DataDrivenDevOps Setting up your DevOps team to success with data @ jbaruch @ DevOpsDaysBoise
datadrivendevops http:// jfrog.com / shownotes

A presentation at DevOps Days Boise 2018 in June 2018 in Boise, ID, USA by Baruch Sadogursky
DataDrivenDevOps Setting up your DevOps team to success with data @ jbaruch @ DevOpsDaysBoise
datadrivendevops http:// jfrog.com / shownotes
shownotes http://jfrog.com/shownotes Slides Video Links Comments, Ratings Raffle @jbaruch @DevOpsDaysBoise #datadrivendevops http://jfrog.com/shownotes

About me @ jbaruch

Cobbler's children have no shoes
Poll time! @ jbaruch @ DevOpsDaysBoise
confident in their work?
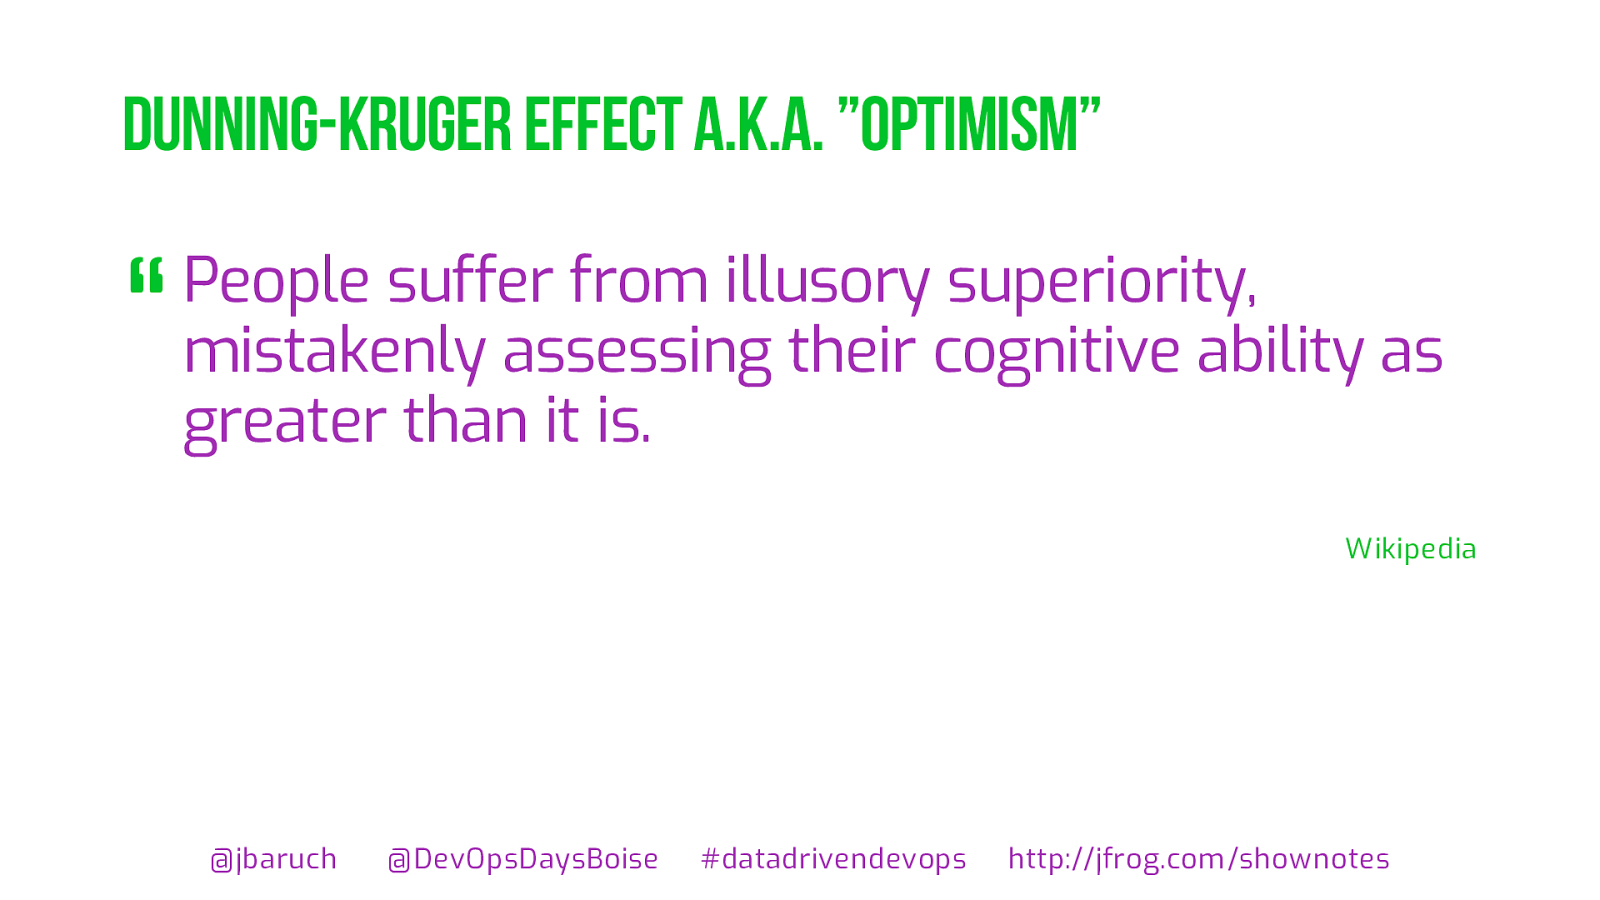
Kruger Effect a.k.a. ”optimism” People suffer from illusory superiority, mistakenly assessing their cognitive ability as greater than it is. Wikipedia @ jbaruch @ DevOpsDaysBoise
datadrivendevops http:// jfrog.com / shownotes “
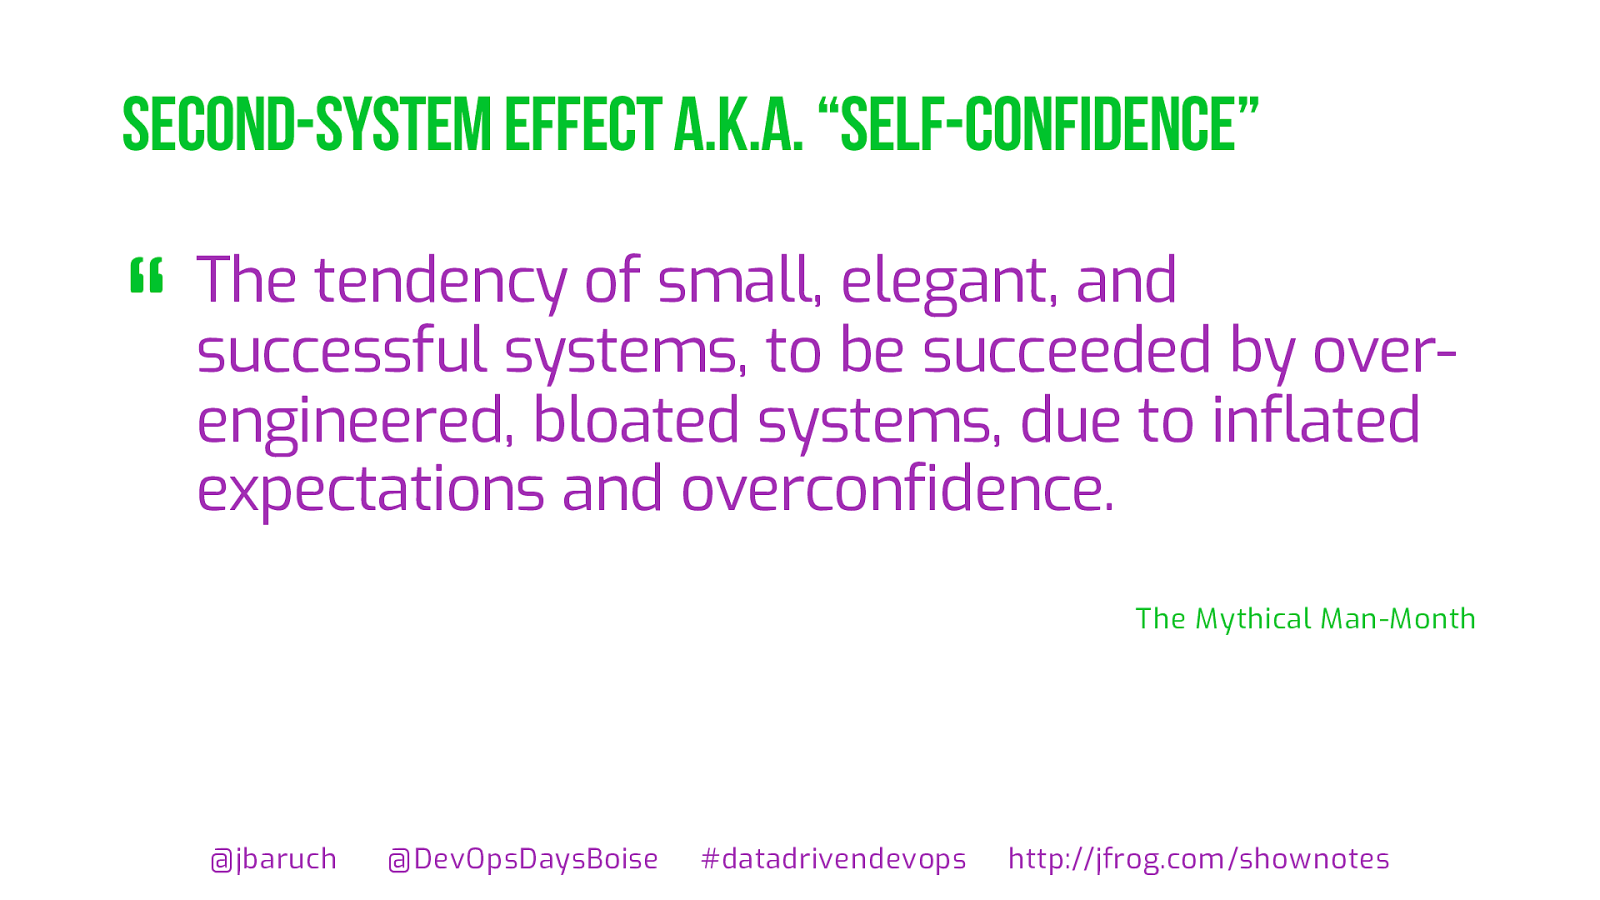
Month @ jbaruch @ DevOpsDaysBoise
datadrivendevops http:// jfrog.com / shownotes “
The consequences @ jbaruch @ DevOpsDaysBoise
datadrivendevops http:// jfrog.com / shownotes
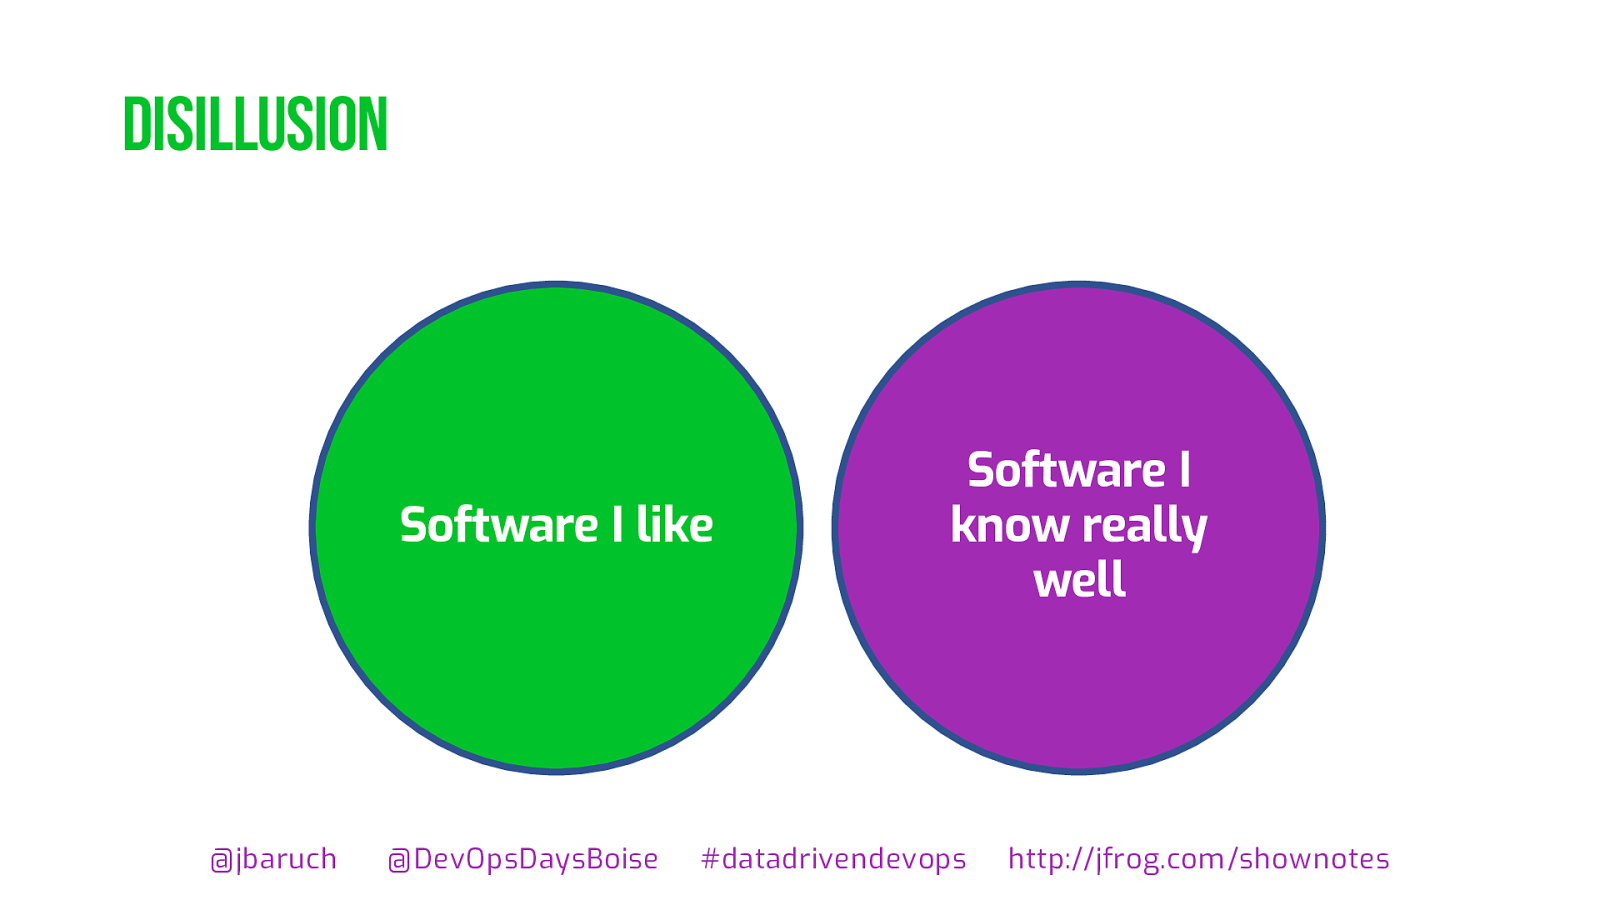
disillusion @ jbaruch @ DevOpsDaysBoise
datadrivendevops http:// jfrog.com / shownotes Software I like Software I know really well
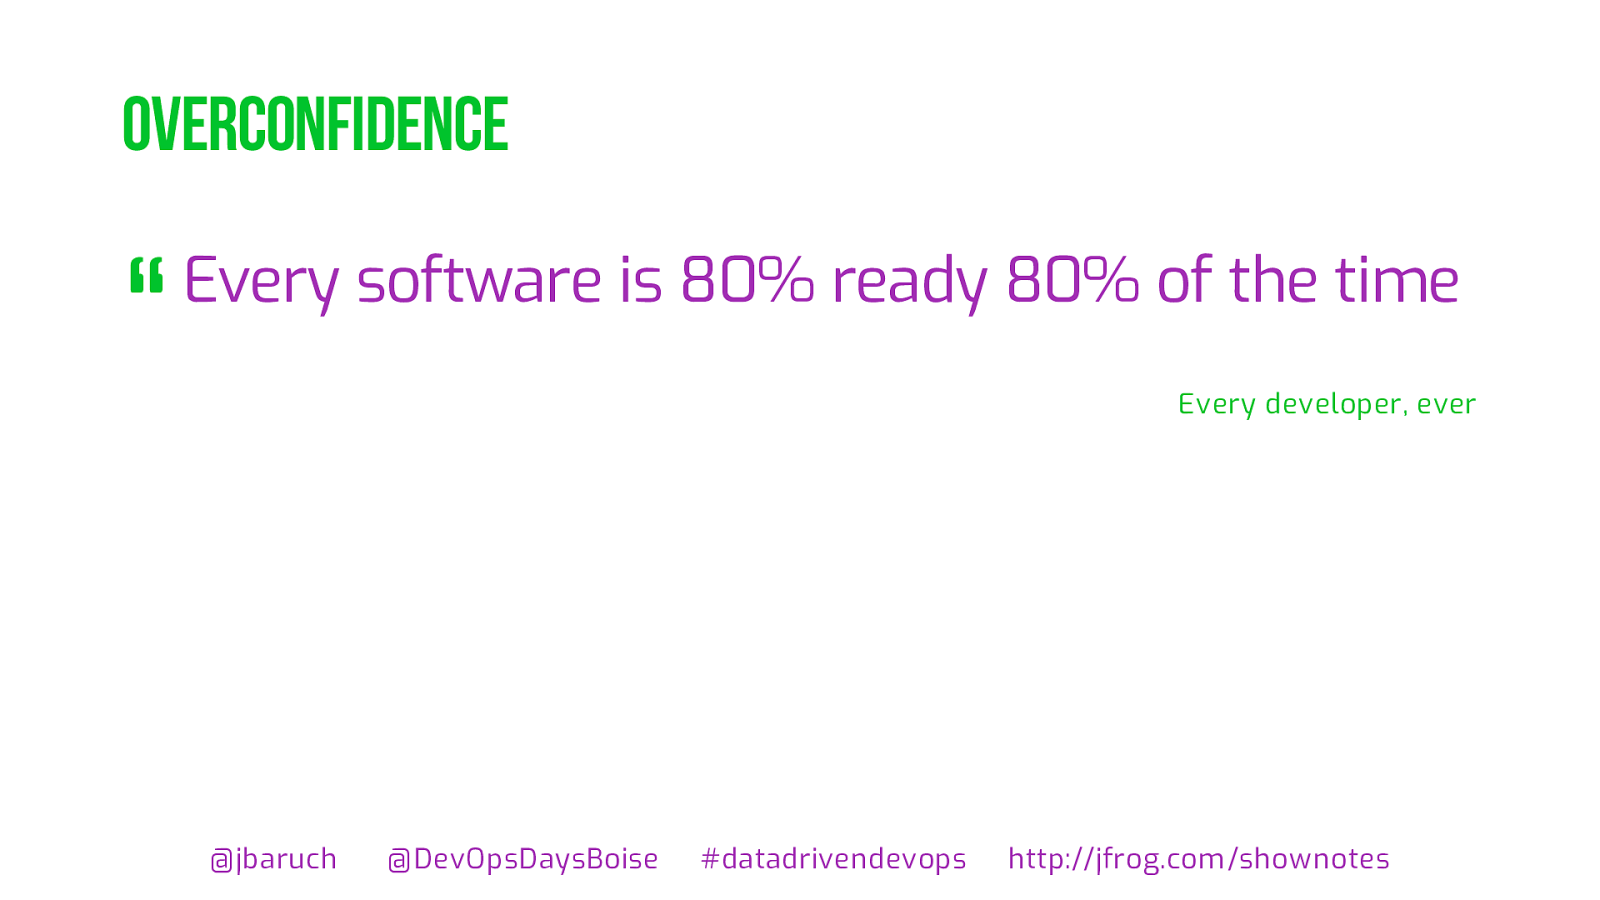
overconfidence @ jbaruch @ DevOpsDaysBoise
datadrivendevops http:// jfrog.com / shownotes Every software is 80% ready 80% of the time Every developer, ever “
Hard to give up @ jbaruch @ DevOpsDaysBoise
datadrivendevops http:// jfrog.com / shownotes

@ jbaruch @ DevOpsDaysBoise
datadrivendevops http:// jfrog.com / shownotes
@ jbaruch @ DevOpsDaysBoise
datadrivendevops http:// jfrog.com / shownotes
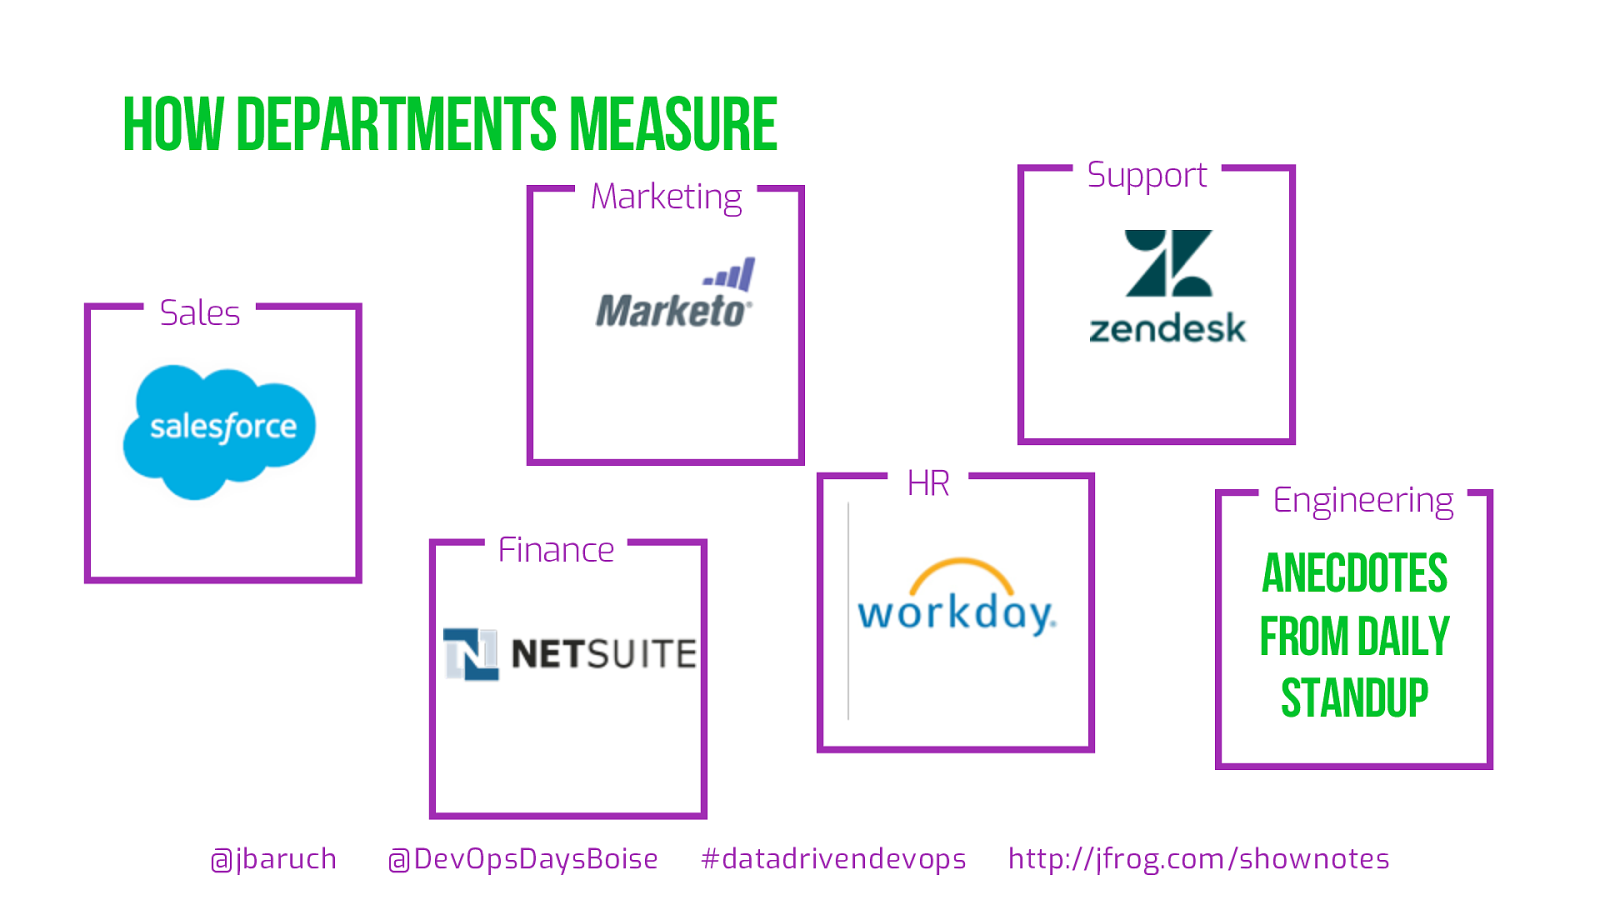
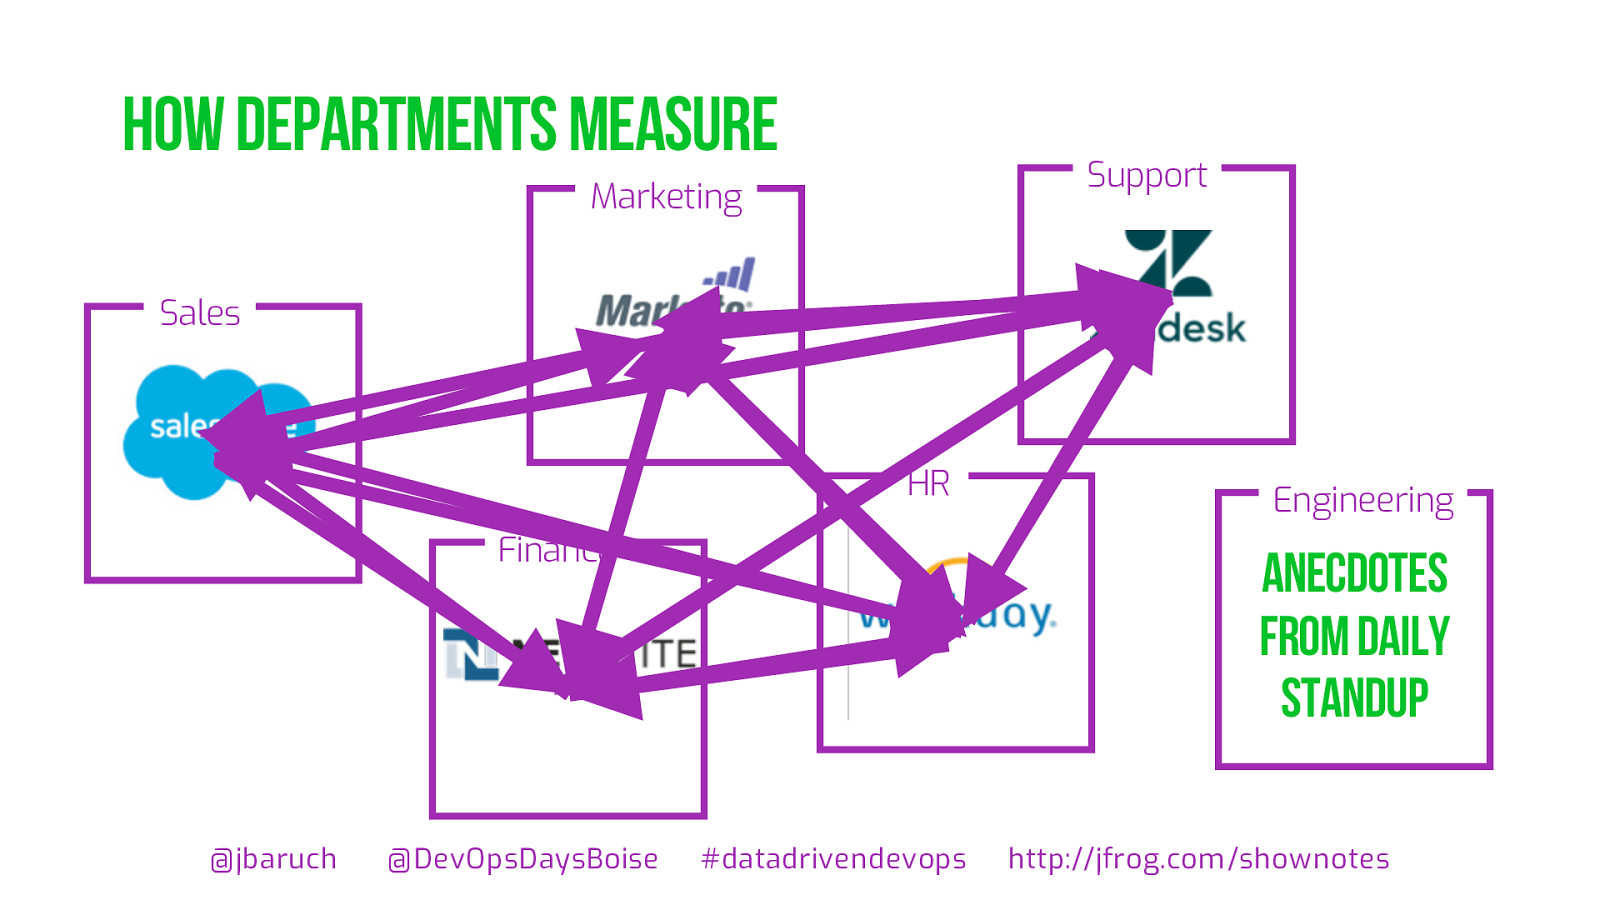
How departments measure @ jbaruch @ DevOpsDaysBoise
datadrivendevops http:// jfrog.com / shownotes Sales Marketing Support HR Finance Anecdotes from daily standup Engineering

How departments measure @ jbaruch @ DevOpsDaysBoise
datadrivendevops http:// jfrog.com / shownotes Sales Marketing Support HR Finance Anecdotes from daily standup Engineering
@ jbaruch @ DevOpsDaysBoise
datadrivendevops http:// jfrog.com / shownotes
@ jbaruch @ DevOpsDaysBoise
datadrivendevops http:// jfrog.com / shownotes

@ jbaruch @ DevOpsDaysBoise
datadrivendevops http:// jfrog.com / shownotes
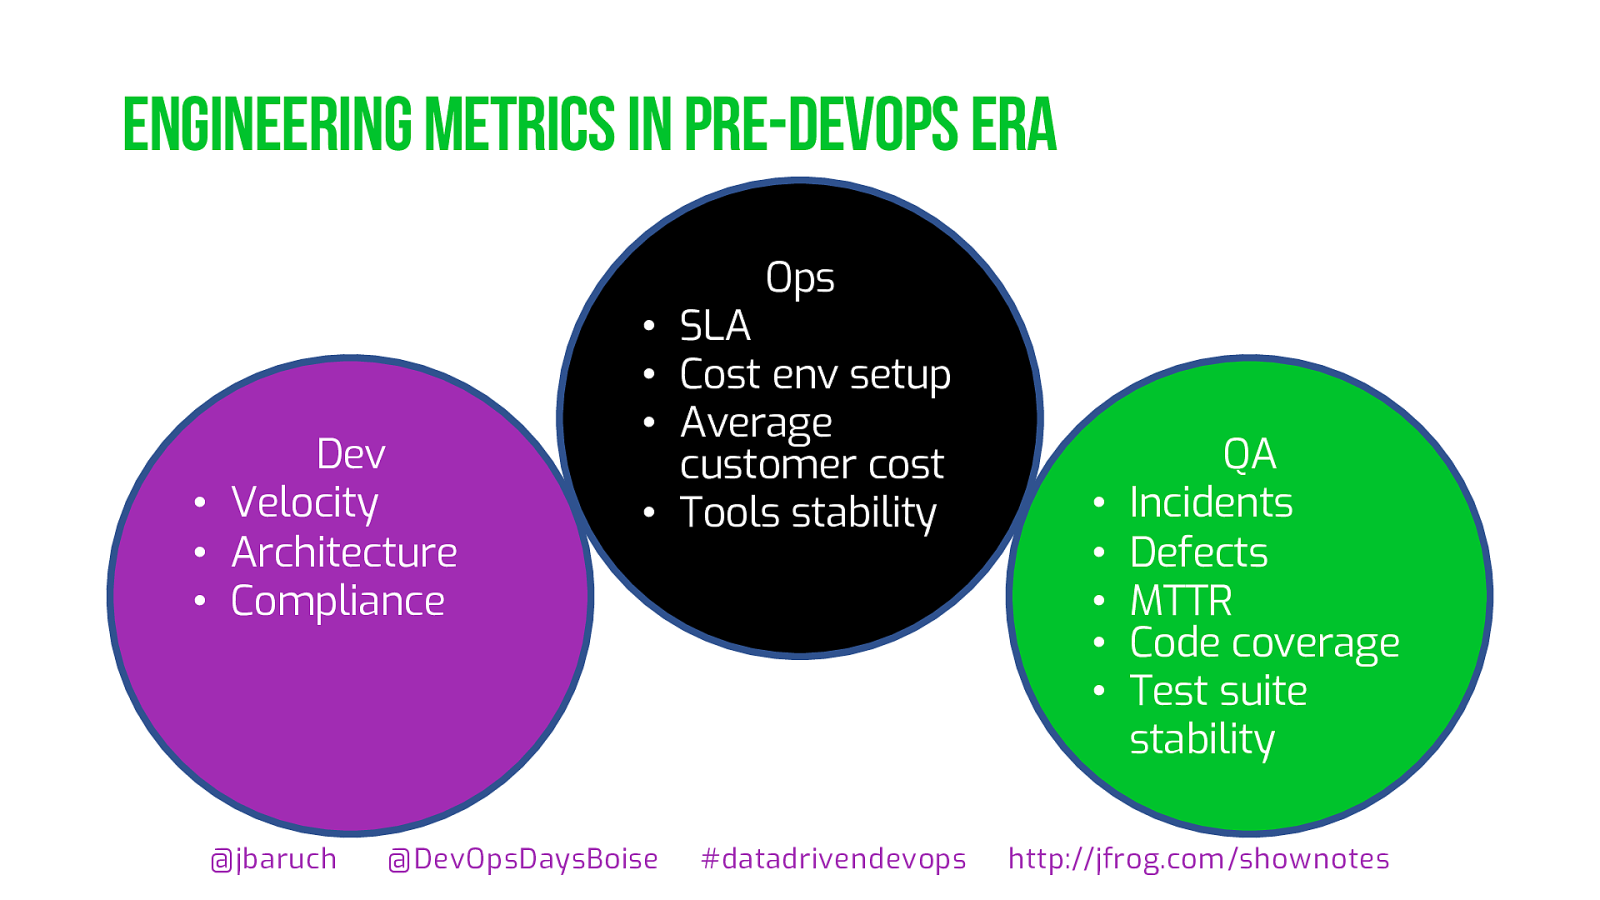
devops era @ jbaruch @ DevOpsDaysBoise
datadrivendevops http:// jfrog.com / shownotes Dev • Velocity • Architecture • Compliance QA • Incidents • Defects • MTTR • Code coverage • Test suite stability Ops • SLA • Cost env setup • Average customer cost • Tools stability
DEVOPS! @ jbaruch @ DevOpsDaysBoise
datadrivendevops http:// jfrog.com / shownotes ?
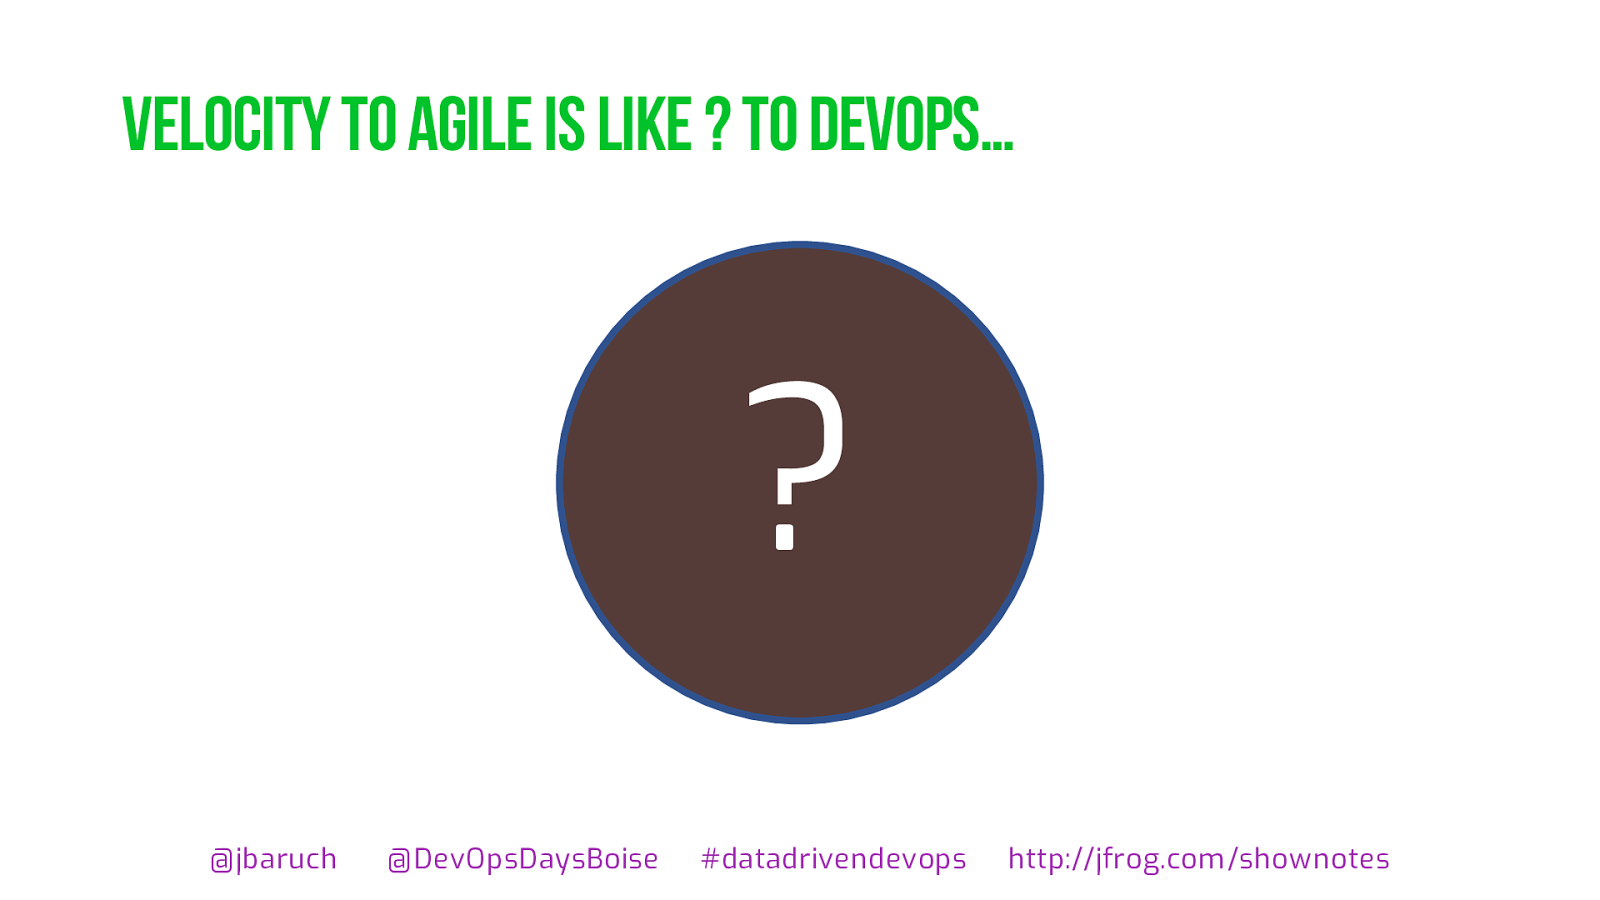
Velocity to agile is like ? To devops … @ jbaruch @ DevOpsDaysBoise
datadrivendevops http:// jfrog.com / shownotes ?
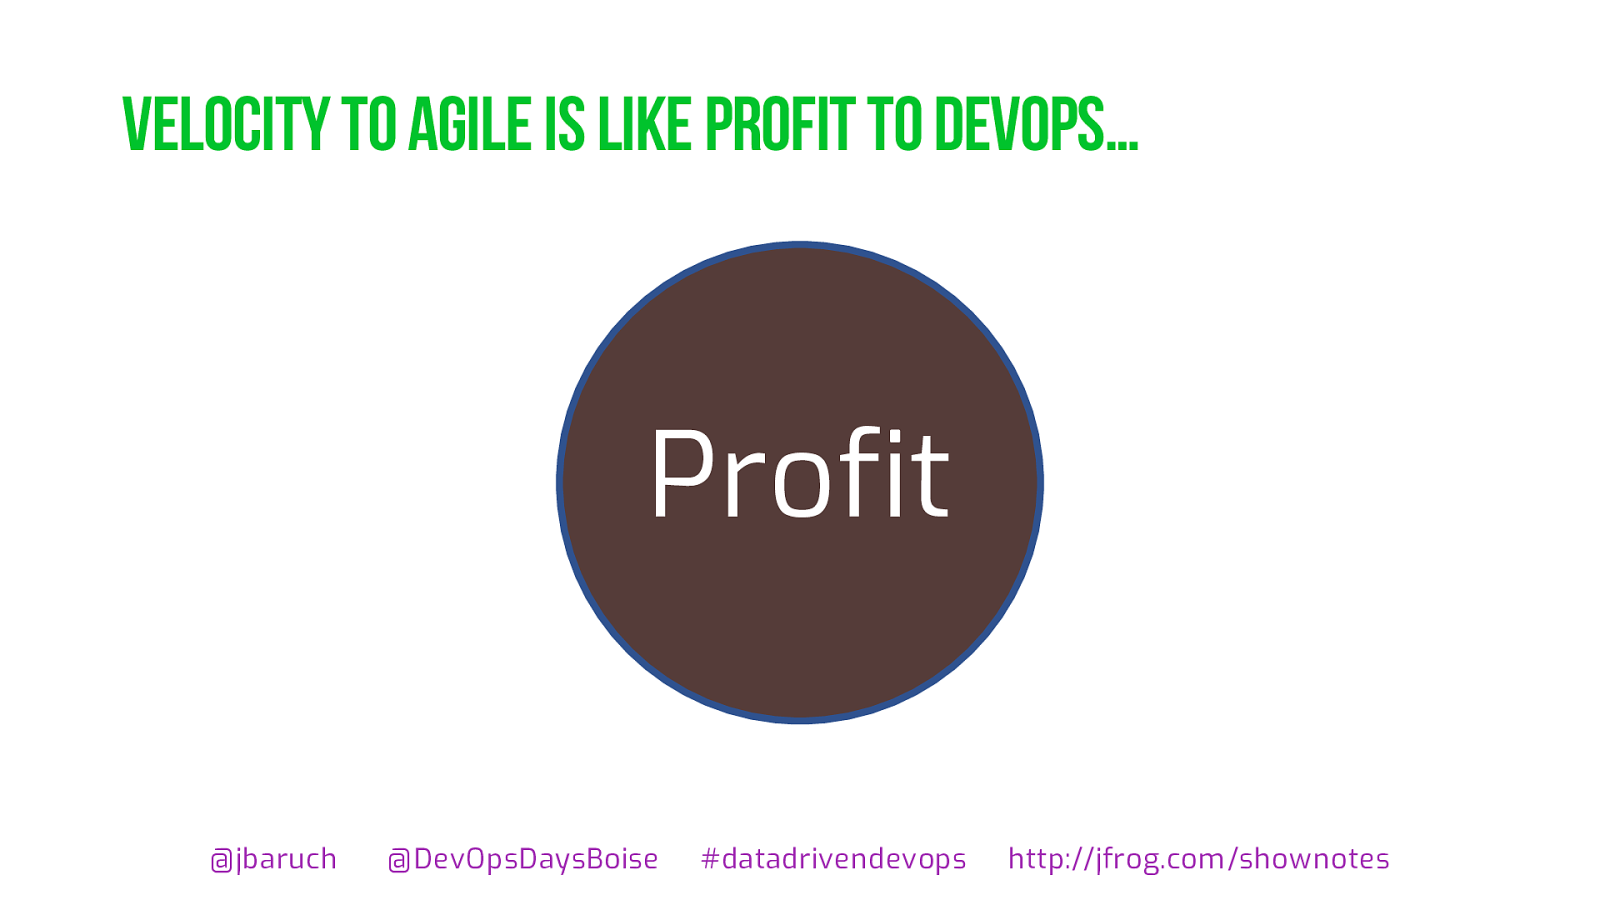
Velocity to agile is like profit To devops … @ jbaruch @ DevOpsDaysBoise
datadrivendevops http:// jfrog.com / shownotes Profit

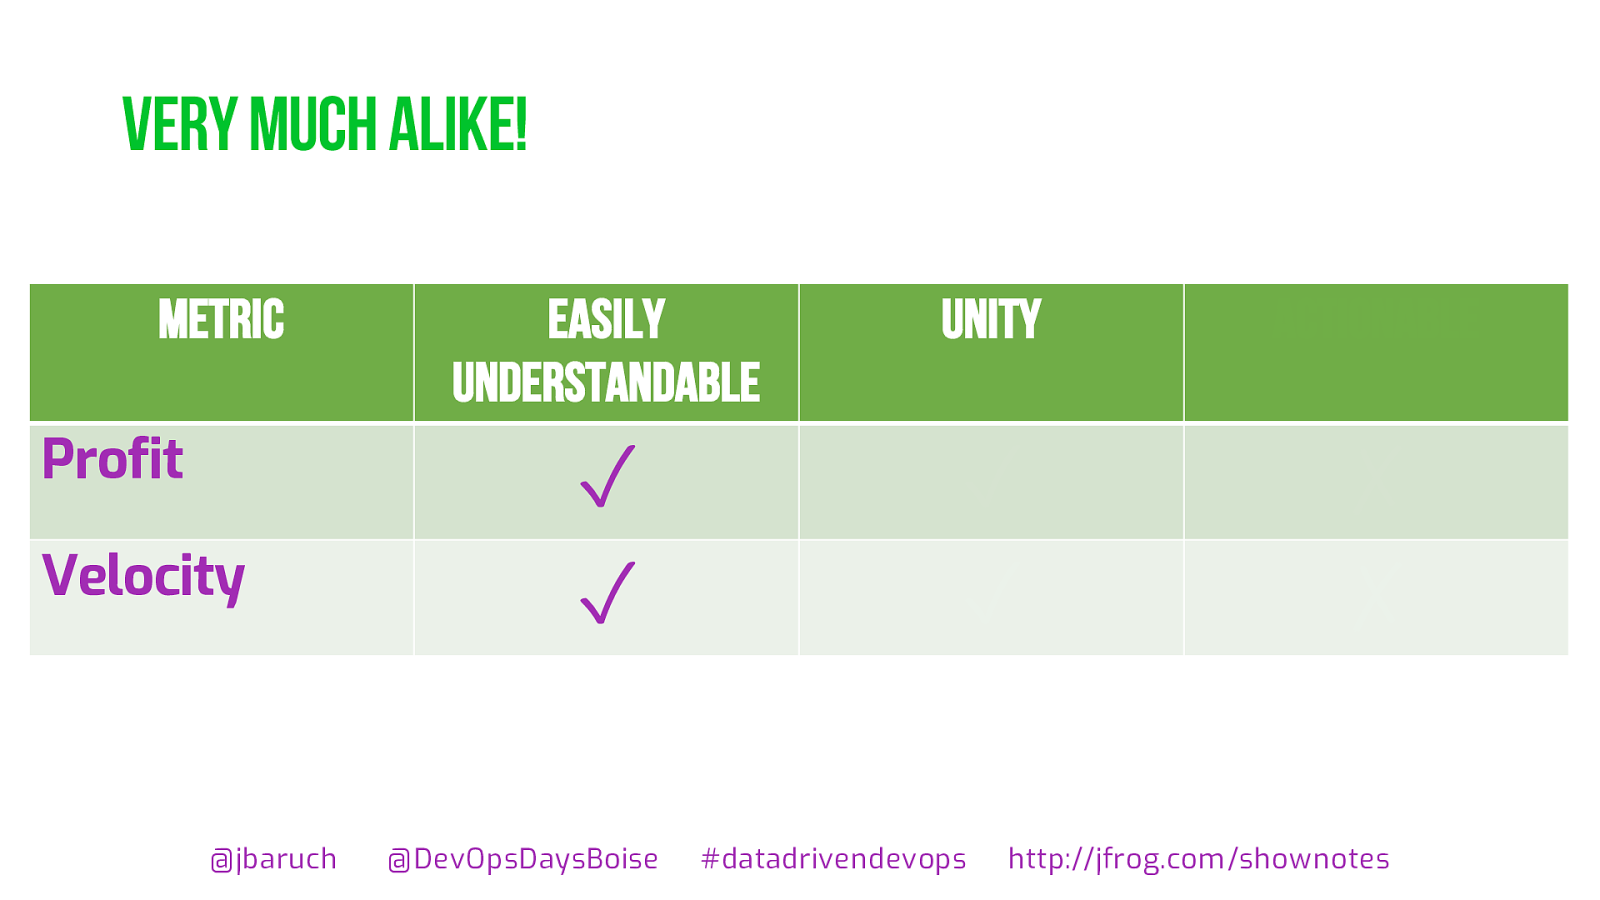
Very much alike! @ jbaruch @ DevOpsDaysBoise
datadrivendevops http:// jfrog.com / shownotes Metric Easily understandable Unity actionable Profit ✓ ✓ ✗ Velocity ✓ ✓ ✗
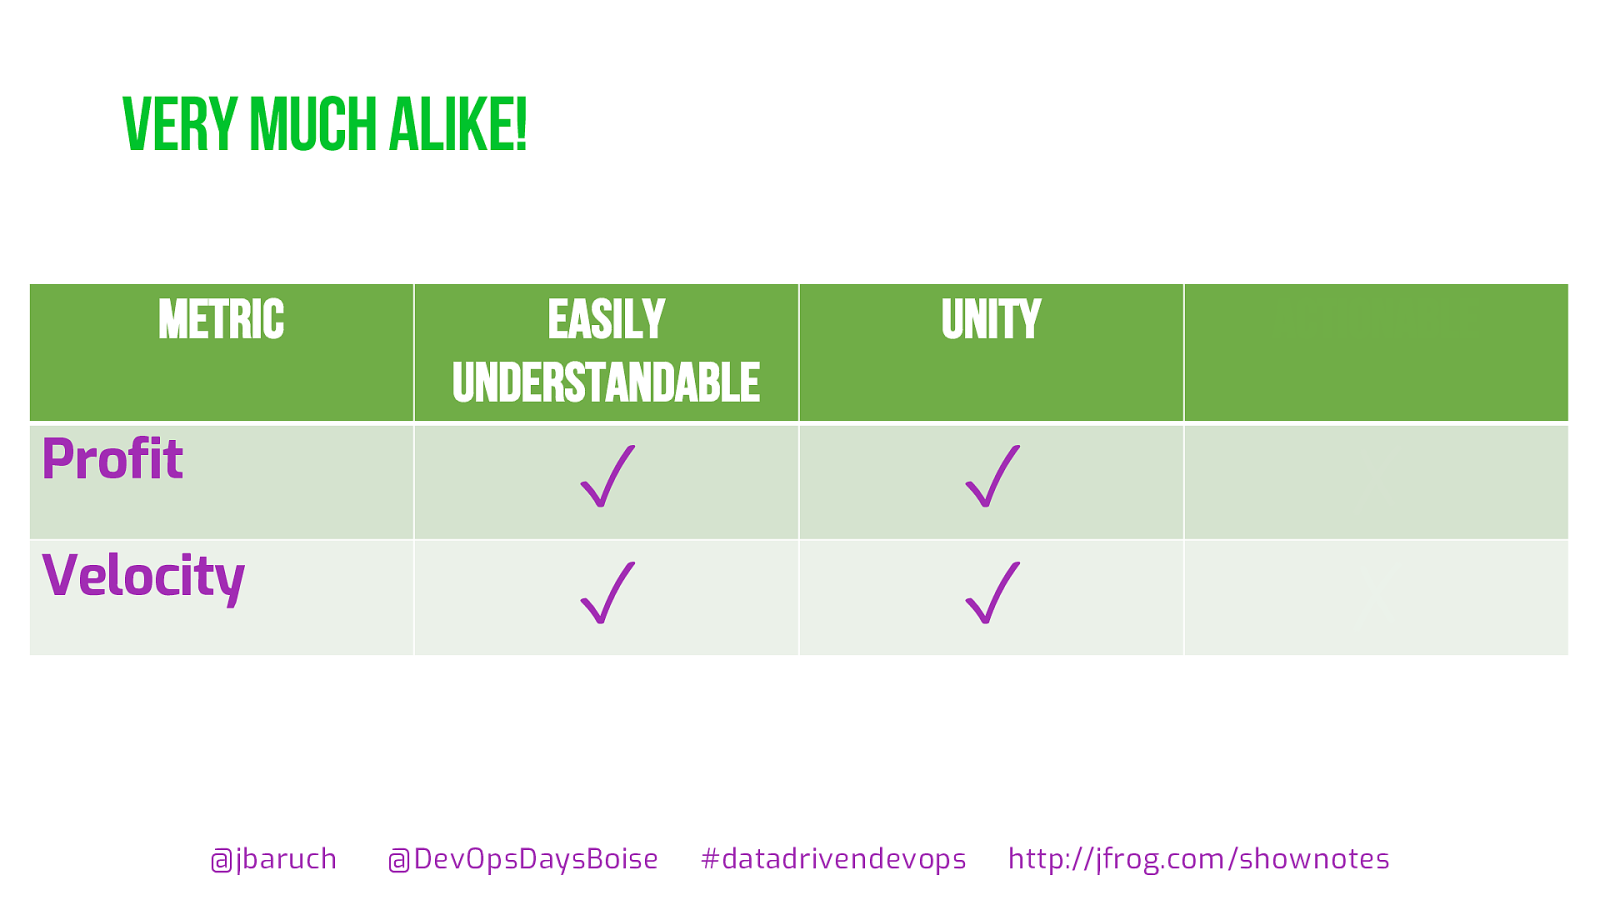
Very much alike! @ jbaruch @ DevOpsDaysBoise
datadrivendevops http:// jfrog.com / shownotes Metric Easily understandable Unity actionable Profit ✓ ✓ ✗ Velocity ✓ ✓ ✗
Very much alike! @ jbaruch @ DevOpsDaysBoise
datadrivendevops http:// jfrog.com / shownotes Metric Easily understandable Unity actionable Profit ✓ ✓ ✗ Velocity ✓ ✓ ✗
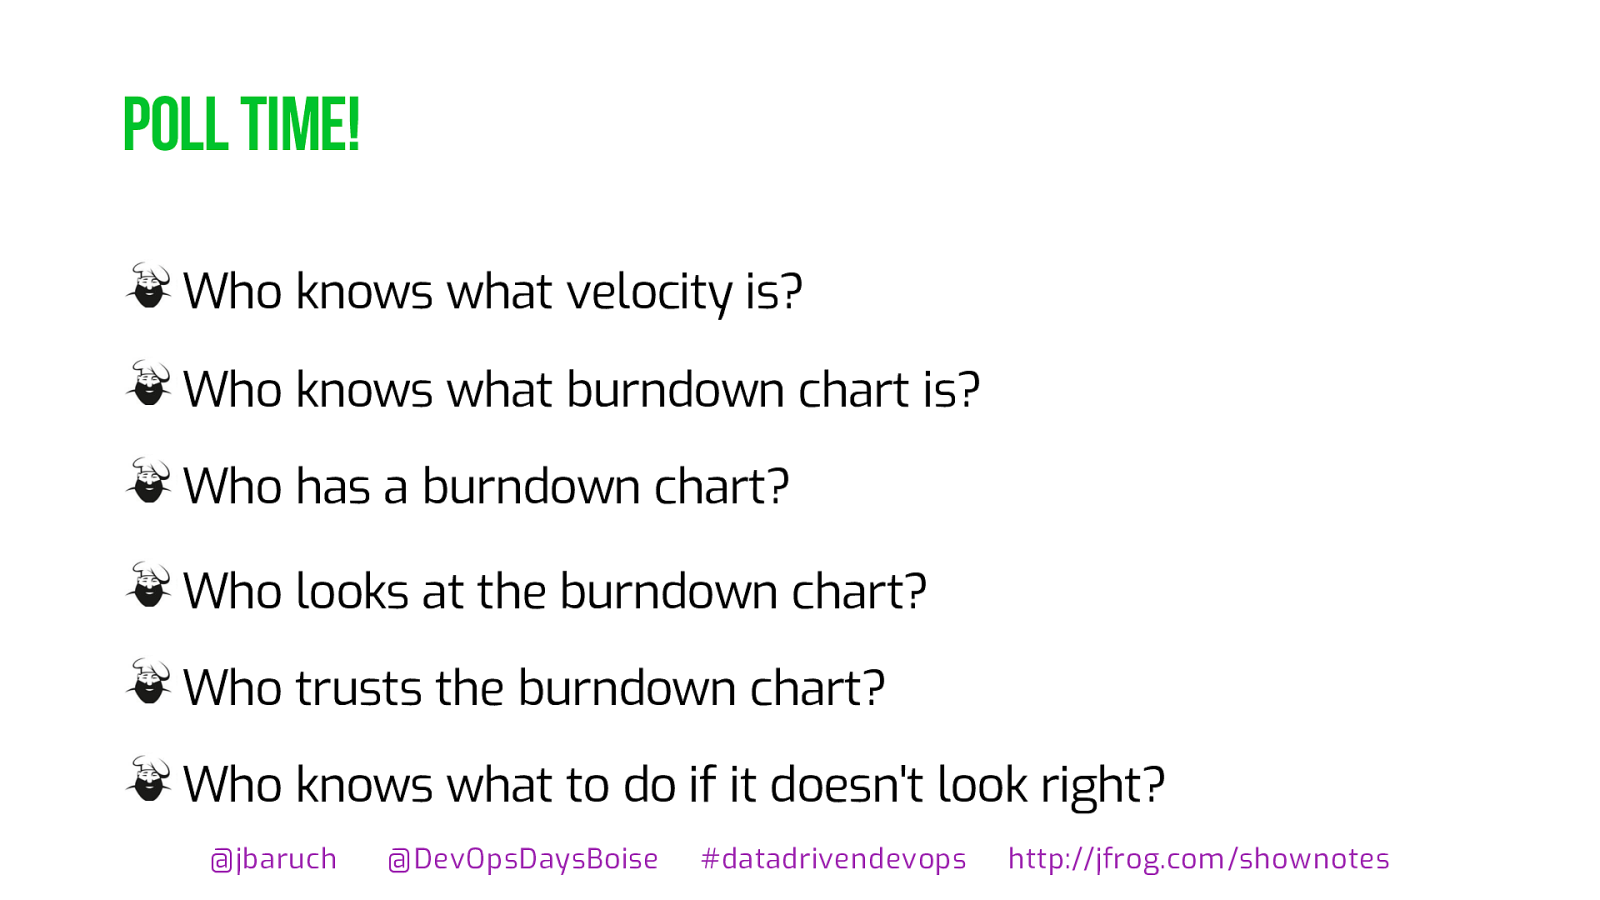
Poll time! @ jbaruch @ DevOpsDaysBoise
datadrivendevops http:// jfrog.com / shownotes Who knows what velocity is? Who knows what burndown chart is? Who has a burndown chart? Who looks at the burndown chart? Who trusts the burndown chart? Who knows what to do if it doesn't look right?
What’s the problem? @ jbaruch @ DevOpsDaysBoise
datadrivendevops http:// jfrog.com / shownotes Velocity
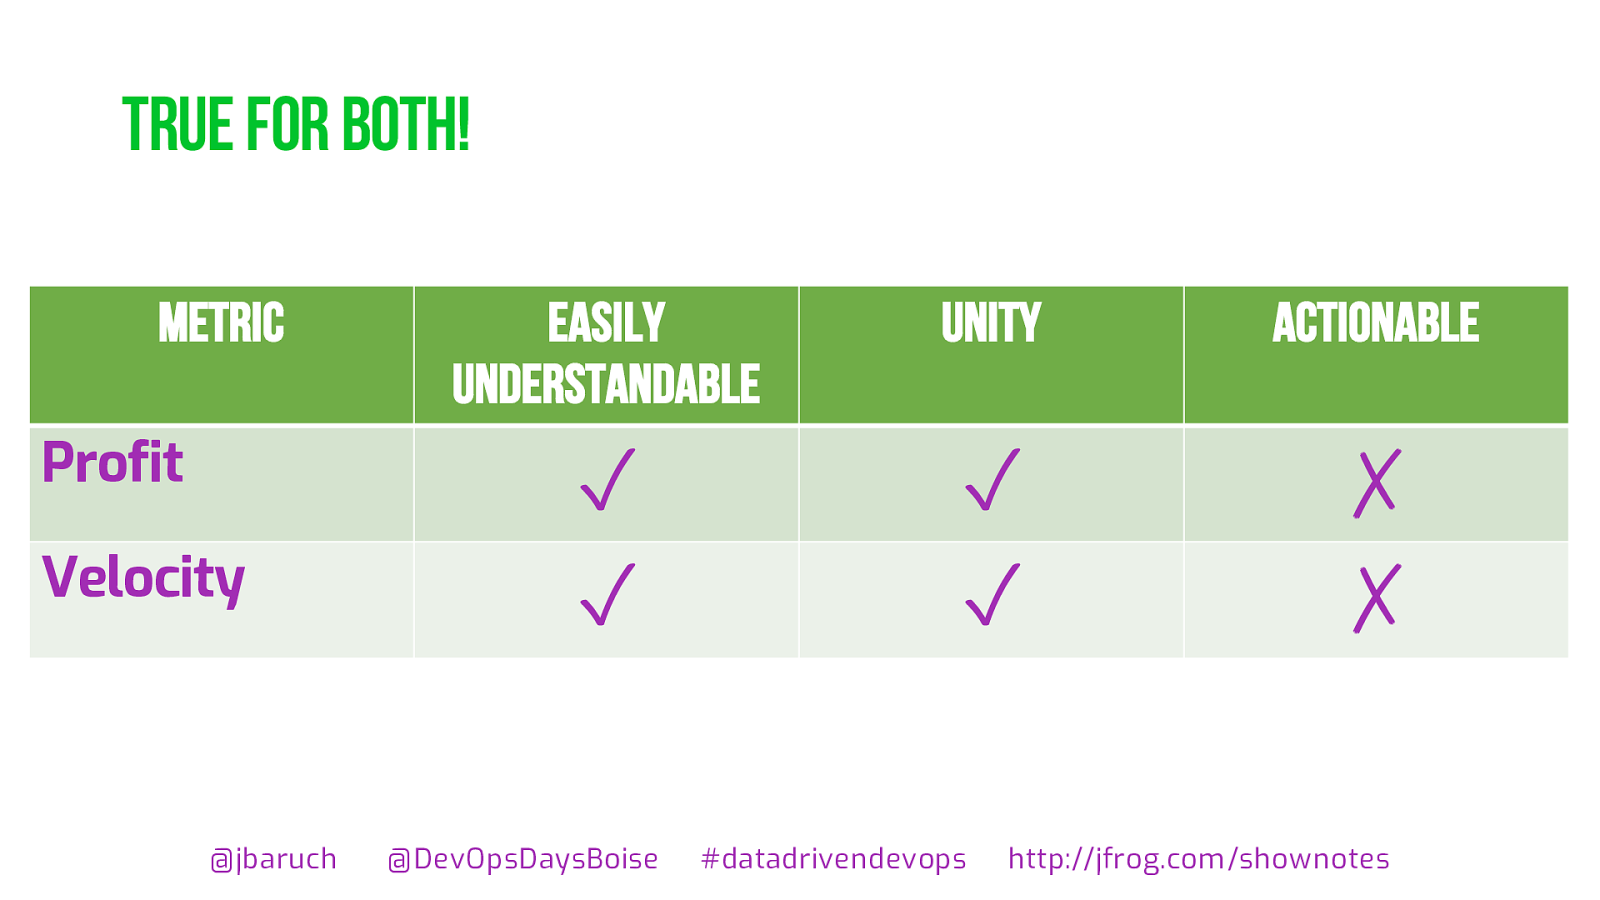
True for both! @ jbaruch @ DevOpsDaysBoise
datadrivendevops http:// jfrog.com / shownotes Metric Easily understandable Unity actionable Profit ✓ ✓ ✗ Velocity ✓ ✓ ✗
Too coarse! @ jbaruch @ DevOpsDaysBoise
datadrivendevops http:// jfrog.com / shownotes Profit
Too coarse! @ jbaruch @ DevOpsDaysBoise
datadrivendevops http:// jfrog.com / shownotes DevOps
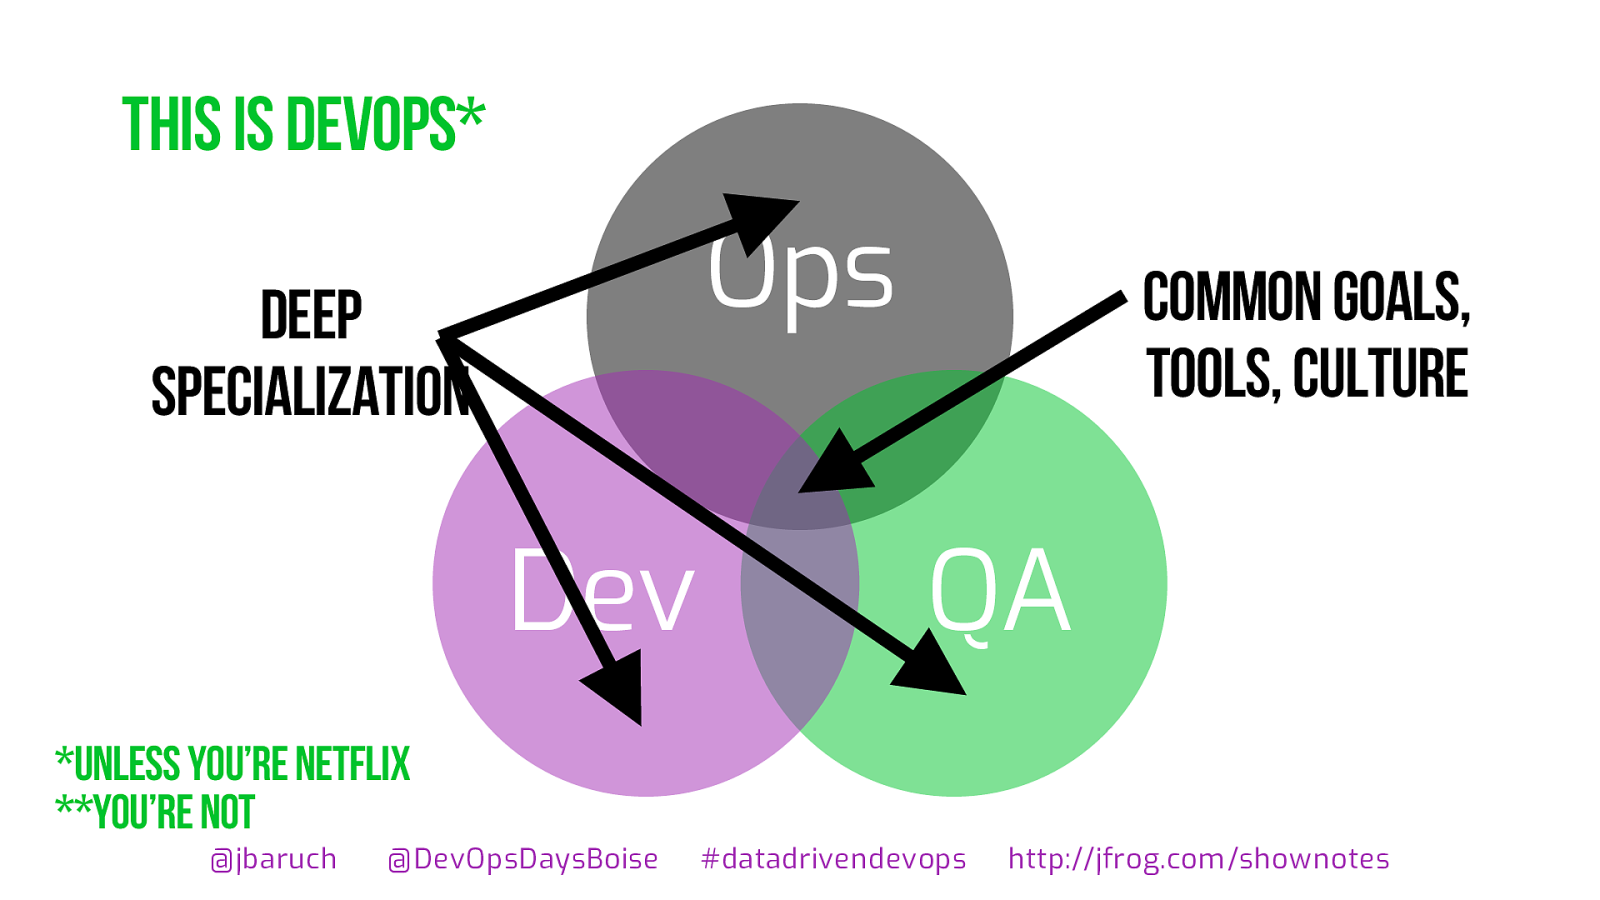
This is devops * @ jbaruch @ DevOpsDaysBoise
datadrivendevops http:// jfrog.com / shownotes Ops QA Dev Common goals, tools, culture Deep specialization *Unless you’re netfliX **You’re not
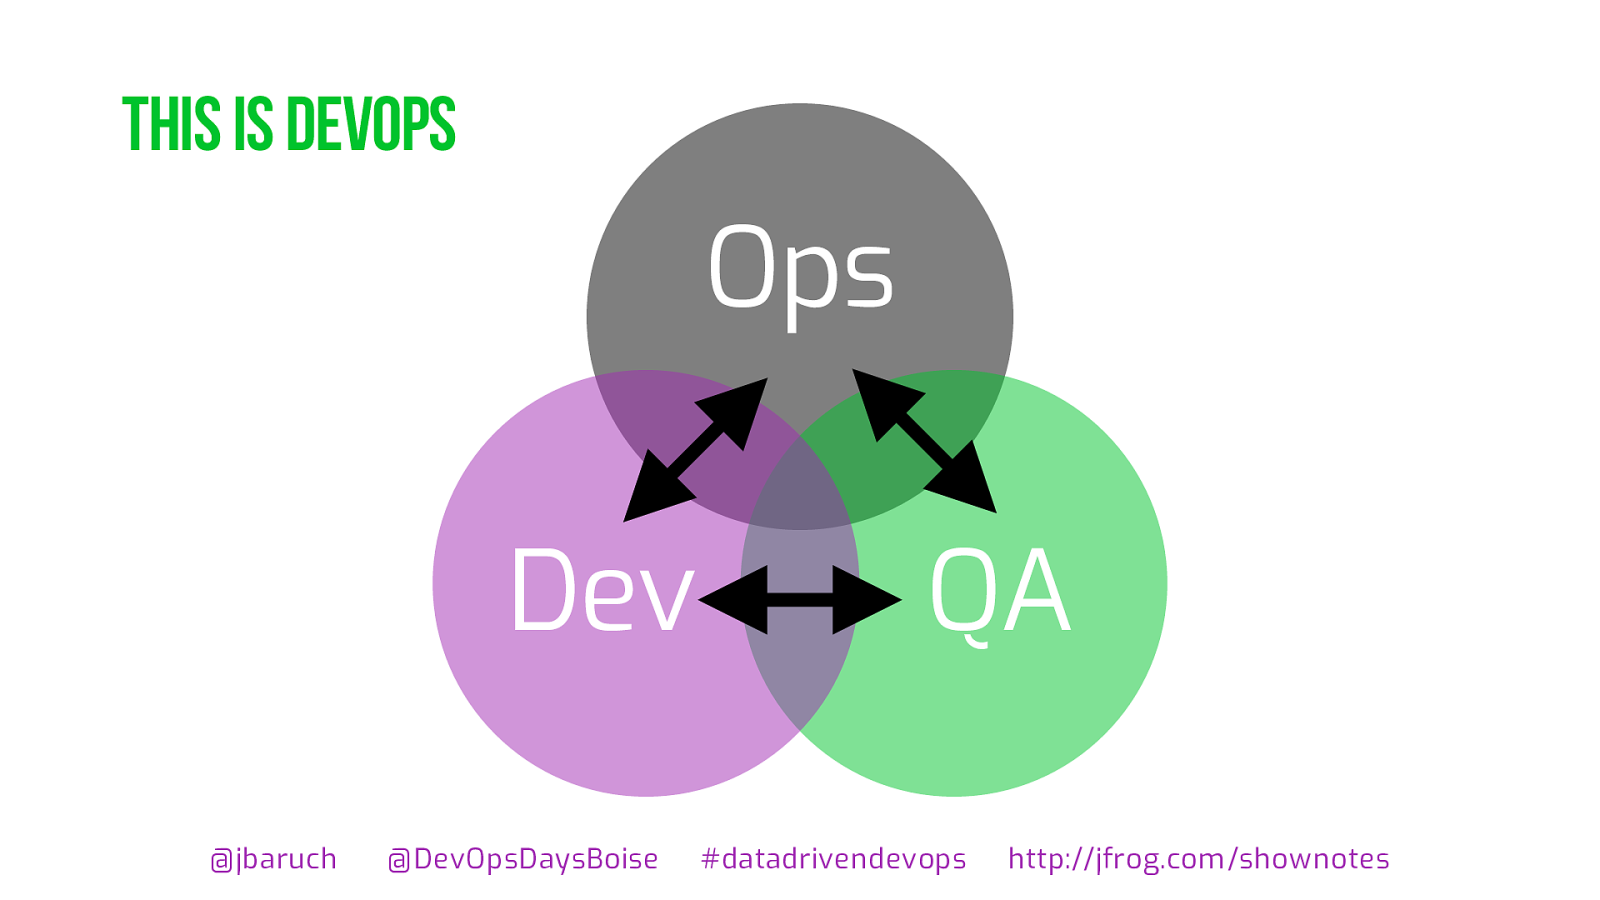
This is devops @ jbaruch @ DevOpsDaysBoise
datadrivendevops http:// jfrog.com / shownotes Ops QA Dev
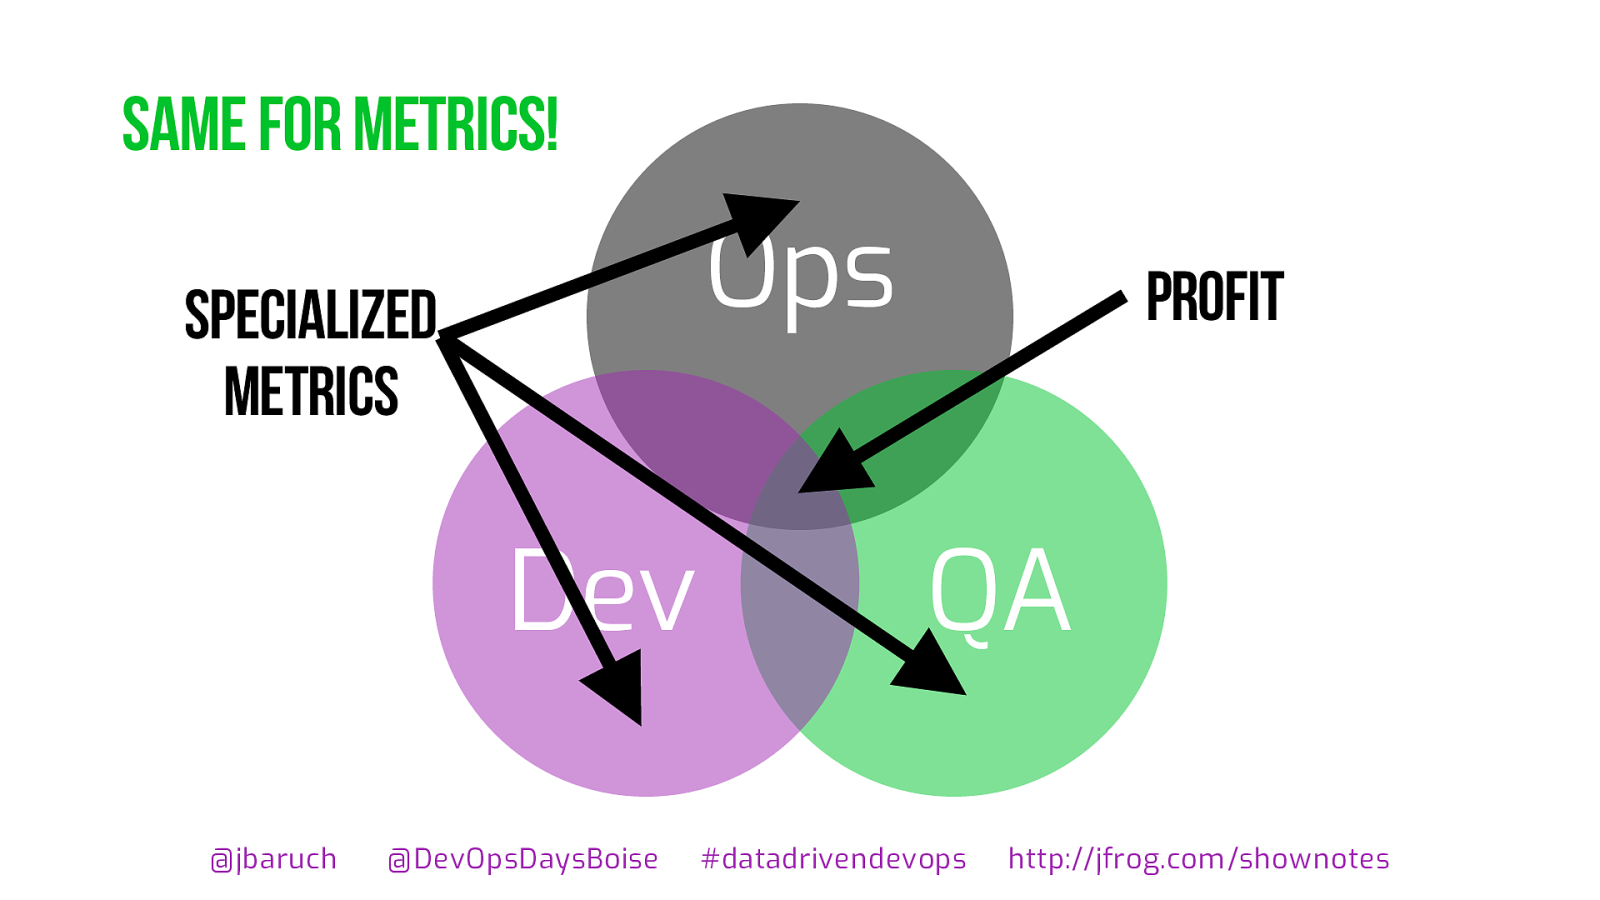
Same for metrics! @ jbaruch @ DevOpsDaysBoise
datadrivendevops http:// jfrog.com / shownotes Ops QA Dev profit Specialized metrics
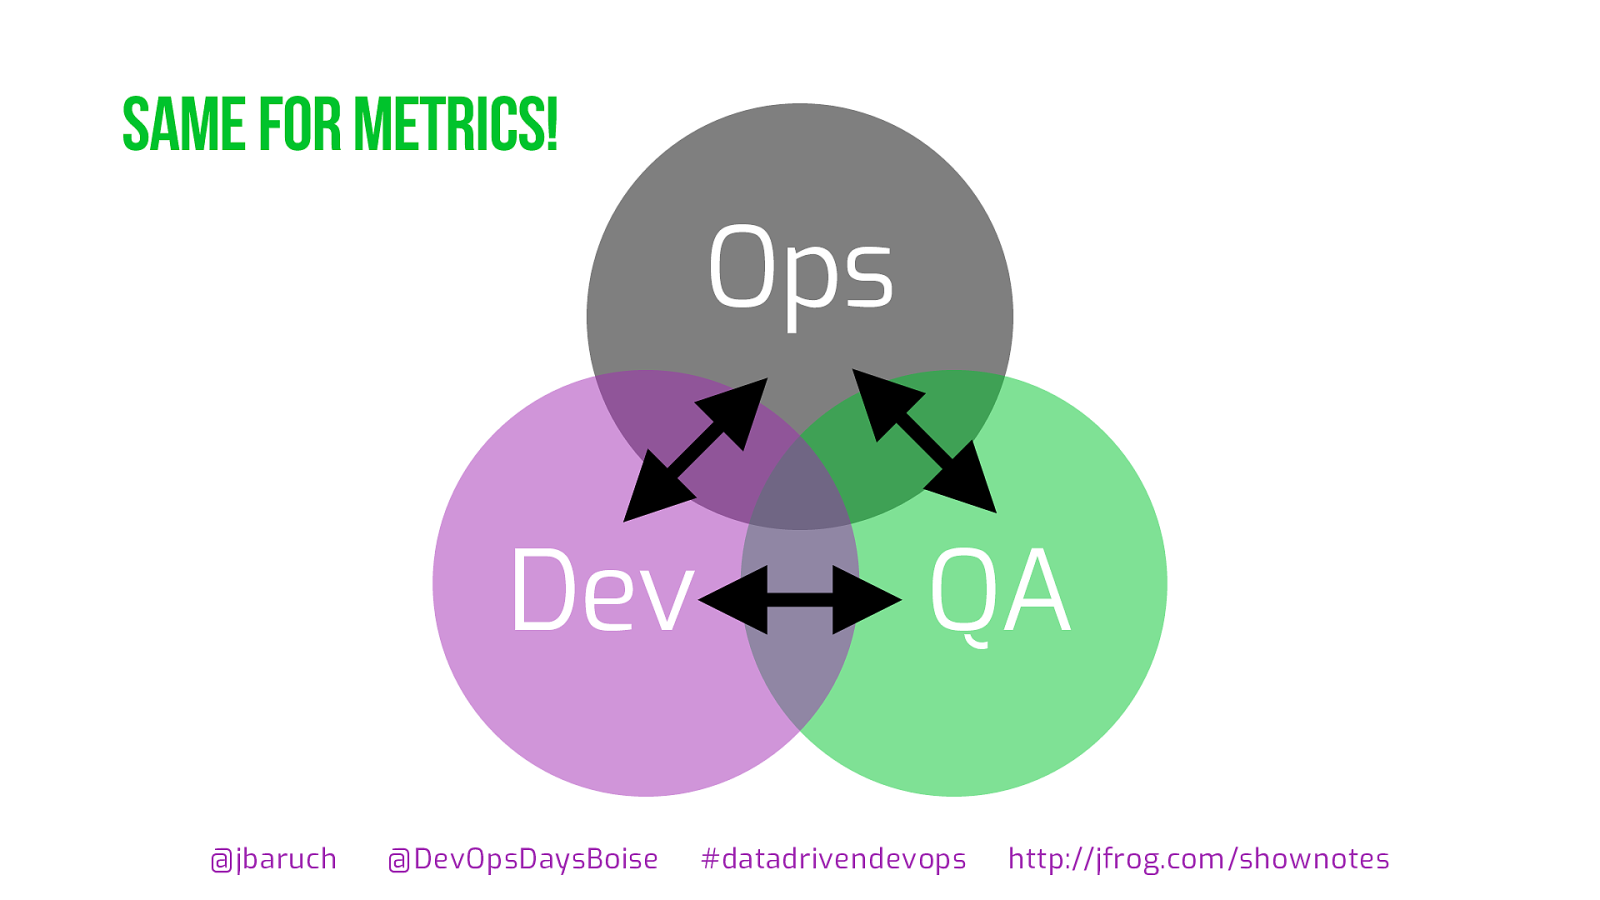
Same for metrics! @ jbaruch @ DevOpsDaysBoise
datadrivendevops http:// jfrog.com / shownotes Ops QA Dev
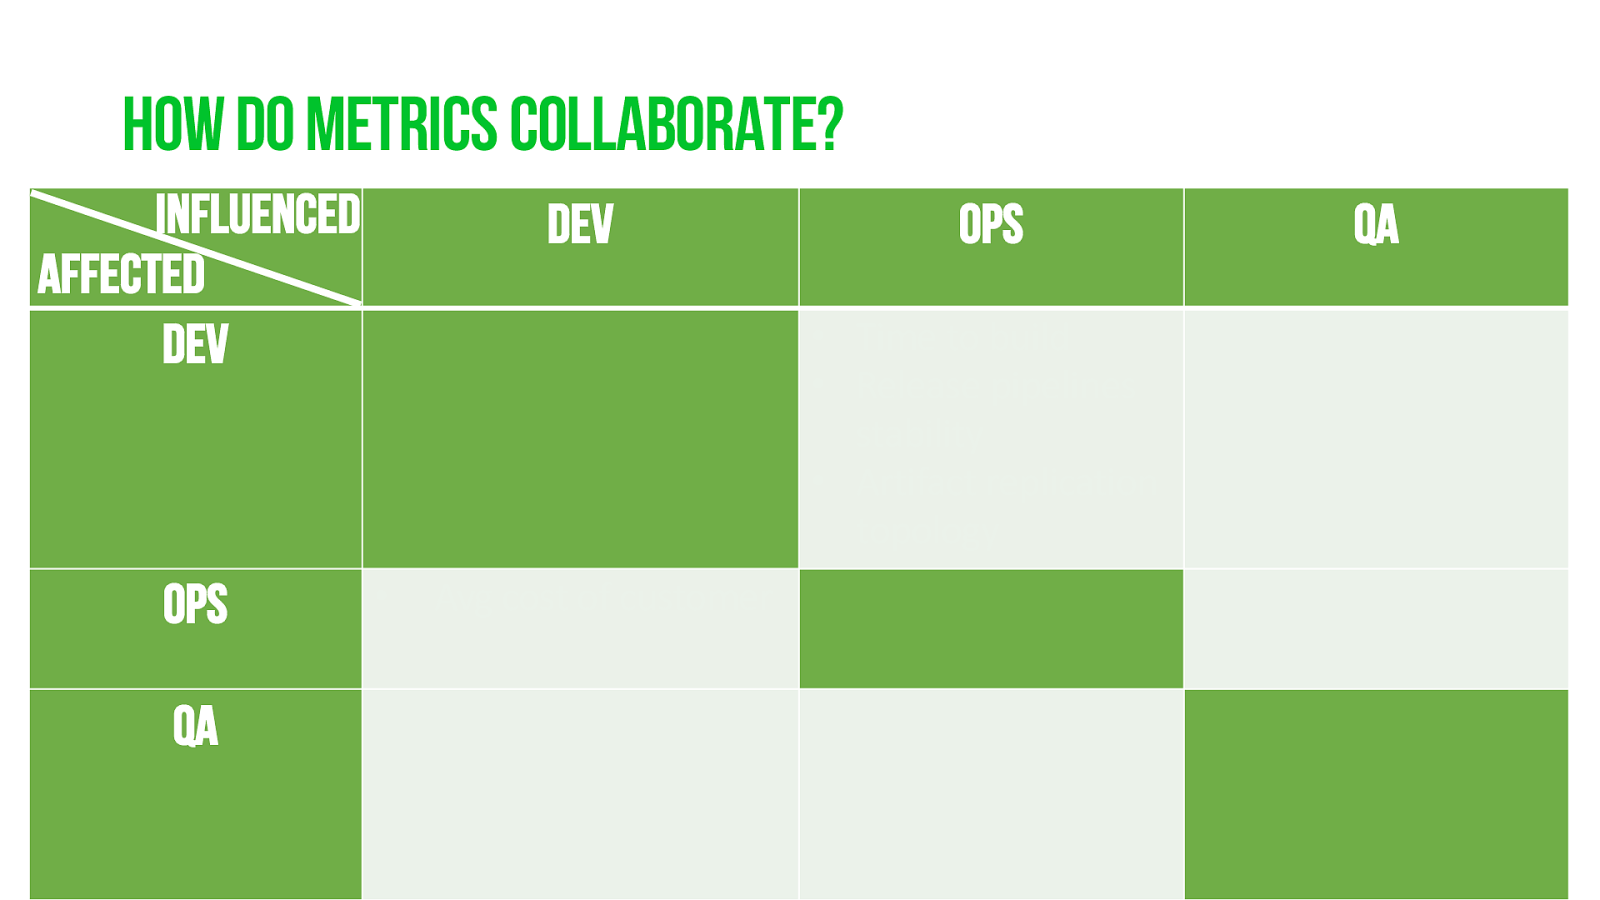
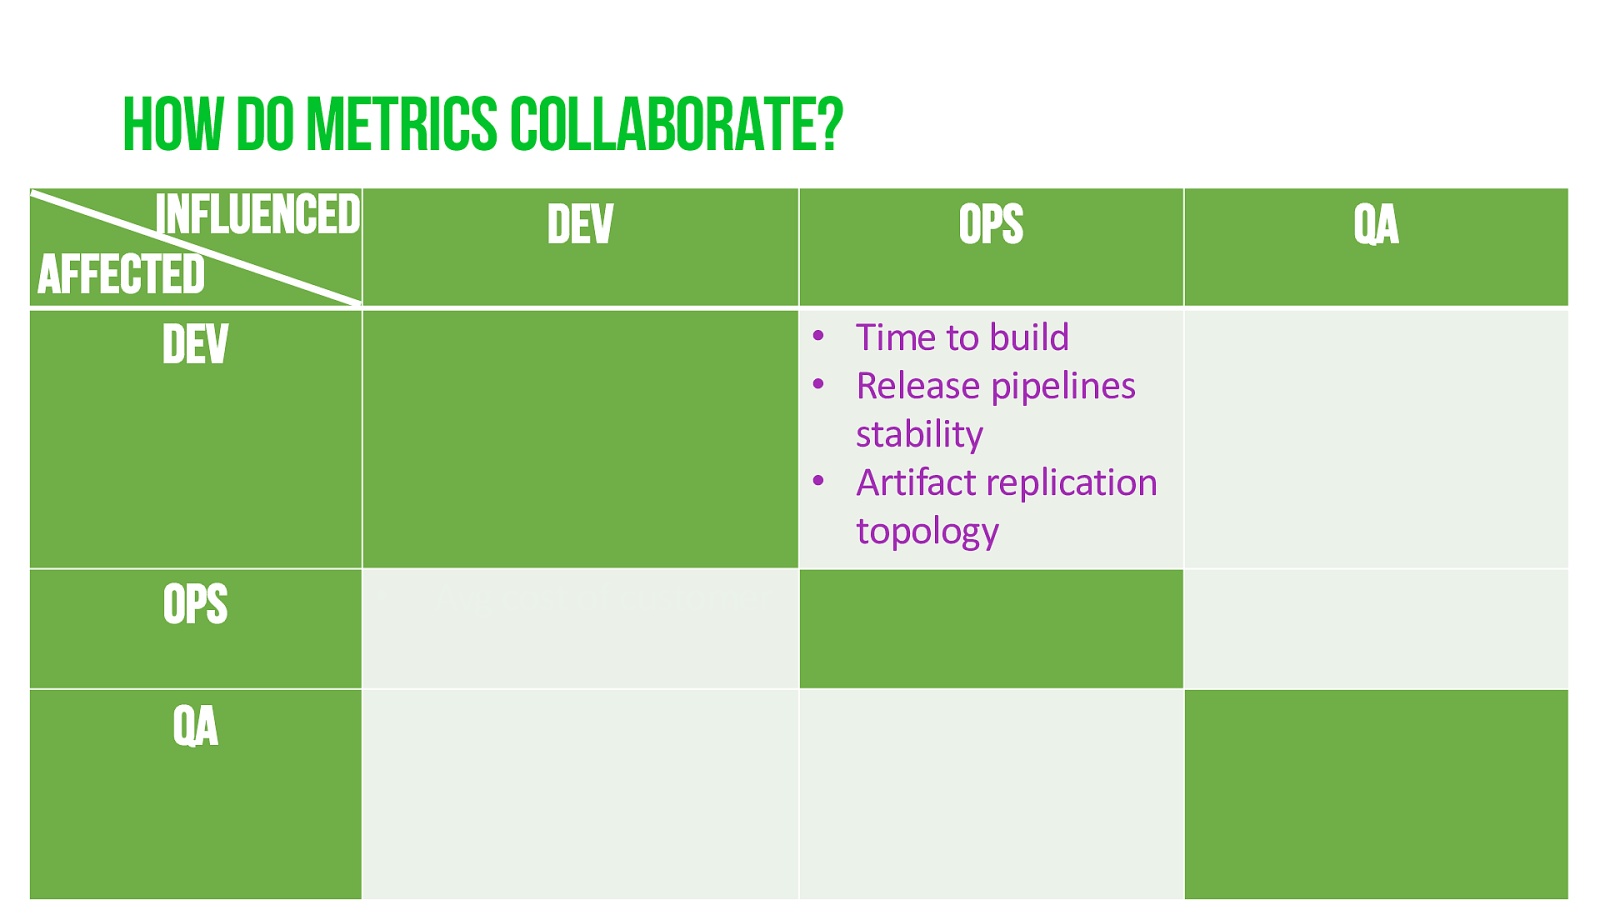
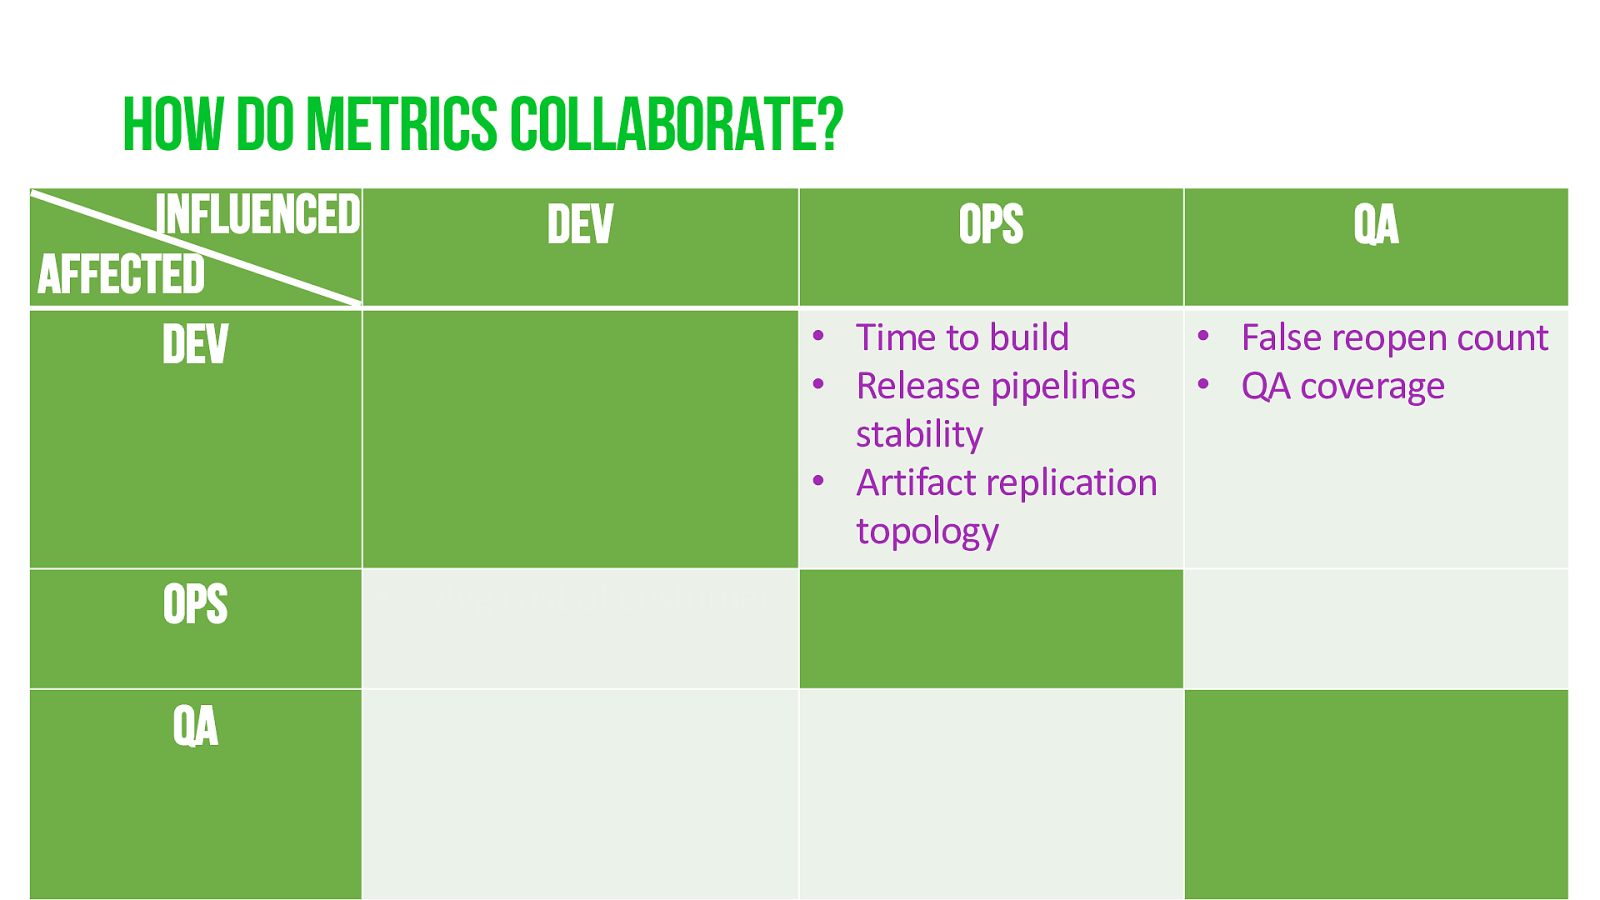
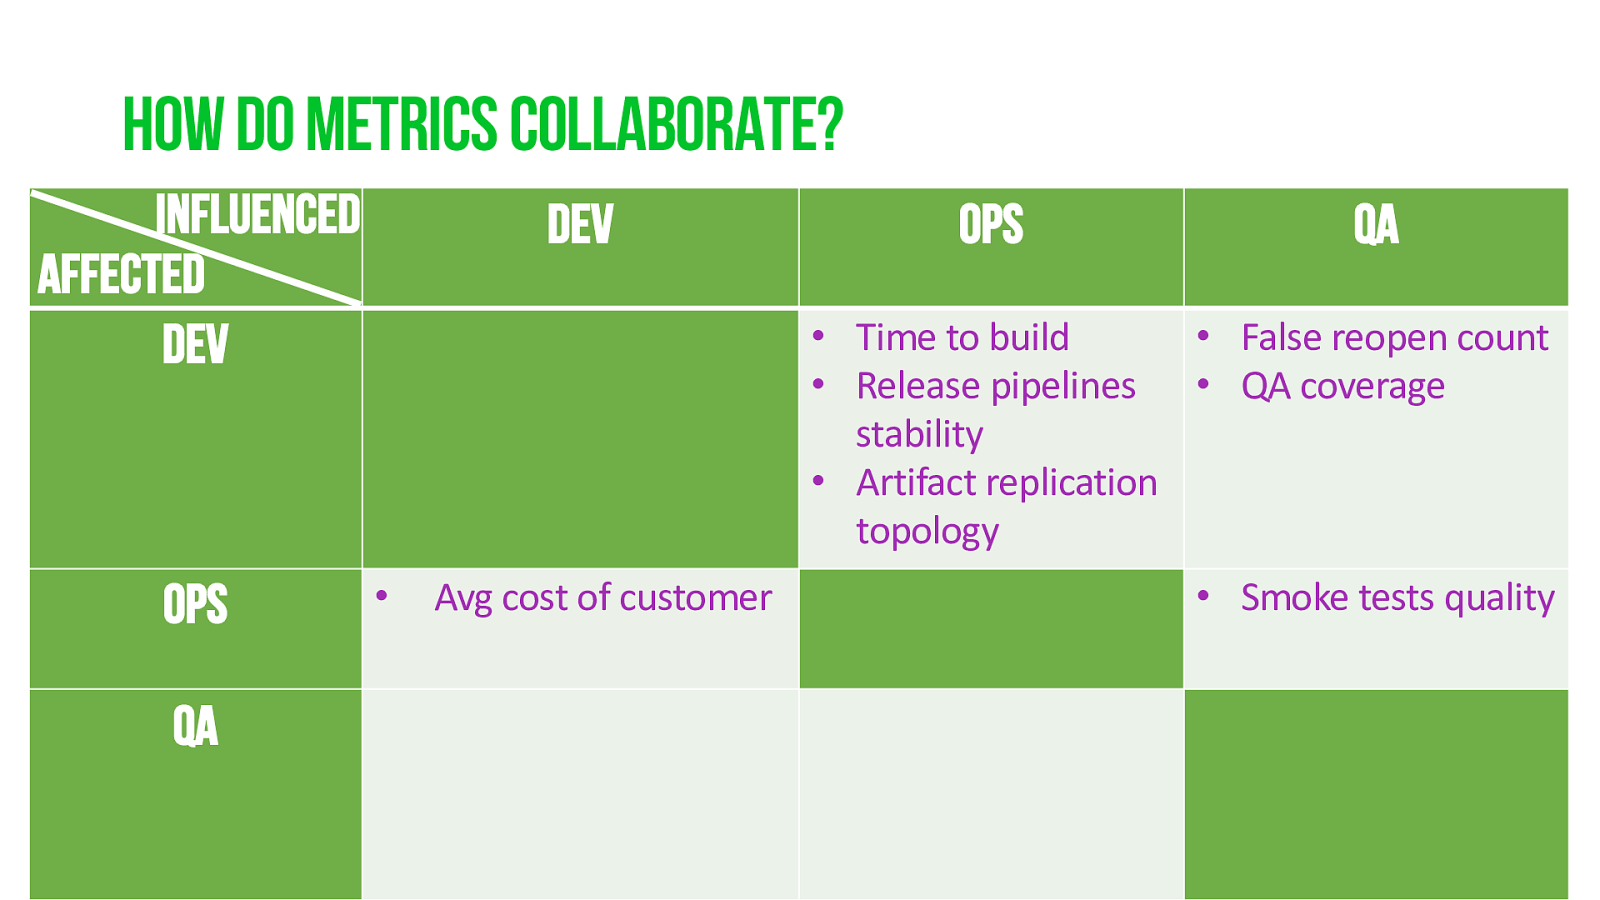
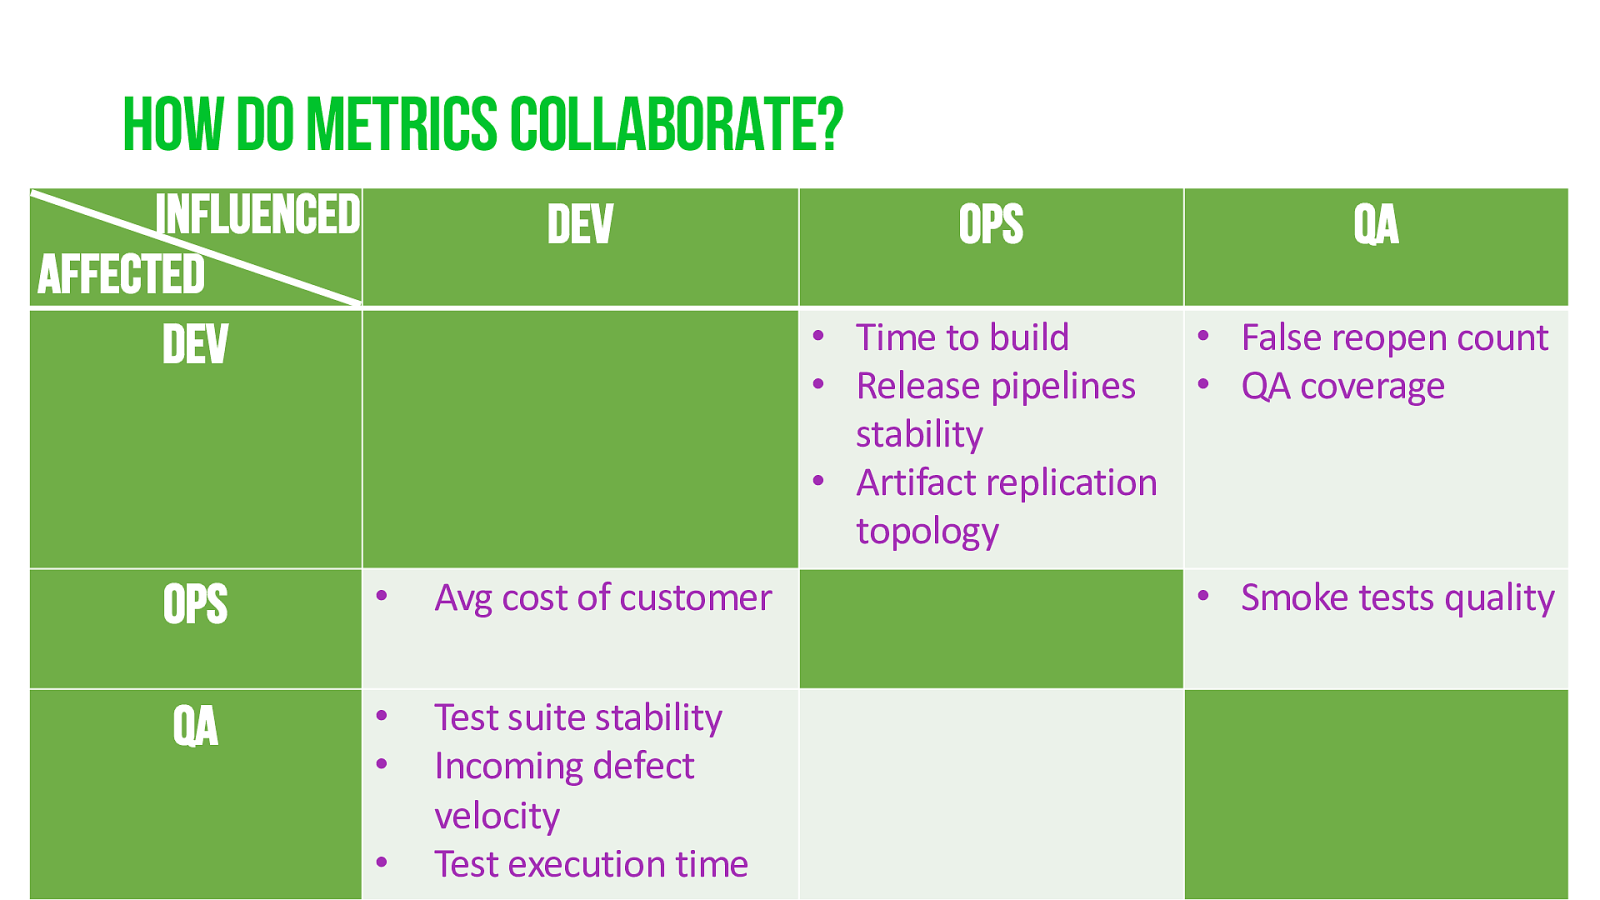
How do metrics collaborate? @ jbaruch @ DevOpsDaysBoise
datadrivendevops http:// jfrog.com / shownotes dev ops qa dev • Time to build • Release pipelines stability • Artifact replication topology • False reopen count • QA coverage ops • Avg cost of customer • Smoke tests quality qa • Te s t s u i t e s t a b i l i t y • Incoming defect velocity • Te s t e x e c u t i o n t i m e • Time to create new QA lab influenced affected
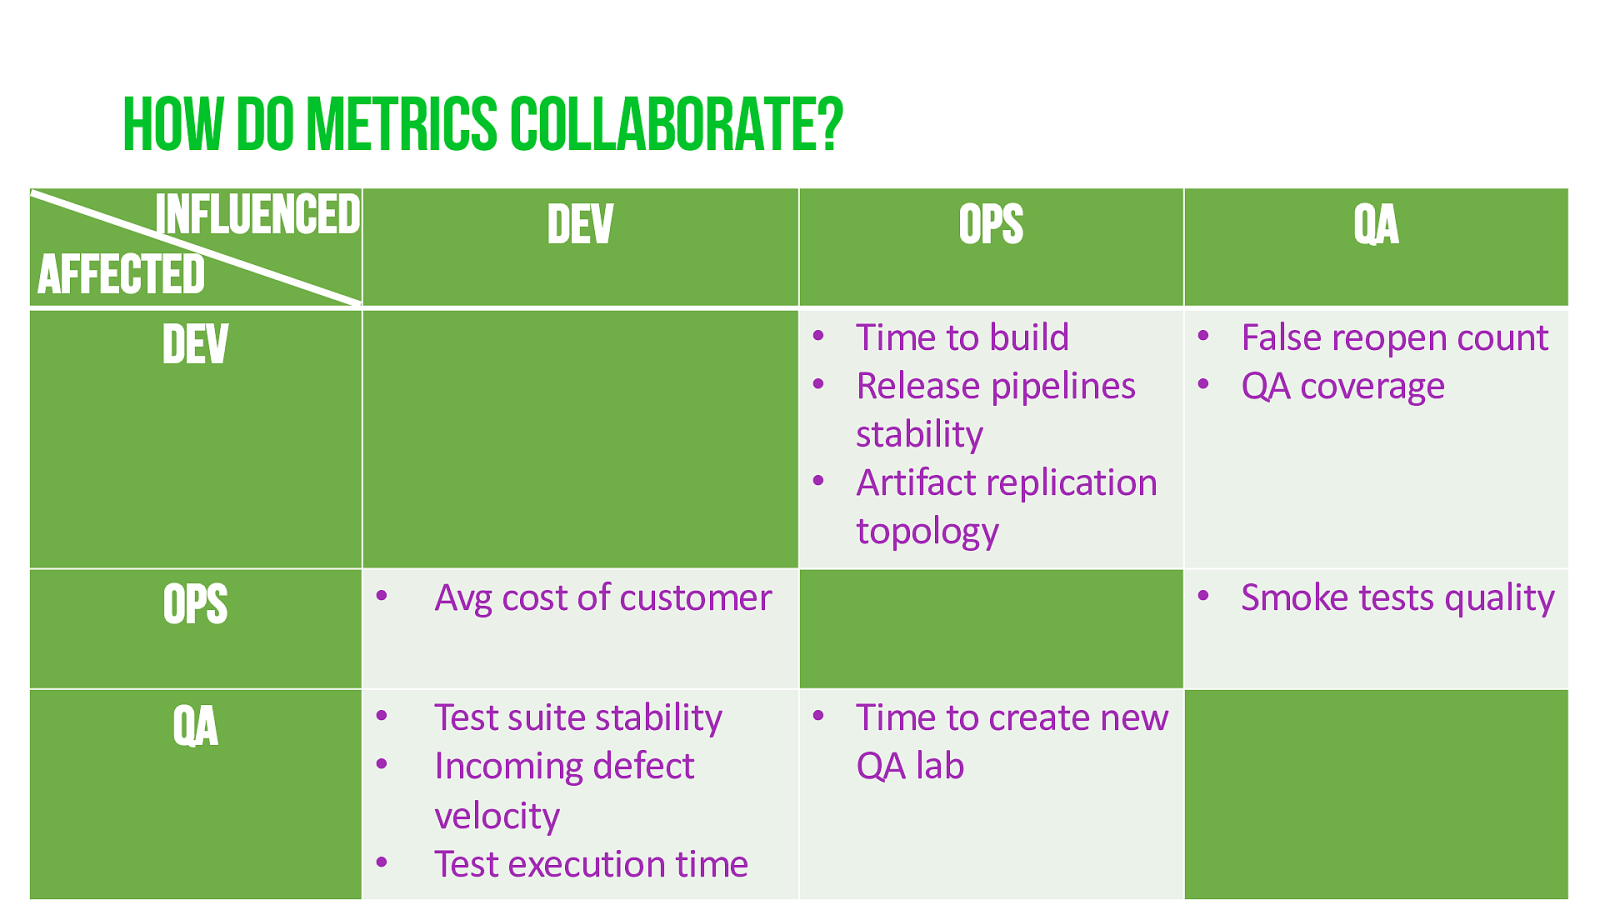
Cooking with metrics @ jbaruch @ DevOpsDaysBoise
datadrivendevops http:// jfrog.com / shownotes
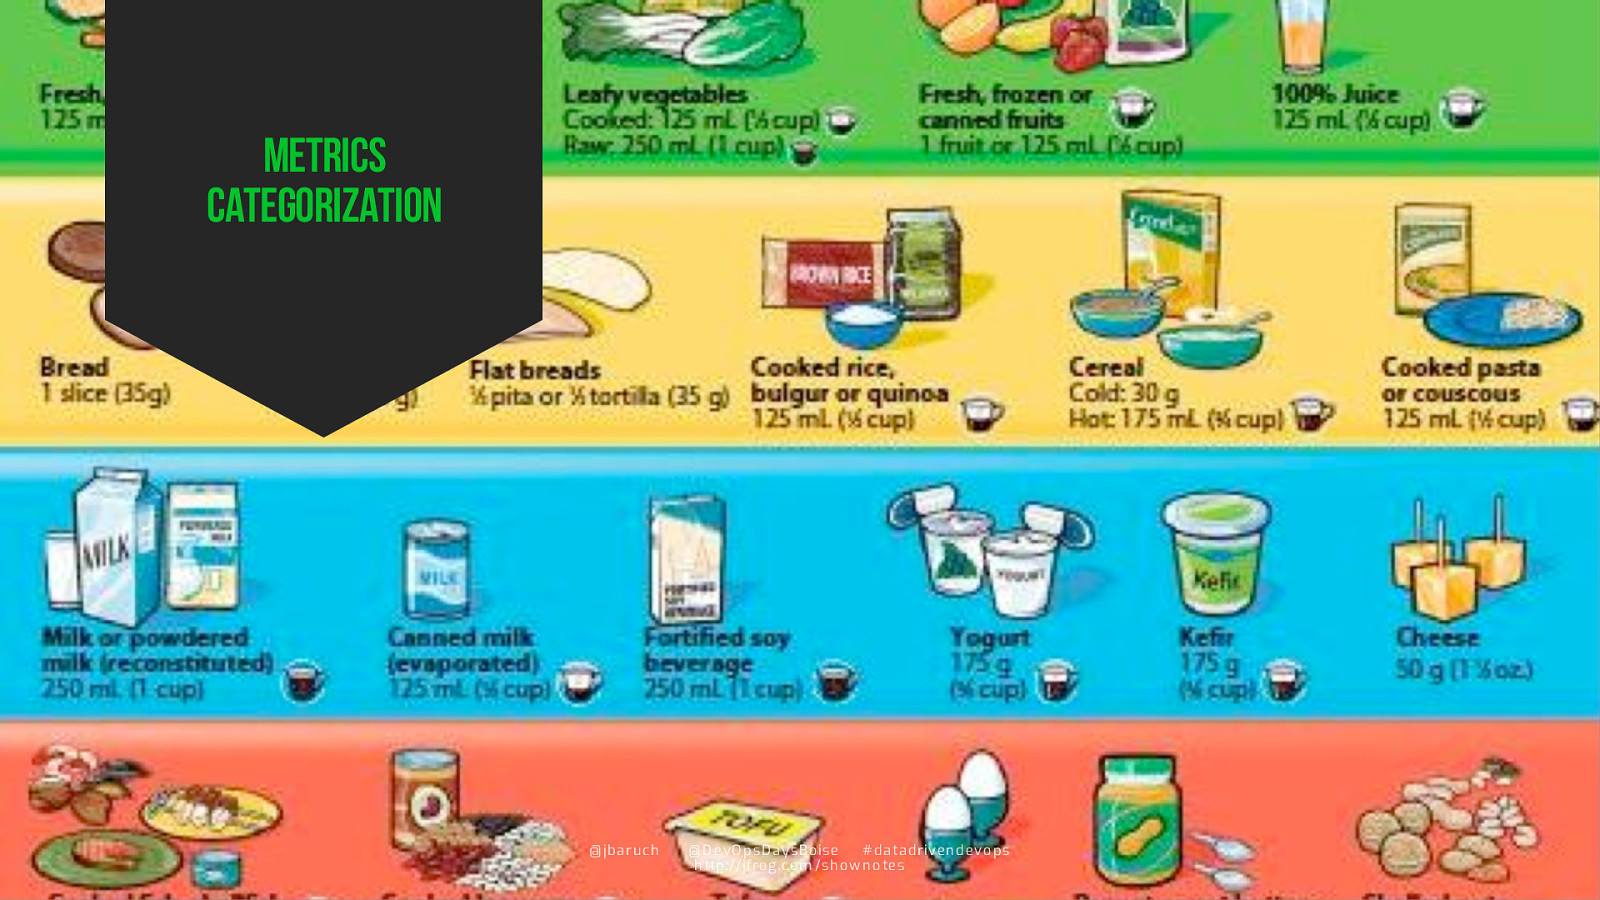
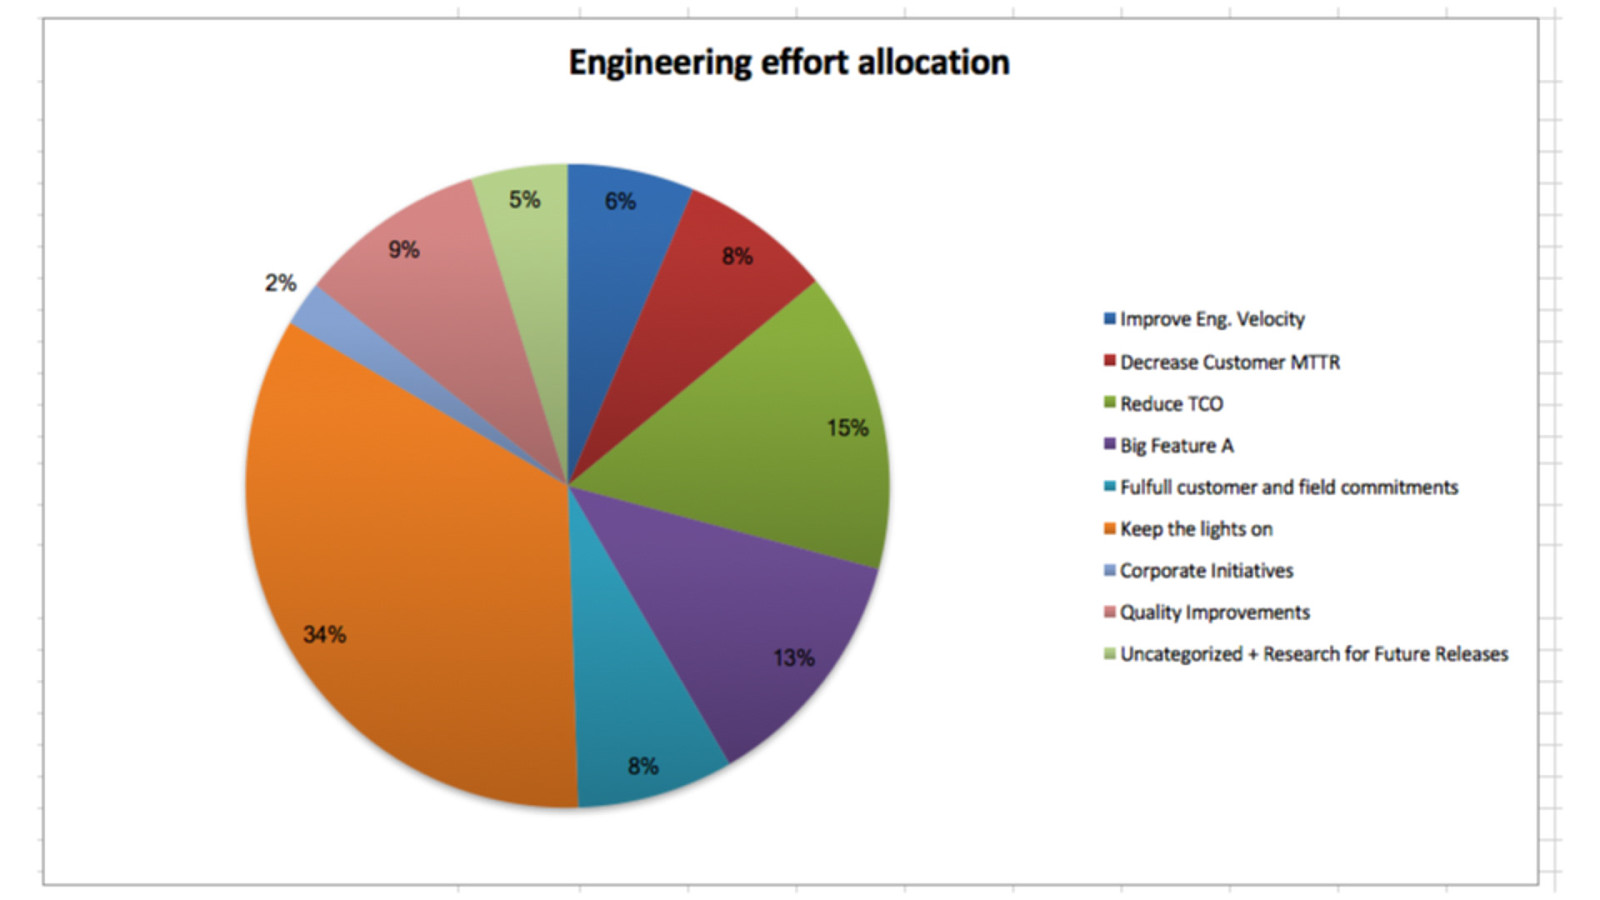
Metrics categorization @ jb a ru c h @ DevOpsDaysBoise
datadrivendevops http:// jfro g .c o m / show notes
Why? @ jbaruch @ DevOpsDaysBoise
datadrivendevops http:// jfrog.com / shownotes

ROI – is this activity is the right thing to do? @ jb a ru c h @ DevOpsDaysBoise
datadrivendevops http:// jfro g .c o m / show notes
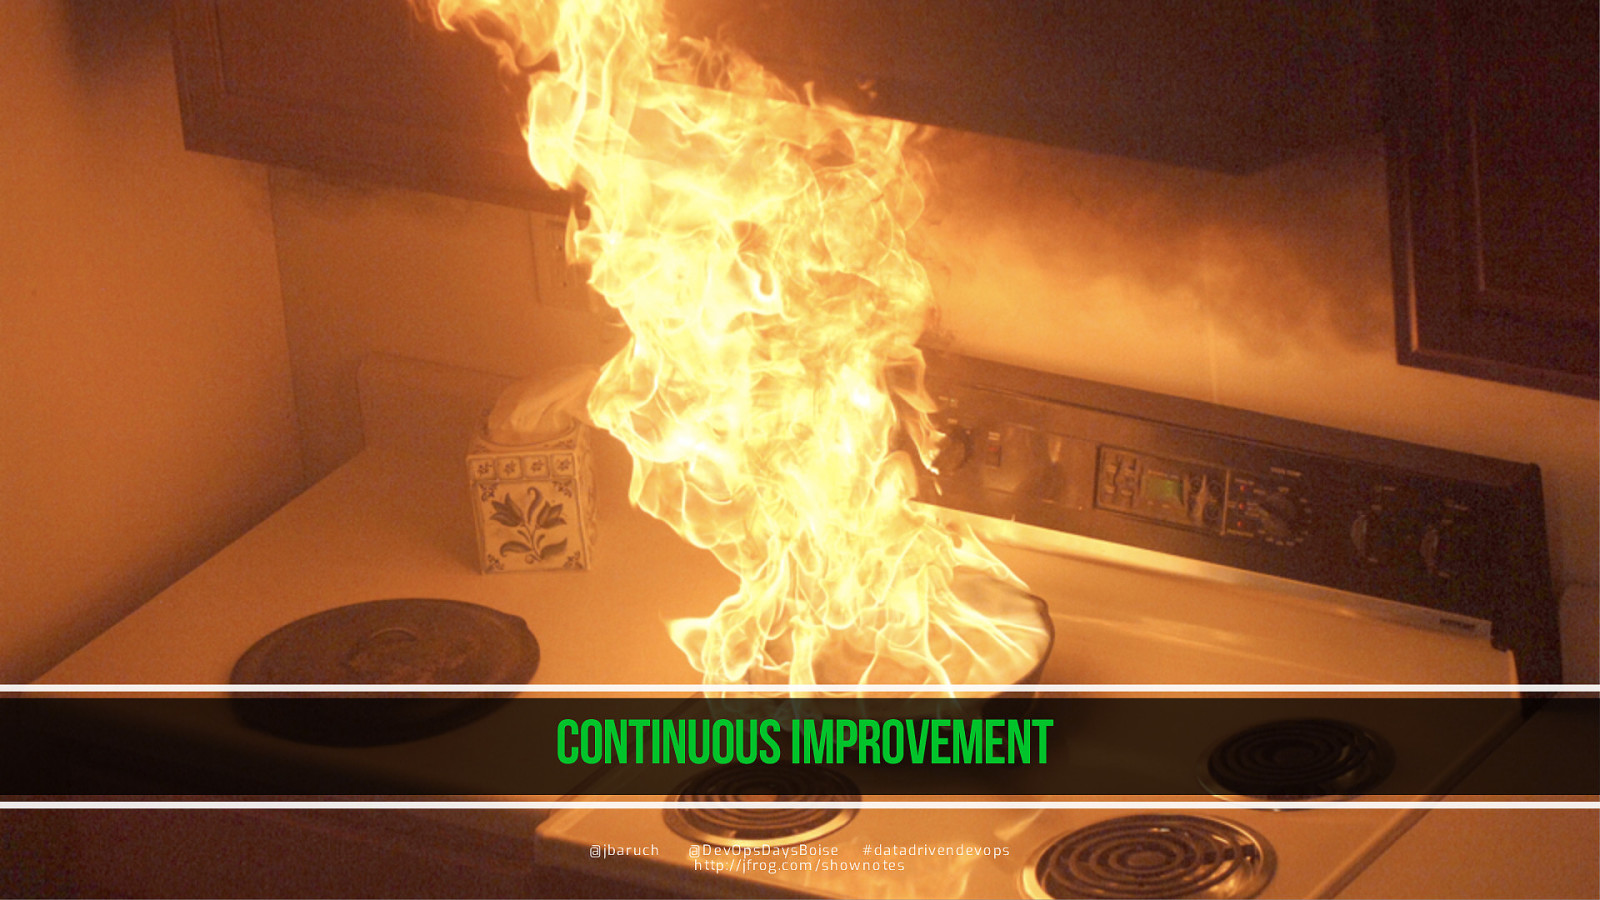
Continuous improvement @ jb a ru c h @ DevOpsDaysBoise
datadrivendevops http:// jfro g .c o m / show notes

trust @ jb a ru c h @ DevOpsDaysBoise
datadrivendevops http:// jfro g .c o m / show notes
sampling @ jbaruch @ DevOpsDaysBoise
datadrivendevops http:// jfrog.com / shownotes

Complete sample @ jb a ru c h @ DevOpsDaysBoise
datadrivendevops http:// jfro g .c o m / show notes
@ jbaruch @ DevOpsDaysBoise
datadrivendevops http:// jfrog.com / shownotes

Representative sample @ jb a ru c h @ DevOpsDaysBoise
datadrivendevops http:// jfro g .c o m / show notes
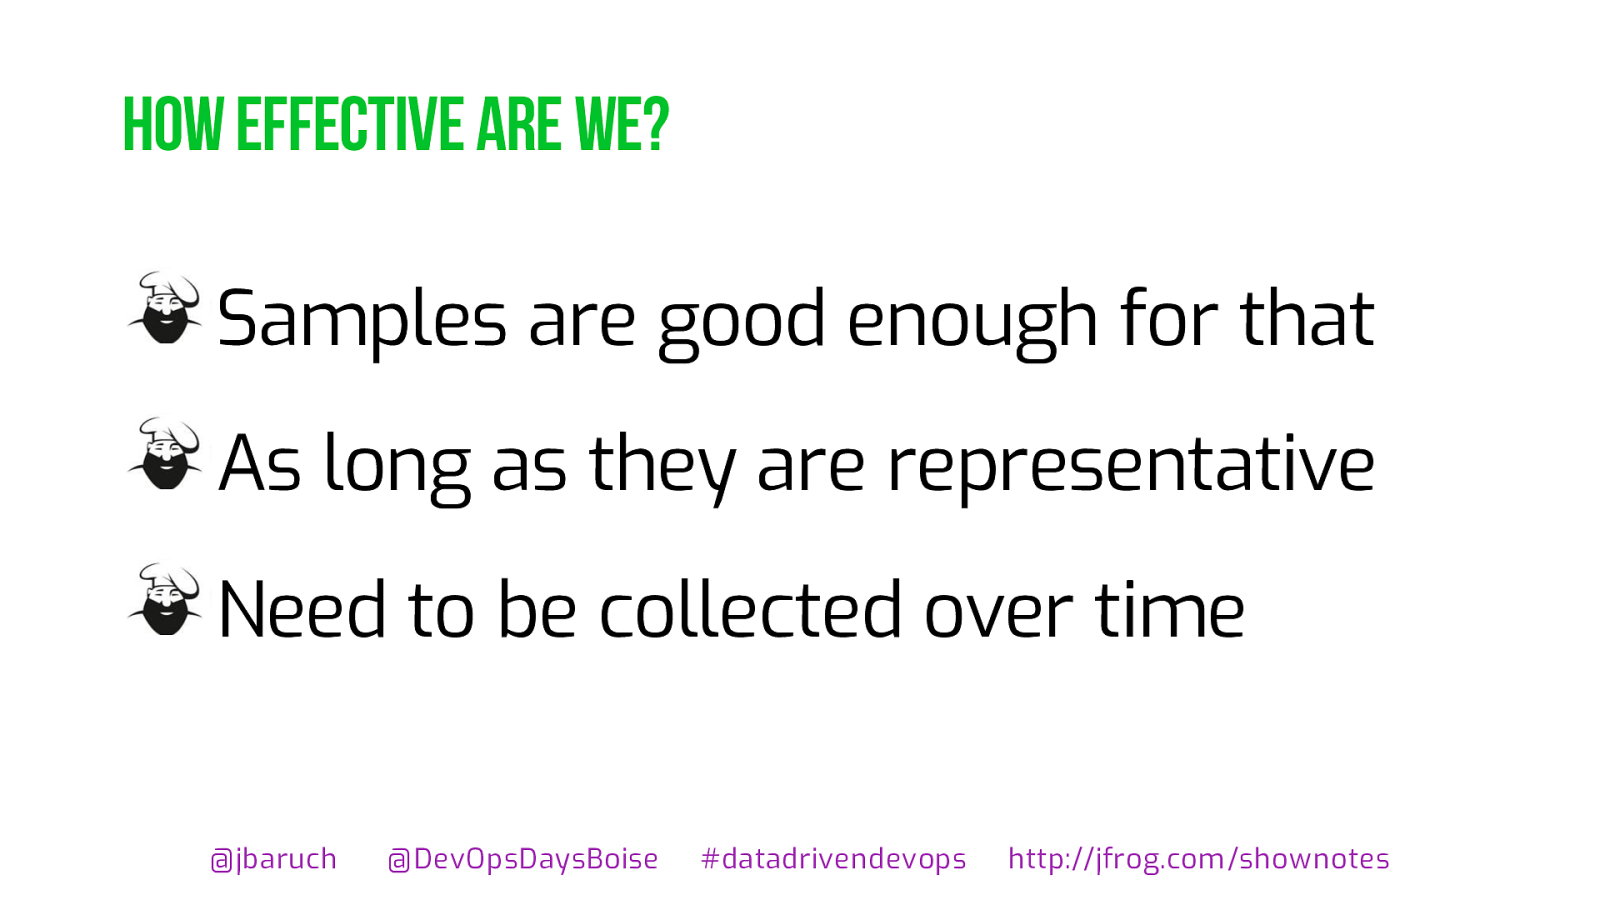
How effective are we? Samples are good enough for that As long as they are representative Need to be collected over time @ jbaruch @ DevOpsDaysBoise
datadrivendevops http:// jfrog.com / shownotes

Predicting the future @ jb a ru c h @ DevOpsDaysBoise
datadrivendevops http:// jfro g .c o m / show notes
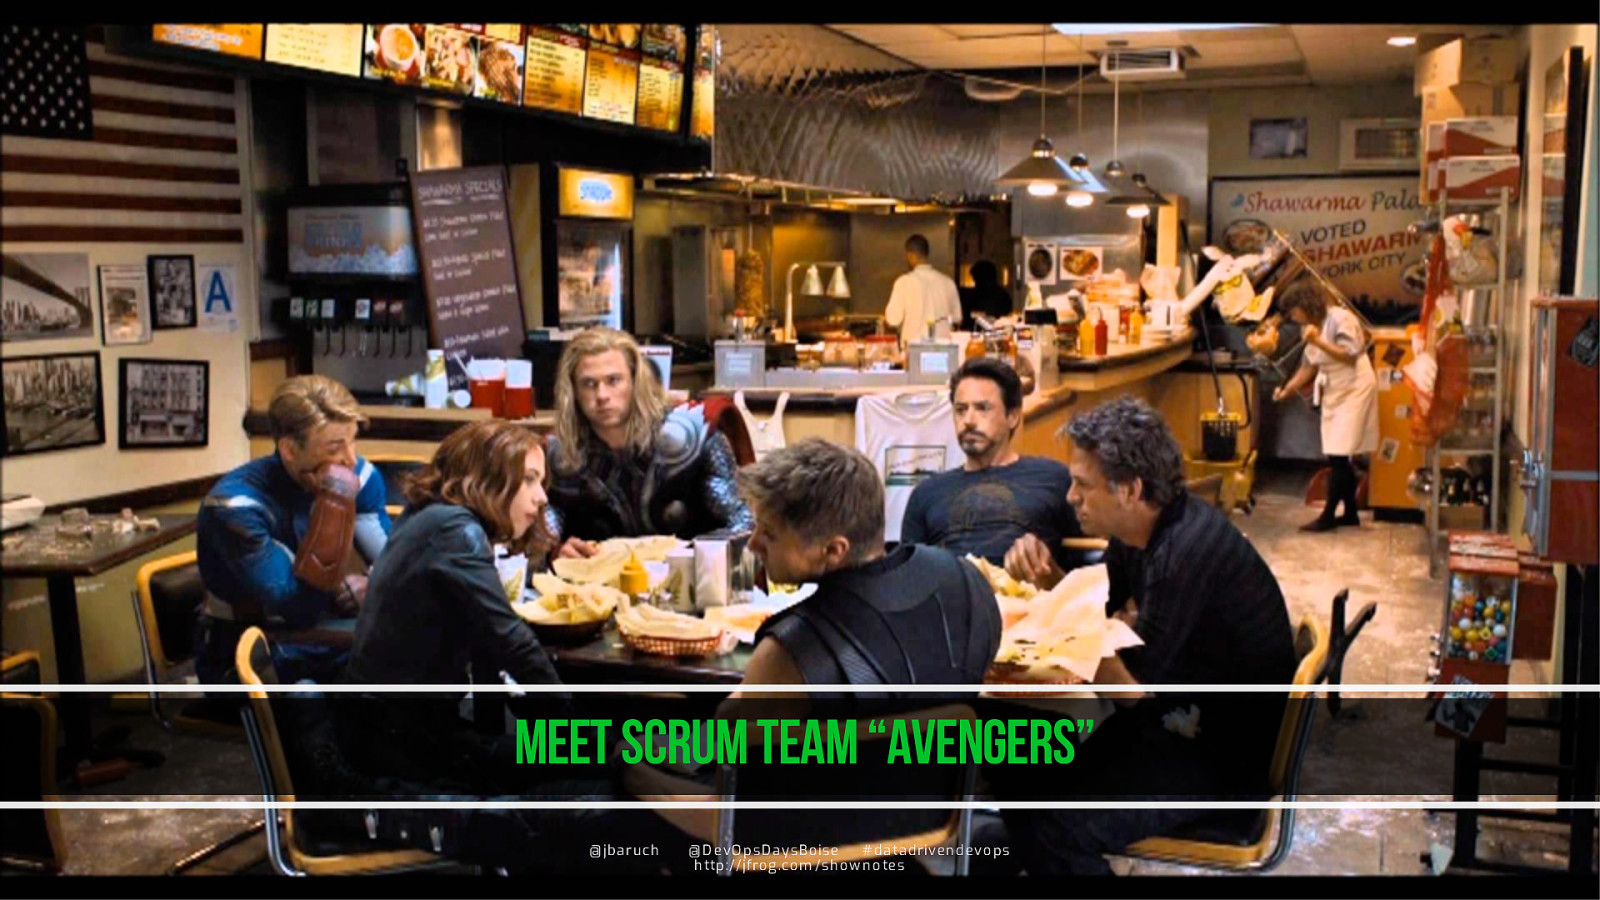
Meet scrum team “avengers” @ jb a ru c h @ DevOpsDaysBoise
datadrivendevops http:// jfro g .c o m / show notes
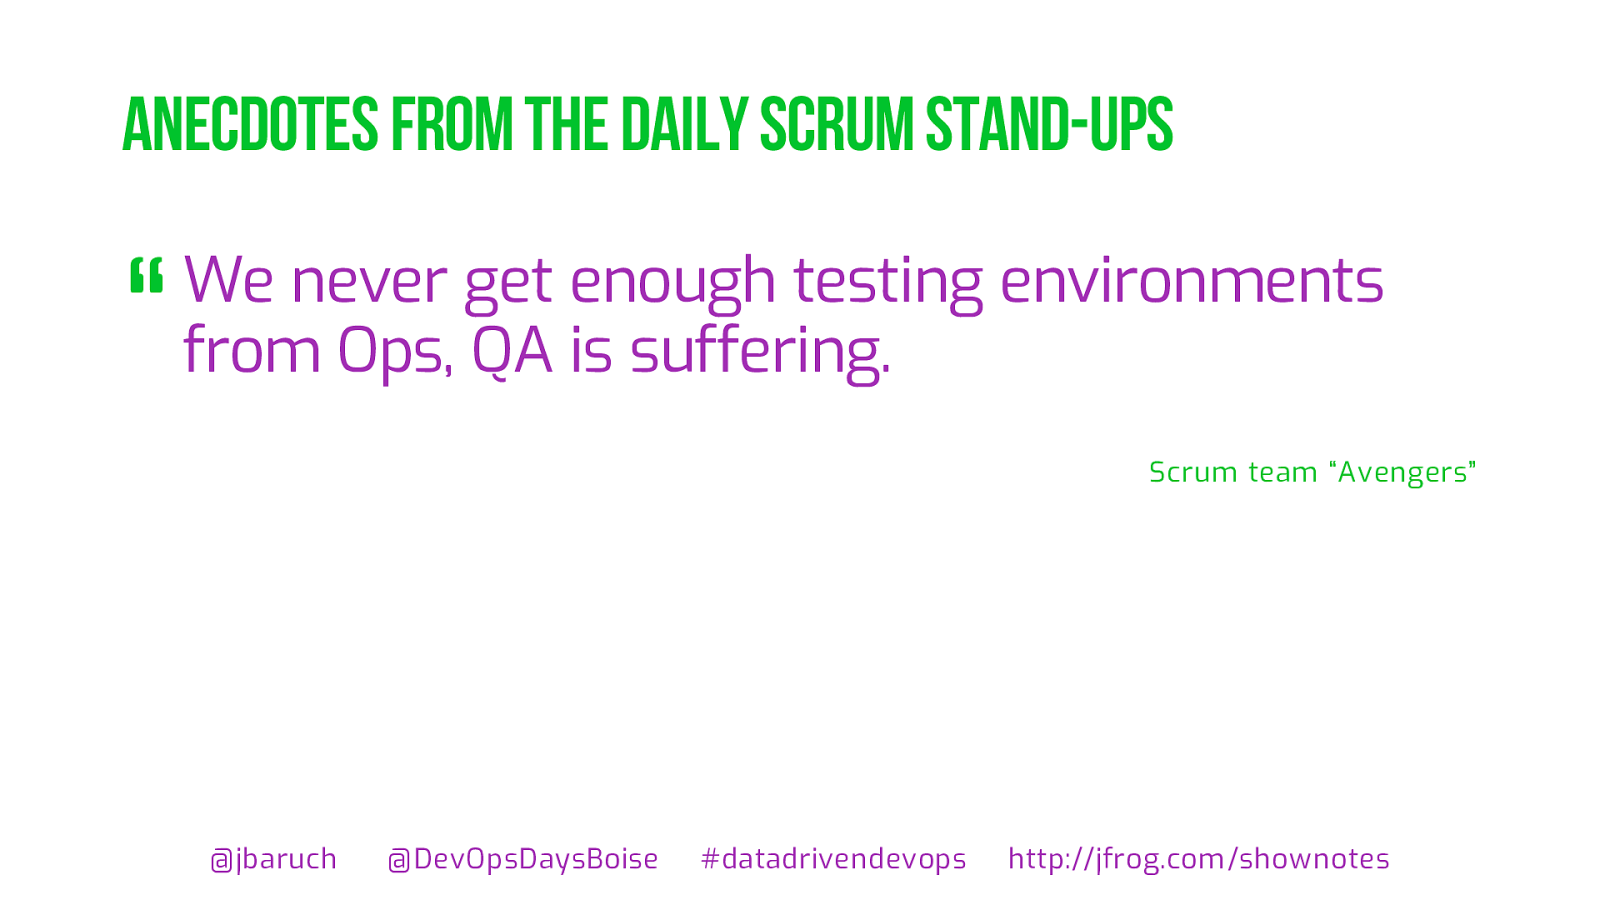
ups @ jbaruch @ DevOpsDaysBoise
datadrivendevops http:// jfrog.com / shownotes We never get enough testing environments from Ops, QA is suffering. Scrum team “Avengers” “
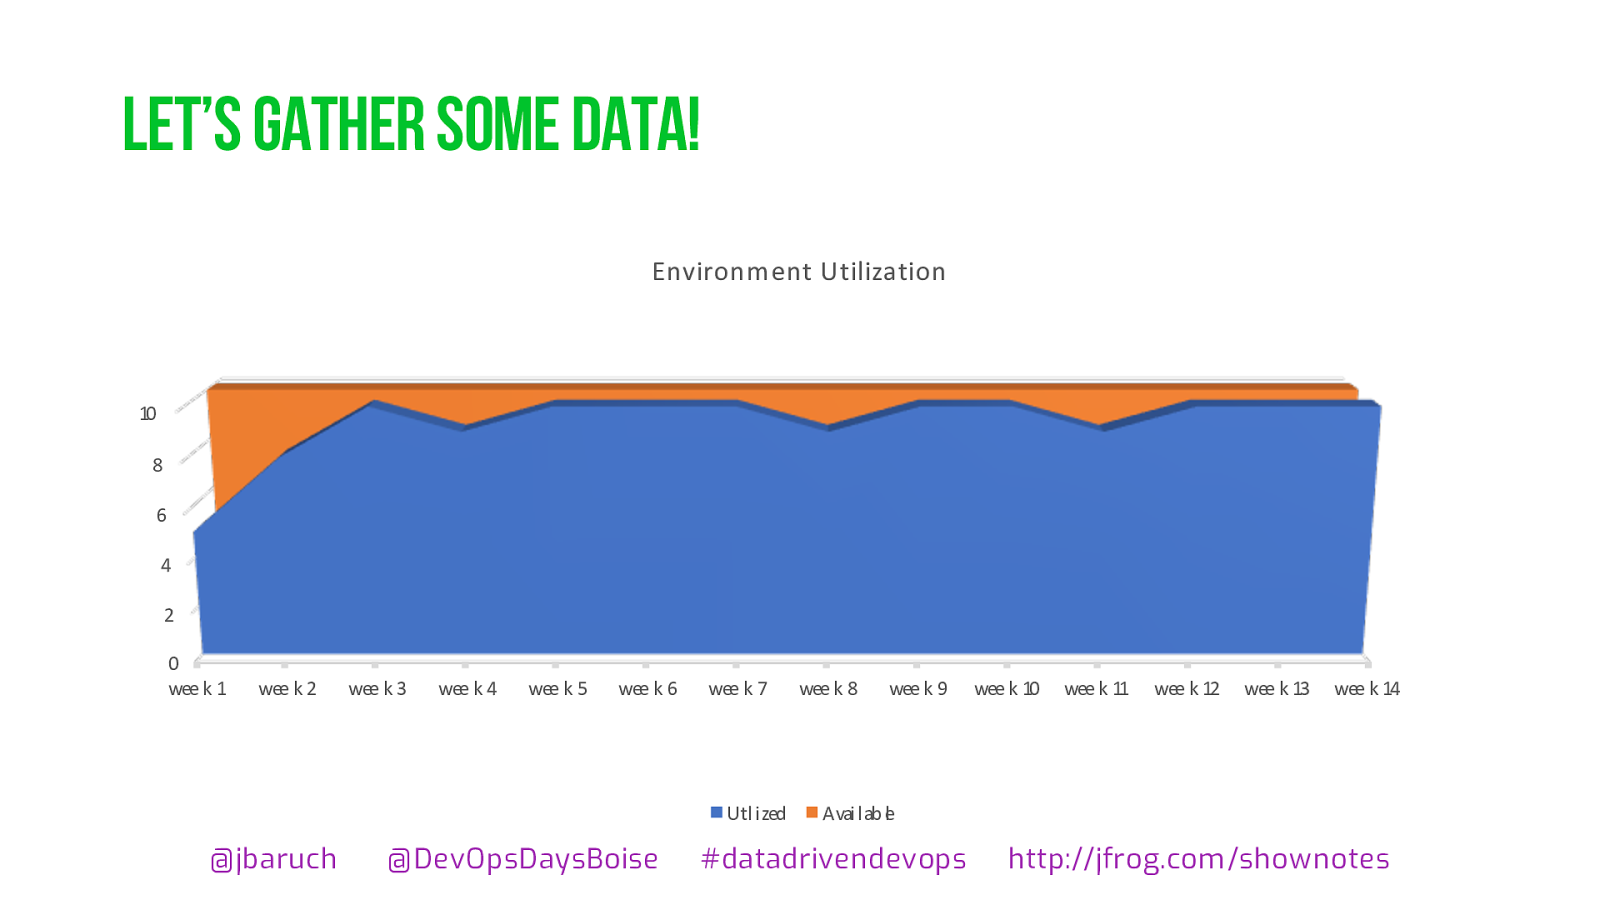
Let’s gather some data! 0 2 4 6 8 10 wee k 1 wee k 2 wee k 3 wee k 4 wee k 5 wee k 6 wee k 7 wee k 8 wee k 9 wee k 10 wee k 11 wee k 12 wee k 13 wee k 14 Environment Utilization Util i zed Availab le @ jbaruch @ DevOpsDaysBoise
datadrivendevops http:// jfrog.com / shownotes
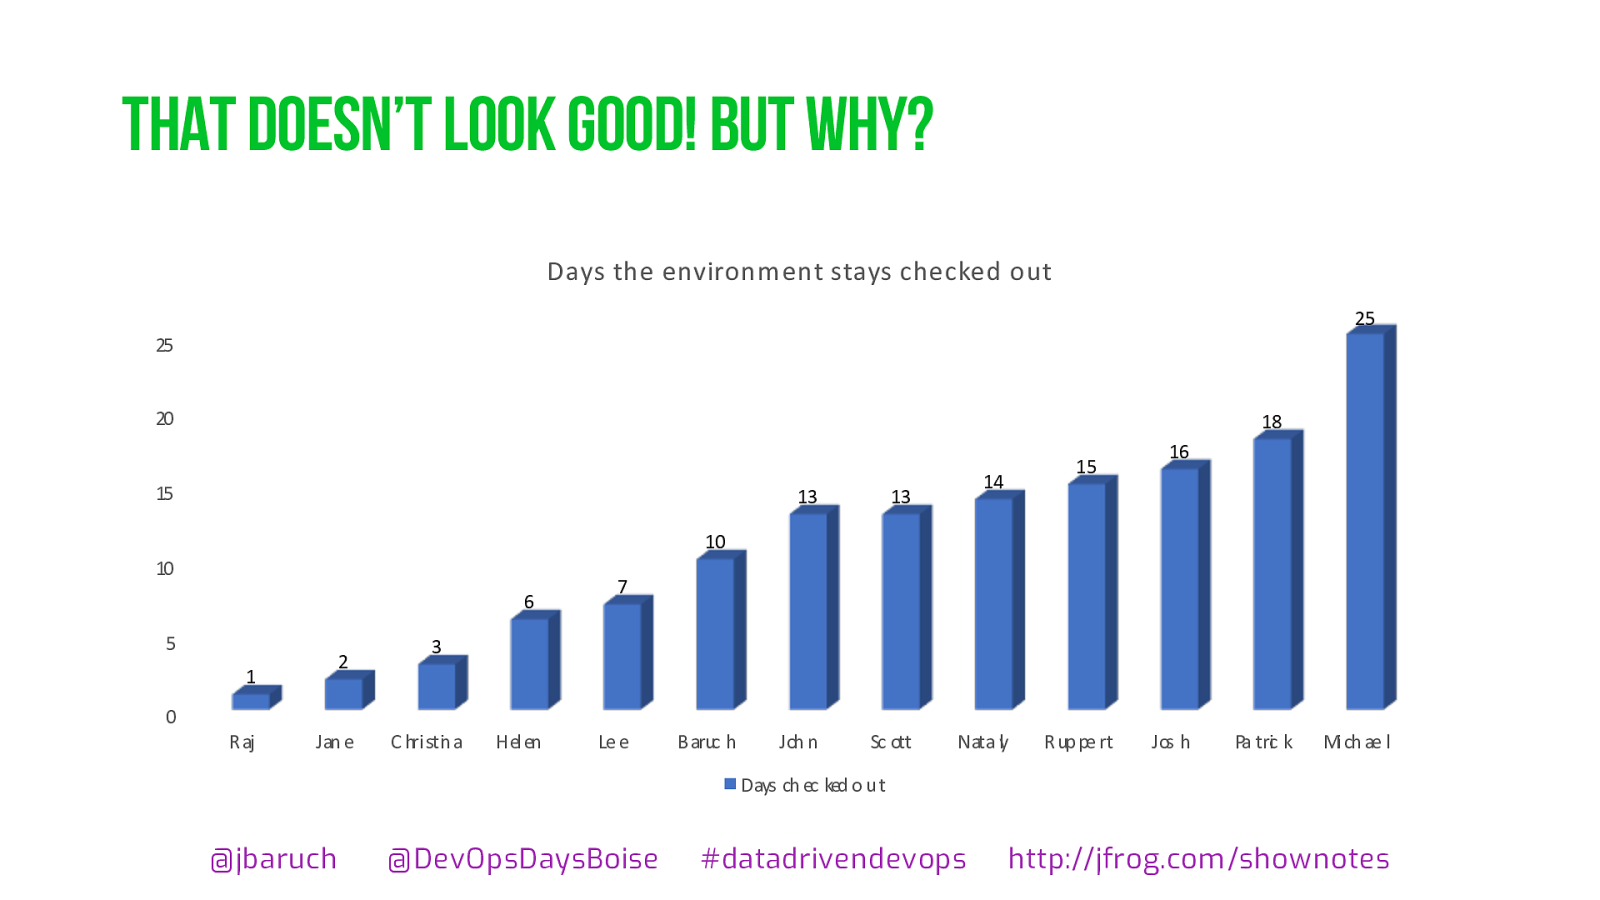
That doesn’t look good! But why? 0 5 10 15 20 25 Raj Jan e Christina Hel en Le e Baruc h Joh n Sc ot t Nata ly Ruppert Jos h Pa t r ic k Mi c h ae l 1 2 3 6 7 10 13 13 14 15 16 18 25 Days the environment stays checked out Days ch ec ked o u t @ jbaruch @ DevOpsDaysBoise
datadrivendevops http:// jfrog.com / shownotes
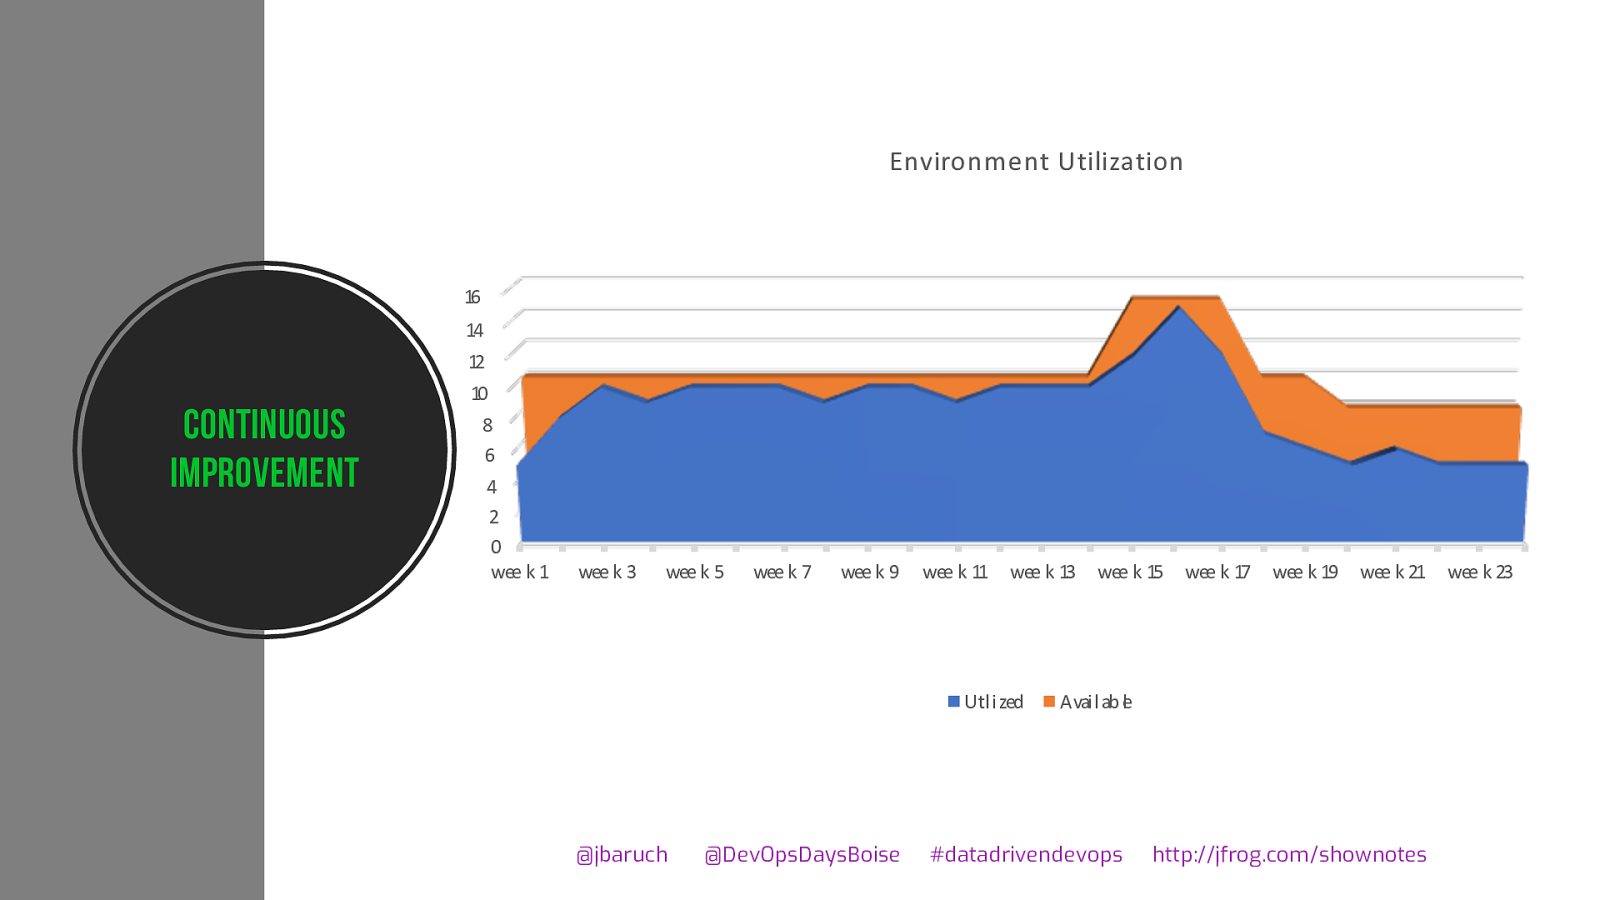
Continuous improvement @ jbaruch @ DevOpsDaysBoise
datadrivendevops http:// jfrog.com / shownotes 0 2 4 6 8 10 12 14 16 wee k 1 wee k 3 wee k 5 wee k 7 wee k 9 wee k 11 wee k 13 wee k 15 wee k 17 wee k 19 wee k 21 wee k 23 Environment Utilization Util i zed Availab le
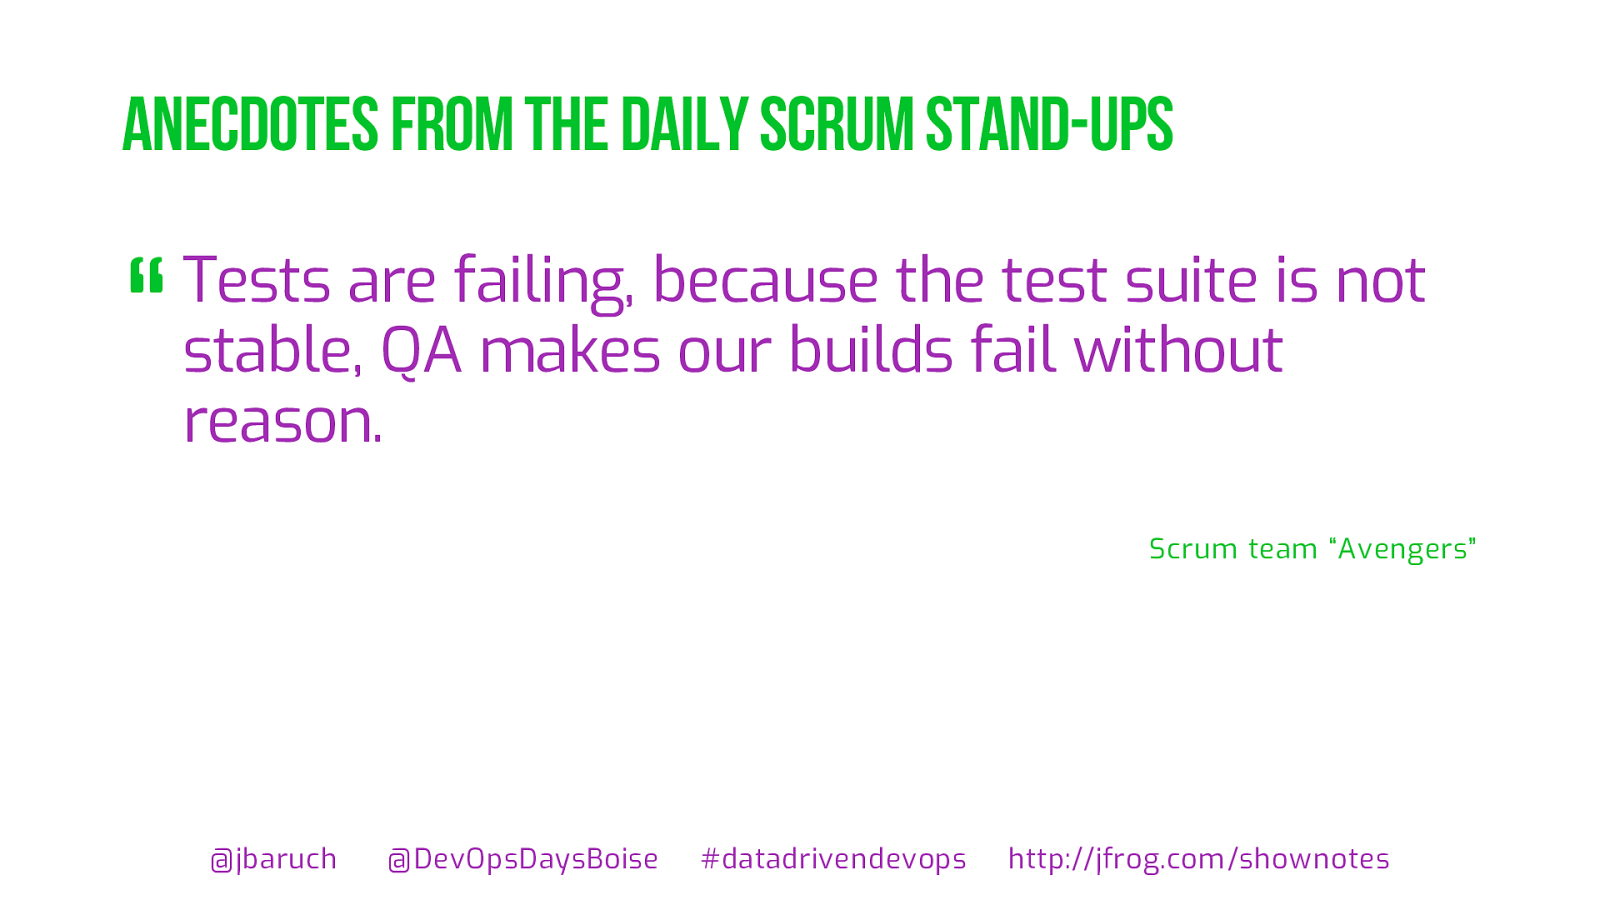
ups @ jbaruch @ DevOpsDaysBoise
datadrivendevops http:// jfrog.com / shownotes Tests are failing, because the test suite is not stable, QA makes our builds fail without reason. Scrum team “Avengers” “
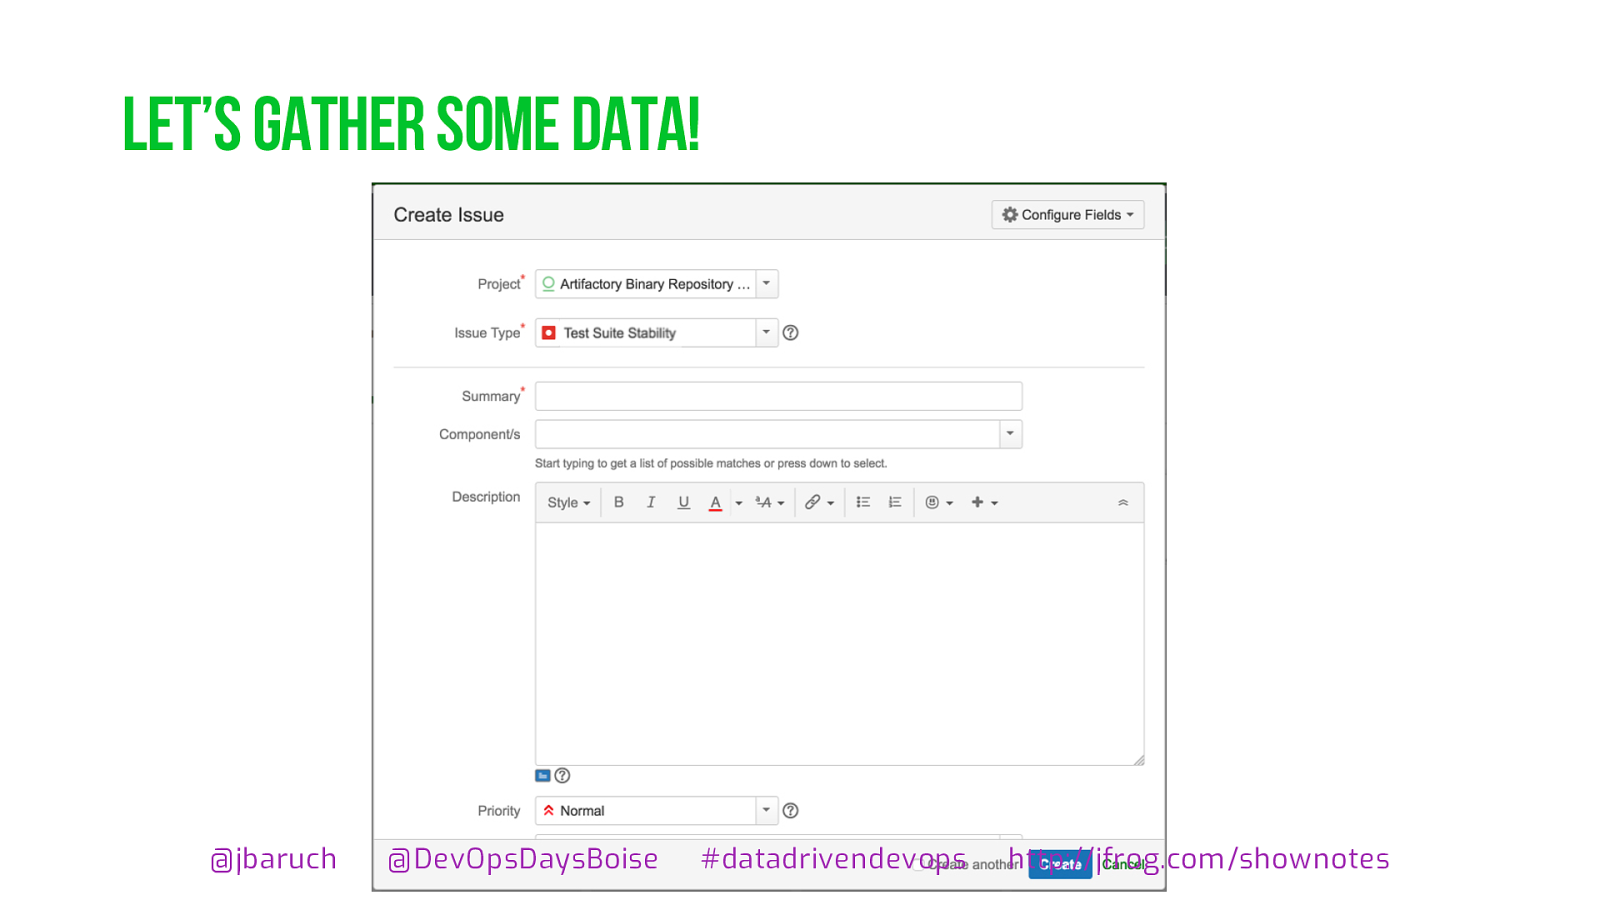
Let’s gather some data! @ jbaruch @ DevOpsDaysBoise
datadrivendevops http:// jfrog.com / shownotes
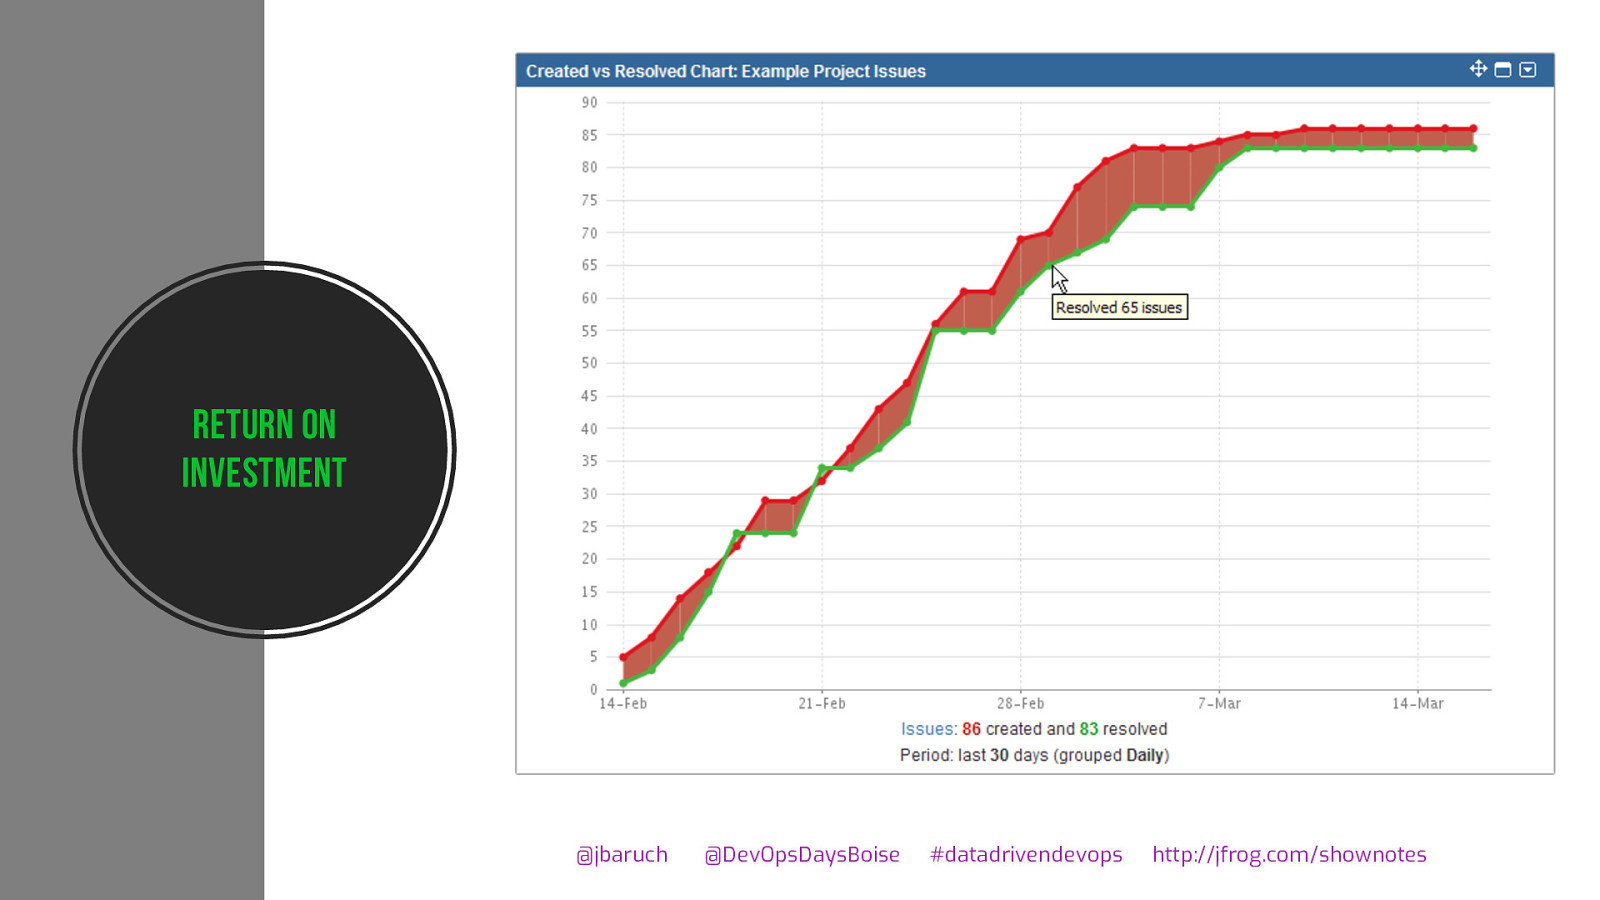
Return on investment @ jbaruch @ DevOpsDaysBoise
datadrivendevops http:// jfrog.com / shownotes
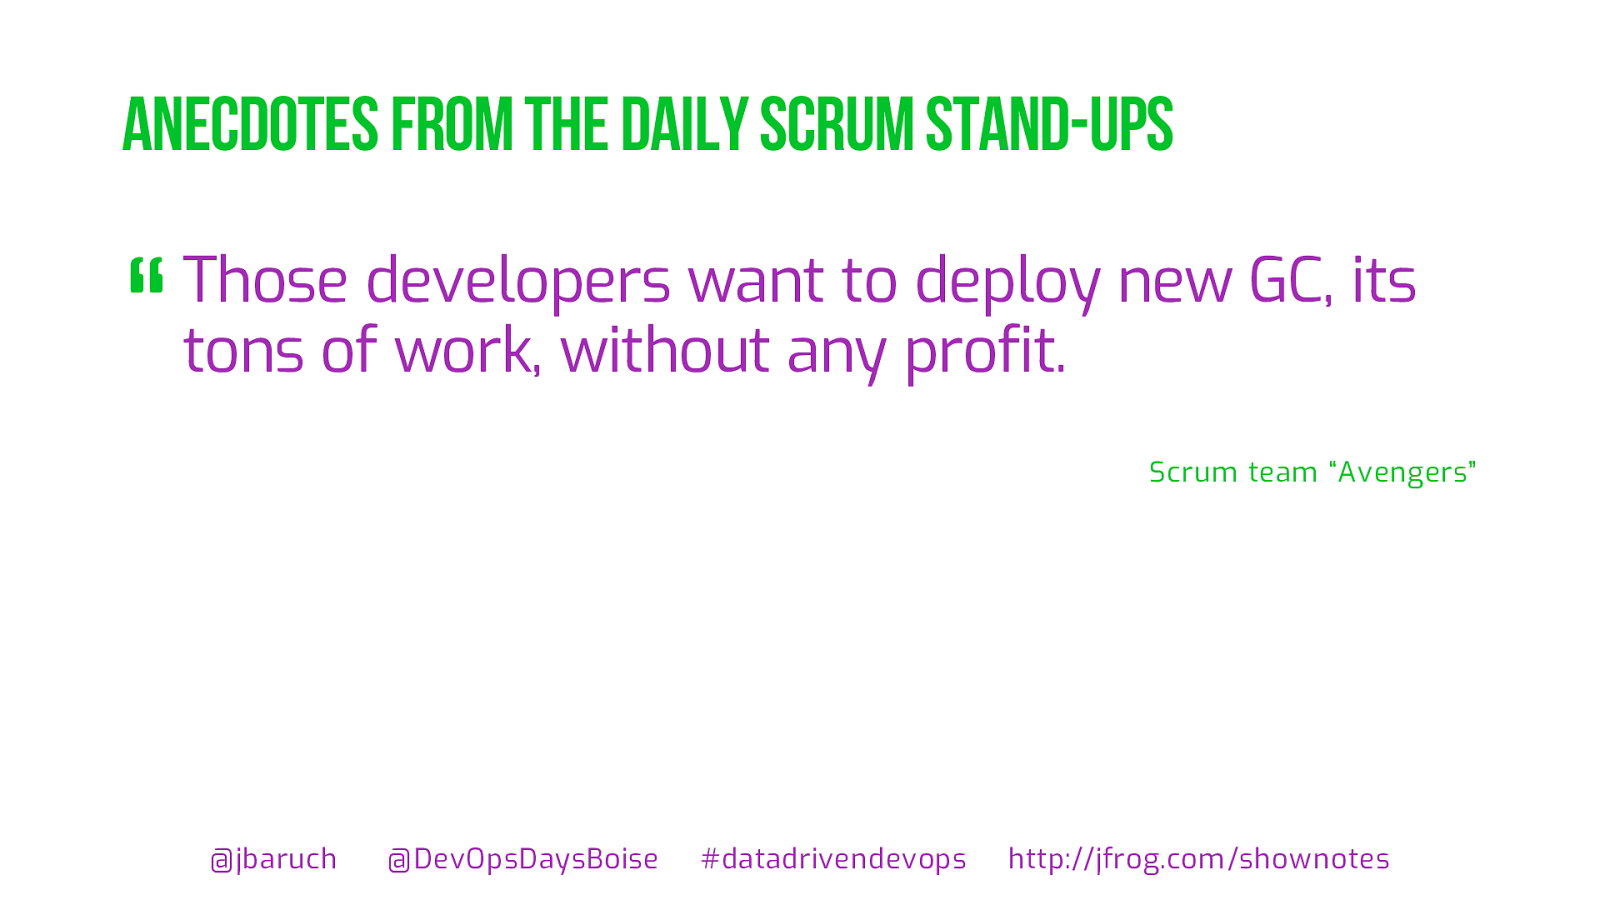
ups @ jbaruch @ DevOpsDaysBoise
datadrivendevops http:// jfrog.com / shownotes Those developers want to deploy new GC, its tons of work, without any profit. Scrum team “Avengers” “
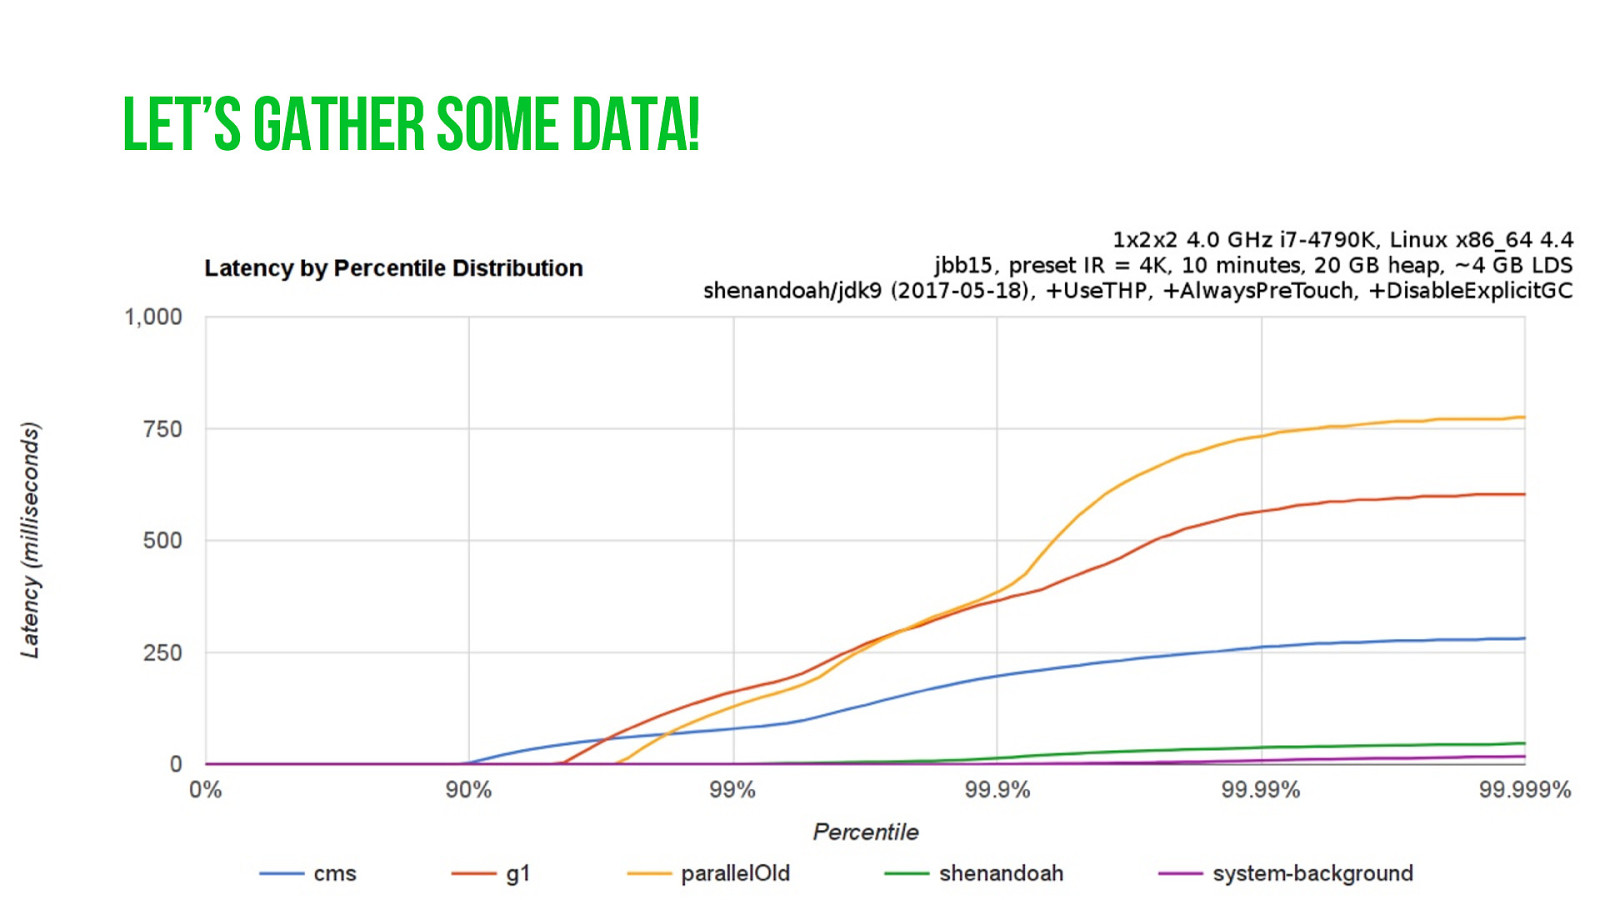
Let’s gather some data! @ jbaruch @ DevOpsDaysBoise
datadrivendevops http:// jfrog.com / shownotes
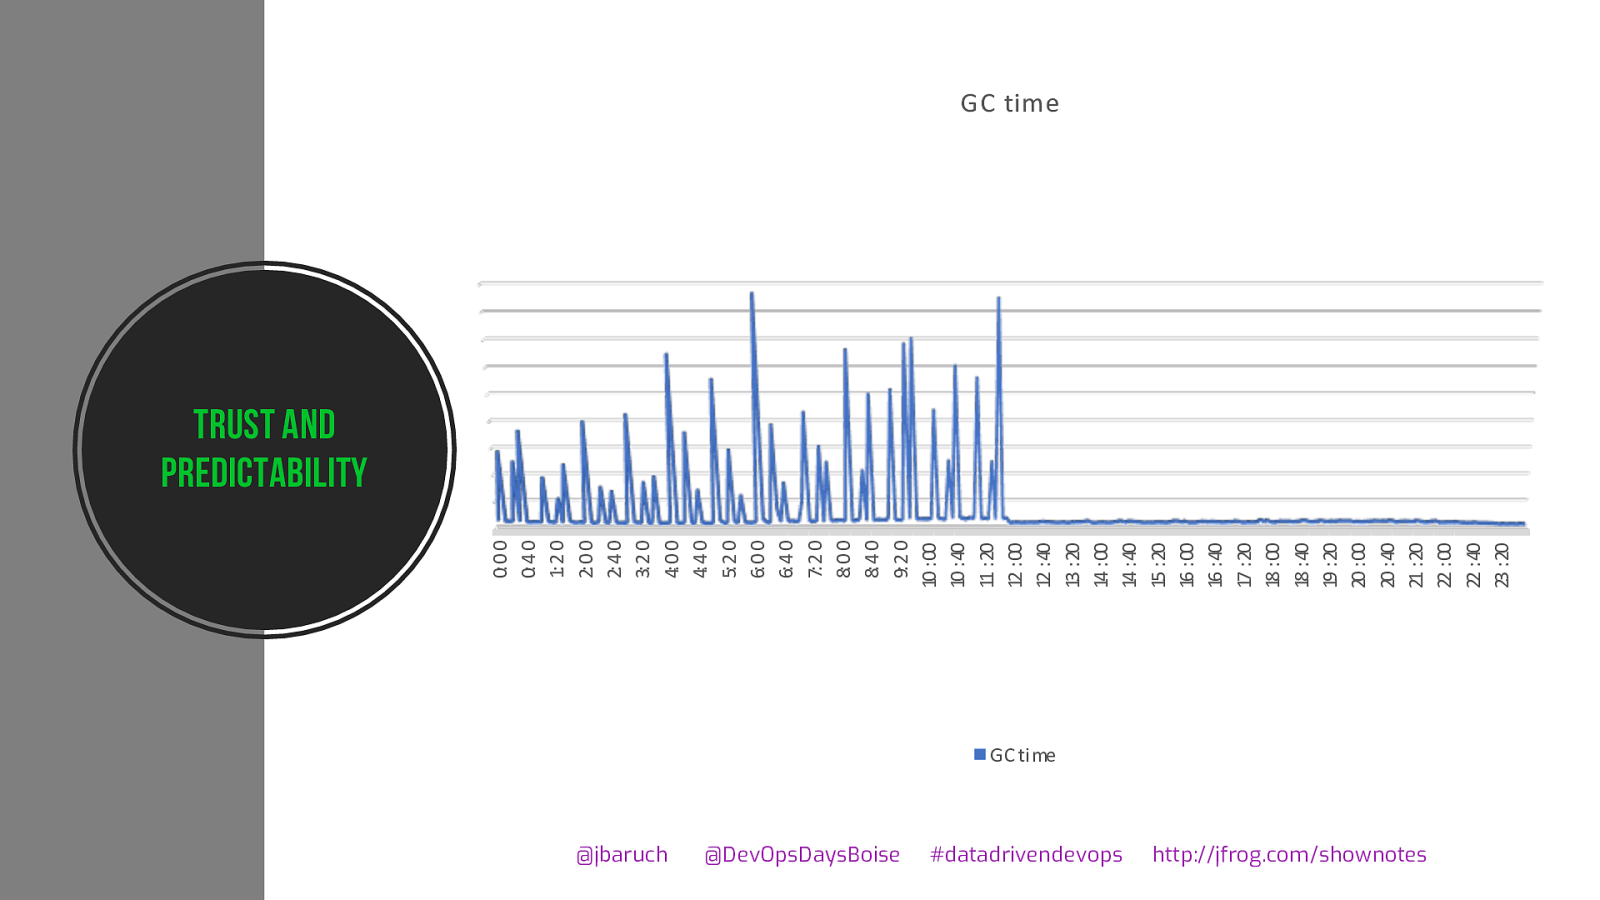
Trust and predictability @ jbaruch @ DevOpsDaysBoise
datadrivendevops http:// jfrog.com / shownotes 0: 0 0 0: 4 0 1: 2 0 2: 0 0 2: 4 0 3: 2 0 4: 0 0 4: 4 0 5: 2 0 6: 0 0 6: 4 0 7: 2 0 8: 0 0 8: 4 0 9: 2 0 10 : 00 10 : 40 11 : 20 12 : 00 12 : 40 13 : 20 14 : 00 14 : 40 15 : 20 16 : 00 16 : 40 17 : 20 18 : 00 18 : 40 19 : 20 20 : 00 20 : 40 21 : 20 22 : 00 22 : 40 23 : 20 GC time GC ti me

Dos and Don’ts

Measuring the right thing @ jb a ru c h @ DevOpsDaysBoise
datadrivendevops http:// jfro g .c o m / show notes
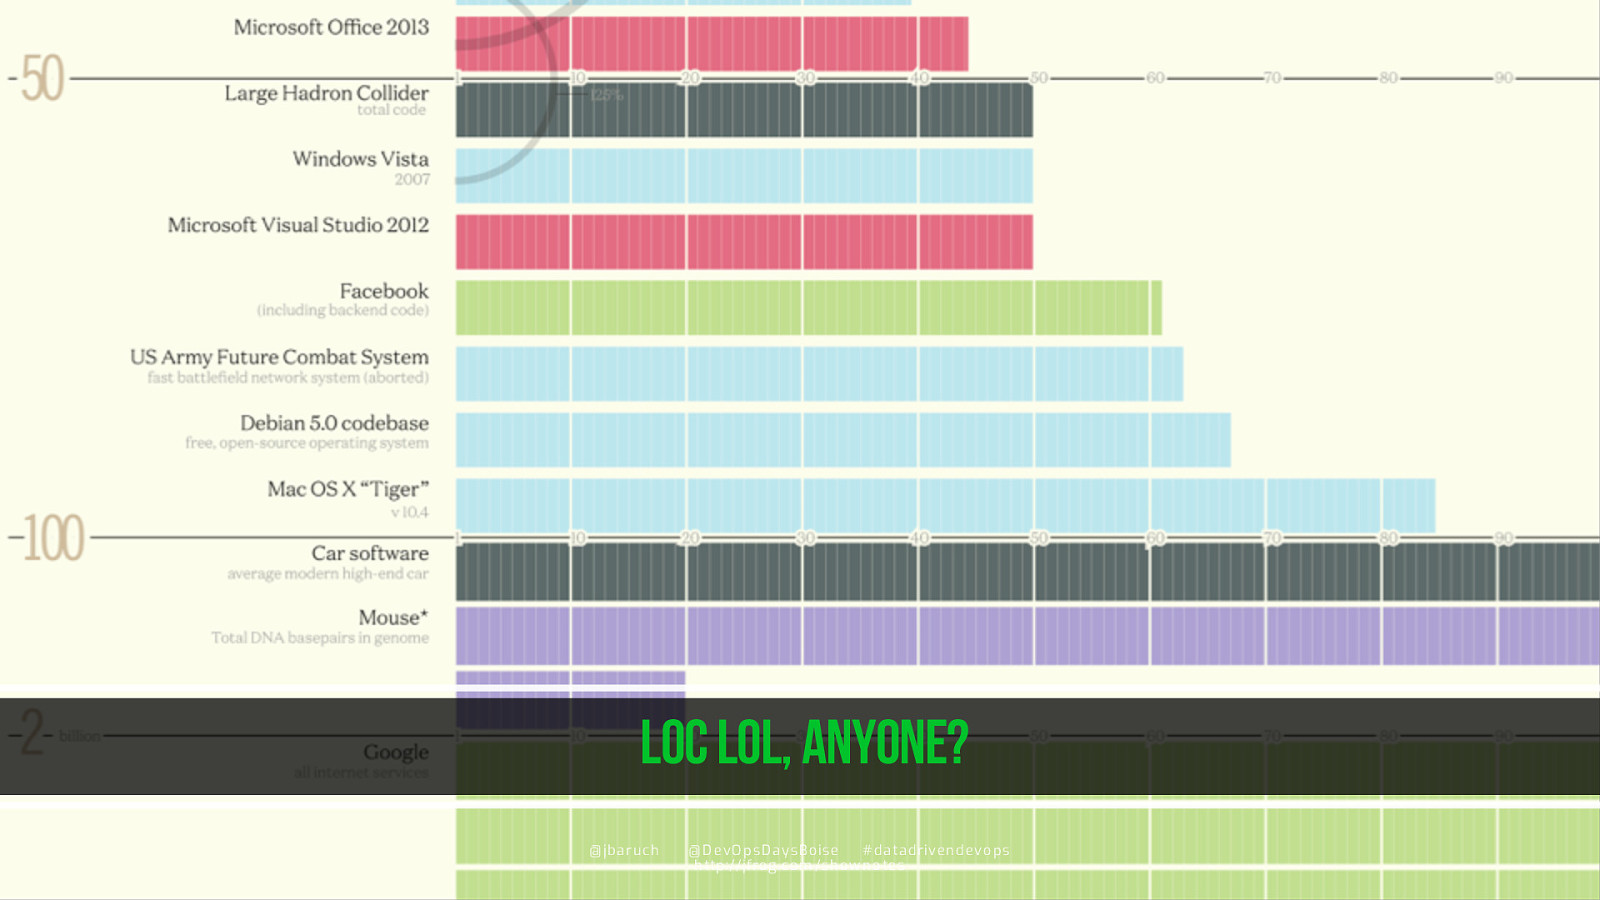
LoC LOL, anyone? @ jb a ru c h @ DevOpsDaysBoise
datadrivendevops http:// jfro g .c o m / show notes
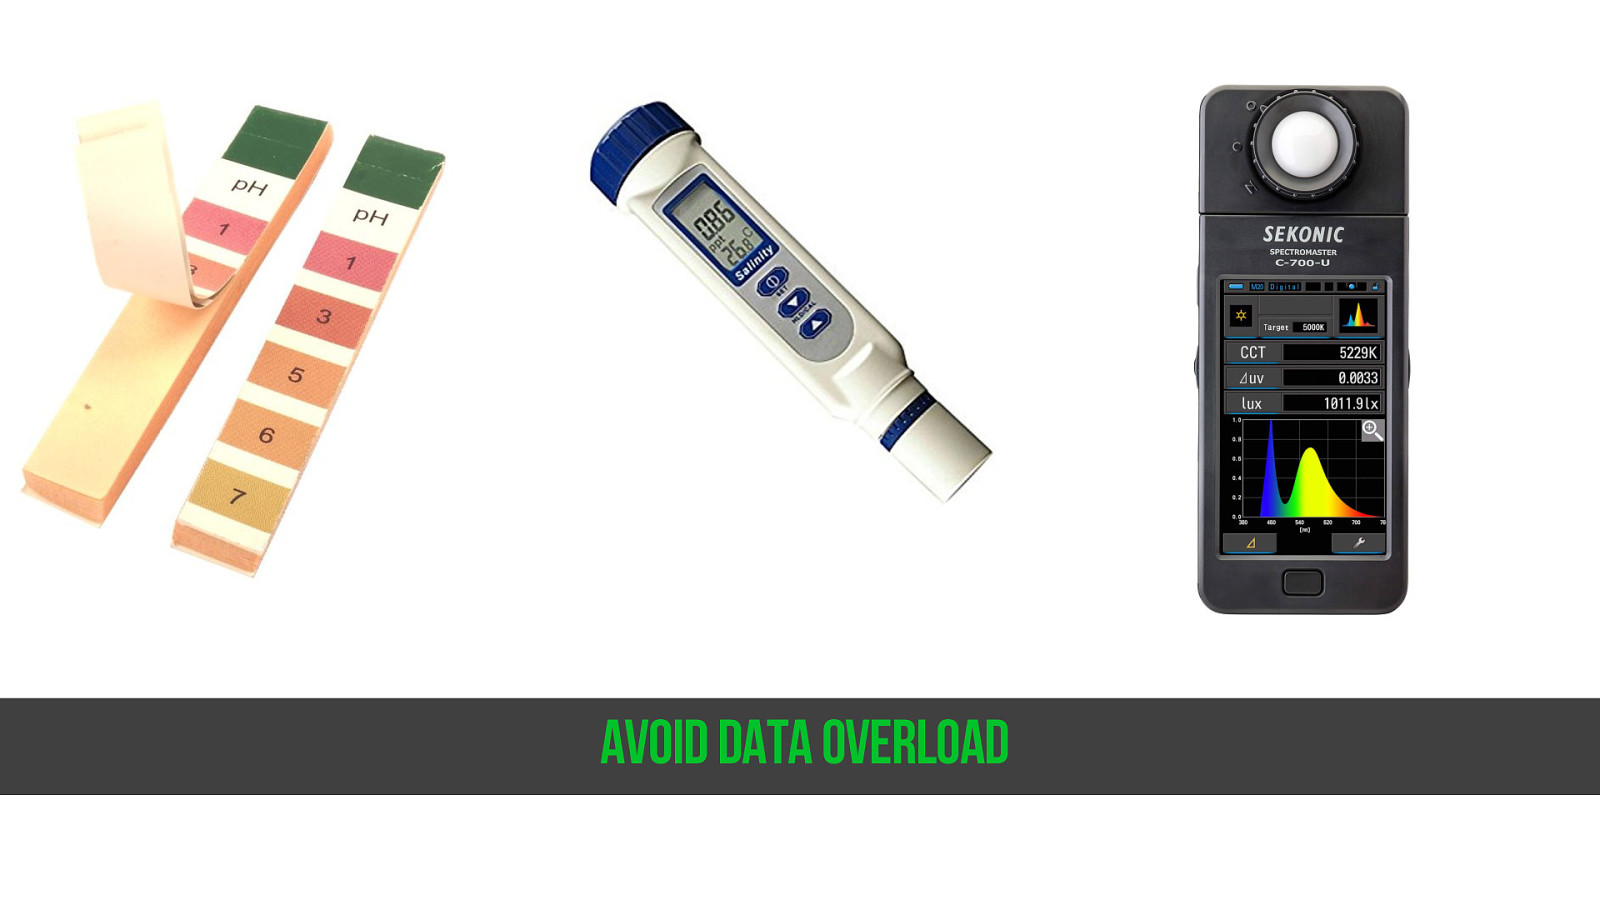
Avoid data overload @ jb a ru c h @ DevOpsDaysBoise
datadrivendevops http:// jfro g .c o m / show notes
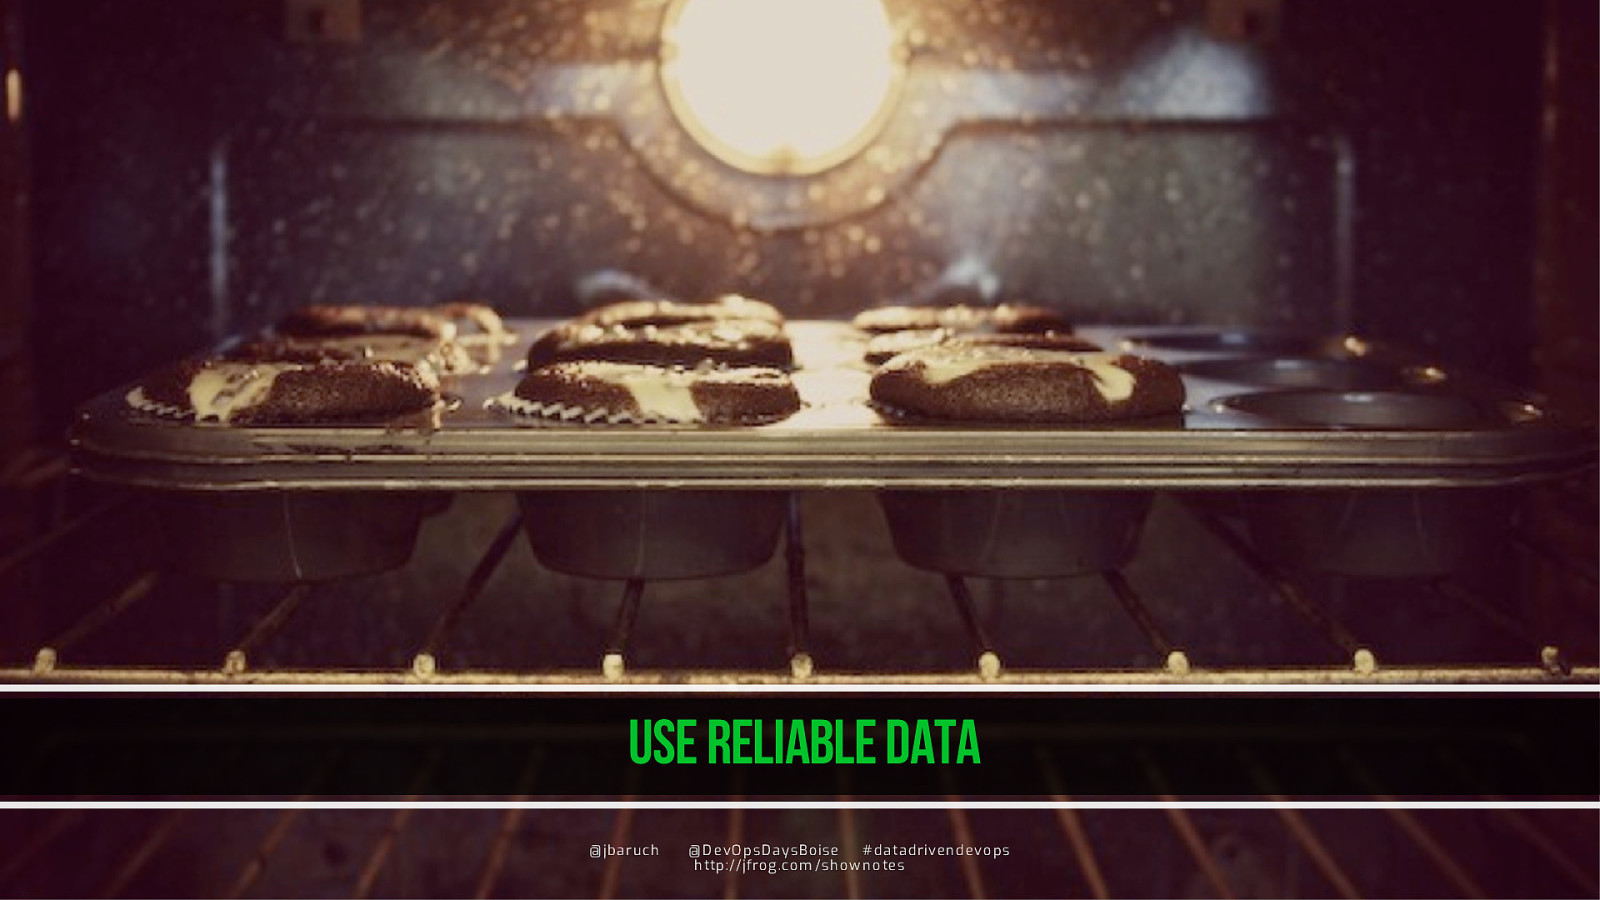
Use reliable data @ jb a ru c h @ DevOpsDaysBoise
datadrivendevops http:// jfro g .c o m / show notes
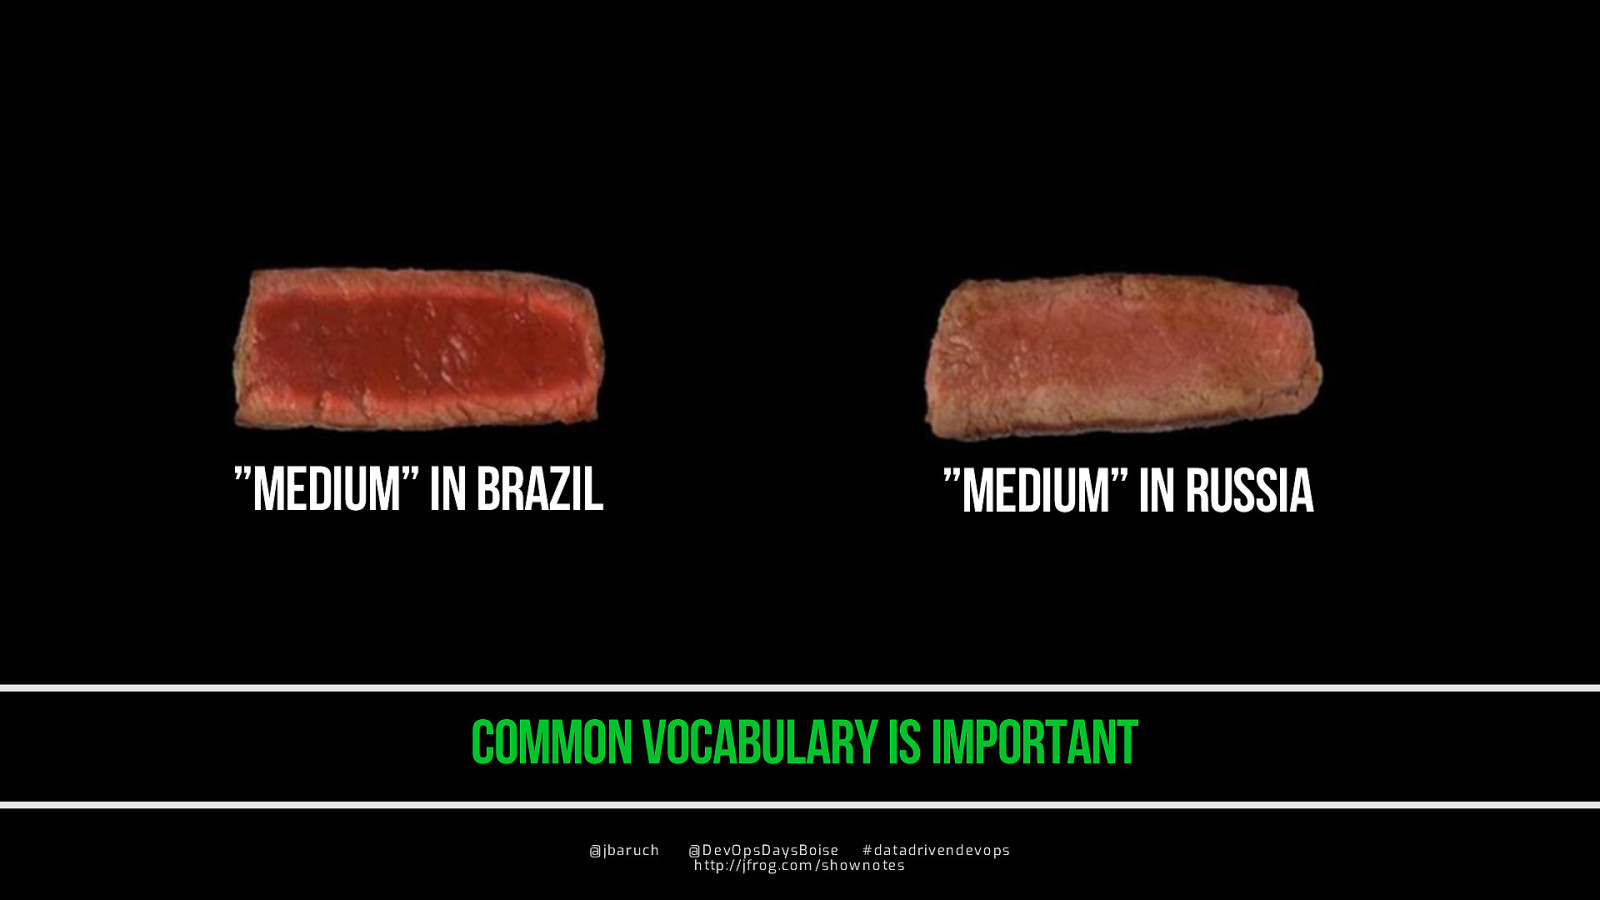
Common vocabulary is important @ jb a ru c h @ DevOpsDaysBoise
datadrivendevops http:// jfro g .c o m / show notes ”medium” In russia ”medium” In brazil
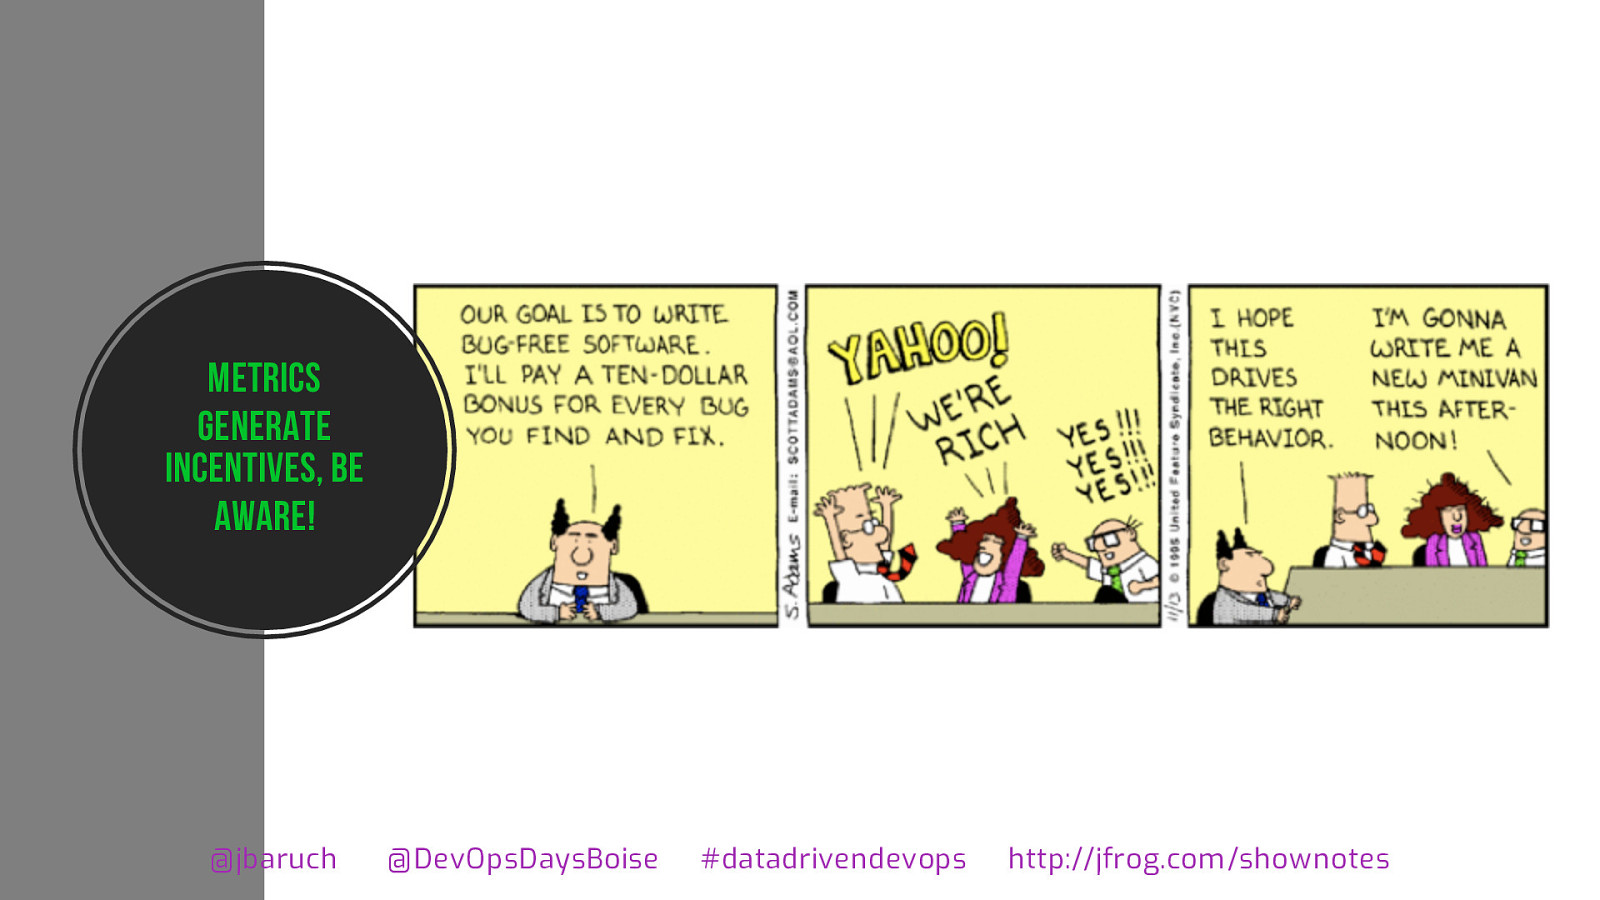
Metrics generate incentives, be aware! @ jbaruch @ DevOpsDaysBoise
datadrivendevops http:// jfrog.com / shownotes

Tweak as you go @ jb a ru c h @ DevOpsDaysBoise
datadrivendevops http:// jfro g .c o m / show notes
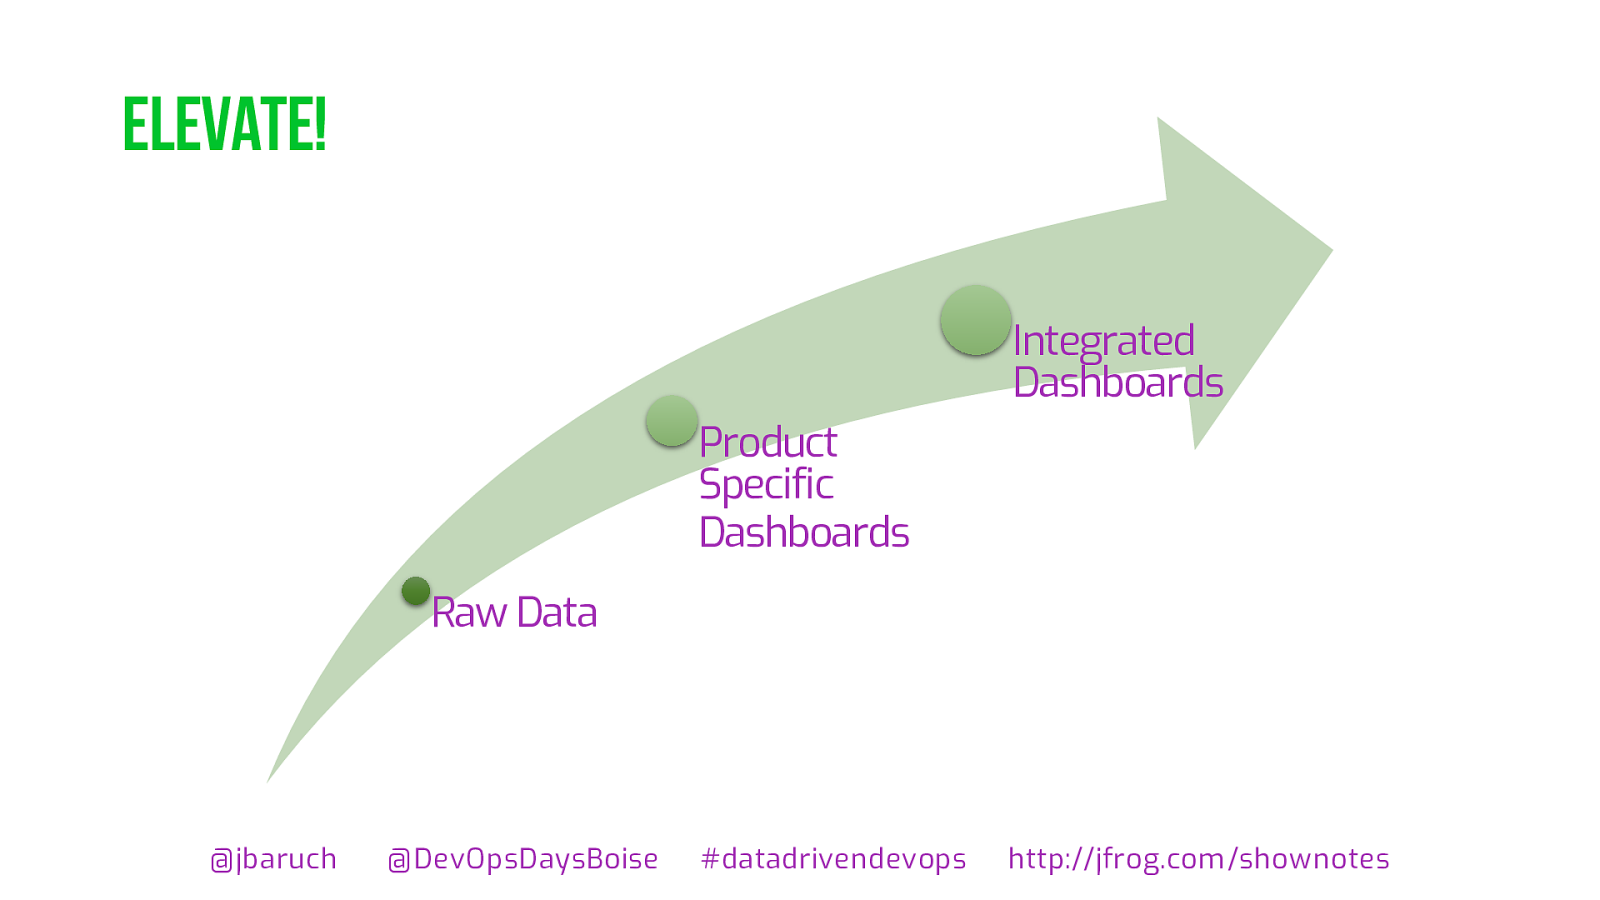
Elevate! @ jbaruch @ DevOpsDaysBoise
datadrivendevops http:// jfrog.com / shownotes Raw Data Product Specific Dashboards Integrated Dashboards
@ jbaruch @ DevOpsDaysBoise
datadrivendevops http:// jfrog.com / shownotes
@ jbaruch @ DevOpsDaysBoise
datadrivendevops http:// jfrog.com / shownotes
@ jbaruch @ DevOpsDaysBoise
datadrivendevops http:// jfrog.com / shownotes
How departments measure @ jbaruch @ DevOpsDaysBoise
datadrivendevops http:// jfrog.com / shownotes Sales Marketing Support HR Finance Anecdotes from daily standup Engineering
driven life @ jbaruch @ DevOpsDaysBoise
datadrivendevops http:// jfrog.com / shownotes Removes blame game Builds accountability and trust Creates common base for discussion
Q&A and twitter aids @ jbaruch @ DevOpsDaysBoise
datadrivendevops http:// jfrog.com / shownotes @ jbaruch @ devopsdaysboise
datadrivendevops http:// jfrog.com / shownotes