Monitor Your Applications with Logs, Metrics, Pings, and Traces (Workshop)
A presentation at BuildStuff in in Vilnius, Lithuania by Philipp Krenn

Monitor Your Applications with Logs, Metrics, Pings, and Traces Philipp Krenn @xeraa


How? vs !

Developer

Disclaimer I build highly monitored Hello World apps

Disclaimer This is not a training https://training.elastic.co


Licensing Open Source Apache-2.0 Basic free Commercial
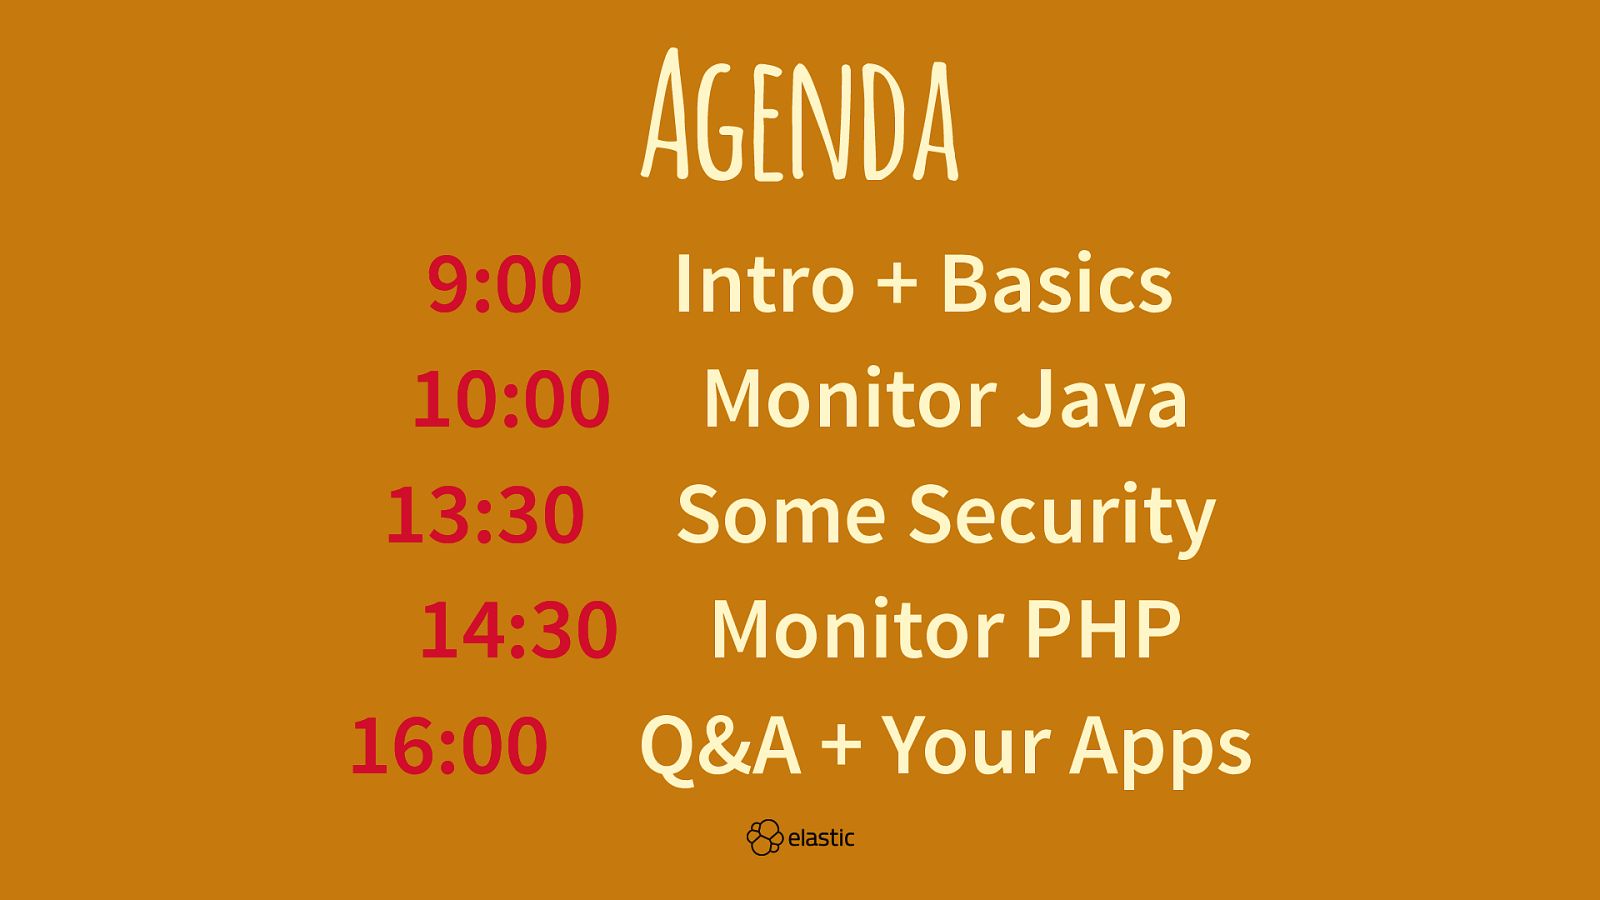
Agenda 9:00 Intro + Basics 10:00 Monitor Java 13:30 Some Security 14:30 Monitor PHP 16:00 Q&A + Your Apps

Intro + Basics

Intro Experience Goals

Elasticsearch Search Engine REST Horizontal Scalability
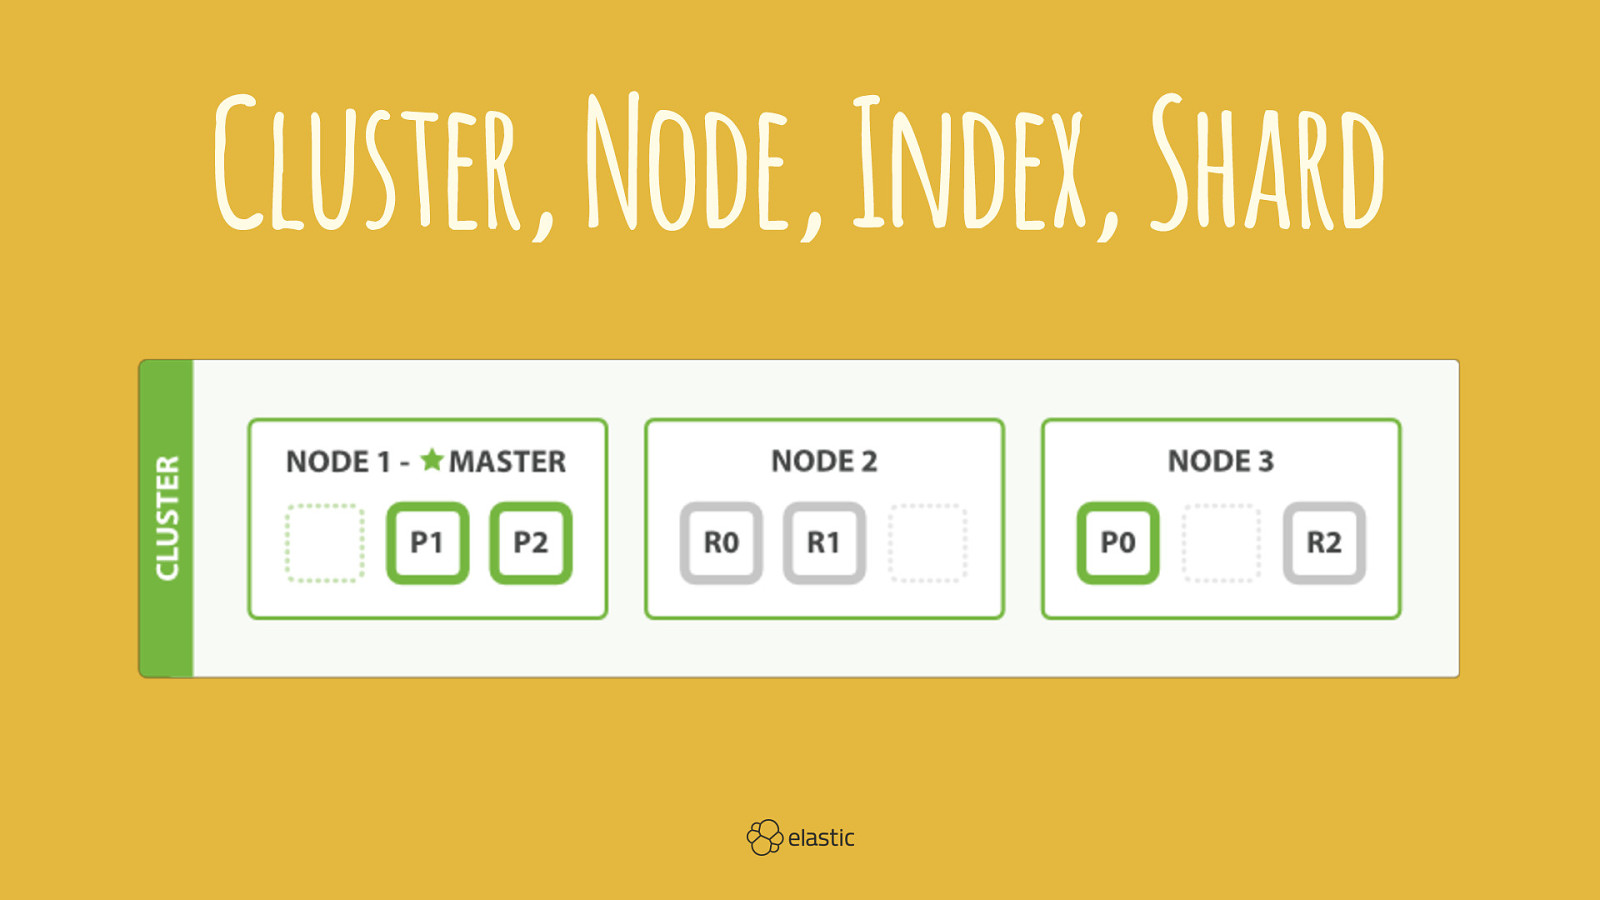
Cluster, Node, Index, Shard
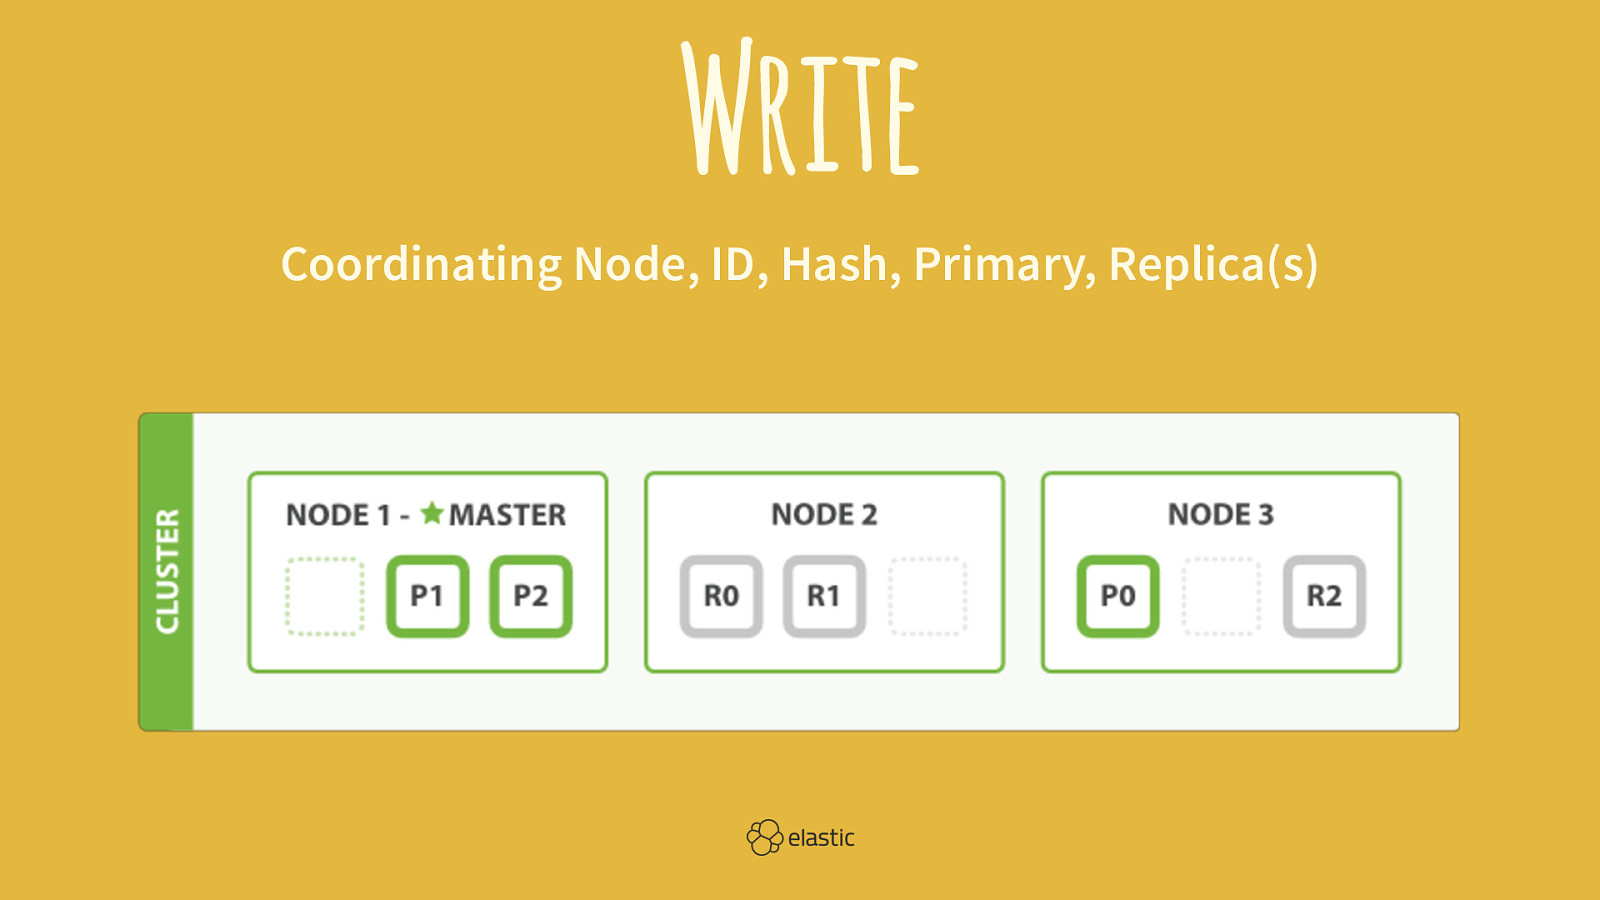
Write Coordinating Node, ID, Hash, Primary, Replica(s)
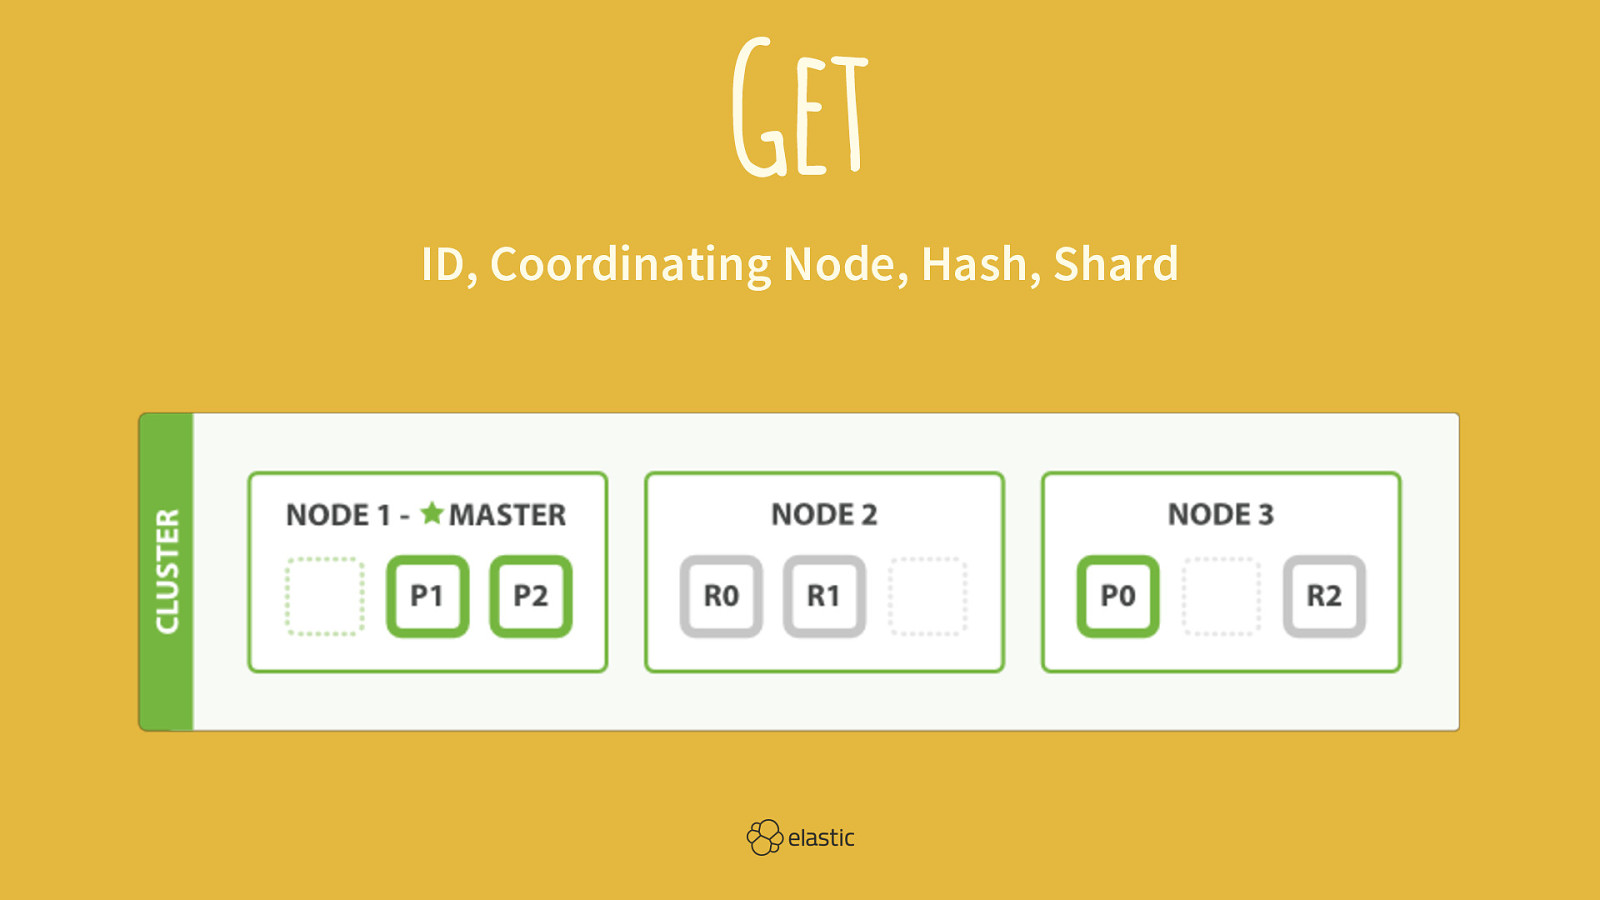
Get ID, Coordinating Node, Hash, Shard
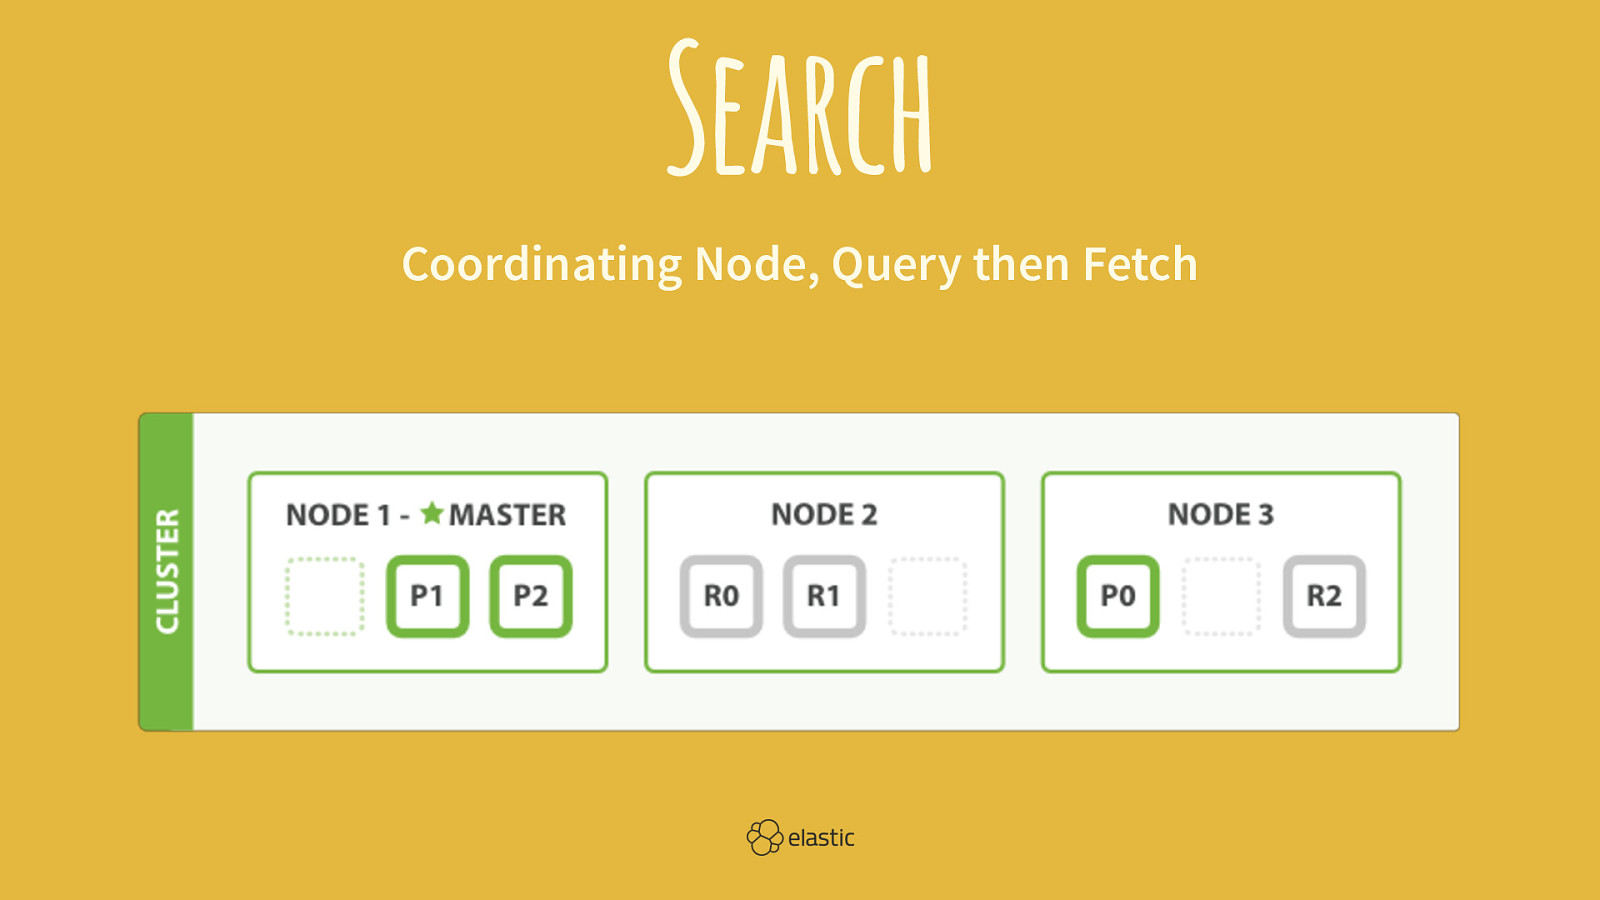
Search Coordinating Node, Query then Fetch
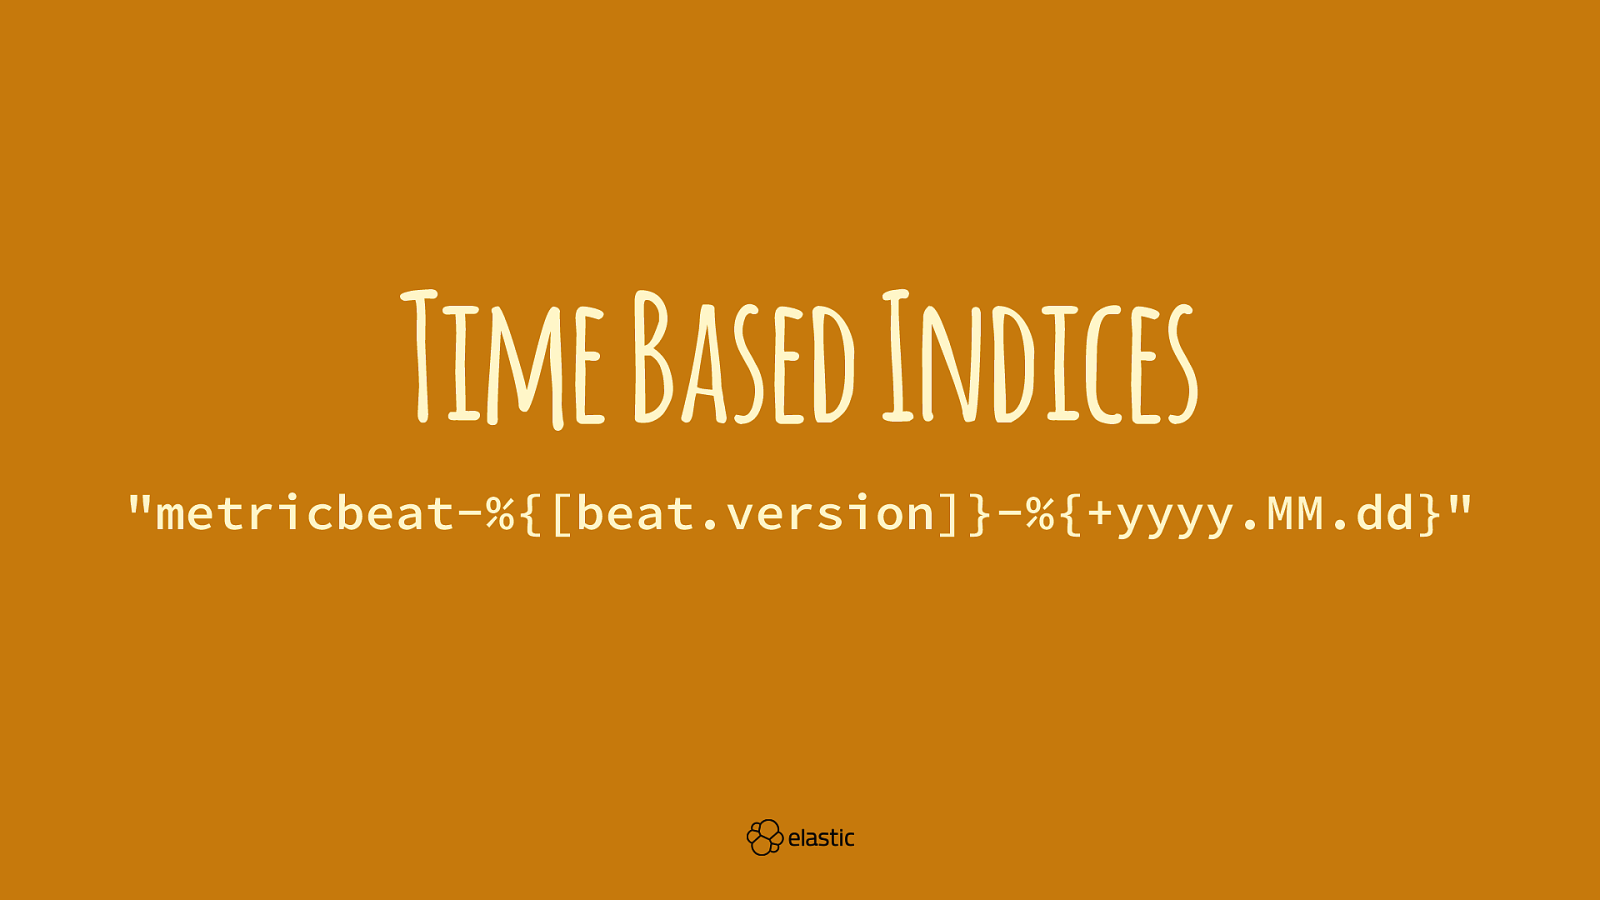
Time Based Indices "metricbeat-%{[beat.version]}-%{+yyyy.MM.dd}"

Nodes ! "
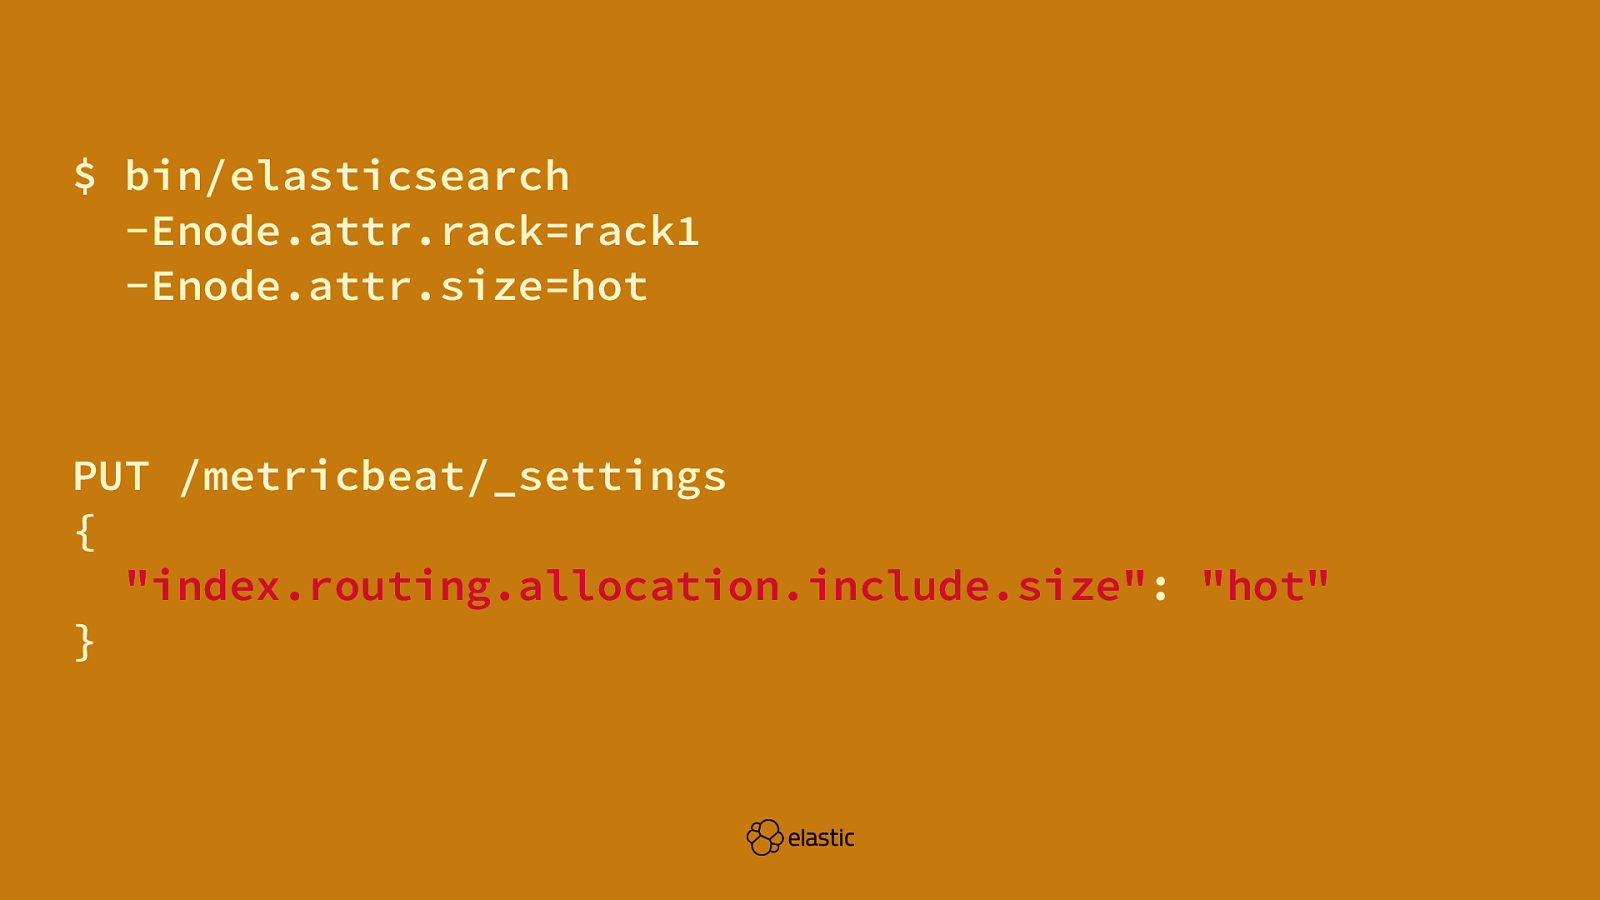
$ bin/elasticsearch -Enode.attr.rack=rack1 -Enode.attr.size=hot PUT /metricbeat/_settings { "index.routing.allocation.include.size": "hot" }

Monitor Java

Code https://github.com/xeraa/ microservice-monitoring

Simple No discovery, load-balancing,...


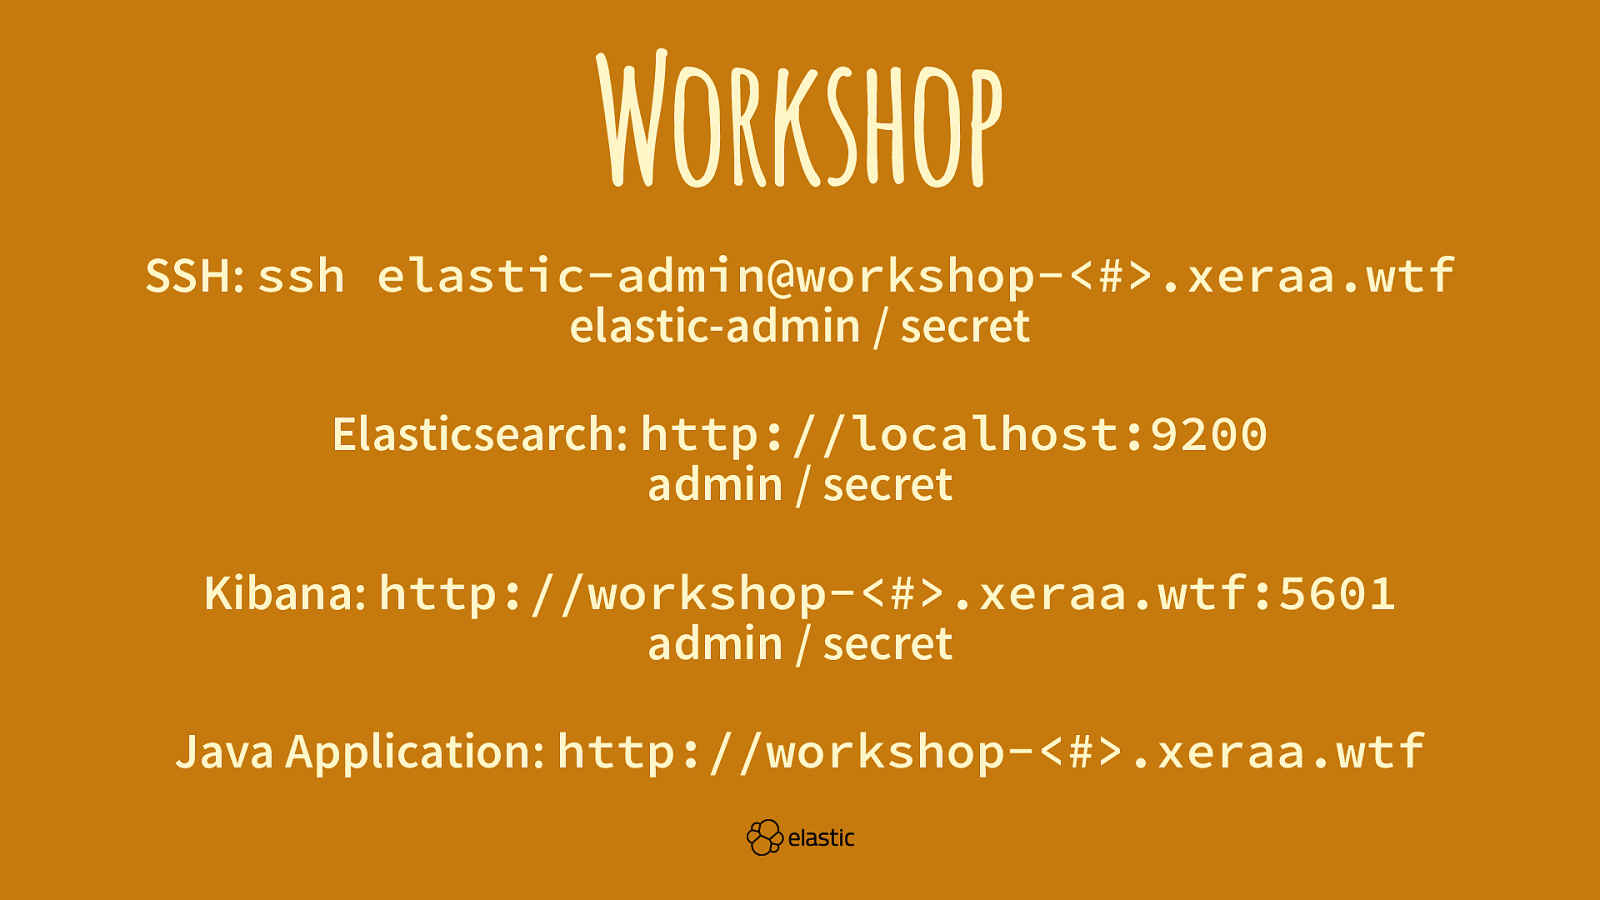
Workshop SSH: ssh elastic-admin@workshop-<#>.xeraa.wtf elastic-admin / secret Elasticsearch: http://localhost:9200 admin / secret Kibana: http://workshop-<#>.xeraa.wtf:5601 admin / secret Java Application: http://workshop-<#>.xeraa.wtf

Kibana Monitoring Overview of the Elastic Stack components
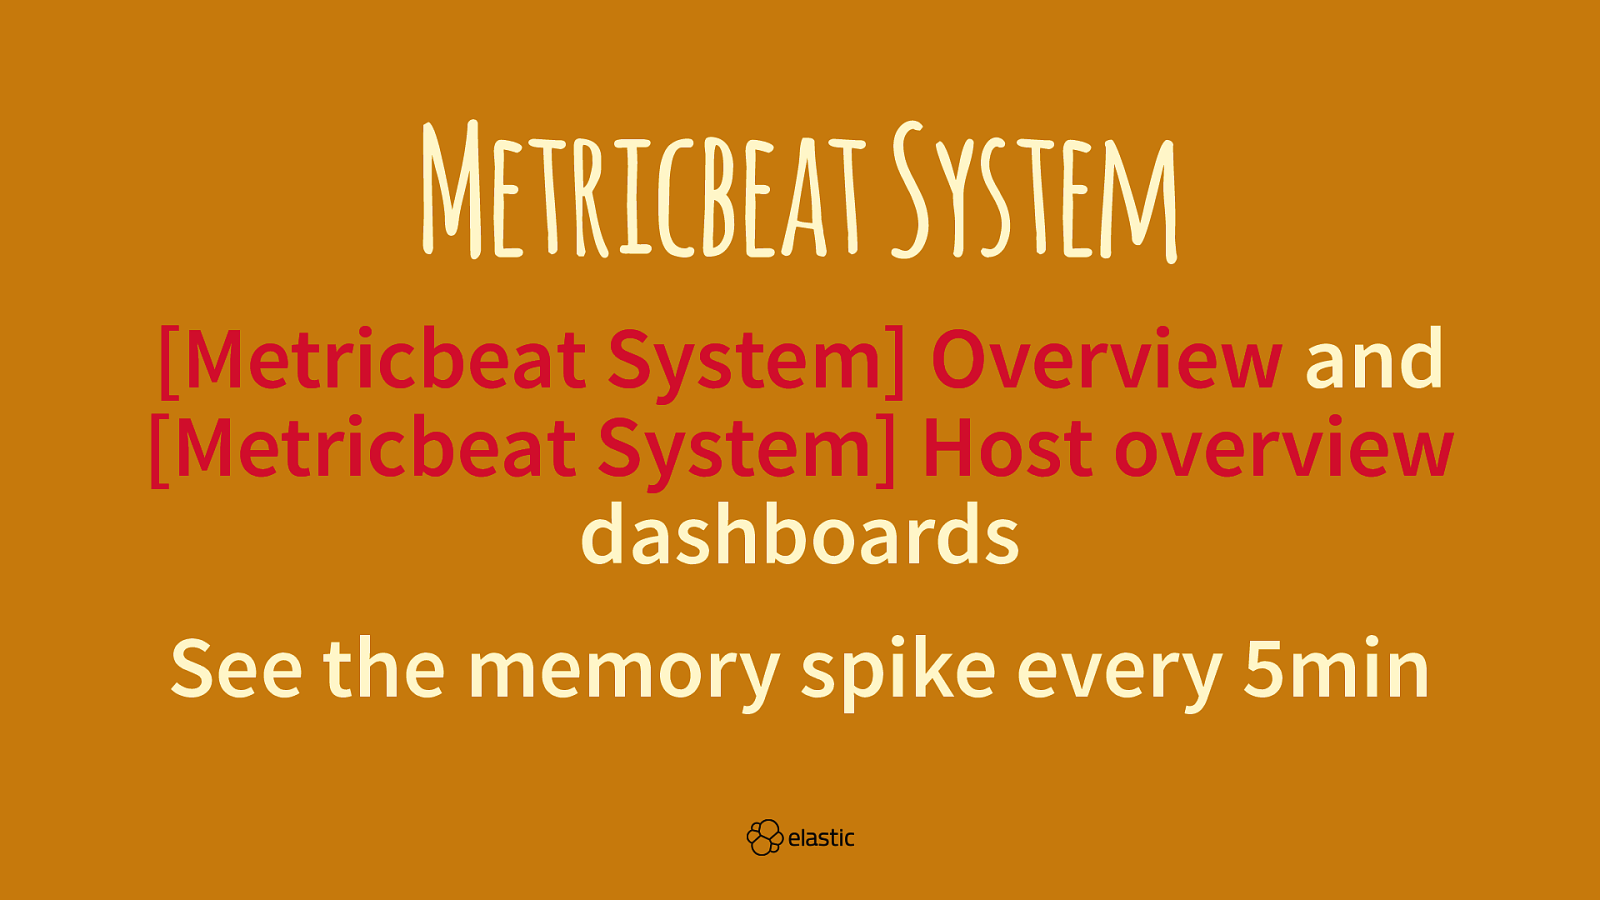
Metricbeat System [Metricbeat System] Overview and [Metricbeat System] Host overview dashboards See the memory spike every 5min
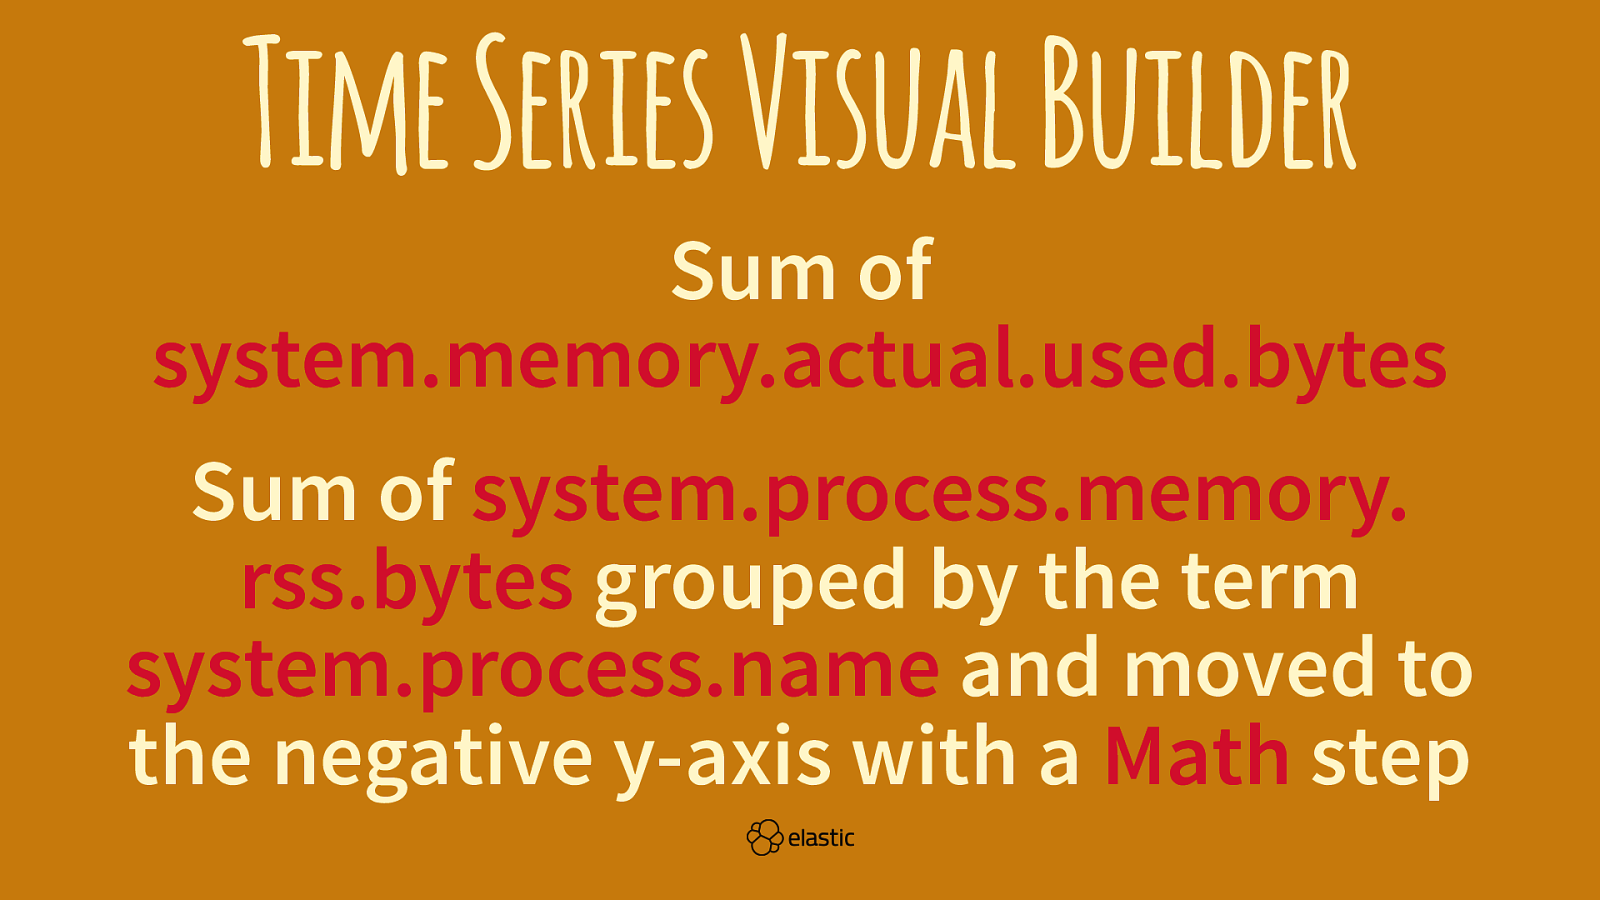
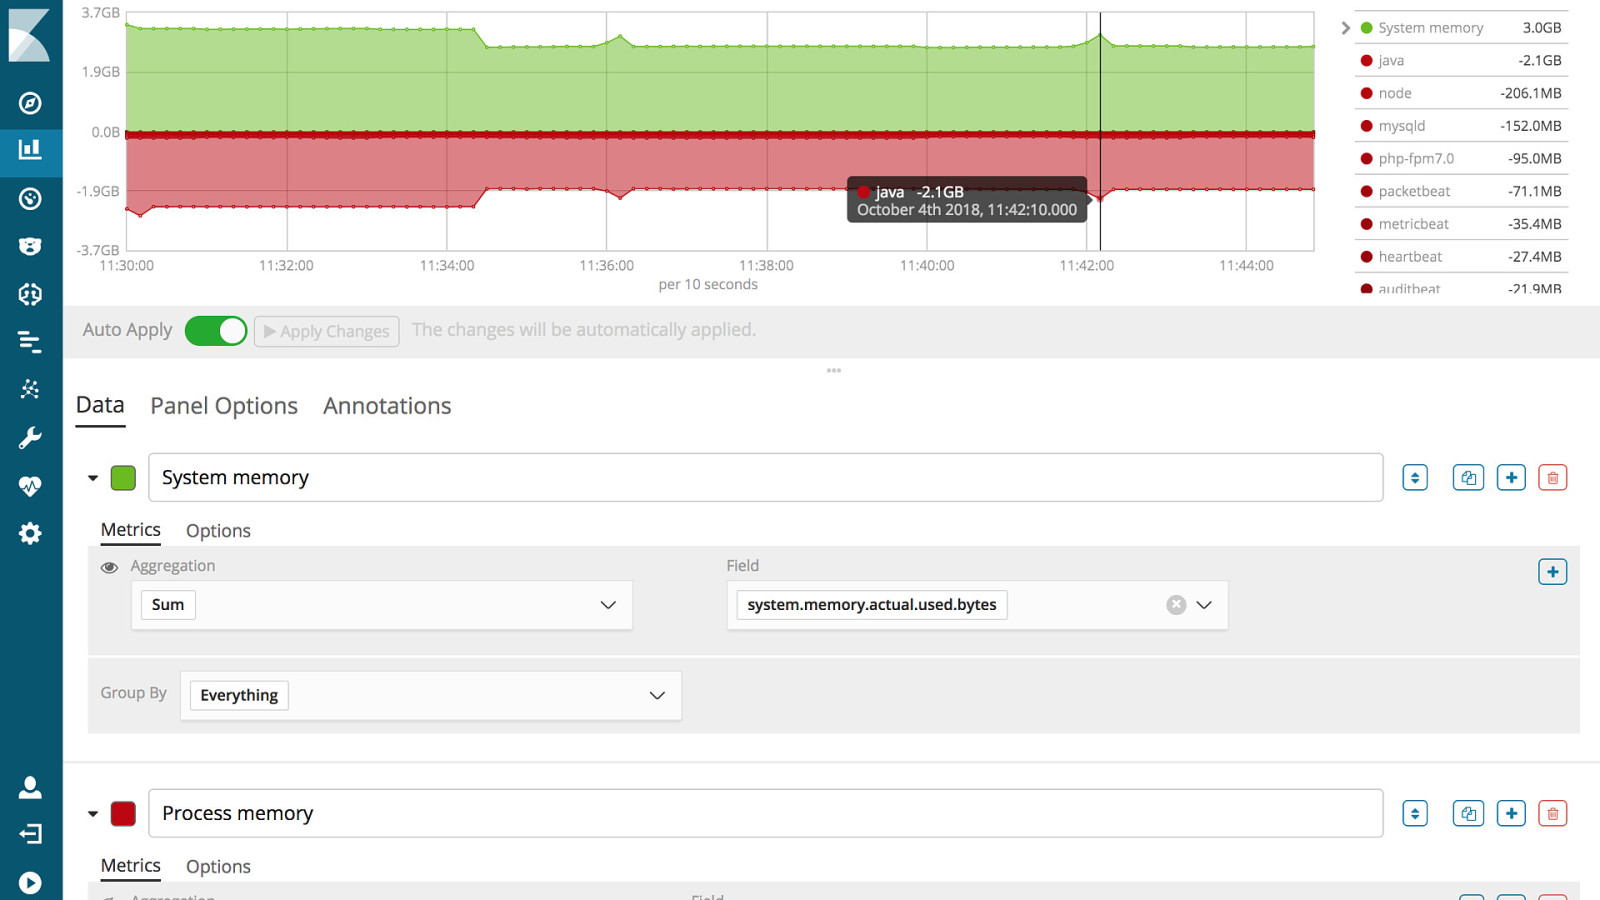
Time Series Visual Builder Sum of system.memory.actual.used.bytes Sum of system.process.memory. rss.bytes grouped by the term system.process.name and moved to the negative y-axis with a Math step
Packetbeat Call /, /good, /bad, and /foobar [Packetbeat] Overview, [Packetbeat] Flows, [Packetbeat] HTTP, and [Packetbeat] DNS Tunneling dashboards
Packetbeat Raw events in Discover Process enrichment for nginx, Java, and the APM server
Filebeat Modules [Filebeat Nginx] Access and error logs, [Filebeat System] Syslog dashboard, and [Osquery Result] Compliance pack dashboards

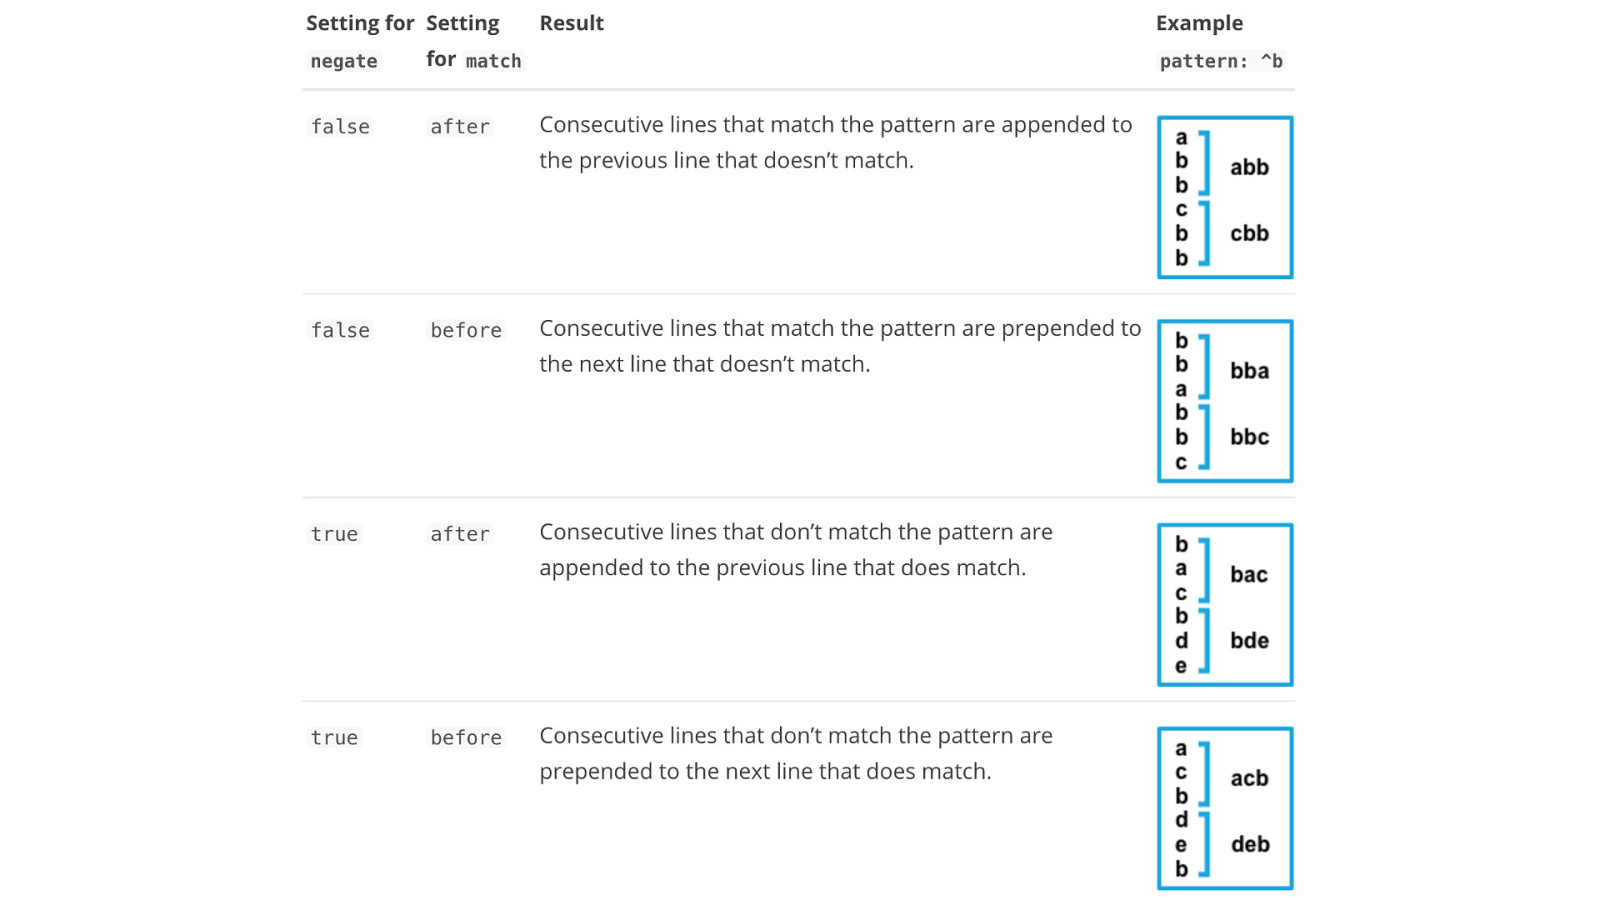
Custom Log Files
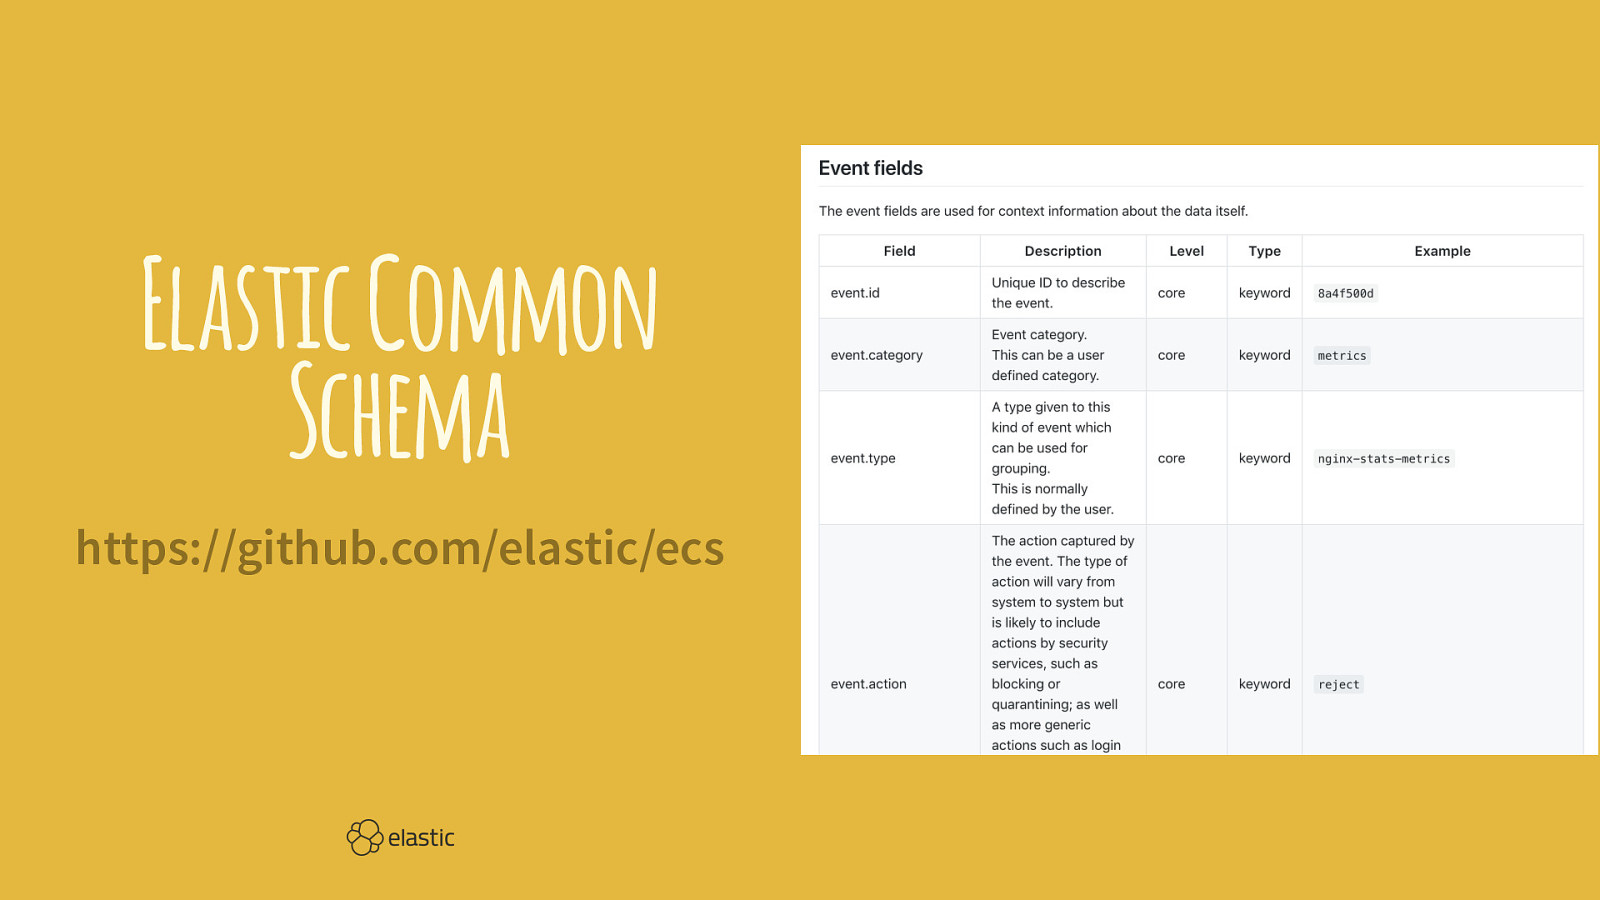
Elastic Common Schema https://github.com/elastic/ecs
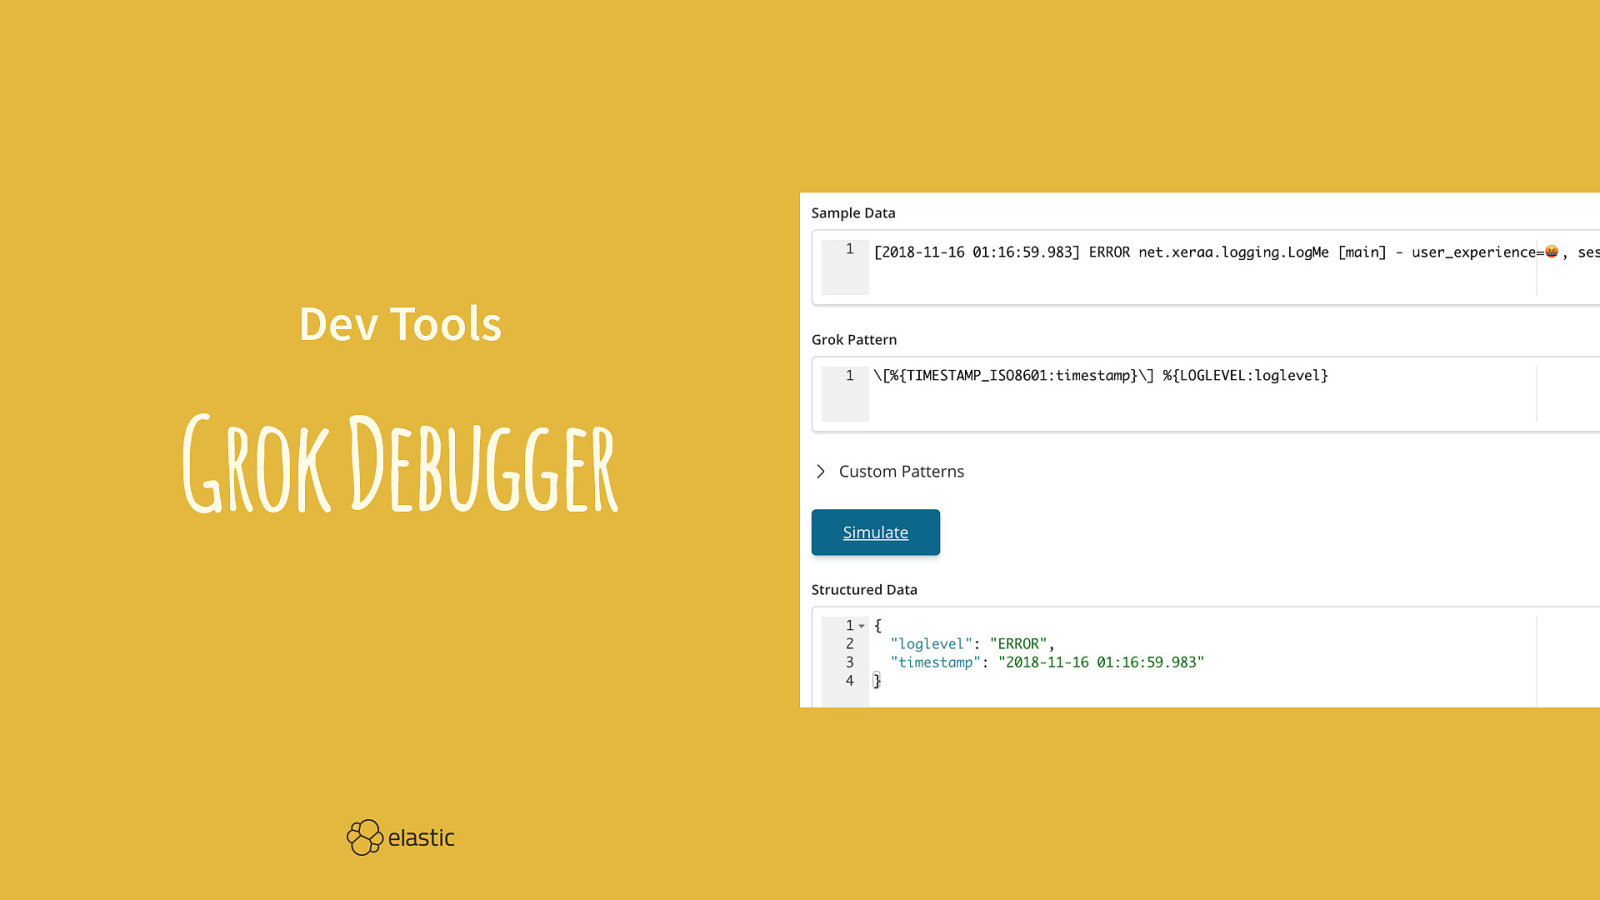
Dev Tools Grok Debugger
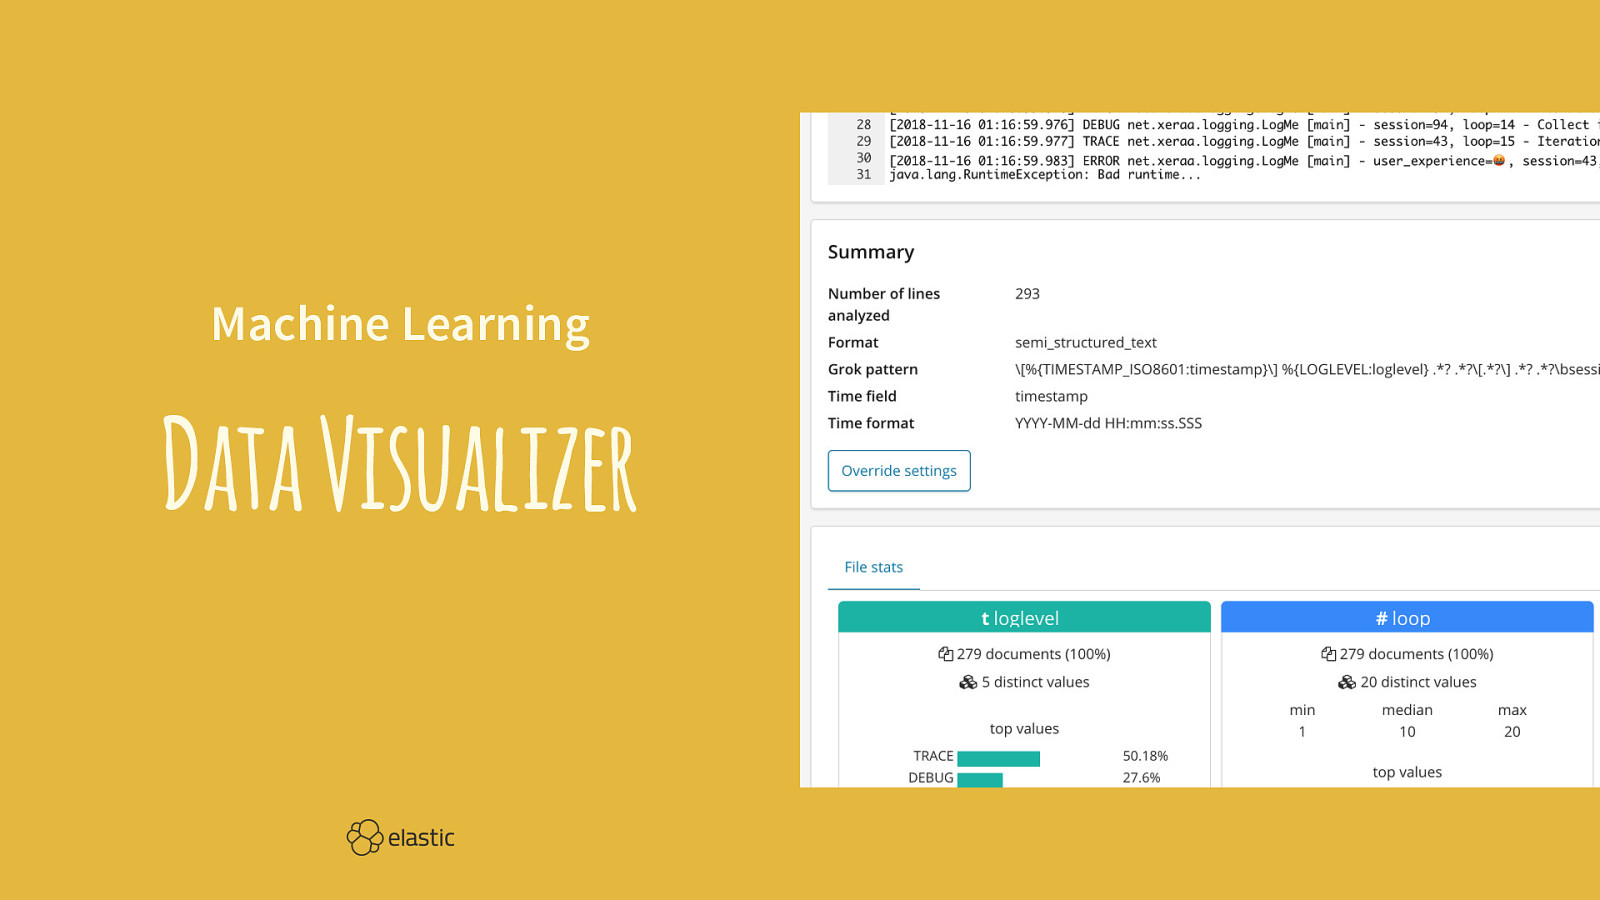
Machine Learning Data Visualizer

Log UI

Infra UI
Filebeat Raw events in Discover /good: MDC logging under json.name and the context view for one log message meta.* and host.* information
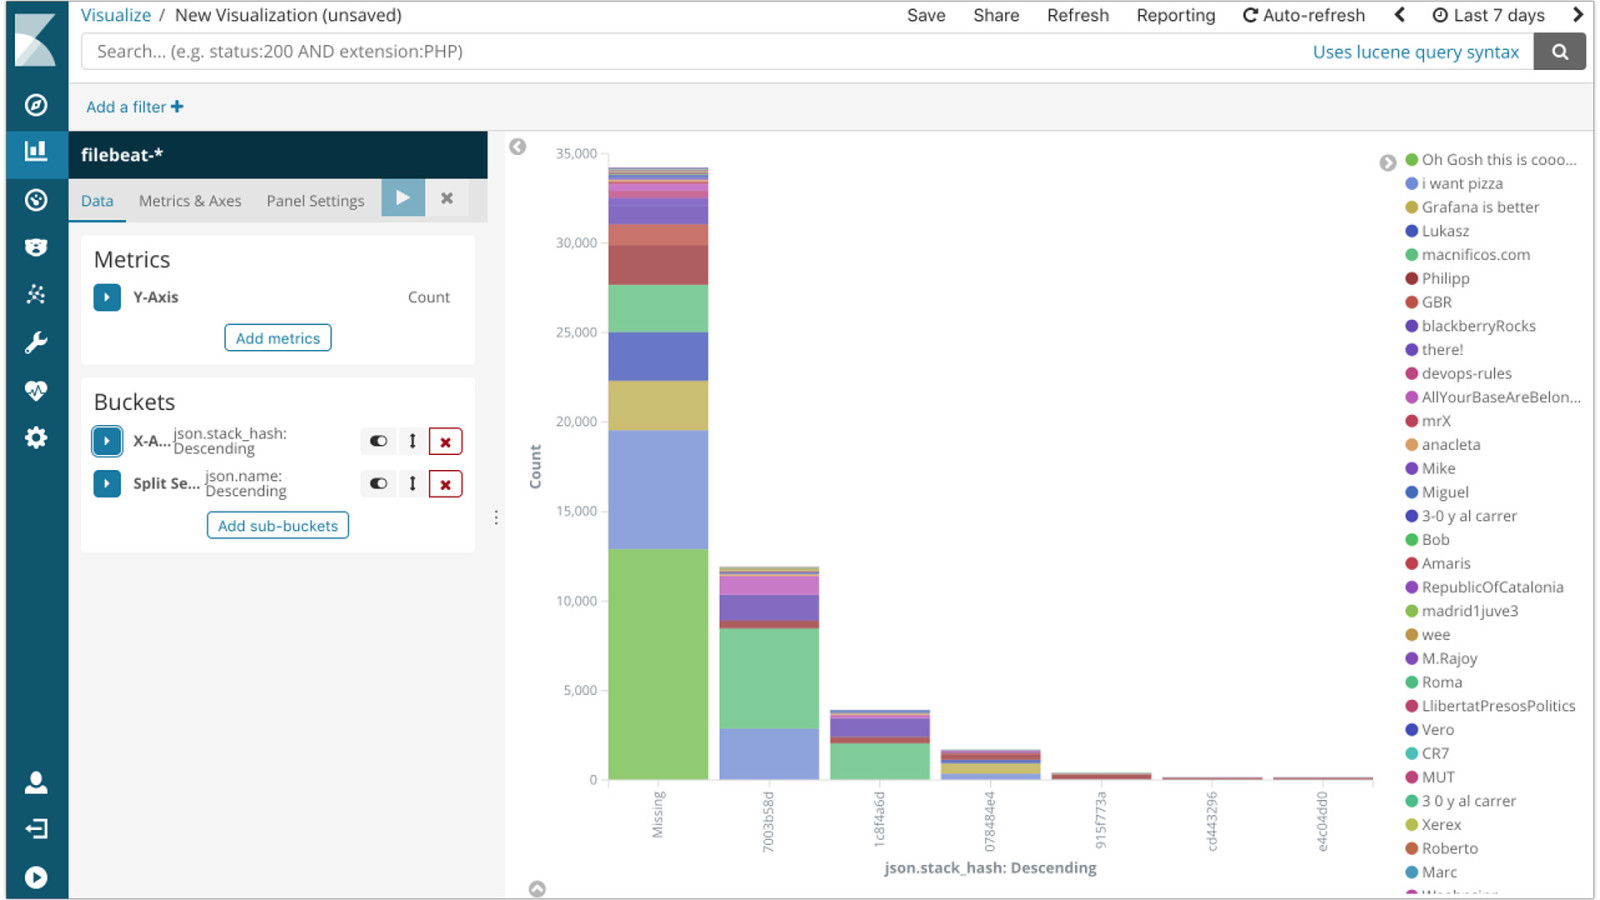
Filebeat /bad and /null: Stacktraces by filtering down on application:java and json.severity:ERROR Visualize json.stack_hash
Heartbeat Heartbeat HTTP monitoring dashboard Stop and start the frontend application while auto refreshing
Metricbeat nginx [Metricbeat Nginx] Overview dashboard
Metricbeat HTTP /health and /metrics endpoints Collected information in Discover
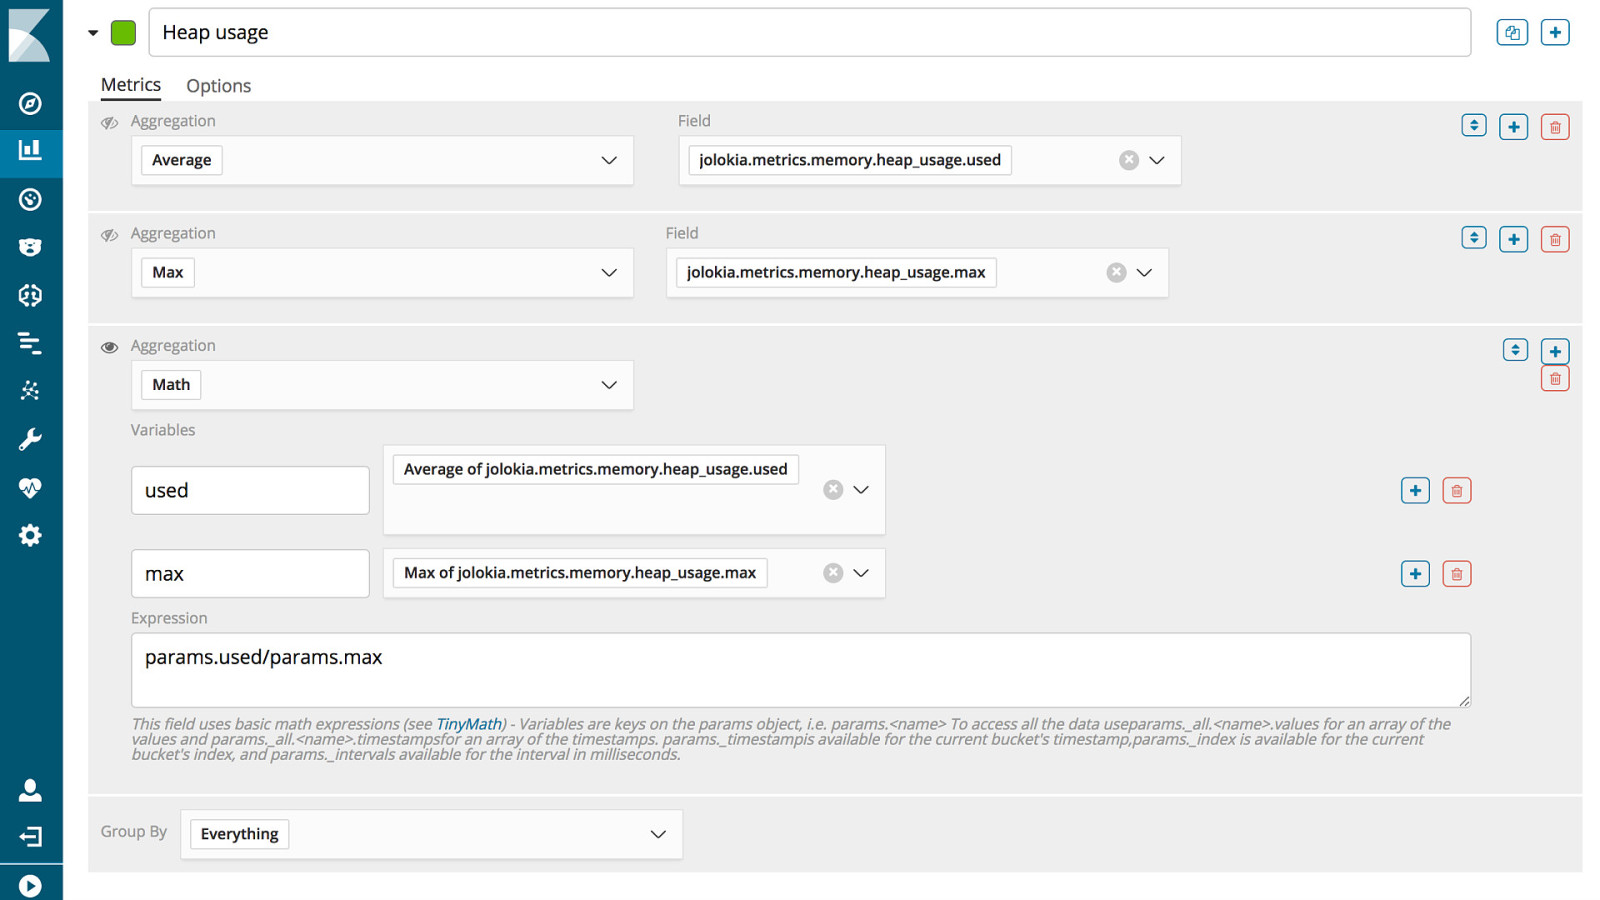
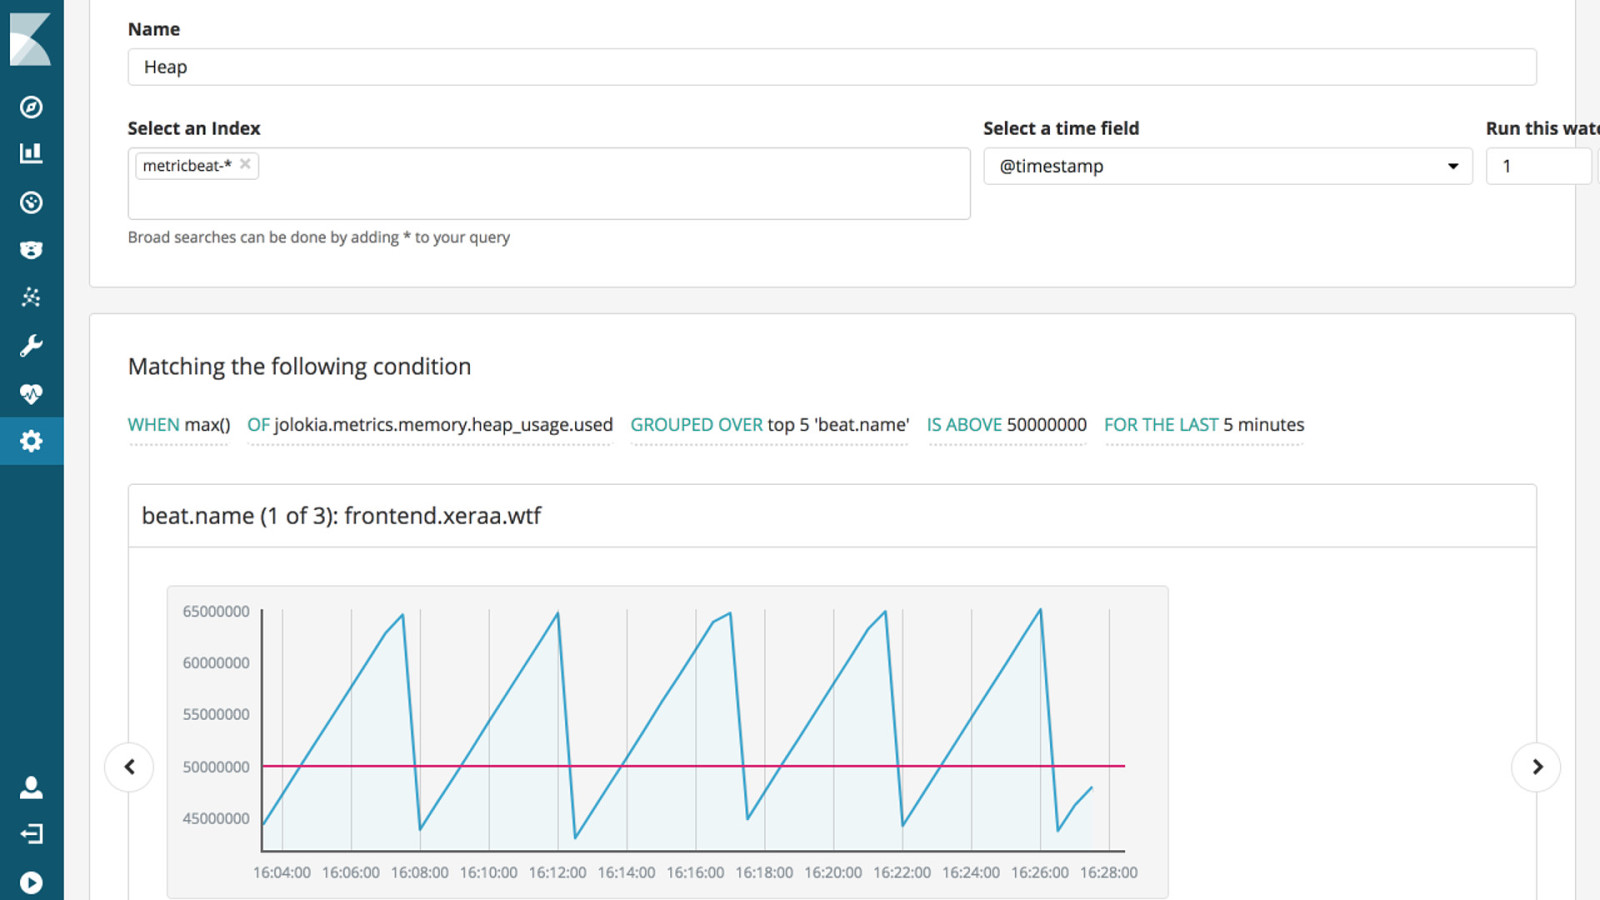
Metricbeat JMX Same data Visualize the heap usage: jolokia. metrics.memory.heap_usage.used divided by the max of jolokia. metrics.memory.heap_usage.max
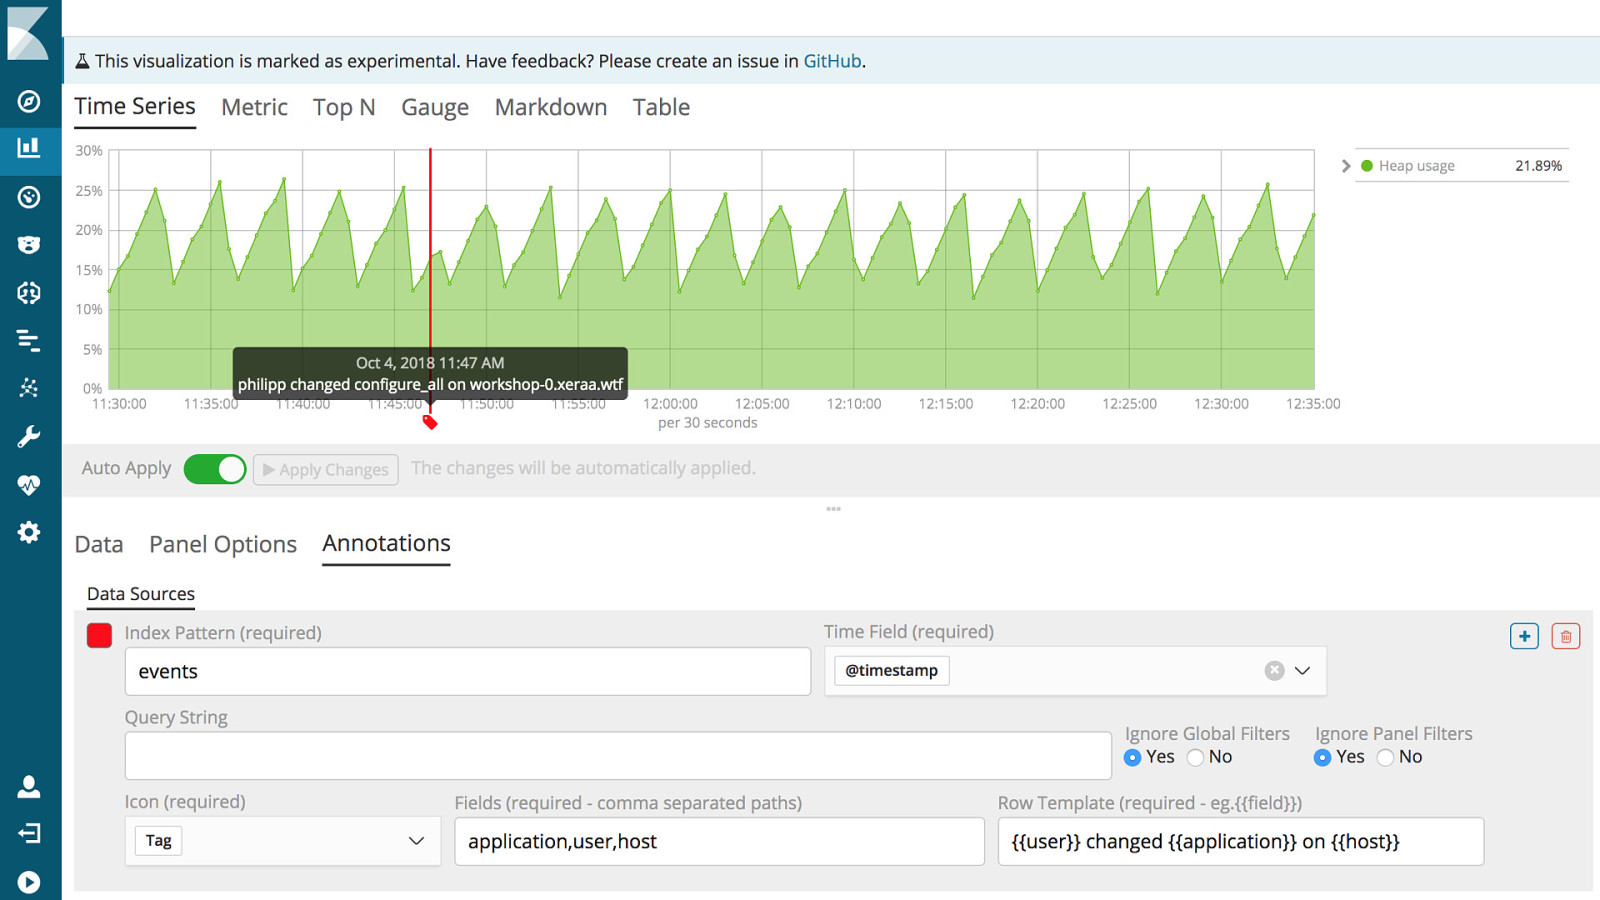
Annotations Add changes from the events index
APM Distributed Tracing

Some Security

Filebeat Modules [Filebeat Auditd] Audit Events, [Filebeat System] New users and groups, and [Filebeat System] Sudo commands dashboards
https://github.com/linux-audit "auditd is the userspace component to the Linux Auditing System. It's responsible for writing audit records to the disk. Viewing the logs is done with the ausearch or aureport utilities."
Auditd Monitors File and network access System calls Commands run by a user Security events
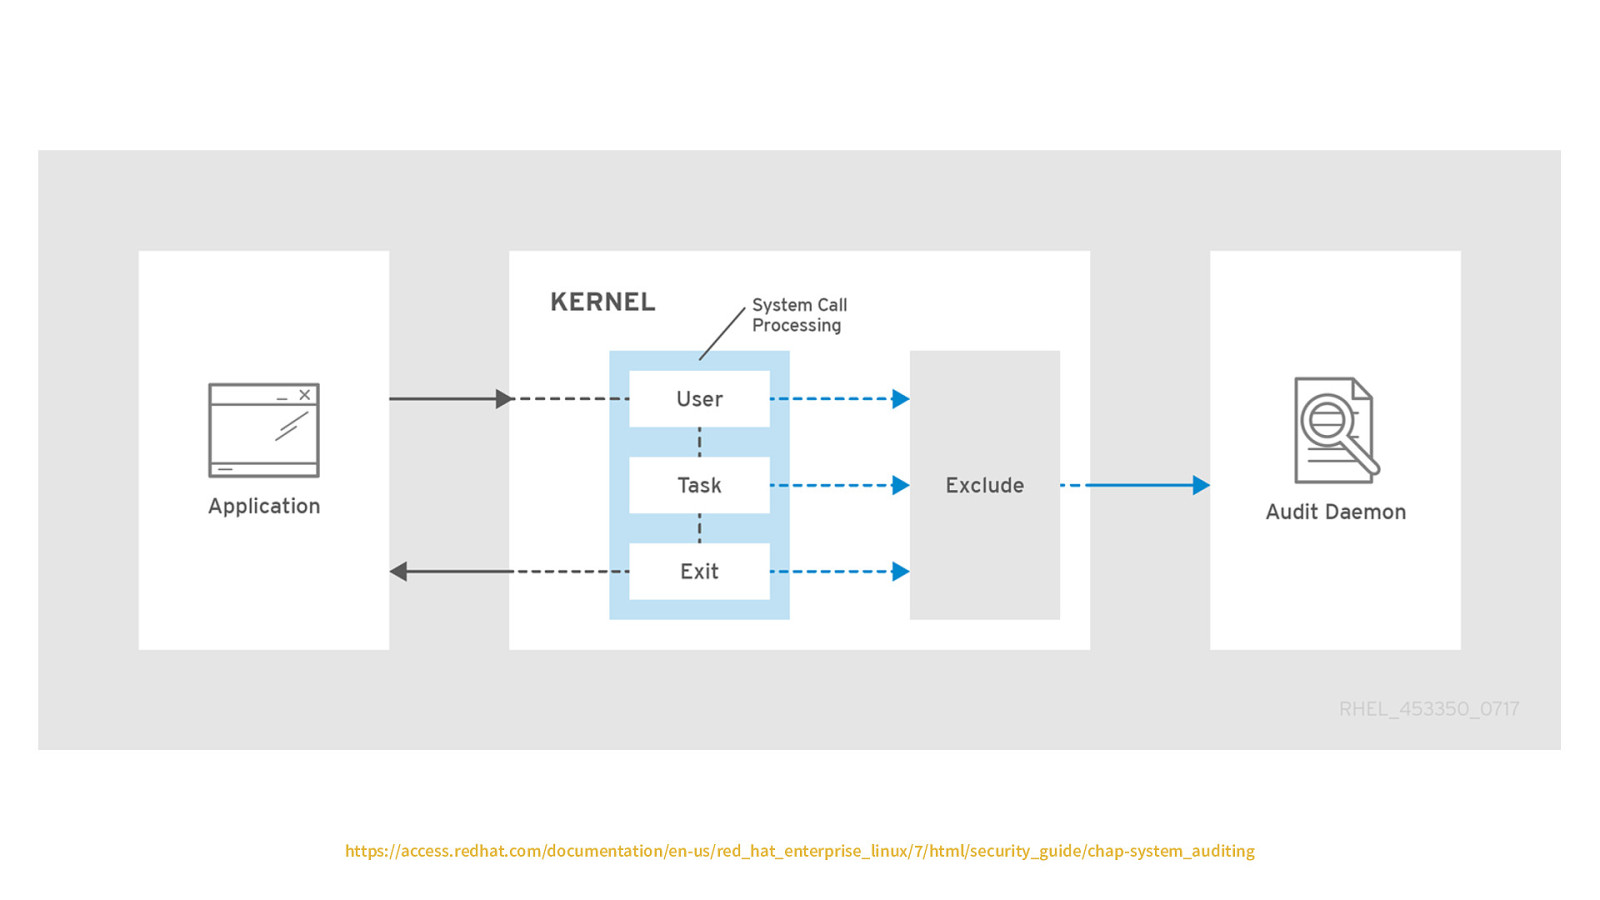
https://access.redhat.com/documentation/en-us/red_hat_enterprise_linux/7/html/security_guide/chap-system_auditing
Understanding Logs https://access.redhat.com/ documentation/en-us/ red_hat_enterprise_linux/7/html/ security_guide/secunderstanding_audit_log_files
Auditbeat [Auditbeat Auditd] Overview dashboard
Fail SSH ssh elastic-user@xeraa.wtf with a bad password [Filebeat System] SSH login attempts dashboard
Success ssh elastic-user@xeraa.wtf with a good password Run service nginx restart and pick the elastic-admin user
Audit Event [Auditbeat Auditd] Executions dashboard filter elastic-user
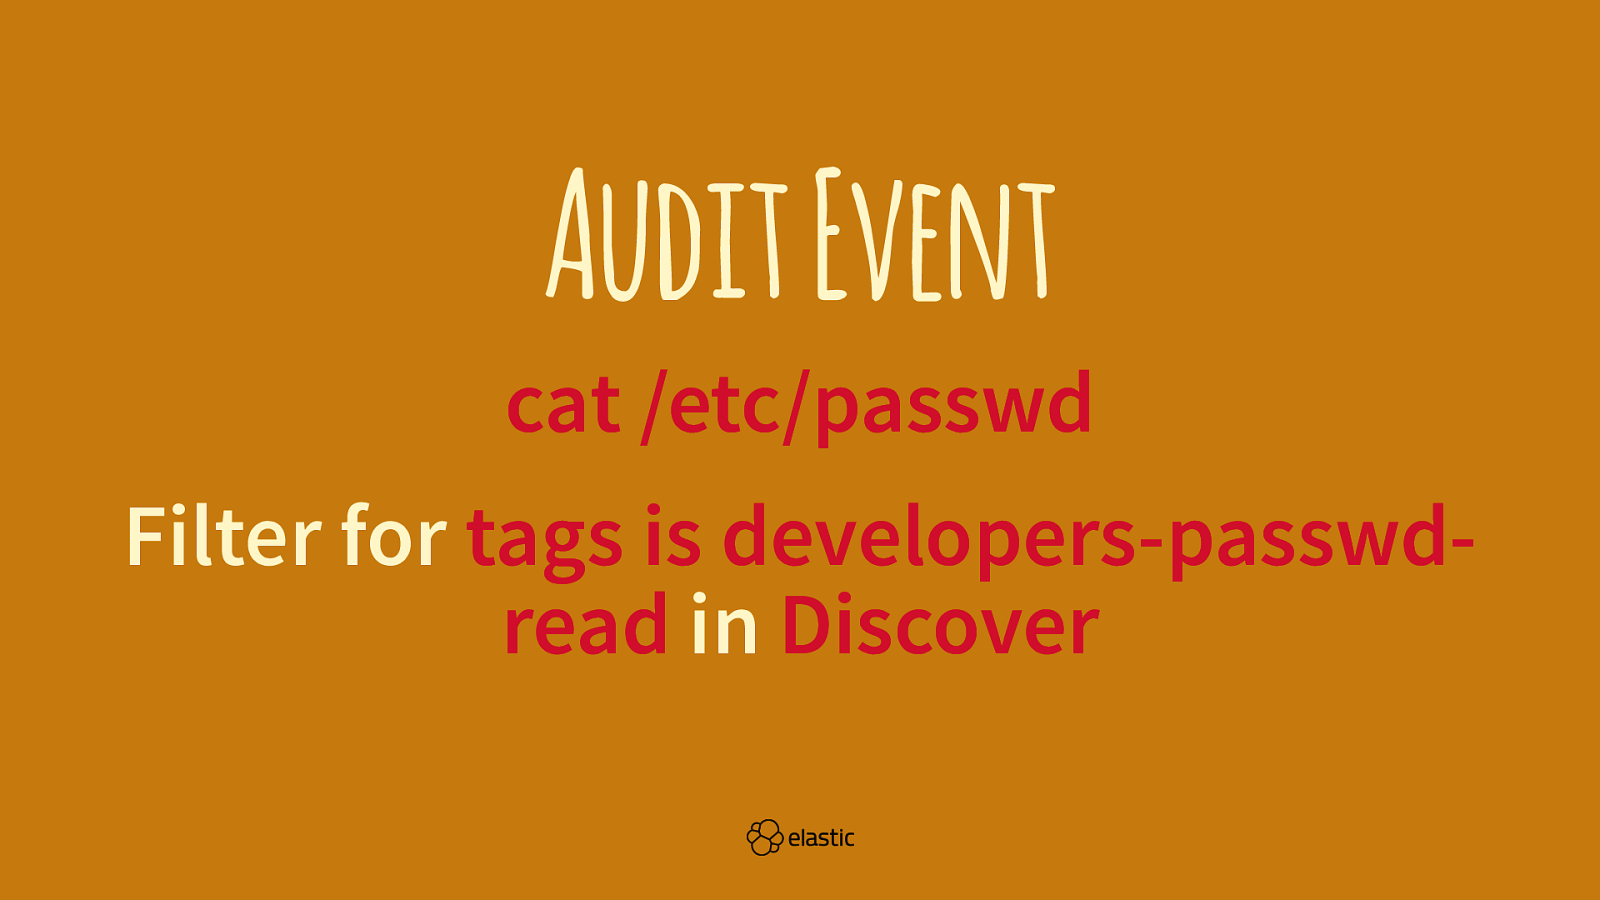
Audit Event cat /etc/passwd Filter for tags is developers-passwdread in Discover
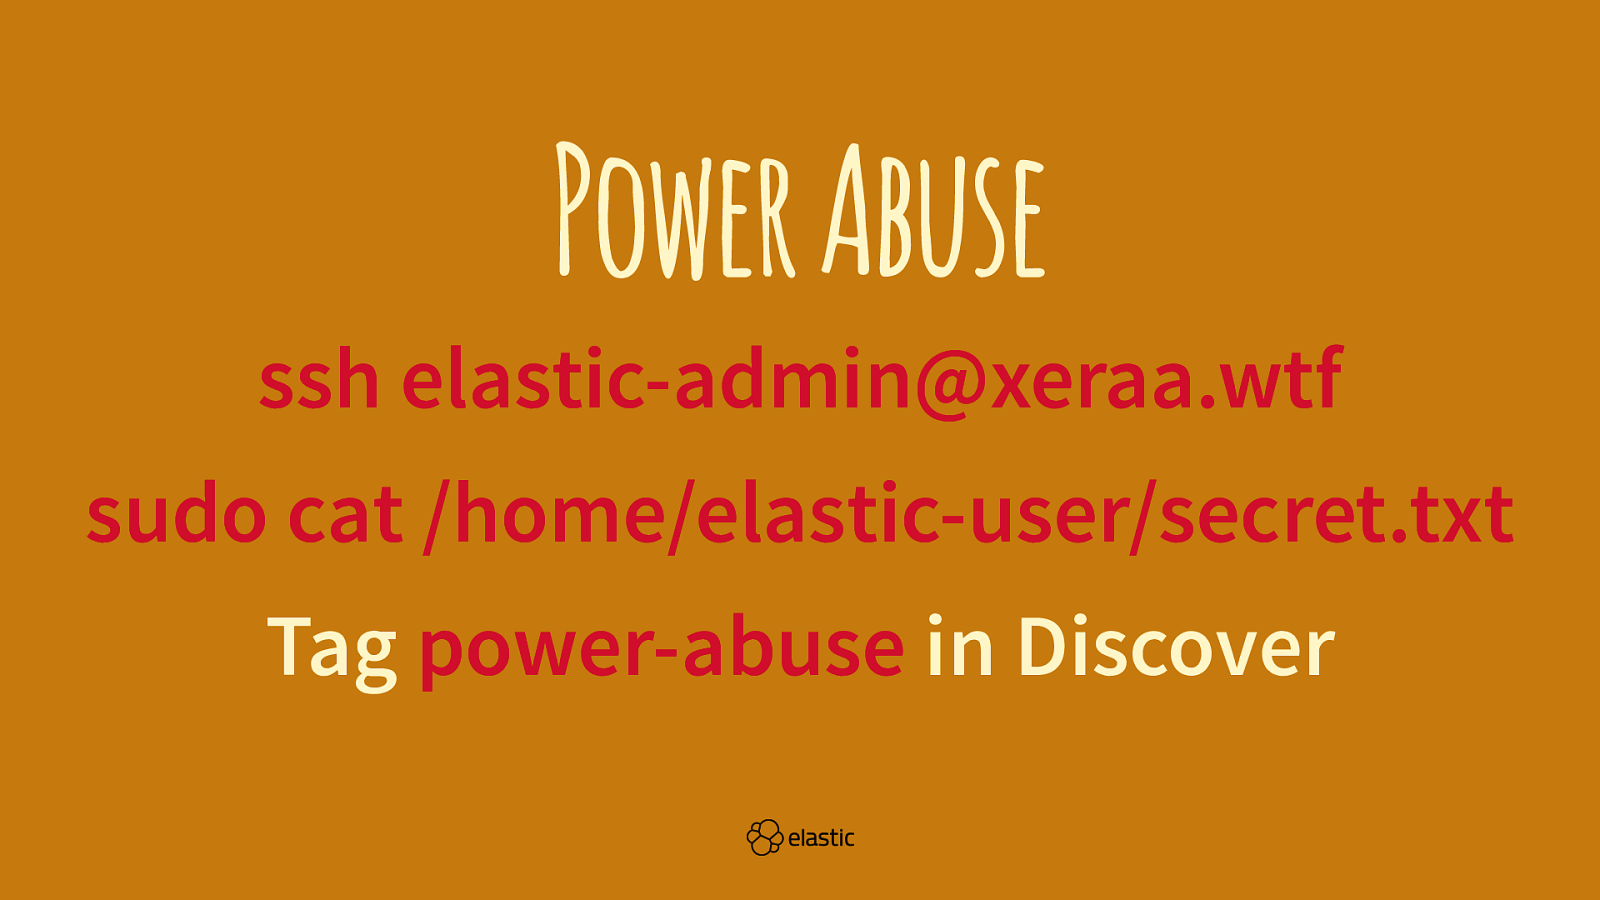
Power Abuse ssh elastic-admin@xeraa.wtf sudo cat /home/elastic-user/secret.txt Tag power-abuse in Discover
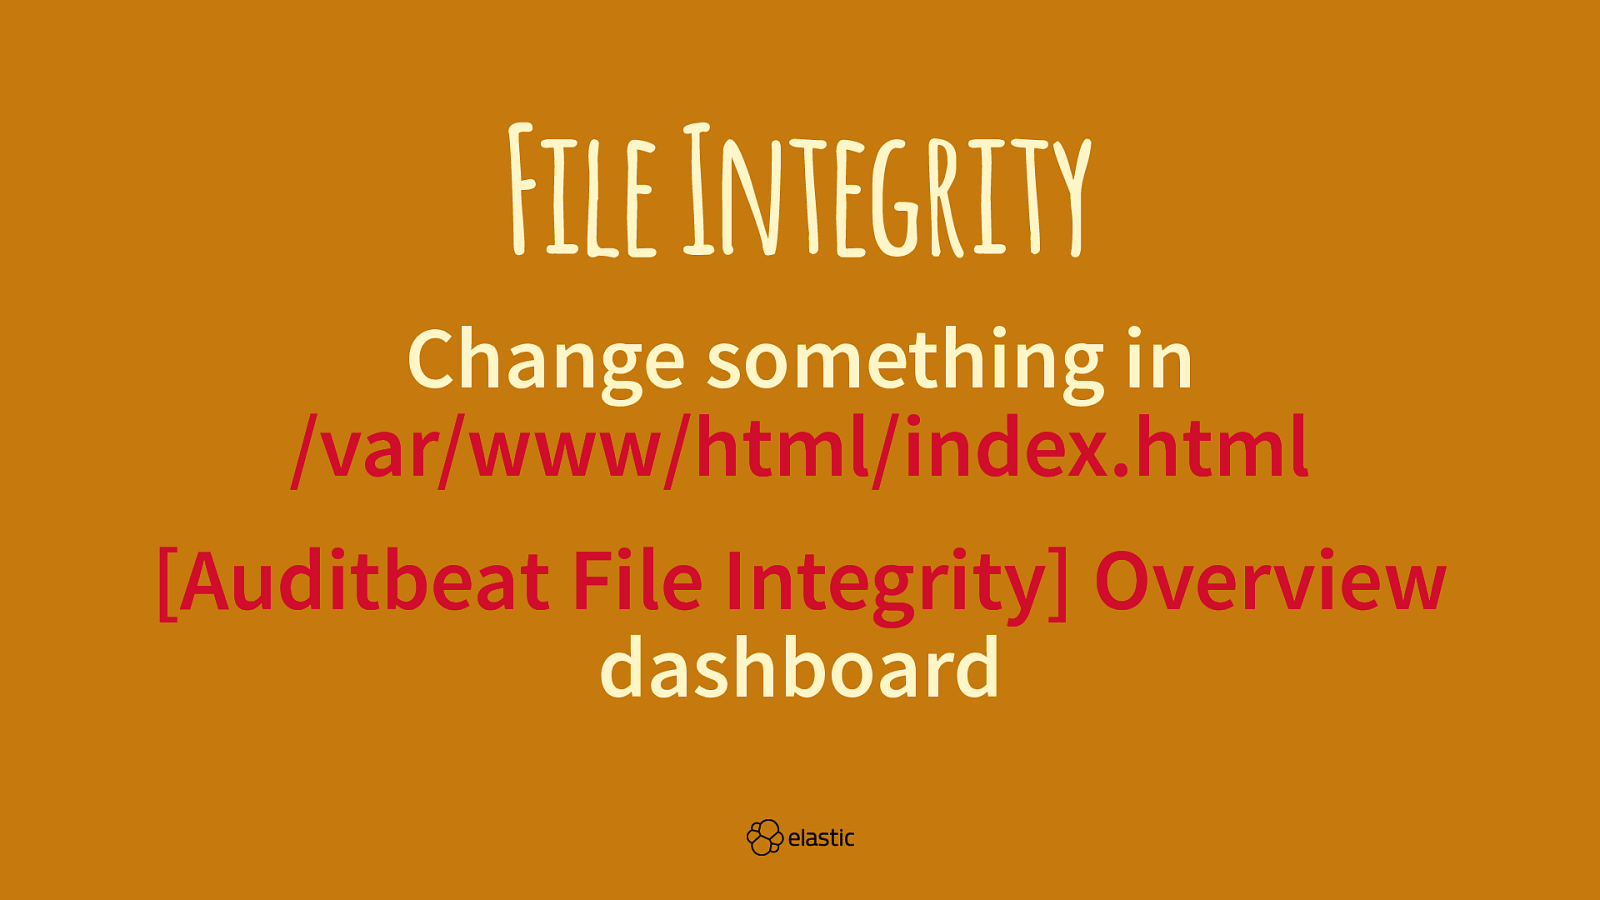
File Integrity Change something in /var/www/html/index.html [Auditbeat File Integrity] Overview dashboard

Monitor PHP

Heartbeat Add HTTP on port 88

Packetbeat Add HTTP on port 88
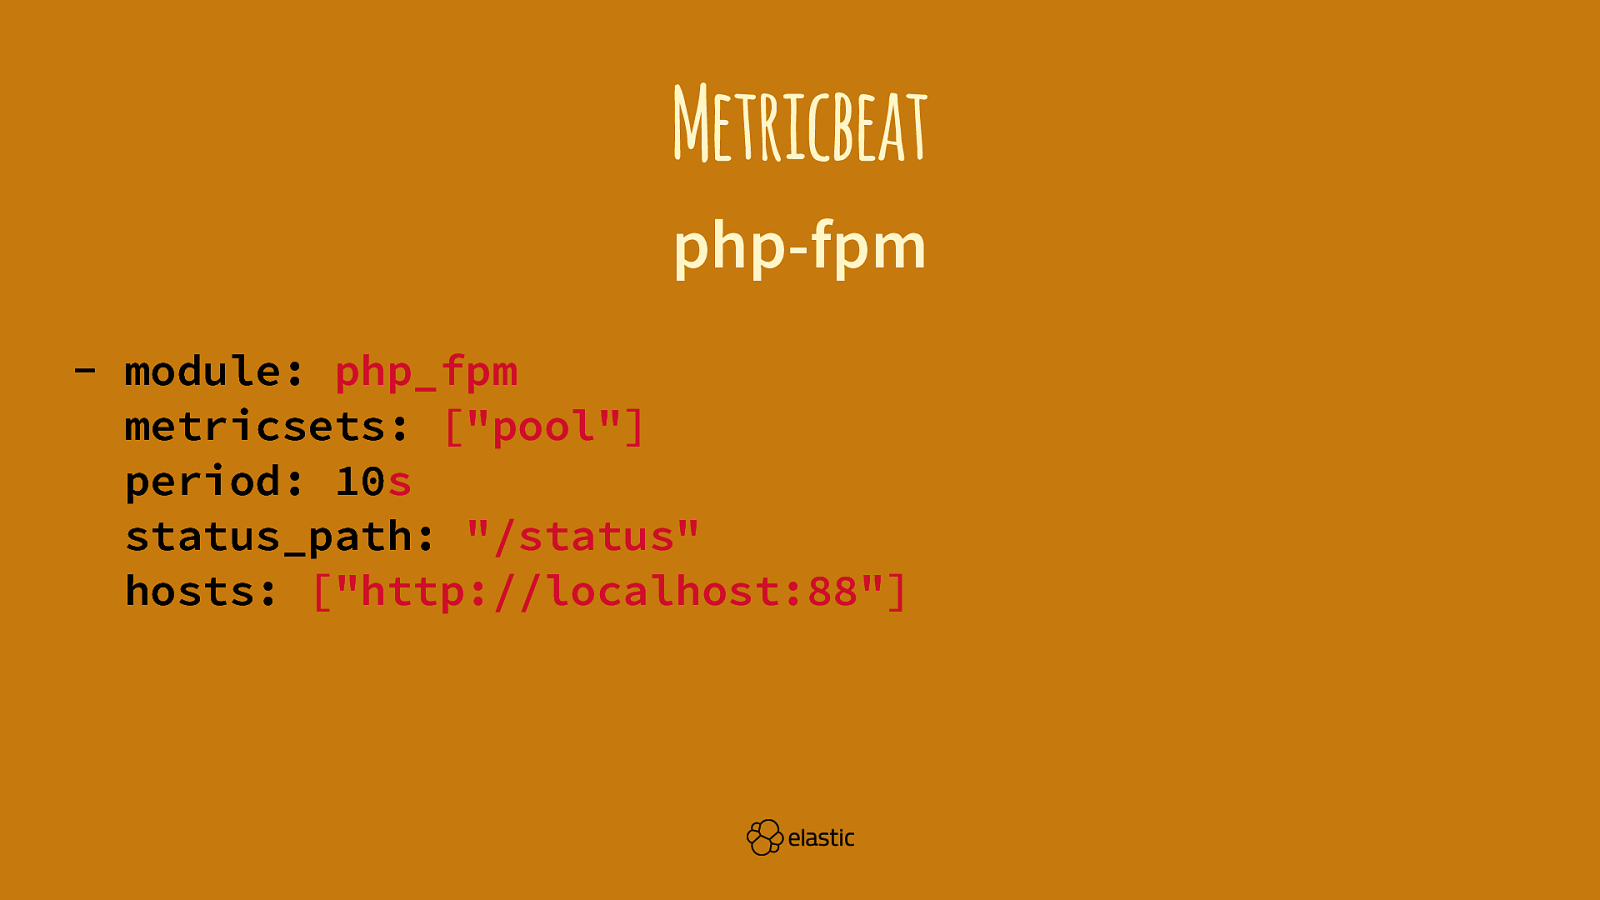
Metricbeat php-fpm - module: php_fpm metricsets: ["pool"] period: 10s status_path: "/status" hosts: ["http://localhost:88"]

Filebeat Collect /var/www/html/silverstripe/ logs/*.json

More Features


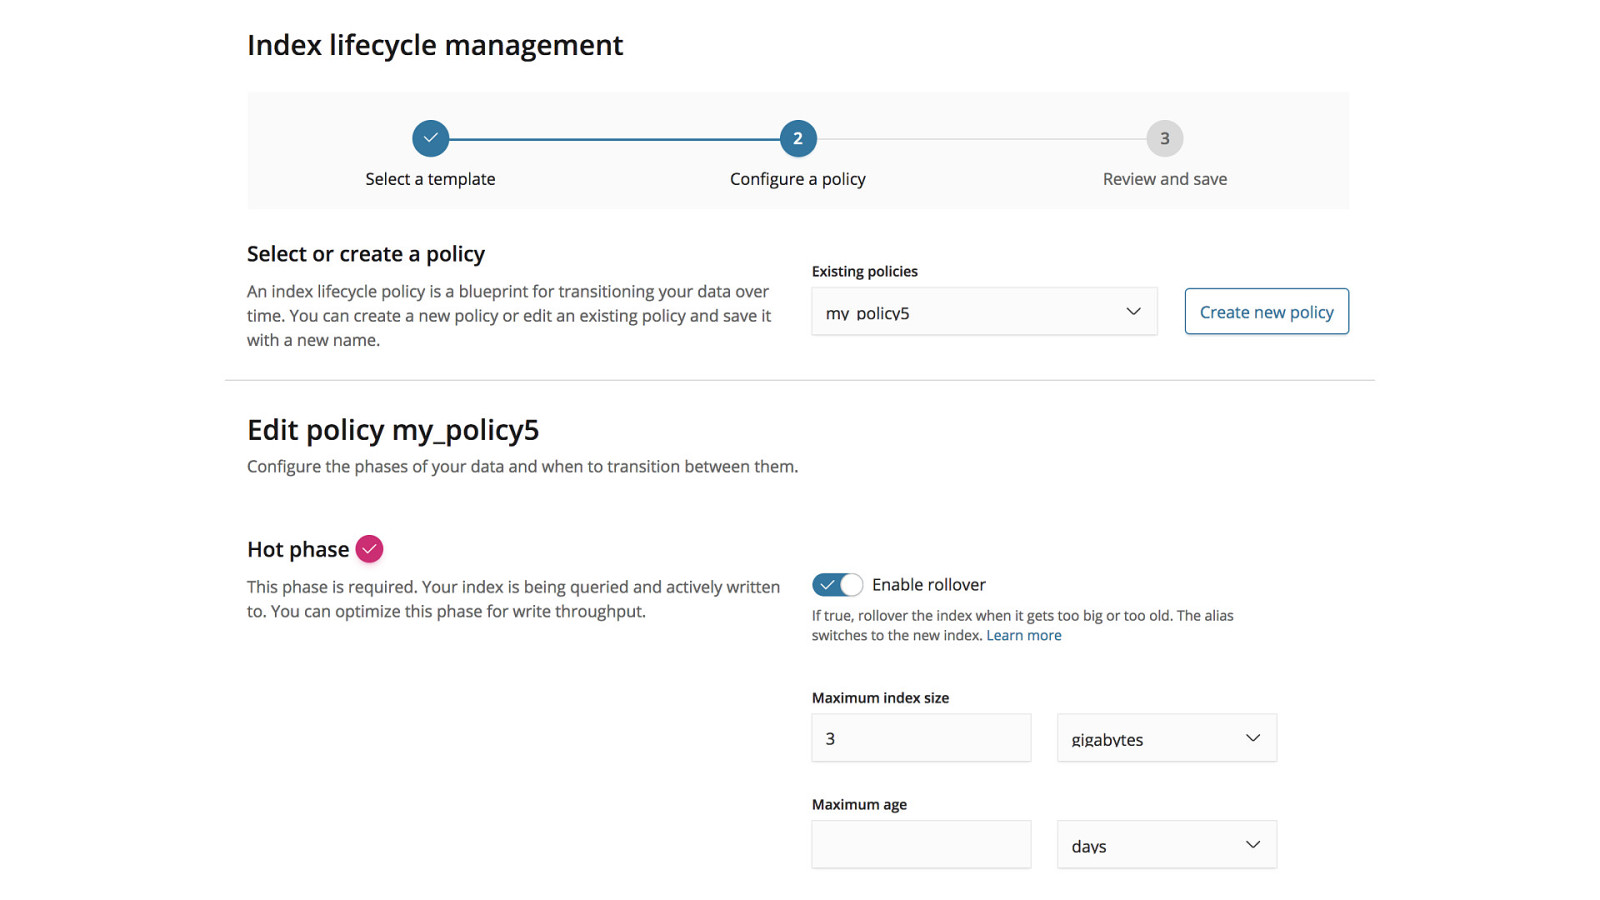
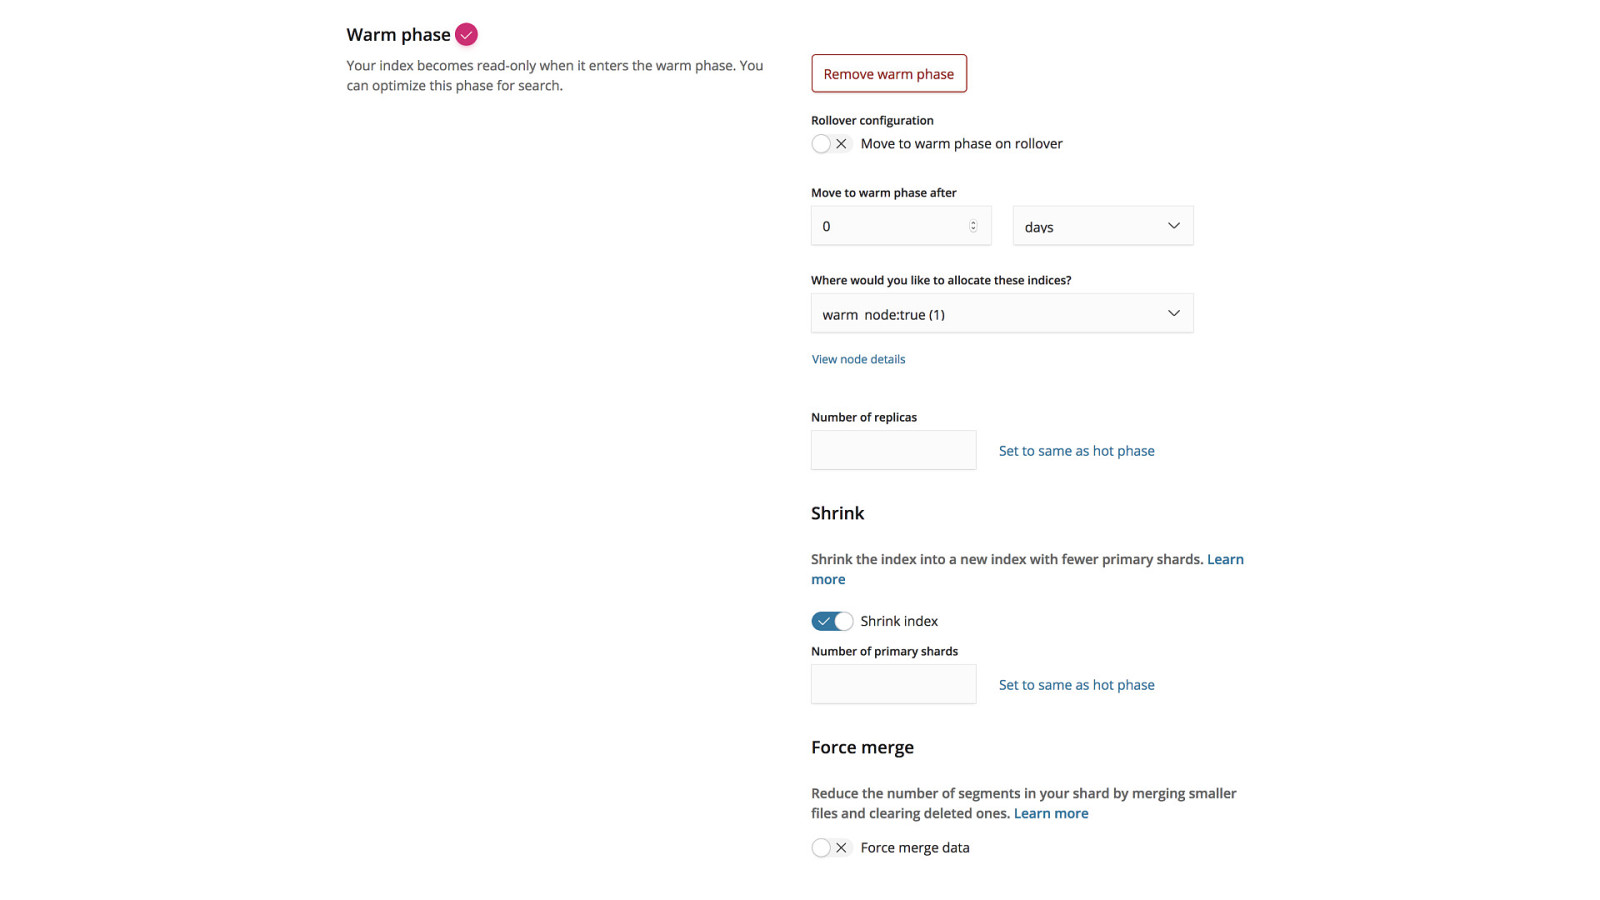
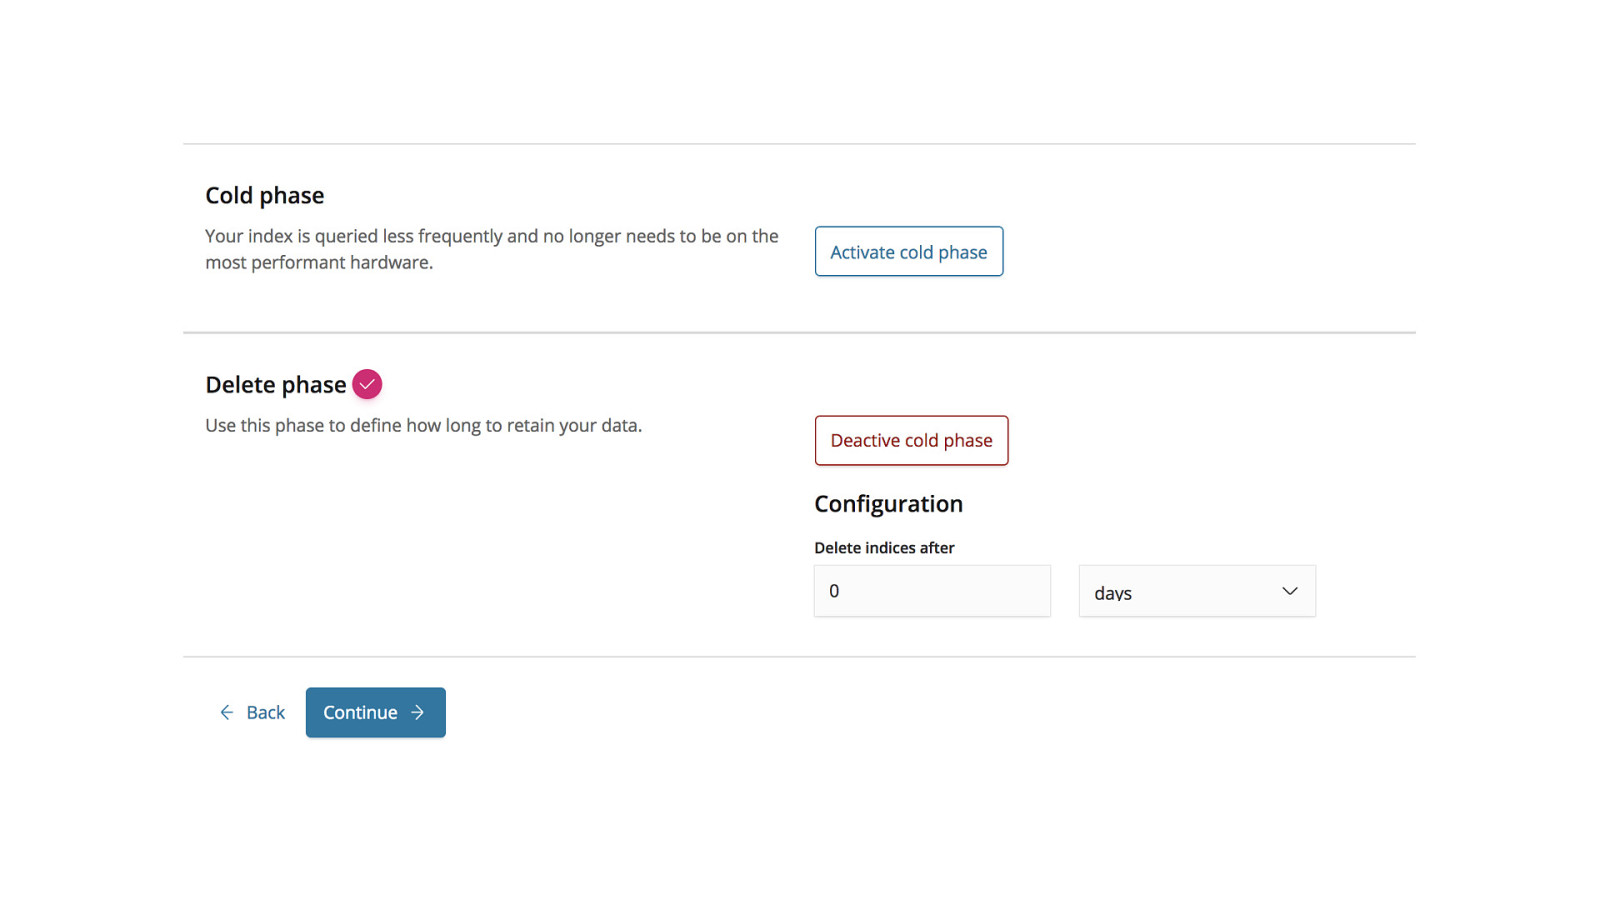
Index Lifecycle Management Currently https://github.com/elastic/curator
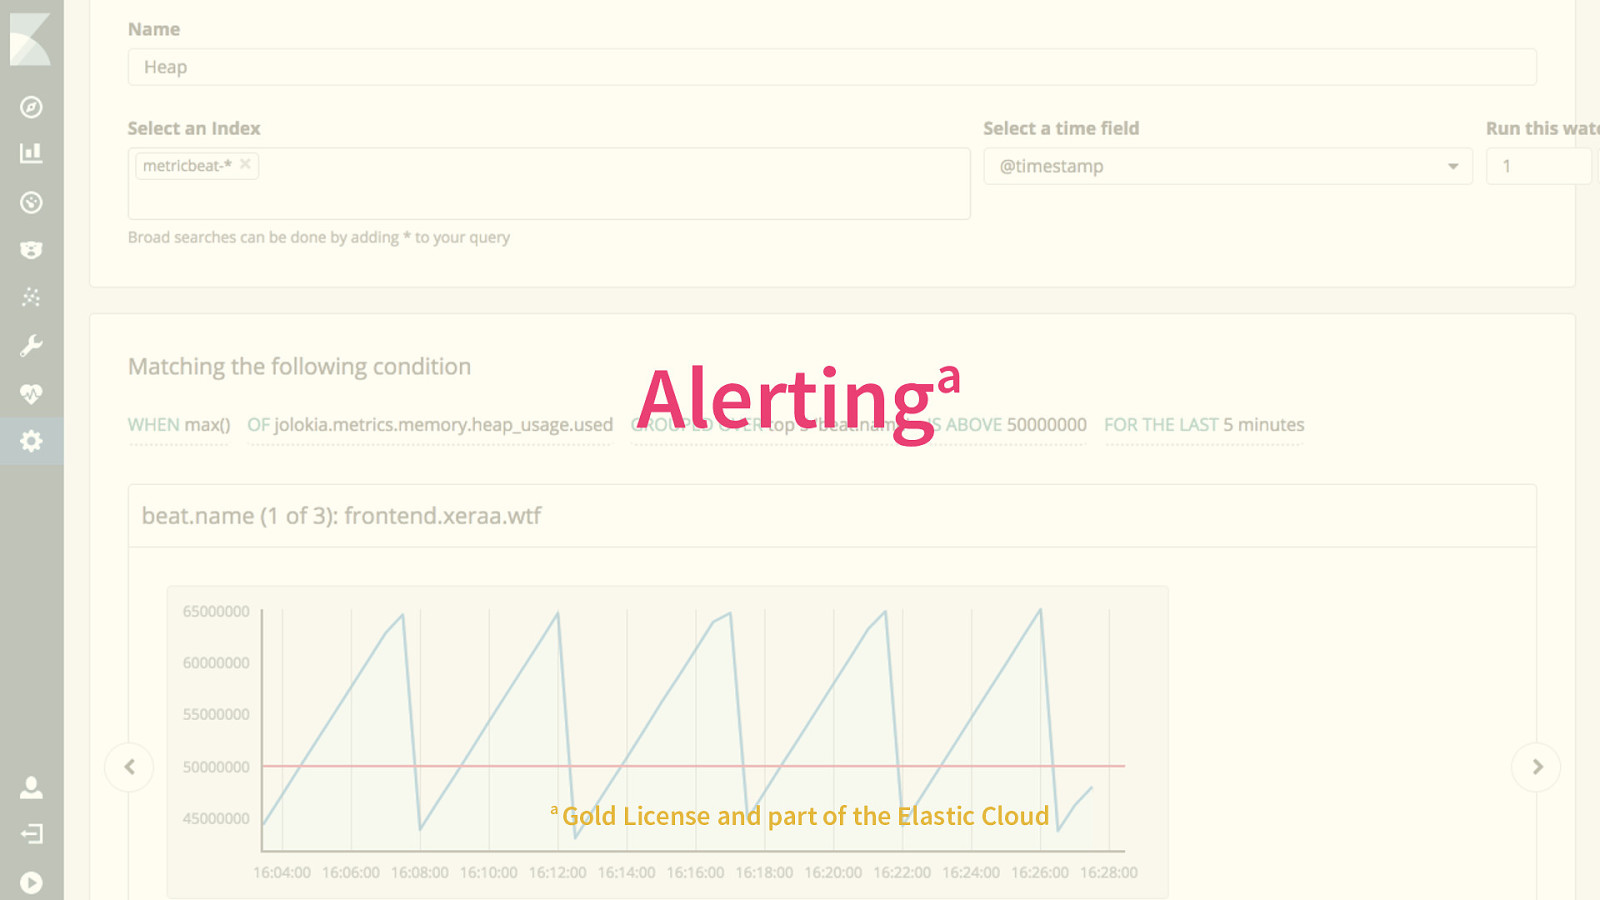
a Alerting a Gold License and part of the Elastic Cloud
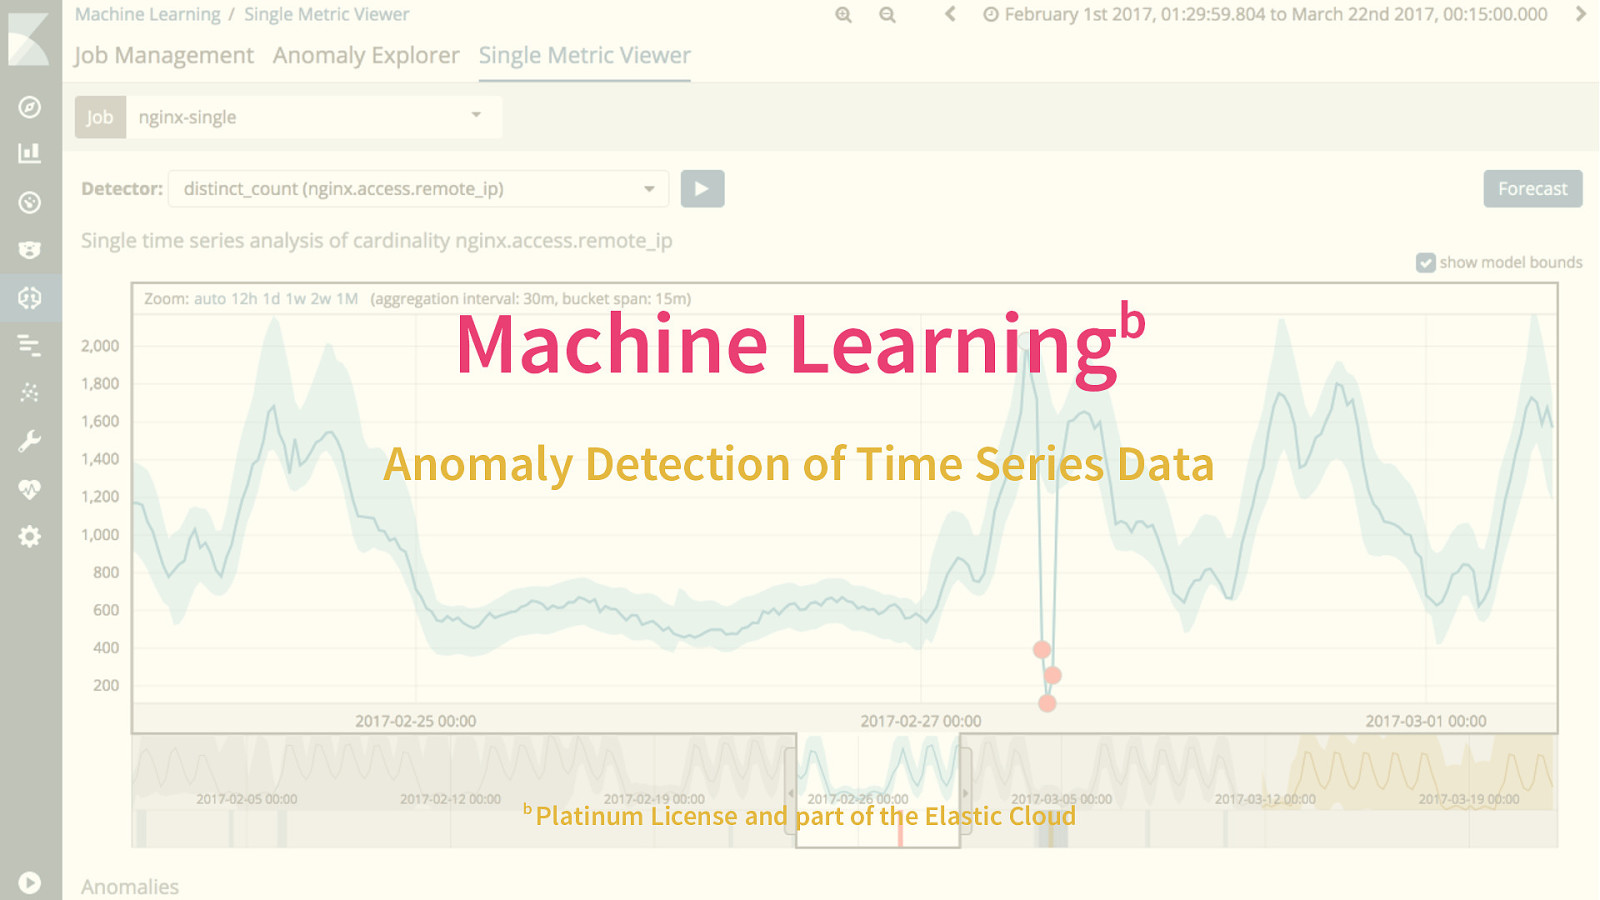
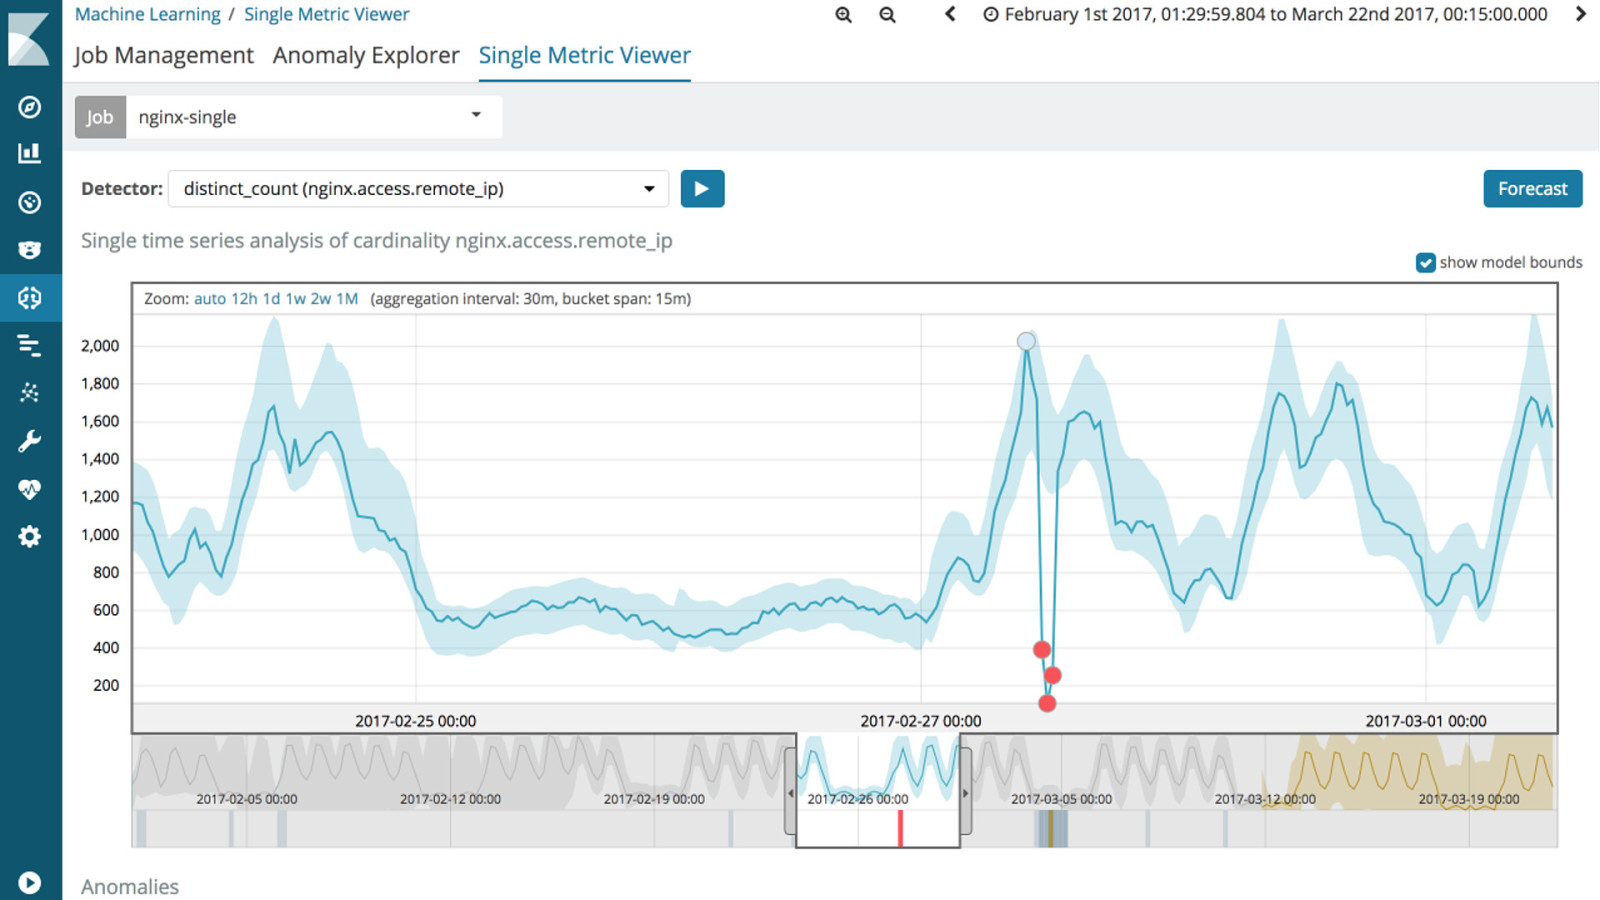
b Machine Learning Anomaly Detection of Time Series Data b Platinum License and part of the Elastic Cloud

Security c c Gold / Platinum License and part of the Elastic Cloud

Q&A + Your Apps

Conclusion

System metrics & network Filebeat modules & Auditbeat Application logs
Uptime Application metrics Request tracing
Benchmarks Fair Reproducible Close to Production


Code https://github.com/xeraa/ microservice-monitoring

Thank You Philipp Krenn PS: Sticker @xeraa

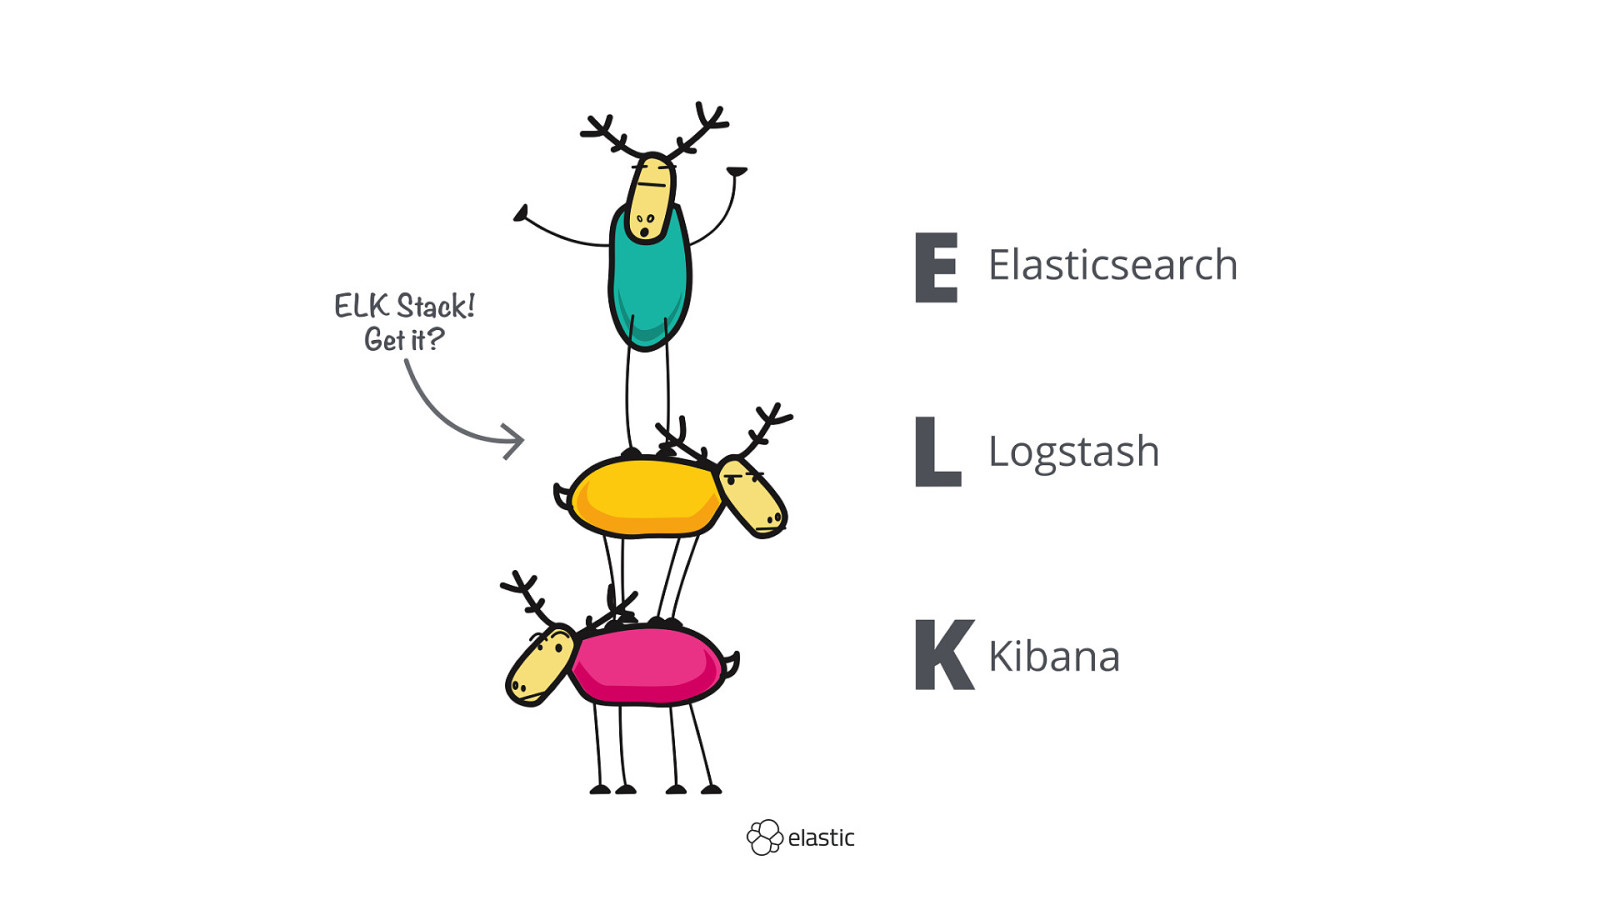
"With microservices every outage is like a murder mystery" is a common complaint. But it doesn't have to be! This workshop gives an introduction on how to monitor distributed applications with open source tools and in particular the Elastic Stack (previously ELK Stack).
We dive into:
- System metrics: Keep track of network traffic and system load.
- Application logs: Collect structured logs in a central location.
- Uptime monitoring: Ping services and actively monitor their availability and response time.
- Application metrics: Get the information from the applications' metrics and health endpoints via REST or JMX.
- Request tracing: Use Elastic APM to trace requests through a distributed system and show where your slow calls are spending their time.
 for free. You
can too.
for free. You
can too.
Resources
The following resources were mentioned during the presentation or are useful additional information.
-
GitHub Demo Code
Monitor your Spring Boot application with the Elastic Stack all around.
Buzz and feedback
Here’s what was said about this presentation on social media.