Performance Testing Chrome Lessons learned from 4 years in the trenches
A presentation at Automationeers Assemble in April 2019 in by Annie Sullivan

Performance Testing Chrome Lessons learned from 4 years in the trenches
Hi, I’m Annie! @anniesullie Led performance testing on Chrome from 2015-2018 after contributing since 2011. Previously worked on web performance for Google Search and Google Docs. Now work on metrics for Chrome.
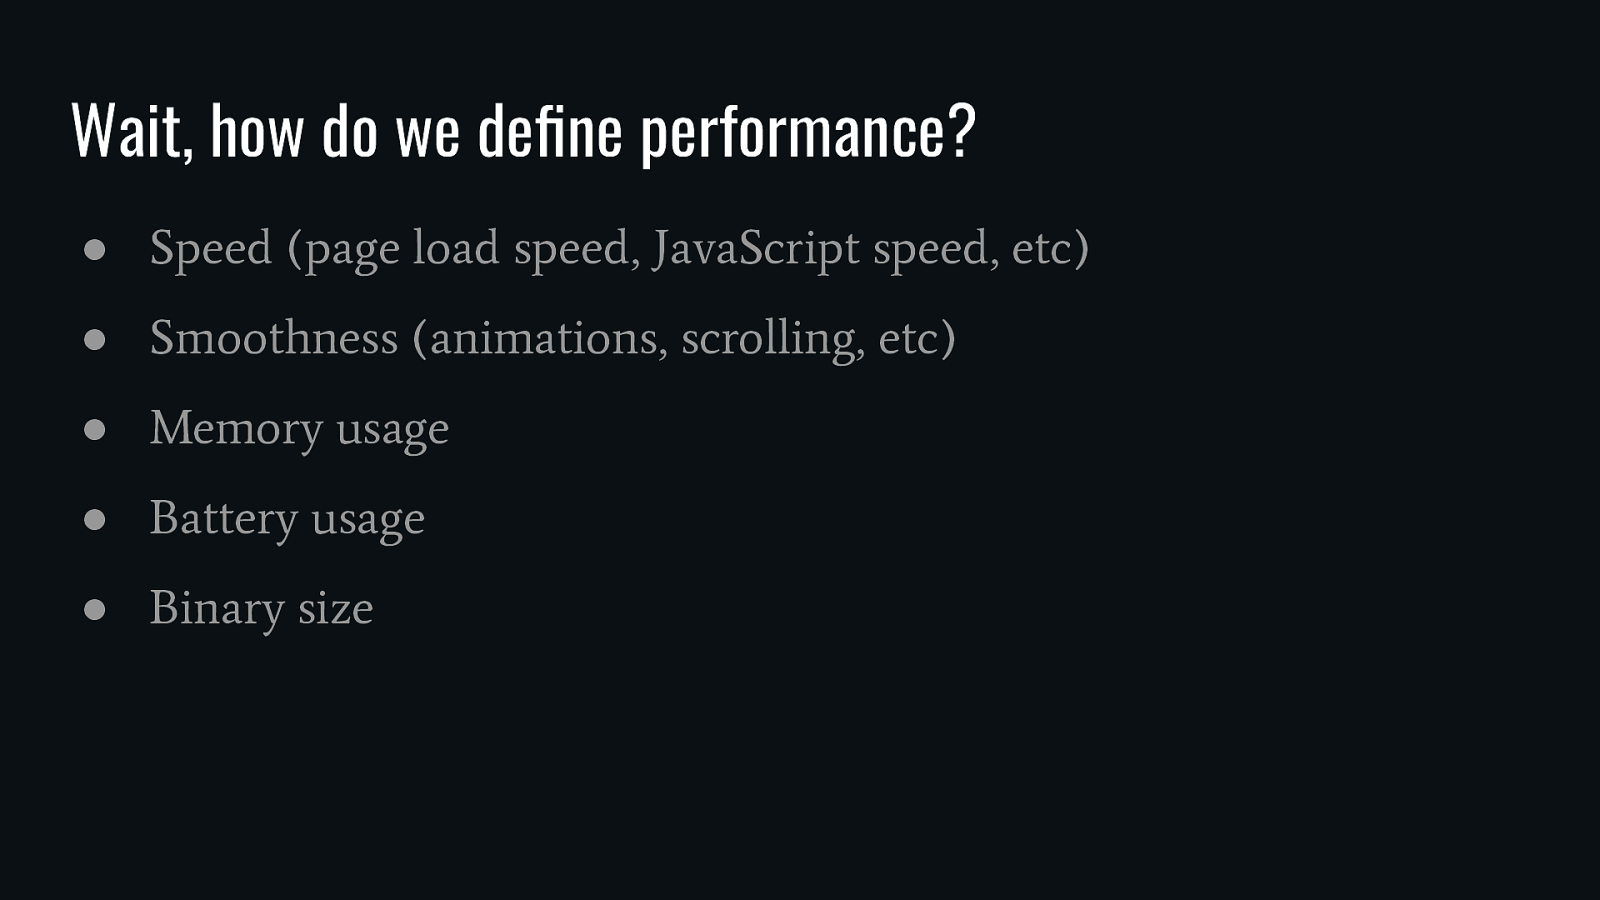
Wait, how do we define performance? ● Speed (page load speed, JavaScript speed, etc) ● Smoothness (animations, scrolling, etc) ● Memory usage ● Battery usage ● Binary size
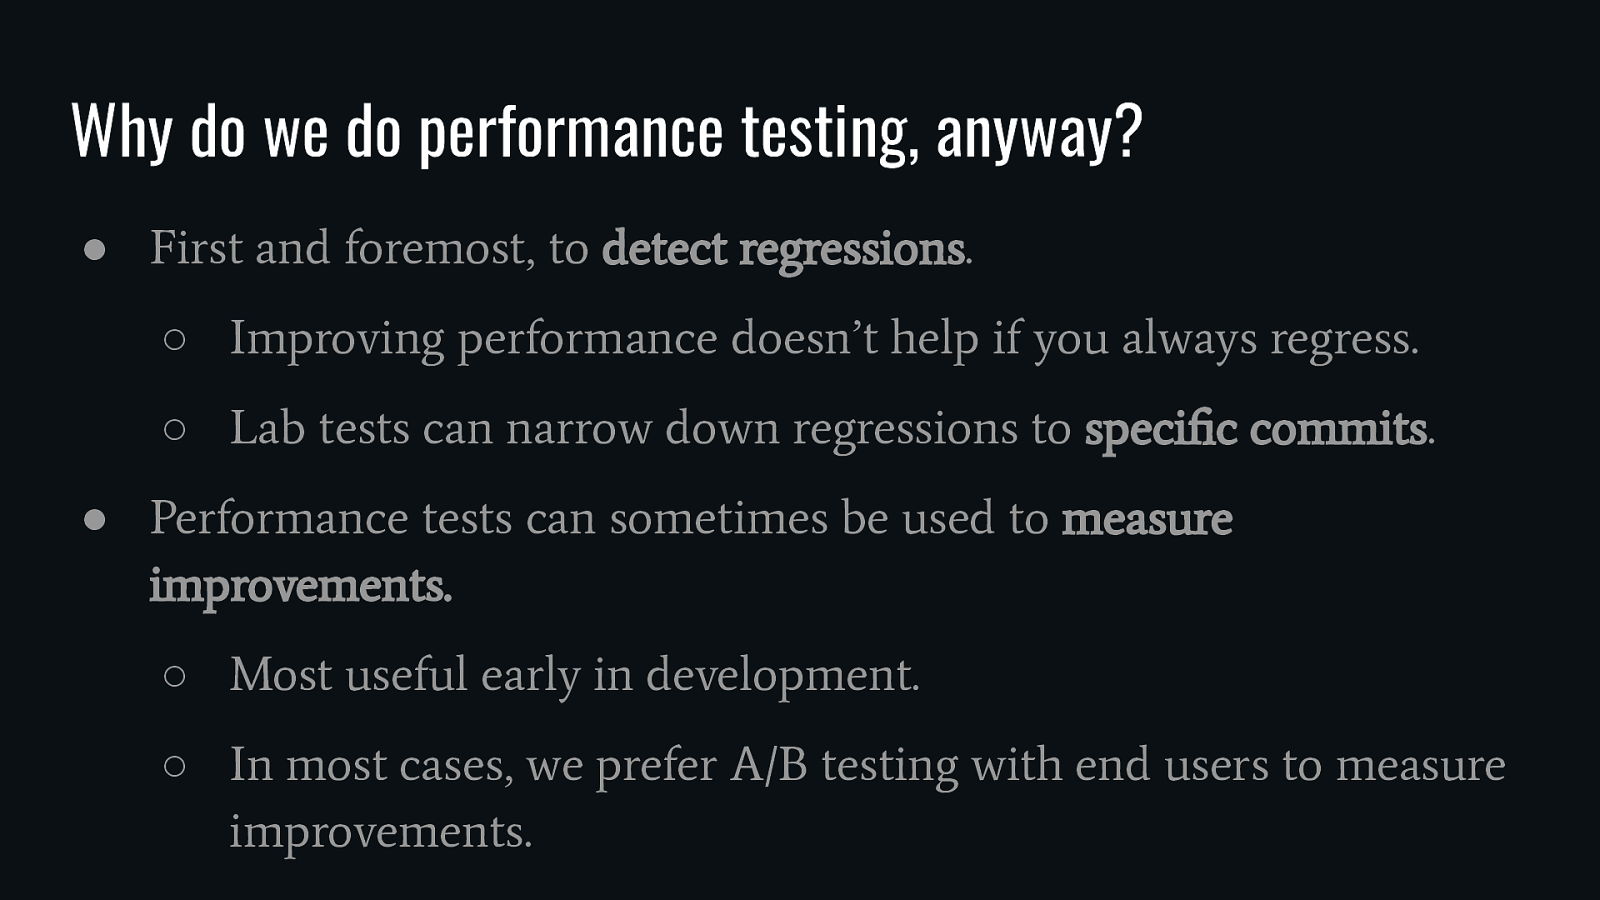
Why do we do performance testing, anyway? ● First and foremost, to detect regressions. ○ Improving performance doesn’t help if you always regress. ○ Lab tests can narrow down regressions to specific commits. ● Performance tests can sometimes be used to measure improvements. ○ Most useful early in development. ○ In most cases, we prefer A/B testing with end users to measure improvements.
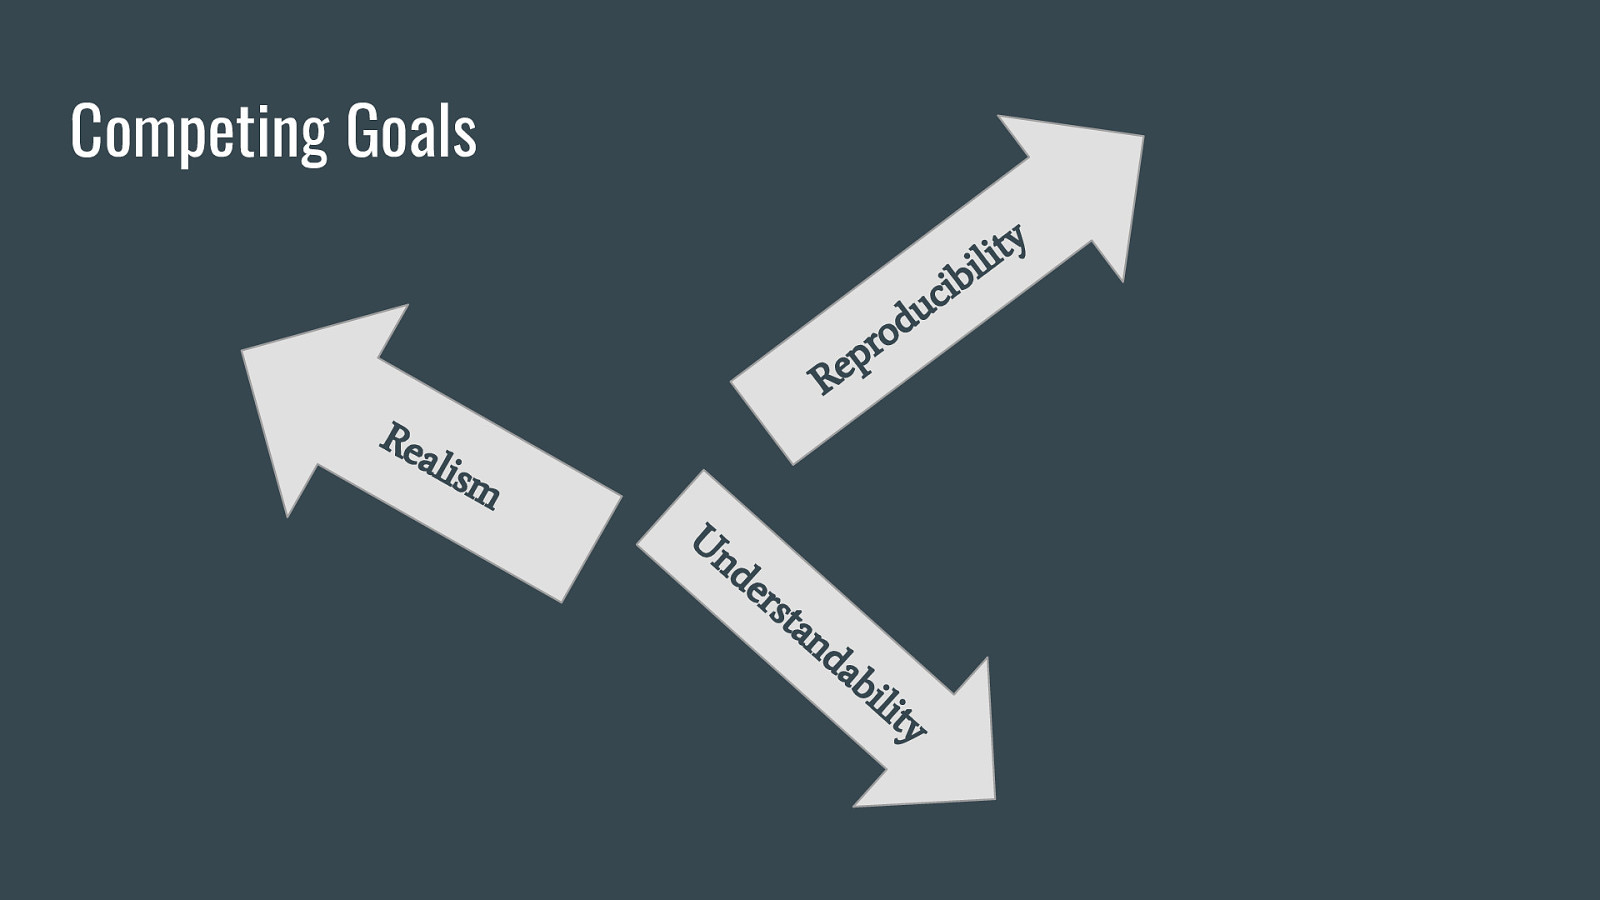
Competing Goals y du o pr Re Re al ism U nd er sta nd a bi lit y lit i b ci

Reproducibility ● Is this a real regression, or just noise? ● Can we repeat the test to narrow down to a commit? ● Can a developer reproduce the problem locally?
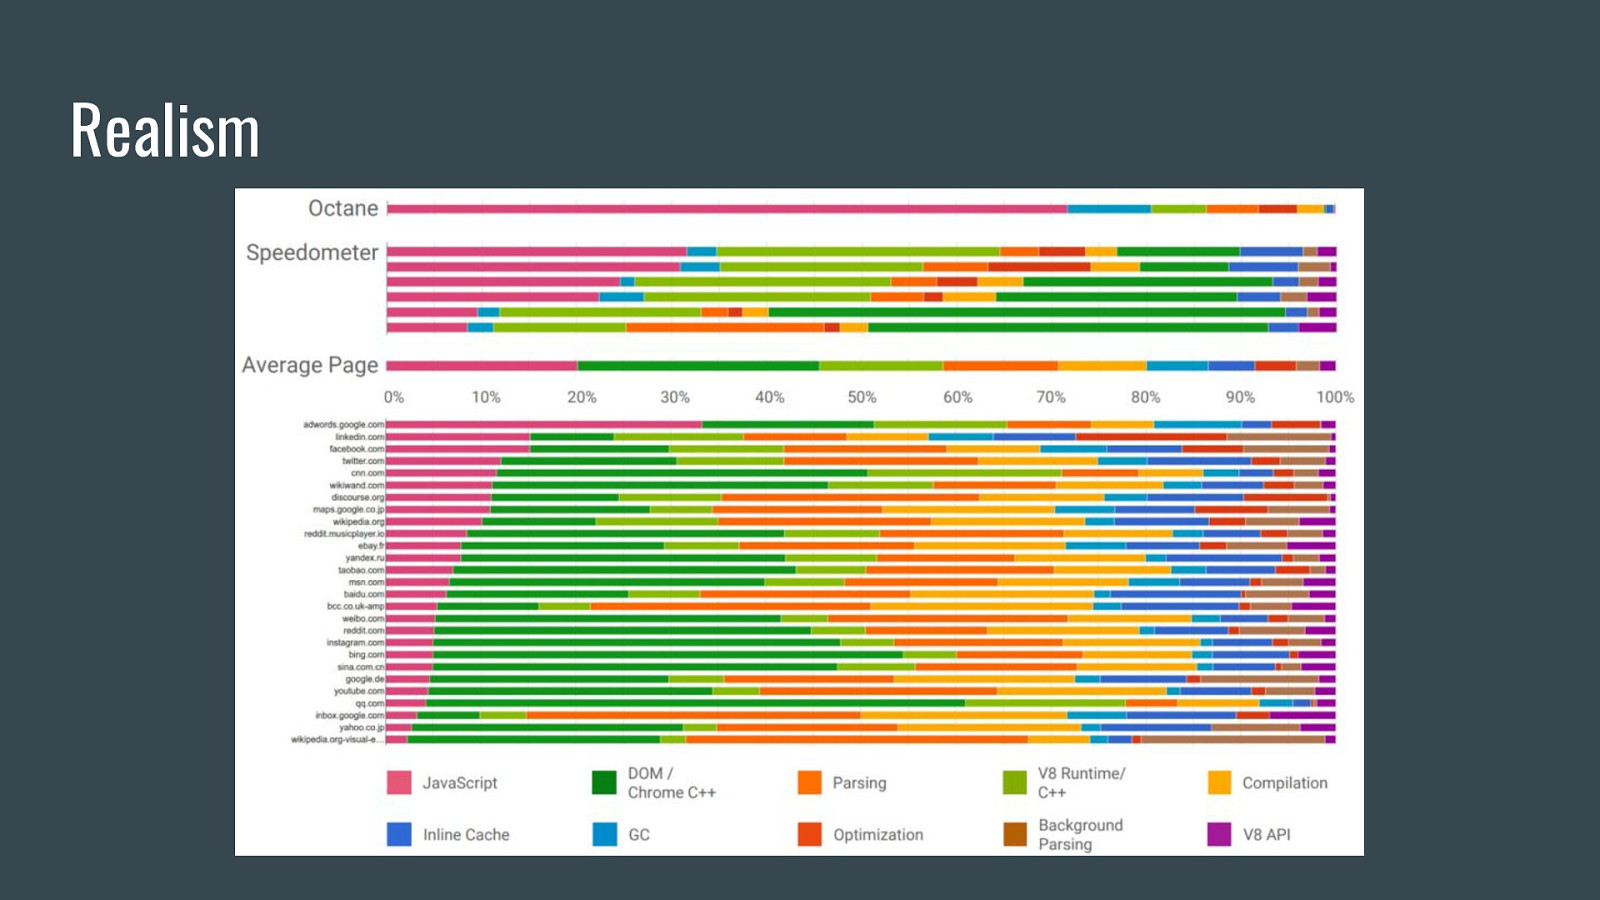
Realism
Reality changes over time ● Web content changes ● Devices users browse the web on change ● Network quality and speed changes

Understandability ● What does the test measure? ● What diagnostic information is available? ● What tools are available for local debugging?
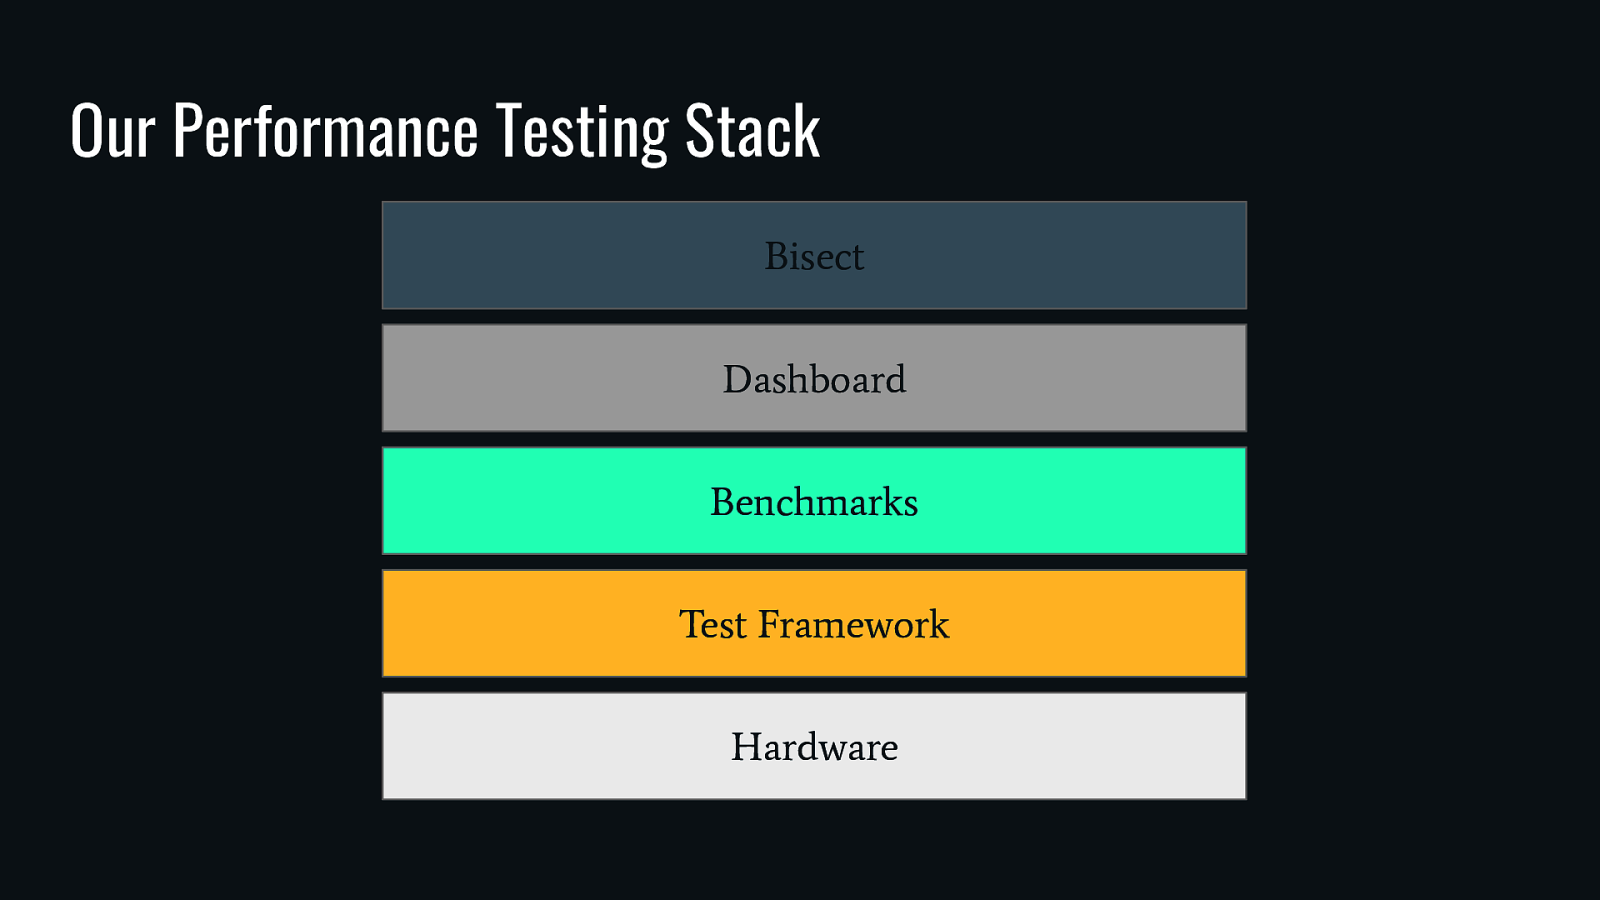
Our Performance Testing Stack Bisect Dashboard Benchmarks Test Framework Hardware
Hardware: Realism ● Test on real devices ○ ○ ○ ○ ○ Android Windows Mac ChromeOS Linux ● Use release official builds (unsigned)
Hardware: Reproducibility ● Each run of a test case on exact same device ● Run a “reference build” (Chrome stable) side-by-side with build under test. ● Turn off things running in background as much as possible ● On Android, wait for device to cool between runs ● On Android, often throttle CPU
Test framework: Telemetry ● We call it telemetry. ● Source code: https://github.com/catapult-project/catapult/tree/master/telemetry ● Cross-platform ○ ○ ○ ○ ○ Android Windows Mac ChromeOS Linux
Test framework: Telemetry Two parts of a benchmark ● Metrics ○ ○ Performance measurements Generally independent of story ● Stories ○ ○ ○ The test case Usually a web page Supports user input, multi-page navigations, multi-app on Android
Telemetry: Realism ● Use WprGo to record/replay real web pages. ● End-to-end testing of thousands of real web pages ● Simulate network conditions like 3G ● Simulate user input, multi-page navigations.
Telemetry: Reproducibility Provides a deterministic environment for repeatable results. ● Set up browser profile, caching, etc the same on each run. ● Replay recorded sites instead of live sites ● Network simulation for consistent network speed
Telemetry: Understandability ● Metrics are generated from chrome traces, which are available to developers. ● Metrics can be broken down so it’s clear which components contributed. ● Benchmark owner, documentation, and bug component required in definition.
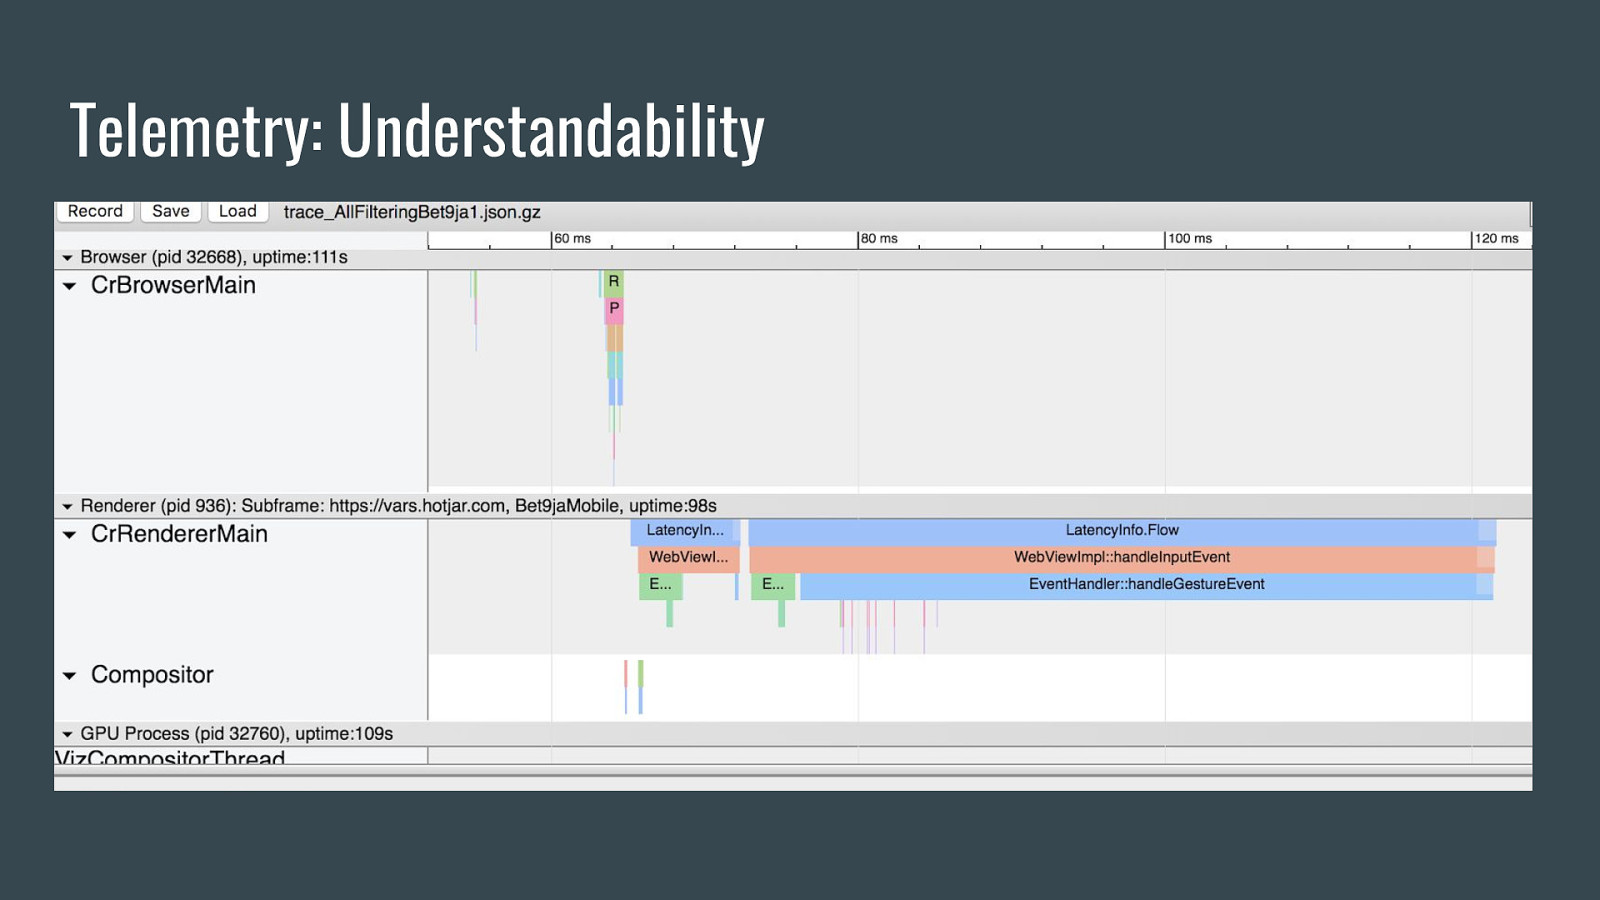
Telemetry: Understandability
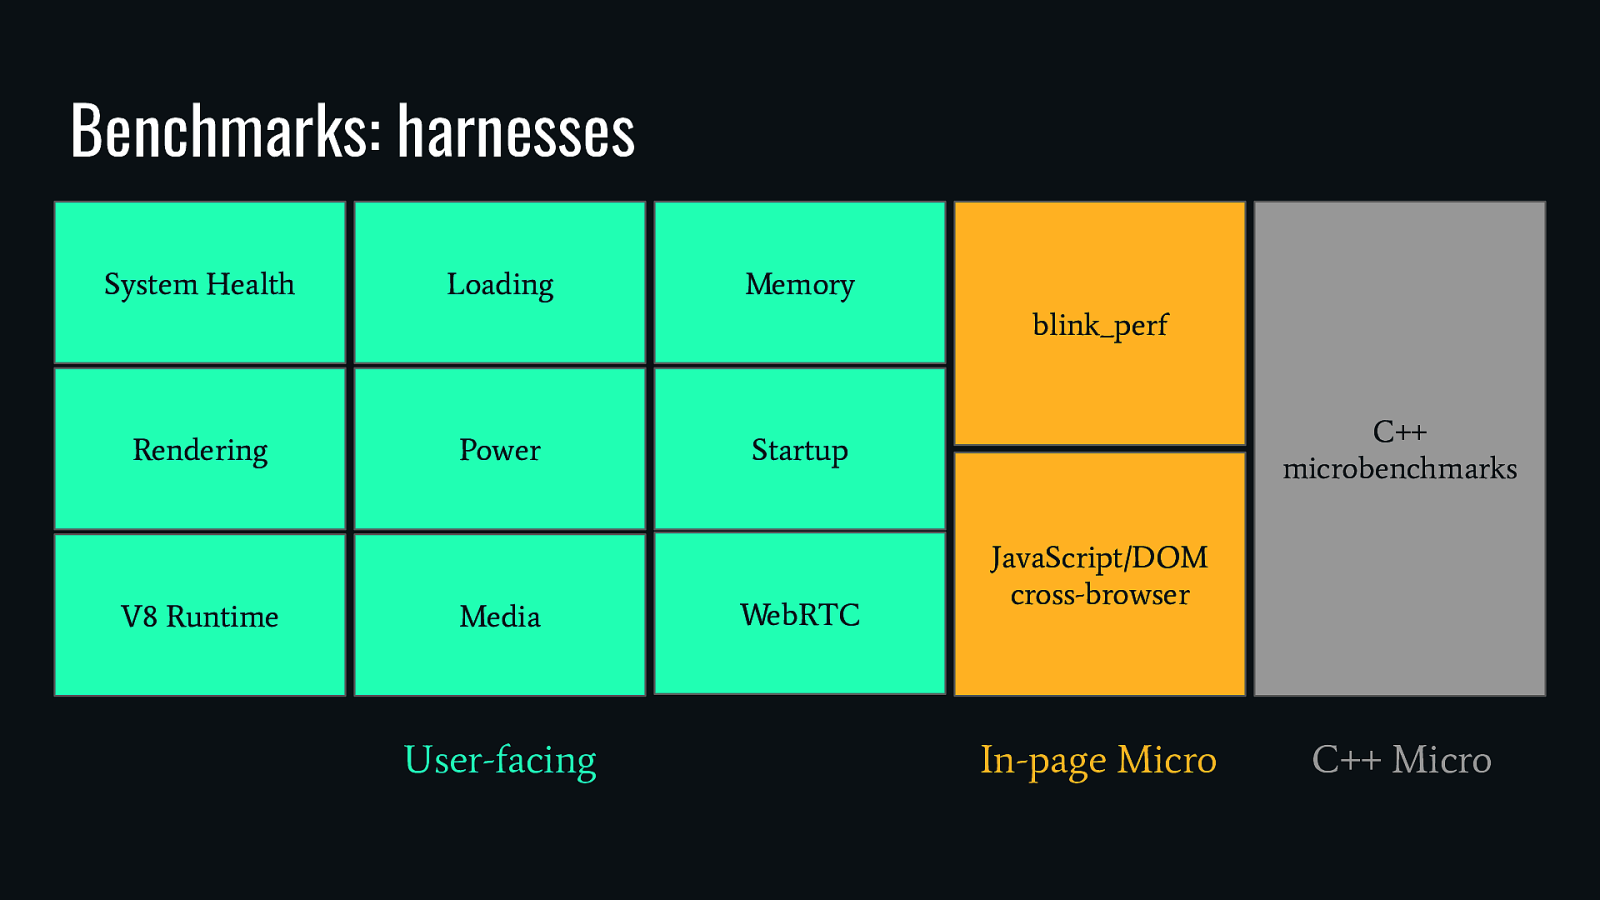
Benchmarks: harnesses System Health Loading Memory blink_perf Rendering V8 Runtime Power Media User-facing C++ microbenchmarks Startup WebRTC JavaScript/DOM cross-browser In-page Micro C++ Micro
User-facing benchmarks focus on realism ● Measuring key metrics on thousands of real web pages ● Get end-to-end performance measurements across the entire codebase

In-page Microbenchmarks focus on Usability ● Easy to compare results between browsers ● Can easily read source and inspect in devtools ● Easy to profile/trace
C++ Microbenchmarks have reproducibility and usability ● Easy to profile ● Smallest amount of code under test
Perf Dashboard ● Source code: https://github.com/catapult-project/catapult/tree/master/dashboard ● Benchmark results uploaded after every run. ● Automatically detects and groups regressions in timeseries. ● Integrates with bug tracker. ● Integrates with bisect tool.
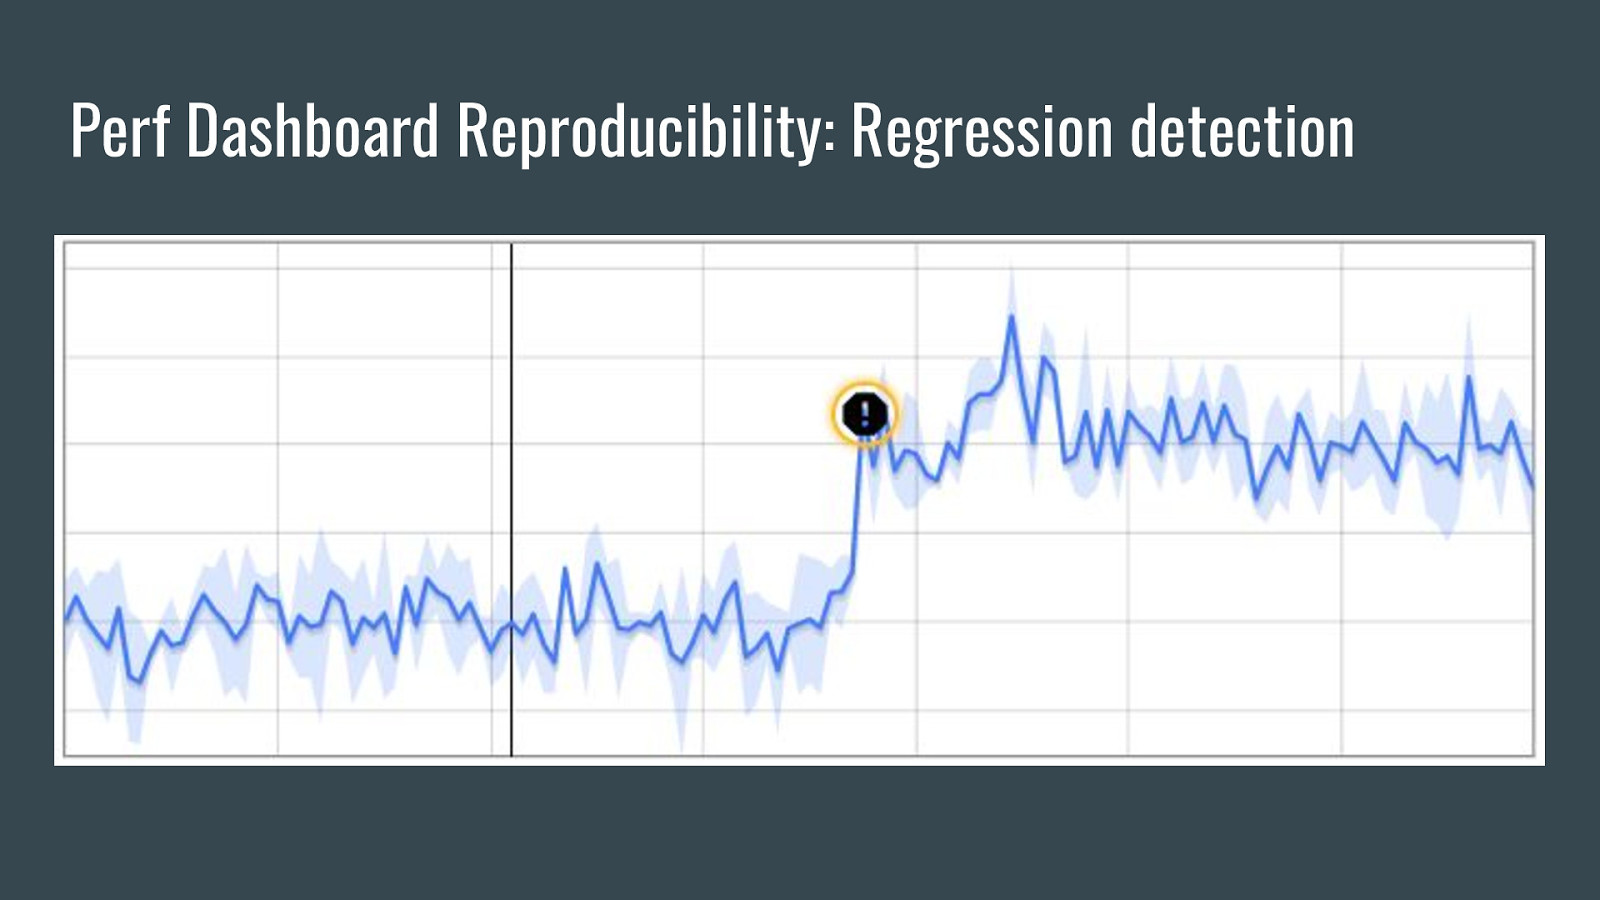
Perf Dashboard Reproducibility: Regression detection
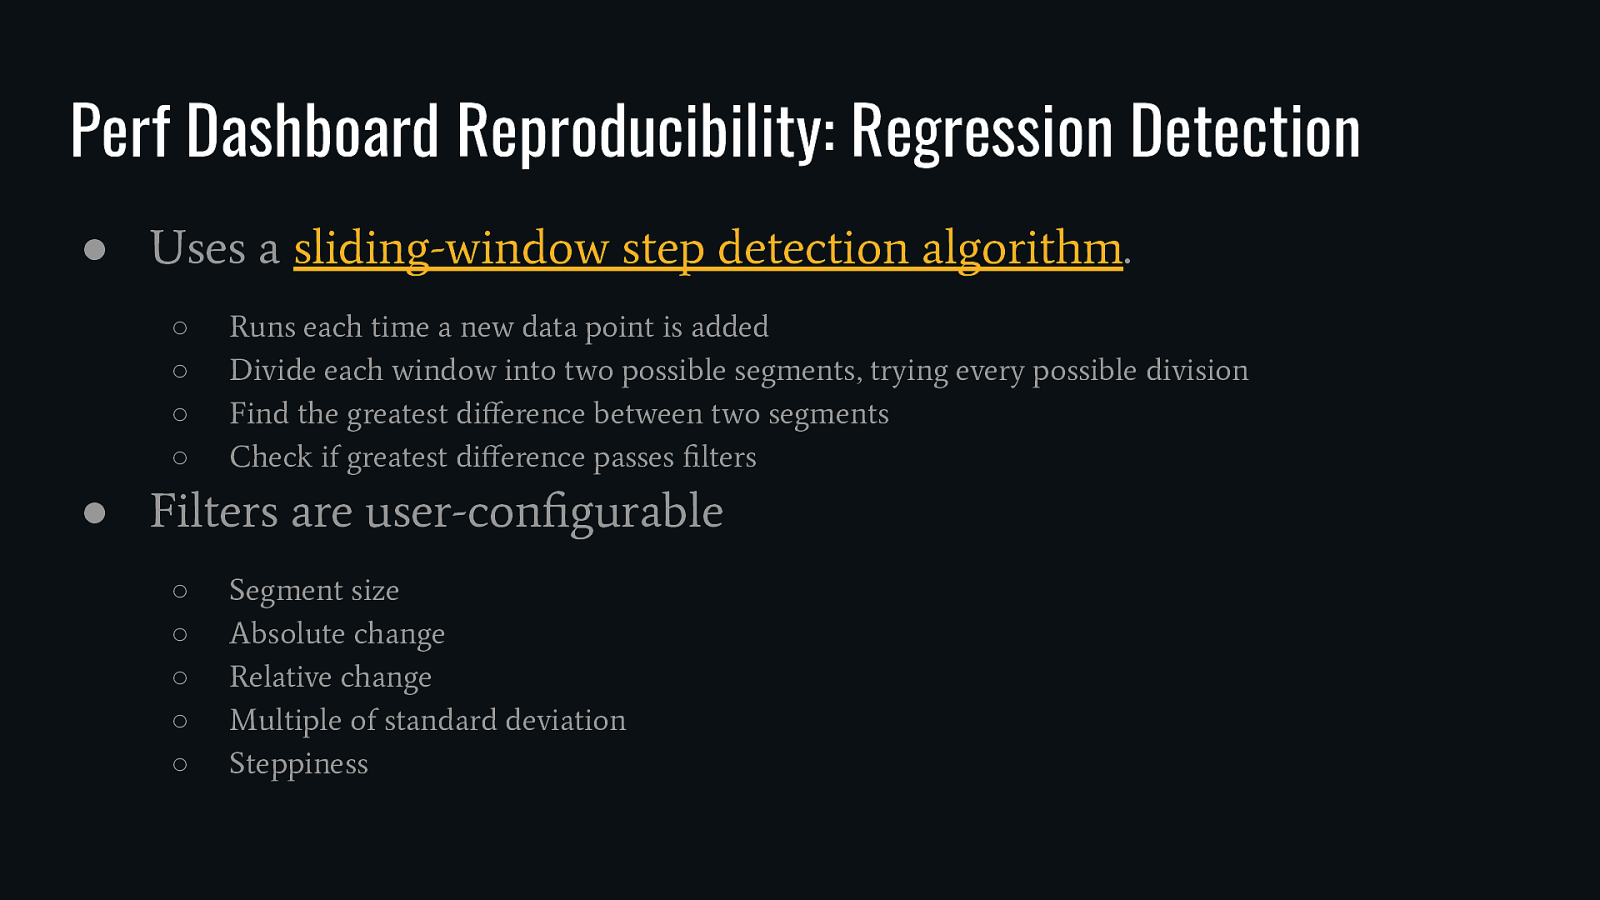
Perf Dashboard Reproducibility: Regression Detection ● Uses a sliding-window step detection algorithm. ○ ○ ○ ○ Runs each time a new data point is added Divide each window into two possible segments, trying every possible division Find the greatest difference between two segments Check if greatest difference passes filters ● Filters are user-configurable ○ ○ ○ ○ ○ Segment size Absolute change Relative change Multiple of standard deviation Steppiness
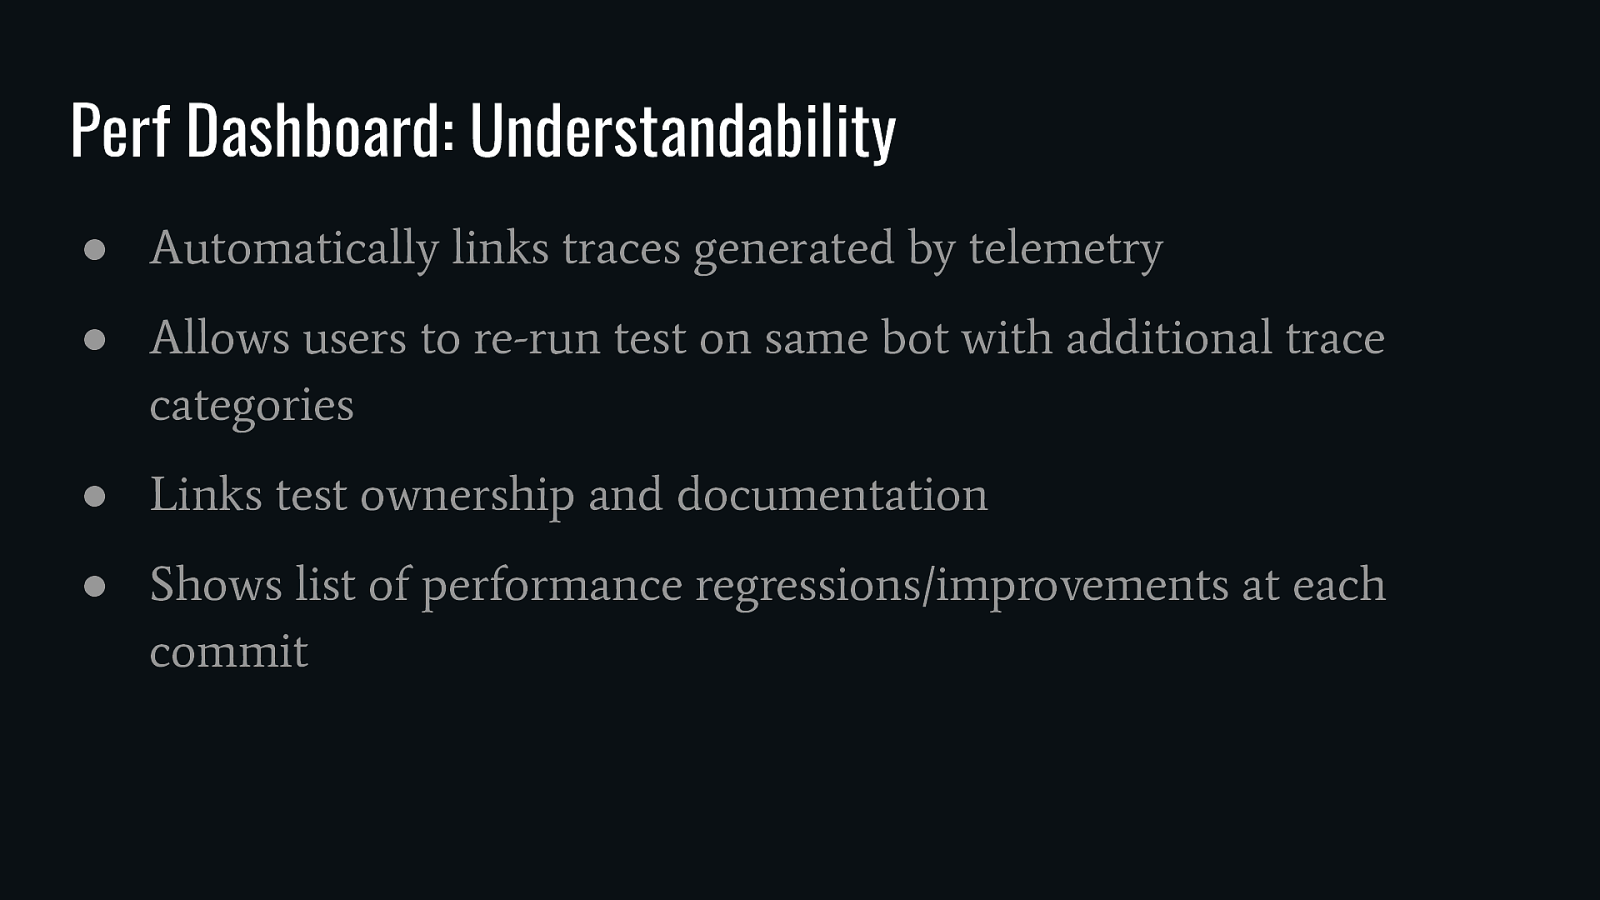
Perf Dashboard: Understandability ● Automatically links traces generated by telemetry ● Allows users to re-run test on same bot with additional trace categories ● Links test ownership and documentation ● Shows list of performance regressions/improvements at each commit
Bisection: Pinpoint ● Source code: https://github.com/catapult-project/catapult/tree/master/dashboard/ dashboard/pinpoint ● Bisection kicked off by perf dashboard for regressions ● Also supports test failure/flakiness
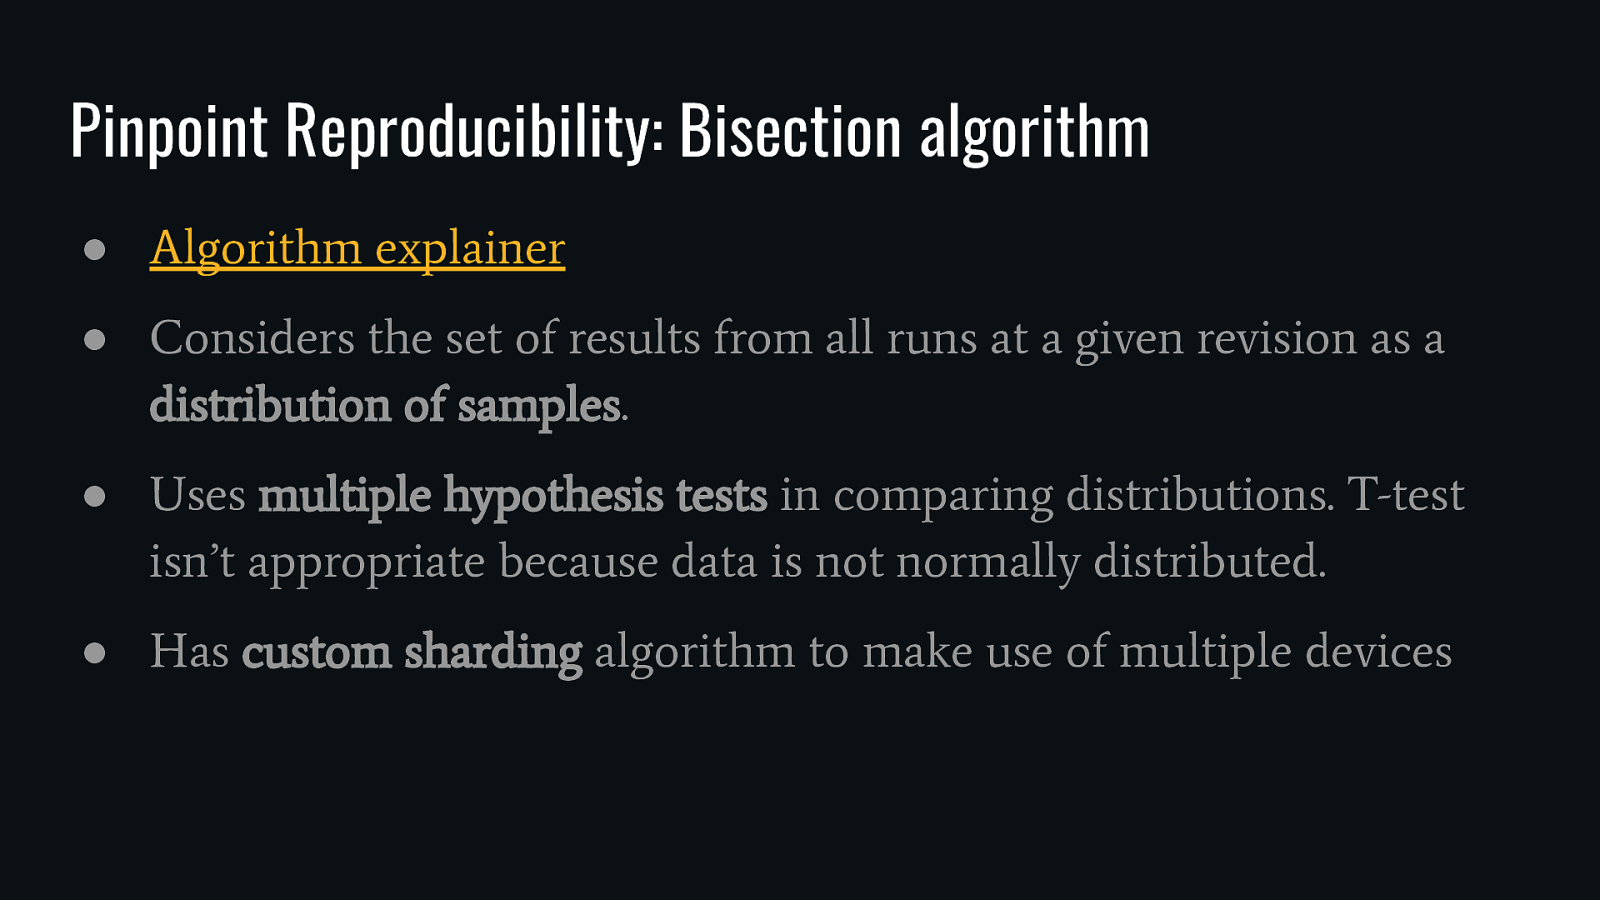
Pinpoint Reproducibility: Bisection algorithm ● Algorithm explainer ● Considers the set of results from all runs at a given revision as a distribution of samples. ● Uses multiple hypothesis tests in comparing distributions. T-test isn’t appropriate because data is not normally distributed. ● Has custom sharding algorithm to make use of multiple devices
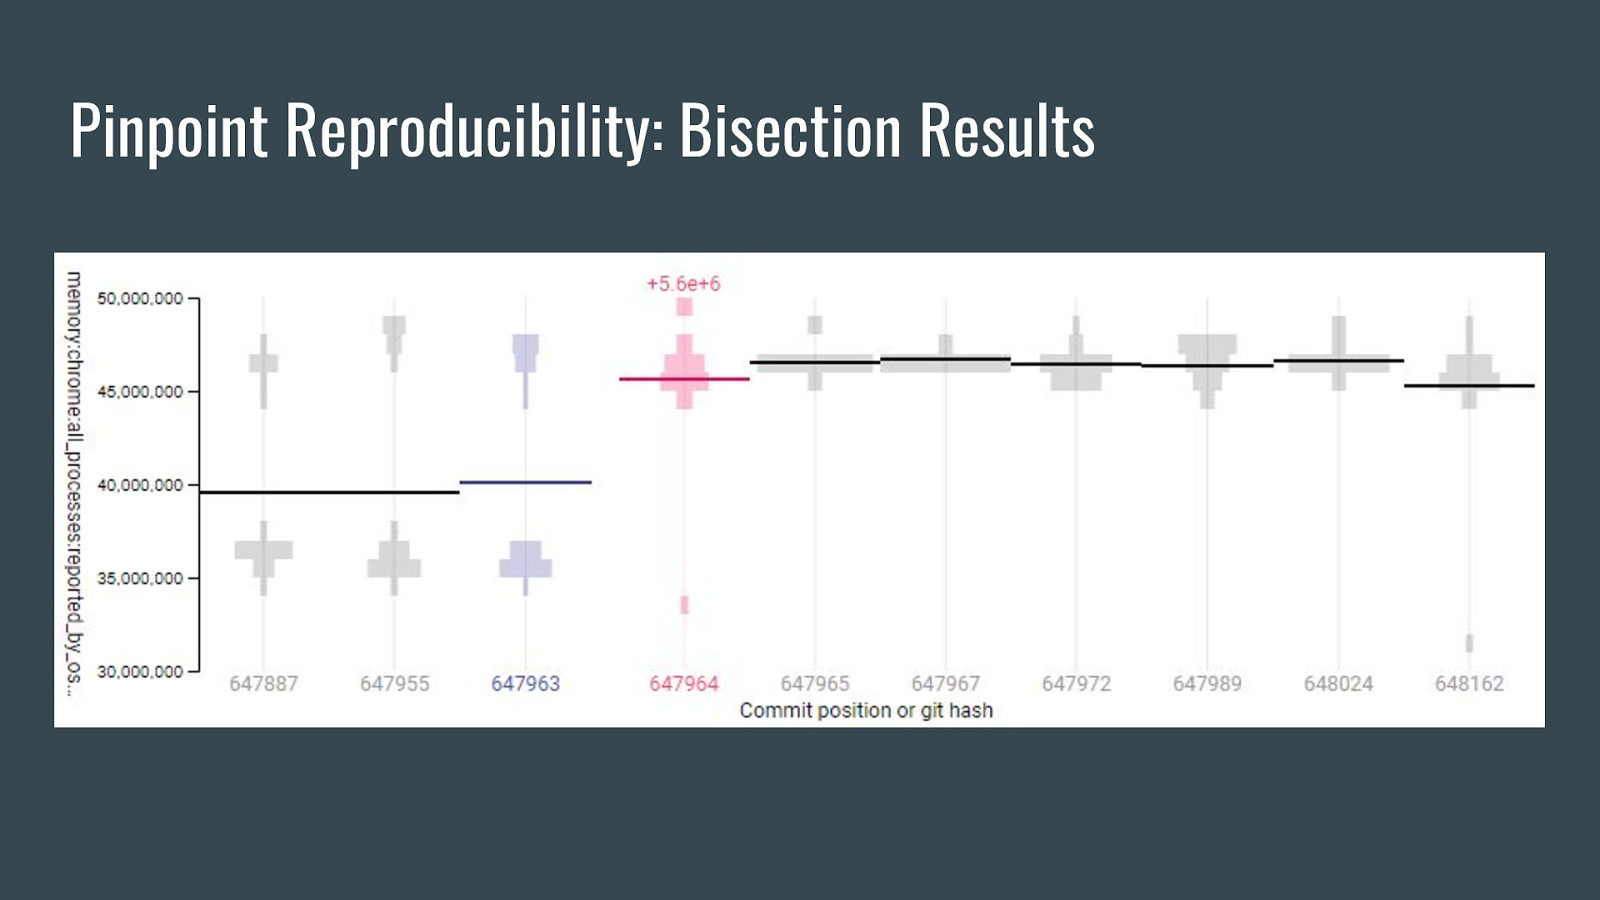
Pinpoint Reproducibility: Bisection Results
Pinpoint Understandability ● Links to traces from all runs ● Allows re-run with more tracing categories ● Integrates with bugs database ● Can run A/B test on any benchmark/bot on unsubmitted change