Monitoring and Metrics in Chrome

A presentation at performance.now() in November 2019 in Amsterdam, Netherlands by Annie Sullivan

Slide 1

Slide 1

Metrics and Monitoring in Chrome Lessons learned over the years http://bit.ly/monitoring-and-metrics-in-chrome Hi, I’m Annie. I’m a software engineer on Chrome, and I’ve been working on performance for the last several years. I led performance testing for 3 years, and now I work on performance metrics. I’ve also spent a lot of time helping track down performance regressions in the wild, and looking at unexpected A/B testing results. I wanted to talk about my experience in performance metrics and monitoring in Chrome, as I really hope it can be useful to web development as well.

Slide 2

Slide 2

Slide 3

Slide 3

Agenda for our trip Metrics ● ● ● ● Overview Properties of good metrics Use cases for metrics Example Monitoring ● ● ● Lab A/B Testing RUM

Slide 4

Slide 4

Metrics I’m going to start off by talking about what we’ve learned over the years about developing performance metrics. I’ll go over monitoring in the second half of the talk.

Slide 5

Slide 5

Slide 6

Slide 6

We need good top level metrics.

Slide 7

Slide 7

Properties of a Good Top Level Metric Representative Stable Accurate Elastic Interpretable Realtime Simple Orthogonal

Slide 8

Slide 8

Use Cases of Top Level Metrics Lab Web Performance API Chrome RUM There are three main use cases for top level metrics, and they each have different considerations, which means we weight the importance of properties for them differently.

Slide 9

Slide 9

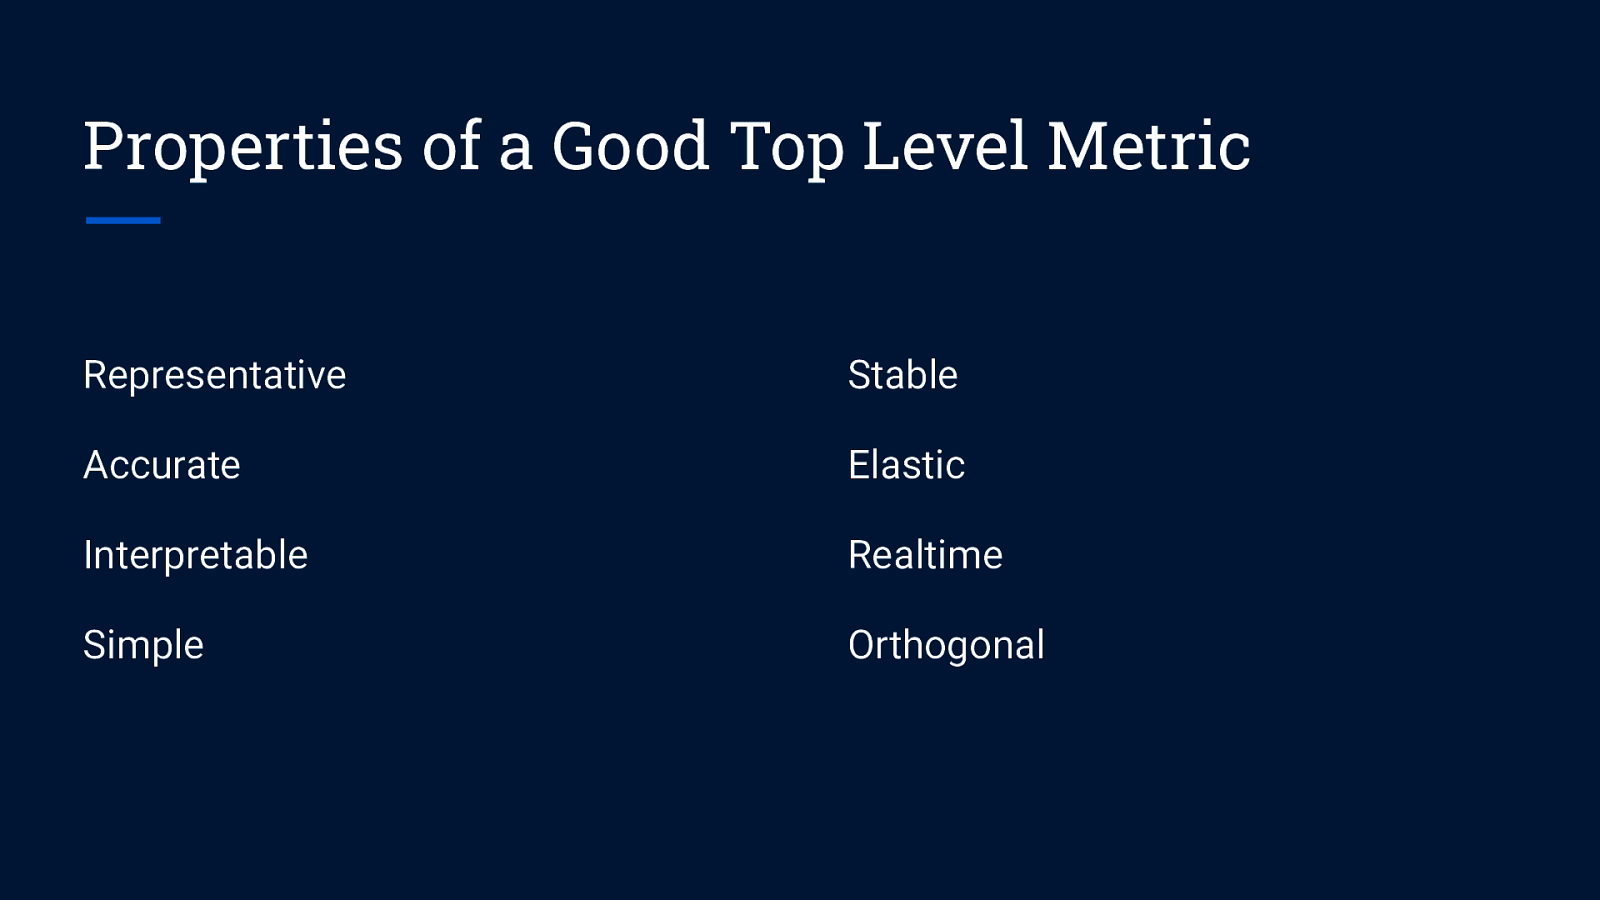
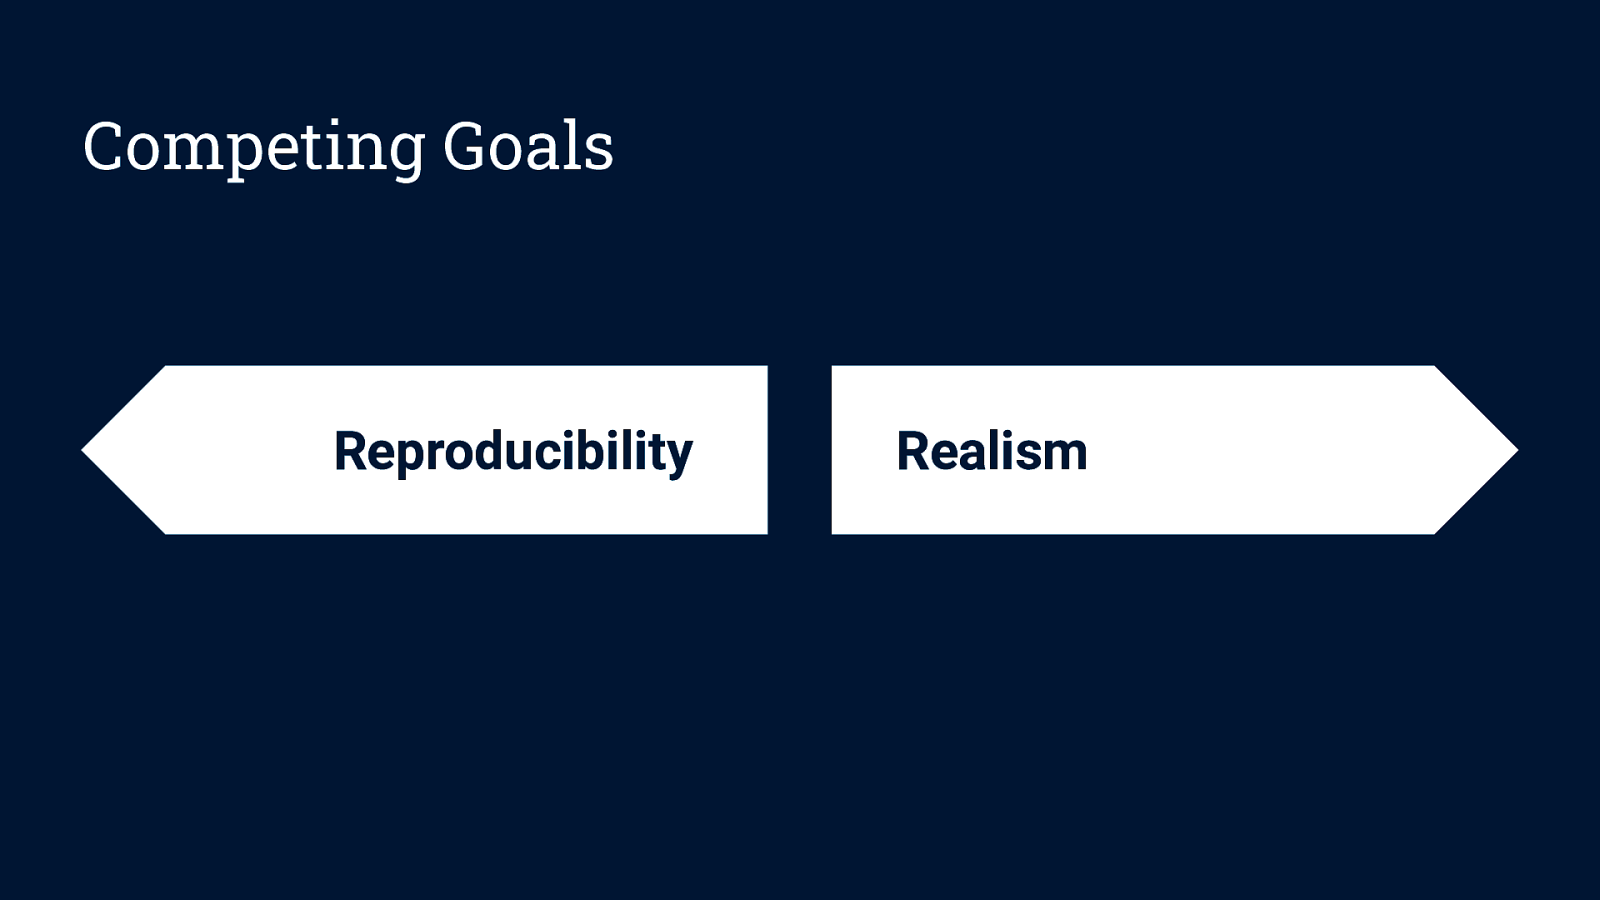
Lab metrics need to be Stable and Elastic. 
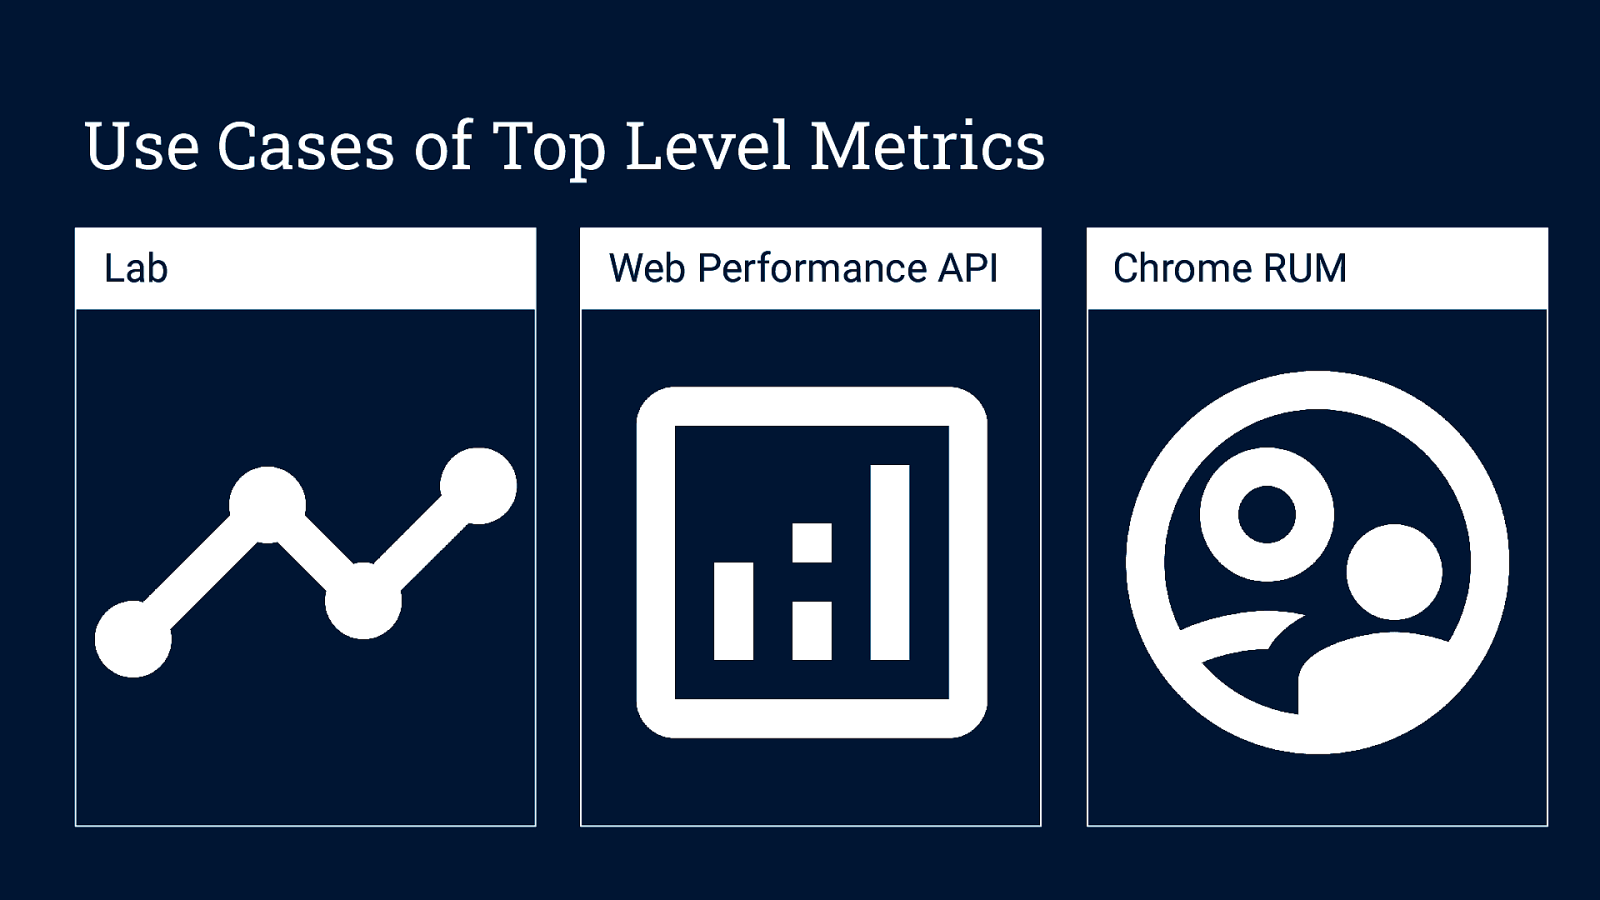
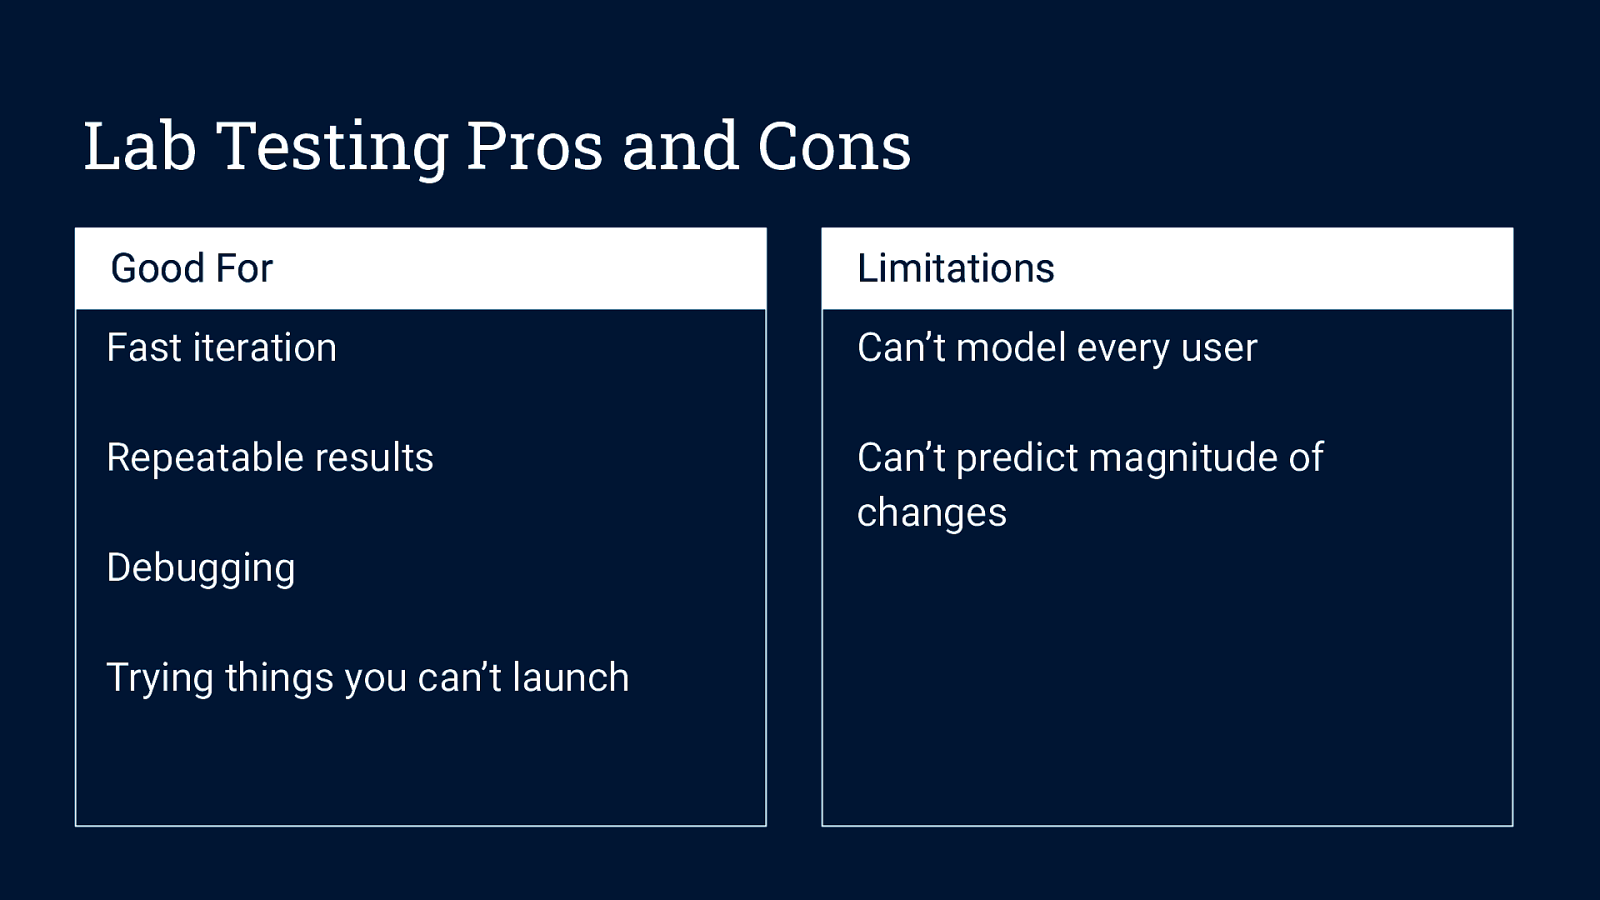
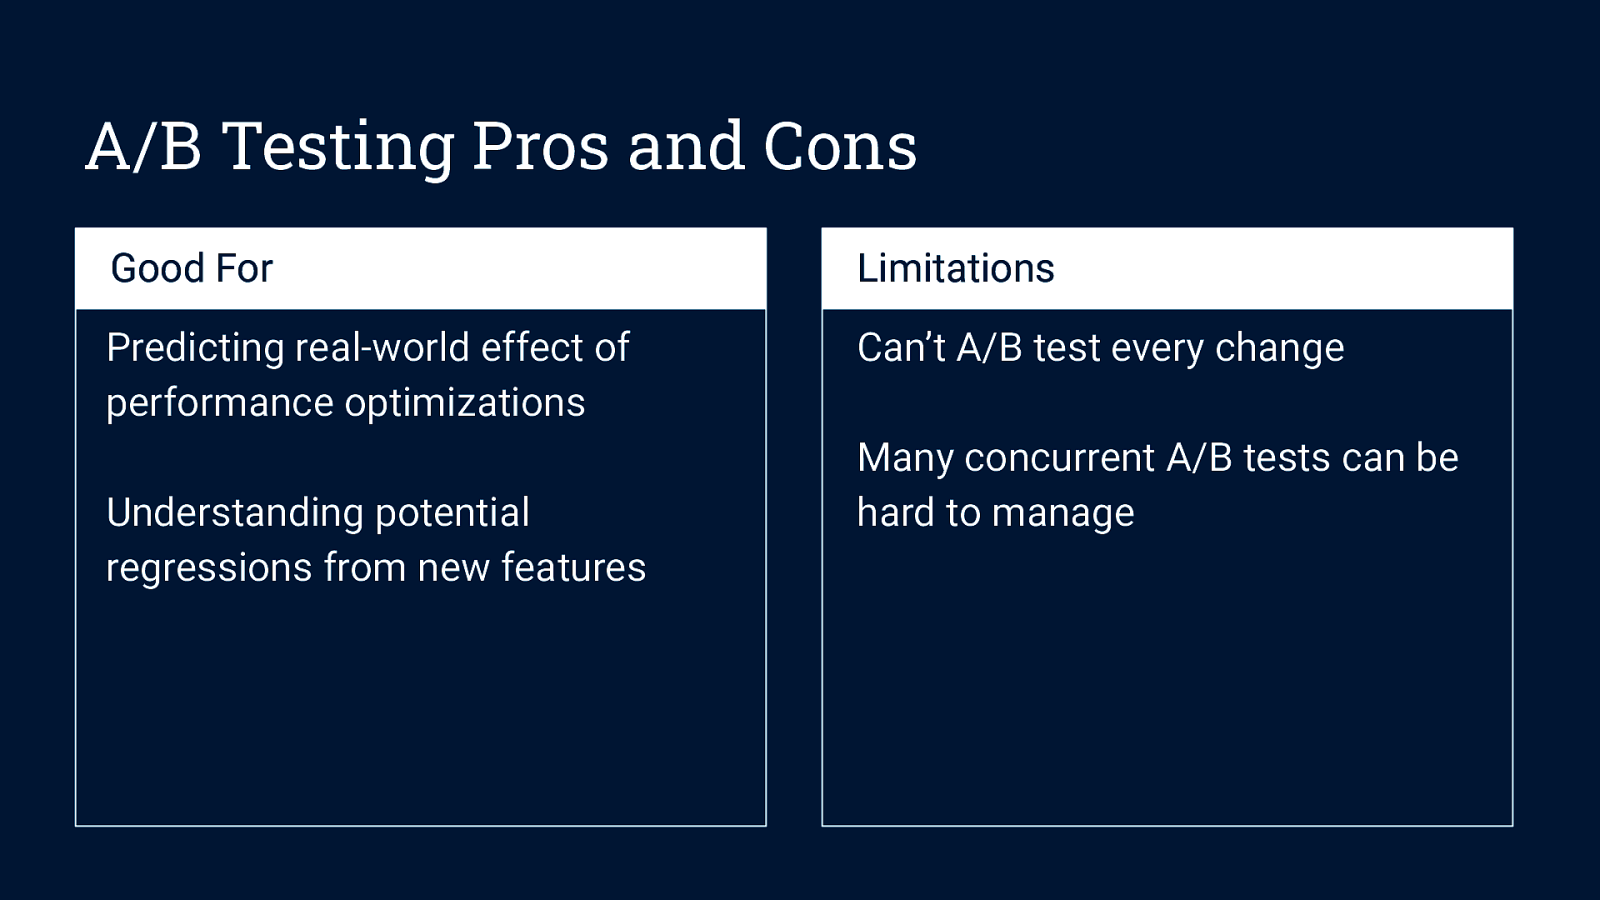
Lab Fewer data points than RUM This can put them at odds with being Simple and Interpretable. They don’t require Realtime. Care should be put into handling user input. 
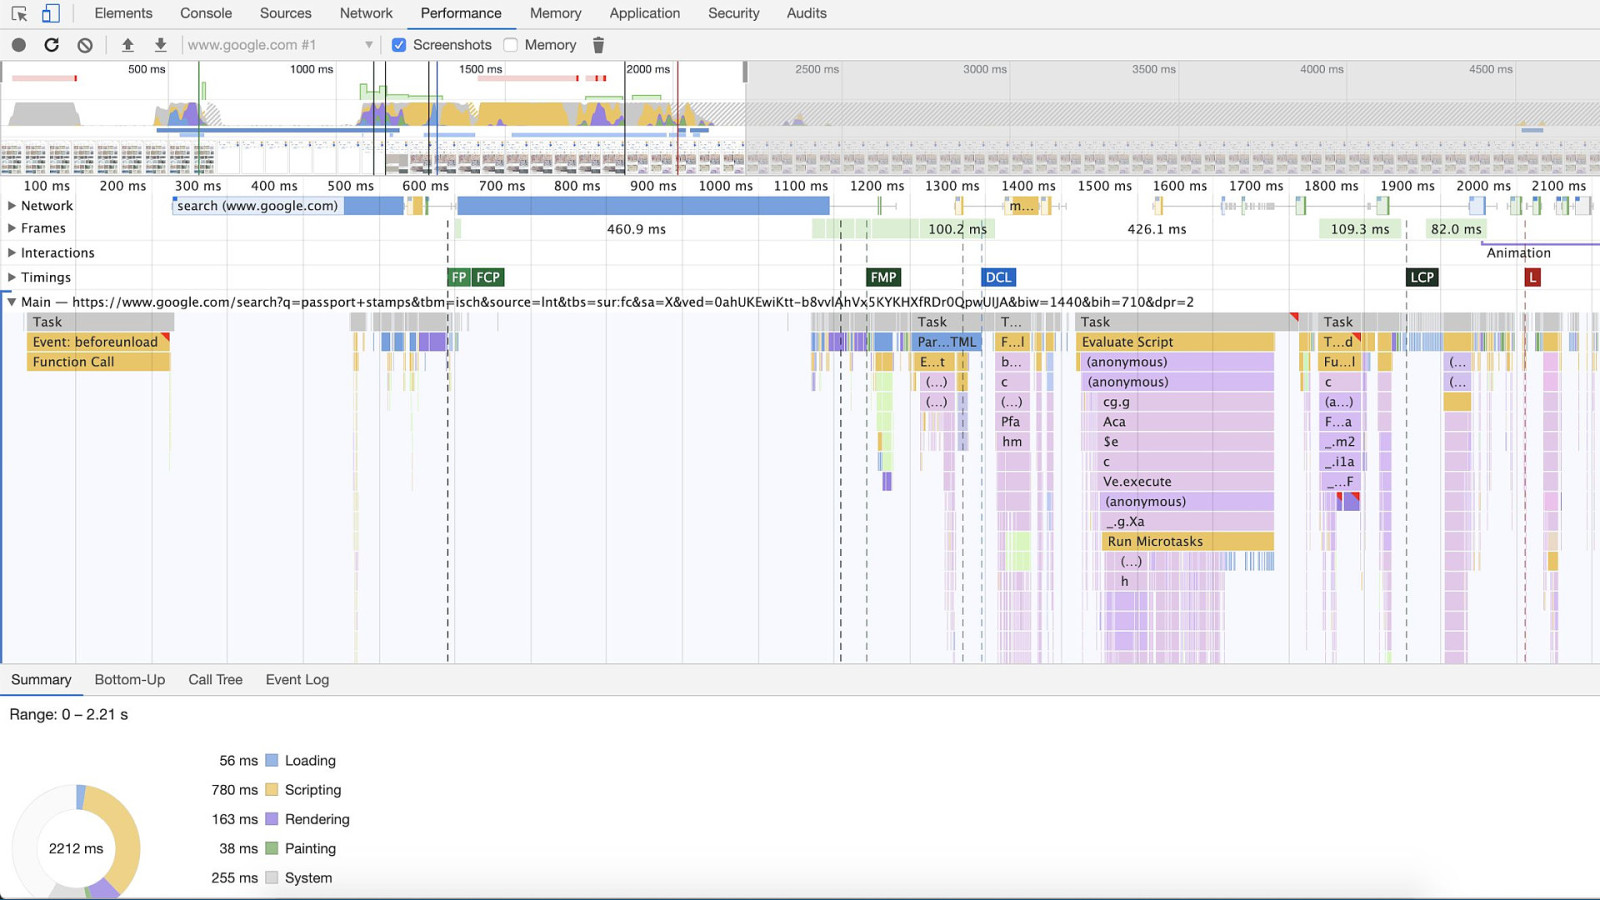
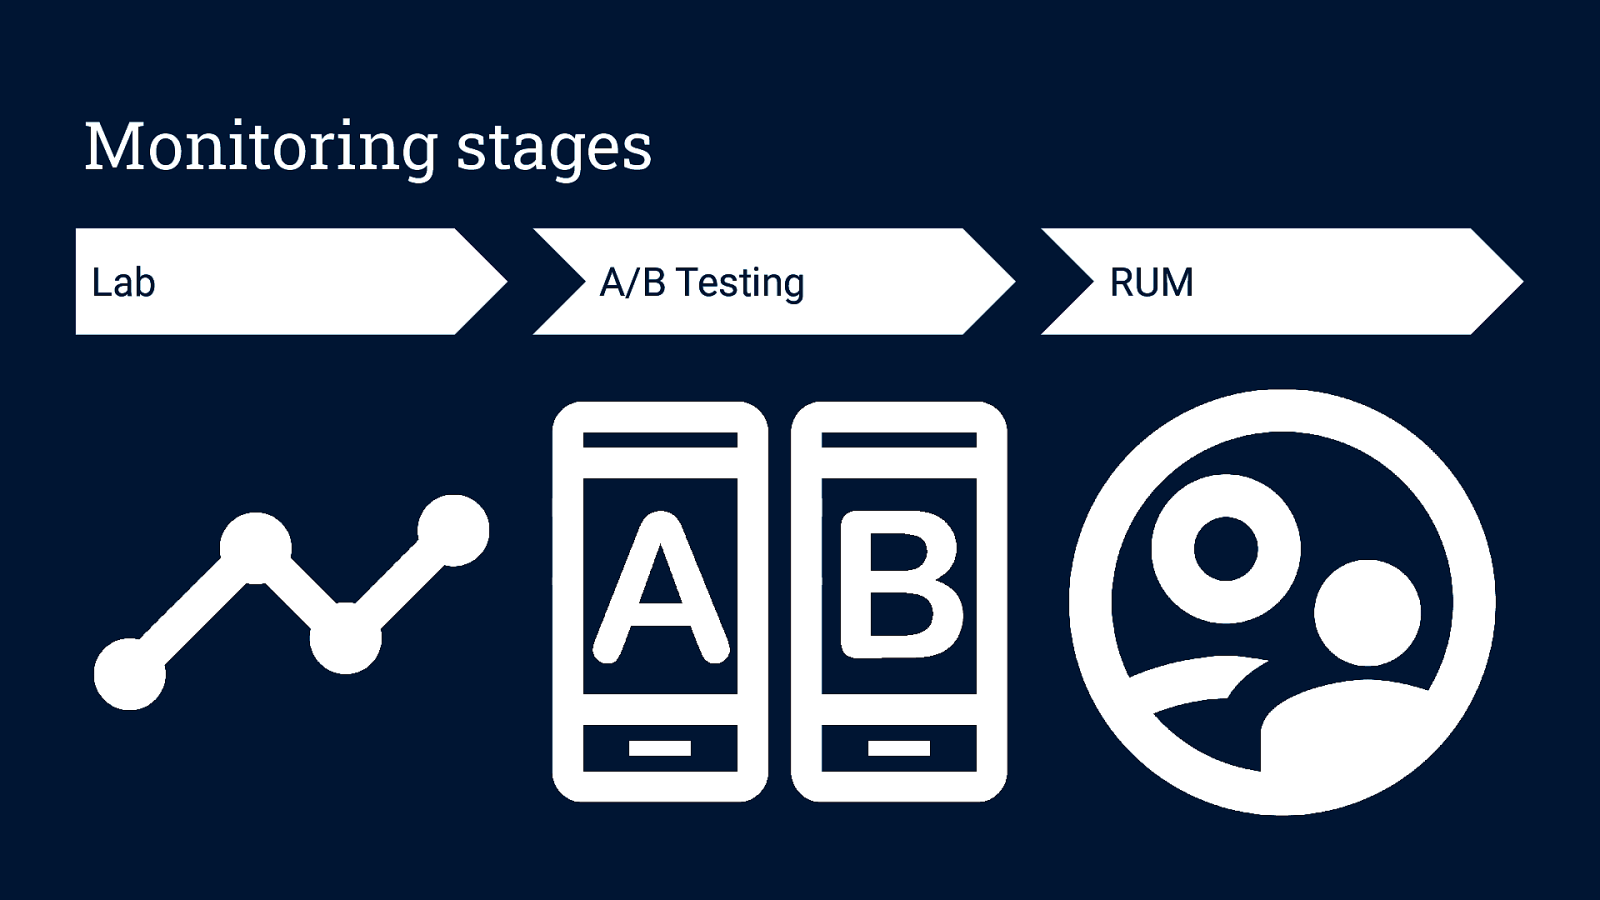
First, in the lab, where we do performance testing before shipping to customers. There’s far less data in the lab than in the real world, so it’s much more important that lab metrics be stable and elastic than field metrics. Let’s take the example of first contentful paint. It’s very simple (first text or image painted on the screen) but it’s not very elastic, since things like shifts in viewport can change the value a lot, and it’s not very stable, since race conditions in which element is painted first can randomize the value. In the field, the large volume of data makes up for this. But in the lab, we can consider alternatives. One alternative Chrome uses is to monitor CPU time to first contentful paint instead of wall time, since it’s more stable and elastic, but it’s clearly less representative of user experience. Another issue to be aware of in the lab is that timing for tests which require user input is quite difficult. Let’s say we wanted to write a performance test for first input delay. A simple approach would be to wait say, 3 seconds and click and element and measure the queueing time. But what happens in practice with a test like that is that work ends up being shifted after our arbitrary 3 second mark so that the benchmark does not regress, because developers assume we have a good reason for wanting an input in the first 3 seconds to be processed quickly. We could randomize the input time, but then the metric will be much less stable. So instead we wrote a metric that computes when the page will likely be interactable. This is Time to Interactive, and it’s what we use in the lab. But FID is much simpler and more accurate for RUM, which is why we have the two metrics.

Slide 10

Slide 10

It is critical that metrics exposed to Web Perf APIs are Representative and Accurate. Web Perf API Broad range of use cases They must be Realtime. It’s more important to be Simple and Interpretable than Stable or Elastic. Clear definitions that can be implemented across engines are important. Web Perf APIs are another use case for performance metrics. Ideally web perf APIs will be standardized across browsers, and used by both web developers and analytics providers to give site owners insight into the performance of their pages. This means that they need to be Representative, Accurate, and Interpretable. They also need to be computed in realtime, so that pages can access the data during the current session. To standardize, we need clear definitions, which means that being Simple is very important. Because there is a higher volume of traffic in the field than is possible in the lab, we can sacrifice some stability and elasticity to meet these goals.

Slide 11

Slide 11

Chrome RUM Understanding Chrome performance in the wild. We care a lot that our internal metrics are Representative and Accurate, but we can iterate on them frequently. We get a very large volume of data, so it’s less important that they are Stable or Elastic. Chrome also has internal real user monitoring. We use this to generate the Chrome User Experience Report, and also to understand Chrome’s performance in the field. While we do want our toplevel metrics to be representative and accurate, we can iterate on them quickly so it’s less important from the start than it is for web perf APIs. The large volume of data we gets makes stability and elasticity less necessary. But of course, metrics need to be computed in real time.

Slide 12

Slide 12

Example: Largest Contentful Paint That’s a lot of properties and use cases! How do we create metrics in practice? Here’s an example of the recent work the team did on largest contentful paint.

Slide 13

Slide 13

Key Moments in Page Load Is it happening? Is it useful? Is it usable?

Slide 14

Slide 14

Goal: When is Main Content Loaded? Is it happening? Is it useful? Is it usable?

Slide 15

Slide 15

Prior work: Speed Index Average time at which visible parts of the page are displayed Speed index is Representative, Accurate, Interpretable, Stable, and Elastic. But it’s not Realtime, which is a requirement for web perf APIs and RUM. And it’s not Simple. Of course, there’s been work in this area already. Speed index is the best known metric for main content painting. And it’s great! It hits almost all the properties, with one very important exception: it’s not realtime. We’ve tried to add it into Chrome multiple times, but we’ve never been able to get it run correctly and consistently.

Slide 16

Slide 16

Prior work: First Meaningful Paint (deprecated) Heuristic: first paint after biggest layout change First Meaningful Paint is Representative, Interpretable, and Realtime. But it produces strange, outlier results in 20% of cases, making it not Accurate. It’s not Simple, or Stable, or Elastic. Another metric in this space is the now-deprecated first meaningful paint. First meaningful paint is not a simple metric. It’s a heuristic; it records the first paint after the biggest layout change on the page. It’s often hard for developers to understand what might be the biggest layout change on the page, and there isn’t a clear explanation for why the first paint after the biggest layout change so often corresponds to the main content being shown. So it’s not a huge surprise that the metric has accuracy problems. In about 20% of cases, it produces outlier results. This is really hard to address.

Slide 17

Slide 17

Main Content Painted Metric Priorities 1. 2. 3. 4. 5. Representative Accurate Realtime Interpretable Simple So we started work on a new metric. And we had a set of goals. Speed index is great in the lab, but we wanted our metric to be available in web perf APIs and RUM contexts. So we wanted to make it realtime, simple, and interpretable, much more than stable and elastic.

Slide 18

Slide 18

We can get paint events in Realtime. Can we make a metric that is Simple and Accurate? We had a building block we thought we’d be able to use—we can get paint events in realtime. Can we use them to make a Simple, Accurate main content metric?

Slide 19

Slide 19

Brainstorm Simple Metrics ● ● ● ● ● ● Largest image paint in viewport Largest text paint in viewport Largest image or text paint in viewport Last image paint in viewport Last text paint in viewport Last image or text paint in viewport… We started off by brainstorming ideas for metrics we could build with paint event. Maybe just when the last text is painted into the viewport? Or when the biggest image is painted?

Slide 20

Slide 20

And Test Them for Accuracy ● ● ● Generate filmstrips for 1000 sites. Look at the filmstrips and the layouts, and what each metric reports for them. Pick the best. We implemented all the variations, and used an internal tool to generate filmstrips and wireframes of paint events for 1000 sites.

Slide 21

Slide 21

And the Winner Is… Largest image or text paint in viewport: Largest Contentful Paint. And we got great results with the largest image OR text paint in the viewport. Hence, Largest Contentful Paint.

Slide 22

Slide 22

Unfortunately, it couldn’t be quite that simple… But there were some gotchas.

Slide 23

Slide 23

What About Splash Screens? Elements that are removed from the DOM are invalidated as candidates for Largest Contentful Paint. First contentful paint (removed) Largest contentful paint Pages with splash screens had very early largest contentful paint time. Invalidating images that are removed from the DOM improved the metric’s accuracy.

Slide 24

Slide 24

What About Background Images? Page background image Background image painted Real largest contentful paint Body background images also caused metric values that were too early. Excluding them improved accuracy.

Slide 25

Slide 25

What is a “Text Paint”? Aggregate to block-level elements containing text nodes or other inline-level text elements children. It also turned out that the “largest text paint” was not as simple to define as just a paint of a text element. In the image below, most people would say the paragraph is the largest text. But it is made up of multiple elements due to links, which you can see in the wireframe at the right. So we aggregate to a block-level element containing text to further improve accuracy.

Slide 26

Slide 26

What About User Actions During Load? Largest Contentful Paint cannot be measured if there is user input. Example: infinite scroll One big problem that was left was pages with infinite scroll. Scroll a little, and more images and text are painted. The value of largest contentful paint just keeps going up as you scroll. We didn’t want to penalize these pages, but there wasn’t a great solution. So largest contentful paint isn’t recorded if there is user input.

Slide 27

Slide 27

Largest Contentful Paint Validating using HttpArchive Speed Index After testing accuracy on over a thousand filmstrips, we further validated by checking how well largest contentful paint correlates with speed index on about 4 million HttpArchive sites. It’s about a 0.83 correlation, which we are really happy with.

Slide 28

Slide 28

Largest Contentful Paint Validating using HttpArchive First Contentful Paint It correlates much less well with First Contentful Paint, which we had also hoped for. Sometimes the largest and first contentful paint for a page are the same, which generally means that it’s painting most of its content at once. But sometimes the largest contentful paint comes a lot later, which means that we’re able to capture more “is the main content visible” in addition to “is the content loading”.

Slide 29

Slide 29

We’d like to work with you! speed-metrics-dev@chromium.org That’s the story of largest contentful paint so far. Looking back, one of the things we think we could have done better is collaborate with the broader web community to design the metric. So if you’re interested in this space, please come talk to me!

Slide 30

Slide 30

Monitoring I’m also really excited to talk through what I’ve learned about monitoring performance over the years.

Slide 31

Slide 31

Monitoring stages Lab A/B Testing RUM I think of performance monitoring in three phases: First, we test in the lab to catch regressions and understand the basics of how the product is performing. Next, when we release a new feature or make a big performance related change, we use A/B testing in the wild to get an understanding of real end-user performance. Lastly, we monitor the performance that end users are seeing in the wild to make sure regressions aren’t slipping through the cracks.

Slide 32

Slide 32

Lab Testing Let’s start with lab testing.

Slide 33

Slide 33

Lab Testing Pros and Cons Good For Limitations Fast iteration Can’t model every user Repeatable results Can’t predict magnitude of changes Debugging Trying things you can’t launch Lab testing is a great place to start monitoring performance. You can catch regressions early, reproduce them locally, and narrow them down to a specific change. But the downside is we can’t model every user in the lab. There are billions of people using the web on all sorts of different devices and networks. So no matter how good our lab testing is, there will always be regressions that slip through the cracks. And we also won’t be able to predict the magnitude of performance changes in the lab alone.

Slide 34

Slide 34

Competing Goals Reproducibility Realism Lab testing usually comes down to two competing goals. First, reproducibility is critical. If the lab test says that there is a performance regression, we need to be able to repeat that test until we can narrow down which change caused the regression and debug the problem. But we also want our tests to be as realistic as possible. If we’re monitoring scenarios that real users will never see, we’re going to waste a lot of time tracking down problems that don’t actually affect users. But realism means noise! Real web pages might do different things on successive loads. Real networks don’t necessarily have consistent bandwidth and ping times. Real devices often run differently when they’re hot.

Slide 35

Slide 35

Benchmark Realism: Real-world Stories Here’s a visual example of that shift to more realistic user stories from the v8 team (this was part of their Google I/O talk a few years back). The colors on the chart are a top level metric, time spent in different components of the v8 engine. At the top of the chart are more traditional synthetic benchmarks: Octane and Speedometer. At the bottom of the are real-world user stories, in this case some of the Alexa top sites. You can see that the metric breakdown looks very different on more realistic user stories. And this has a big impact on real-world performance. If we’re only looking at the synthetic benchmarks, it makes a lot of sense to optimize that pink JavaScript bar at the expense of the yellow Compliation bar. But this would have a negative impact on most of the real sites. We’ve found that measuring a metric on a variety of real user stories is an important source of realism for Chrome lab testing.

Slide 36

Slide 36

Better Reproducibility: Test Environment ● ● ● ● ● Consider real hardware instead of VMs Use exact same model + configuration, or even same device On mobile, ensure devices are cool and charged Turn off all background tasks Reduce randomization ○ ○ ○ Simulate network Mock Math.random(), Date.now(), etc Freeze 3rd party scripts But what about reproducibility? We’ve done a lot of work there, too. First, take a look at the test environment. We find that tests are more reproducible if run on real hardware than VMs. So that’s a good choice if you have the option. But if you run on multiple devices, you need to take care to make each of them as similar as possible to the others, even buying them in the same lot if you can. And for mobile devices in particular, it’s important to keep the temperature consistent. You may need to allow the device time to cool between runs. Background tasks are a big source of noise, so try to turn as many of them off as possible. And think about what else you can make consistent between test runs. Does it make sense to simulate the network? To mock out JavaScript APIs that introduce randomness? To freeze 3rd party scripts?

Slide 37

Slide 37

Better Reproducibility: Diagnostic Metrics ● ● ● ● CPU time Breakdowns Sizes and counts (JS size, number of requests) Background noise Diagnostic metrics can also be really useful for reproducibility. For instance, I mentioned earlier that we track CPU time to first contentful paint in Chrome in addition to just wall time. We also track breakdowns of top level metrics, so we can see which part changed the most when they regress. And back to the fact that you should disable background processes. You can also track a diagnostic metric that just captures what processes were running on the machine when the test ran. When you get a noisy result, check the processes that were running to see if maybe there’s something you should kill.

Slide 38

Slide 38

Better Reproducibility: Reference Runs Consider a reference run with a pinned version, to find sources of noise outside the test case. We also graph what we call reference builds, which are pinned builds of Chrome. In this chart, the yellow line is tip of tree and the green line is a pinned reference version. When they both regress at the same time, you can tell that it’s likely a change in the metric or test environment, and not the performance of tip of tree.

Slide 39

Slide 39

Better Reproducibility: Change Detection How you detect a change in performance can also have a big impact on your ability to reproduce performance regressions.

Slide 40

Slide 40

Comparing Two Versions How do you know if it’s just noise? B A It’s also important to be able to compare two versions. We can do this to check fixes for regressions, try out ideas that can’t be checked in, or narrow down a regression range on a timeline. You could even imagine throwing the timeline out altogether and blocking changes from being submitted if they regress performance. But to do that, you need to know if the difference between A and B here is a performance regression, or just noise.

Slide 41

Slide 41

Add more data points! But how do you compare them? B A The first thing to do is to add more data points. But then how do you compare them? Taking the averages has a smoothing effect, so you might miss regressions. You could try taking the medians, and I’ve even heard people say that the lowest values might be the best to compare, since those are probably the runs that had the least noise.

Slide 42

Slide 42

Each Group of Runs is a Set of Samples Use a hypothesis test to see if the sets are from different. Note that performance test results are usually not normally distributed. Recommend looking into Mann-Whitney U, Kolmogorov-Smirnov, and Anderson-Darling. But really each group of runs is a set of samples. What we want to know is whether those samples are from the same distribution. We can use a hypothesis test to see if they’re from different distributions. One thing to note with this approach is that performance data is almost never normally distributed. It often has a long tail, or is bimodal. So the t test isn’t a good hypothesis test to use. There are lots of alternatives though.

Slide 43

Slide 43

A/B Testing After lab testing, the next phase is A/B testing.

Slide 44

Slide 44

A/B Testing Pros and Cons Good For Limitations Predicting real-world effect of performance optimizations Can’t A/B test every change Understanding potential regressions from new features Many concurrent A/B tests can be hard to manage A/B testing is great for understanding real world performance impacts, both of optimizations, and of regressions caused by new features. The big downside is that it’s hard to A/B test every single change.

Slide 45

Slide 45

Should be “Controlled Experimentation” One control group Any number of variations And really, an A/B test should be called a controlled experiment. You really want to compare a control group to potential variations.

Slide 46

Slide 46

User opt-in is not a controlled experiment You DON’T want to do an experiment without a control group. And that’s why user opt-in isn’t a good replacement for A/B testing—the group that opted in is often different from the control group somehow. An example that always sticks out to me is from about 10 years ago. I used to work on Google Docs, and before SSL was everywhere we had an option to turn it on by default. My director wanted to know the performance cost of turning it on everywhere, so he asked me how much slower performance was for users who opted in. And… it was 250ms FASTER, despite having to do the extra handshake. We thought it was because the group of users that opted in were some of our most tech savvy users, who also opted in to expensive hardware and faster network connections.

Slide 47

Slide 47

Best practices for experiment groups ● ● ● Use equal-sized control and experiment groups Compare groups on same version before experiment Options for getting more data ○ ○ Run over a longer time period Increase group size So what is a controlled experiment? You should use equal-size, randomly chosen control and experiment groups. Choose the groups before running the experiment, and allow what we call a preperiod, where you see if there are diffrences between the groups before the experiment starts. If you don’t have enough data, you have a few options. Either increase the size of experiment groups, or run it for longer.

Slide 48

Slide 48

Real User Monitoring Lastly, there is real user monitoring.

Slide 49

Slide 49

RUM Pros and Cons Good For Limitations Ground truth about user experience Hard to reproduce and debug By the time a regression is detected, real users are already experiencing it Real user monitoring is the only ground truth about end user experience. You need RUM to know for sure if performance regressions are getting to end users, and if performance improvements are having an impact. But the downside to RUM data is that it’s really, really hard to understand.

Slide 50

Slide 50

Why is understanding RUM data so hard?

Slide 51

Slide 51

Reasons your RUM metric is doing something you don’t understand ● ● ● ● Diversity of user base Mix shifts Things out of your control—patch Tuesday type updates Changes in metric definition

Slide 52

Slide 52

What can you do about it?

Slide 53

Slide 53

What to monitor ● ● Use percentiles Monitor median and a high percentile First, a recommendation on what to monitor. It’s simplest to use percentiles instead of averages or composites. The median user experience should be great. And you should also monitor a high percentile, to understand the worst user experiences as well.

Slide 54

Slide 54

Checking for Mix Shift ● ● First check for volume change Try splitting ○ ○ ○ By county By platform By device type The first thing to do when digging into a performance change is to look at the volume. If there is a big change in the number of users at the same time as a change in performance, it’s often mix shift of some sort, and not a change to the product’s performance. Another thing to do when looking at RUM data is to split it—by country, by operating system, by device type—you’ll often get a clearer picture of the conditions a regression happened under, and whether it was due to a mix shift of one of those things.

Slide 55

Slide 55

Metric Breakdowns Think in terms of traces, not events.

Slide 56

Slide 56

Make RUM more like A/B Testing Launch new features via A/B test Canary launches Use a holdback But that’s still really hard! Let’s say you do all that and you narrow down a date range at which a regression occurred. You still don’t have a lot to go on. Ideally you could have found the regression earlier. You can do that by A/B testing more aggressively. You can also check performance numbers as a release is canaried to users. Another thing to try after the fact is a holdback, where users are randomly served the old version. That can help narrow whether a version change was responsible for a regression.

Slide 57

Slide 57

Takeaways ● ● ● Metrics are hard, but you can help! speed-metrics-dev@chromium.org Focus on user experience metrics Use lab for quick iteration, A/B testing for deeper understanding

Slide 58

Slide 58

Thanks! @anniesullie http://bit.ly/monitoring-and-metrics-in-chrome