Elastic Stack Data Ingestion & Visualizations Aravind Putrevu Developer | Evangelist @aravindputrevu | aravindputrevu.in 1

A presentation at DigitalOcean Webinar Series in October 2018 in by Aravind Putrevu
Elastic Stack Data Ingestion & Visualizations Aravind Putrevu Developer | Evangelist @aravindputrevu | aravindputrevu.in 1
Agenda 2 1 The Ingest Story 2 Logstash: Only for Logs? 3 Configuring and Managing Logstash 4 Visualizing Data Ingested in Kibana 5 Demo
Agenda 3 1 The Ingest Story 2 Logstash: Only for Logs? 3 Configuring and Managing Logstash 4 Visualizing Data Ingested in Kibana 5 Demo
Agenda 4 1 The Ingest Story 2 Logstash: Only for Logs? 3 Configuring and Managing Logstash 4 Visualizing Data Ingested in Kibana 5 Demo
Agenda 5 1 The Ingest Story 2 Logstash: Only for Logs? 3 Configuring and Managing Logstash 4 Visualizing Data Ingested in Kibana 5 Demo
Agenda 6 1 The Ingest Story 2 Logstash: Only for Logs? 3 Configuring and Managing Logstash 4 Visualizing Data Ingested in Kibana 5 Demo
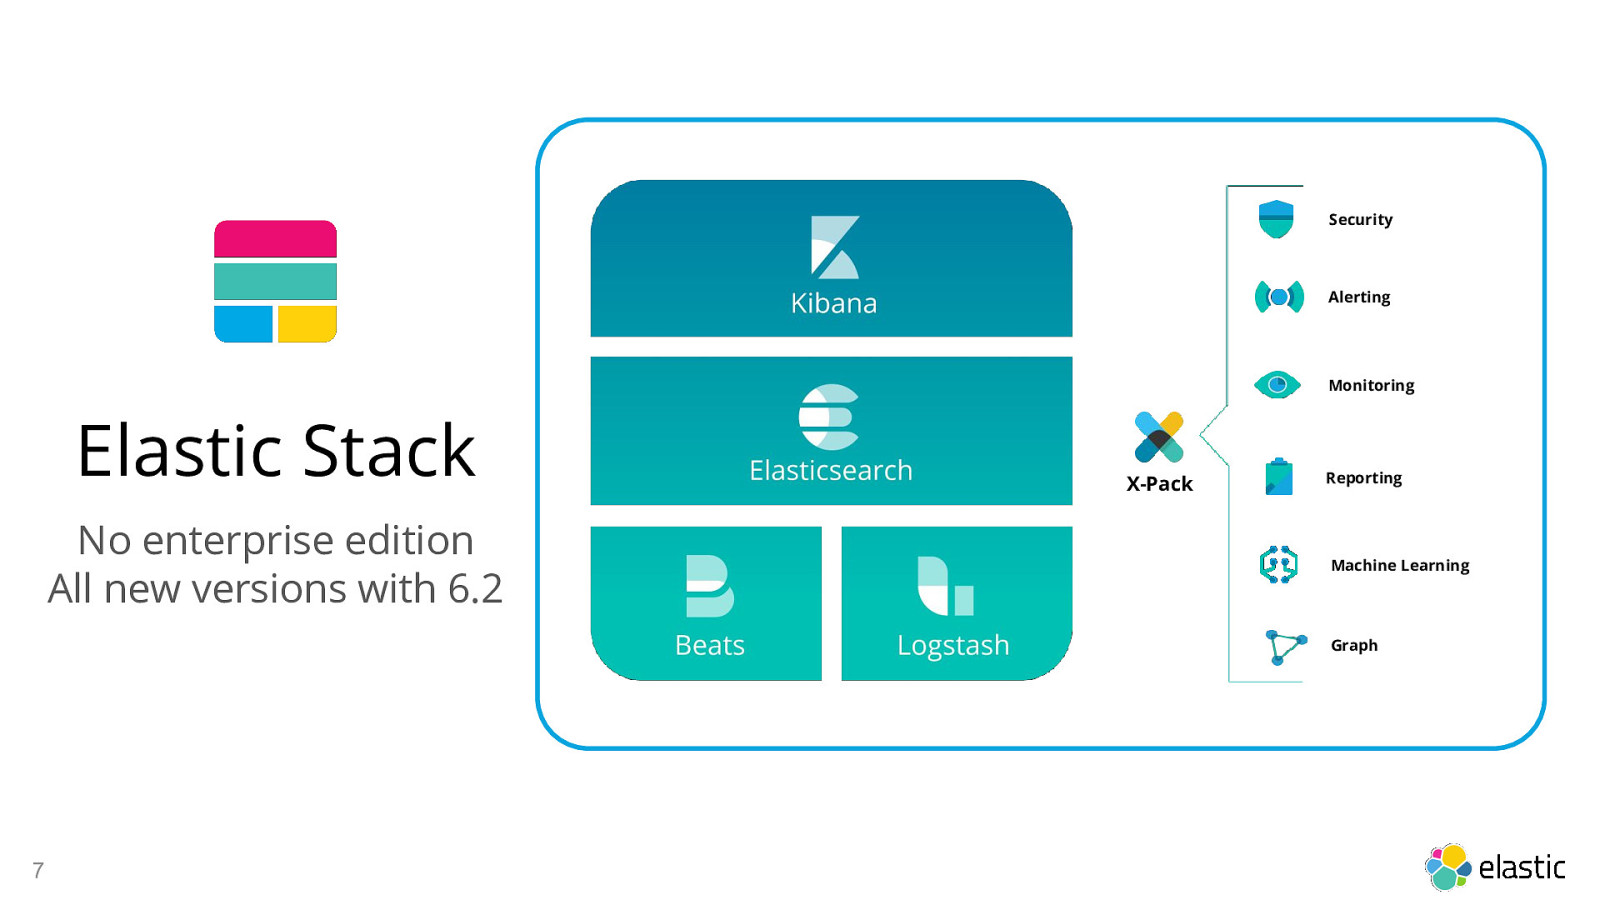
Security Alerting Monitoring Elastic Stack No enterprise edition All new versions with 6.2 X-Pack Reporting Machine Learning Graph 7
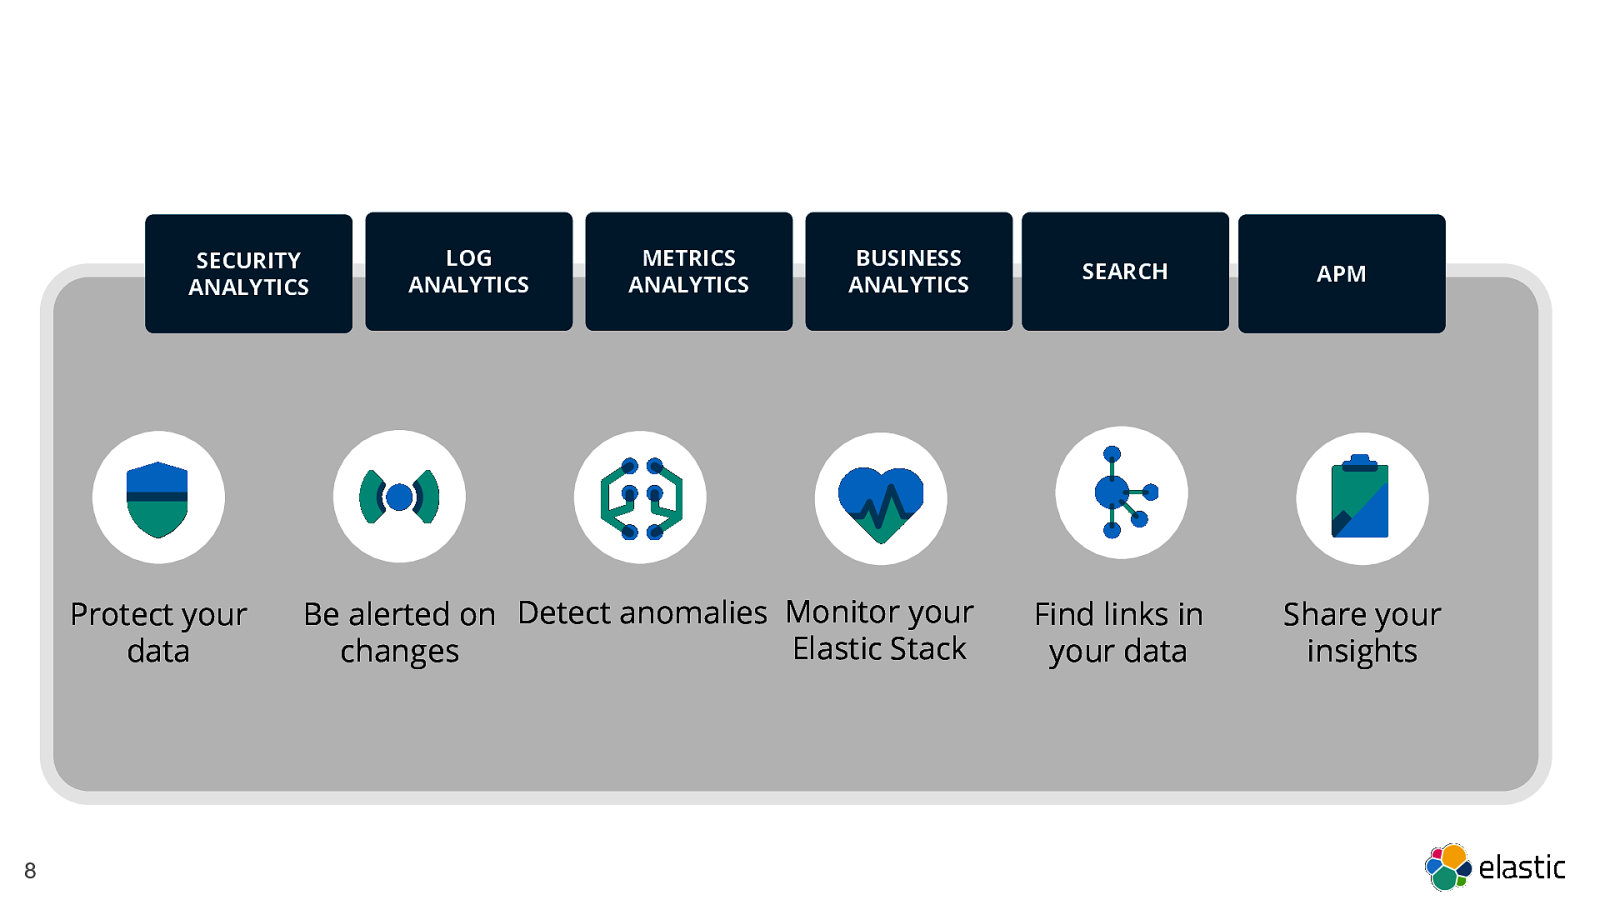
SECURITY ANALYTICS
LOG ANALYTICS
METRICS ANALYTICS
BUSINESS ANALYTICS
SEARCH
APM
Protect your data
8
Be alerted on Detect anomalies Monitor your Elastic Stack changes
Find links in your data
Share your insights
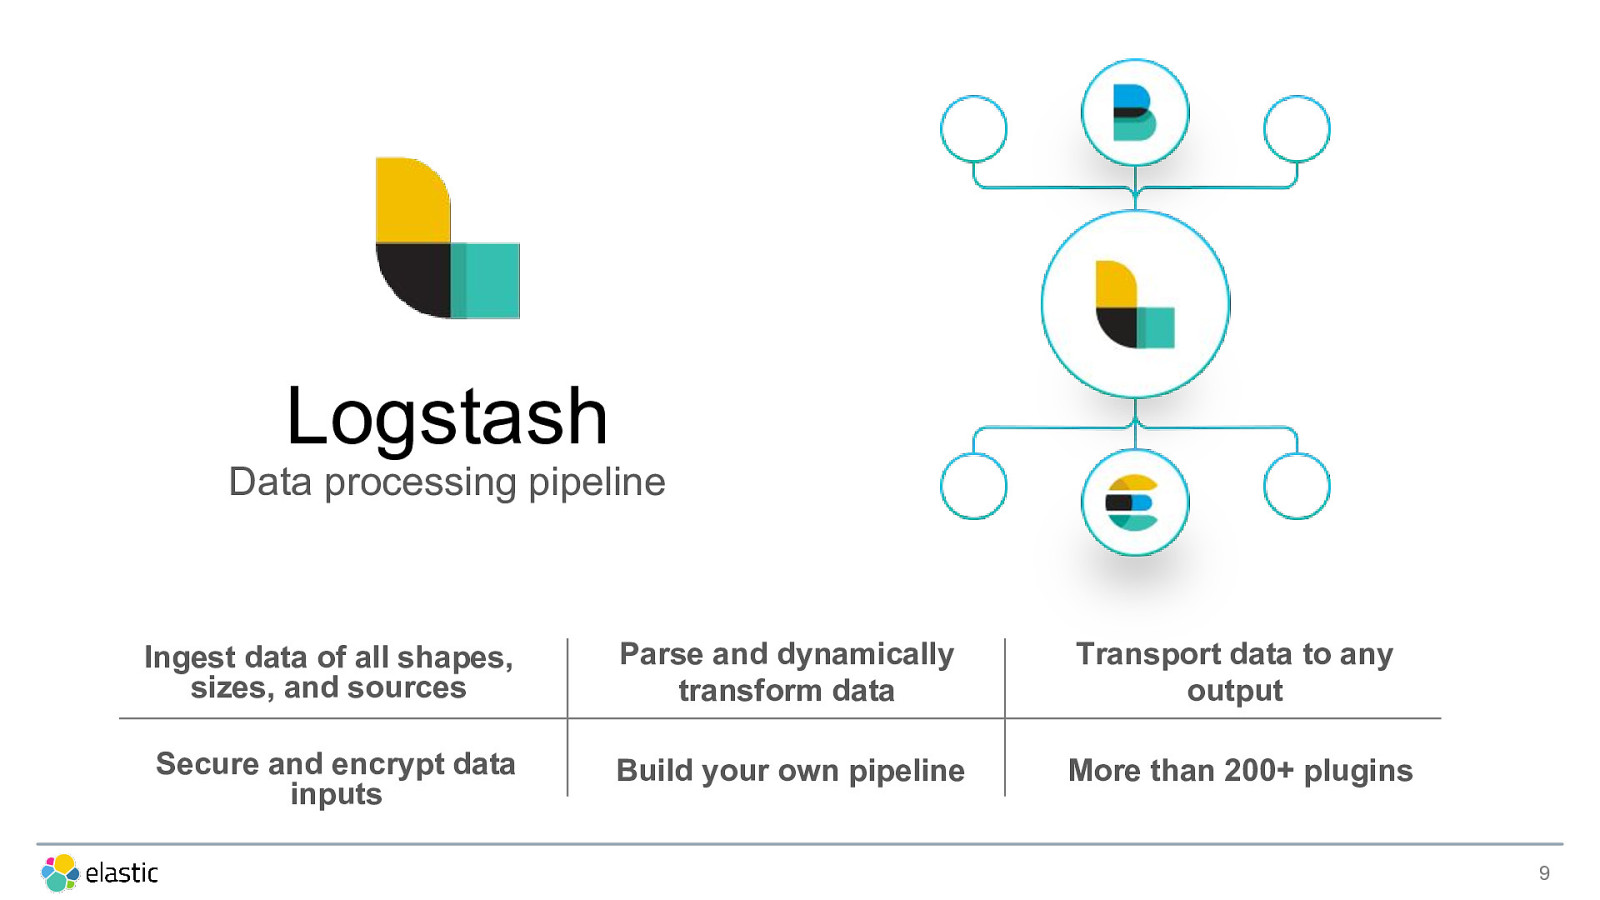
Logstash Data processing pipeline Ingest data of all shapes, sizes, and sources Parse and dynamically transform data Transport data to any output Secure and encrypt data inputs Build your own pipeline More than 200+ plugins 9
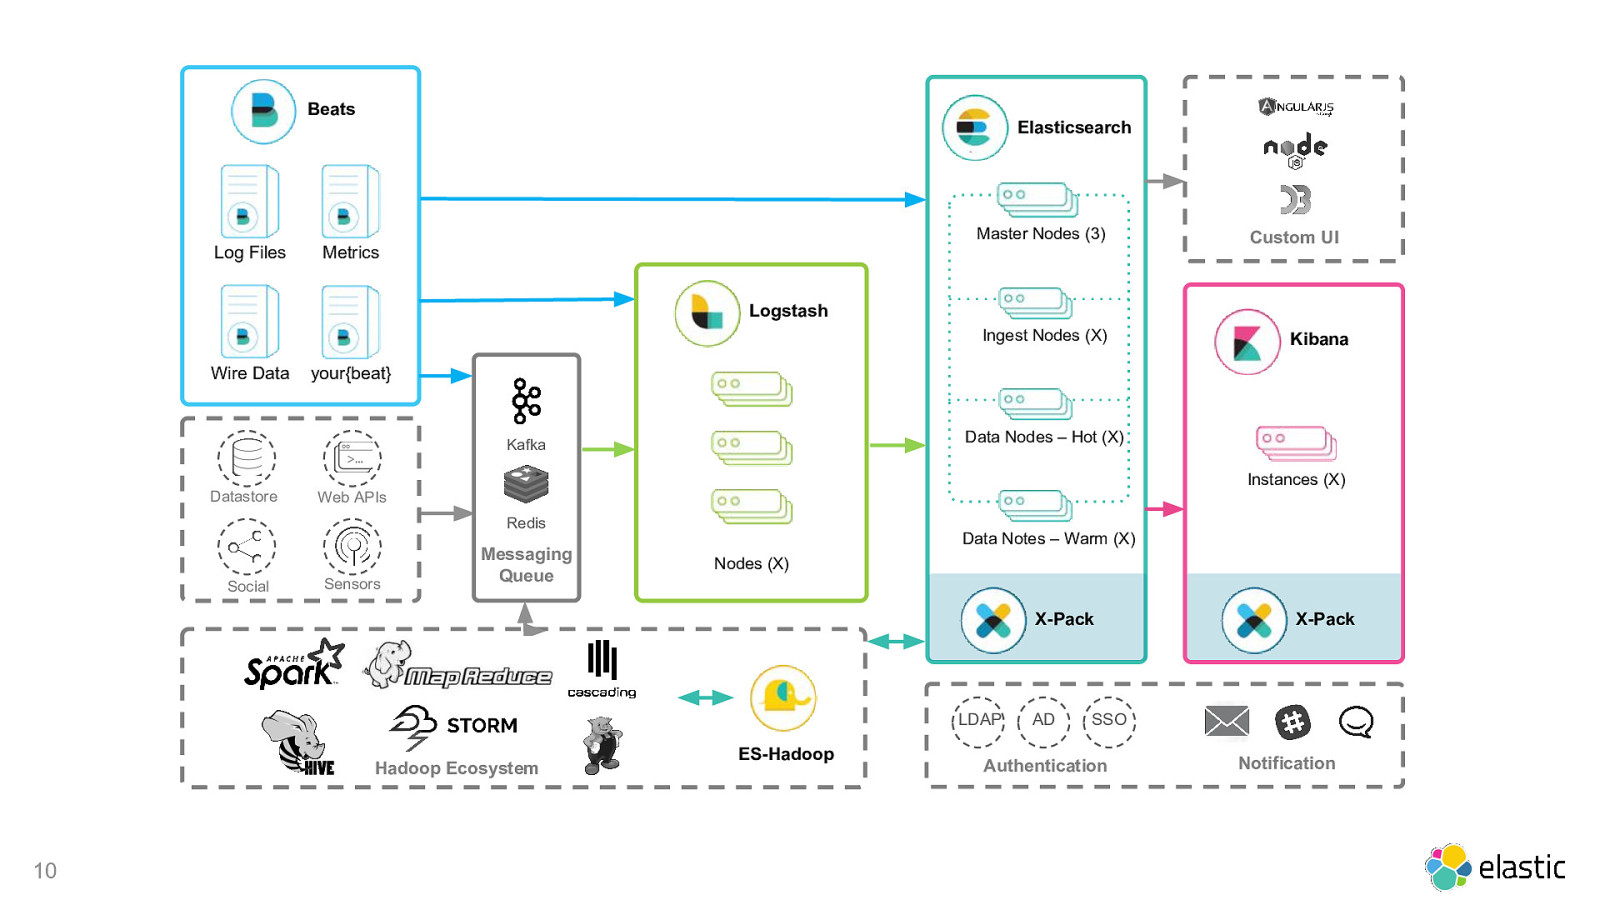
Beats Elasticsearch Master Nodes (3) Log Files Metrics Custom UI Logstash Ingest Nodes (X) Wire Data Kibana your{beat} Data Nodes – Hot (X) Kafka Instances (X) Datastore Web APIs Redis Social Sensors Messaging Queue Data Notes – Warm (X) Nodes (X) X-Pack LDAP Hadoop Ecosystem 10 ES-Hadoop AD X-Pack SSO Authentication Notification
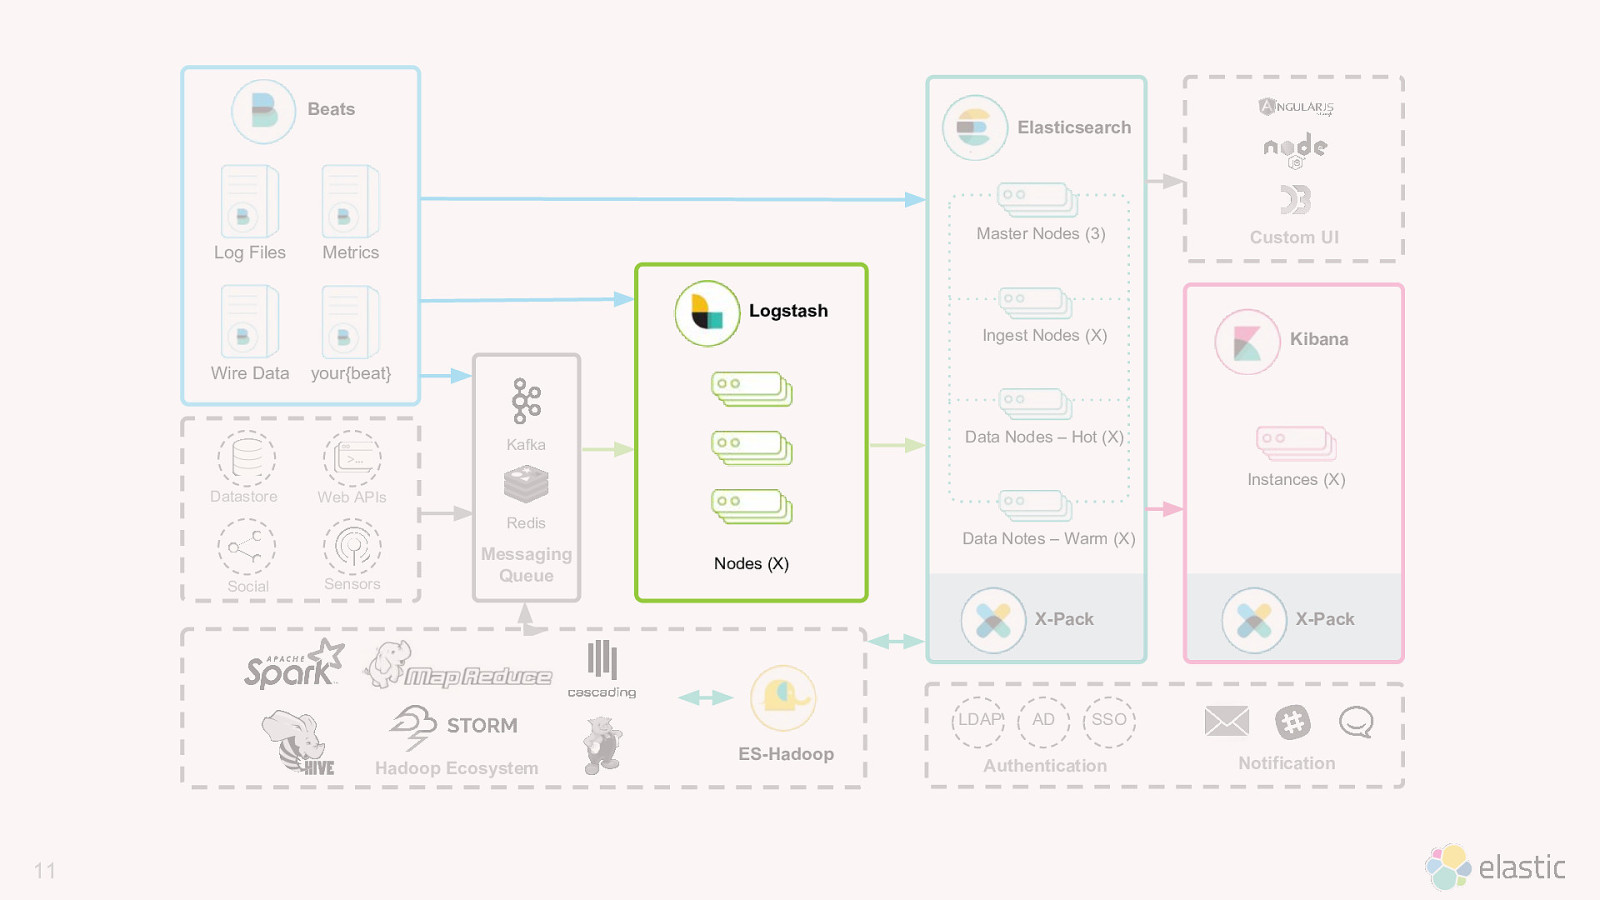
Beats Elasticsearch Master Nodes (3) Log Files Metrics Custom UI Logstash Ingest Nodes (X) Wire Data Kibana your{beat} Data Nodes – Hot (X) Kafka Instances (X) Datastore Web APIs Redis Social Sensors Messaging Queue Data Notes – Warm (X) Nodes (X) X-Pack LDAP Hadoop Ecosystem 11 ES-Hadoop AD X-Pack SSO Authentication Notification
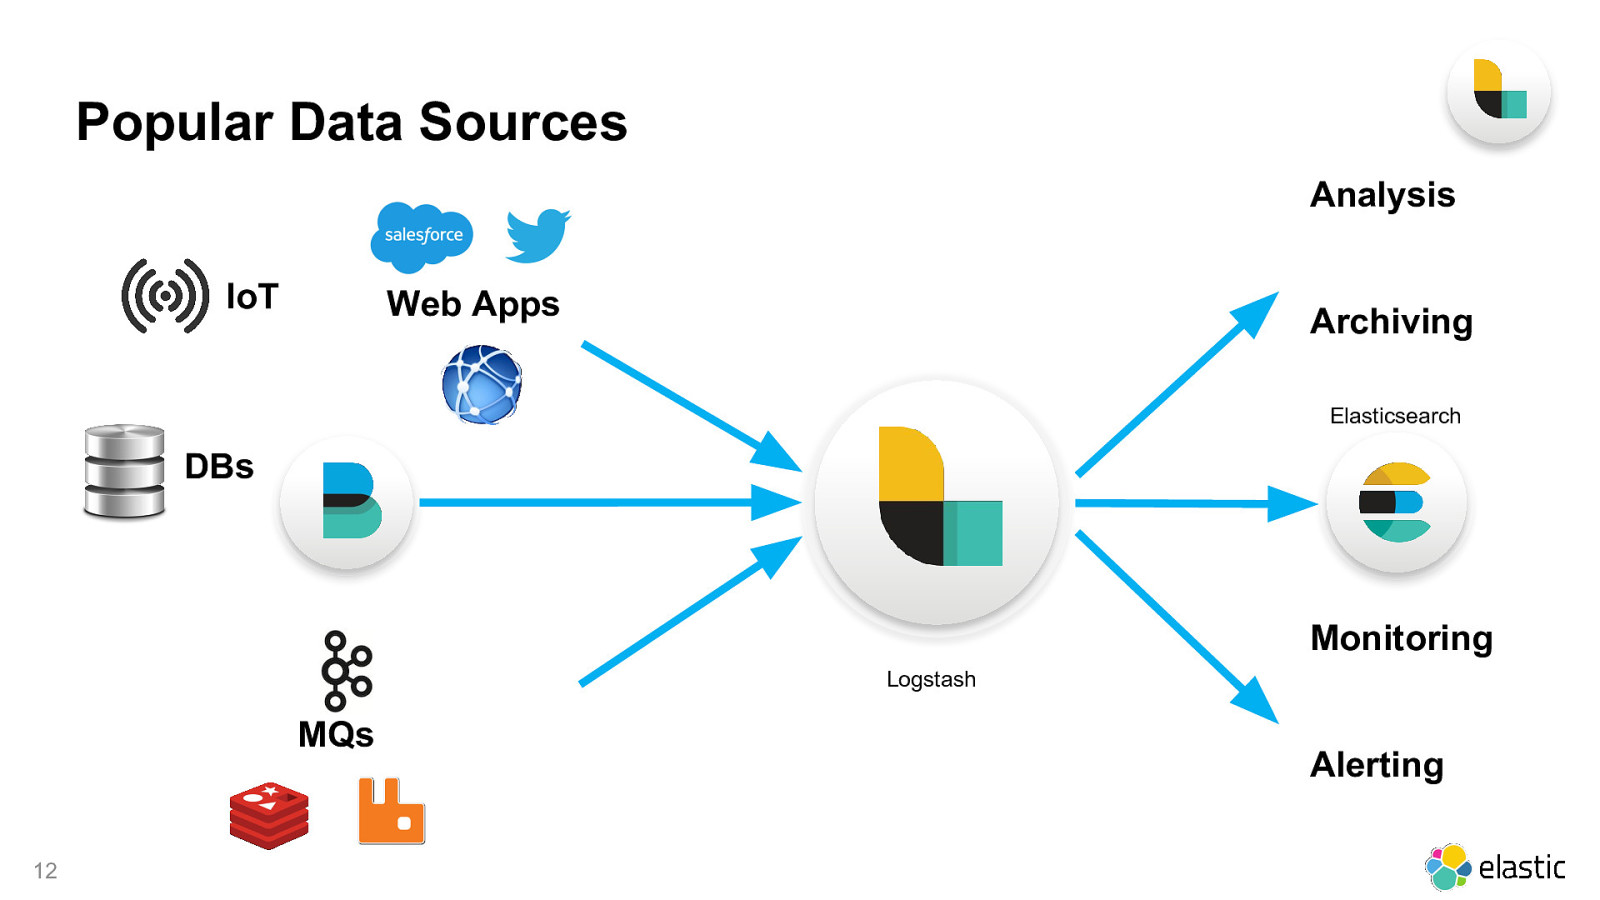
Popular Data Sources Analysis IoT Web Apps Archiving Elasticsearch DBs Monitoring Logstash MQs 12 Alerting
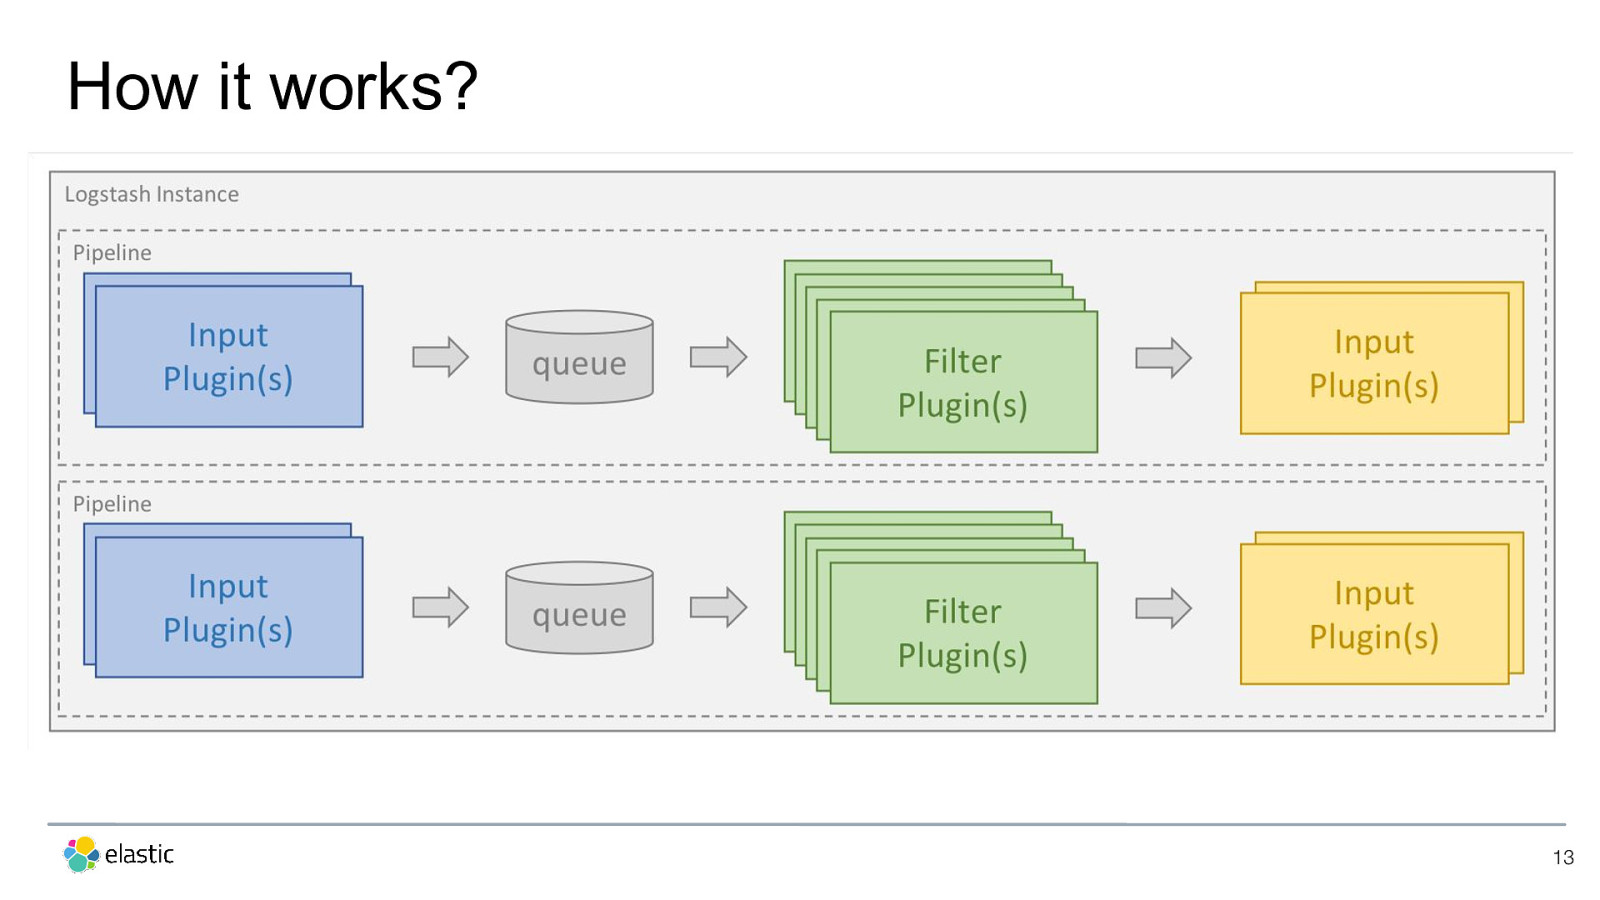
How it works? 13
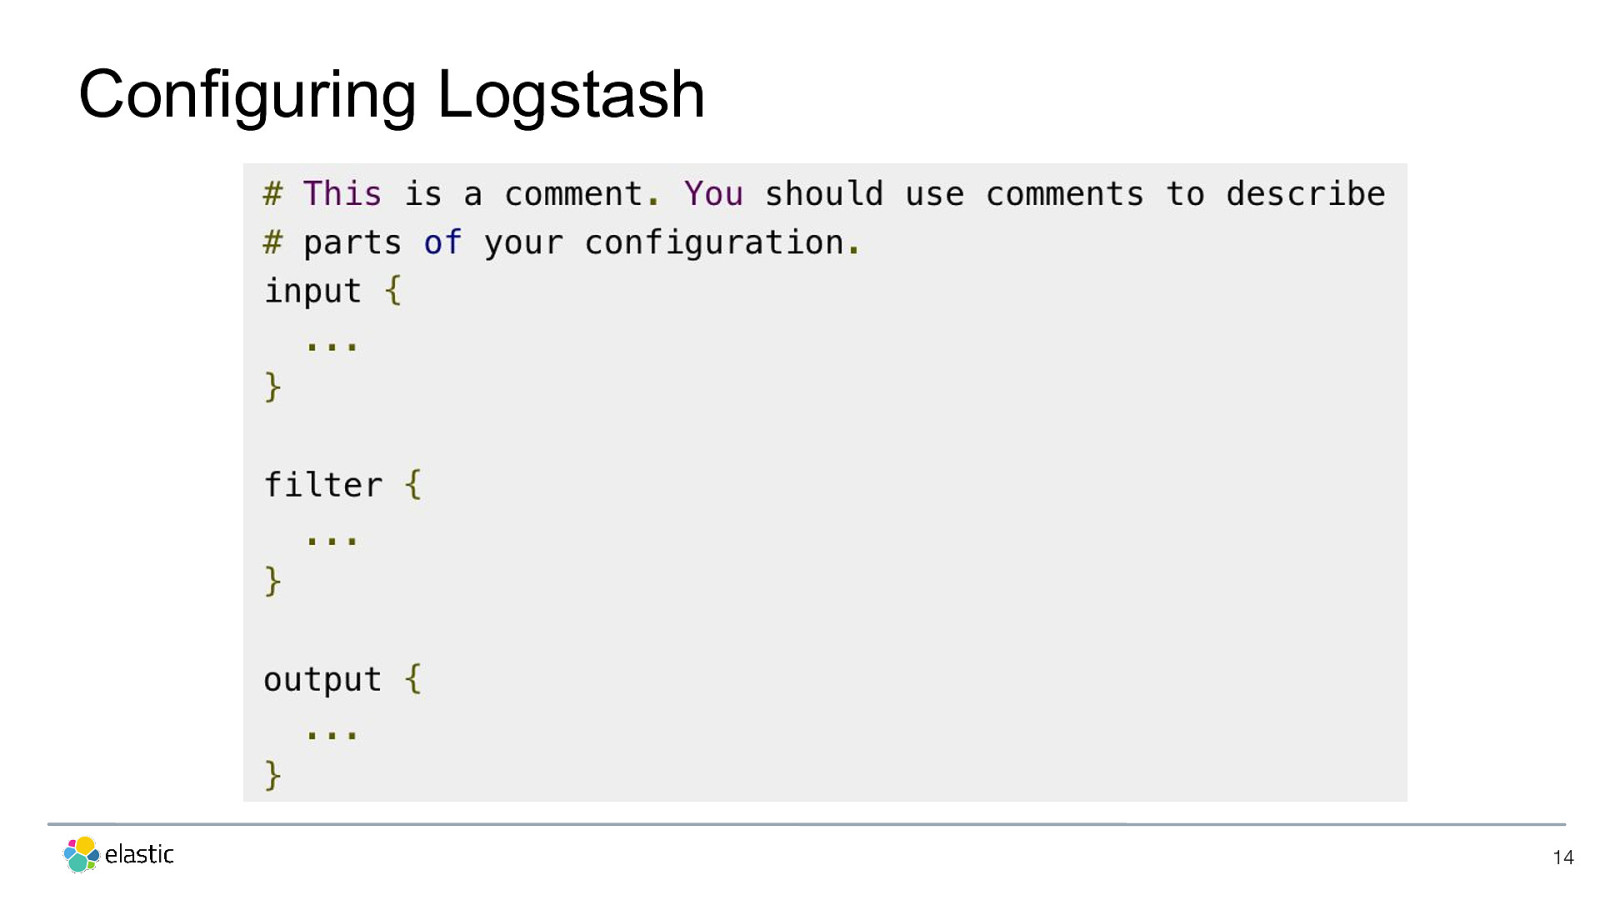
Configuring Logstash 14
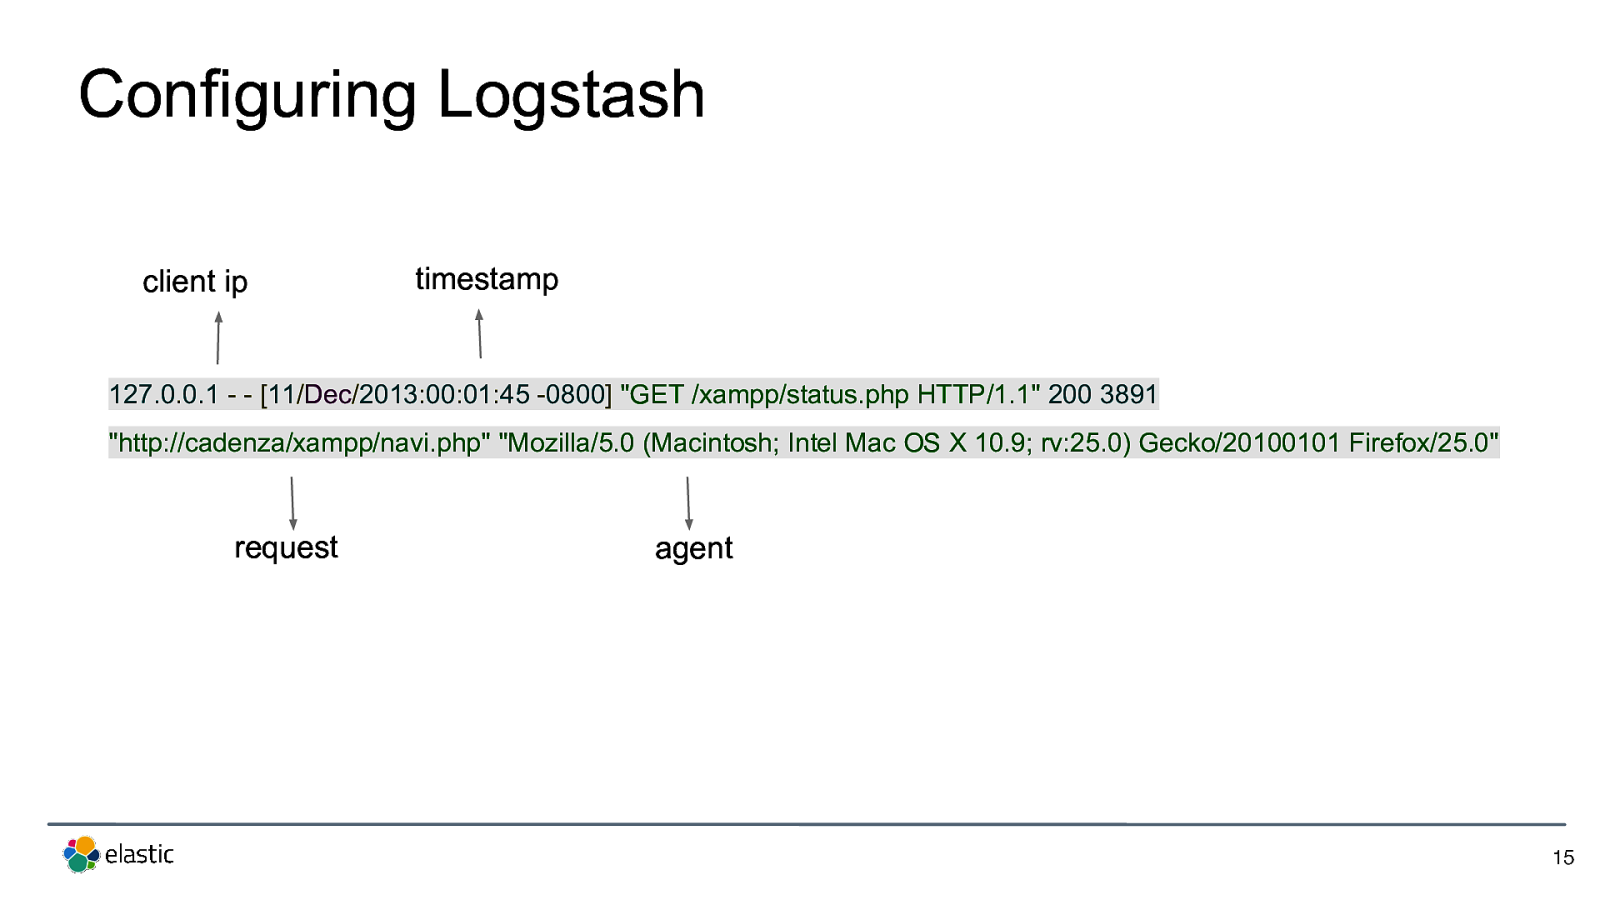
Configuring Logstash client ip timestamp 127.0.0.1 - - [11/Dec/2013:00:01:45 -0800] "GET /xampp/status.php HTTP/1.1" 200 3891 "http://cadenza/xampp/navi.php" "Mozilla/5.0 (Macintosh; Intel Mac OS X 10.9; rv:25.0) Gecko/20100101 Firefox/25.0" request agent 15
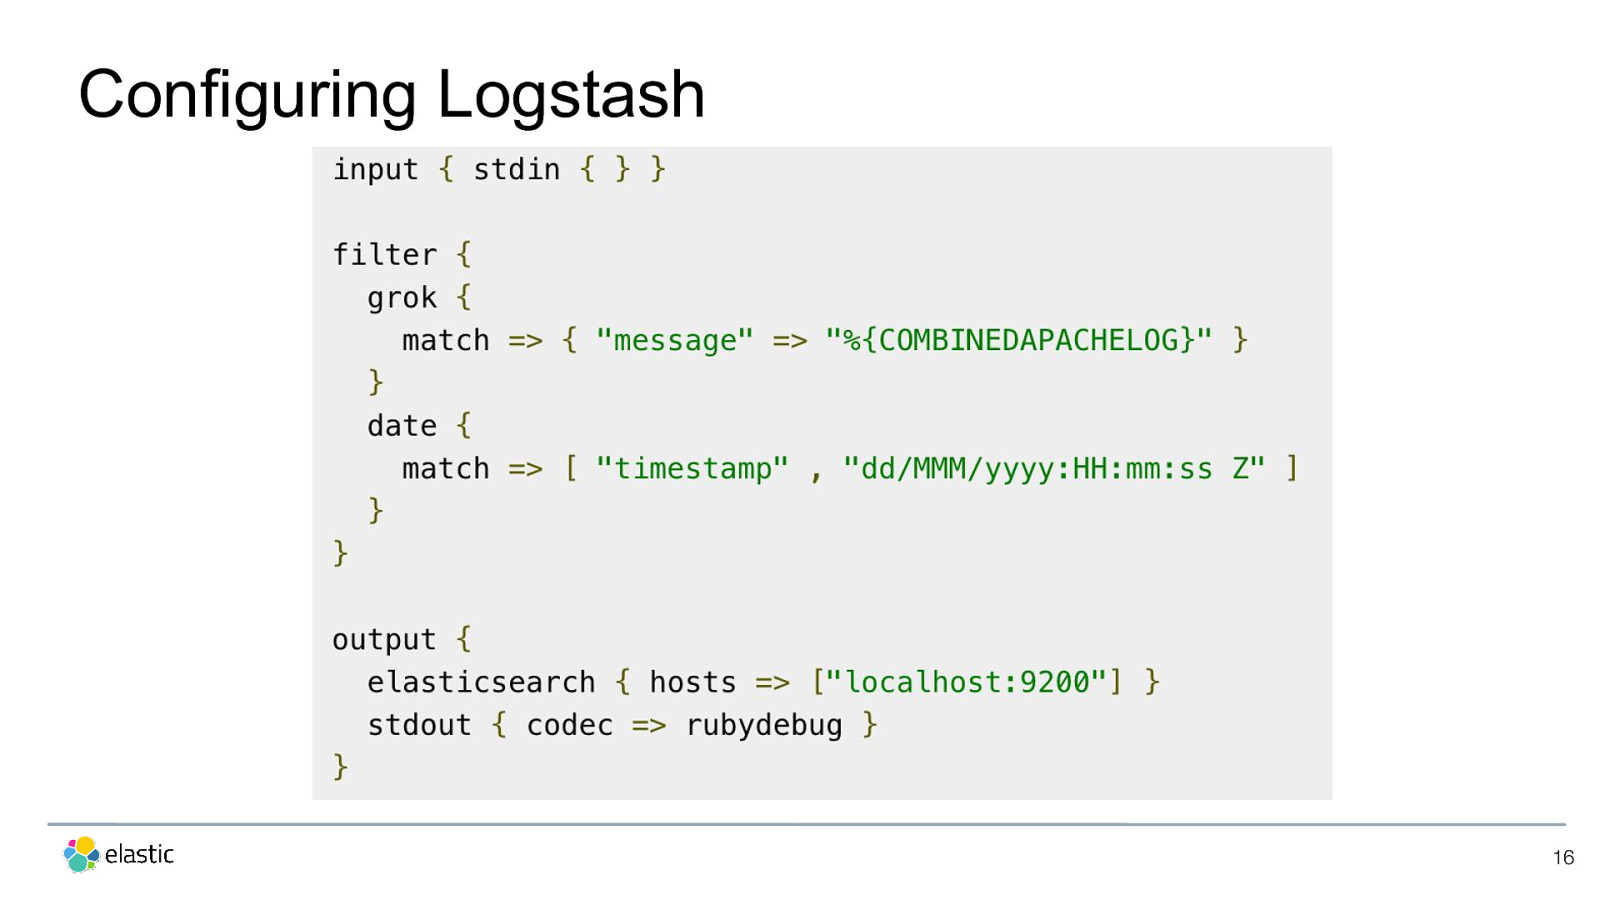
Configuring Logstash 16
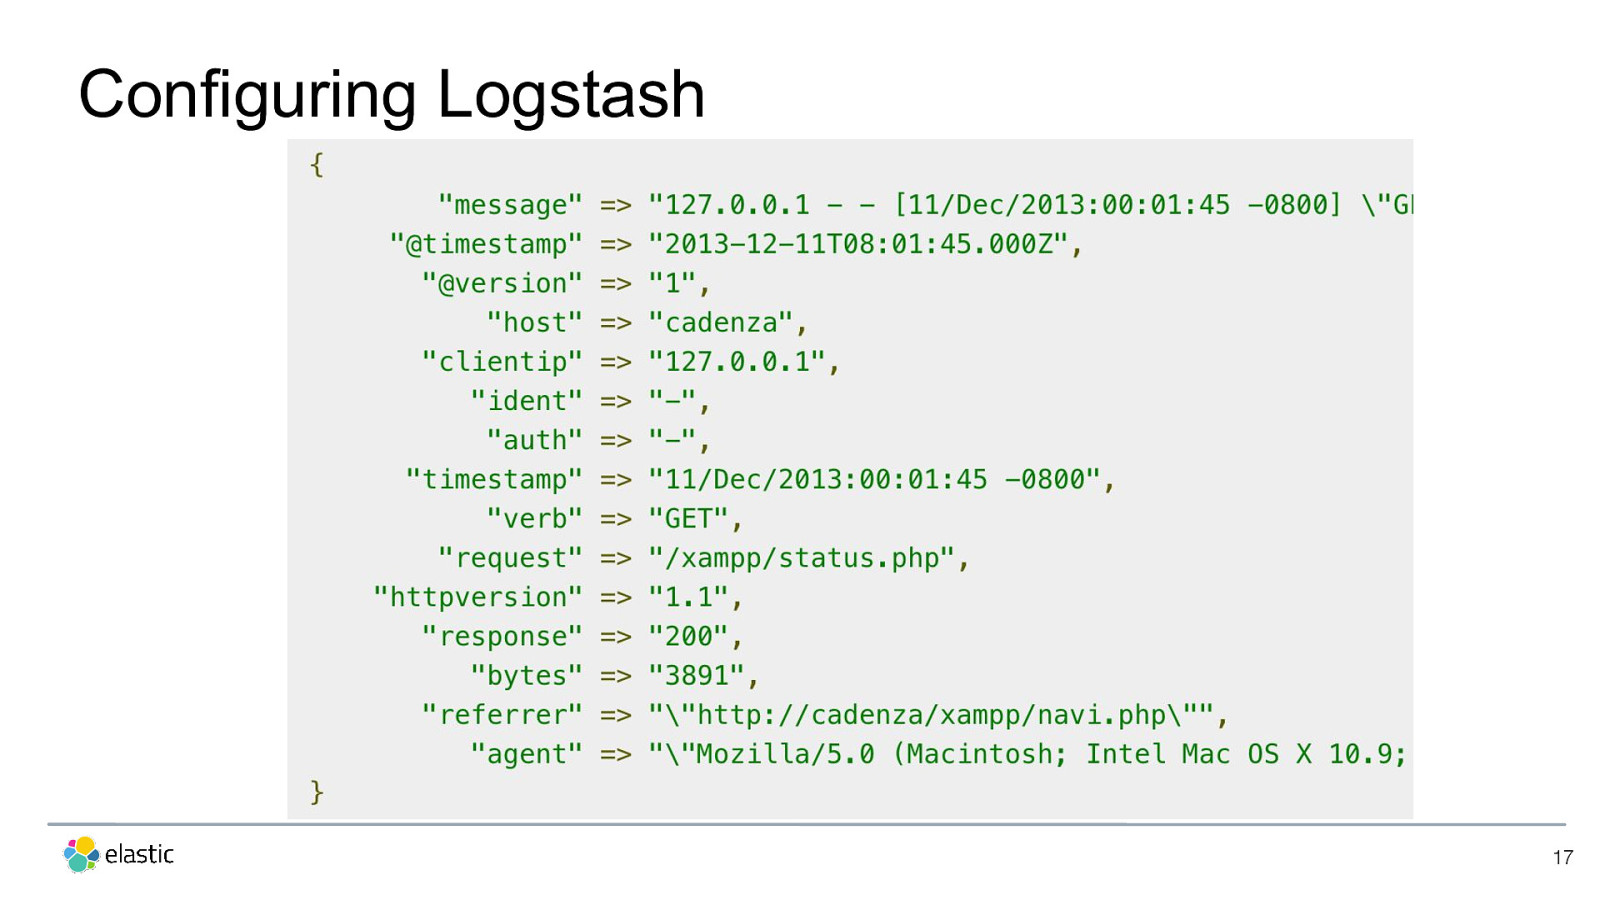
Configuring Logstash 17
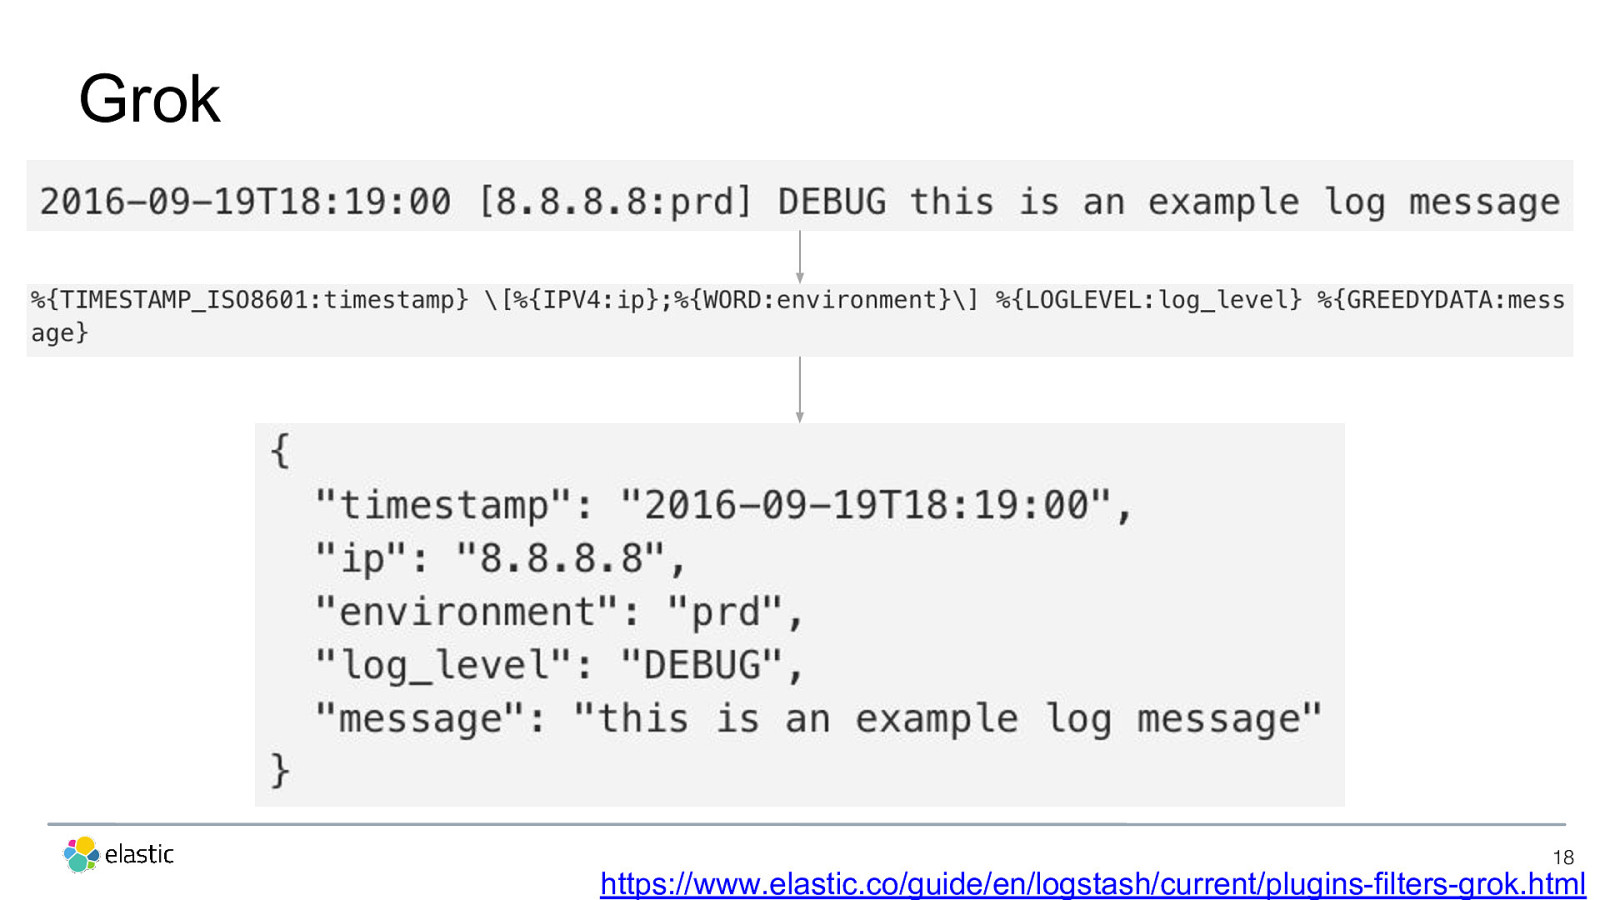
Grok 18 https://www.elastic.co/guide/en/logstash/current/plugins-filters-grok.html
Best Practices for Grok • Grok may not perform well when a match fails • Monitor the occurrence of _grokparsefailures and then benchmark their cost • Use anchors such as ^ and $ to remove ambiguity and aid the regex engine • Tiered matching increases performance if you don’t use anchors, otherwise don’t bother. When in doubt, measure! • Use Monitoring or Metrics API. 19 https://www.elastic.co/guide/en/logstash/current/plugins-filters-grok.html
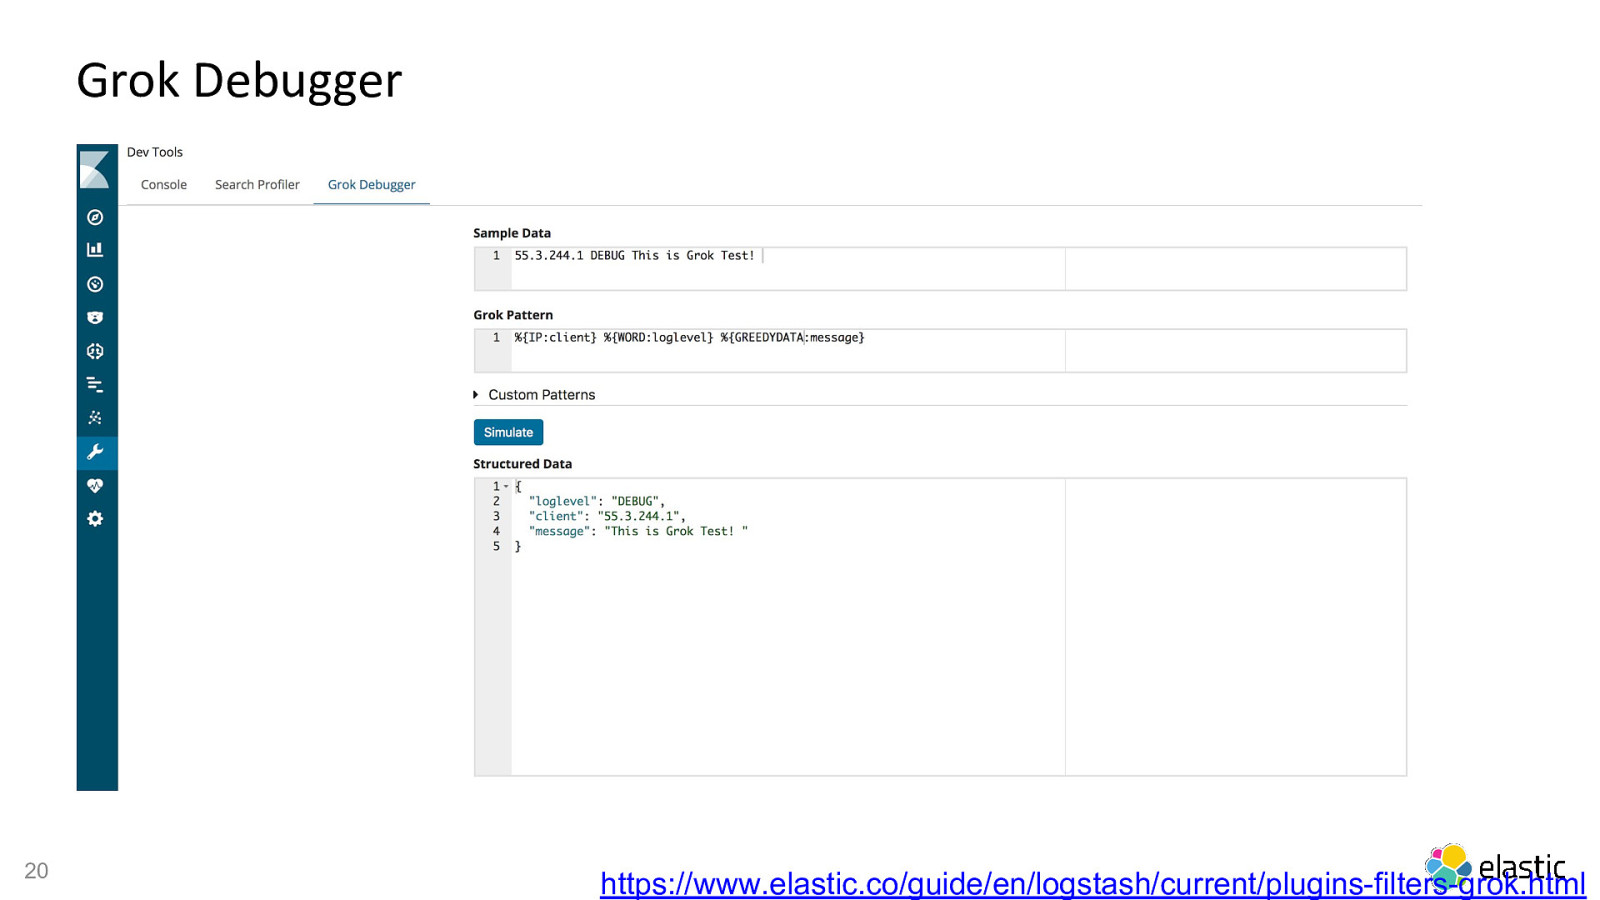
Grok Debugger 20 https://www.elastic.co/guide/en/logstash/current/plugins-filters-grok.html
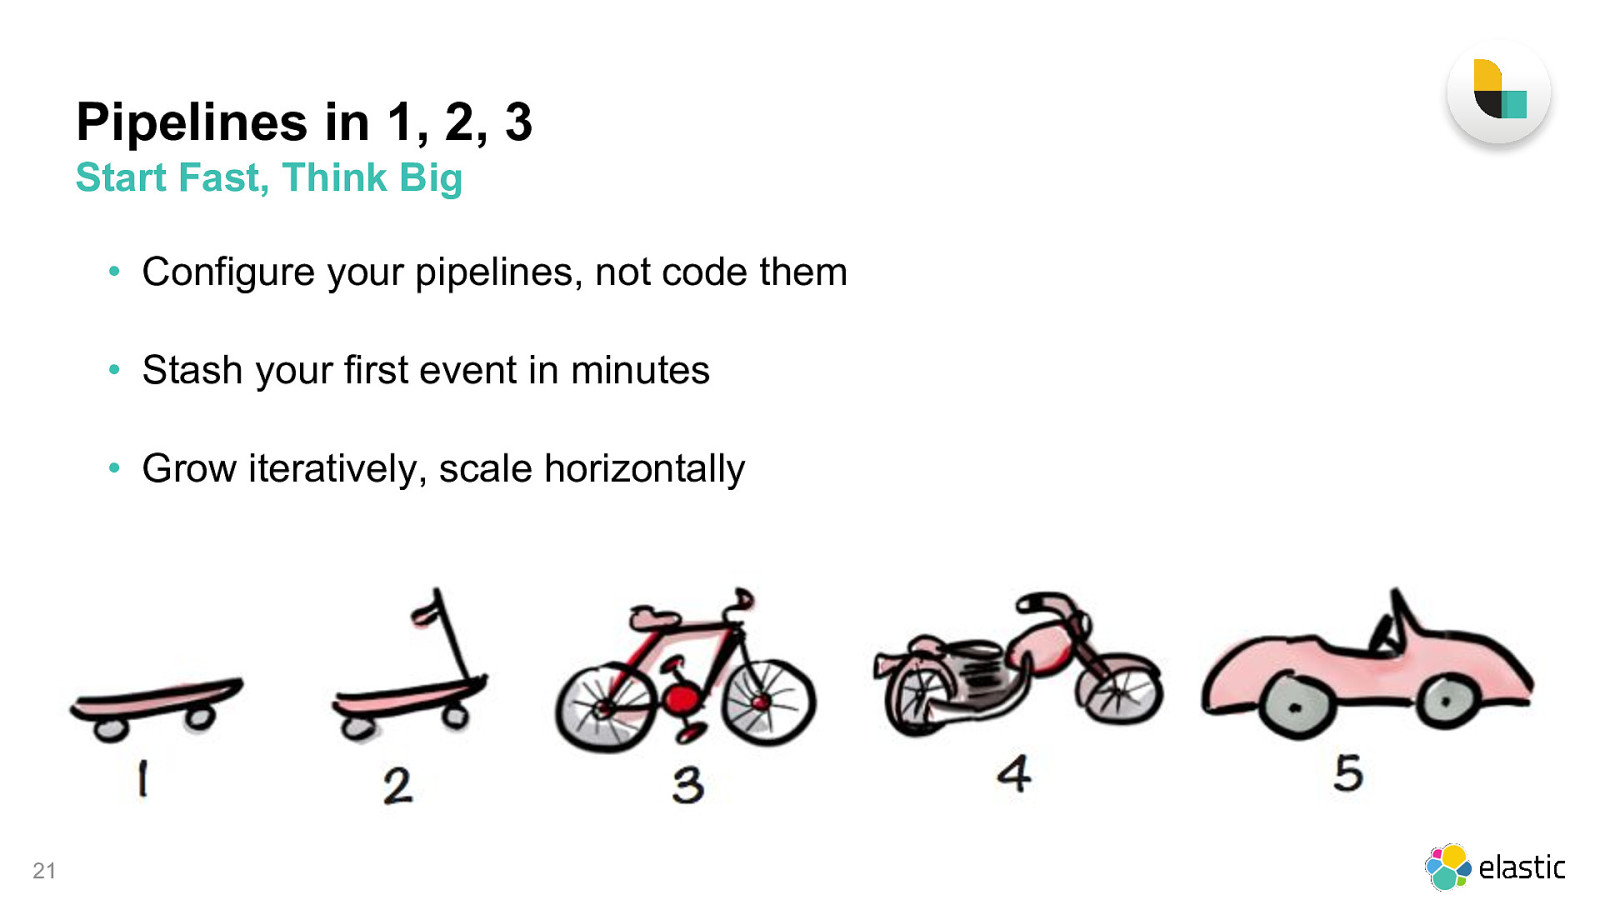
Pipelines in 1, 2, 3 Start Fast, Think Big • Configure your pipelines, not code them • Stash your first event in minutes • Grow iteratively, scale horizontally 21
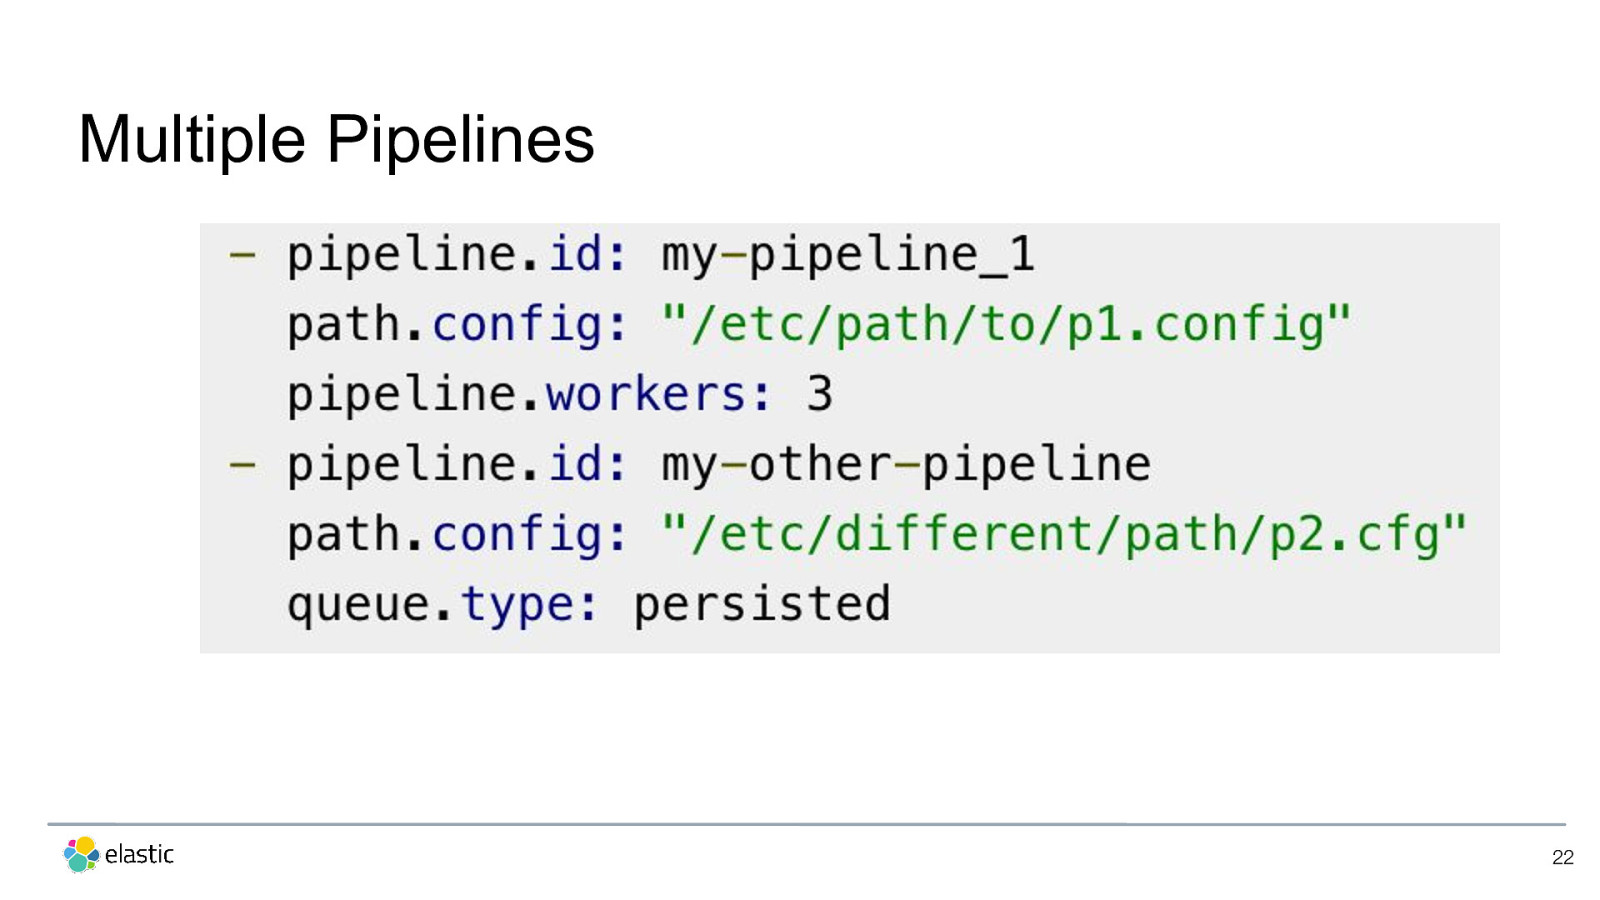
Multiple Pipelines 22
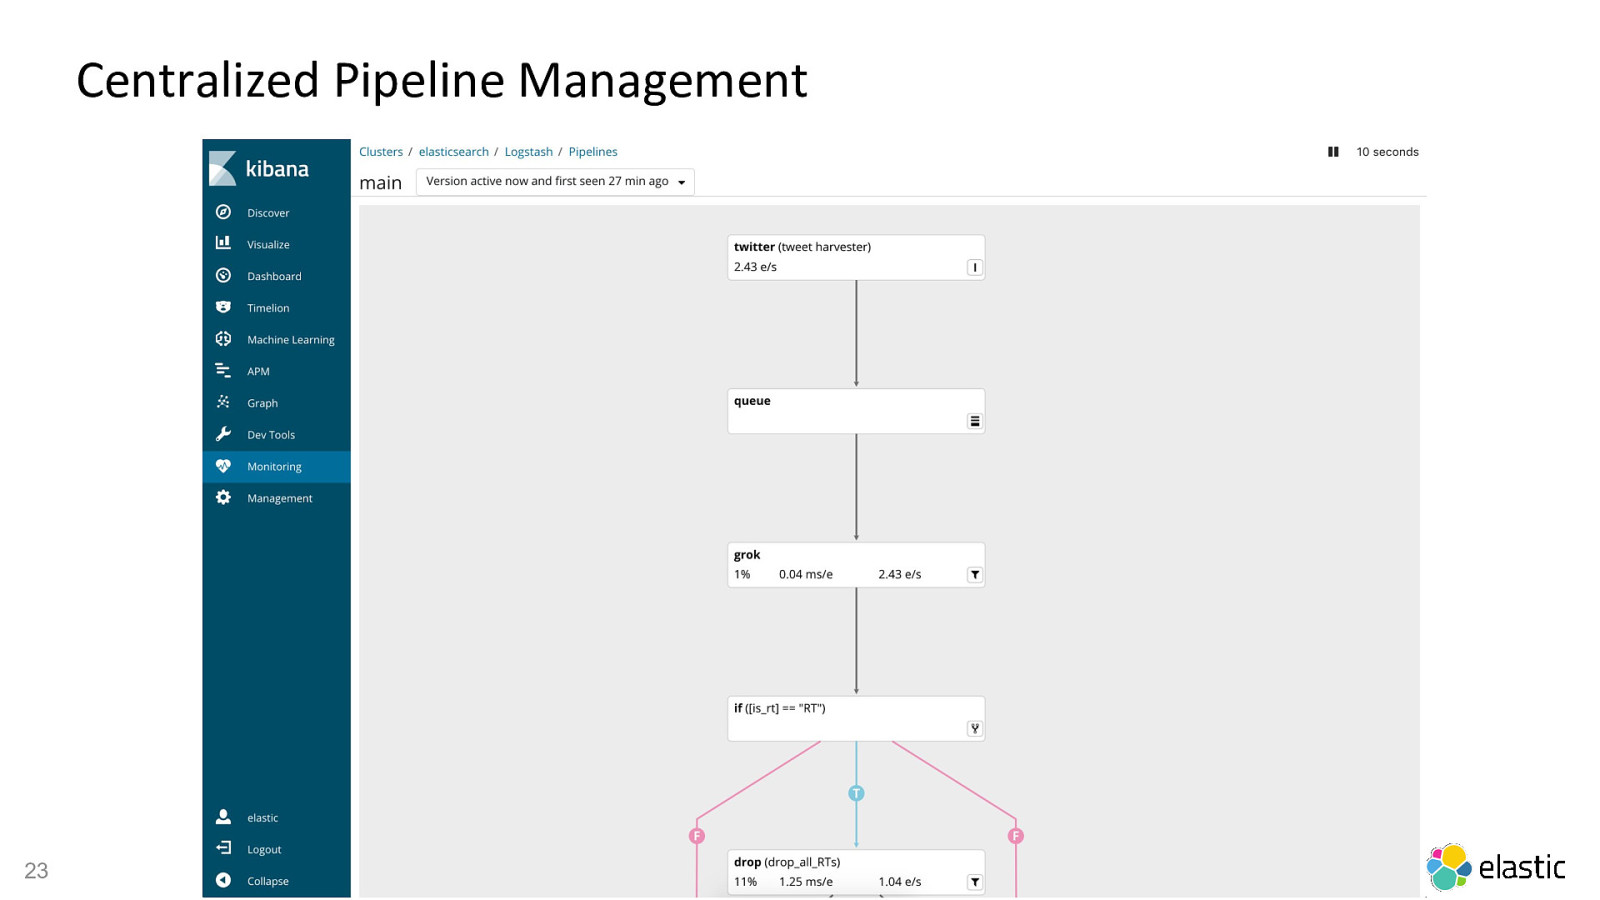
Centralized Pipeline Management 23
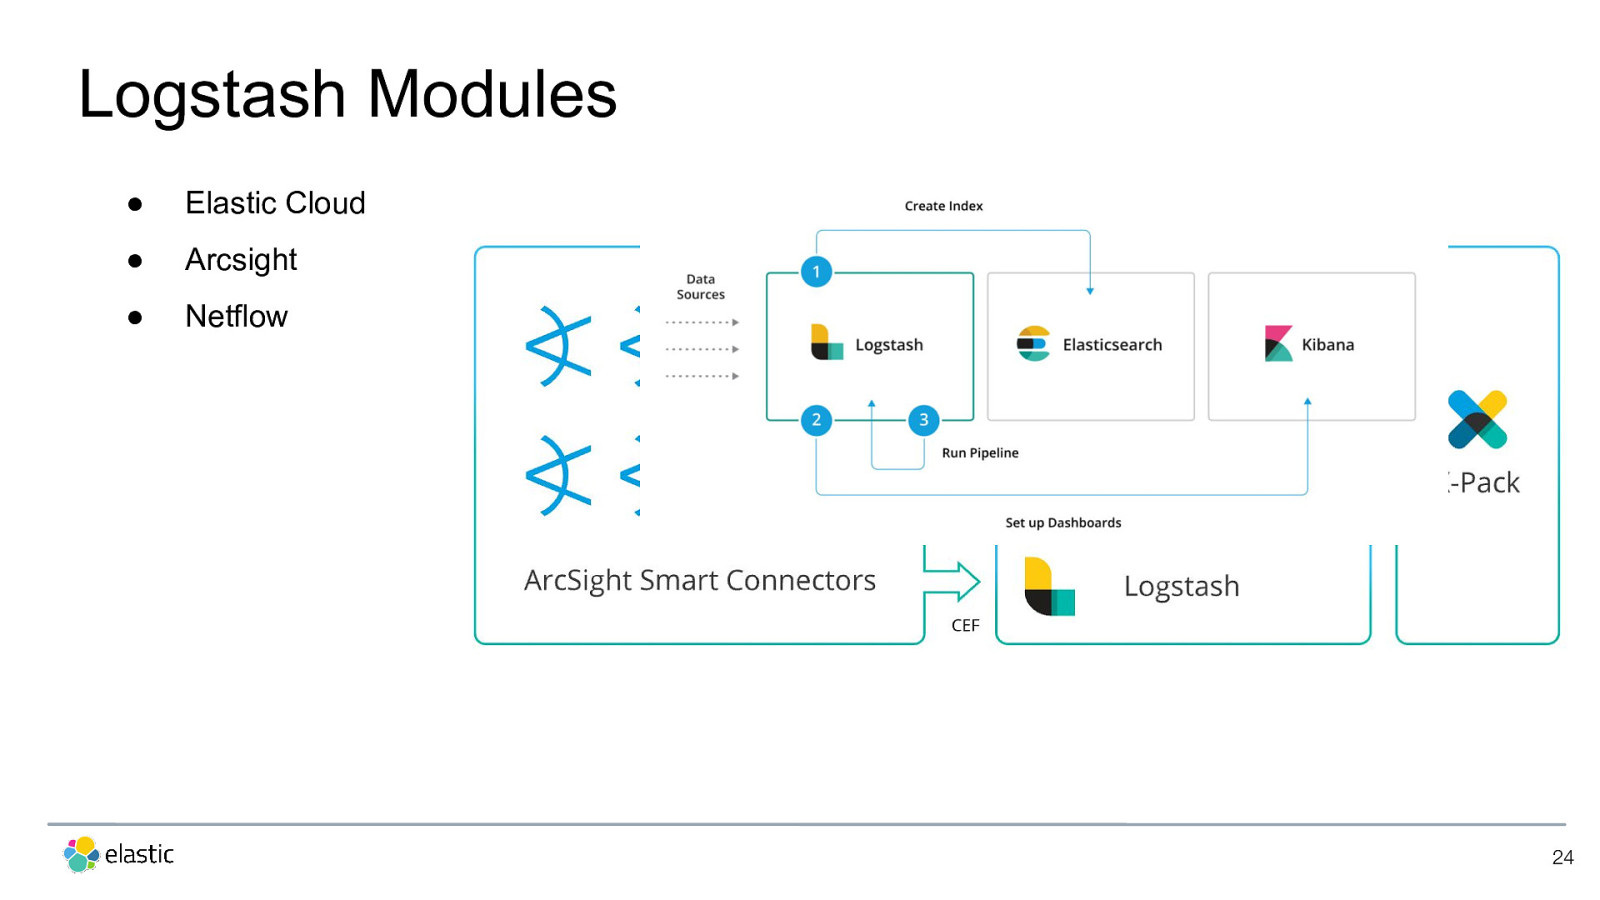
Logstash Modules ● Elastic Cloud ● Arcsight ● Netflow 24
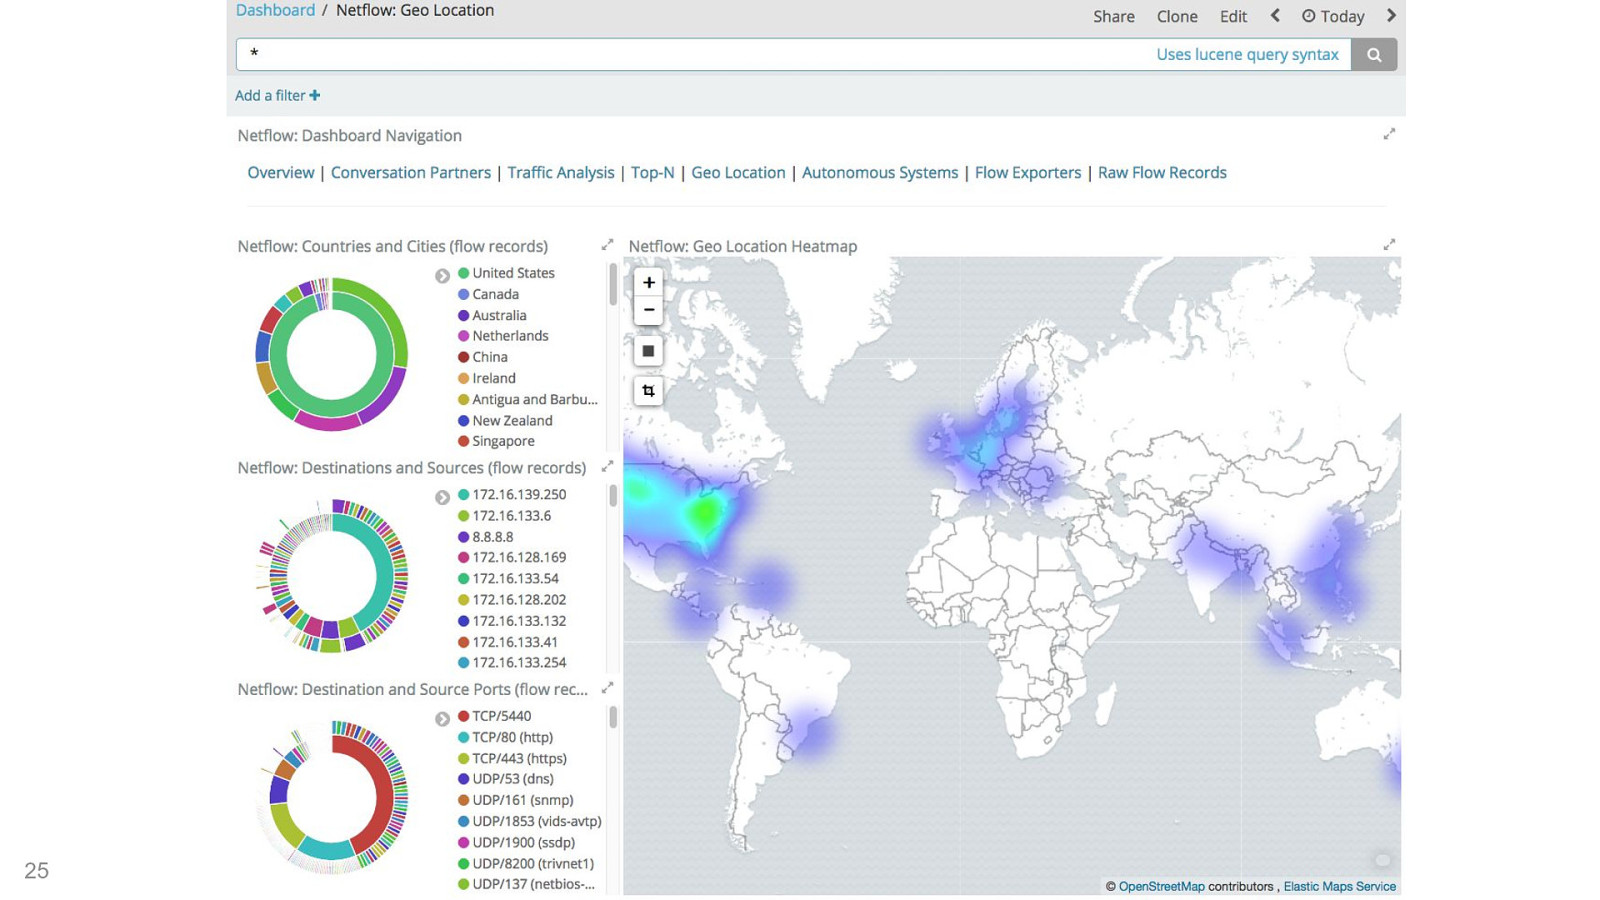
25
Data Resiliency • Persistent Queues • Dead Letter Queues 26
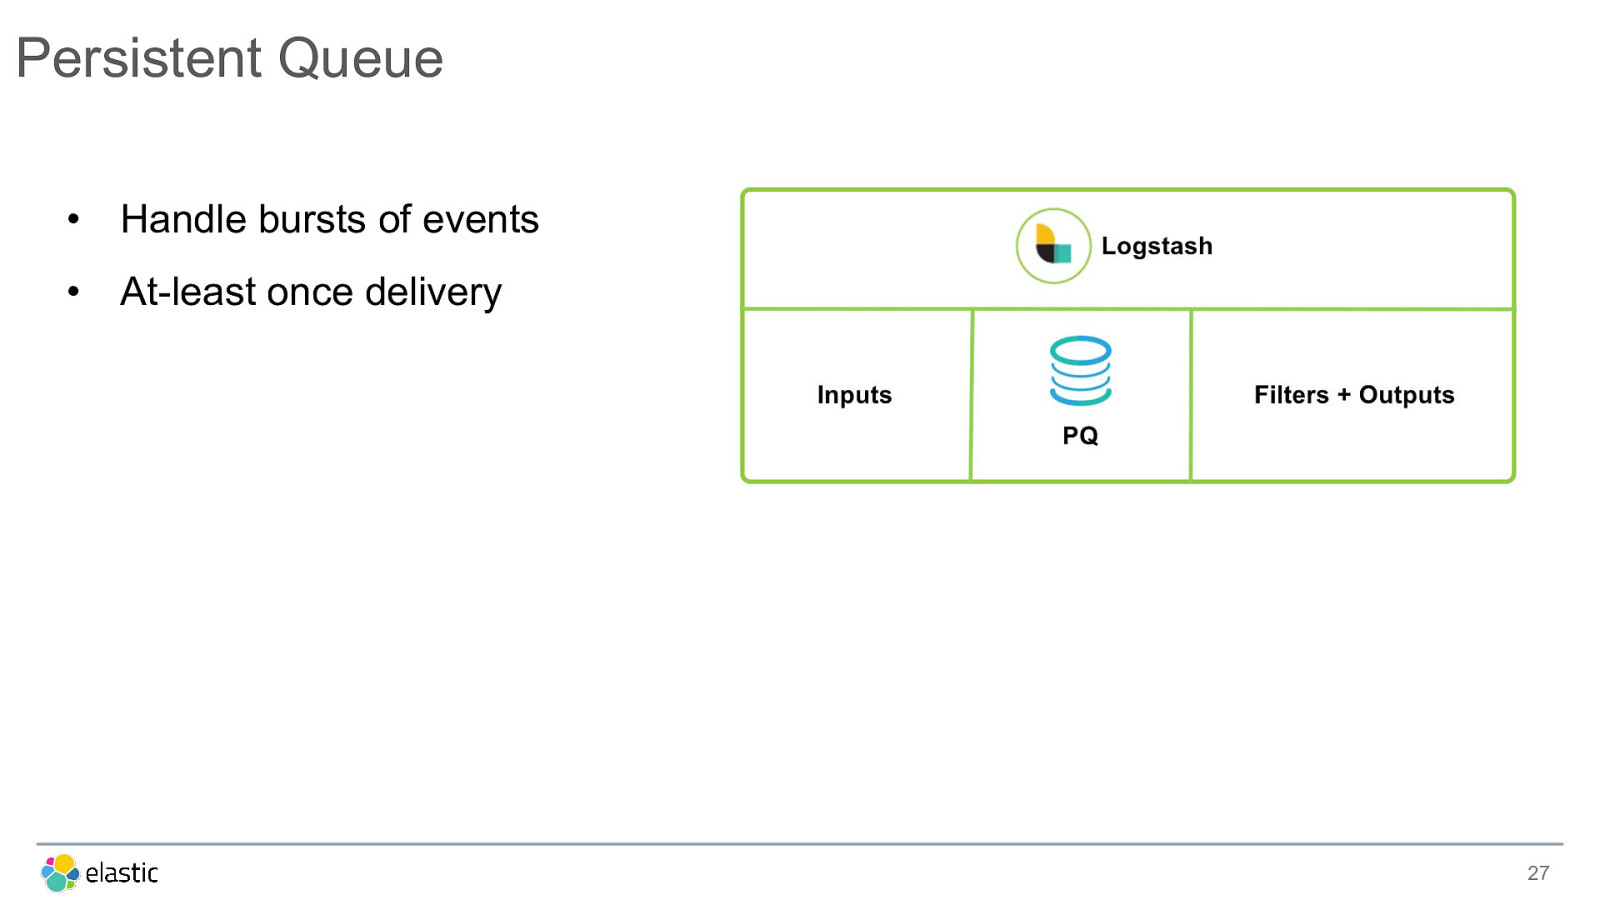
Persistent Queue • Handle bursts of events • At-least once delivery 27
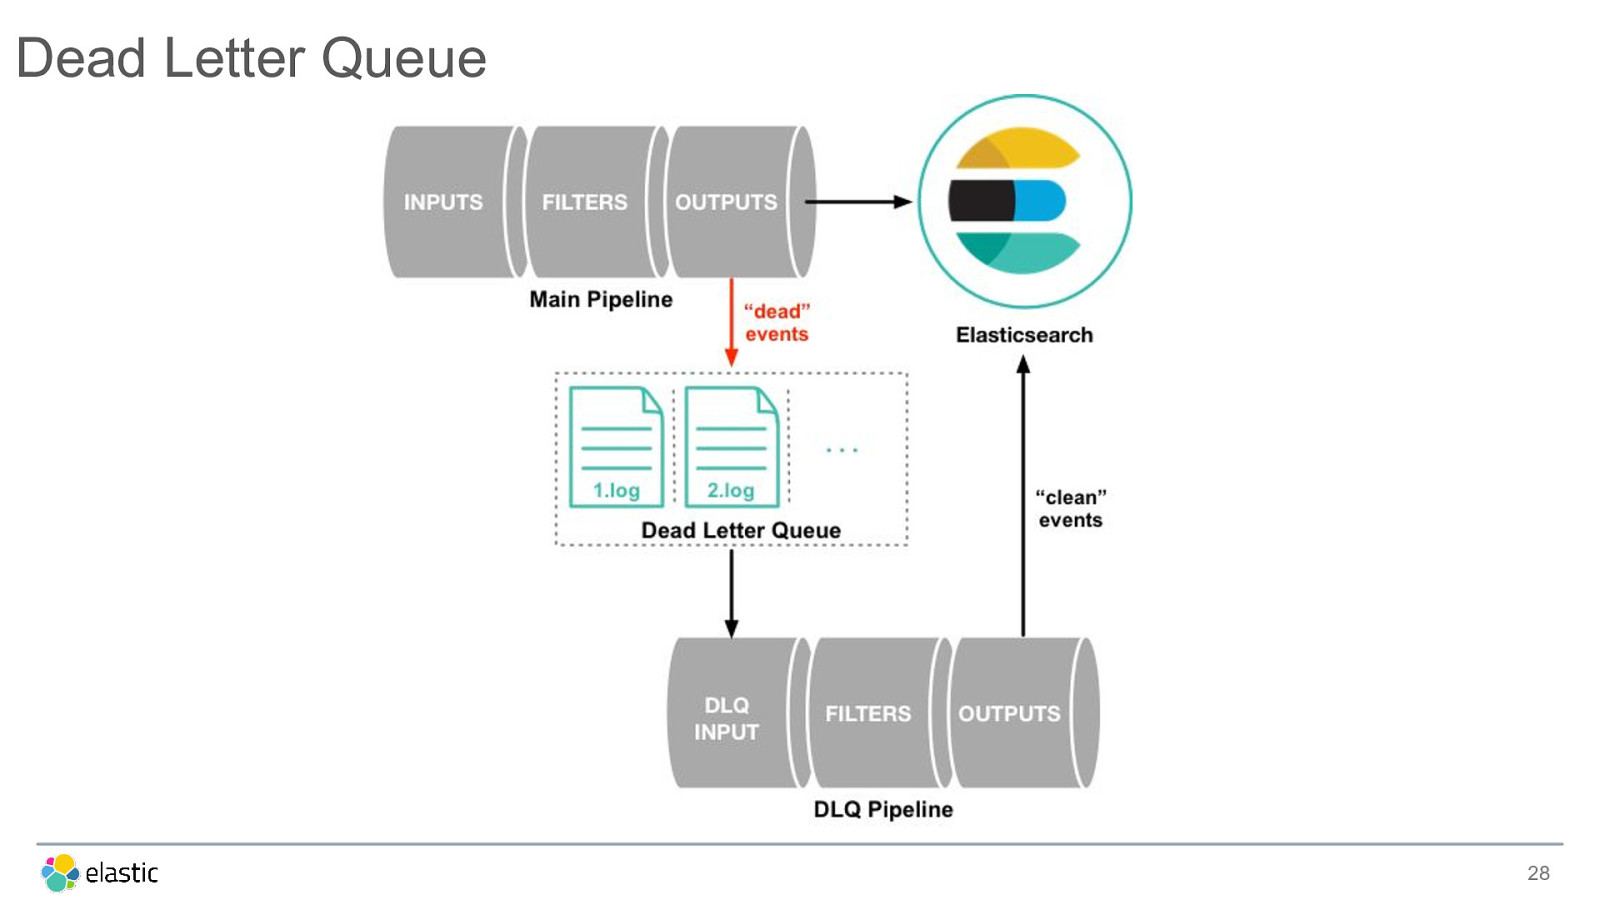
Dead Letter Queue 28
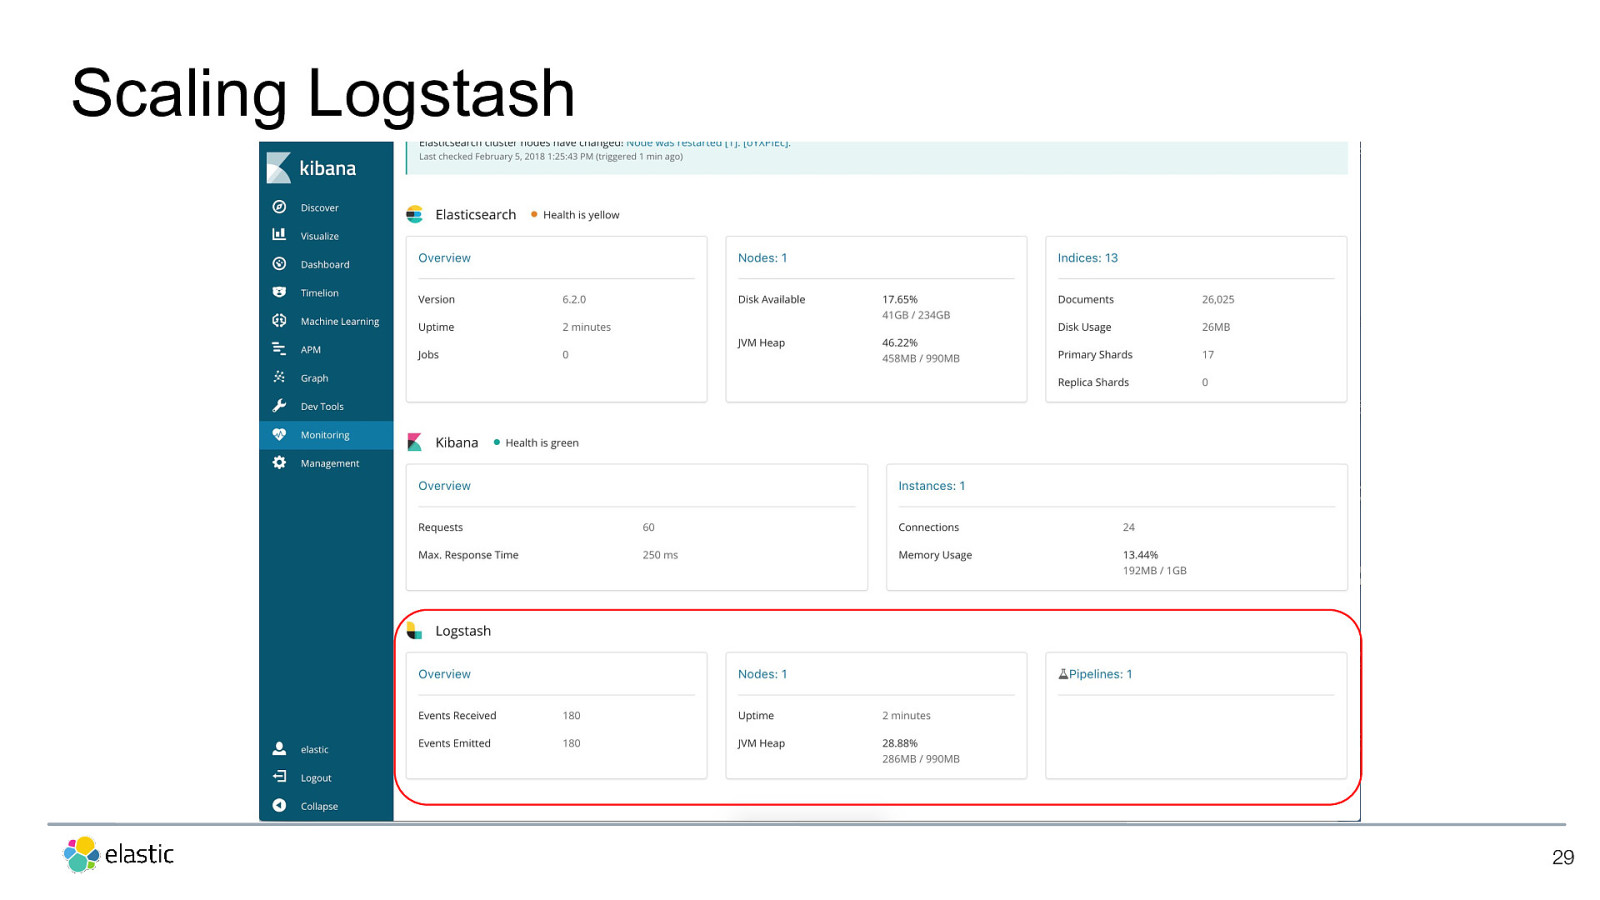
Scaling Logstash 29
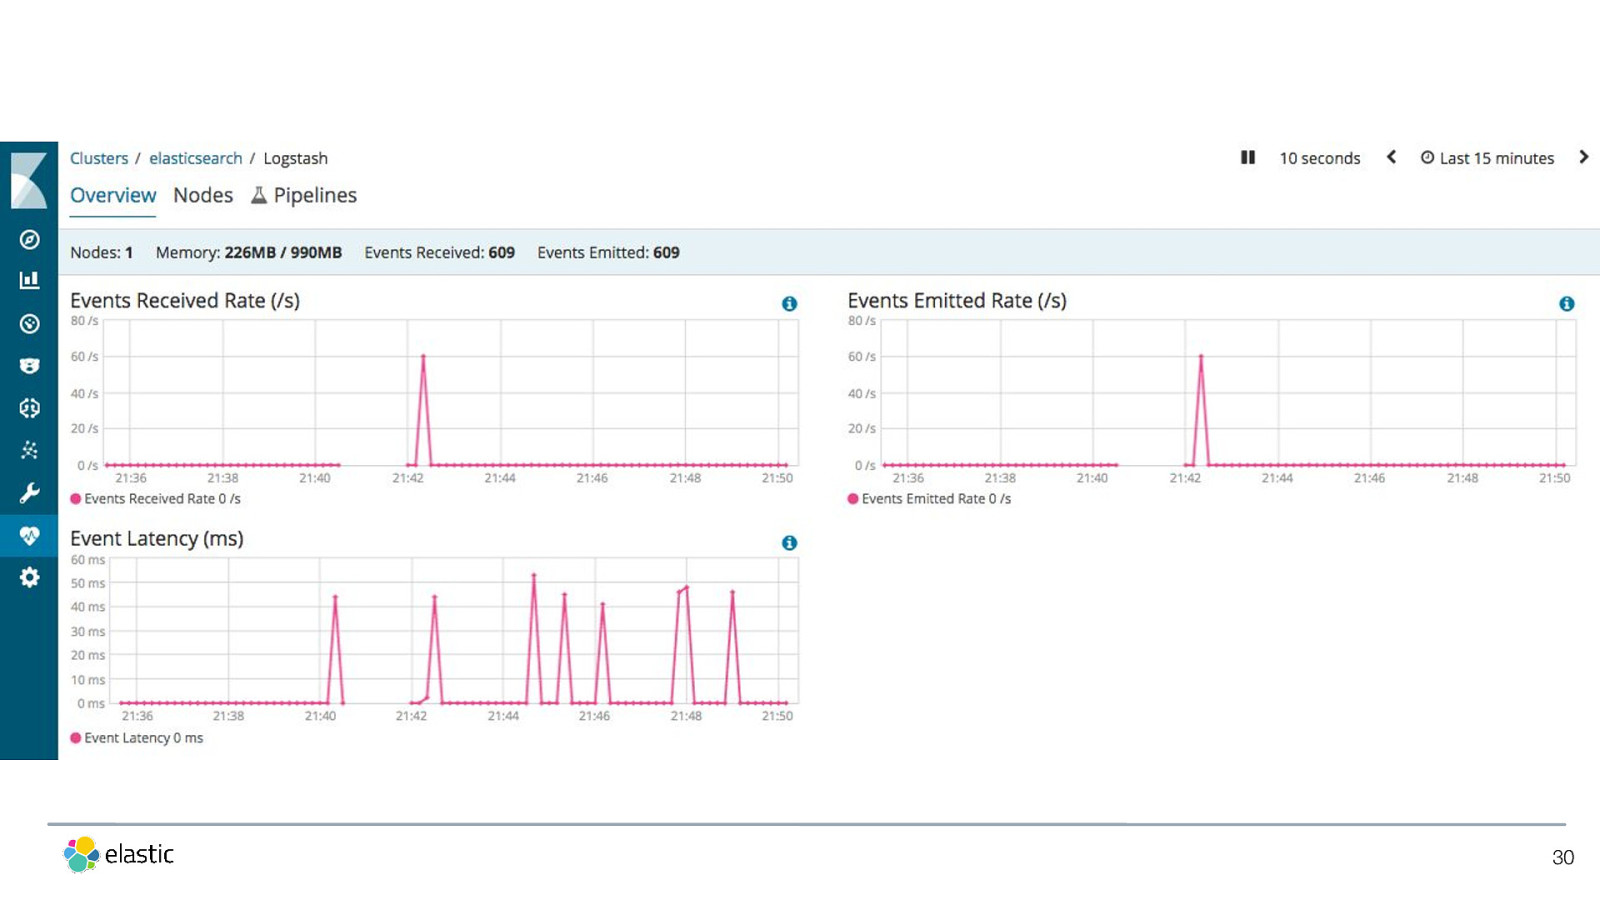
30
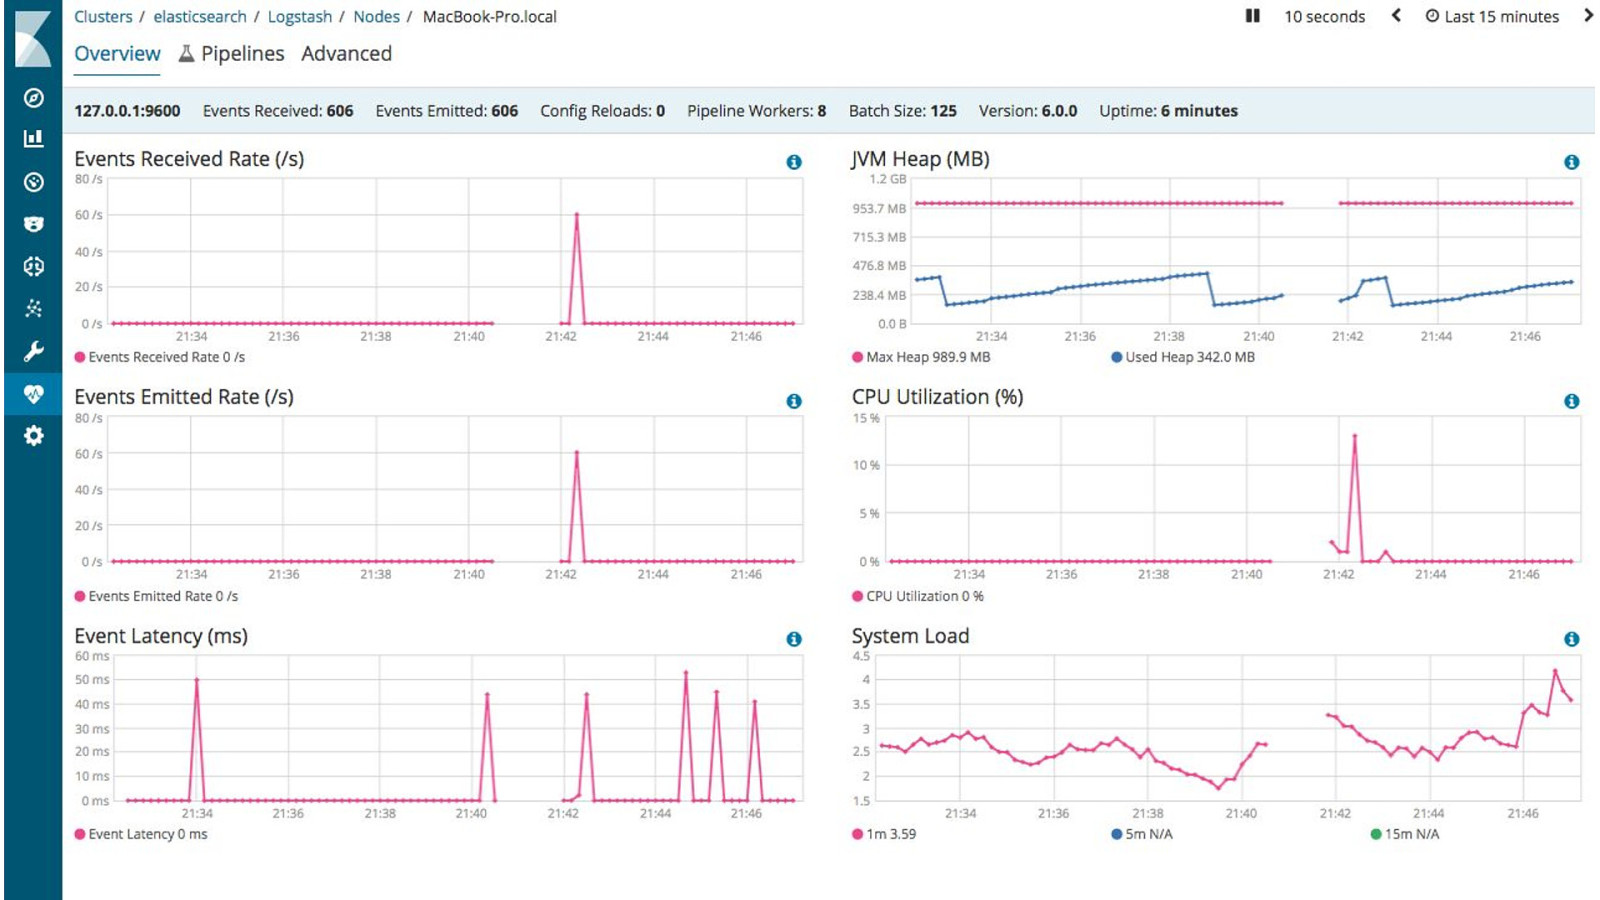
31
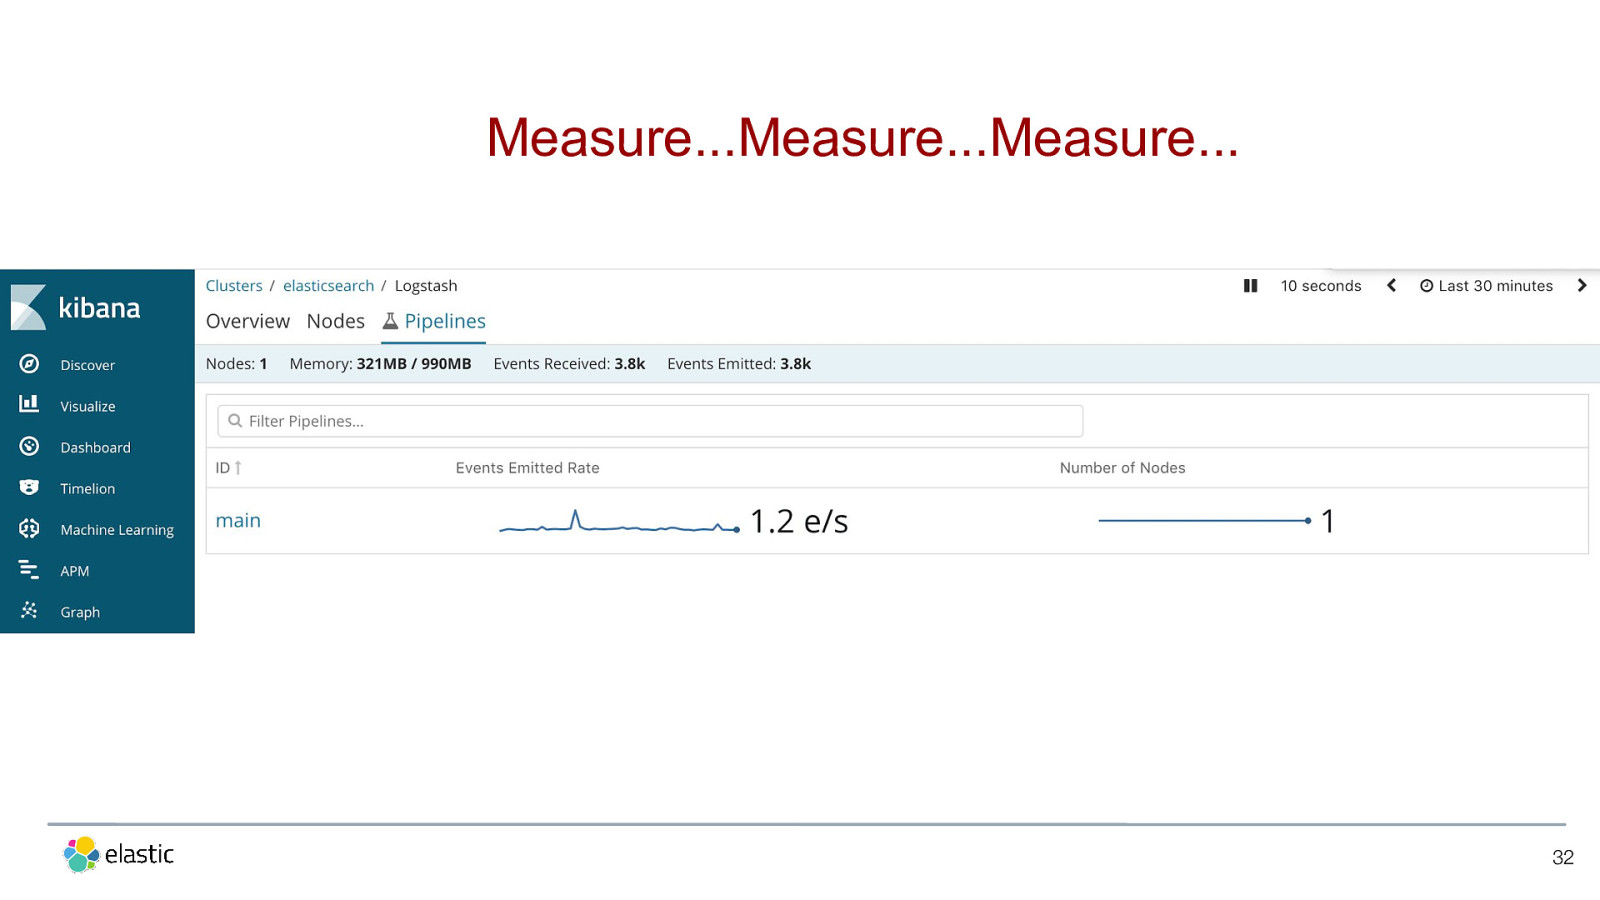
Measure...Measure...Measure... 32
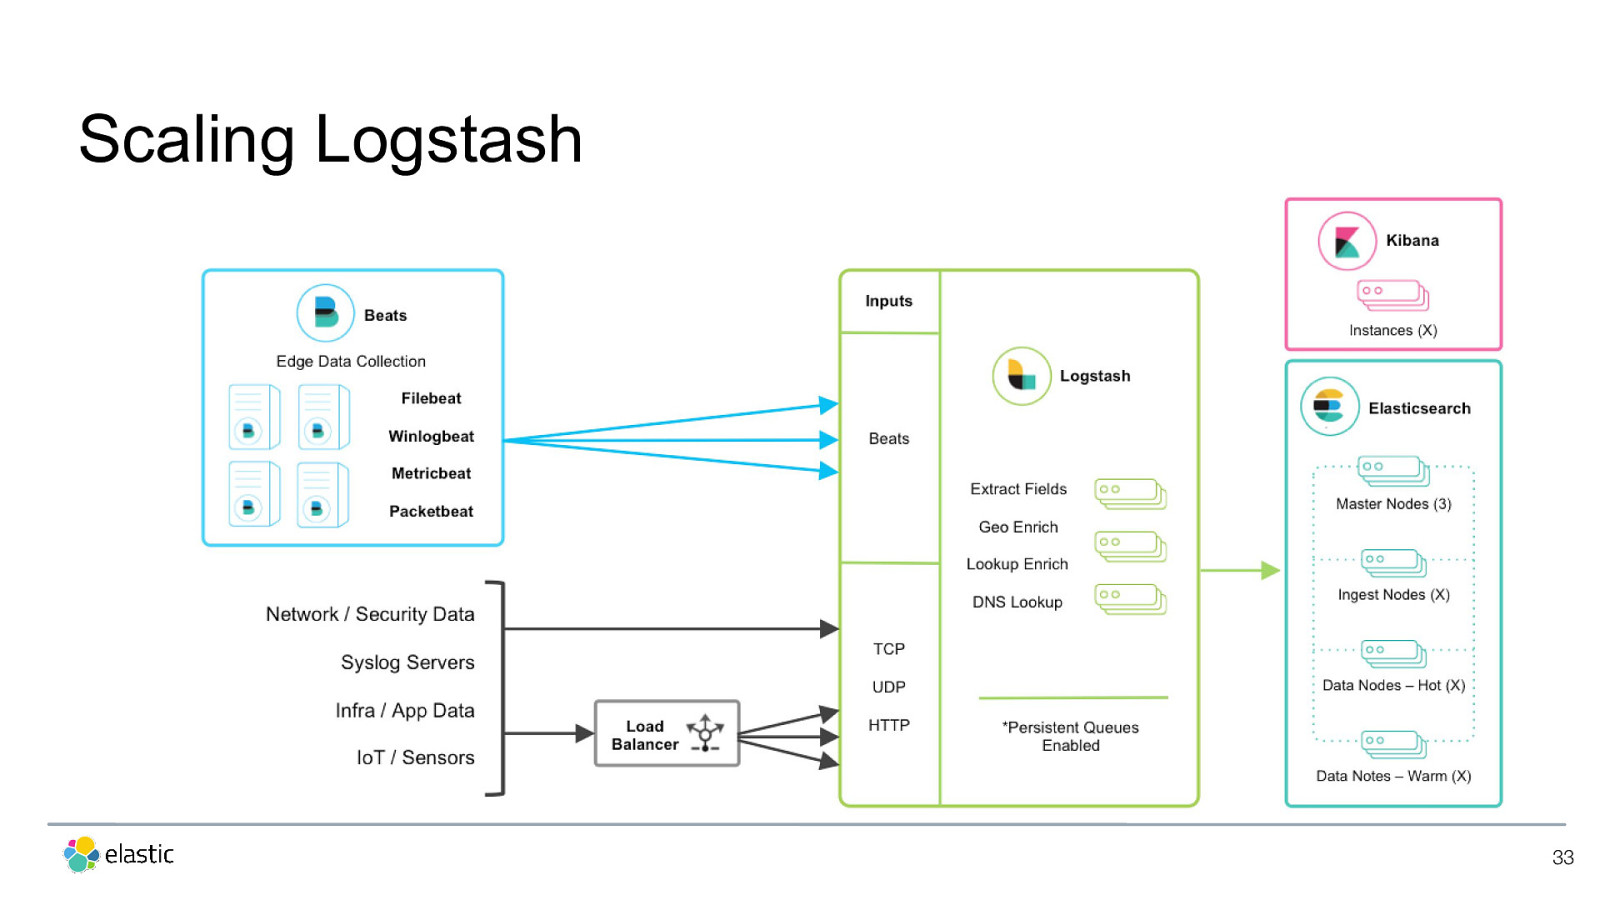
Scaling Logstash 33
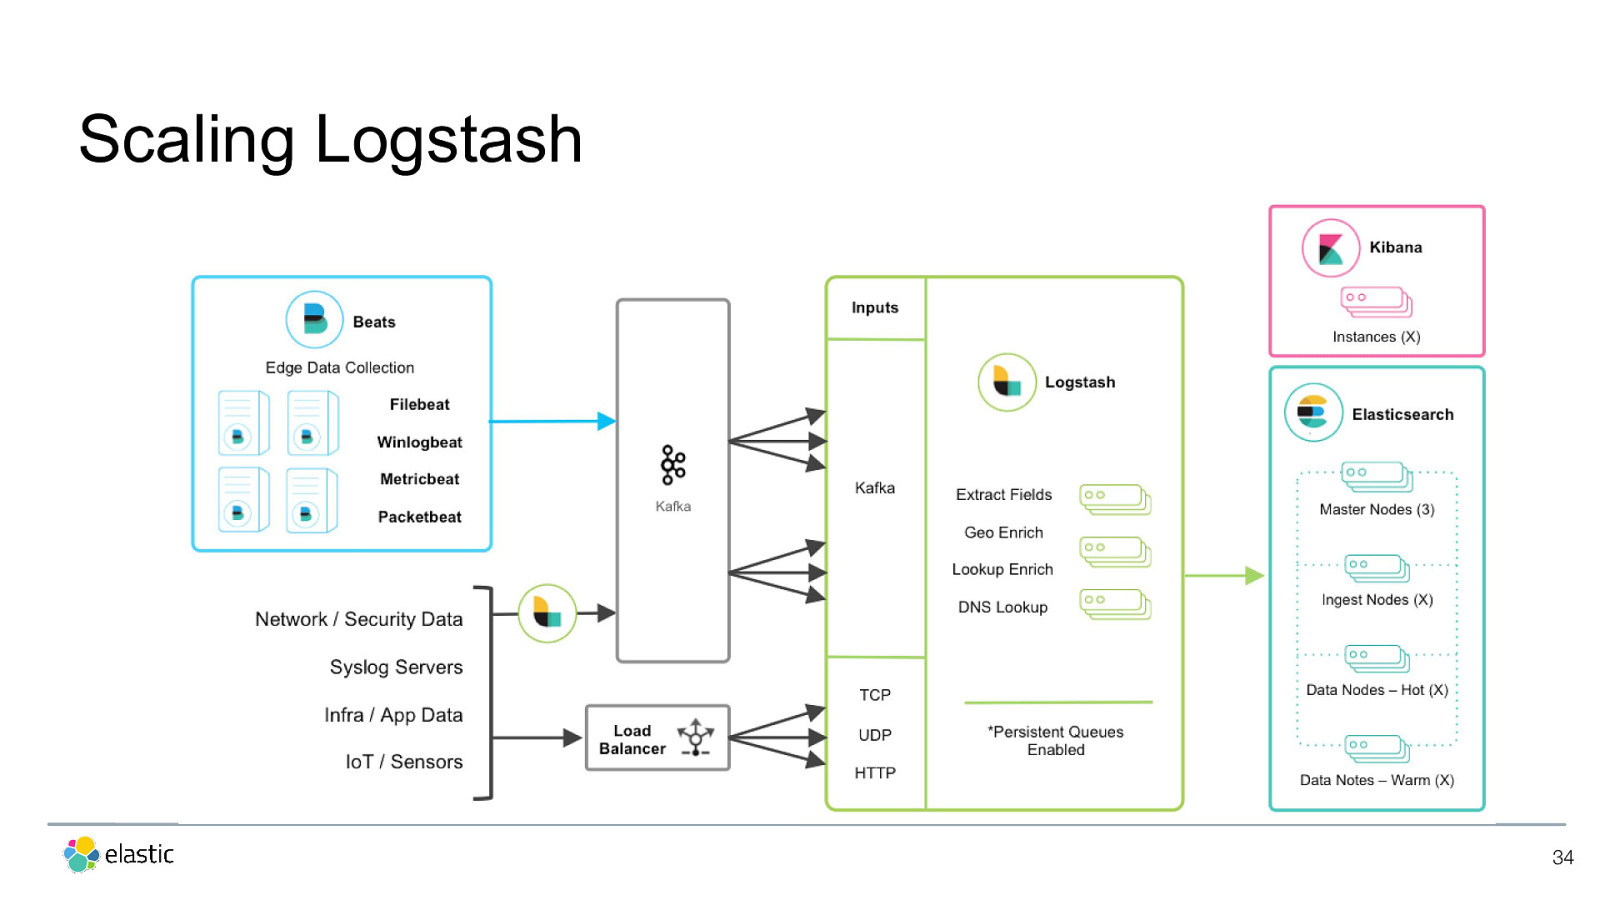
Scaling Logstash 34
Logstash Plugins • Input • Output • Filter 35 https://www.elastic.co/guide/en/logstash-versioned-plugins/current/index.html
Parse/Extract
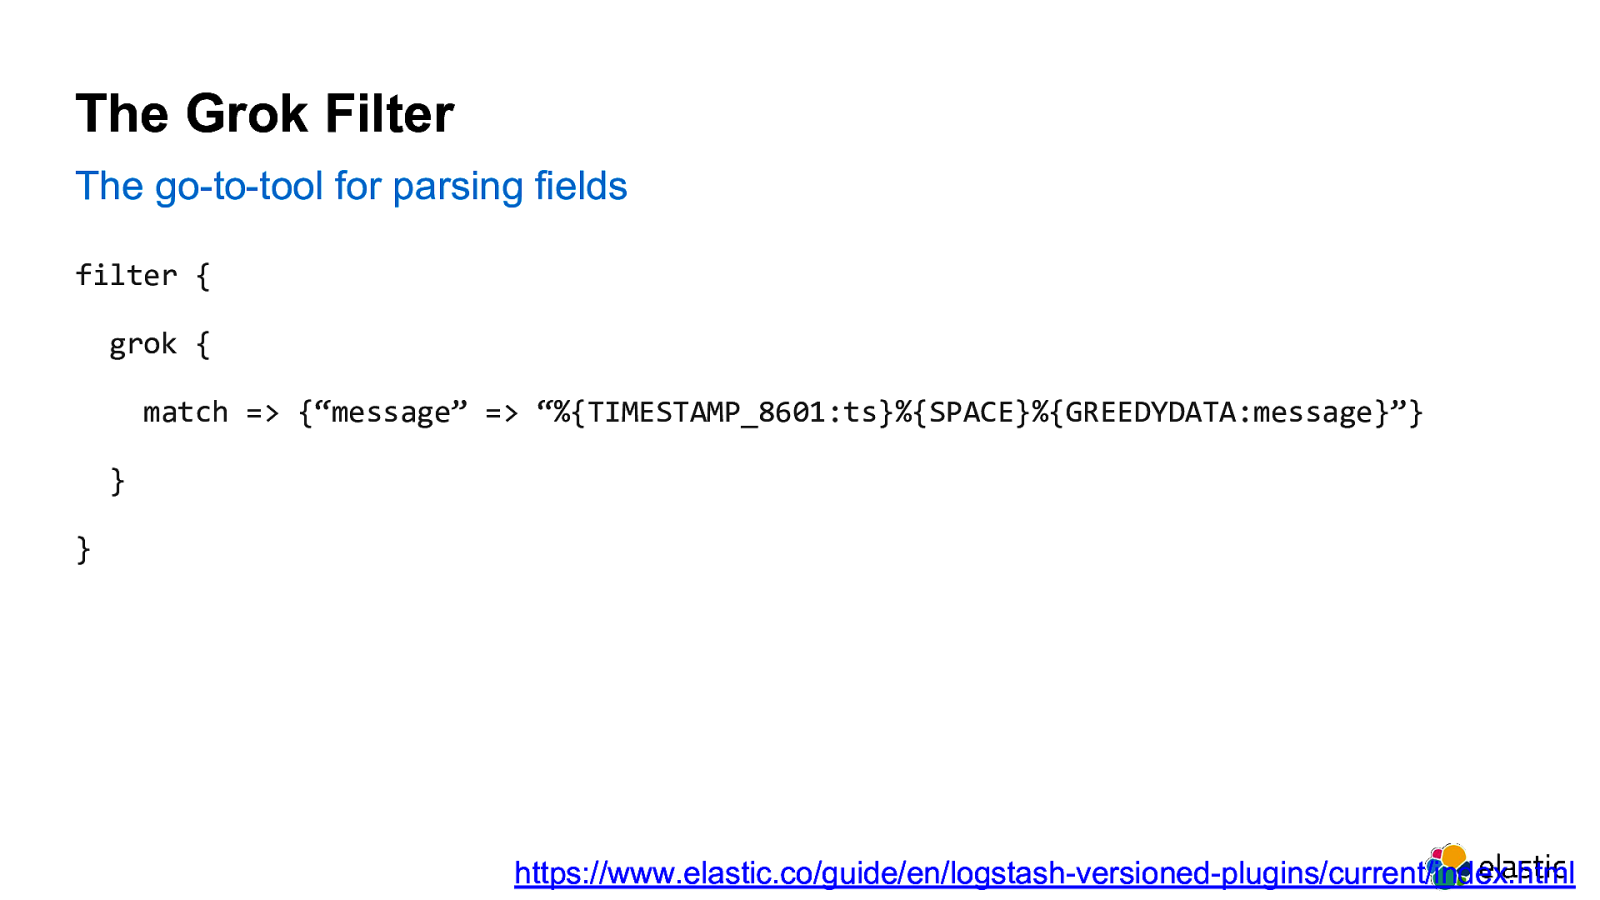
The Grok Filter The go-to-tool for parsing fields filter { grok { match => {“message” => “%{TIMESTAMP_8601:ts}%{SPACE}%{GREEDYDATA:message}”} } } https://www.elastic.co/guide/en/logstash-versioned-plugins/current/index.html
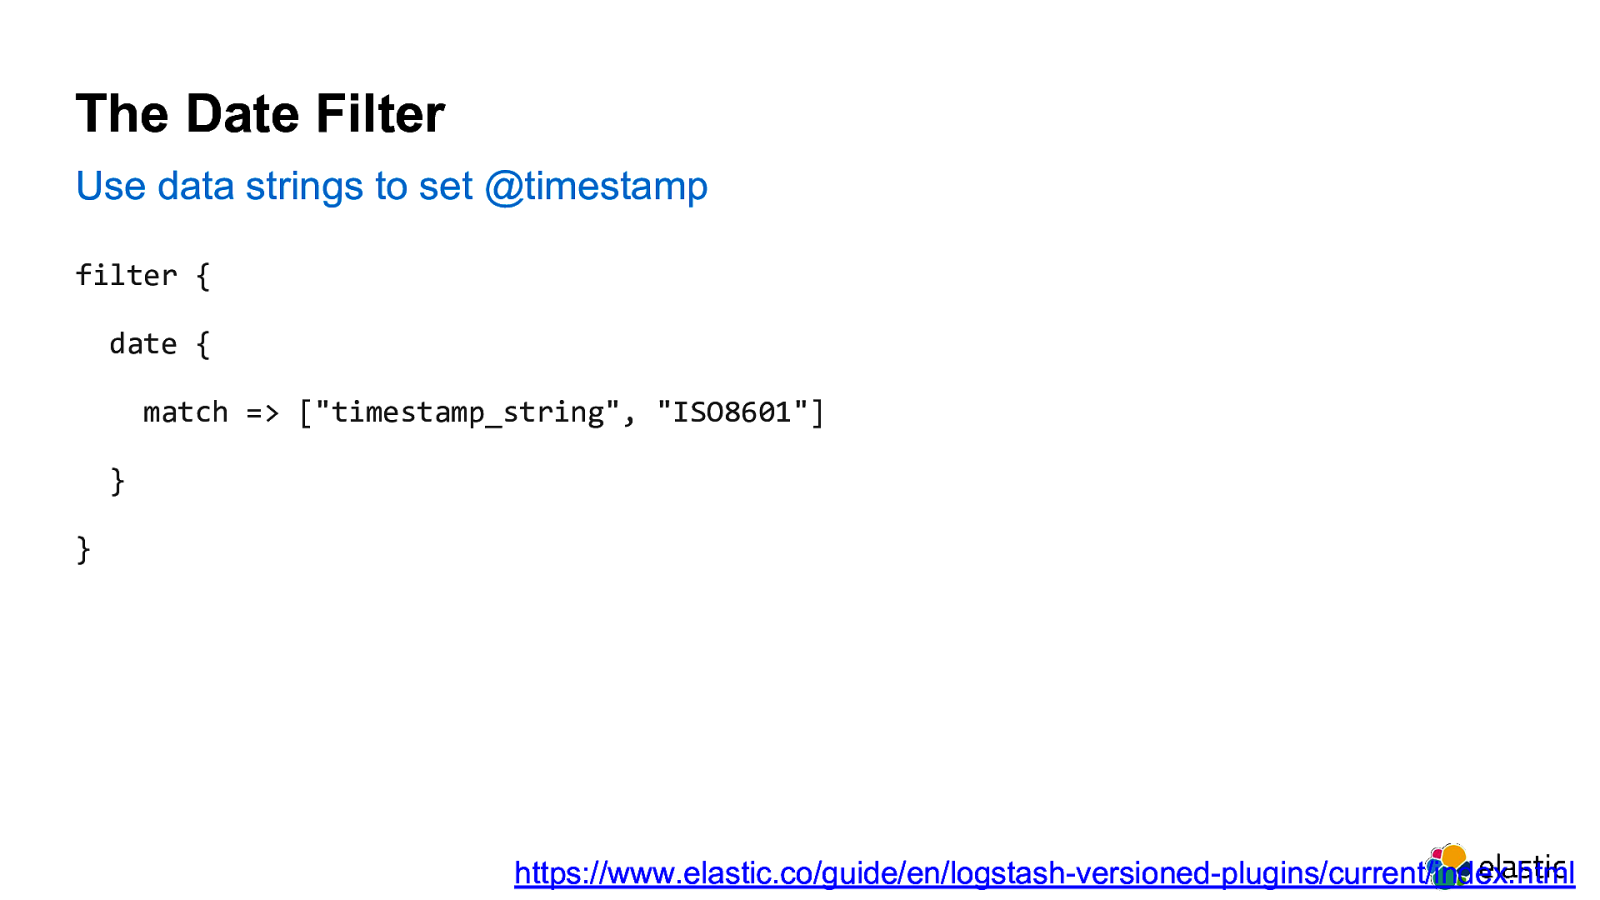
The Date Filter Use data strings to set @timestamp filter { date { match => ["timestamp_string", "ISO8601"] } } https://www.elastic.co/guide/en/logstash-versioned-plugins/current/index.html
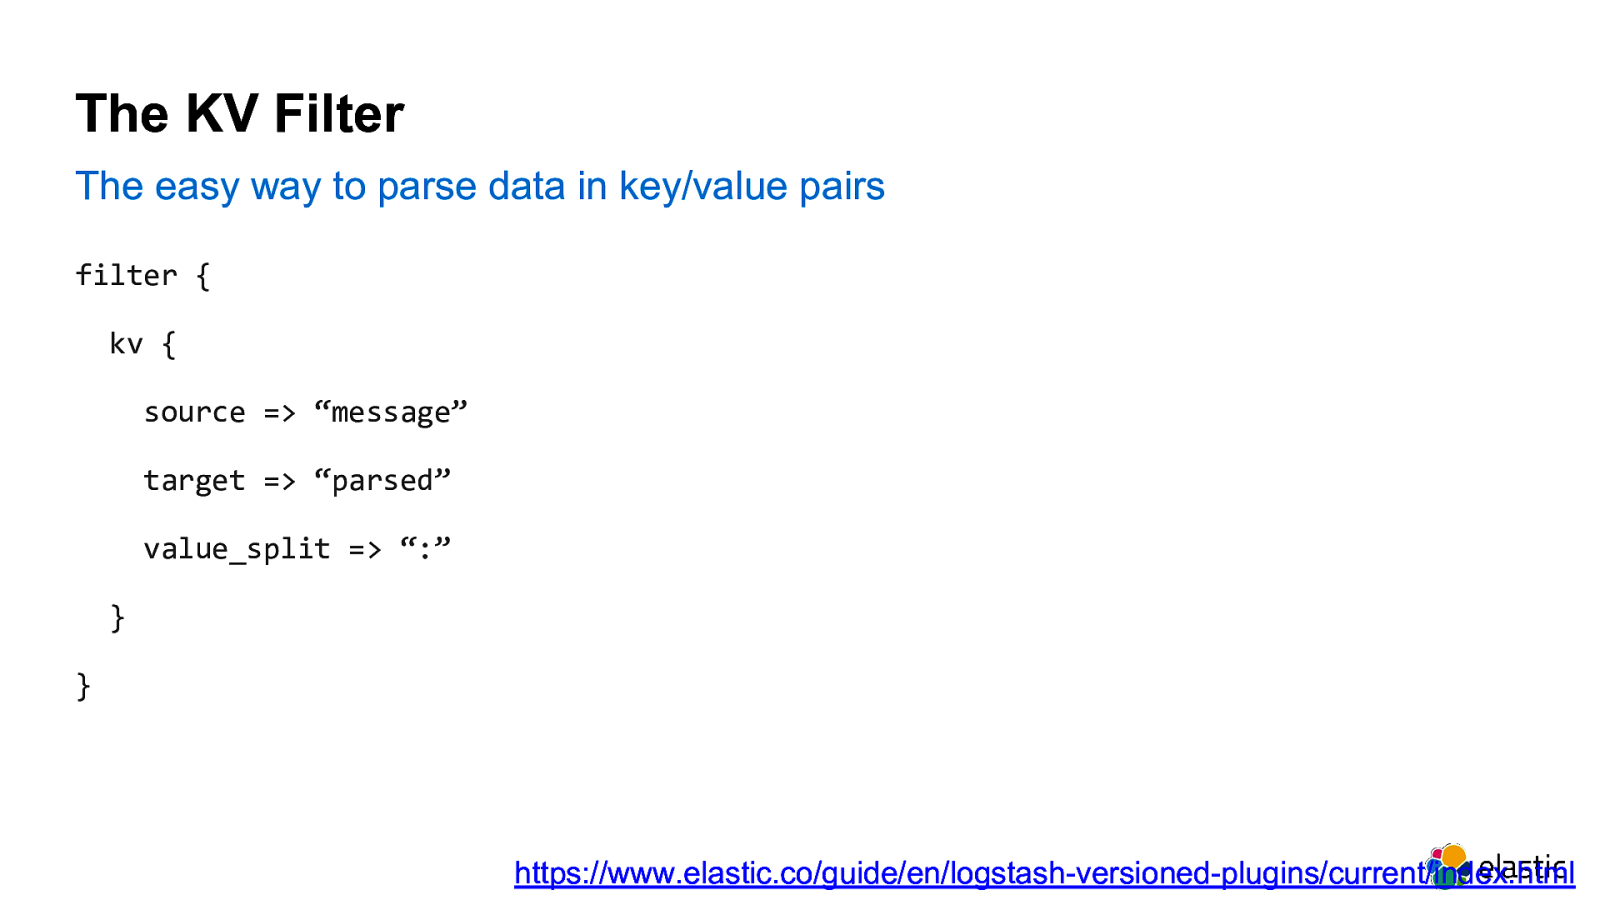
The KV Filter The easy way to parse data in key/value pairs filter { kv { source => “message” target => “parsed” value_split => “:” } } https://www.elastic.co/guide/en/logstash-versioned-plugins/current/index.html
Core operations
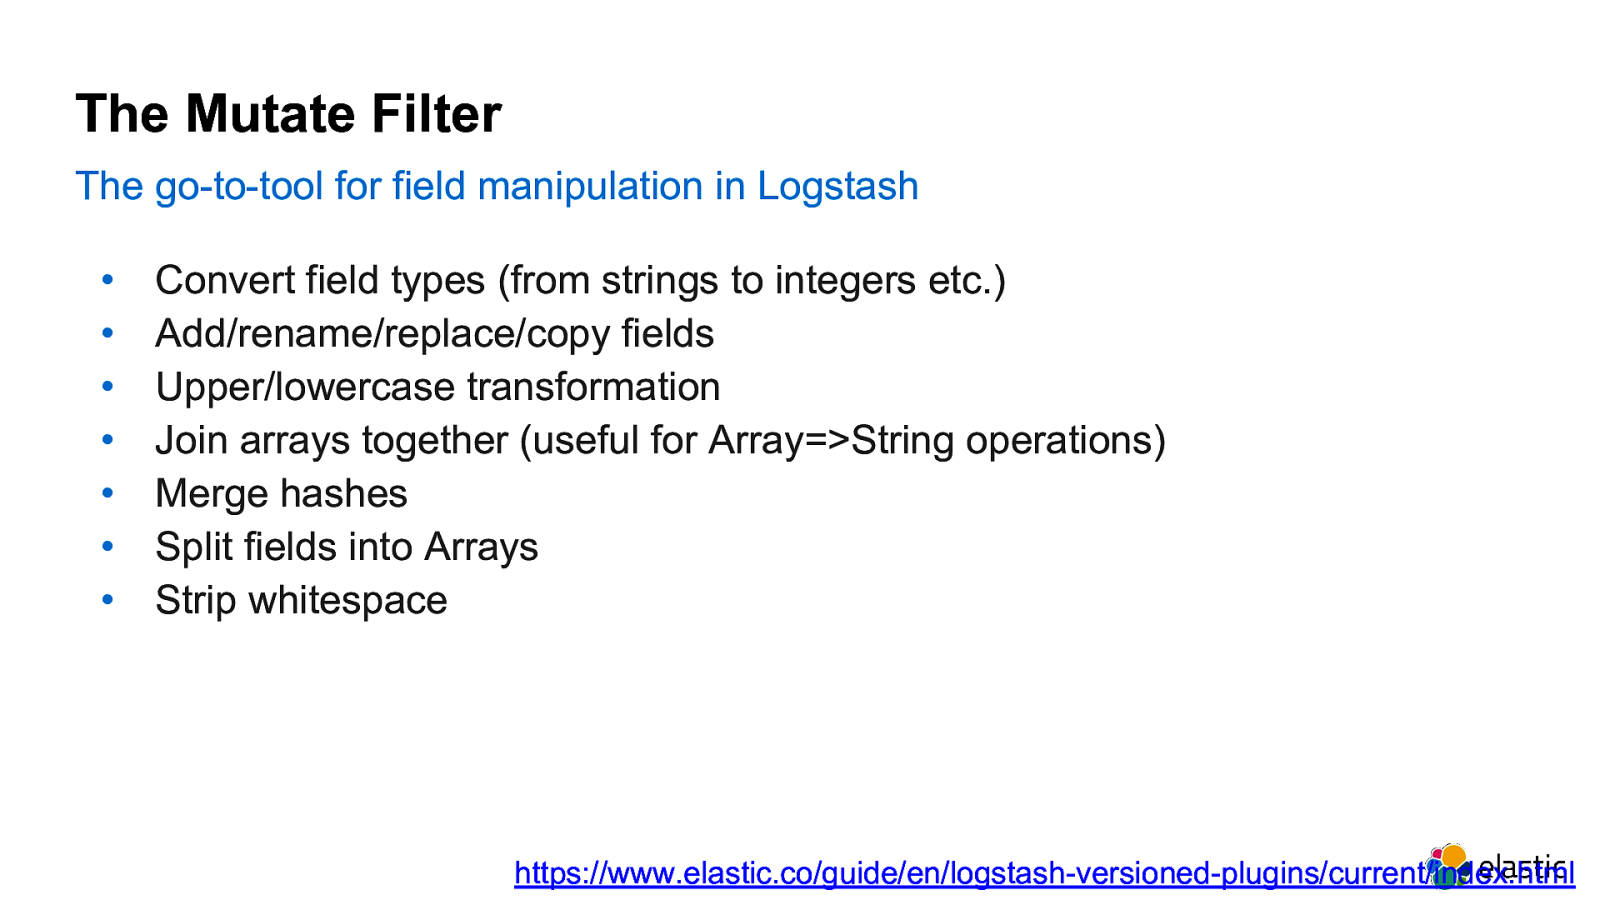
The Mutate Filter The go-to-tool for field manipulation in Logstash • • • • • • • Convert field types (from strings to integers etc.) Add/rename/replace/copy fields Upper/lowercase transformation Join arrays together (useful for Array=>String operations) Merge hashes Split fields into Arrays Strip whitespace https://www.elastic.co/guide/en/logstash-versioned-plugins/current/index.html
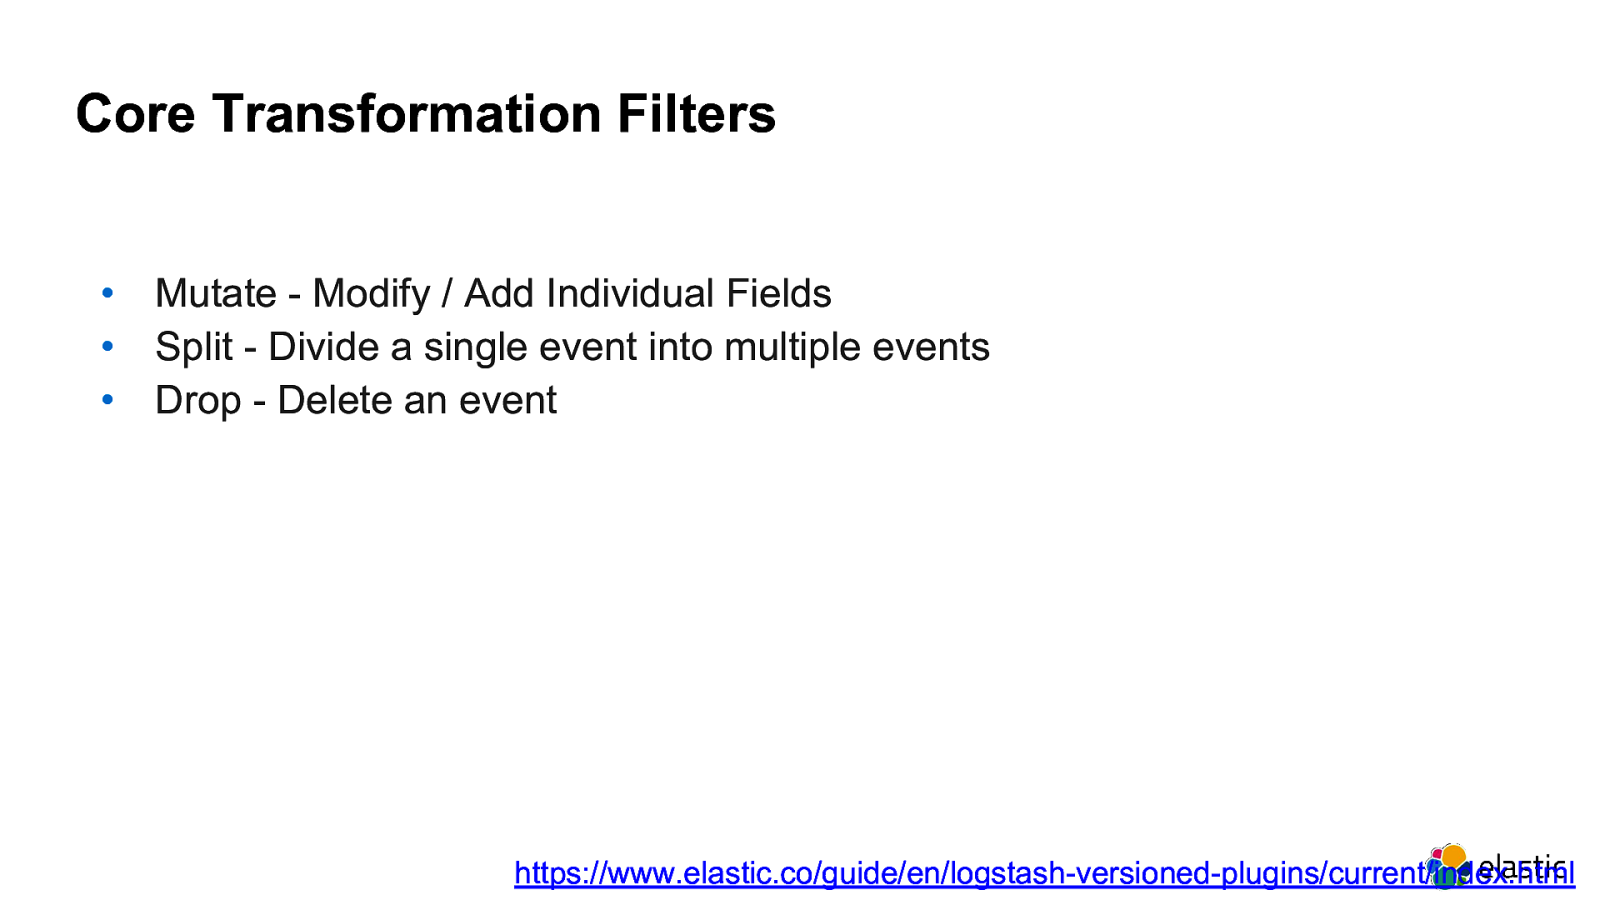
Core Transformation Filters • • • Mutate - Modify / Add Individual Fields Split - Divide a single event into multiple events Drop - Delete an event https://www.elastic.co/guide/en/logstash-versioned-plugins/current/index.html
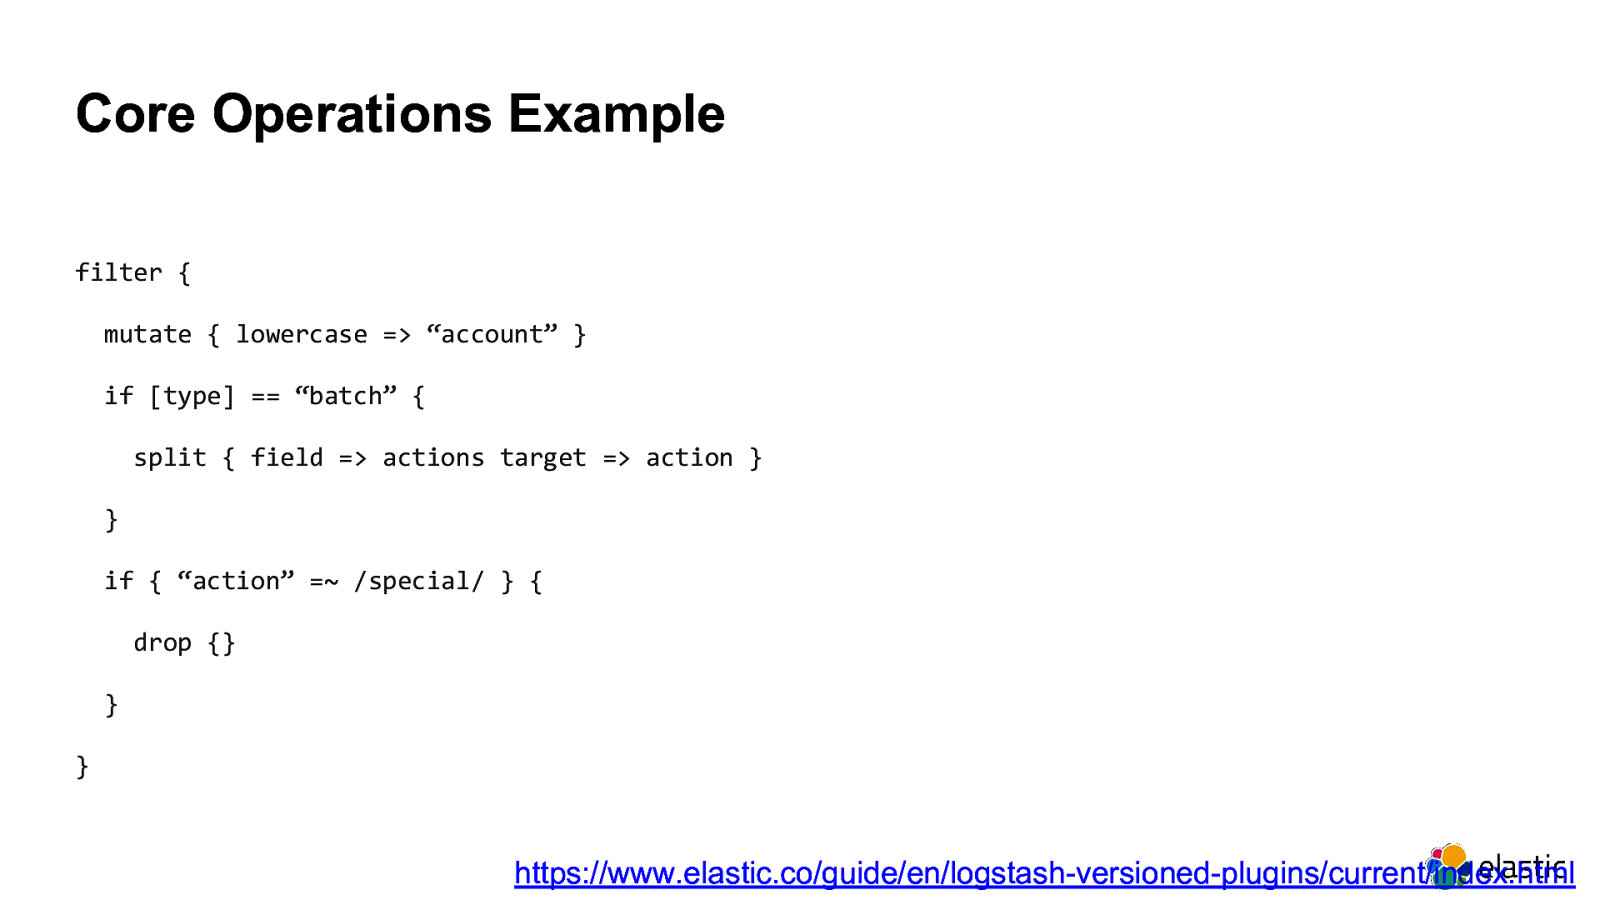
Core Operations Example filter { mutate { lowercase => “account” } if [type] == “batch” { split { field => actions target => action } } if { “action” =~ /special/ } { drop {} } } https://www.elastic.co/guide/en/logstash-versioned-plugins/current/index.html

Search Supportive
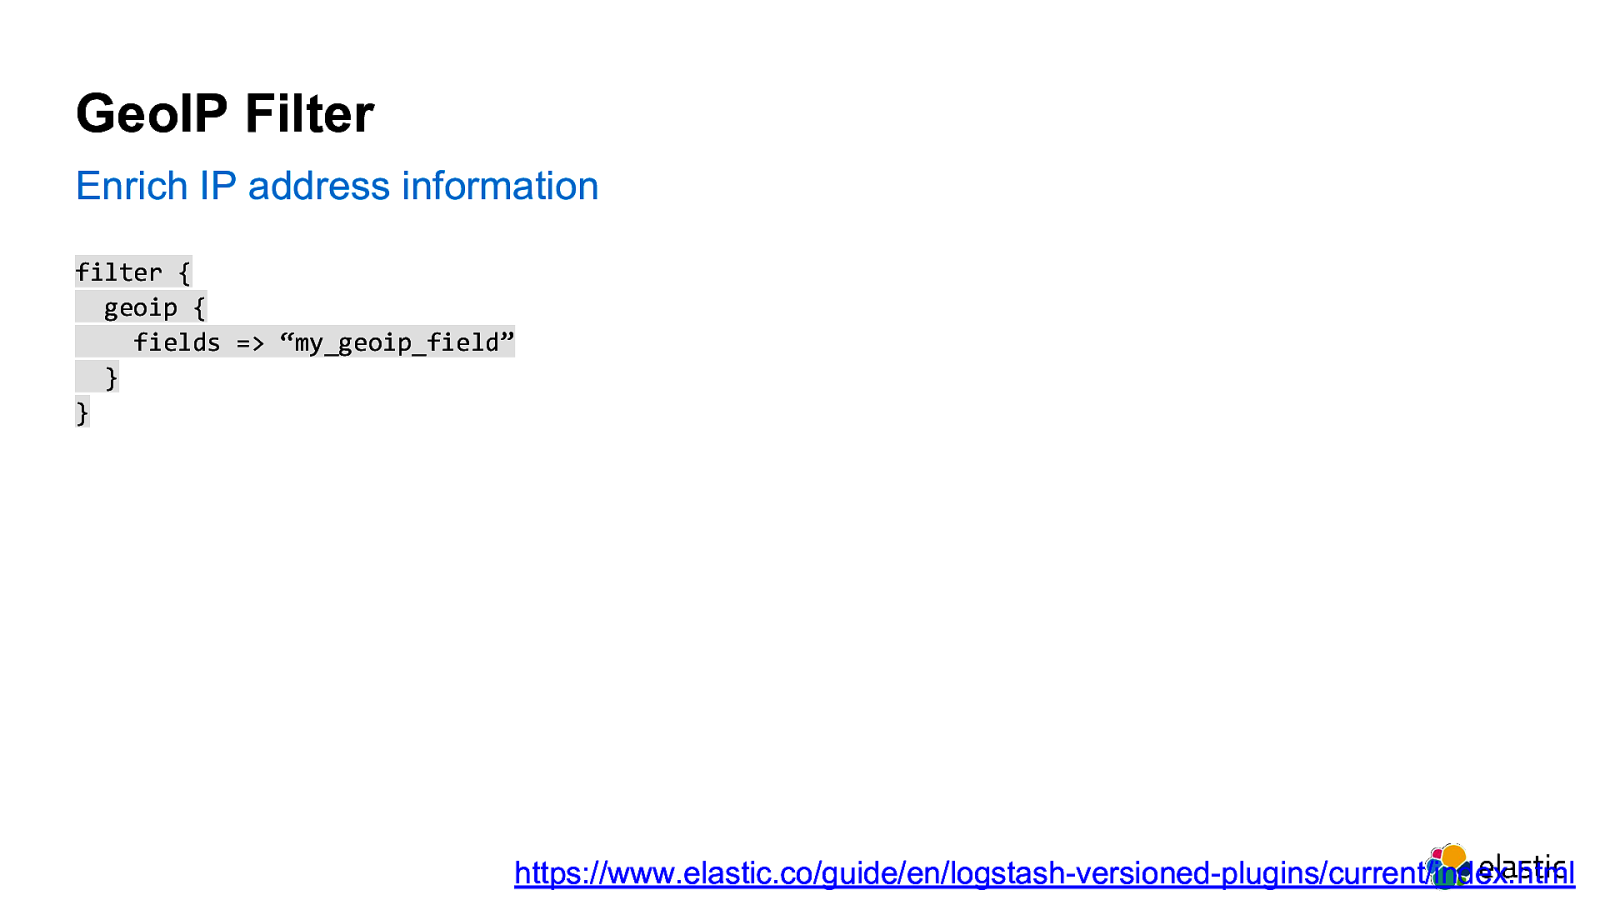
GeoIP Filter Enrich IP address information filter { geoip { fields => “my_geoip_field” } } https://www.elastic.co/guide/en/logstash-versioned-plugins/current/index.html
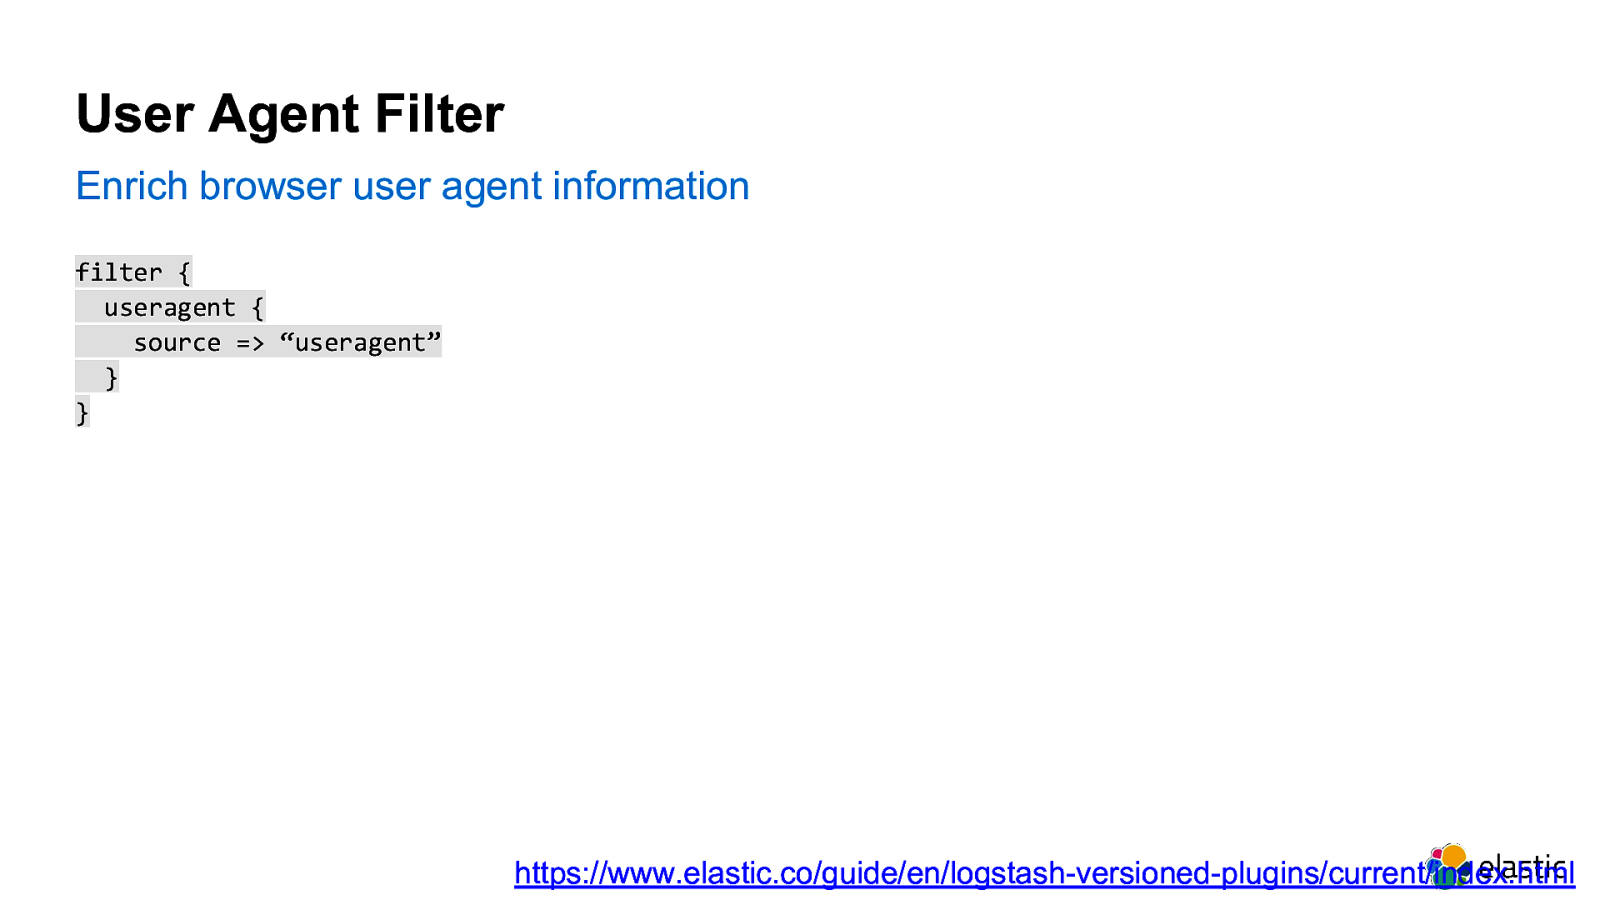
User Agent Filter Enrich browser user agent information filter { useragent { source => “useragent” } } https://www.elastic.co/guide/en/logstash-versioned-plugins/current/index.html
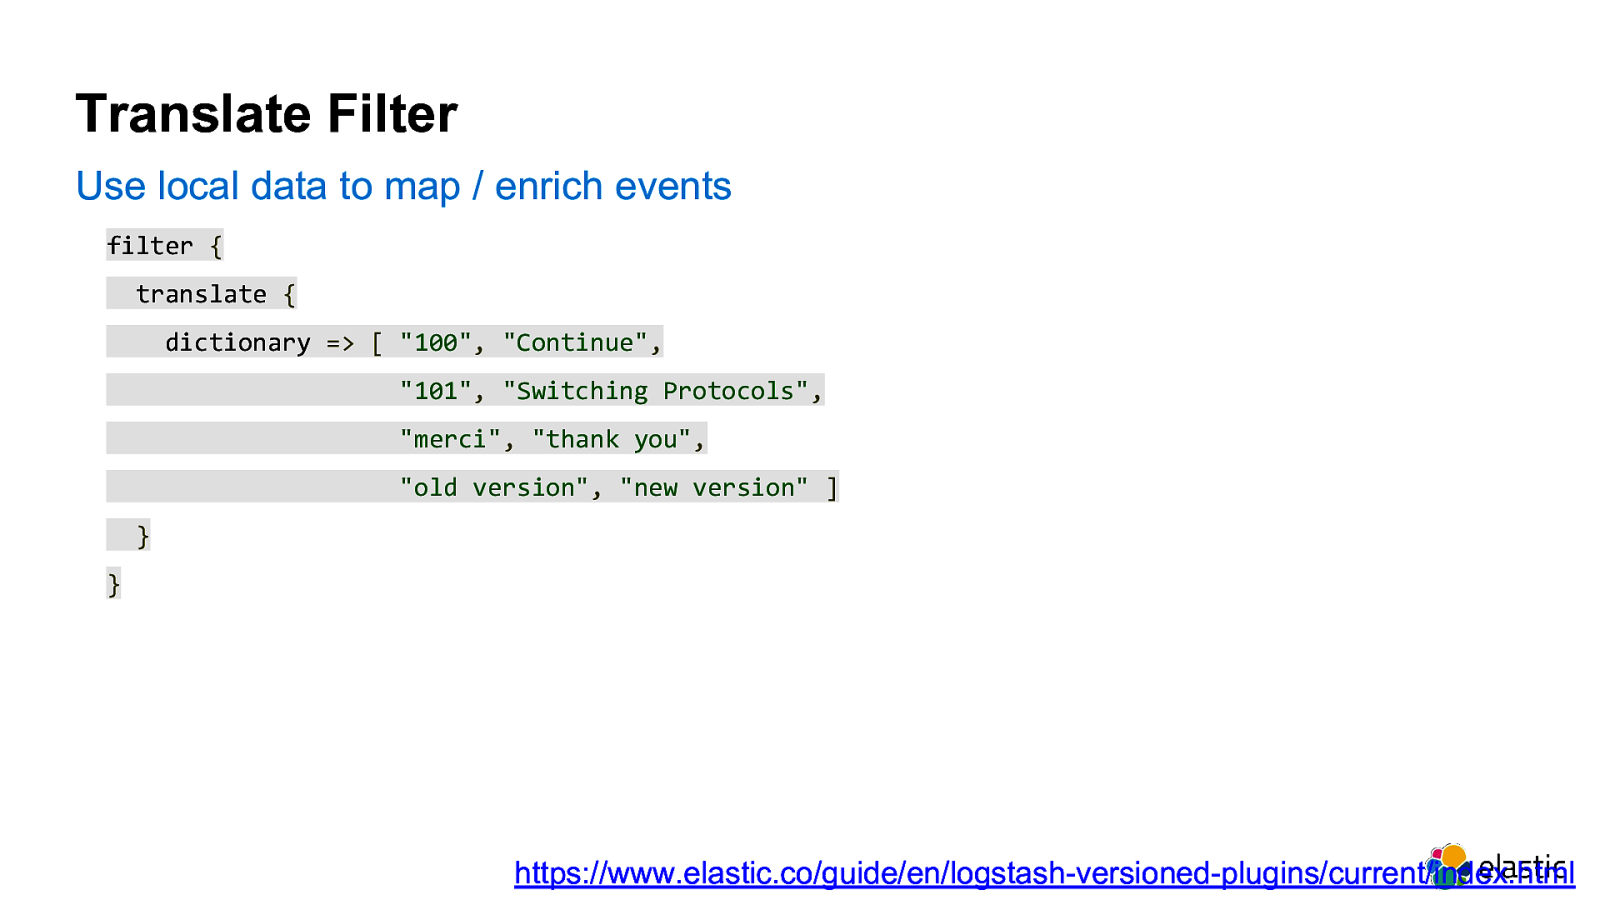
Translate Filter Use local data to map / enrich events filter { translate { dictionary => [ "100", "Continue", "101", "Switching Protocols", "merci", "thank you", "old version", "new version" ] } } https://www.elastic.co/guide/en/logstash-versioned-plugins/current/index.html
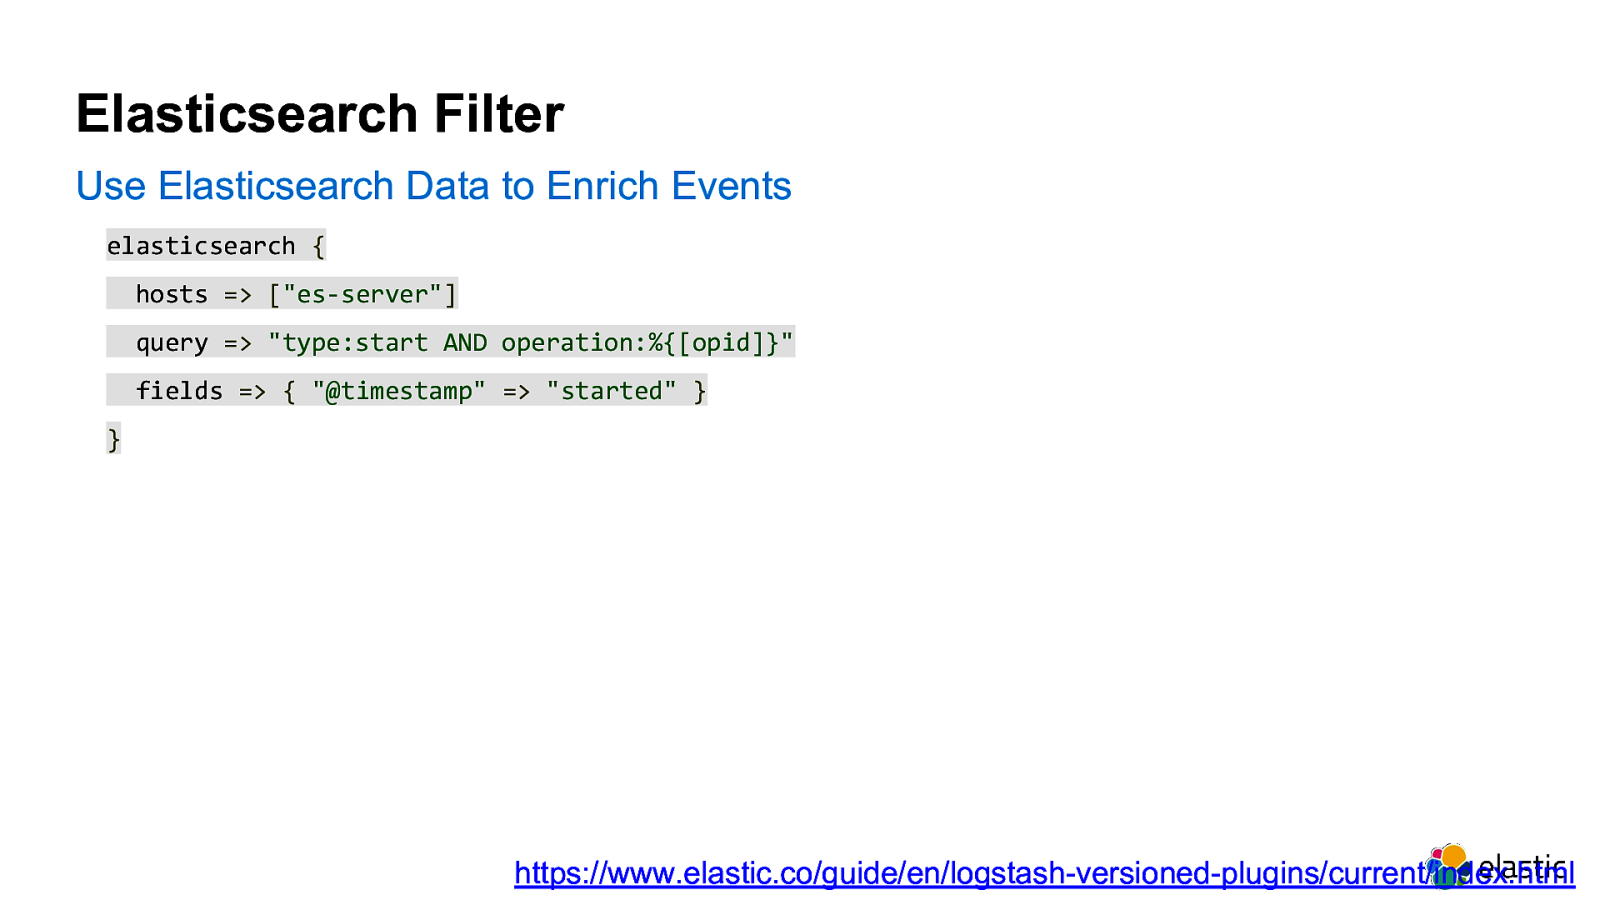
Elasticsearch Filter Use Elasticsearch Data to Enrich Events elasticsearch { hosts => ["es-server"] query => "type:start AND operation:%{[opid]}" fields => { "@timestamp" => "started" } } https://www.elastic.co/guide/en/logstash-versioned-plugins/current/index.html
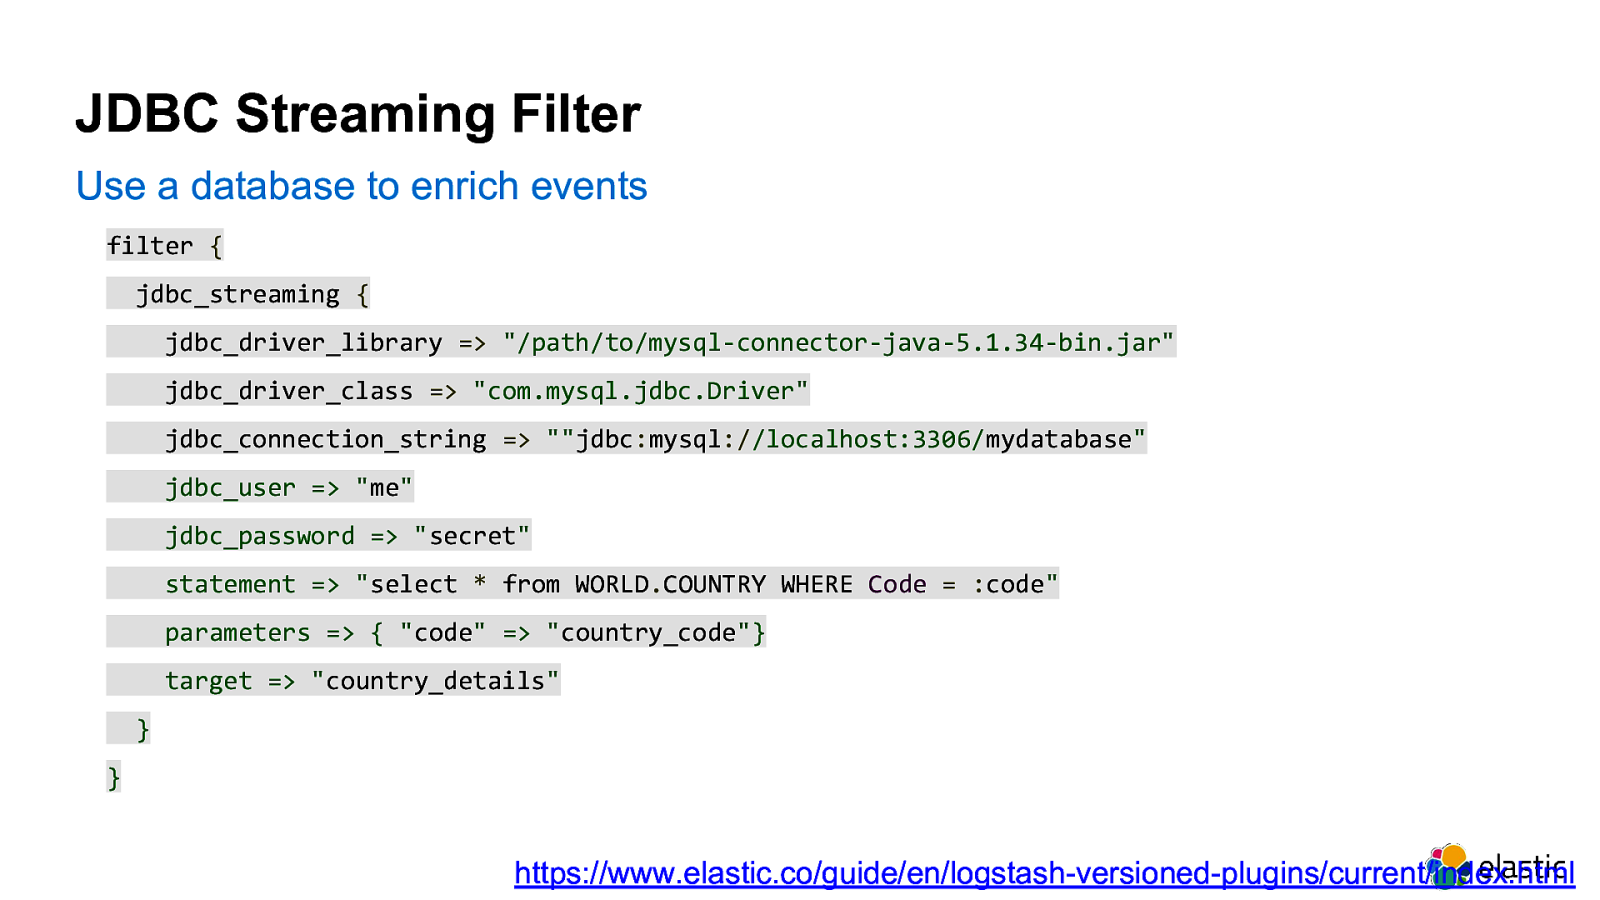
JDBC Streaming Filter Use a database to enrich events filter { jdbc_streaming { jdbc_driver_library => "/path/to/mysql-connector-java-5.1.34-bin.jar" jdbc_driver_class => "com.mysql.jdbc.Driver" jdbc_connection_string => ""jdbc:mysql://localhost:3306/mydatabase" jdbc_user => "me" jdbc_password => "secret" statement => "select * from WORLD.COUNTRY WHERE Code = :code" parameters => { "code" => "country_code"} target => "country_details" } } https://www.elastic.co/guide/en/logstash-versioned-plugins/current/index.html
50
Resources • https://www.elastic.co/learn • https://www.elastic.co/blog/category/engineering • https://discuss.elastic.co/ • https://fb.com/groups/ElasticIndiaUserGroup • https://elastic.co/community 51

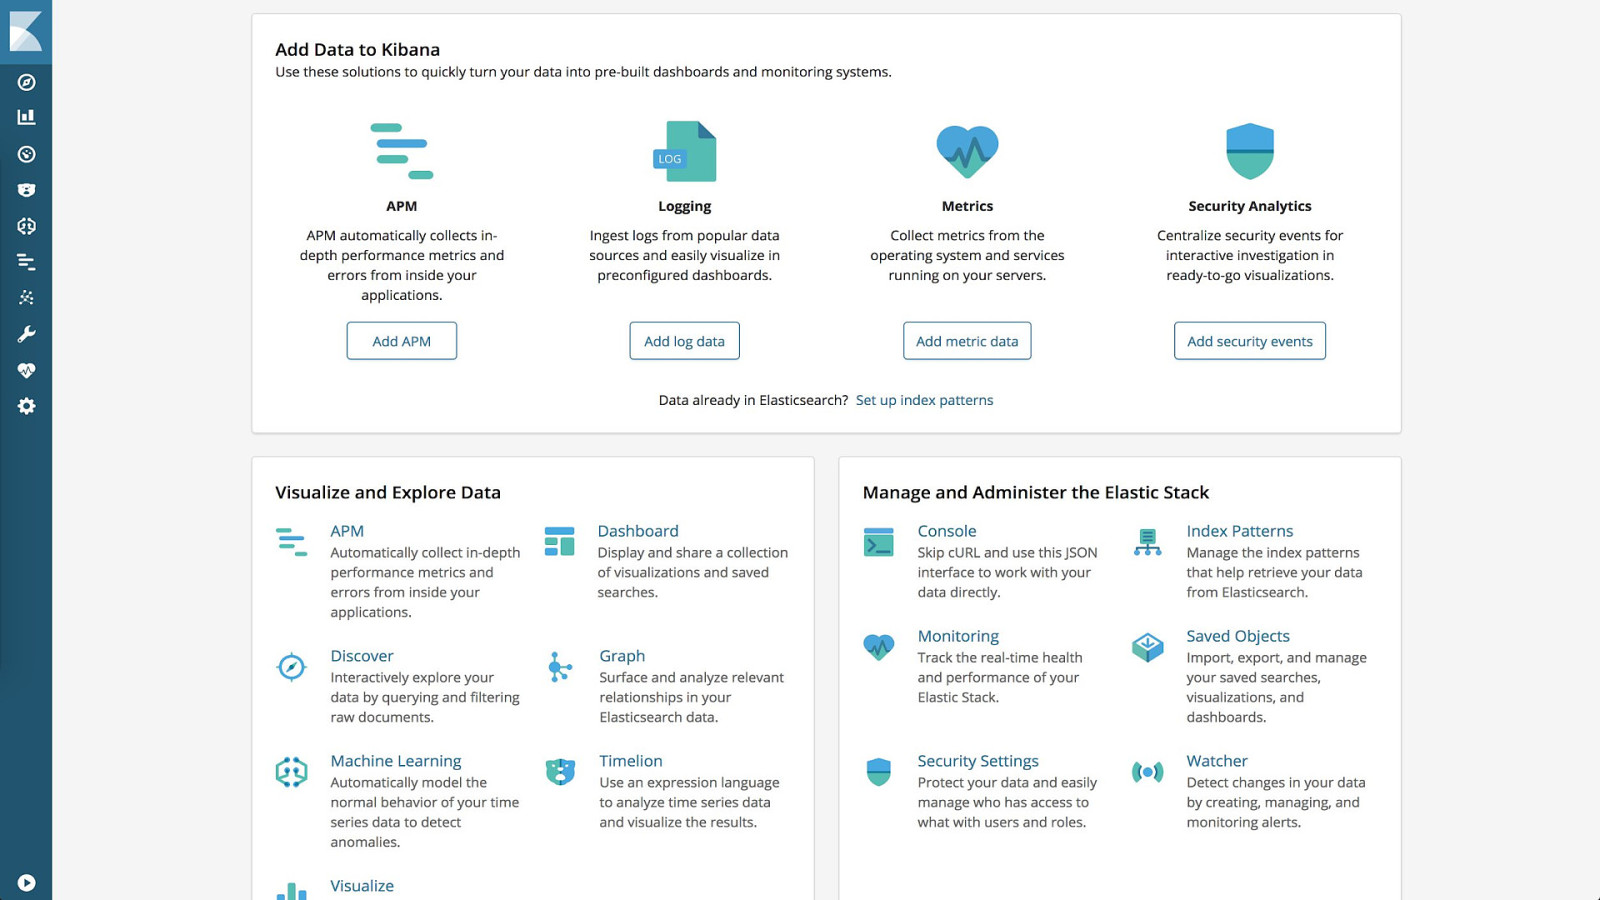
Fin! discuss.elastic.co | aravind@elastic.co | @aravindputrevu 52