Multi-Cloud Infrastructure Monitoring with Elastic Stack Aravind Putrevu Developer | Evangelist @aravindputrevu | aravind.dev 1

A presentation at Elastic User Group Meet at GrabTaxi in October 2019 in Singapore by Aravind Putrevu
Multi-Cloud Infrastructure Monitoring with Elastic Stack Aravind Putrevu Developer | Evangelist @aravindputrevu | aravind.dev 1
{ “name”: “Aravind Putrevu”, “title”: “Developer Advocate”, “company”: “Elastic”, “personal_website”: “aravind.dev”, “social_media”: { “twitter”: “@aravindputrevu”, “linkedin”: “Aravind Putrevu” } } 2
Agenda 1 Why Monitoring? 2 Why Elastic Stack? 3 Beats : Lightweight data shipper framework 4 Monitor All things with Beats 5 Demo 3
Agenda 1 Why Monitoring? 2 Why Elastic Stack? 3 Beats : Lightweight data shipper framework 4 Monitor All things with Beats 5 Demo 4
Agenda 1 Why Monitoring? 2 Why Elastic Stack? 3 Beats : Lightweight data shipper framework 4 Monitor All things with Beats 5 Demo 5
Agenda 1 Why Monitoring? 2 Why Elastic Stack? 3 Beats : Lightweight data shipper framework 4 Monitor All things with Beats 5 Demo 6
Agenda 1 Why Monitoring? 2 Why Elastic Stack? 3 Beats : Lightweight data shipper framework 4 Monitor All things with Beats 5 Demo 7
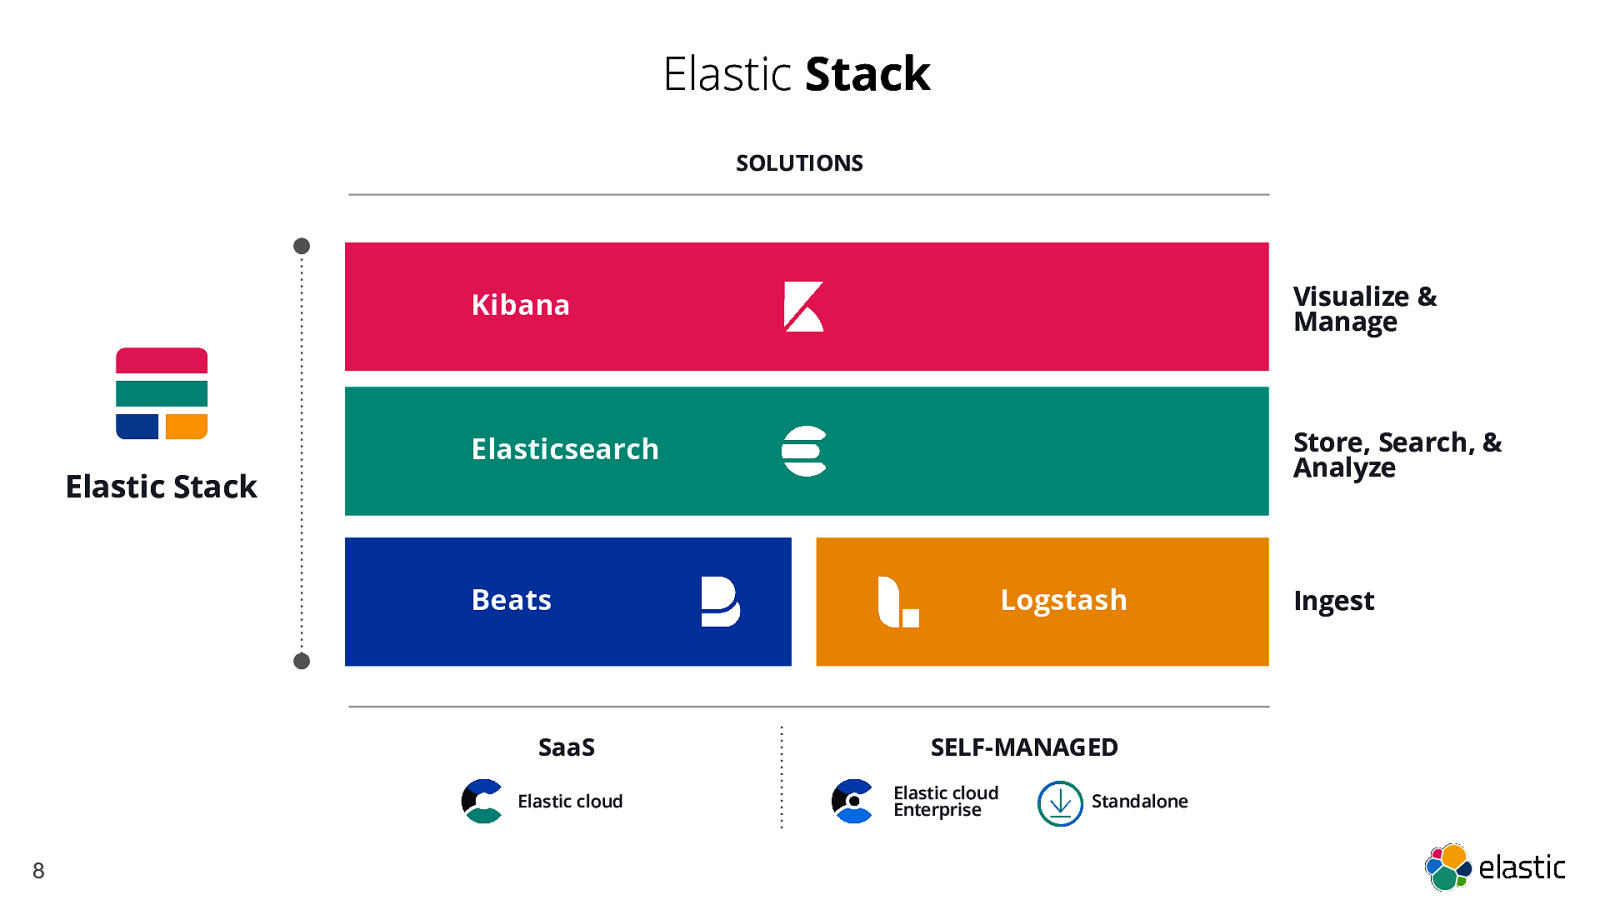
Elastic Stack SOLUTIONS Kibana Visualize & Manage Elasticsearch Store, Search, & Analyze Elastic Stack Beats SaaS Elastic cloud 8 Logstash SELF-MANAGED Elastic cloud Enterprise Standalone Ingest
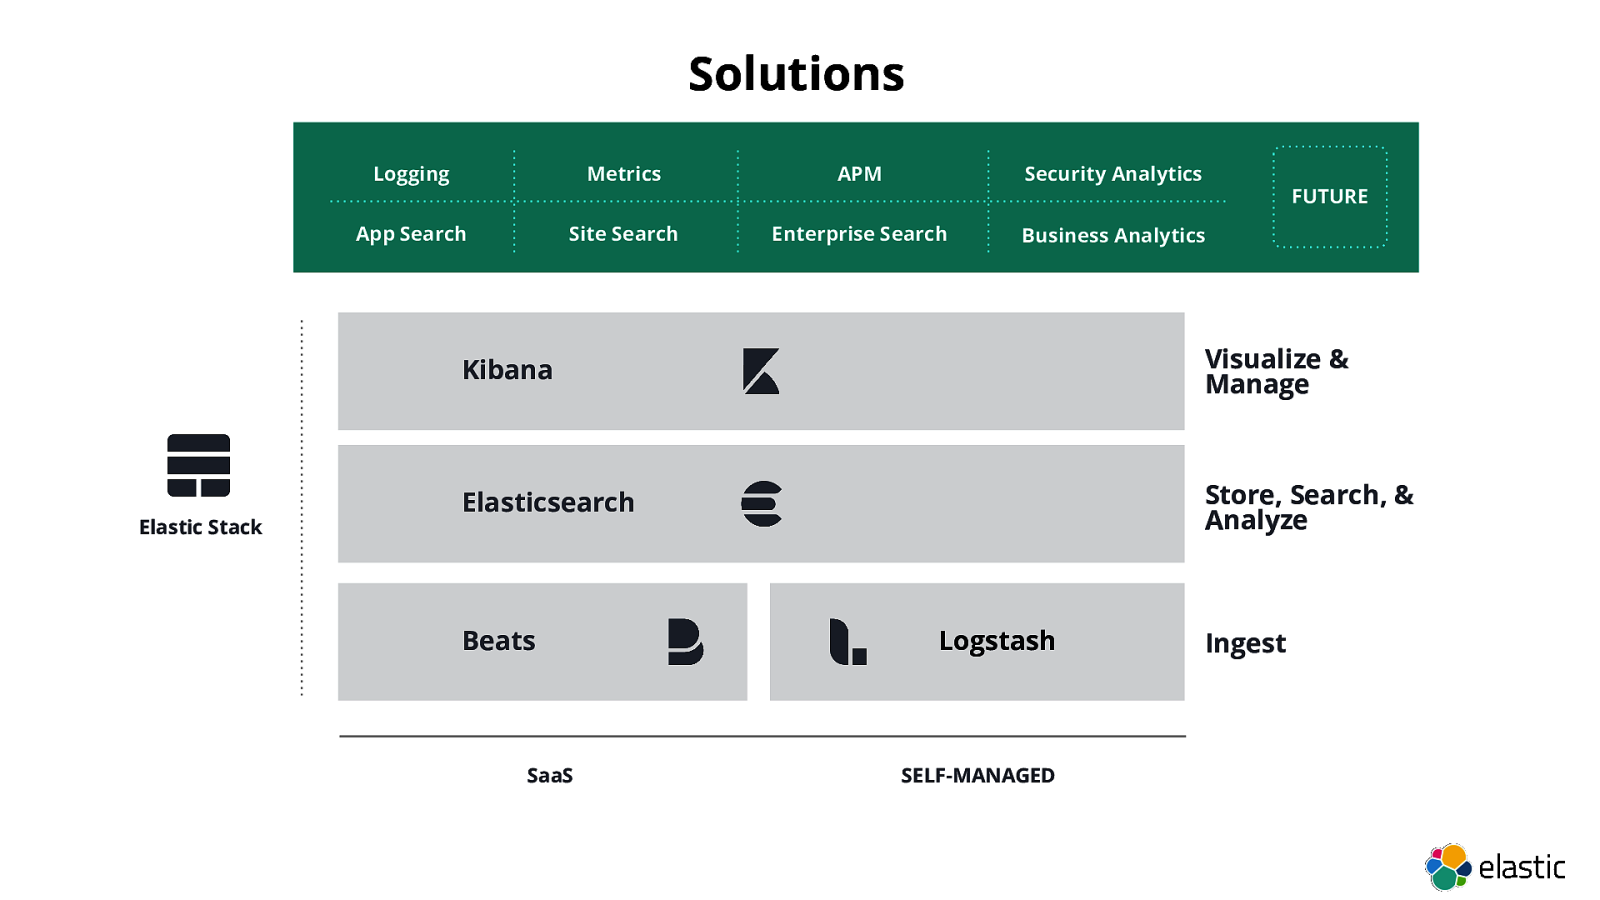
Solutions Logging Metrics APM Security Analytics FUTURE App Search Site Search Enterprise Search Business Analytics Kibana Visualize & Manage Elasticsearch Store, Search, & Analyze Elastic Stack Beats SaaS Logstash SELF-MANAGED Ingest
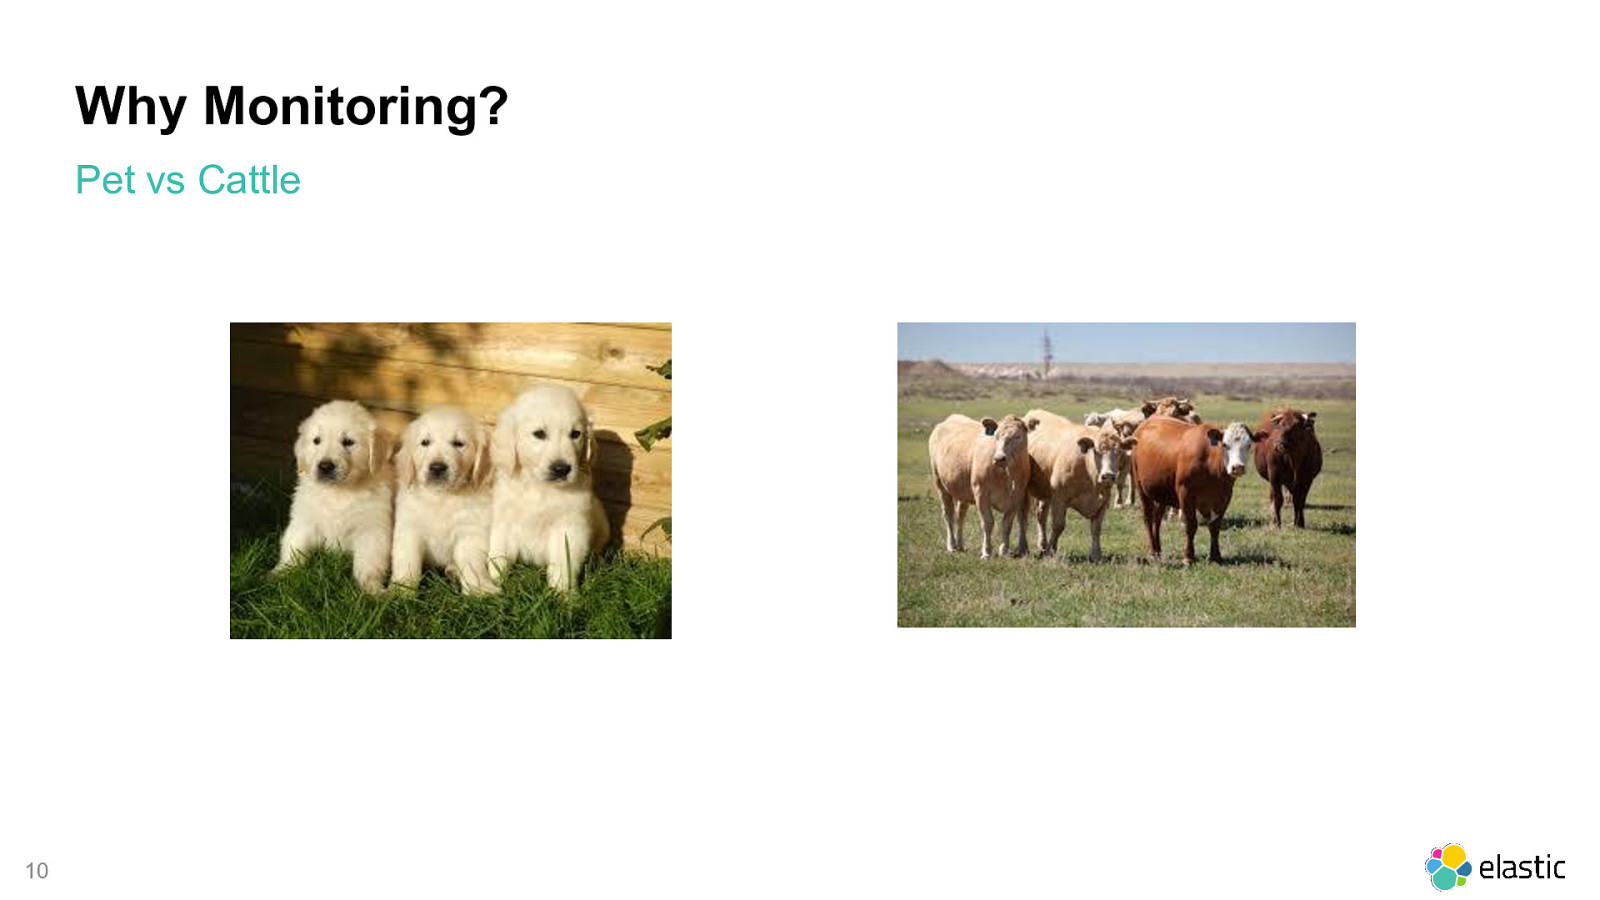
Why Monitoring? Pet vs Cattle 10
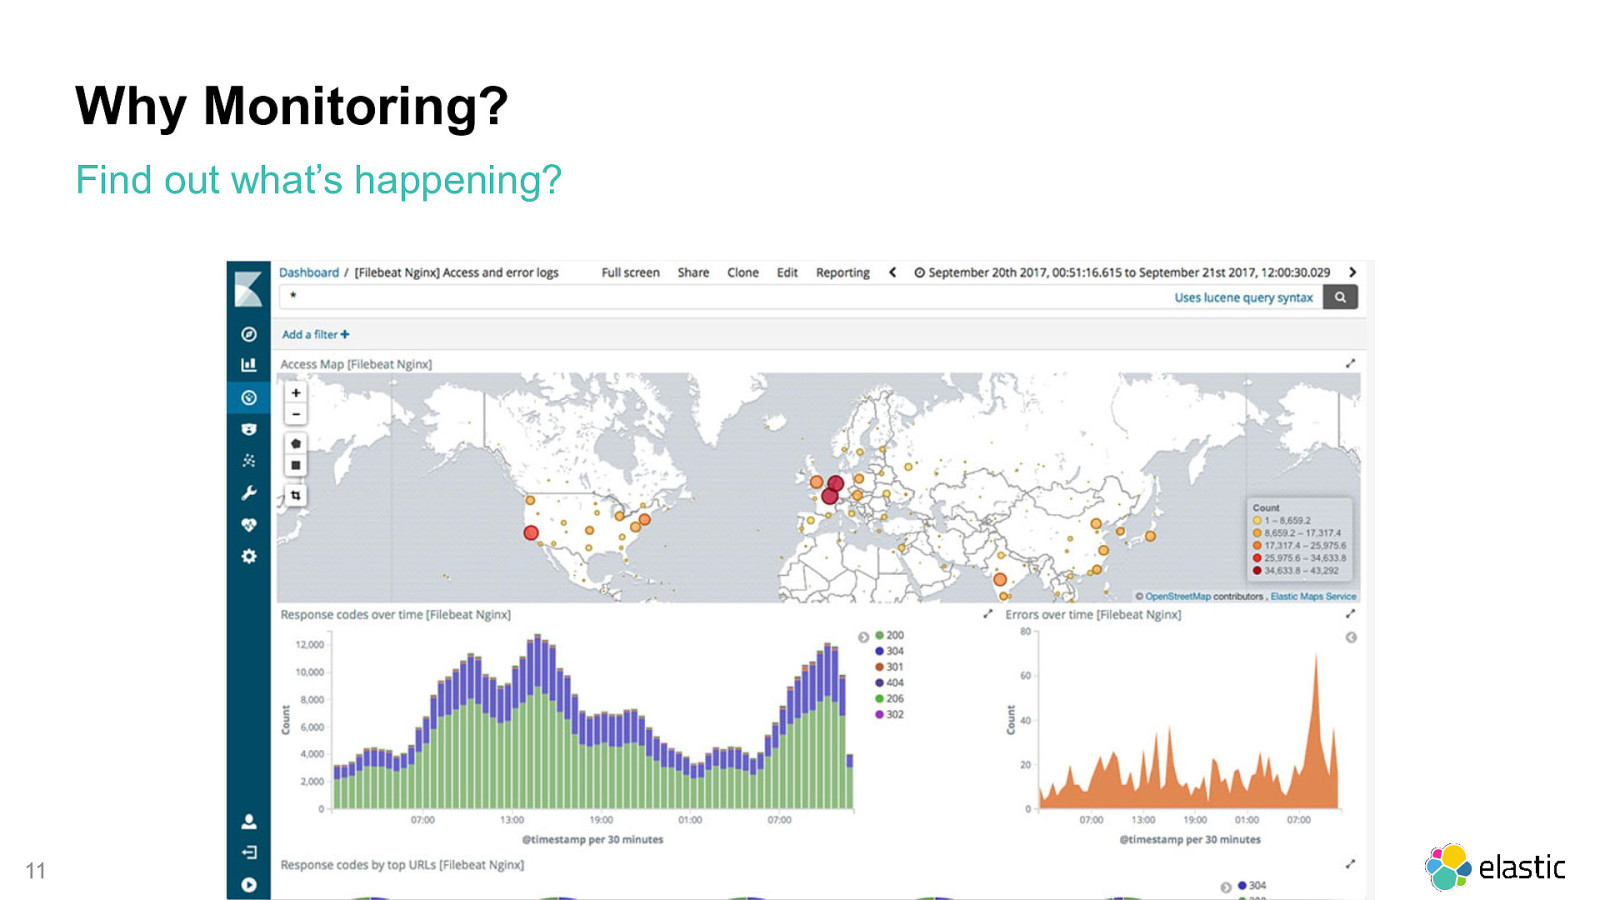
Why Monitoring? Find out what’s happening? 11
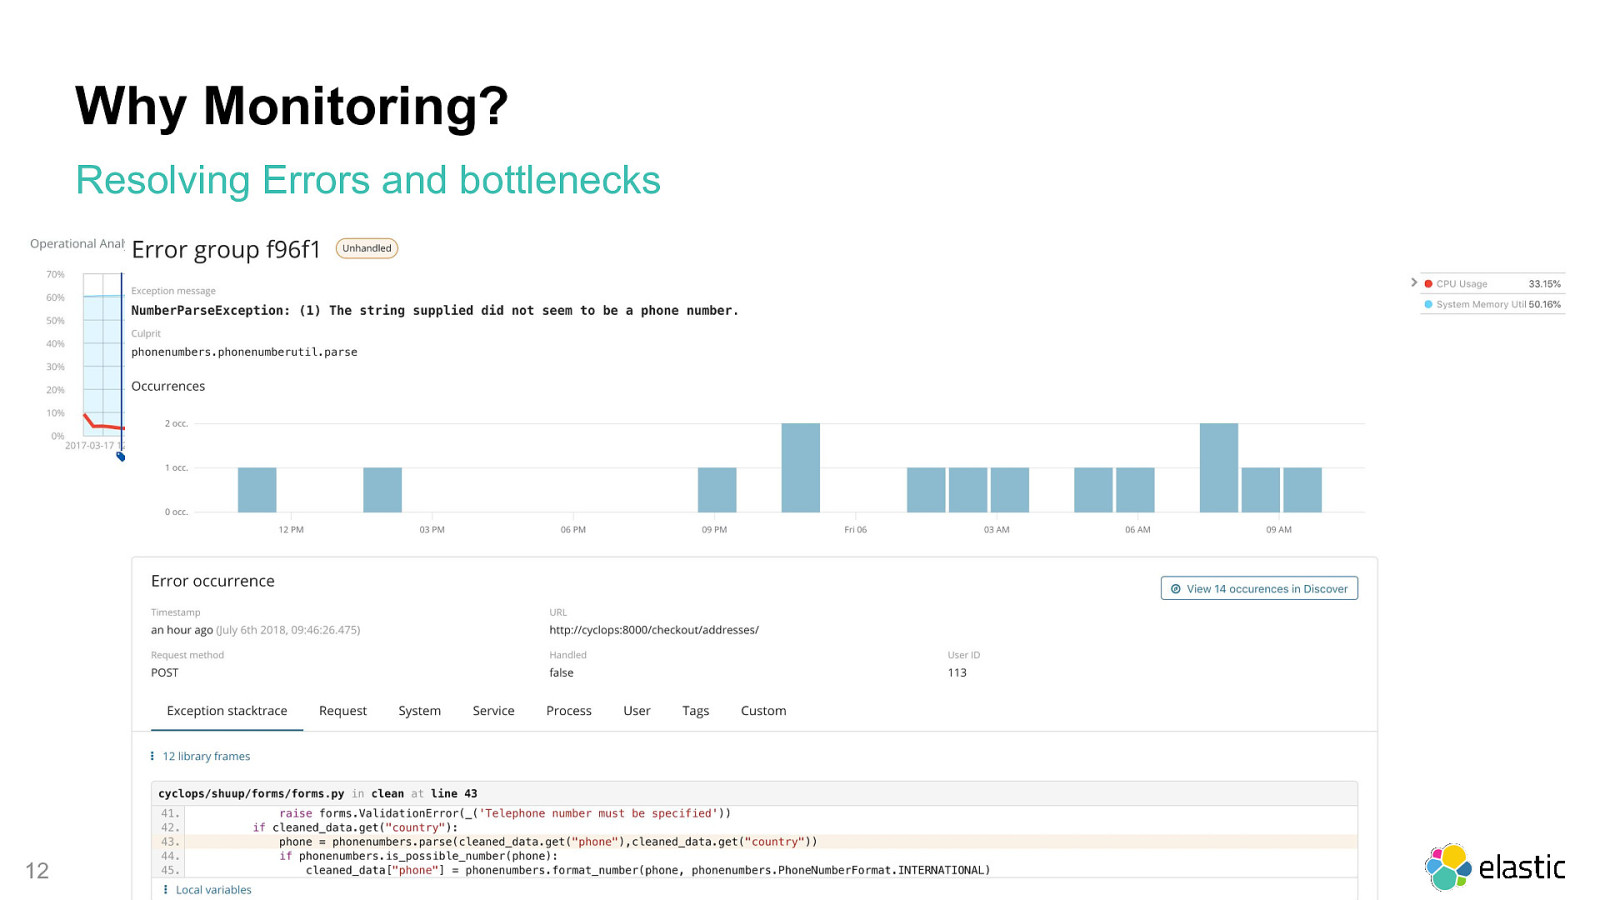
Why Monitoring? Resolving Errors and bottlenecks 12
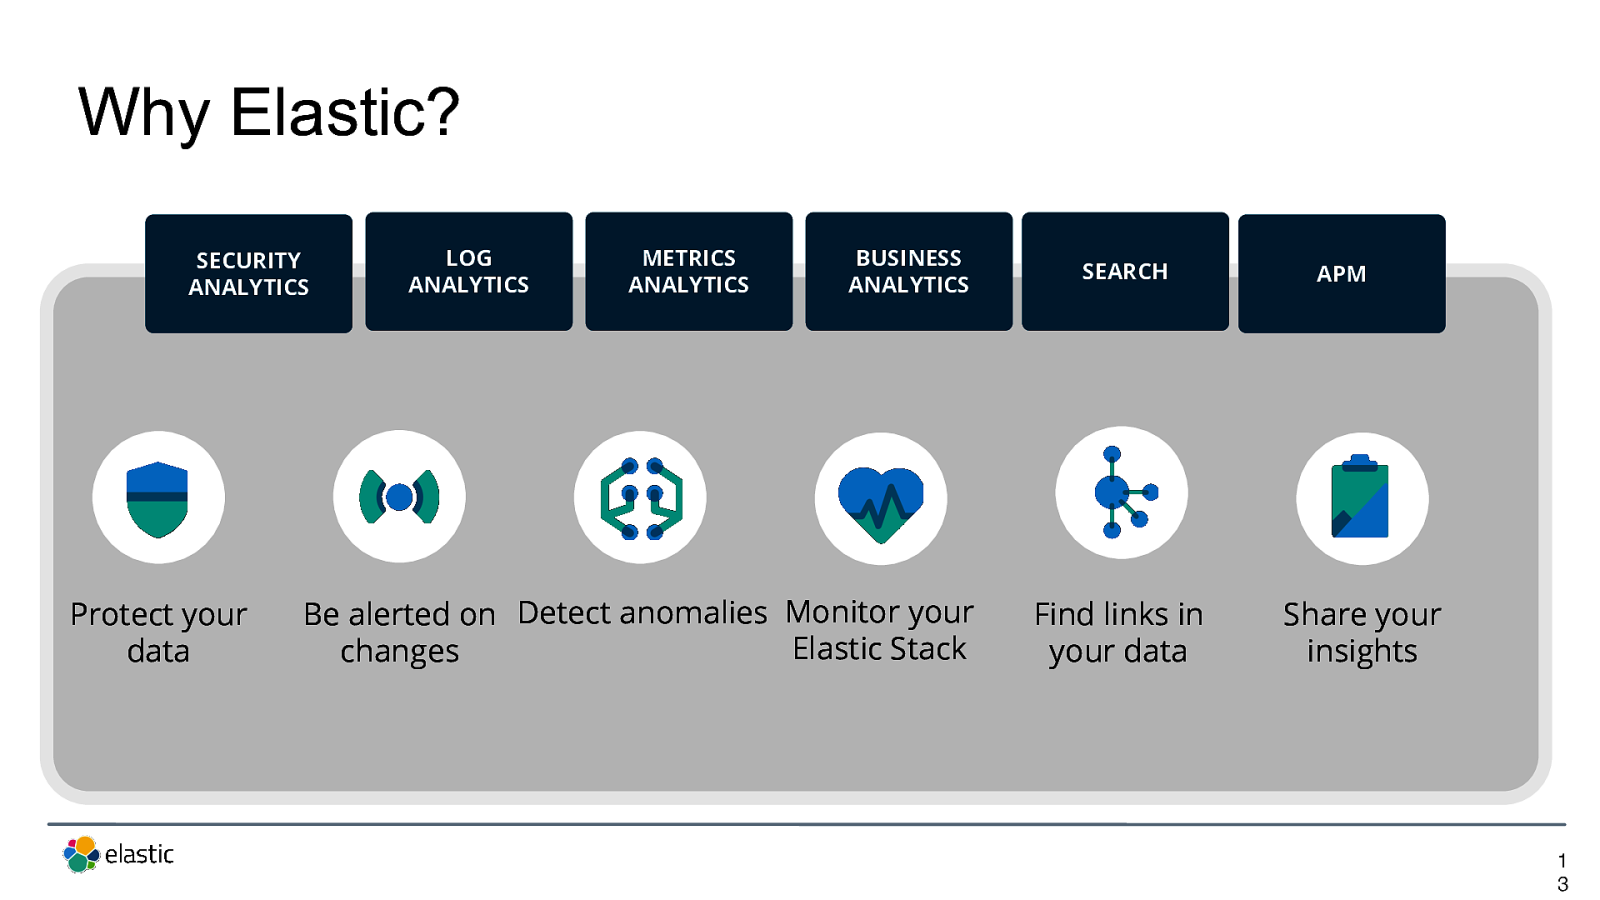
Why Elastic? SECURITY ANALYTICS
LOG ANALYTICS
METRICS ANALYTICS
BUSINESS ANALYTICS
SEARCH
APM
Protect your data
Be alerted on Detect anomalies Monitor your Elastic Stack changes
Find links in your data
Share your insights
1 3
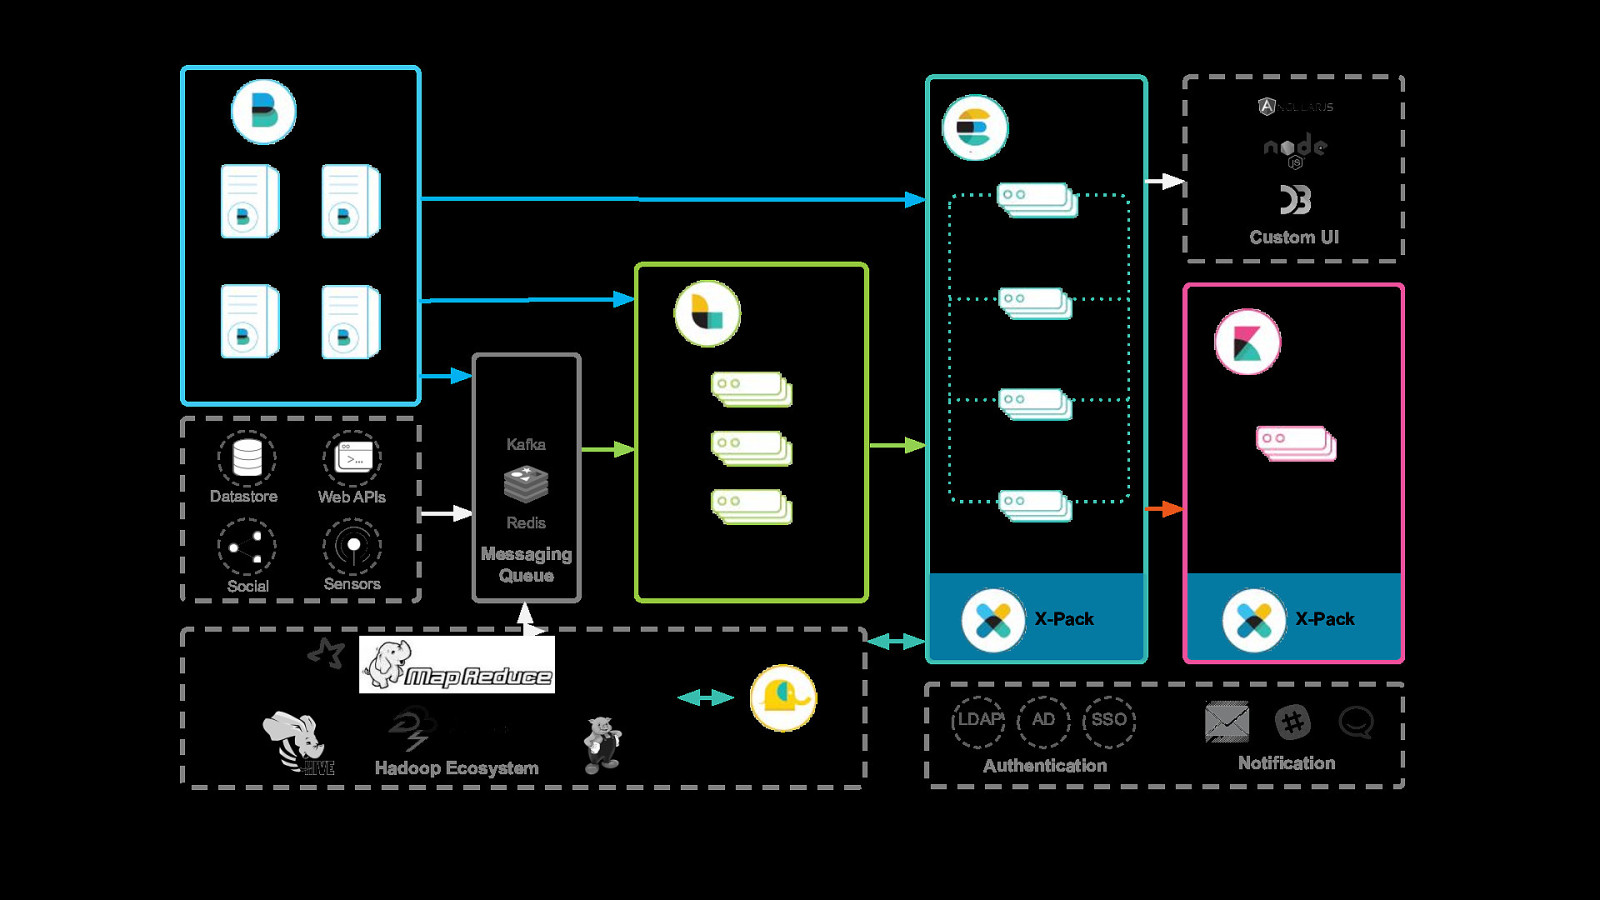
Beats Elasticsearch Master Nodes (3) Log Files Metrics Custom UI Logstash Ingest Nodes (X) Wire Data Kibana your{beat} Data Nodes – Hot (X) Kafka Instances (X) Datastore Web APIs Redis Social Sensors Messaging Queue Data Notes – Warm (X) Nodes (X) X-Pack LDAP Hadoop Ecosystem ES-Hadoop AD X-Pack SSO Authentication Notification
Beats Elasticsearch Master Nodes (3) Log Files Metrics Custom UI Logstash Ingest Nodes (X) Wire Data Kibana your{beat} Data Nodes – Hot (X) Kafka Instances (X) Datastore Web APIs Redis Social Sensors Messaging Queue Data Notes – Warm (X) Nodes (X) X-Pack LDAP Hadoop Ecosystem ES-Hadoop AD X-Pack SSO Authentication Notification
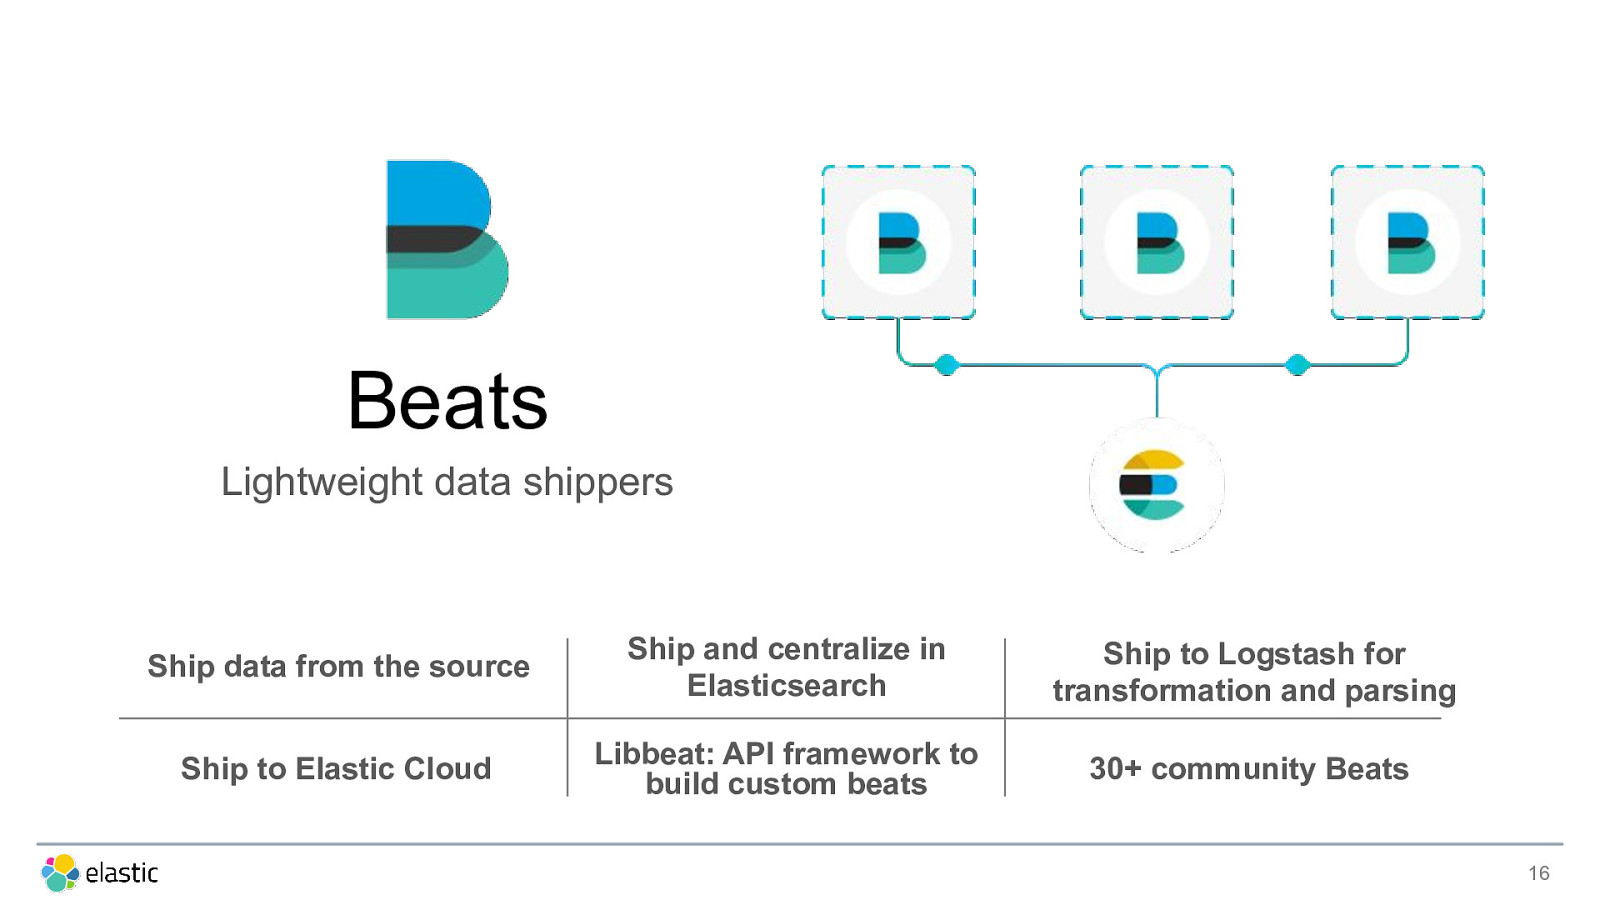
Beats Lightweight data shippers Ship data from the source Ship and centralize in Elasticsearch Ship to Logstash for transformation and parsing Ship to Elastic Cloud Libbeat: API framework to build custom beats 30+ community Beats 16
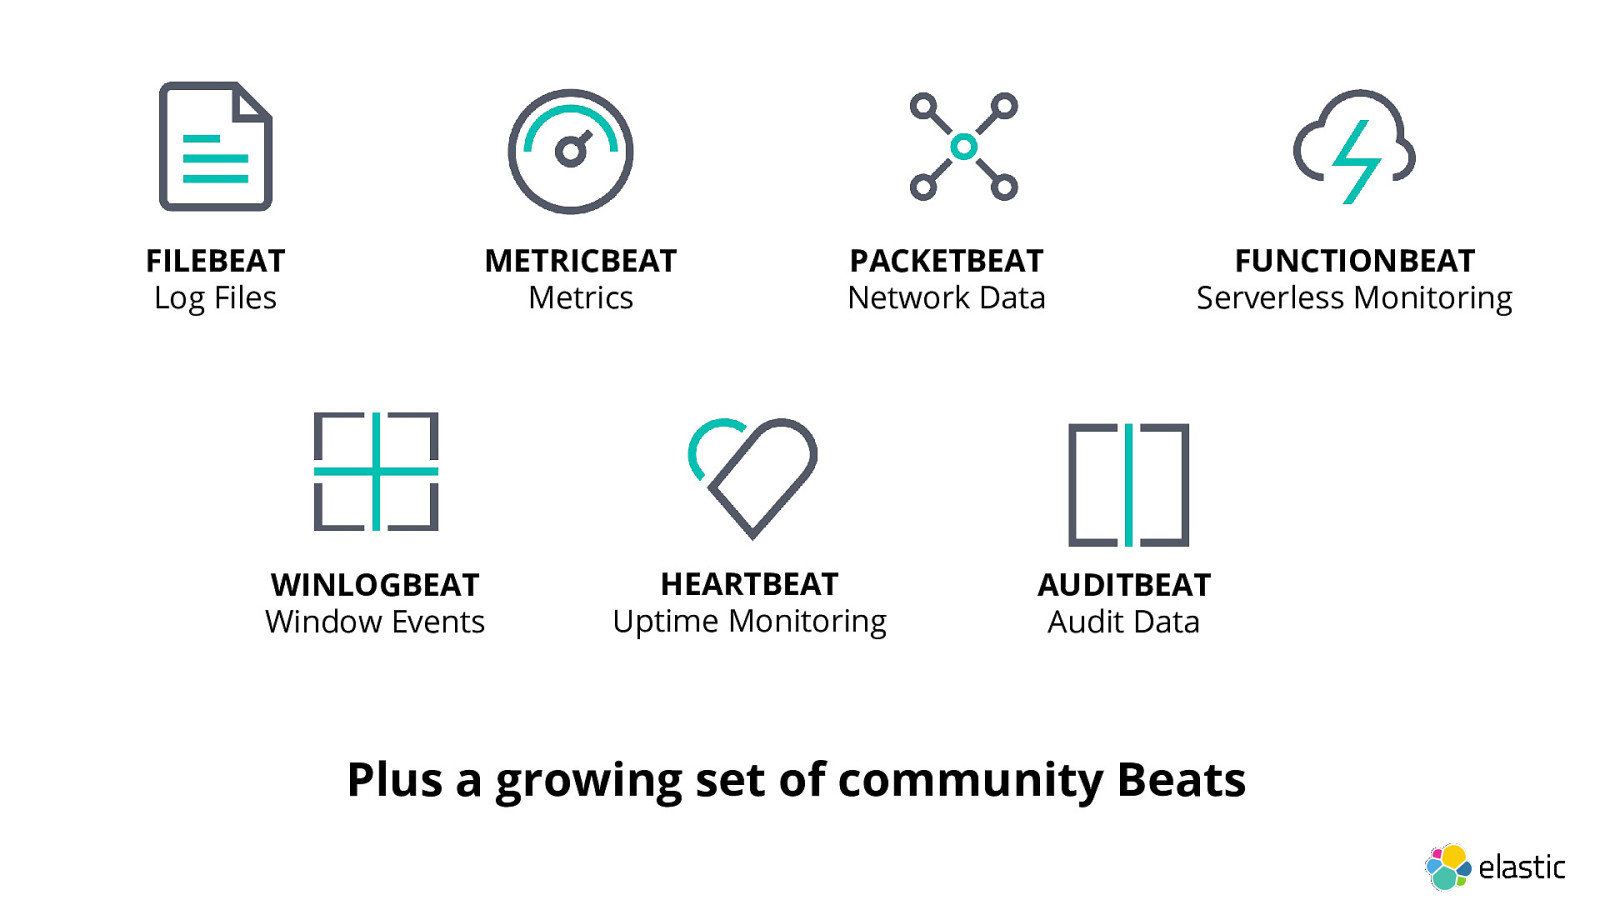
FILEBEAT Log Files METRICBEAT Metrics WINLOGBEAT Window Events PACKETBEAT Network Data HEARTBEAT Uptime Monitoring FUNCTIONBEAT Serverless Monitoring AUDITBEAT Audit Data Plus a growing set of community Beats
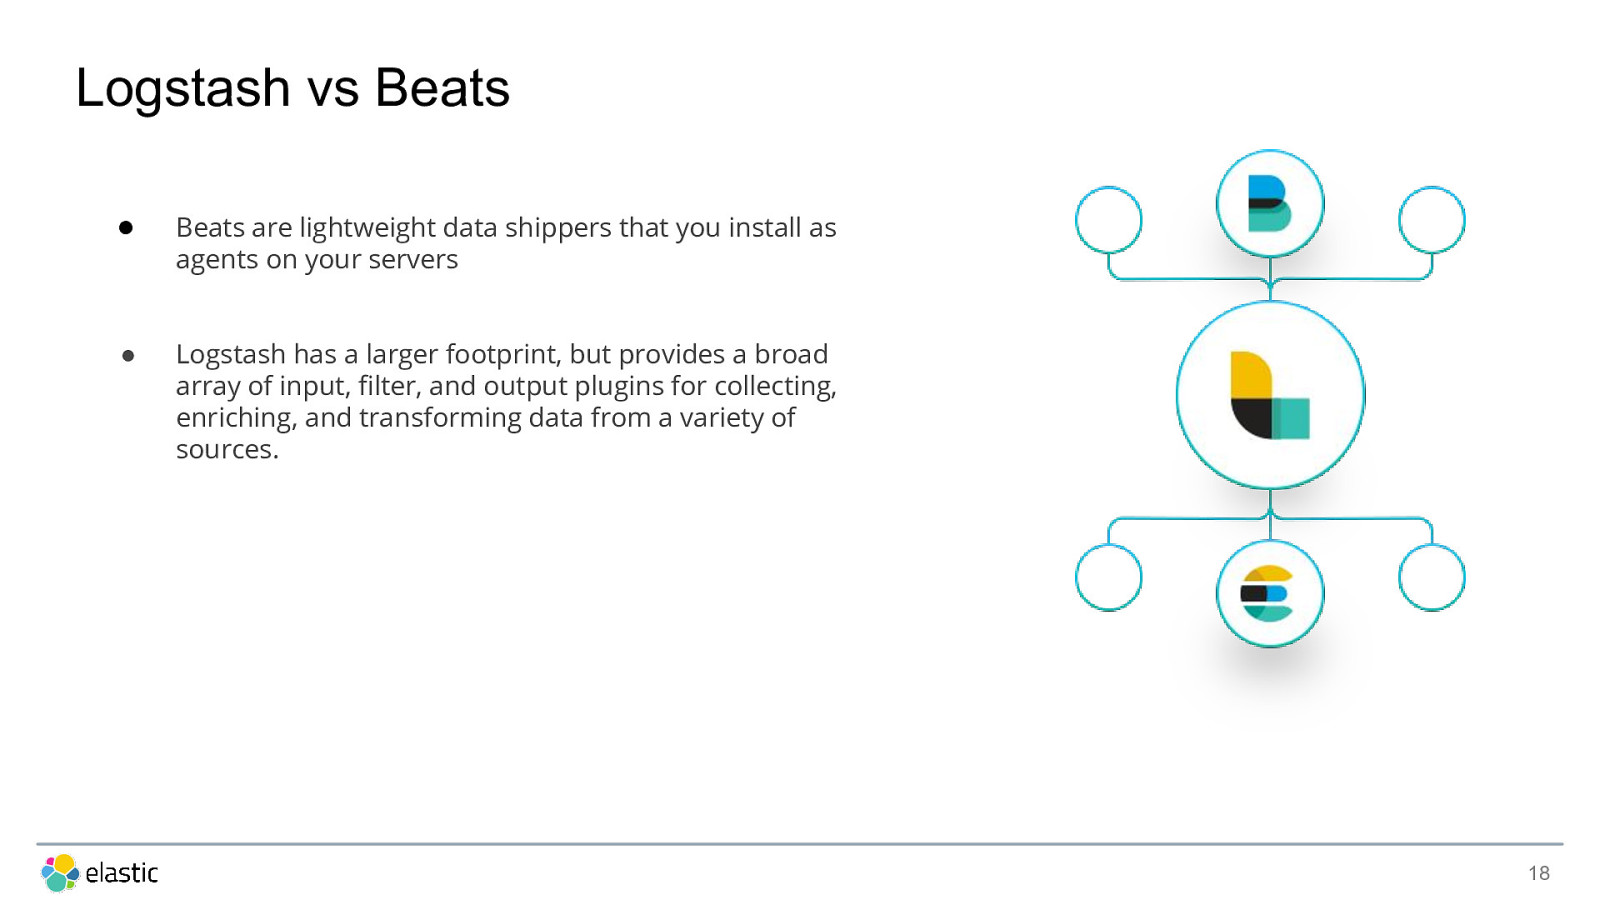
Logstash vs Beats ● Beats are lightweight data shippers that you install as agents on your servers ● Logstash has a larger footprint, but provides a broad array of input, filter, and output plugins for collecting, enriching, and transforming data from a variety of sources. 18
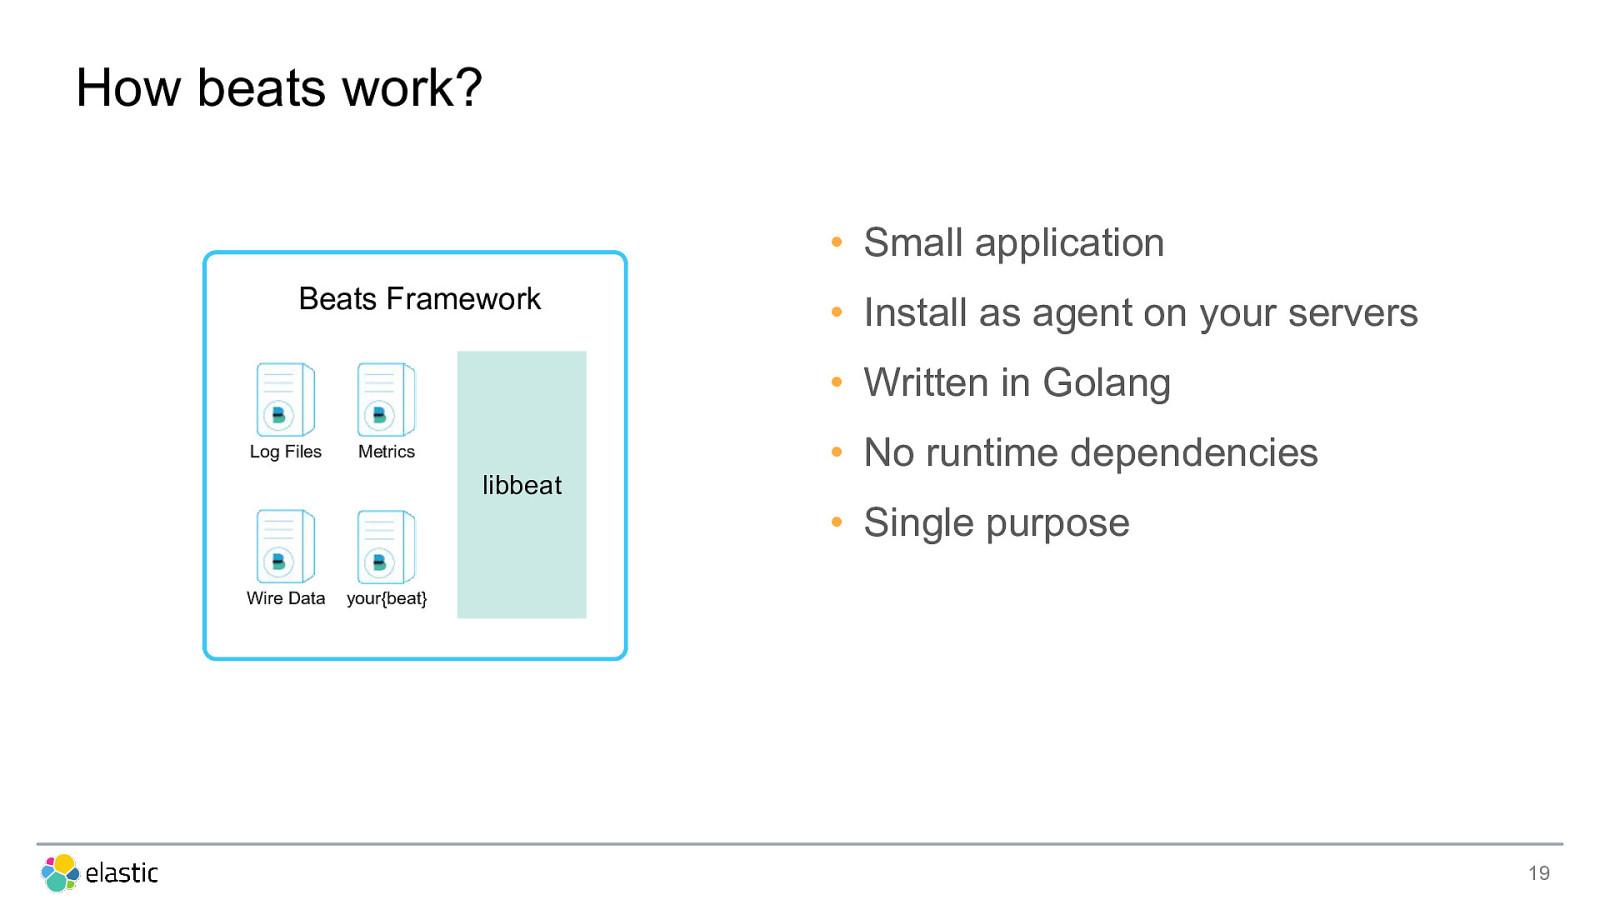
How beats work? • Small application Beats Framework • Install as agent on your servers • Written in Golang Log Files • No runtime dependencies Metrics libbeat • Single purpose Wire Data your{beat} 19
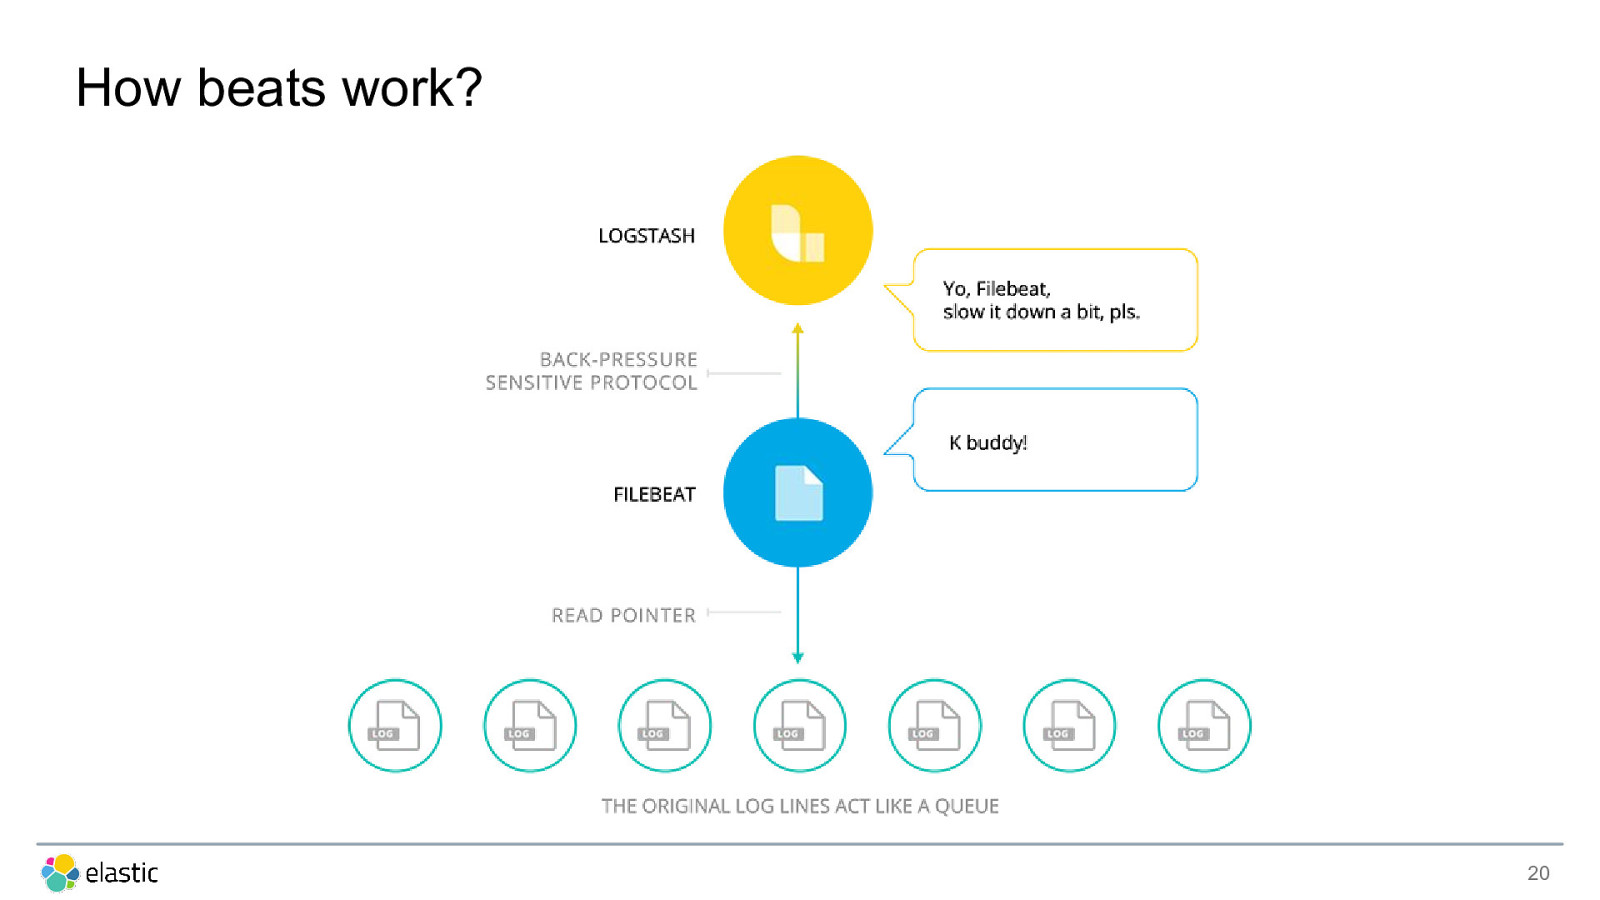
How beats work? 20
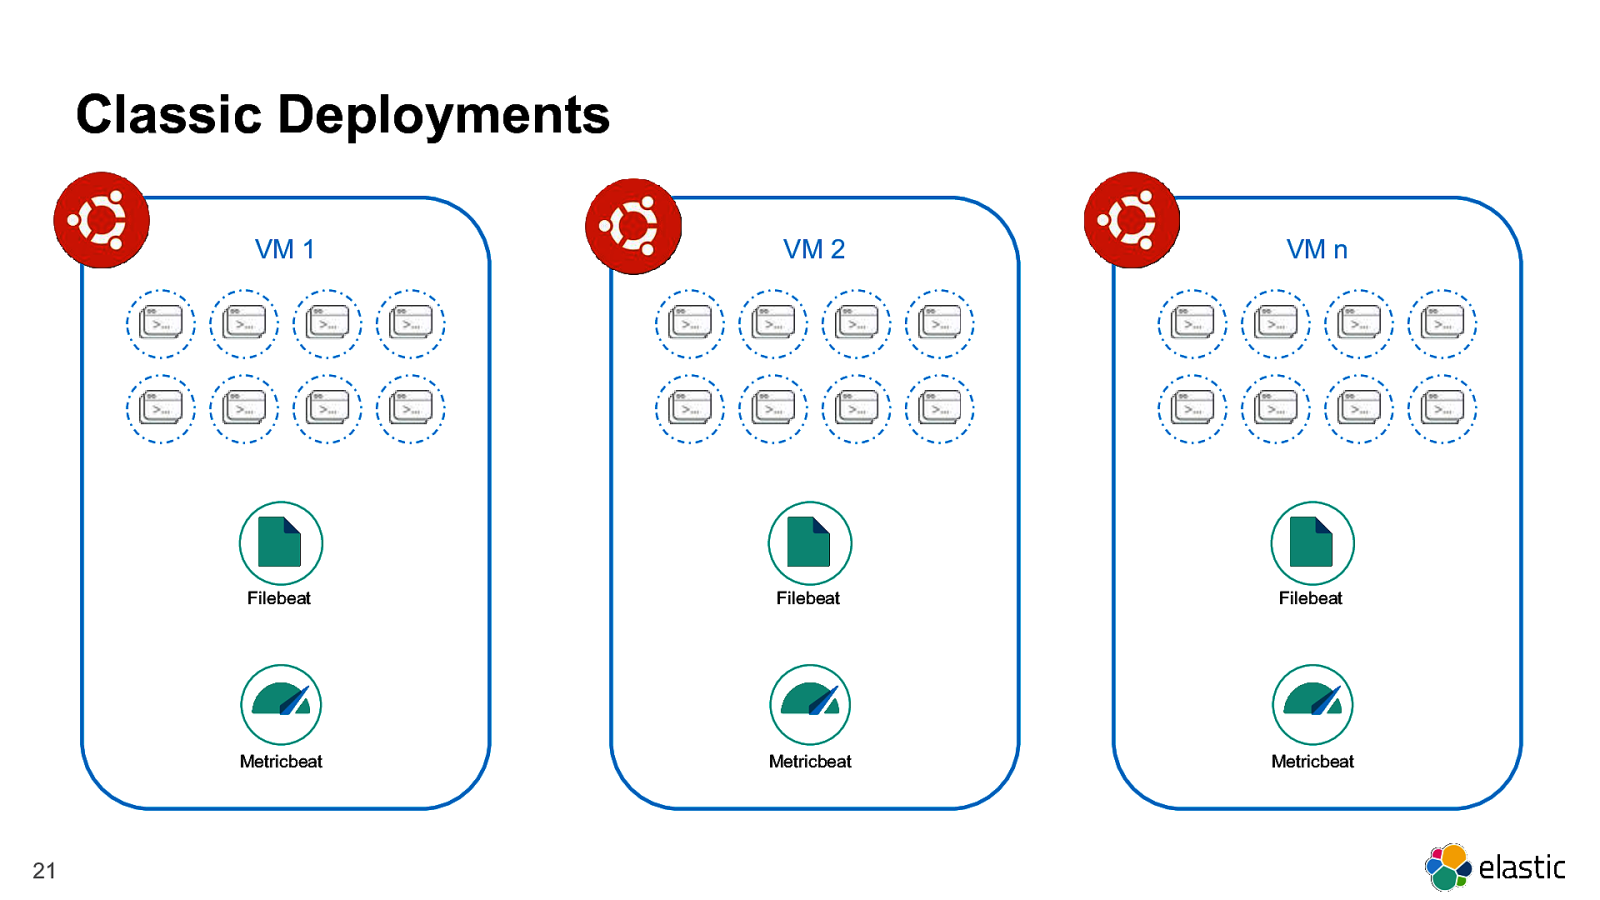
Classic Deployments VM 1 21 VM 2 VM n Filebeat Filebeat Filebeat Metricbeat Metricbeat Metricbeat
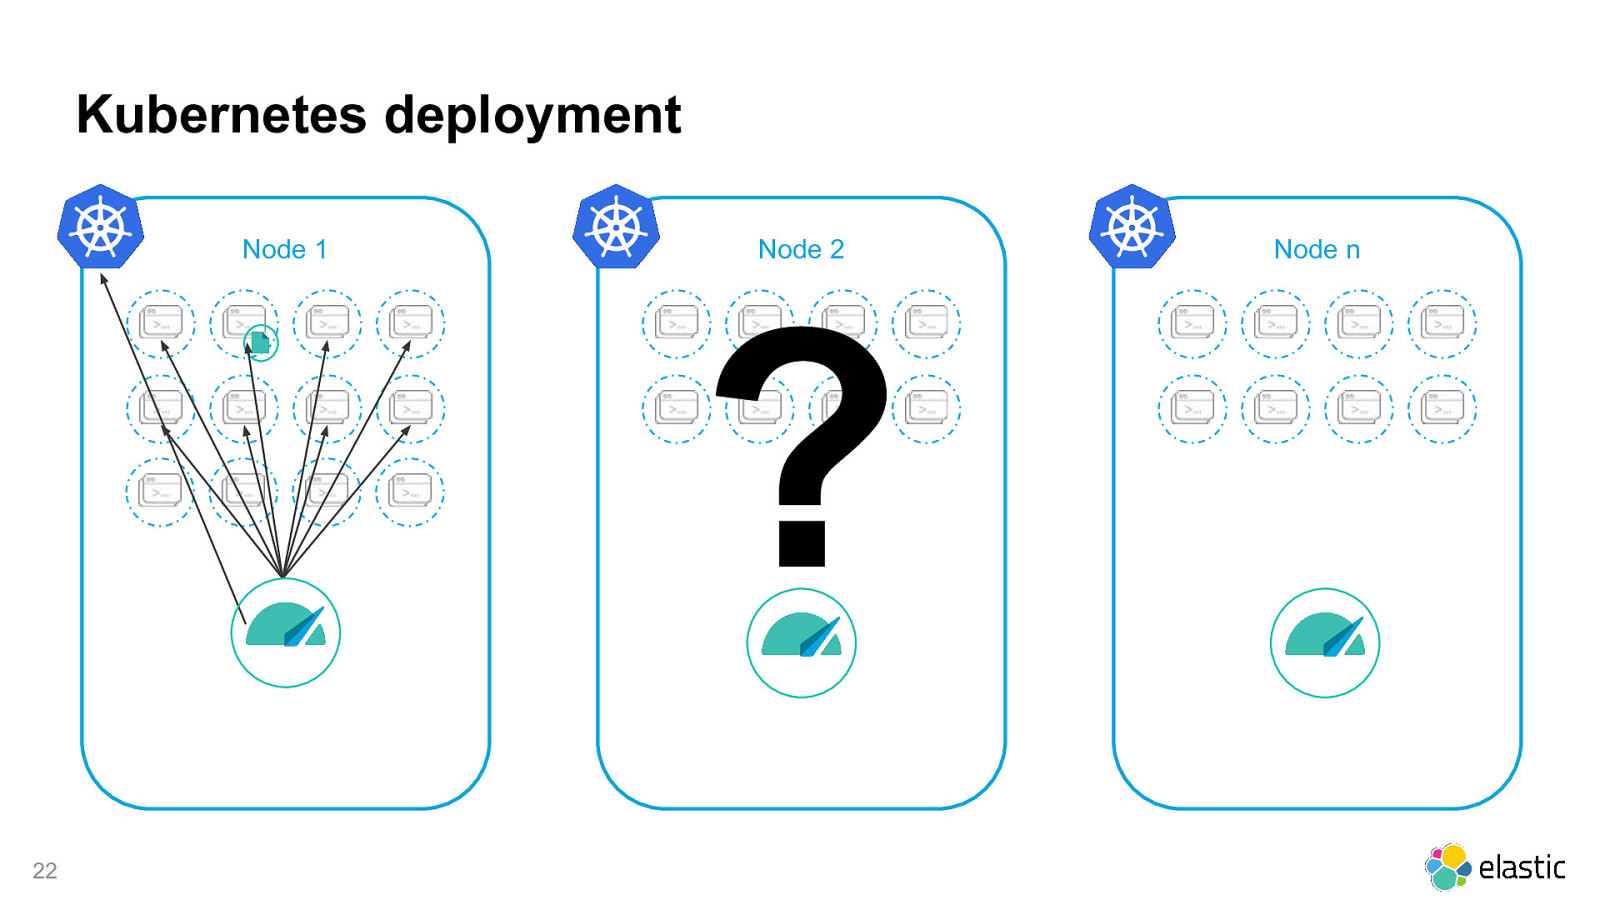
Kubernetes deployment Node 1 Node 2 ? 22 Node n
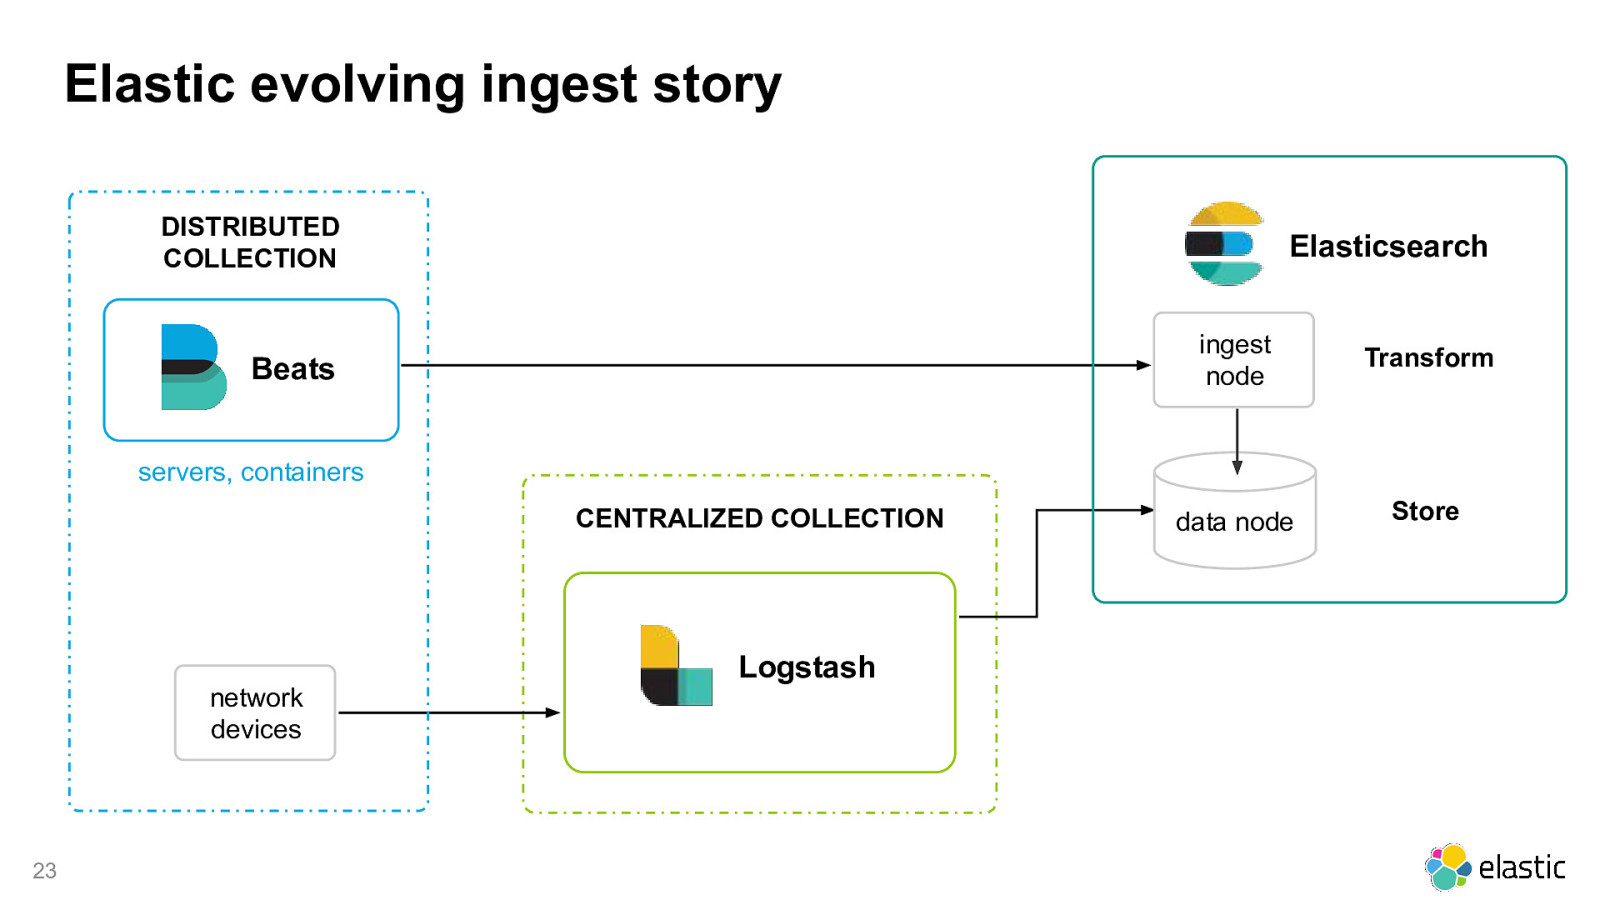
Elastic evolving ingest story DISTRIBUTED COLLECTION Elasticsearch Beats ingest node Transform data node Store servers, containers CENTRALIZED COLLECTION Logstash network devices 23
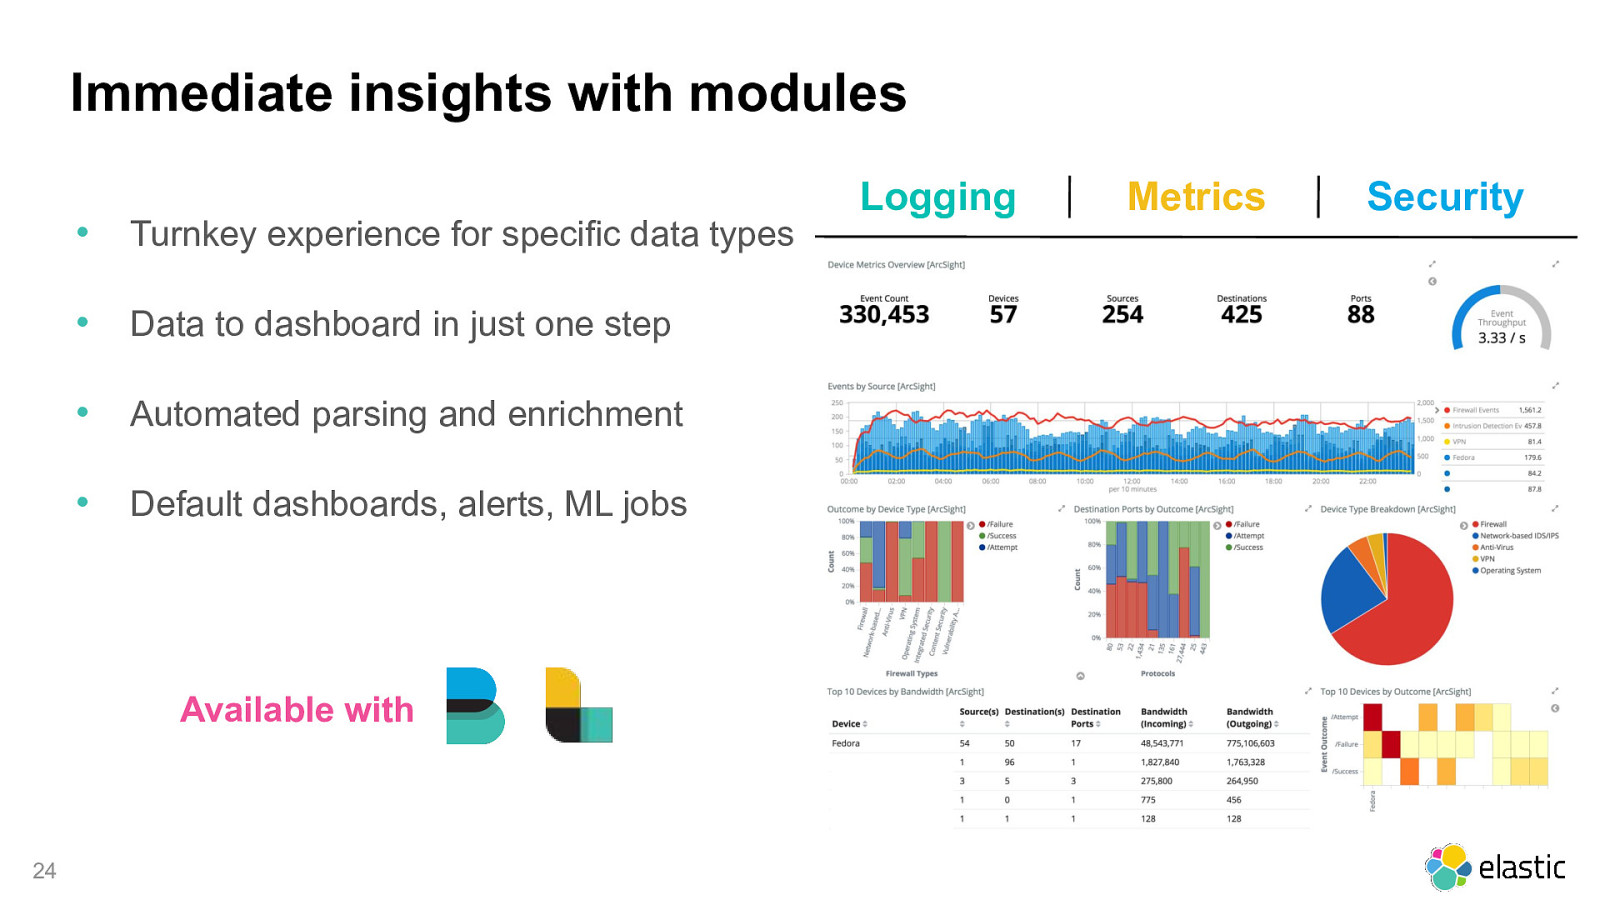
Immediate insights with modules Logging • Turnkey experience for specific data types • Data to dashboard in just one step • Automated parsing and enrichment • Default dashboards, alerts, ML jobs Available with 24 Metrics Security
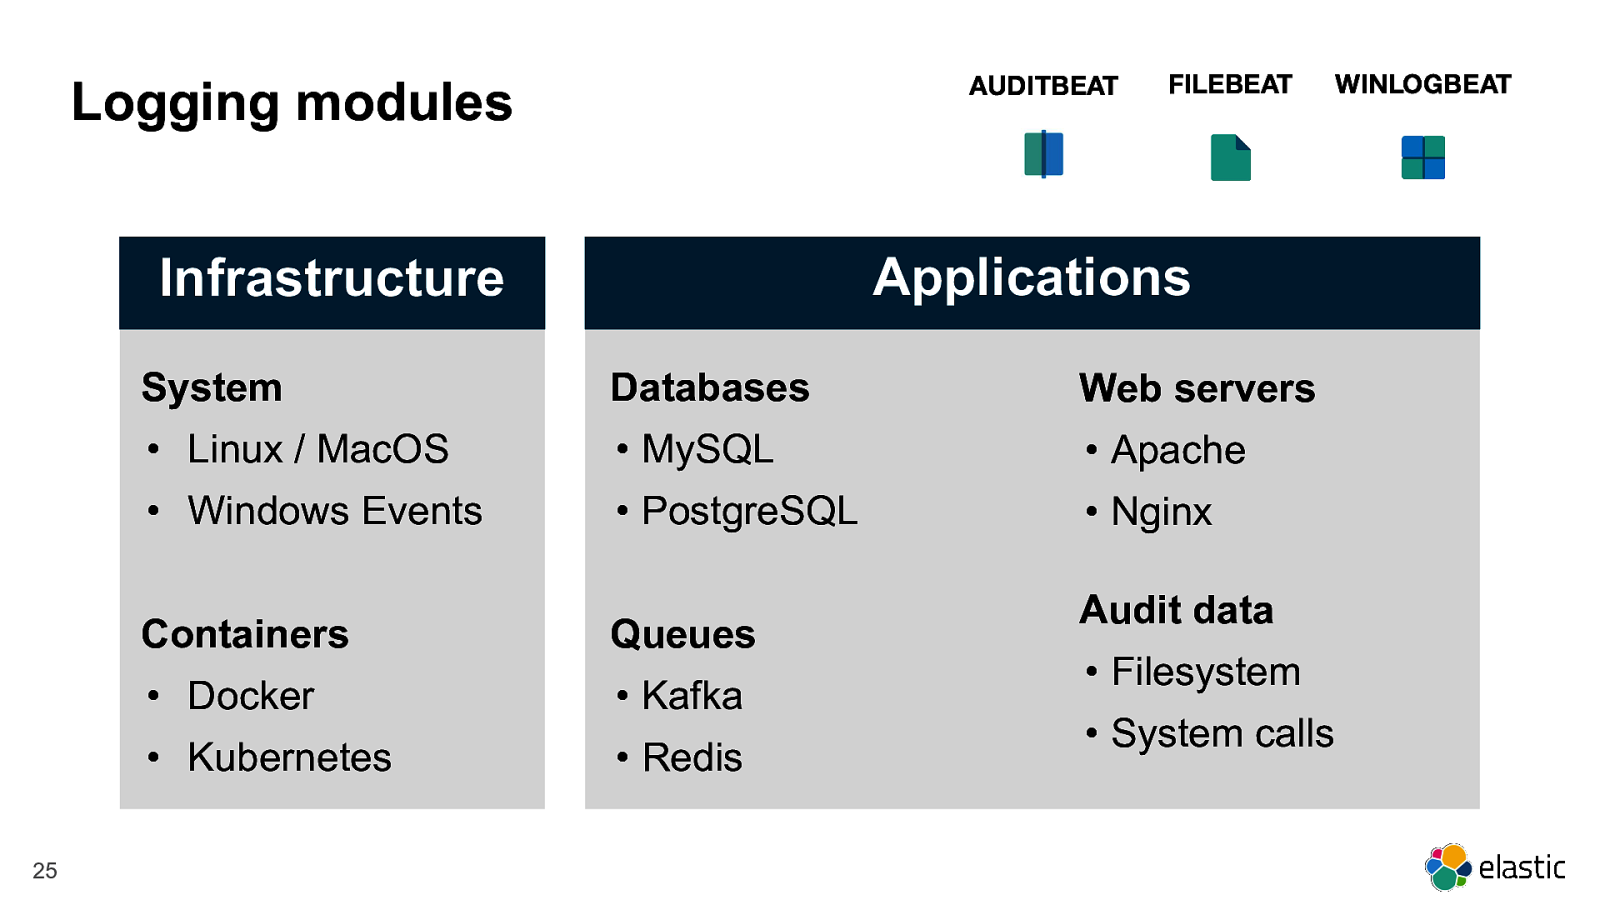
AUDITBEAT Logging modules Applications Infrastructure 25 FILEBEAT System Databases Web servers • Linux / MacOS • MySQL • Apache • Windows Events • PostgreSQL • Nginx Containers Queues • Docker • Kafka • Kubernetes • Redis Audit data • Filesystem • System calls WINLOGBEAT
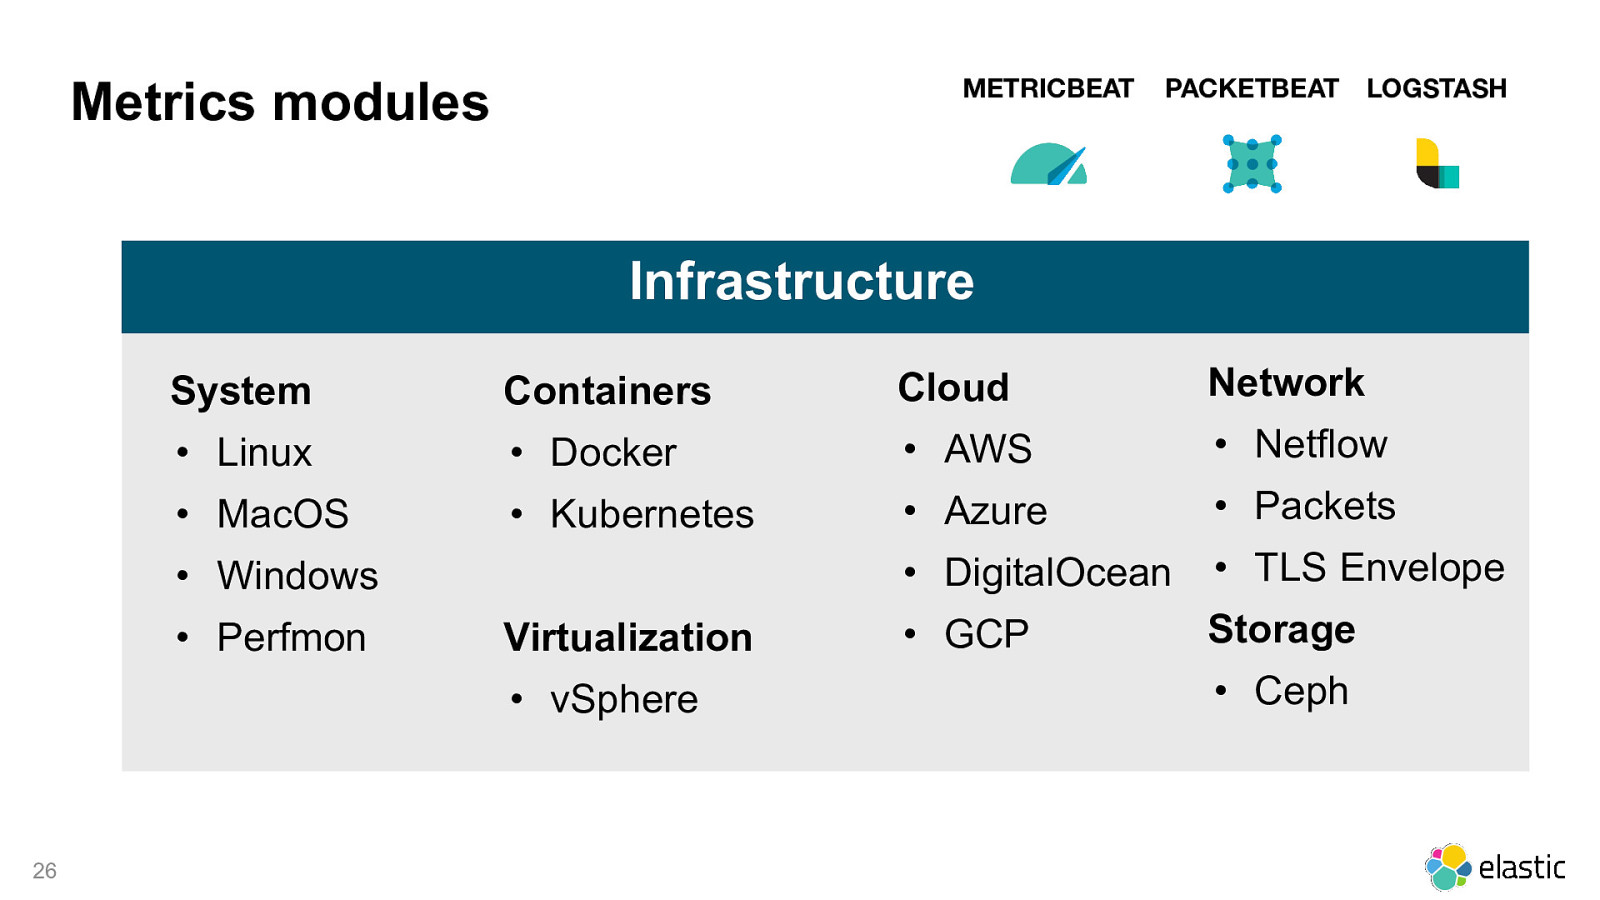
METRICBEAT Metrics modules PACKETBEAT LOGSTASH Infrastructure System Containers Cloud Network • Linux • Docker • AWS • Netflow • MacOS • Kubernetes • Azure • Packets • DigitalOcean • TLS Envelope • GCP Storage • Windows • Perfmon Virtualization • vSphere 26 • Ceph
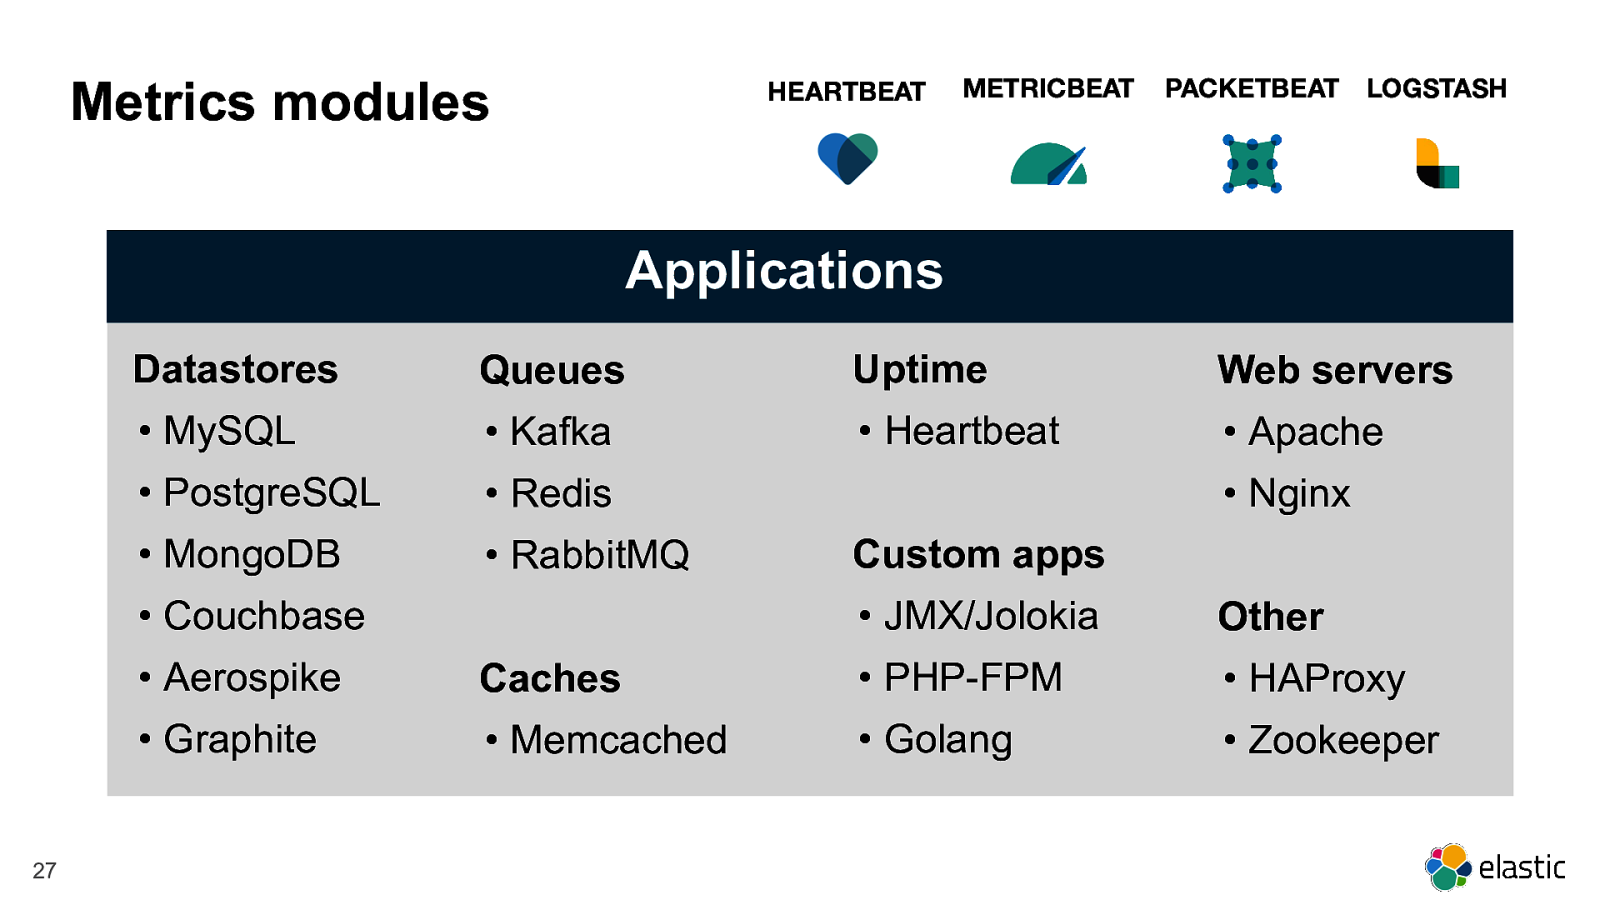
Metrics modules HEARTBEAT METRICBEAT PACKETBEAT LOGSTASH Applications Datastores Queues Uptime Web servers • MySQL • Kafka • Heartbeat • Apache • PostgreSQL • Redis • MongoDB • RabbitMQ • Couchbase 27 • Nginx Custom apps • JMX/Jolokia Other • Aerospike Caches • PHP-FPM • HAProxy • Graphite • Memcached • Golang • Zookeeper
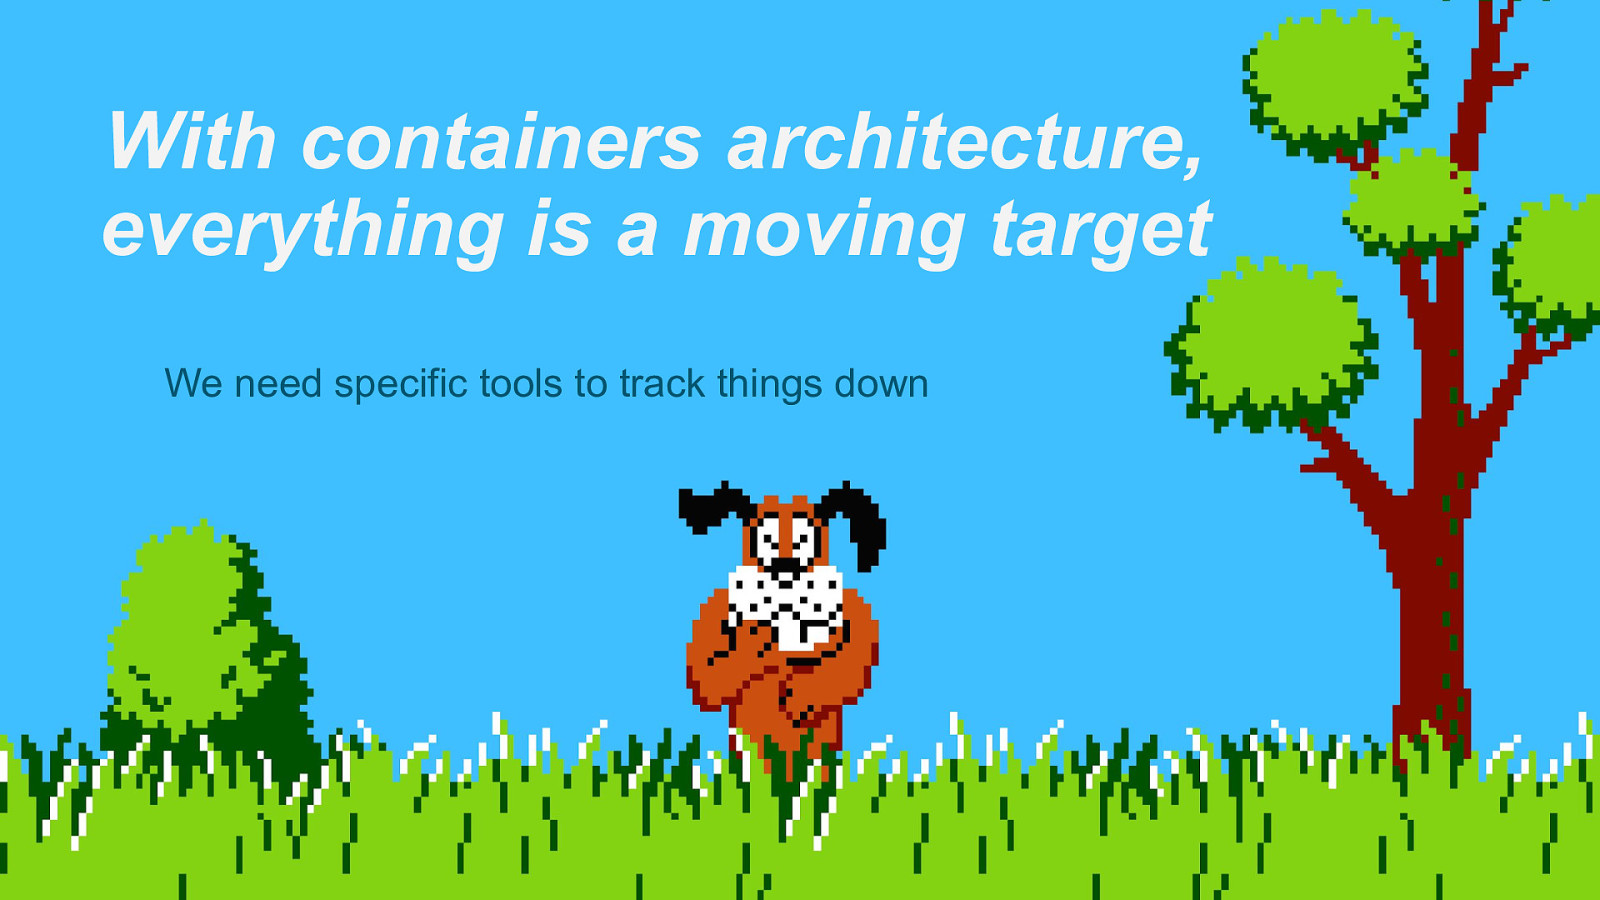
With containers architecture, everything is a moving target We need specific tools to track things down 28
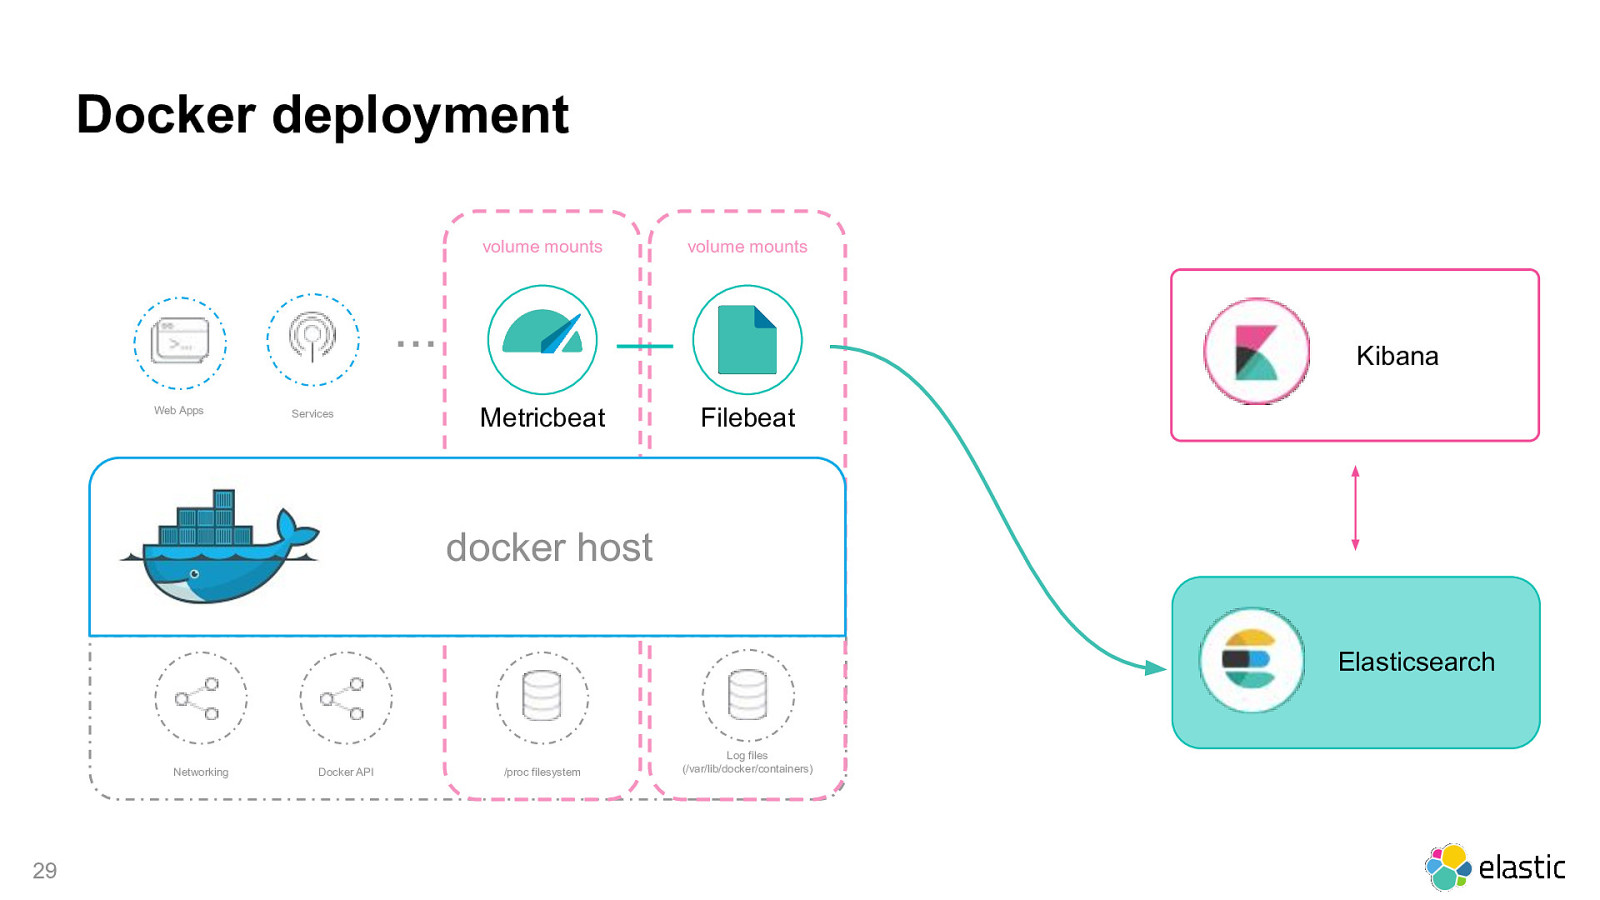
Docker deployment volume mounts volume mounts … Web Apps Services Kibana Metricbeat Filebeat docker host Elasticsearch Networking 29 Docker API /proc filesystem Log files (/var/lib/docker/containers)
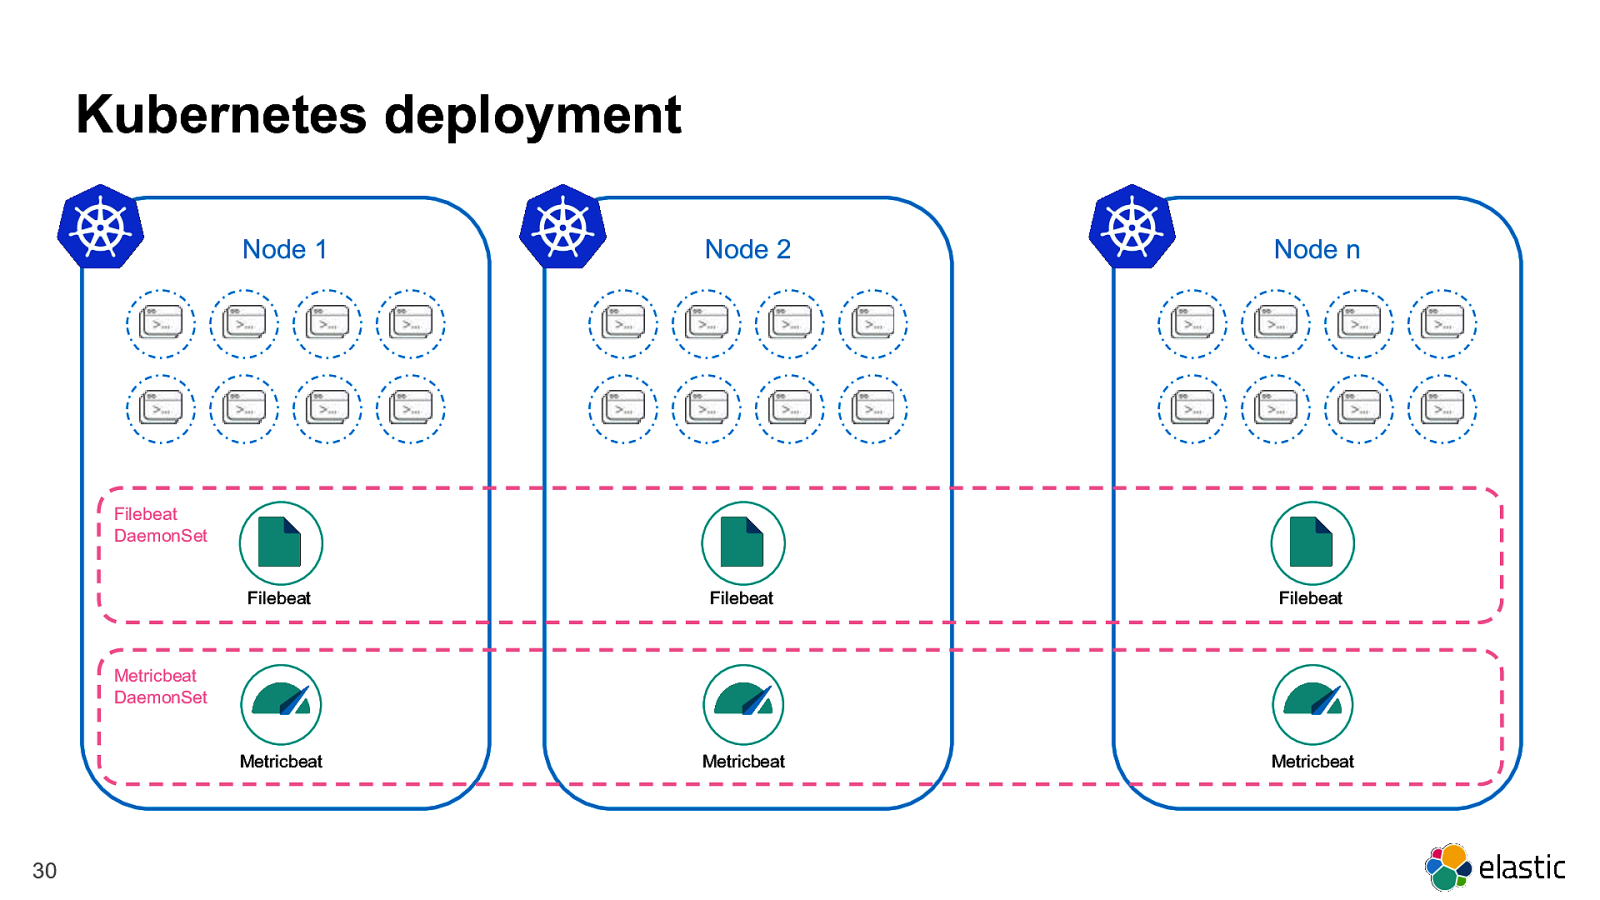
Kubernetes deployment Node 1 Node 2 Node n Filebeat Filebeat Filebeat Metricbeat Metricbeat Metricbeat Filebeat DaemonSet Metricbeat DaemonSet 30
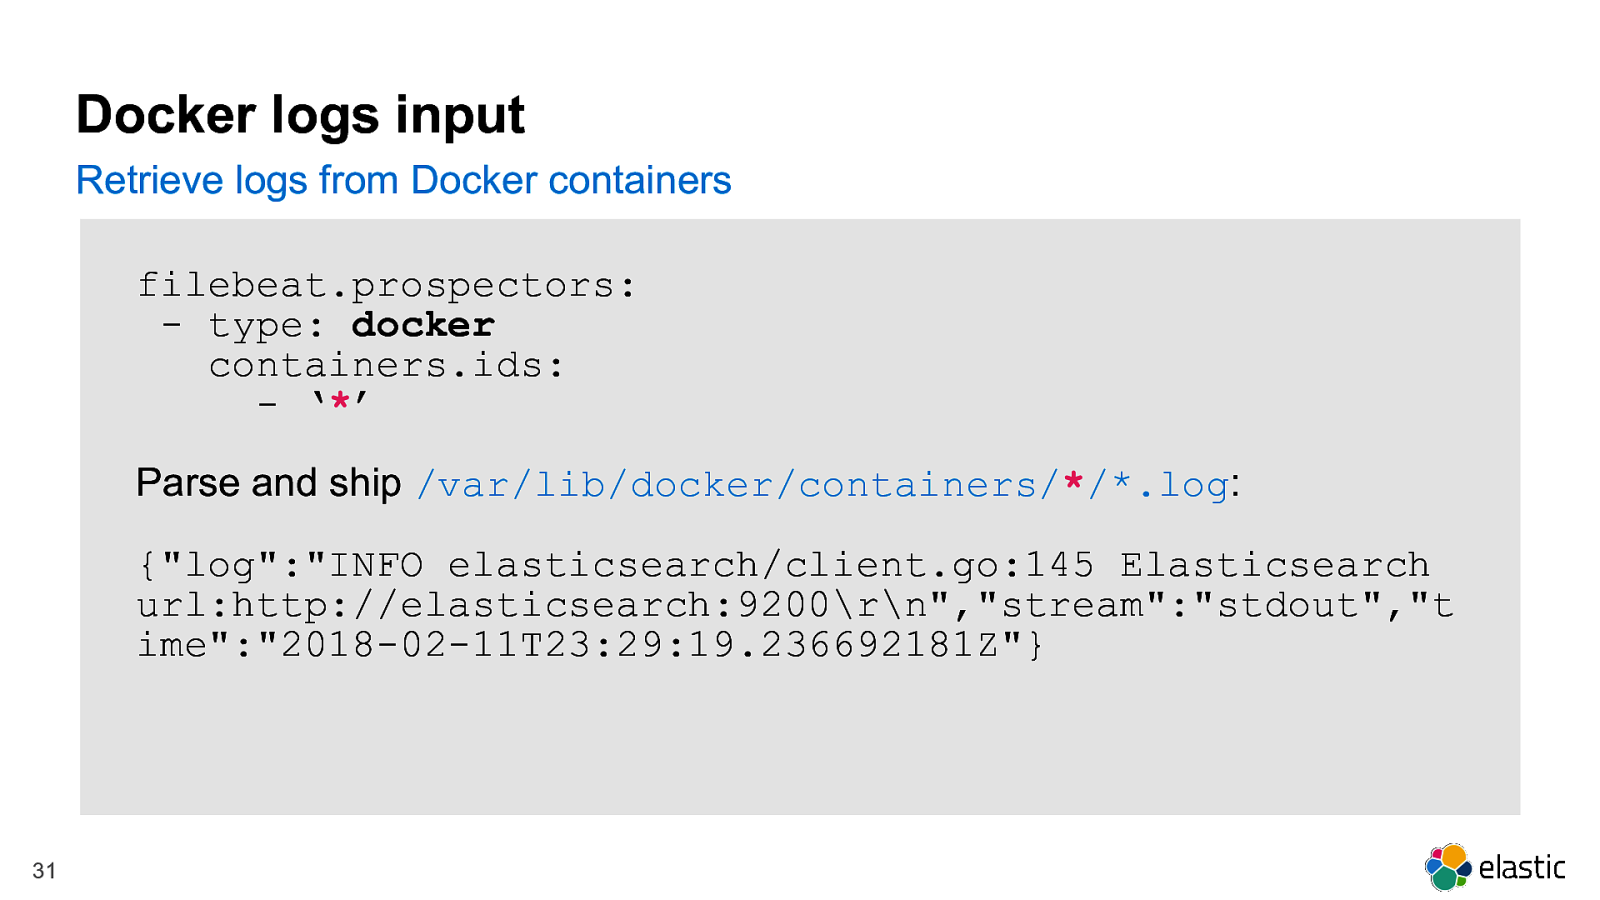
Docker logs input Retrieve logs from Docker containers filebeat.prospectors: - type: docker containers.ids: - ‘’ Parse and ship /var/lib/docker/containers//*.log: {“log”:”INFO elasticsearch/client.go:145 Elasticsearch url:http://elasticsearch:9200\r\n”,”stream”:”stdout”,”t ime”:”2018-02-11T23:29:19.236692181Z”} 31
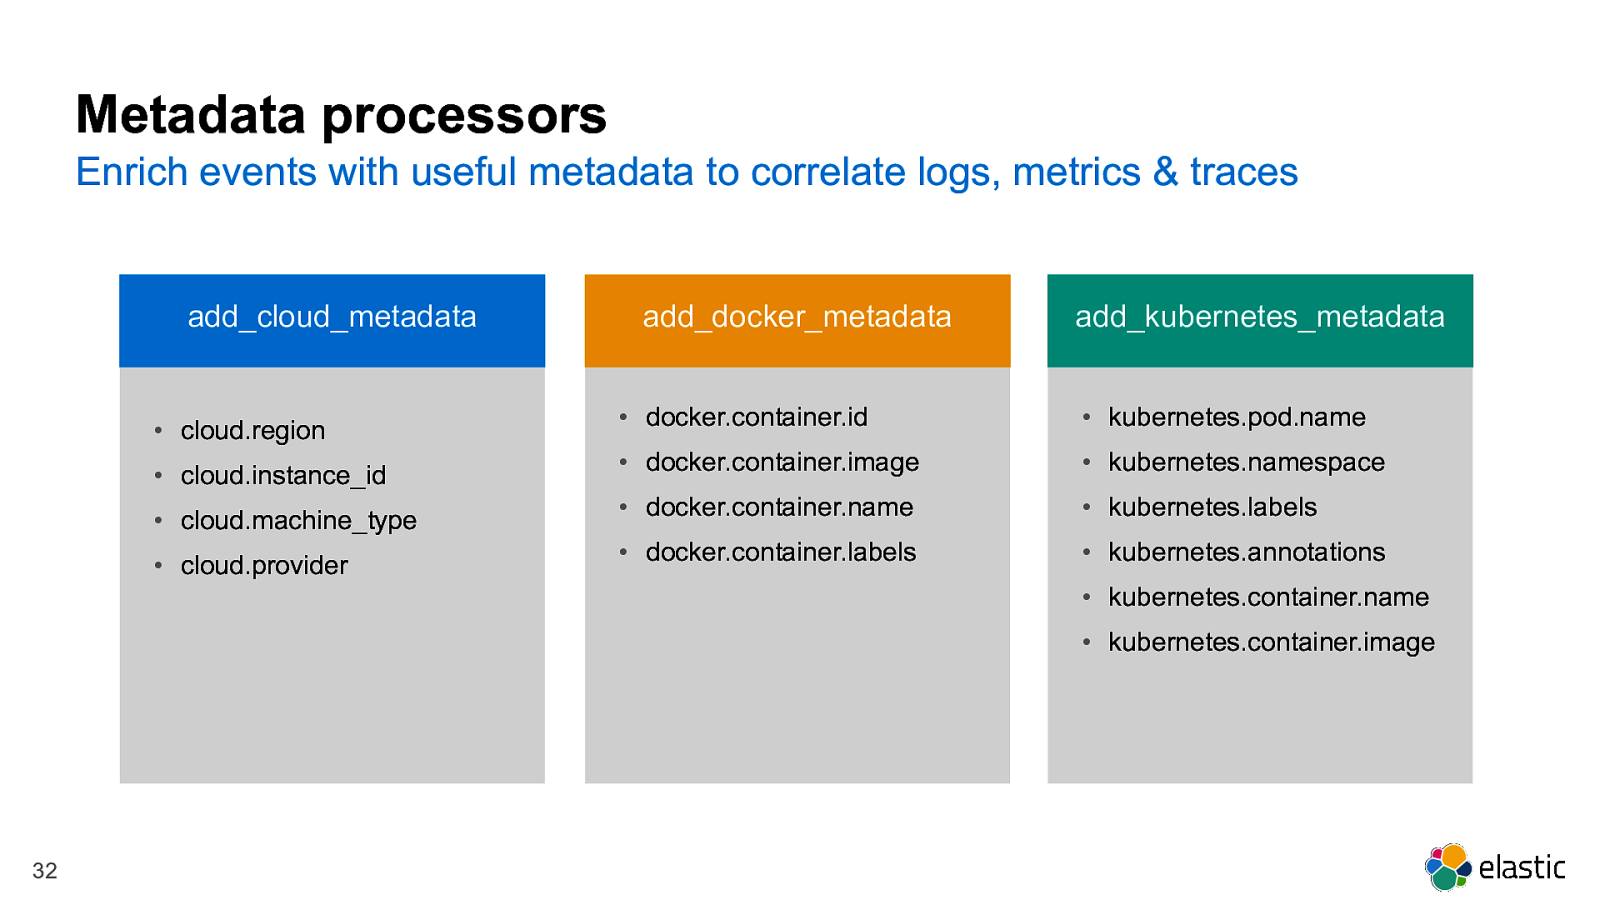
Metadata processors Enrich events with useful metadata to correlate logs, metrics & traces add_cloud_metadata • cloud.region • cloud.instance_id • cloud.machine_type • cloud.provider add_docker_metadata add_kubernetes_metadata • docker.container.id • kubernetes.pod.name • docker.container.image • kubernetes.namespace • docker.container.name • kubernetes.labels • docker.container.labels • kubernetes.annotations • kubernetes.container.name • kubernetes.container.image 32
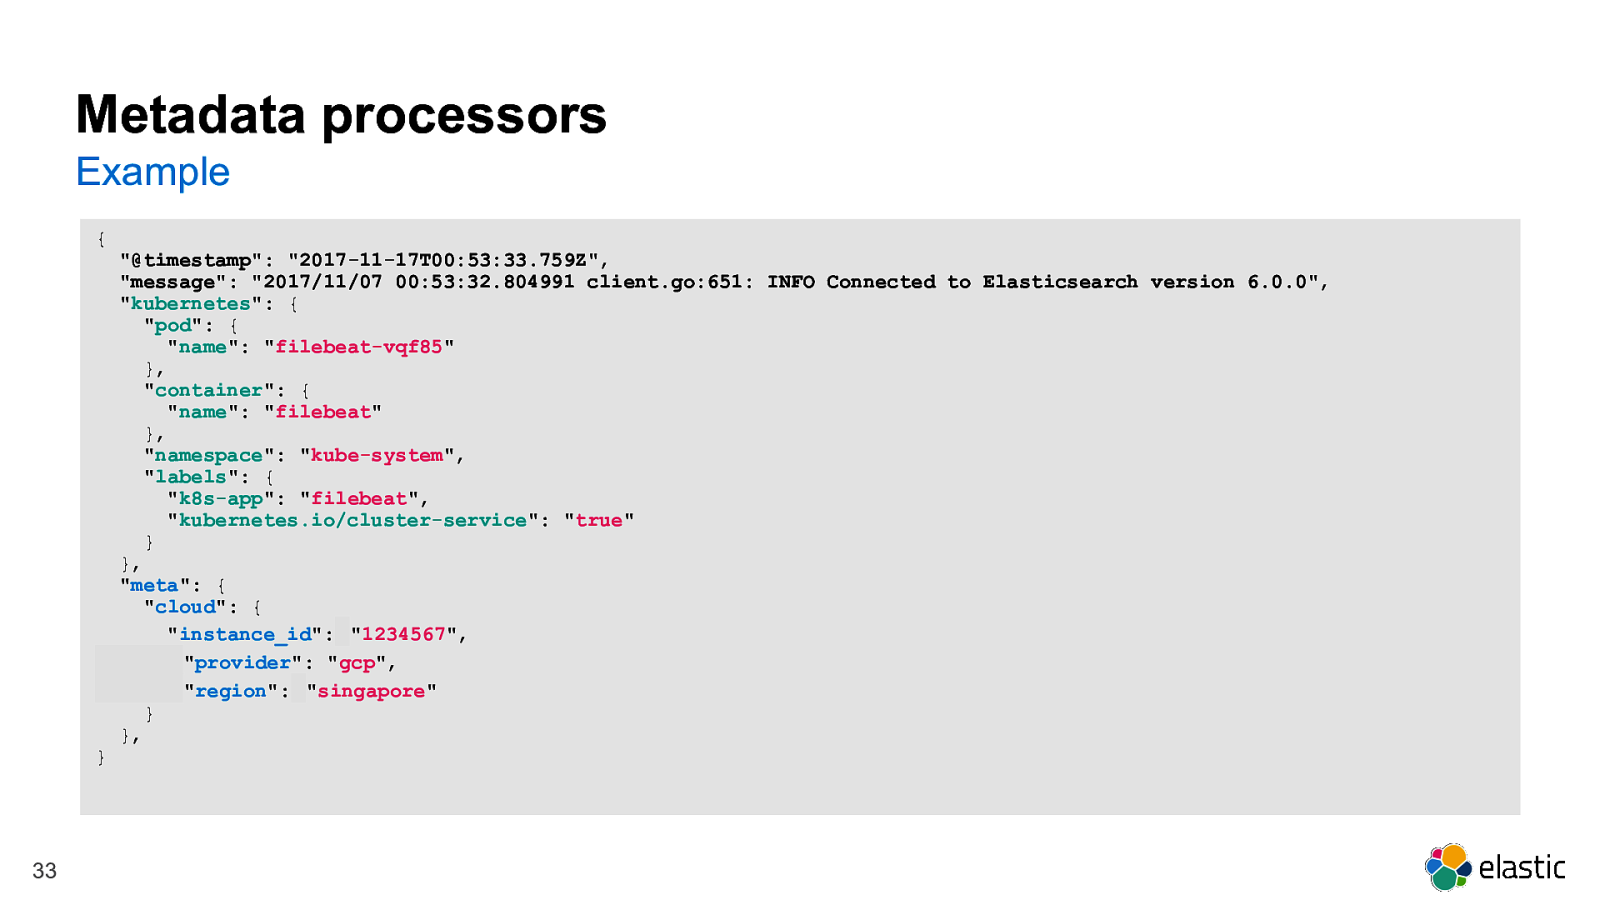
Metadata processors Example { “@timestamp”: “2017-11-17T00:53:33.759Z”, “message”: “2017/11/07 00:53:32.804991 client.go:651: INFO Connected to Elasticsearch version 6.0.0”, “kubernetes”: { “pod”: { “name”: “filebeat-vqf85” }, “container”: { “name”: “filebeat” }, “namespace”: “kube-system”, “labels”: { “k8s-app”: “filebeat”, “kubernetes.io/cluster-service”: “true” } }, “meta”: { “cloud”: { “instance_id”: “1234567”, “provider”: “gcp”, “region”: “singapore” } }, } 33
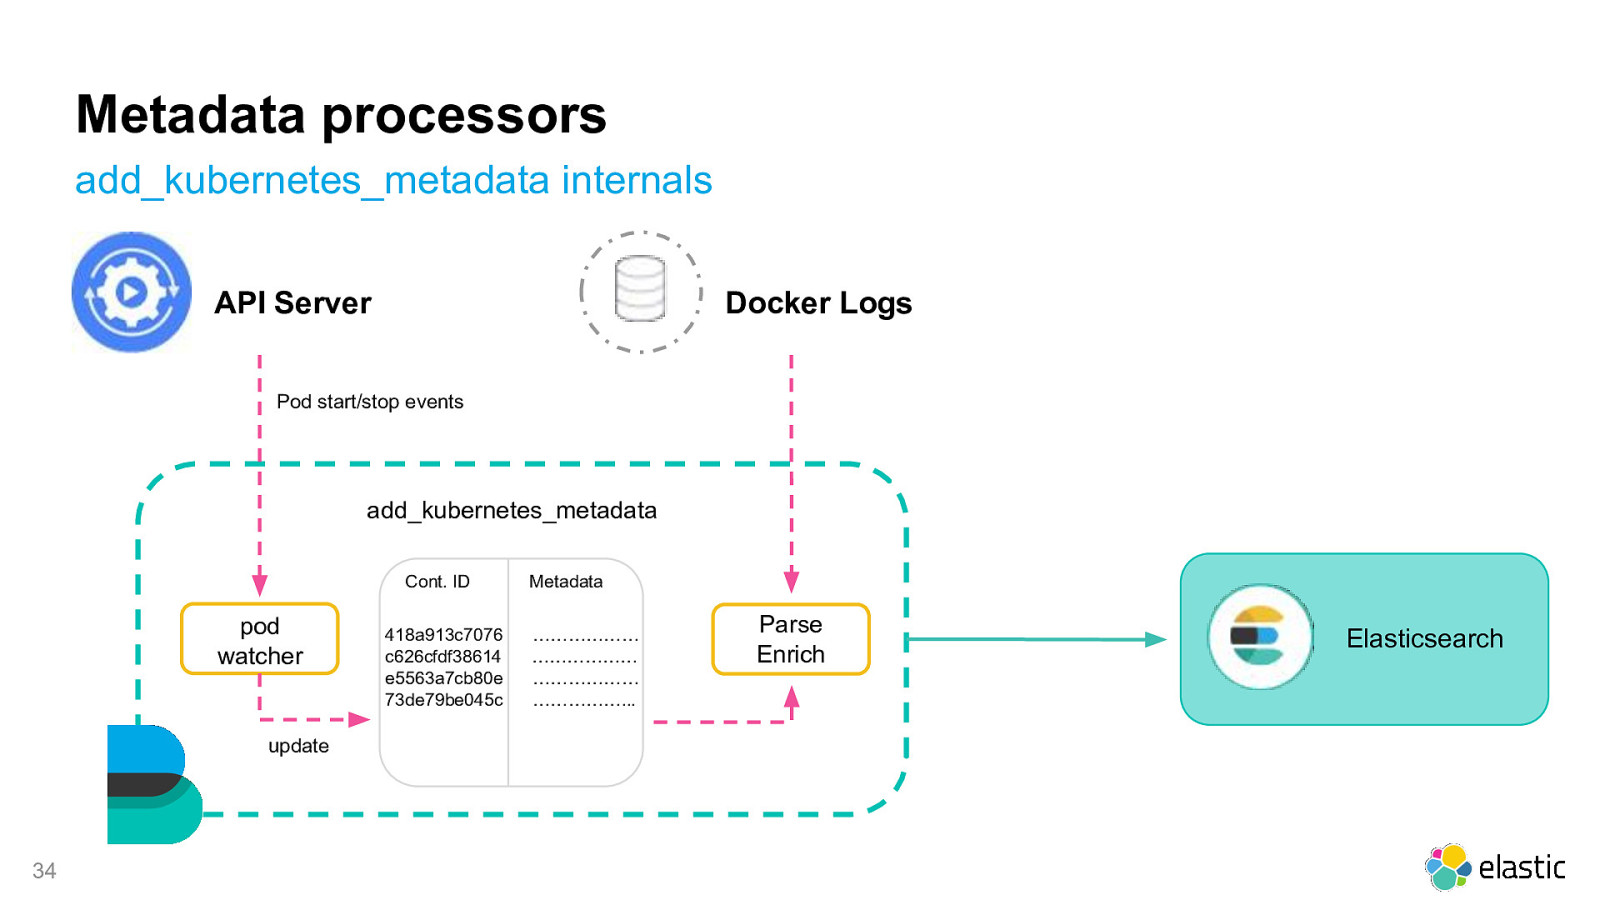
Metadata processors add_kubernetes_metadata internals API Server Docker Logs Pod start/stop events add_kubernetes_metadata Cont. ID pod watcher update 34 418a913c7076 c626cfdf38614 e5563a7cb80e 73de79be045c Metadata ……………… ……………… ……………… ……………… Parse Enrich Elasticsearch
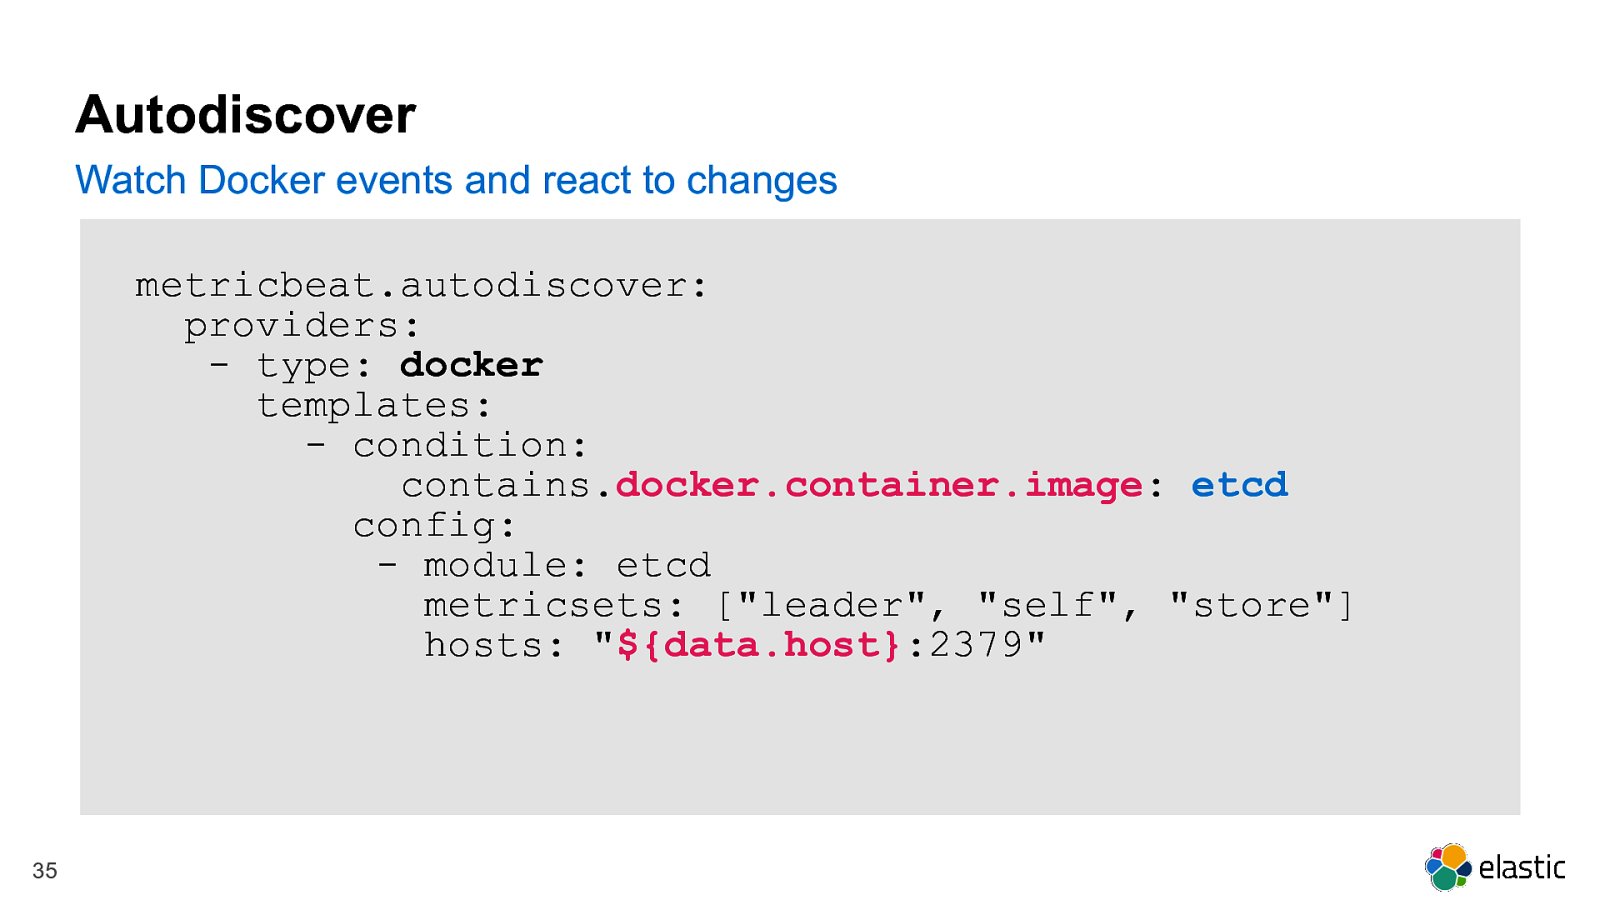
Autodiscover Watch Docker events and react to changes metricbeat.autodiscover: providers: - type: docker templates: - condition: contains.docker.container.image: etcd config: - module: etcd metricsets: [“leader”, “self”, “store”] hosts: “${data.host}:2379” 35
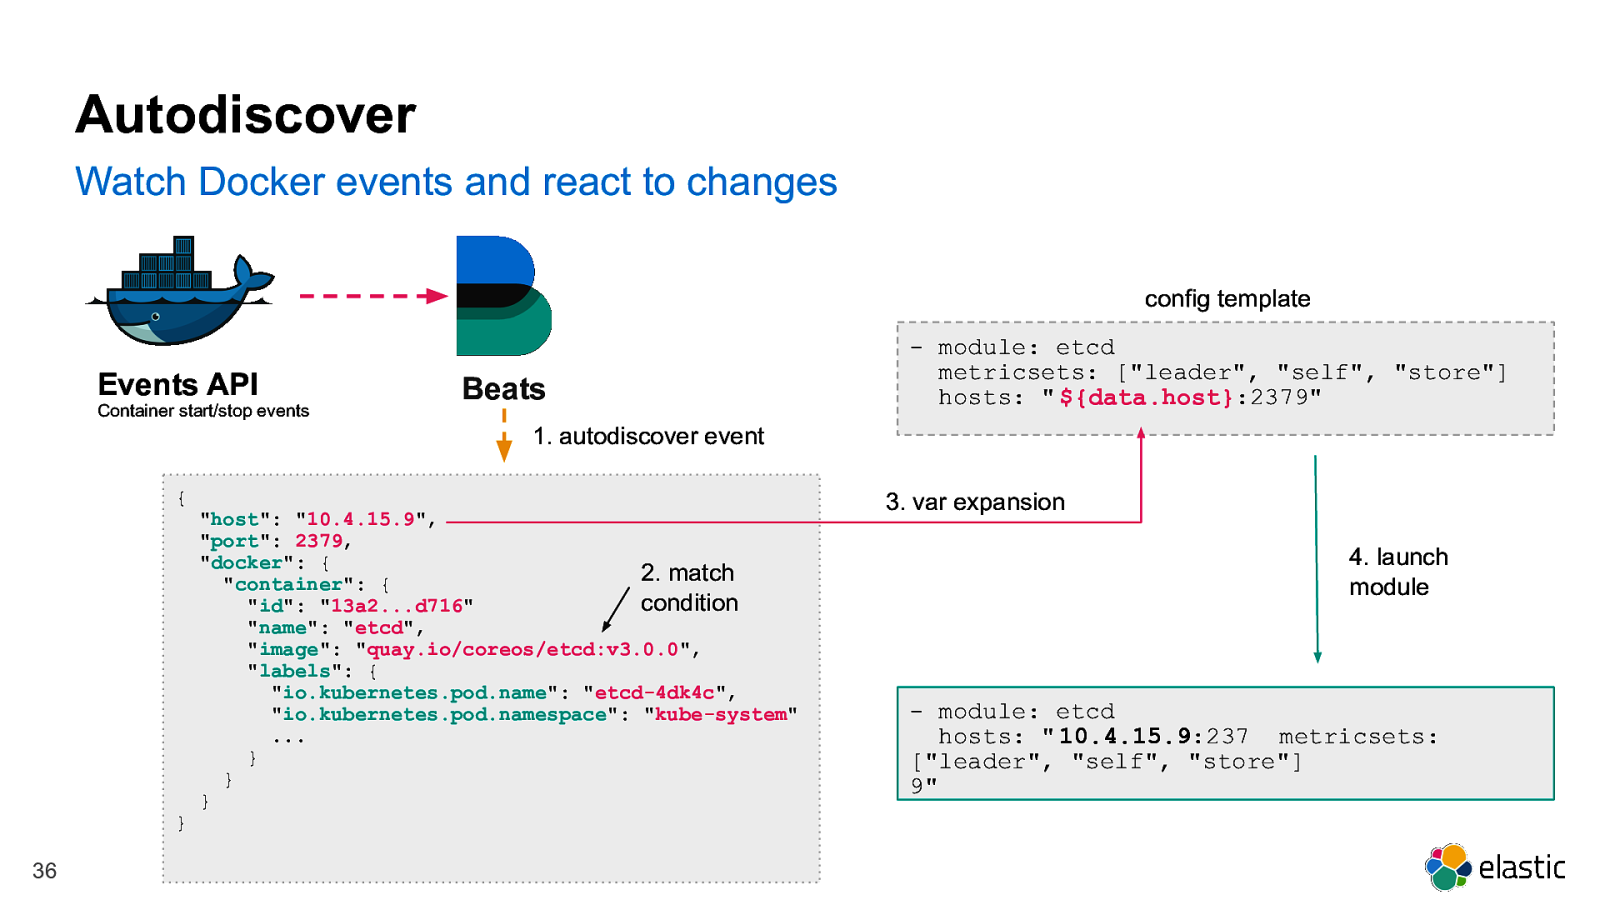
Autodiscover Watch Docker events and react to changes config template Events API Container start/stop events Beats

DEMO 37

What Next? 38
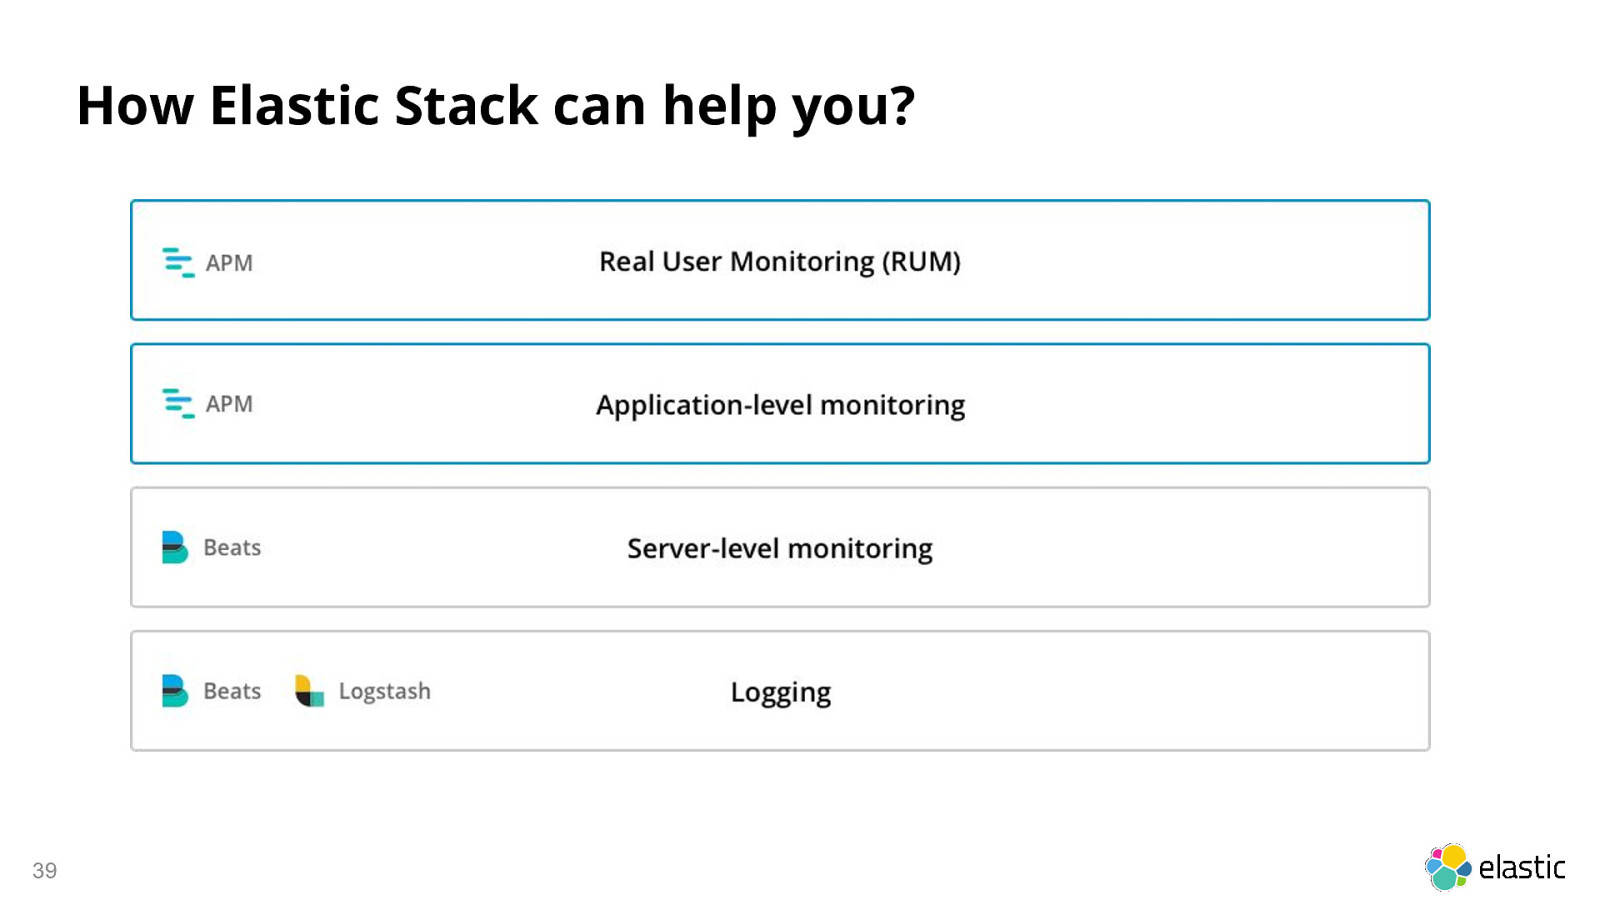
How Elastic Stack can help you? 39
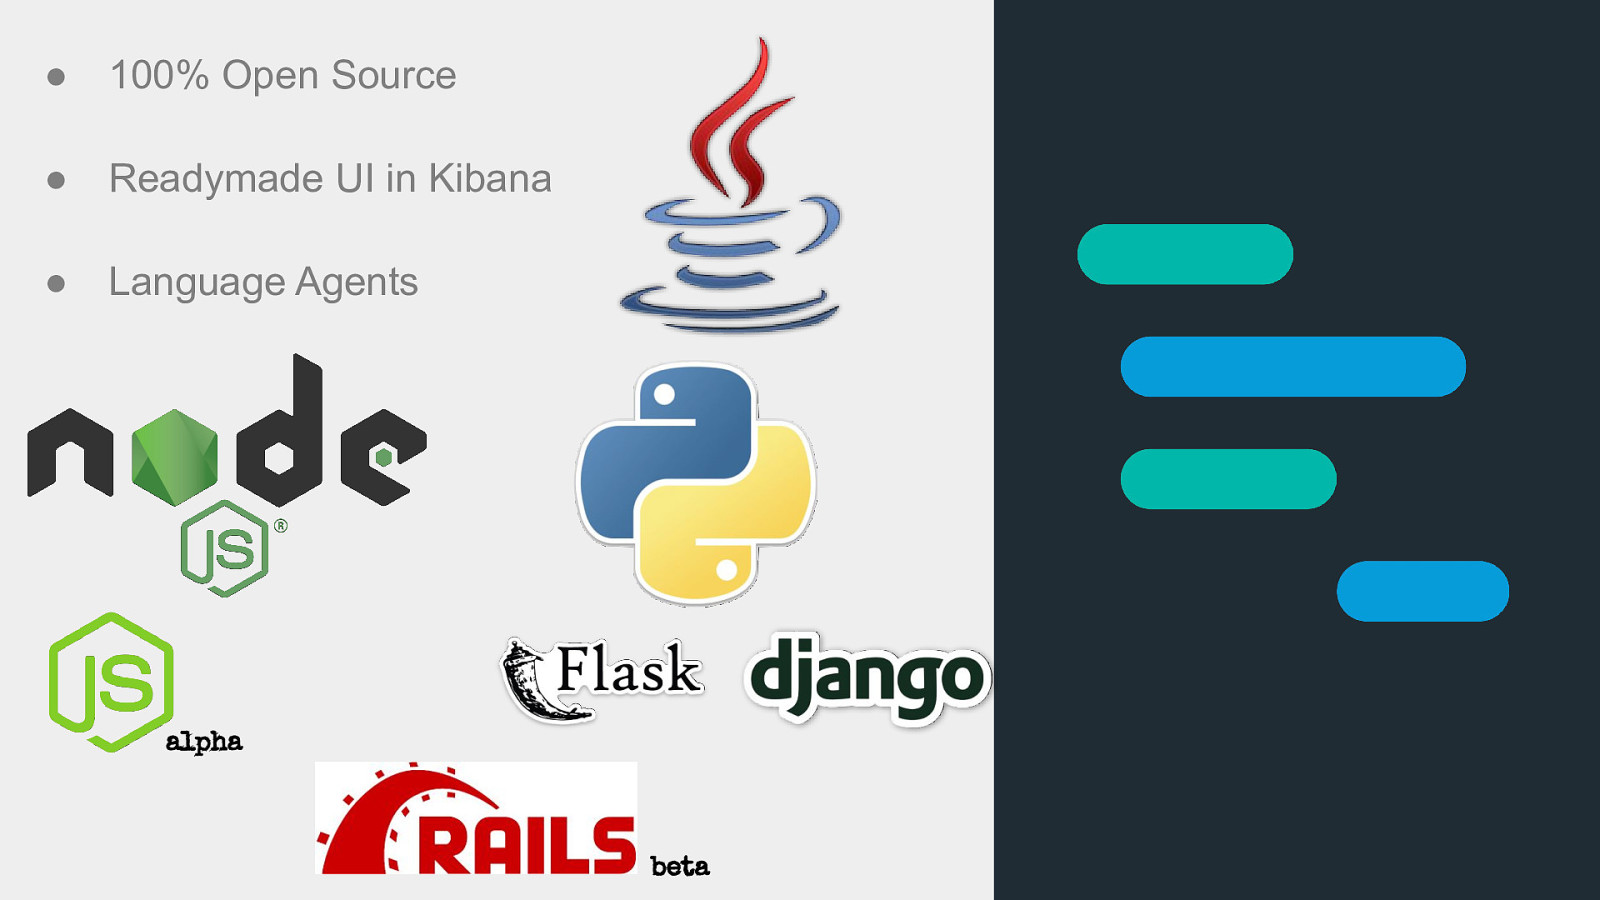
● 100% Open Source ● Readymade UI in Kibana ● Language Agents alpha 40 beta
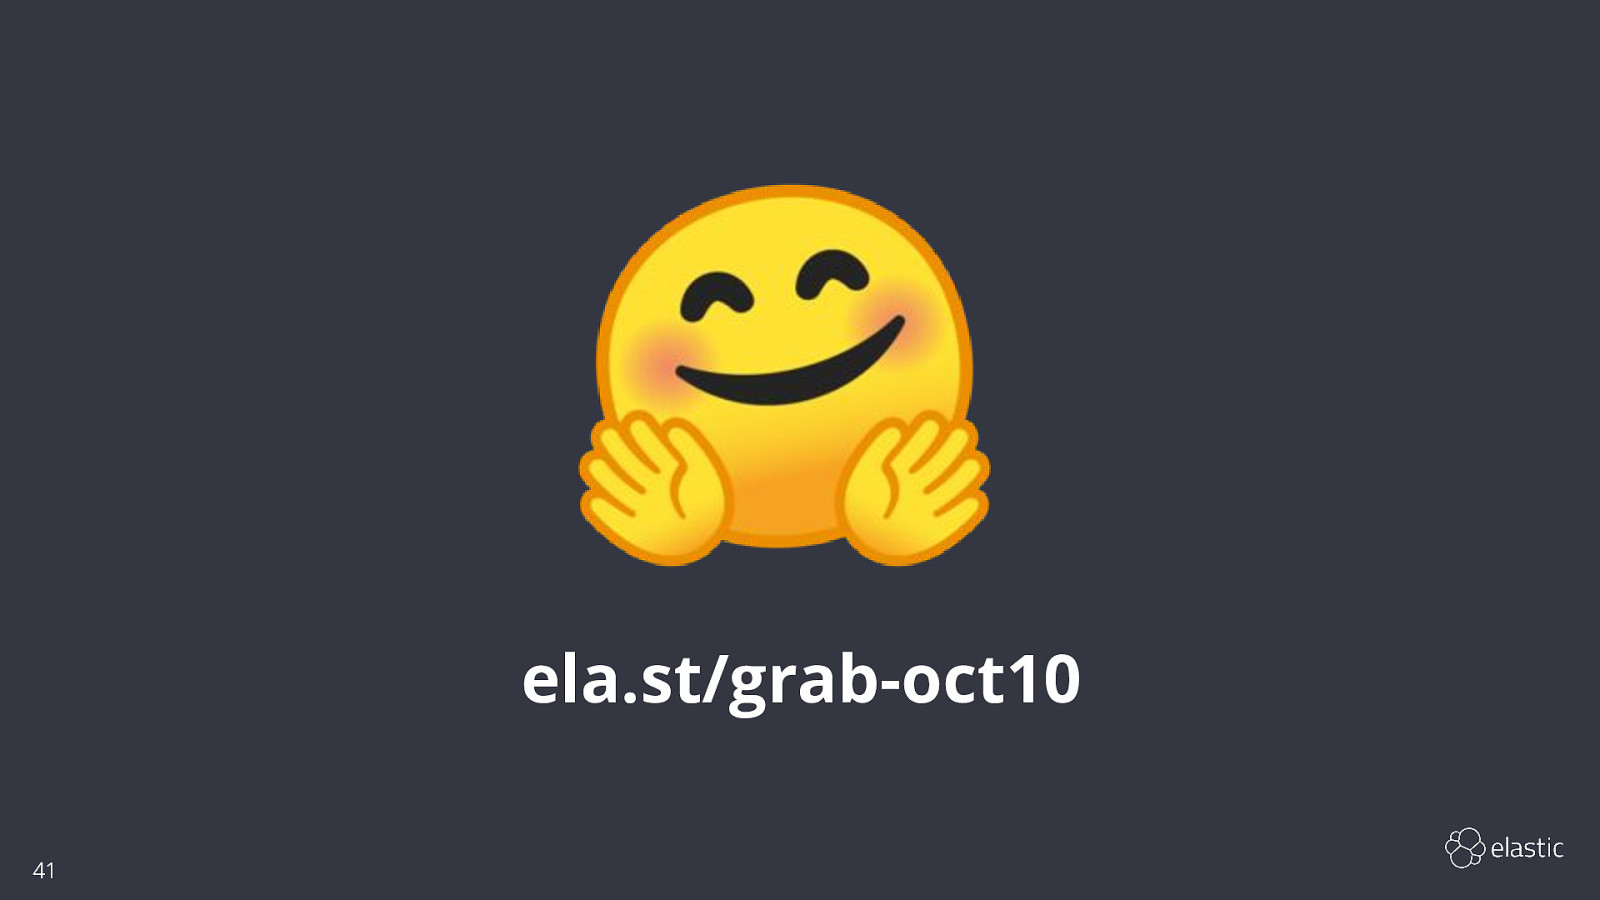
ela.st/grab-oct10 41

Fin! discuss.elastic.co | aravind@elastic.co | @aravindputrevu 42