Secrets of the Web Inspector

A presentation at Clique Studios Internal in October 2017 in Chicago, IL, USA by Carly Ho

Secrets of the Web Inspector
What’s the web inspector? The web inspector is a panel available in every current browser (yes, even IE!) that allows you to navigate through the components that go into rendering the web page you see. It also has a bunch of nifty features to help achieve better performance, find bugs, check mobile views, and more!
A Brief History — "View Source" / "Save as web page" — Firebug - 2006 (RIP) — Browsers start adding native developer tools (2007-2008ish)
How to open the web inspector — Mac Chrome: Cmd + Opt + I — Safari: Cmd + Opt + I — Firefox: Cmd + Opt + C — Internet Explorer/Edge: F12 Alternately, you can almost always open it via right- clicking and selecting “Inspect Element” from the context menu.
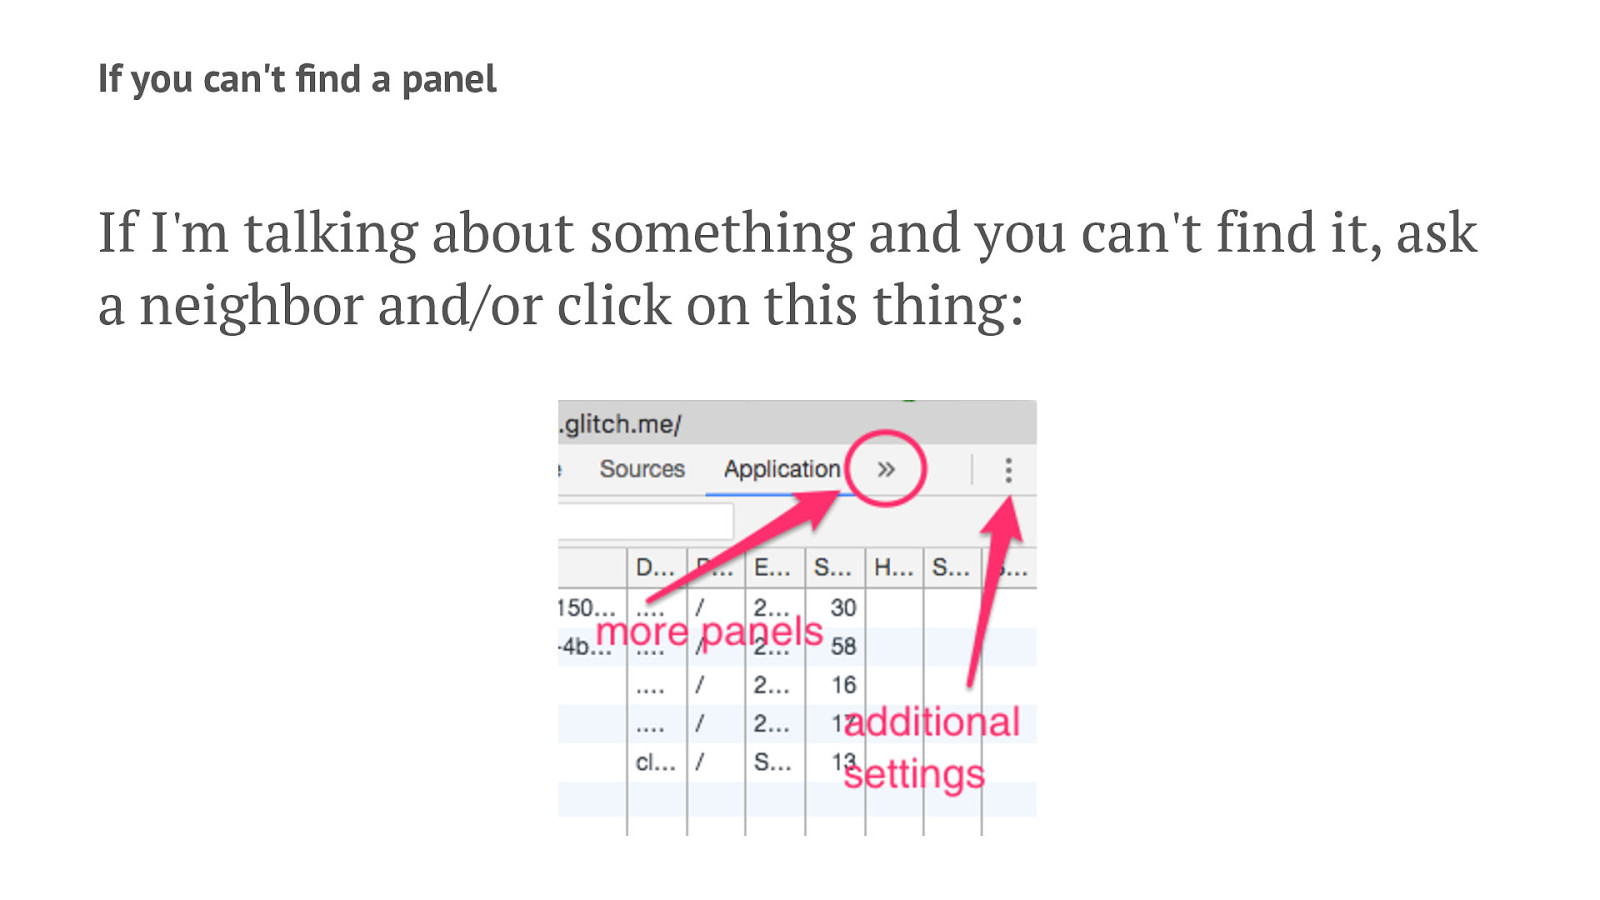
If you can't find a panel If I'm talking about something and you can't find it, ask a neighbor and/or click on this thing:
Let’s browse some code
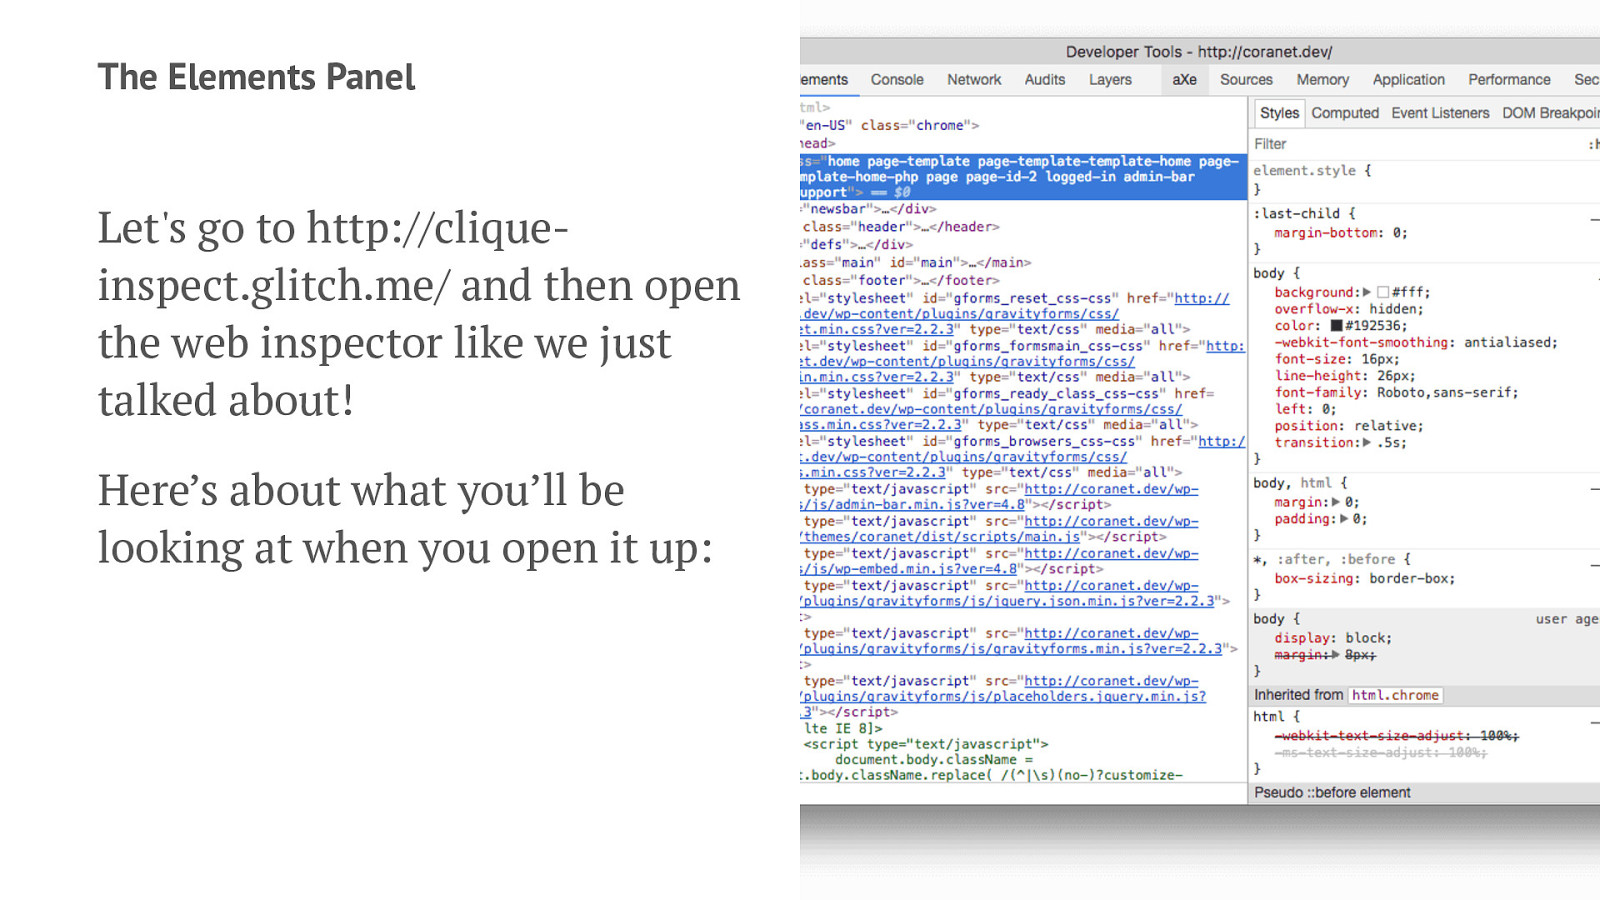
The Elements Panel Let's go to http://clique- inspect.glitch.me/ and then open the web inspector like we just talked about! Here’s about what you’ll be looking at when you open it up:
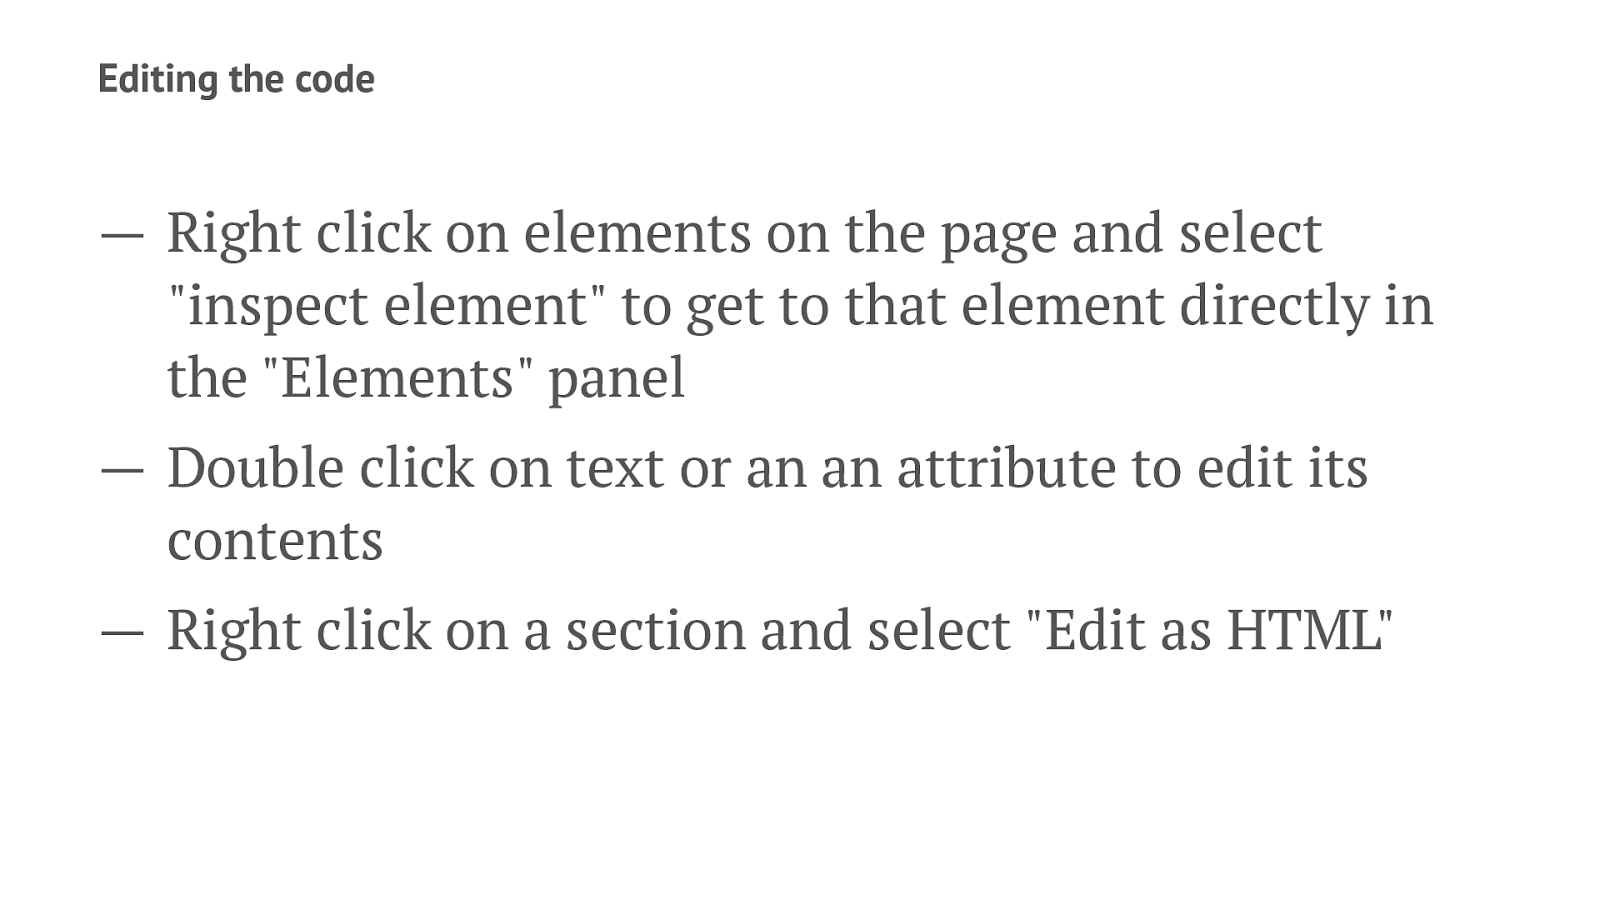
Editing the code — Right click on elements on the page and select "inspect element" to get to that element directly in the "Elements" panel — Double click on text or an an attribute to edit its contents — Right click on a section and select "Edit as HTML"
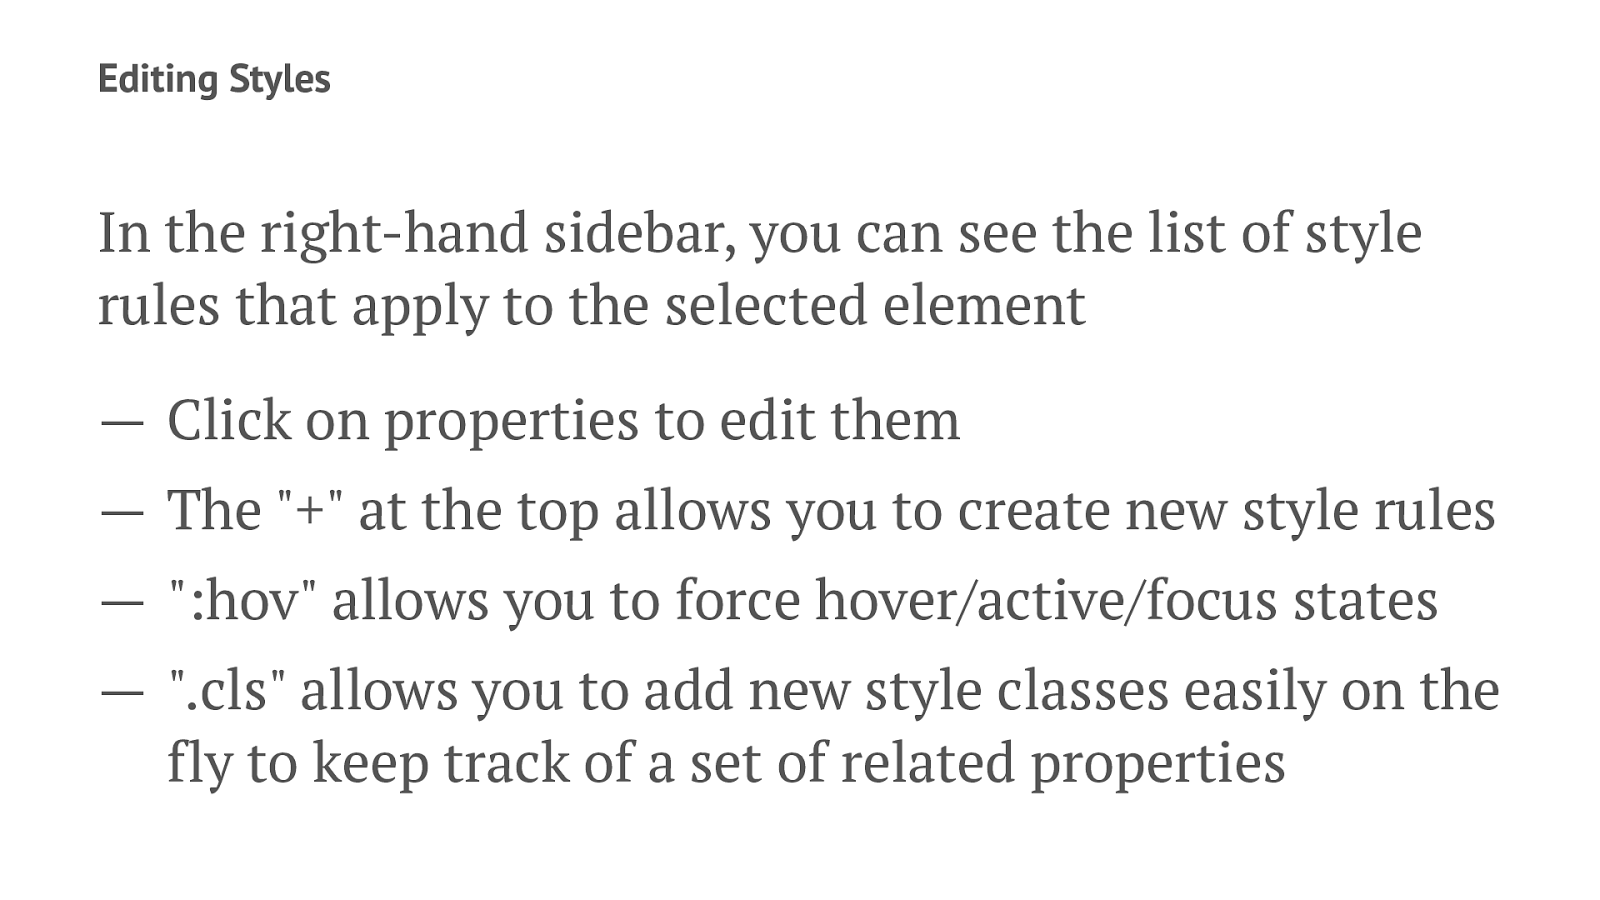
Editing Styles In the right-hand sidebar, you can see the list of style rules that apply to the selected element — Click on properties to edit them — The "+" at the top allows you to create new style rules — ":hov" allows you to force hover/active/focus states — ".cls" allows you to add new style classes easily on the fly to keep track of a set of related properties

The Source Panel
Why is this different from the elements panel? — Can also view non-HTML files, such as javascript, raw CSS code, images included in page — Can set "breakpoints" in script files that tell it to pause at a certain point — Lists all files requested as part of loading the page Can you find the hidden cat photo in the sources list?

The Console
The console is a powerful debugging tool — Displays errors — Can also print messages from scripts being run to output debug info — You can also type javascript directly into the console Try the command the console message suggests to you and see what happens!
Responsive Testing
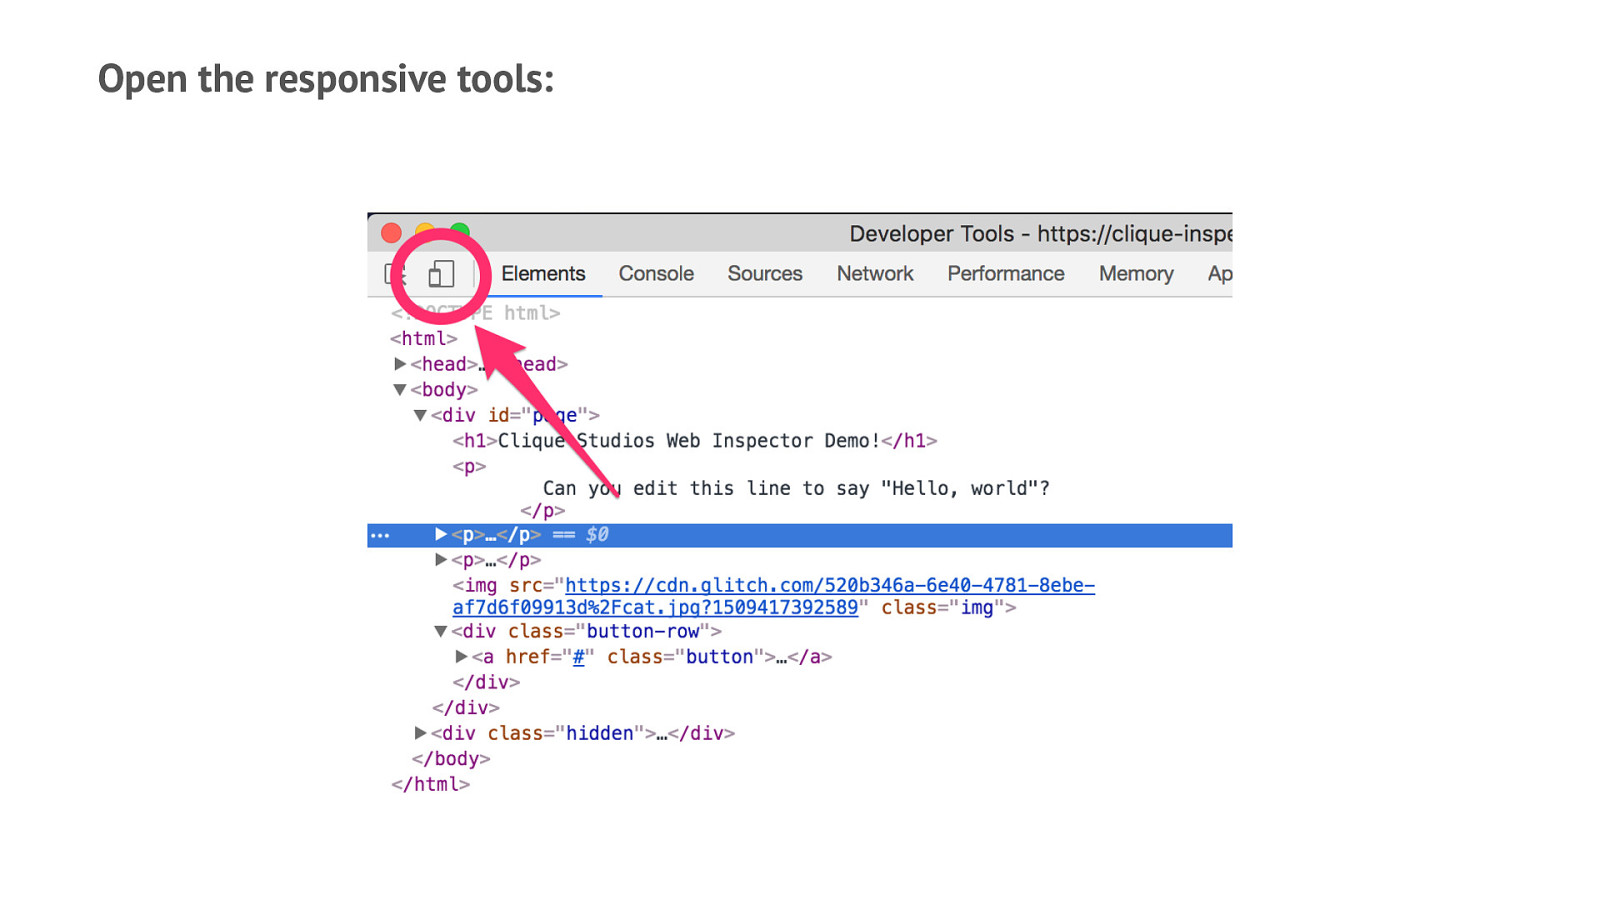
Open the responsive tools:
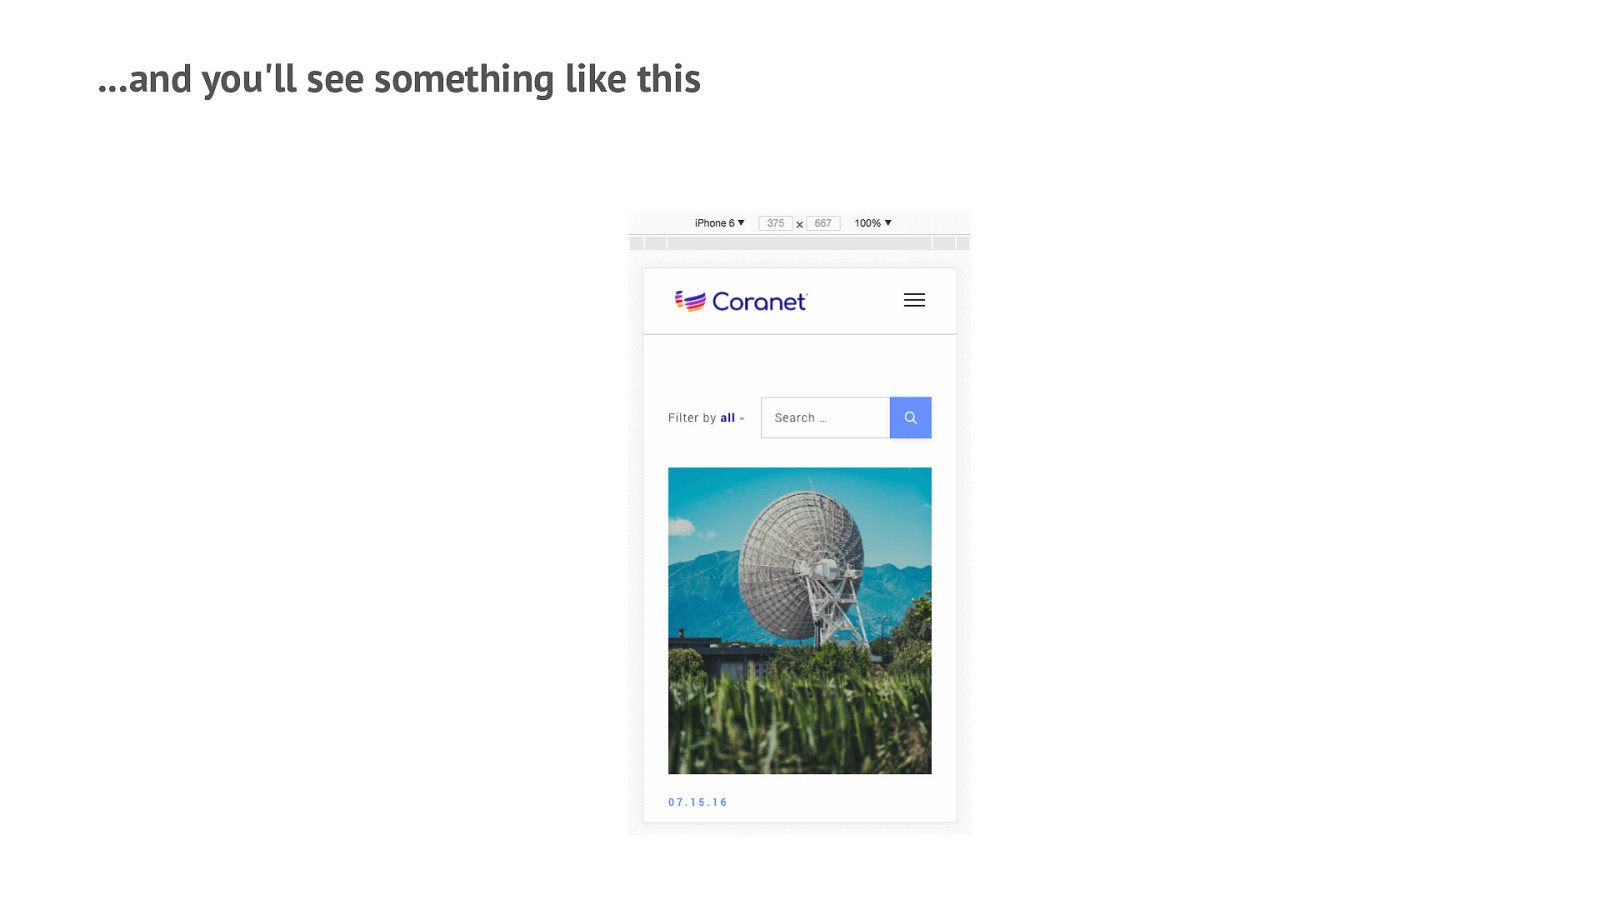
...and you'll see something like this
Responsive testing capabilities — Change viewport size to known common resolutions — Imitate device type (e.g. if some content is only show to iOS users) — Use "touch" event rather than "click"
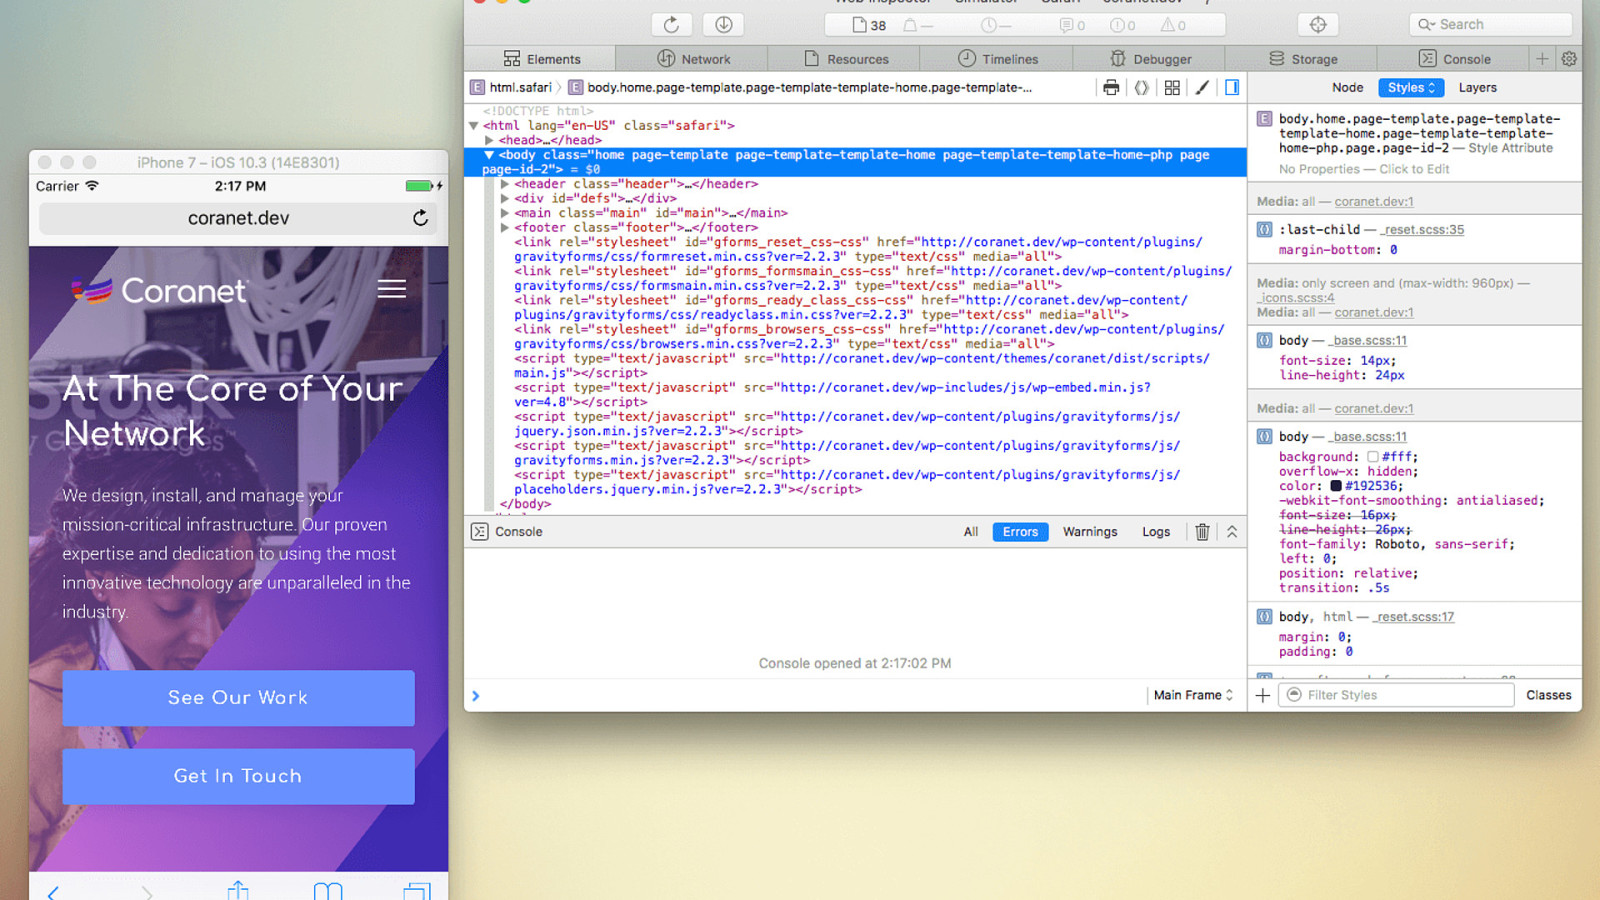
A brief aside about the Safari web inspector and its unique tools Safari is an Apple product, which means that it gets some special tools for working with iOS! When an iPhone/iPod Touch/iPad is connected via Bluetooth or USB to your computer, you can use the web inspector to look at the content of the browser on your phone.
The iOS Simulator Apple also makes a simulator application that comes packaged with their coding suite called Xcode, which can imitate all Apple devices, from watch to iPad.
Windows Testing Internet Explorer/Edge has slightly different tools for responsive device testing, which are under the "Emulation" tab. Internet Explorer/Edge can imitate other previous versions of IE, as well as emulate Windows phones.

The Application Panel
Application Storage The main use for this panel is to deal with cookies. Cookies are the way that sites temporarily store data about you and your choices in the browser. If you're in Safari or Firefox, you'll find this under the "Storage" tab.
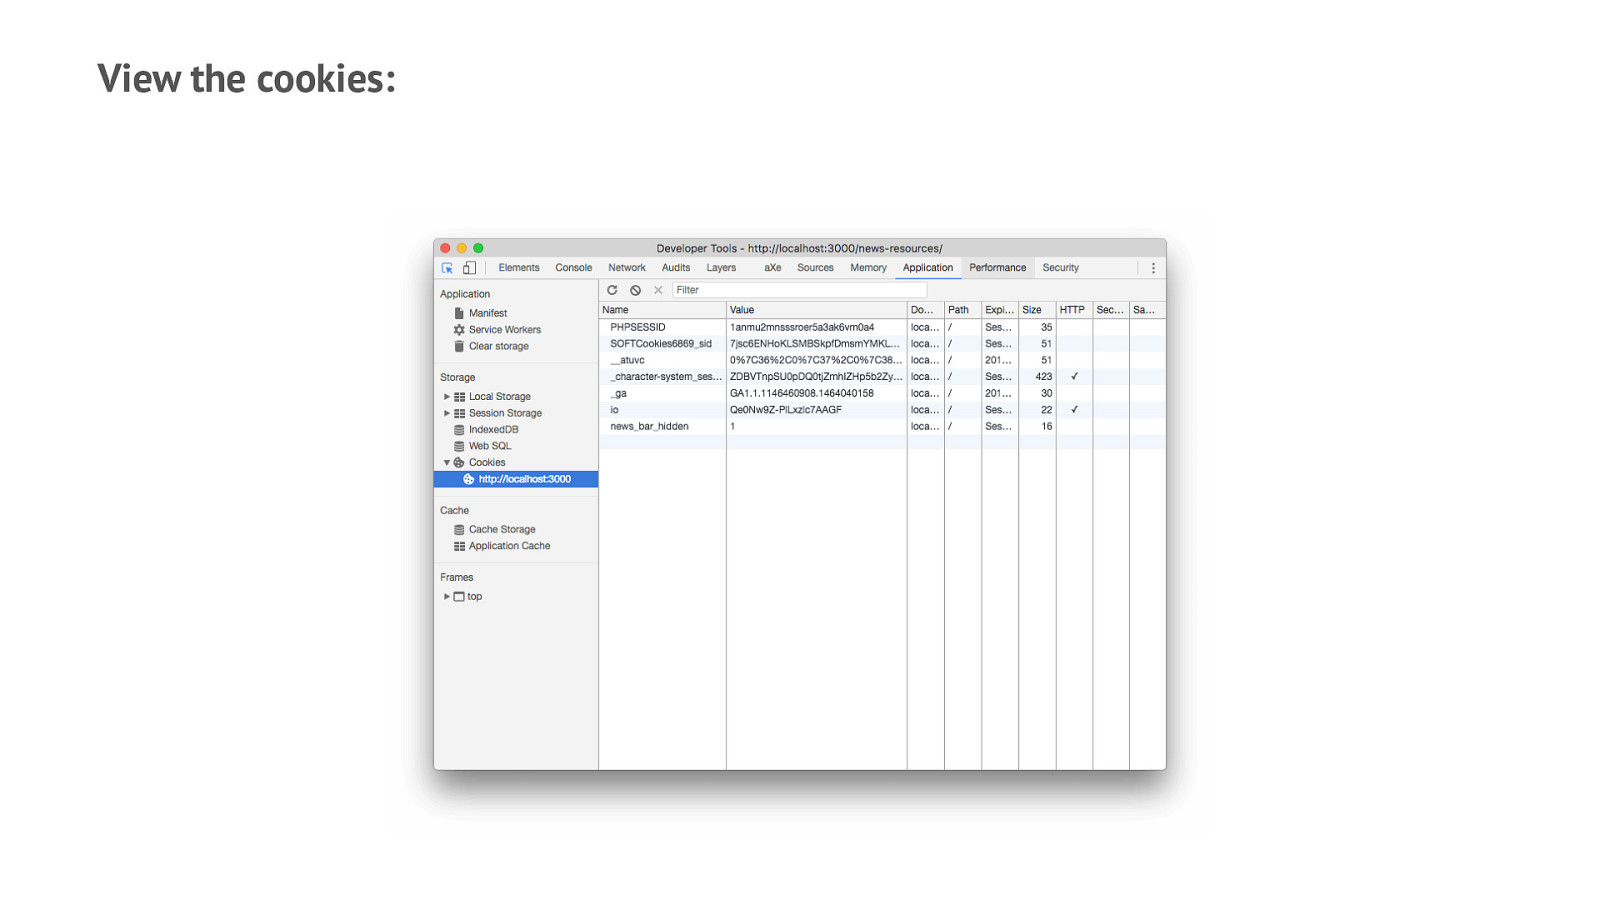
View the cookies:
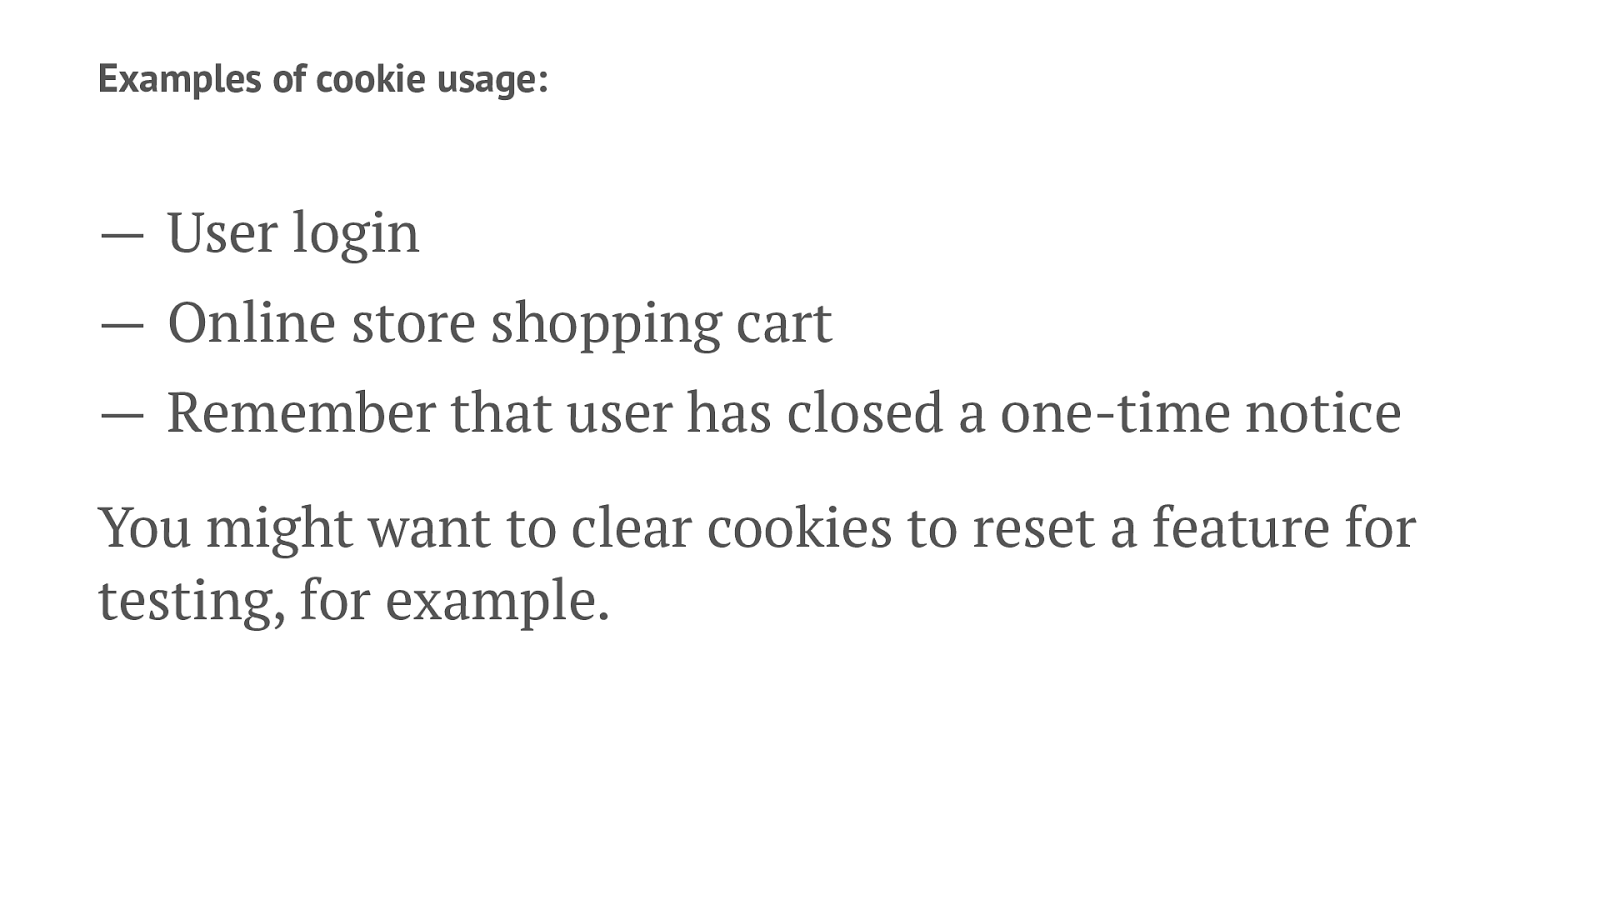
Examples of cookie usage: — User login — Online store shopping cart — Remember that user has closed a one-time notice You might want to clear cookies to reset a feature for testing, for example.
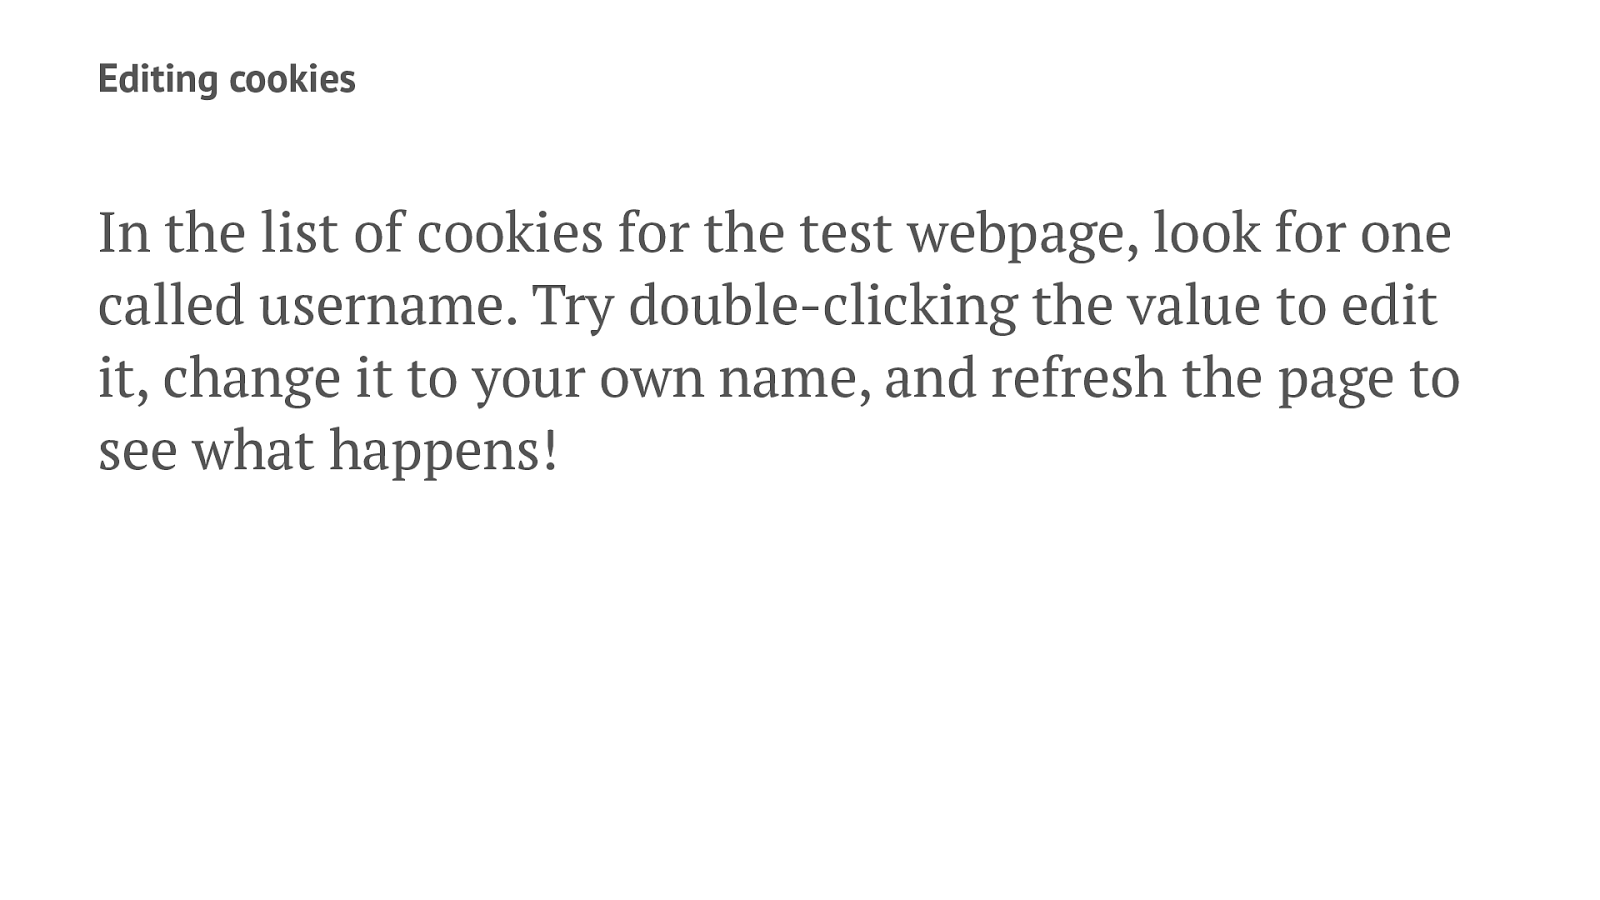
Editing cookies In the list of cookies for the test webpage, look for one called username. Try double-clicking the value to edit it, change it to your own name, and refresh the page to see what happens!

The Audits Panel
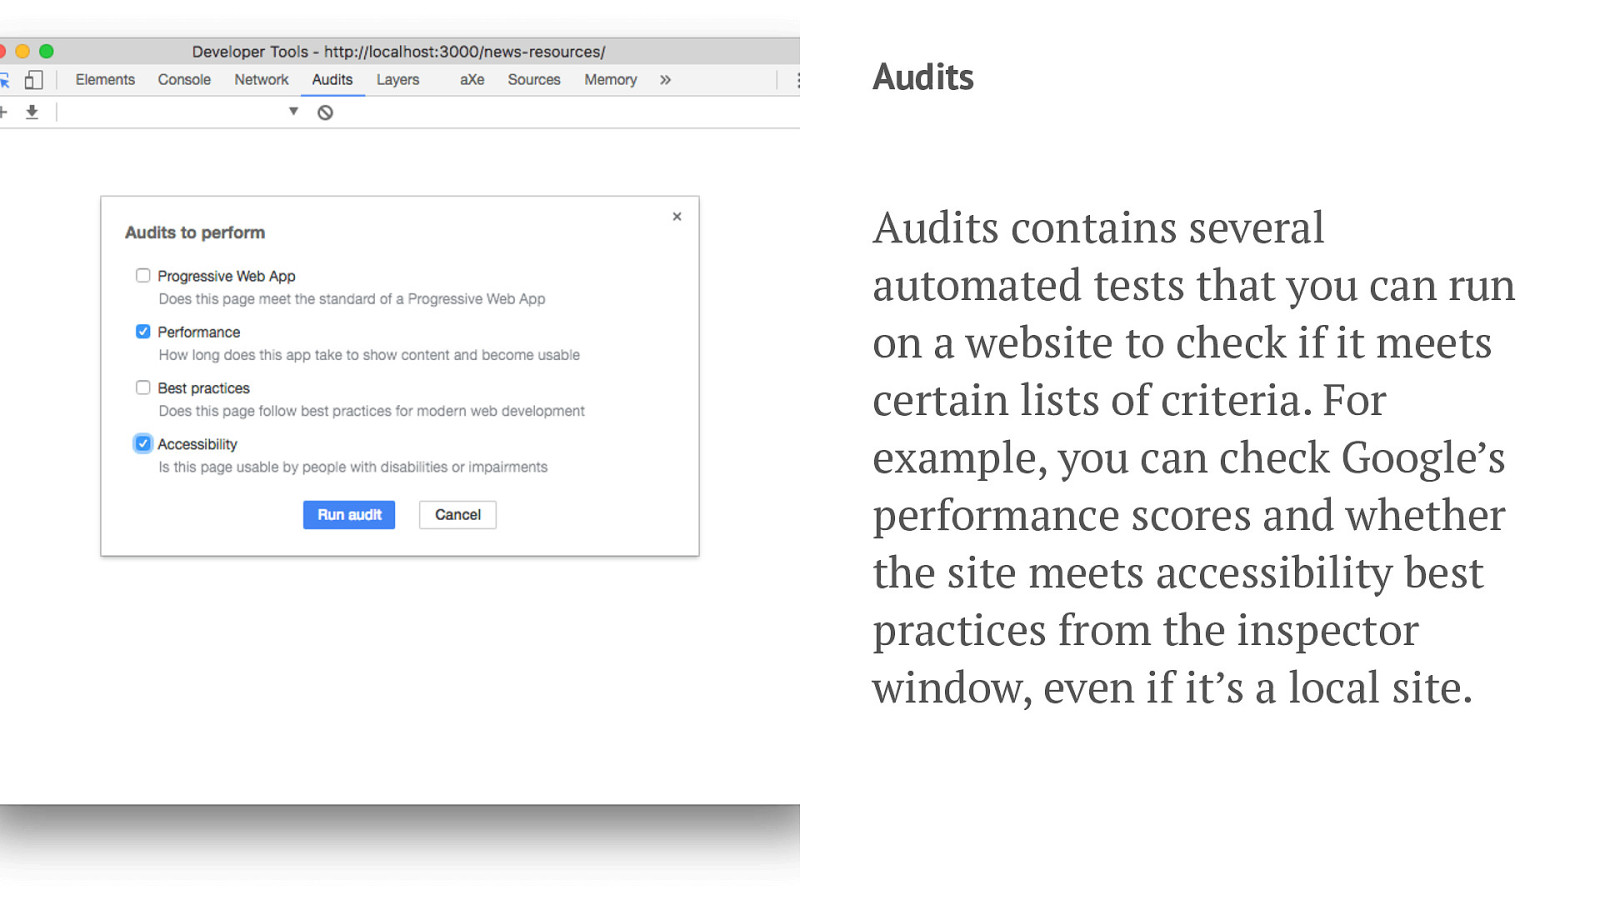
Audits Audits contains several automated tests that you can run on a website to check if it meets certain lists of criteria. For example, you can check Google’s performance scores and whether the site meets accessibility best practices from the inspector window, even if it’s a local site.
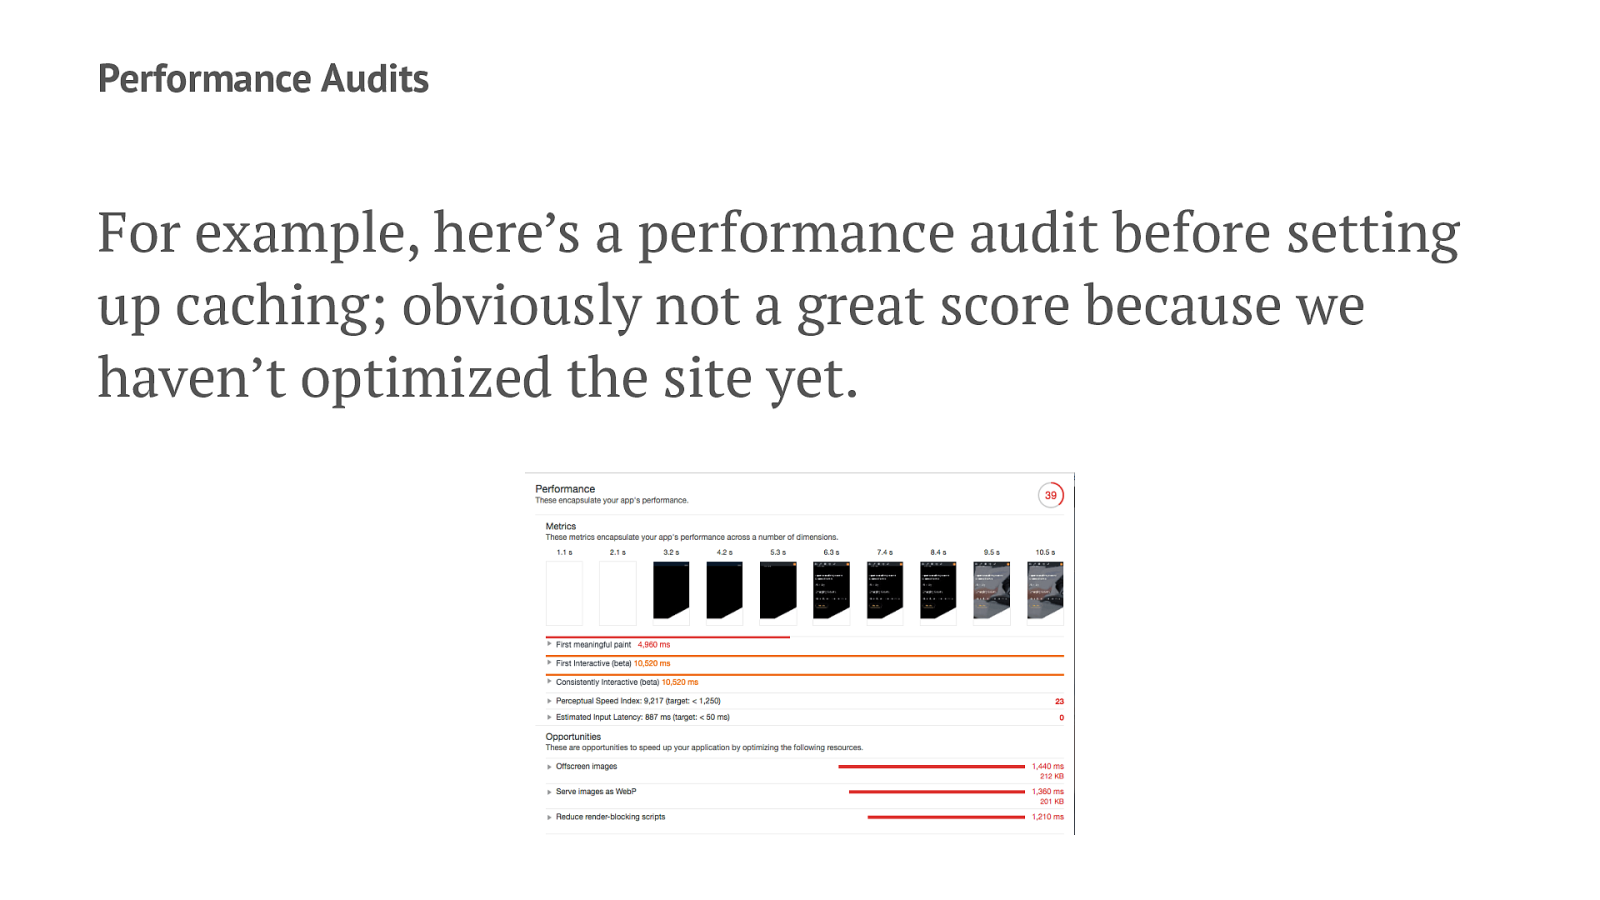
Performance Audits For example, here’s a performance audit before setting up caching; obviously not a great score because we haven’t optimized the site yet.
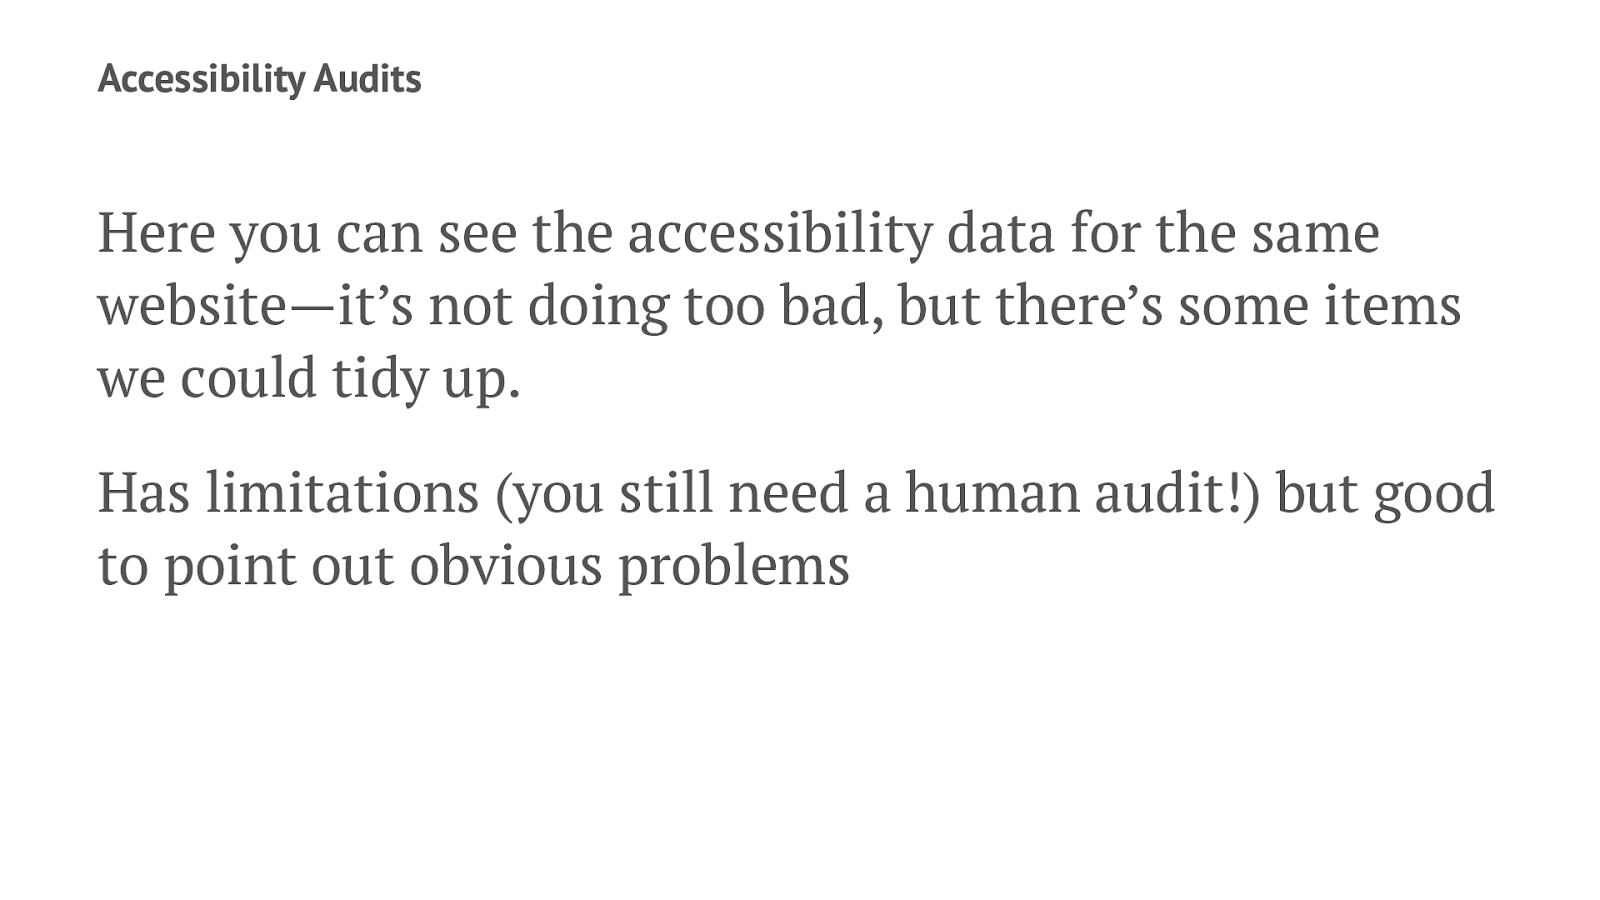
Accessibility Audits Here you can see the accessibility data for the same website—it’s not doing too bad, but there’s some items we could tidy up. Has limitations (you still need a human audit!) but good to point out obvious problems
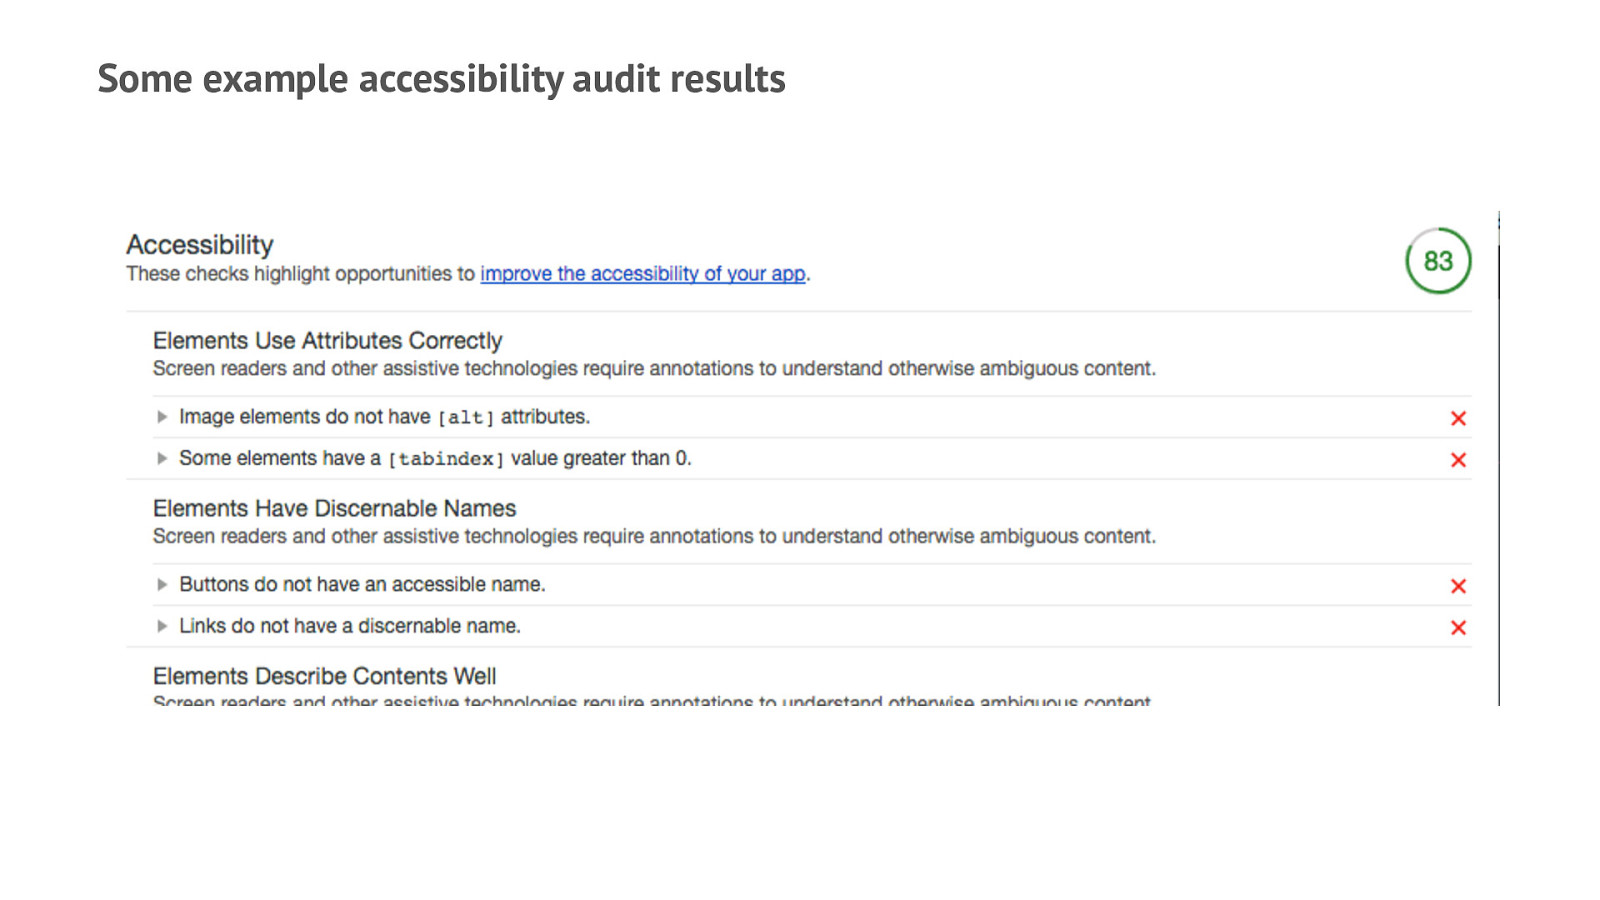
Some example accessibility audit results

More hidden tools
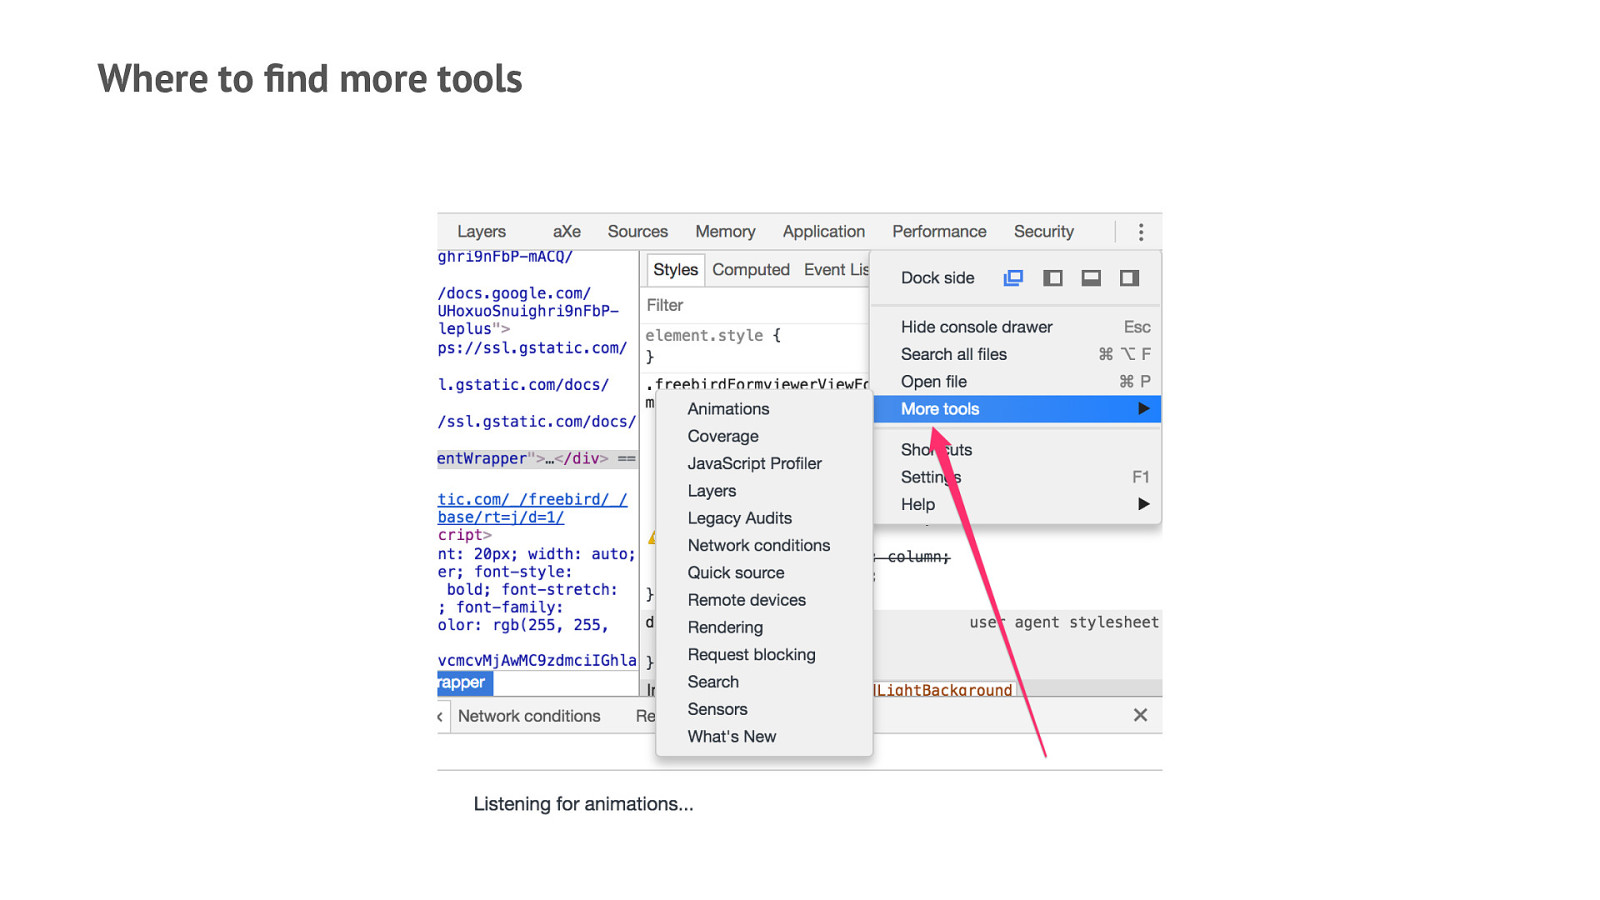
Where to find more tools
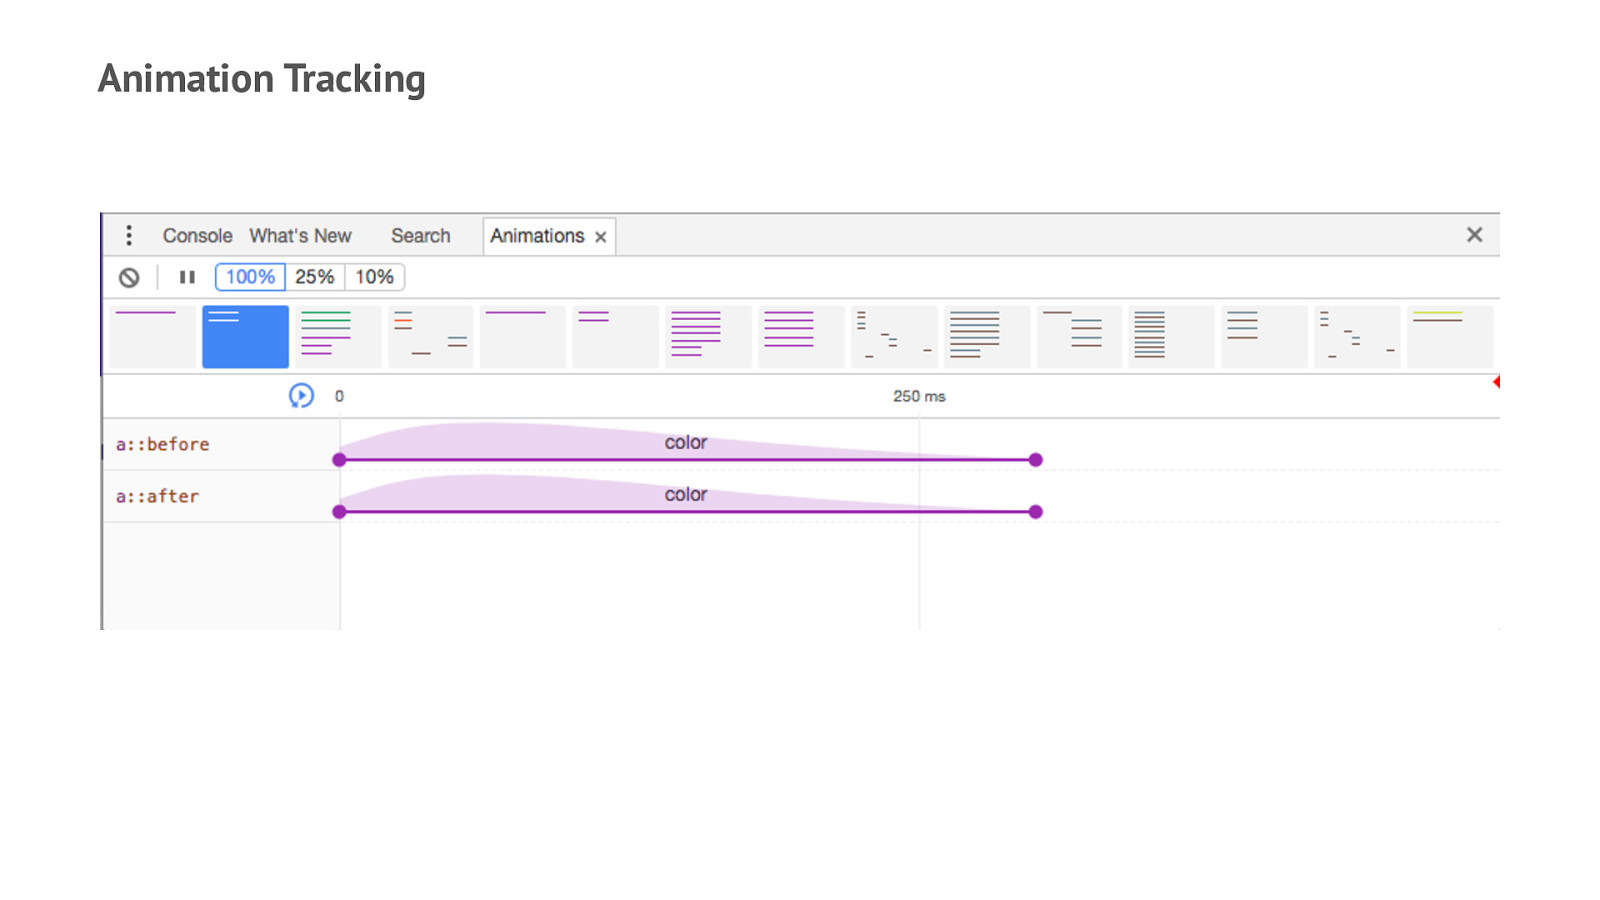
Animation Tracking
Geolocation Sensor Editing Before this, you'd need a proxy server to test how your site would look with different geolocation data, but you can spoof it with the tools in Chrome. Interesting note: Safari and Firefox don't have this feature, but IE does (under the bottom tab, "Emulation")
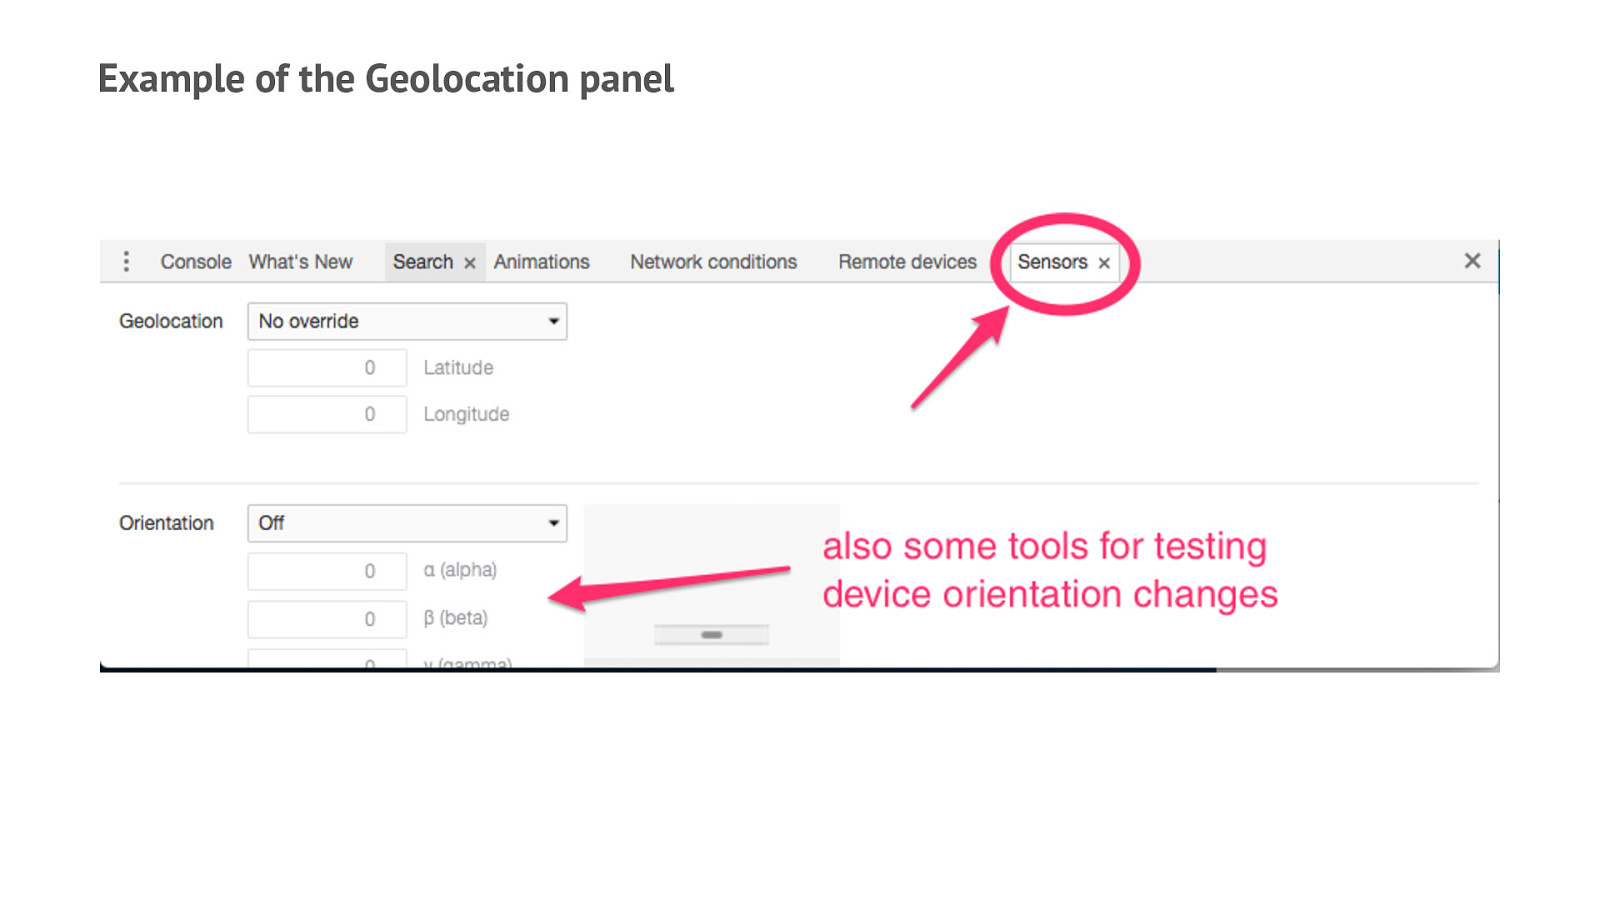
Example of the Geolocation panel
Layers The Layers panel will show you where all the components on the page are, regardless of whether they're currently visible or not Ex. go to the example page, and you can see that it shows where the hover effect on the button is, even when it's not visible—this is great for debugging
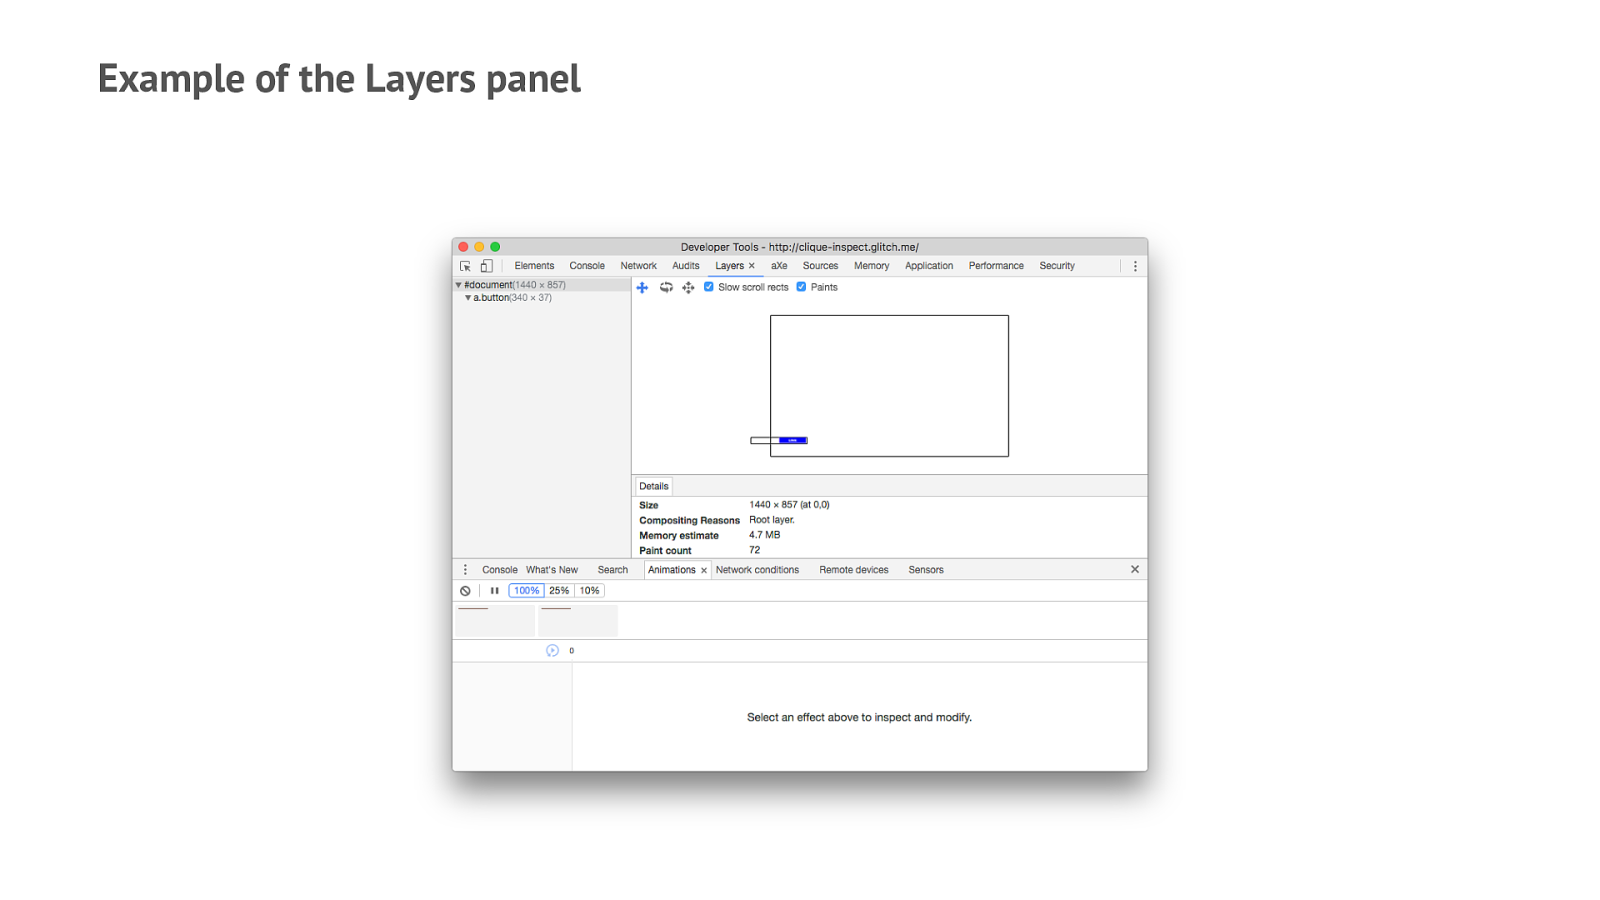
Example of the Layers panel
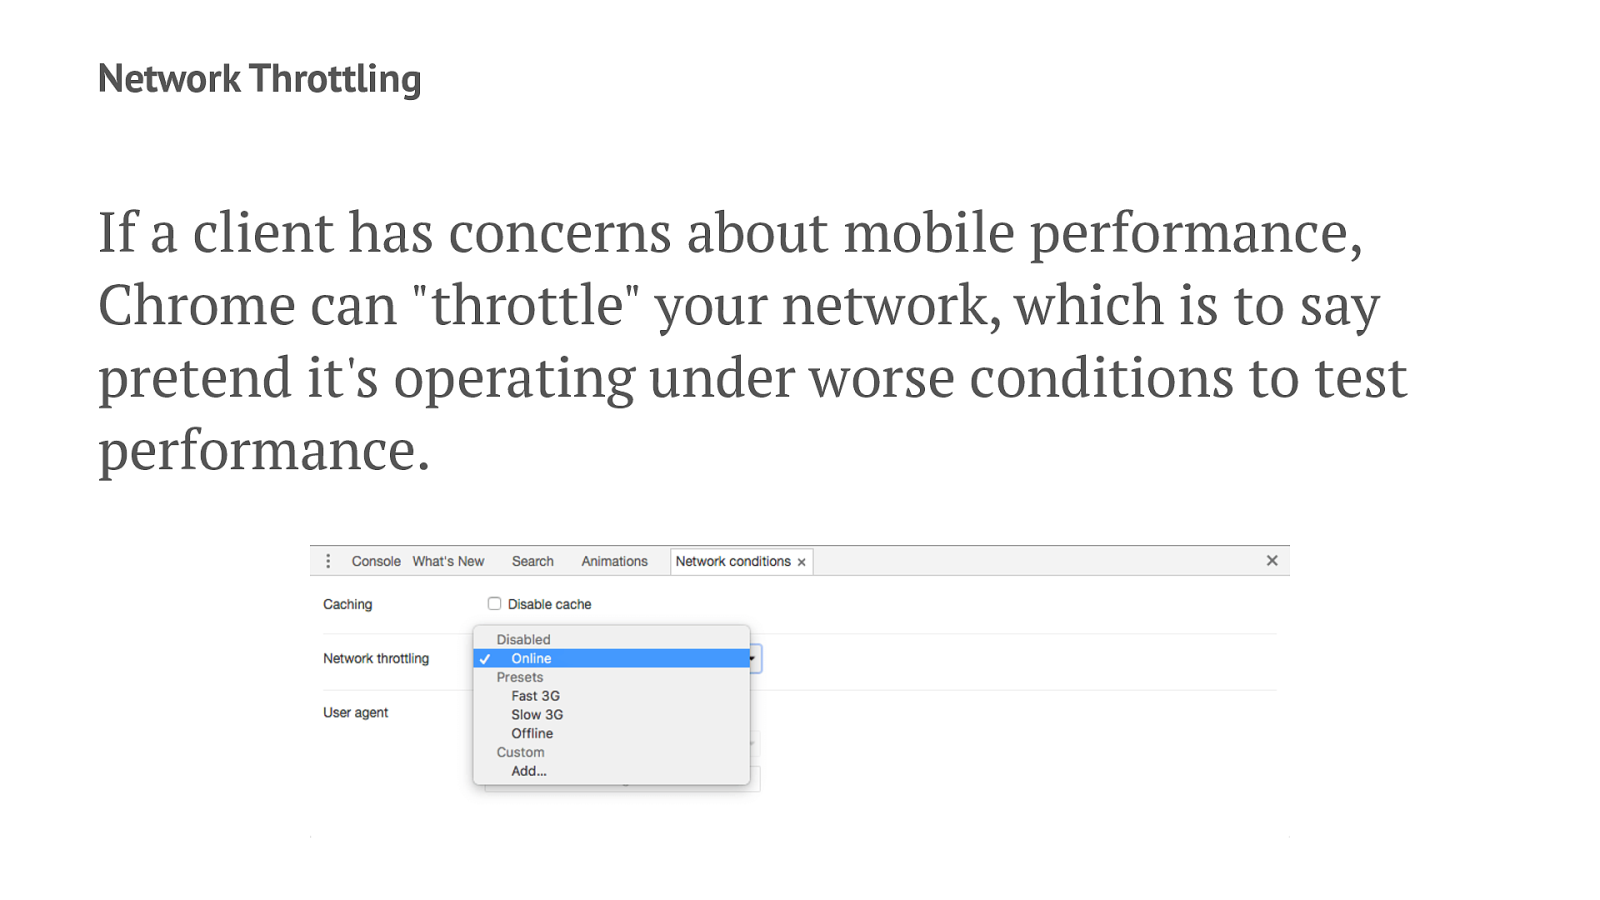
Network Throttling If a client has concerns about mobile performance, Chrome can "throttle" your network, which is to say pretend it's operating under worse conditions to test performance.
...and even more? — New features added all the time in Chrome — Firefox just rolled Firebug into its native suite of tools, pointing to more ahead — Try the Safari Technology Preview for cutting-edge Safari tools