Measuring Performance 0% is your site as fast as you think? cbn http://flic.kr/p/92uGmU

A presentation at ALT.NET Sessions Night in December 2014 in Herzliya, Israel by Yonatan Mevorach
Measuring Performance 0% is your site as fast as you think? cbn http://flic.kr/p/92uGmU
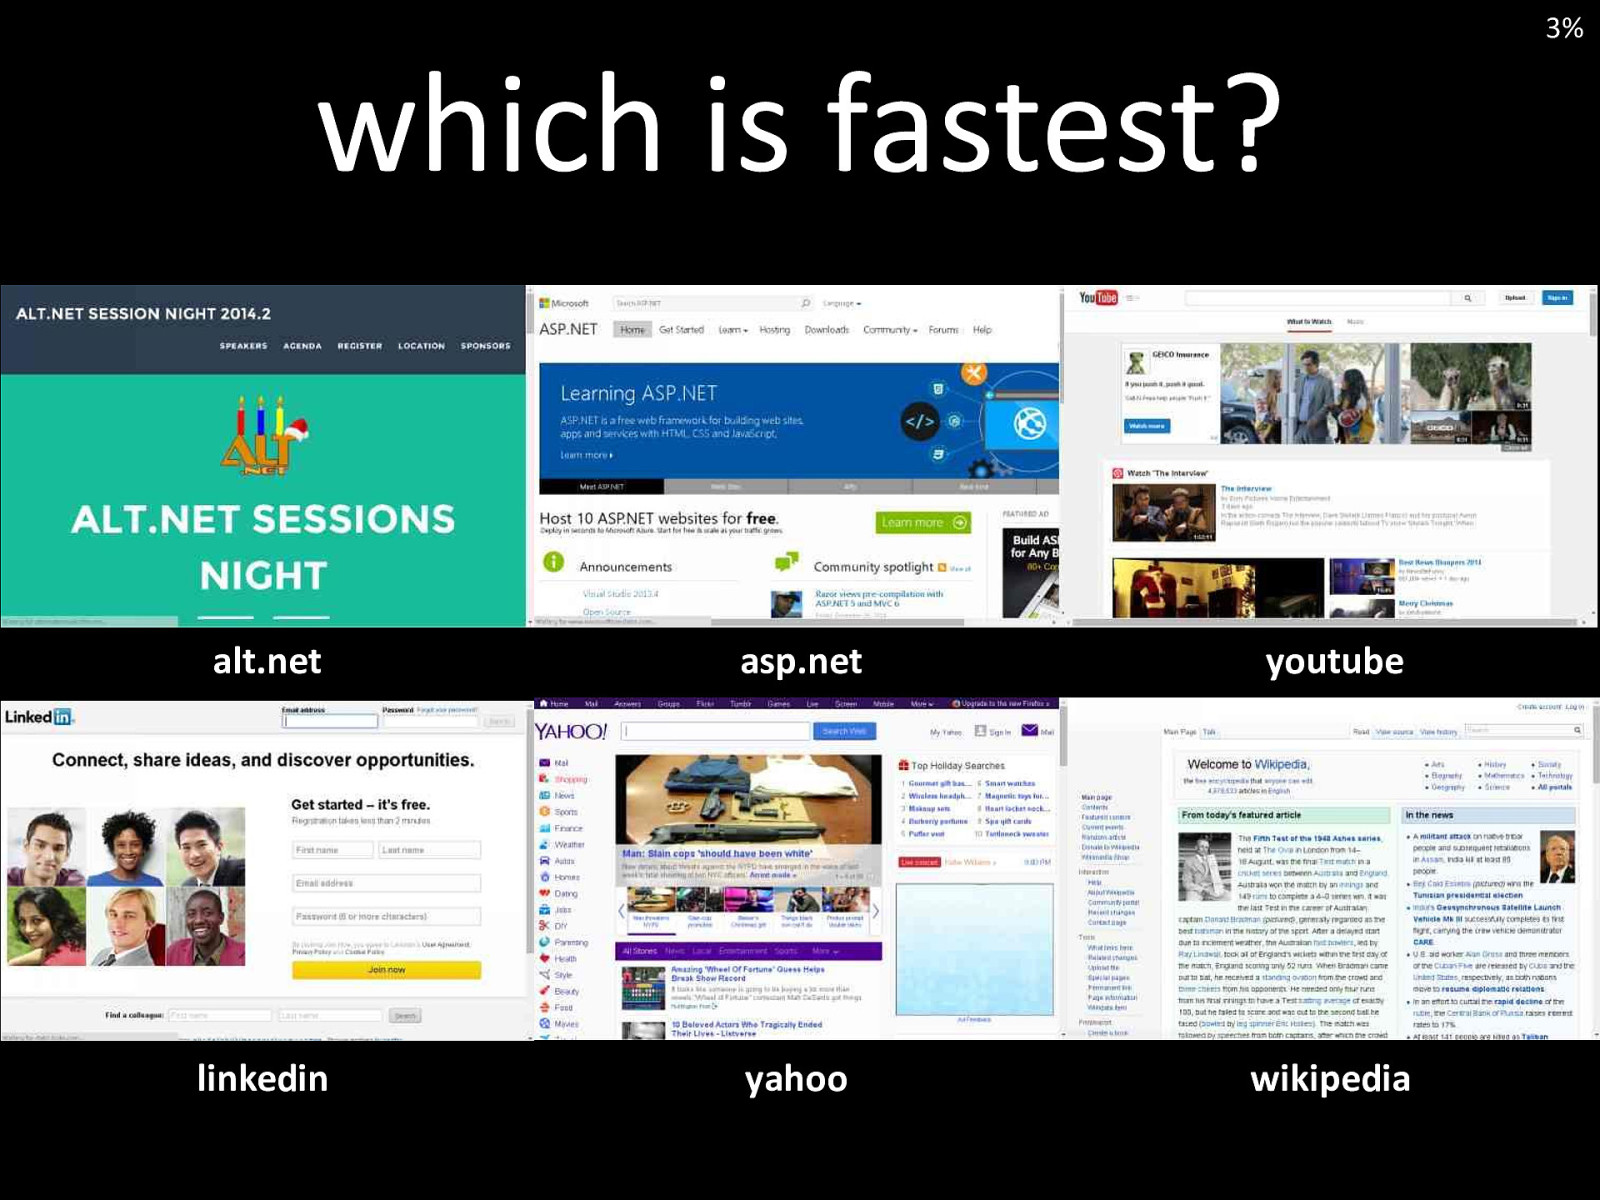
3% which is fastest? alt.net asp.net youtube linkedin yahoo wikipedia
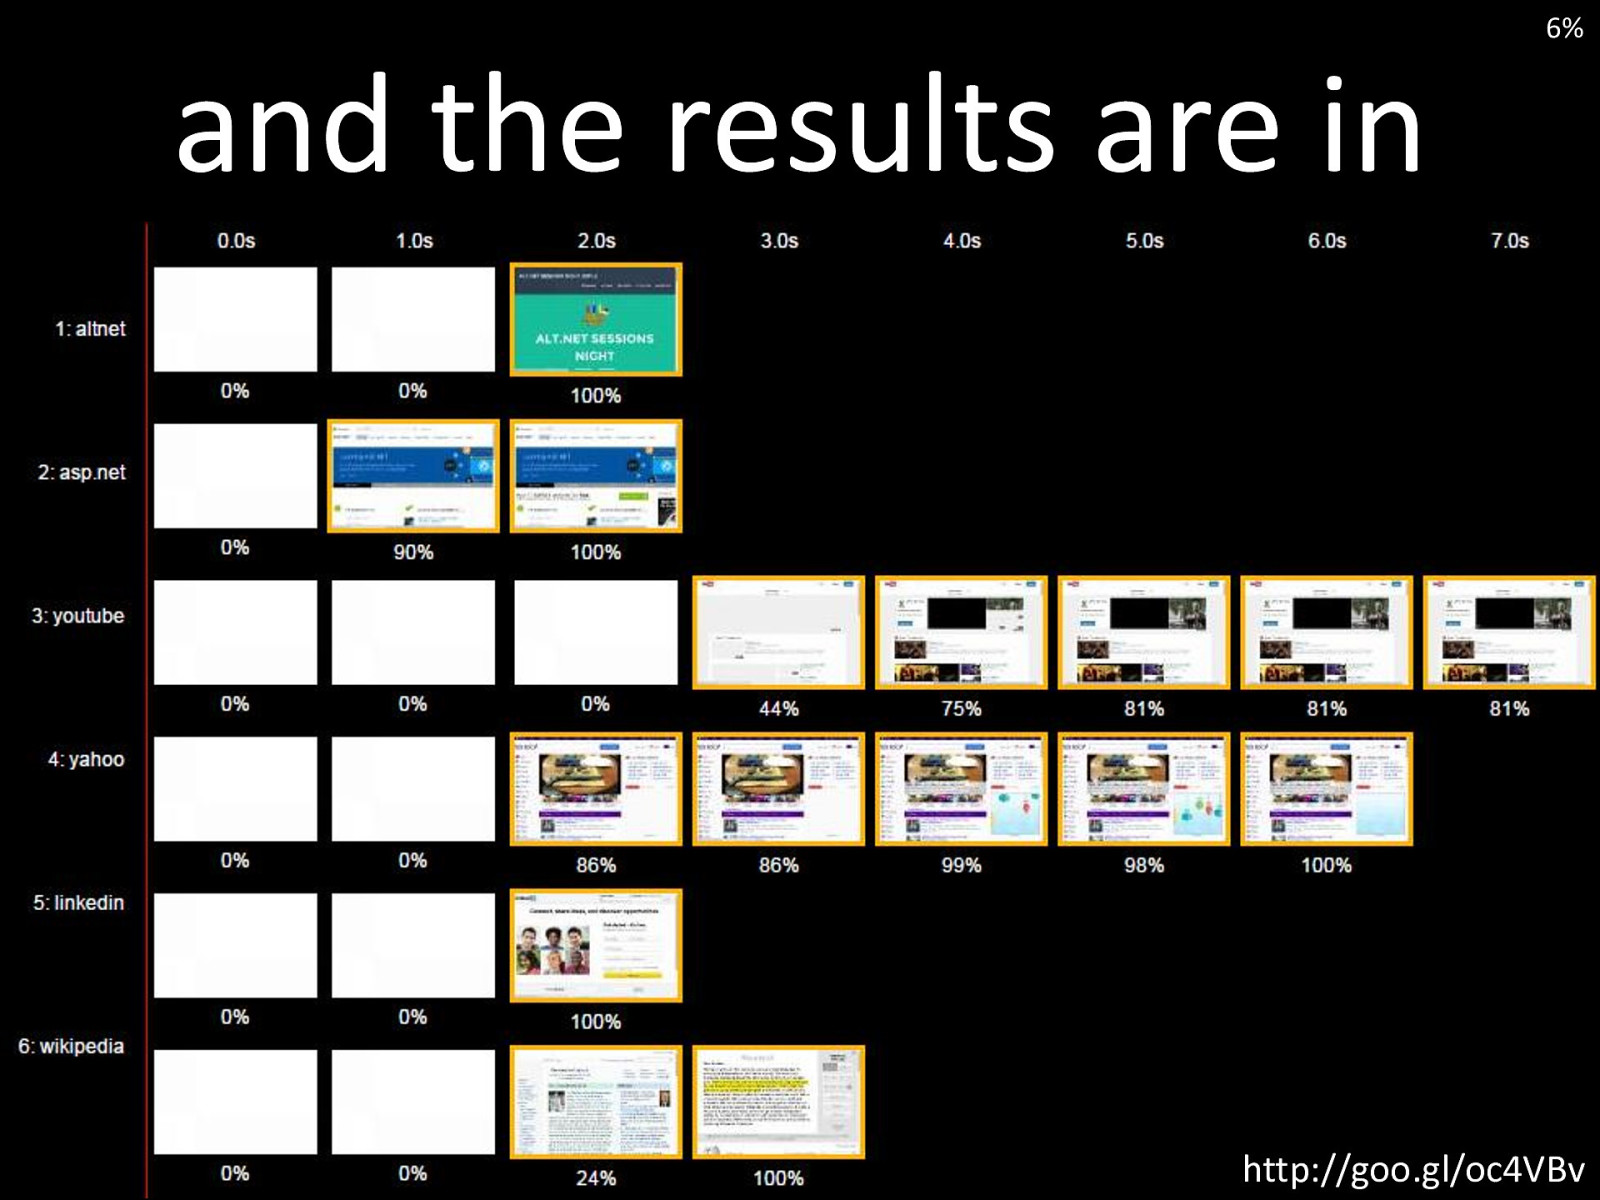
6% and the results are in http://goo.gl/oc4VBv
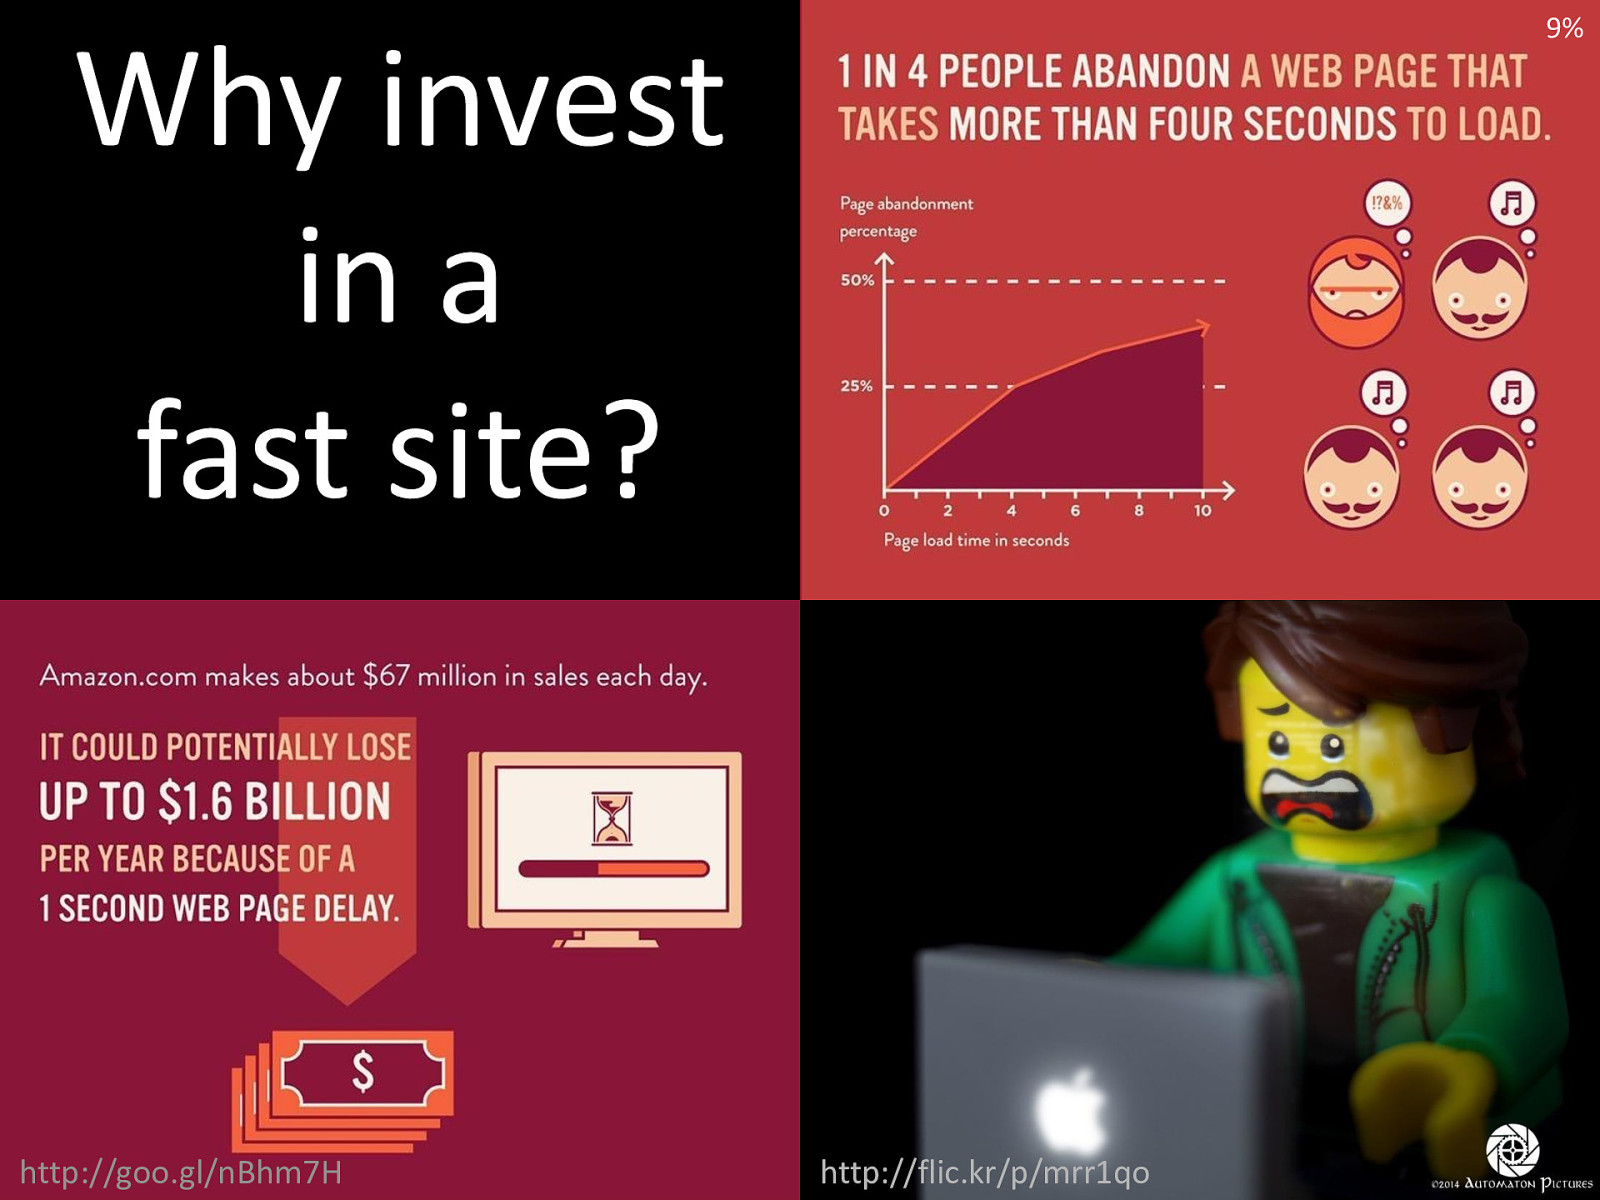
9% Why invest in a fast site? http://goo.gl/nBhm7H http://flic.kr/p/mrr1qo

12% blog.cowchimp.com @cowchimp

15% • Just around the corner • We build shopyourway.com • Serverside is (mainly) .net • Hiring!!!
18% MEASUREMENT “No science attains maturity until it acquires methods of measurement” - Dr. Logan Clendening (science wins!)
21% User Experience = Serverside + Clientside
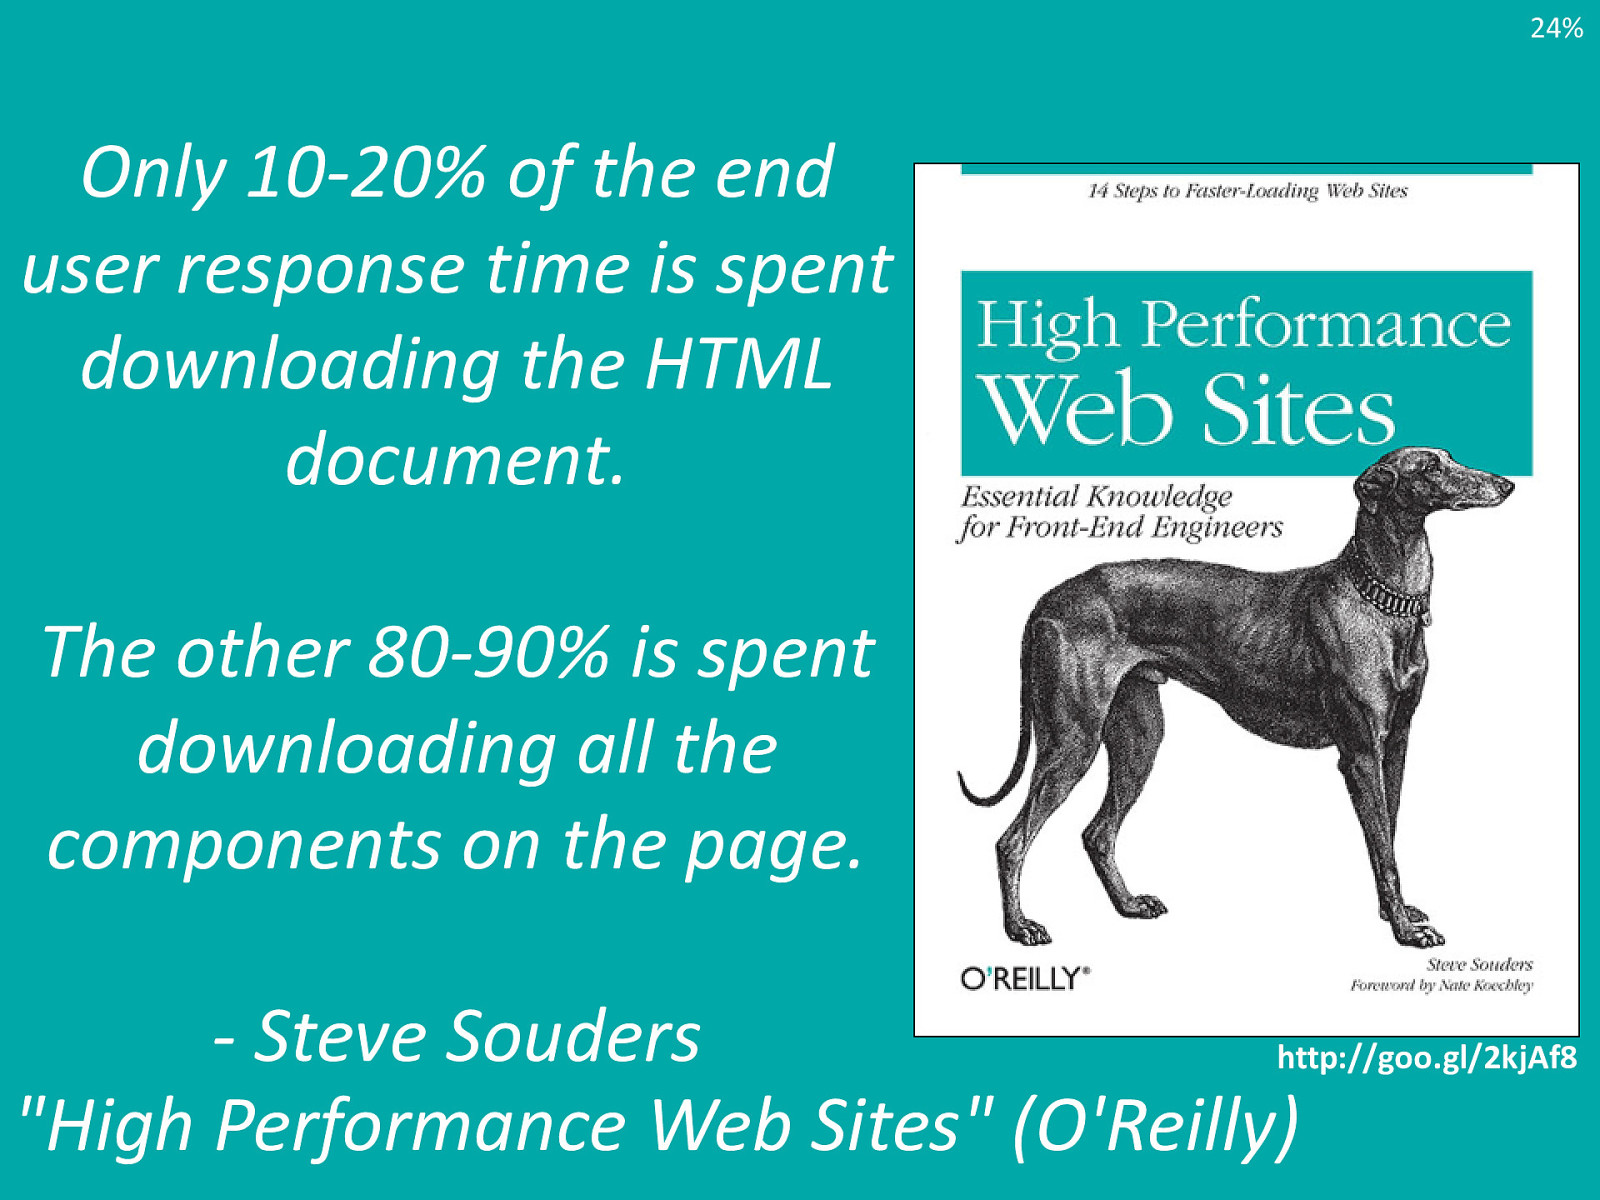
24% Only 10-20% of the end user response time is spent downloading the HTML document. The other 80-90% is spent downloading all the components on the page. - Steve Souders http://goo.gl/2kjAf8 "High Performance Web Sites" (O'Reilly)
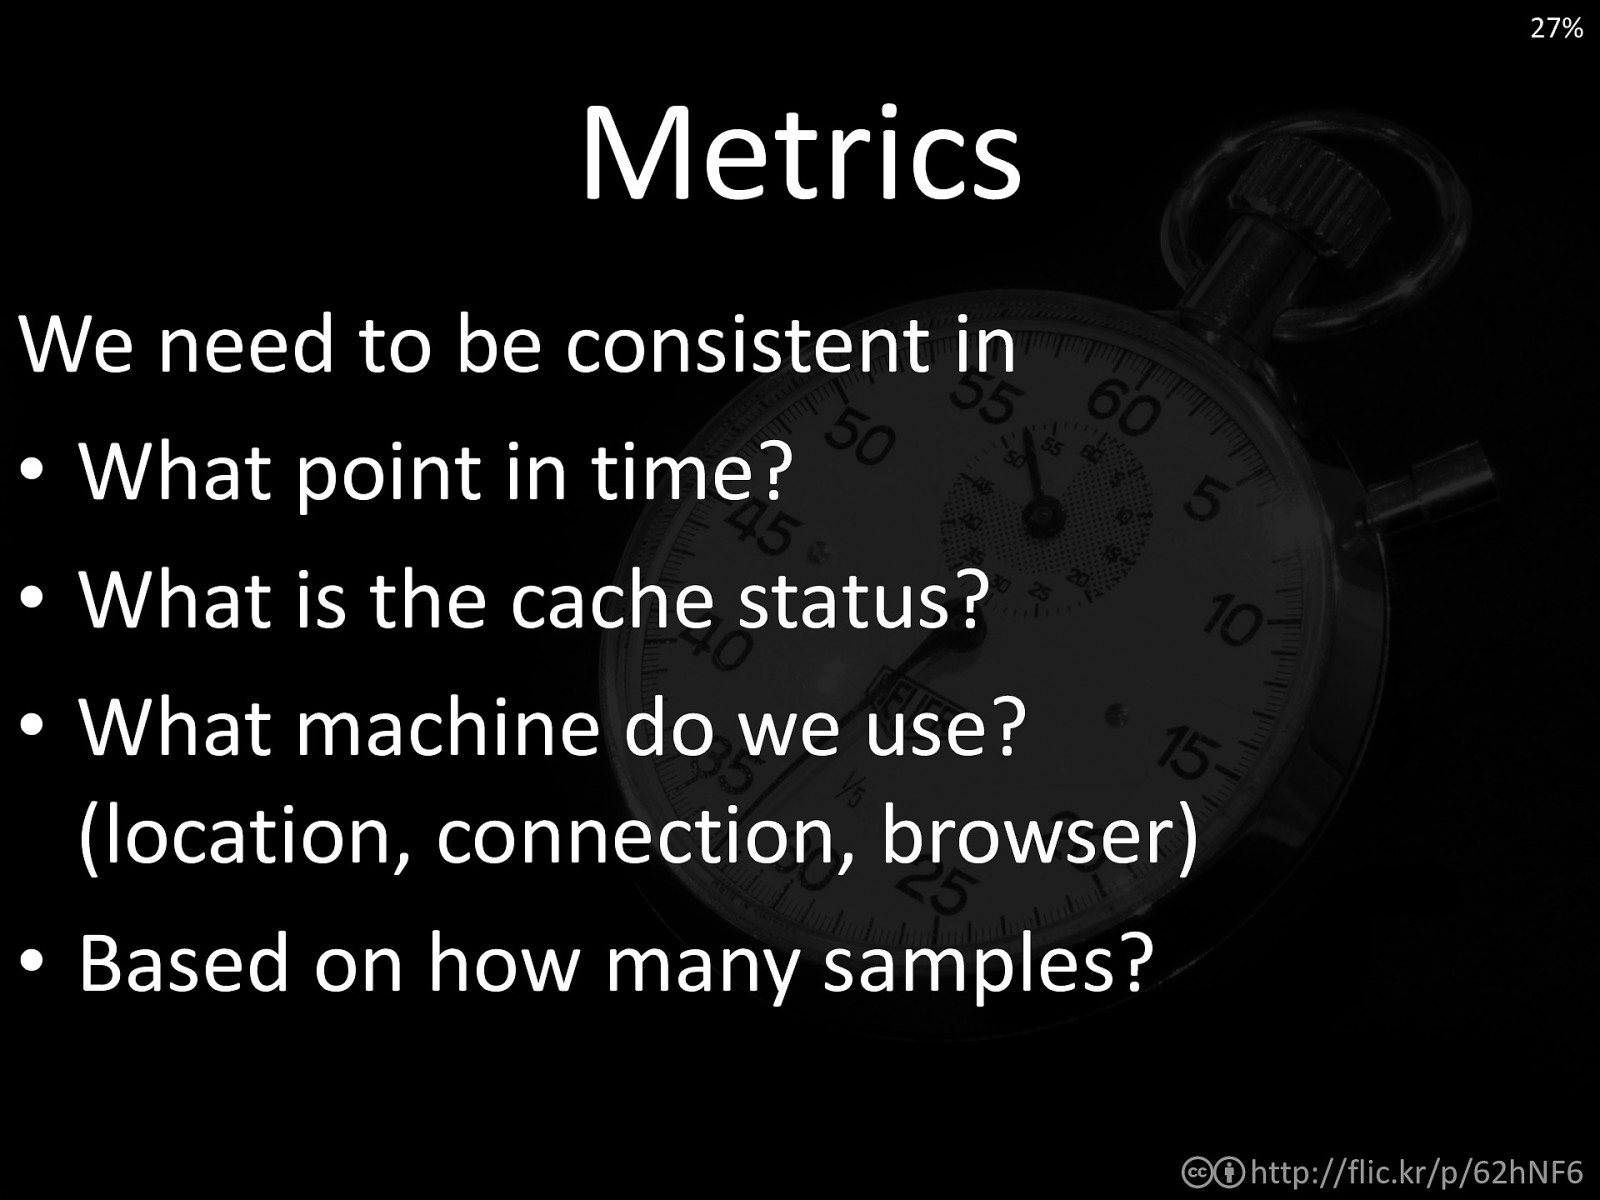
27% Metrics We need to be consistent in • What point in time? • What is the cache status? • What machine do we use? (location, connection, browser) • Based on how many samples? cb http://flic.kr/p/62hNF6
30% Example Metric • • • • x = Page load time - Navigation start time Of cached view As measured by Webpagetest Running a Chrome with a DSL connection in Virginia cb http://flic.kr/p/62hNF6
33% Top Level Metrics from start until... • Time to First Byte (TTFB) • Start Render • Page Load (aka Load time) cb http://flic.kr/p/62hNF6
36% Good enough? • These metrics do a good job at measuring generic network\browser events • But do they do a good job of reflecting the User Experience? http://goo.gl/2hIlGQ

39% The reported Load time for this page is 3.959s http://goo.gl/o6EXn2
Perceived Performance 42% http://goo.gl/mRBPDJ
45% Monitoring cbn http://flic.kr/p/4X3ect
48% Synthetic vs. RUM (Real User Monitoring) cb http://flic.kr/p/91r3Wz

51% Webpagetest.org (WPT) http://goo.gl/1qiL62
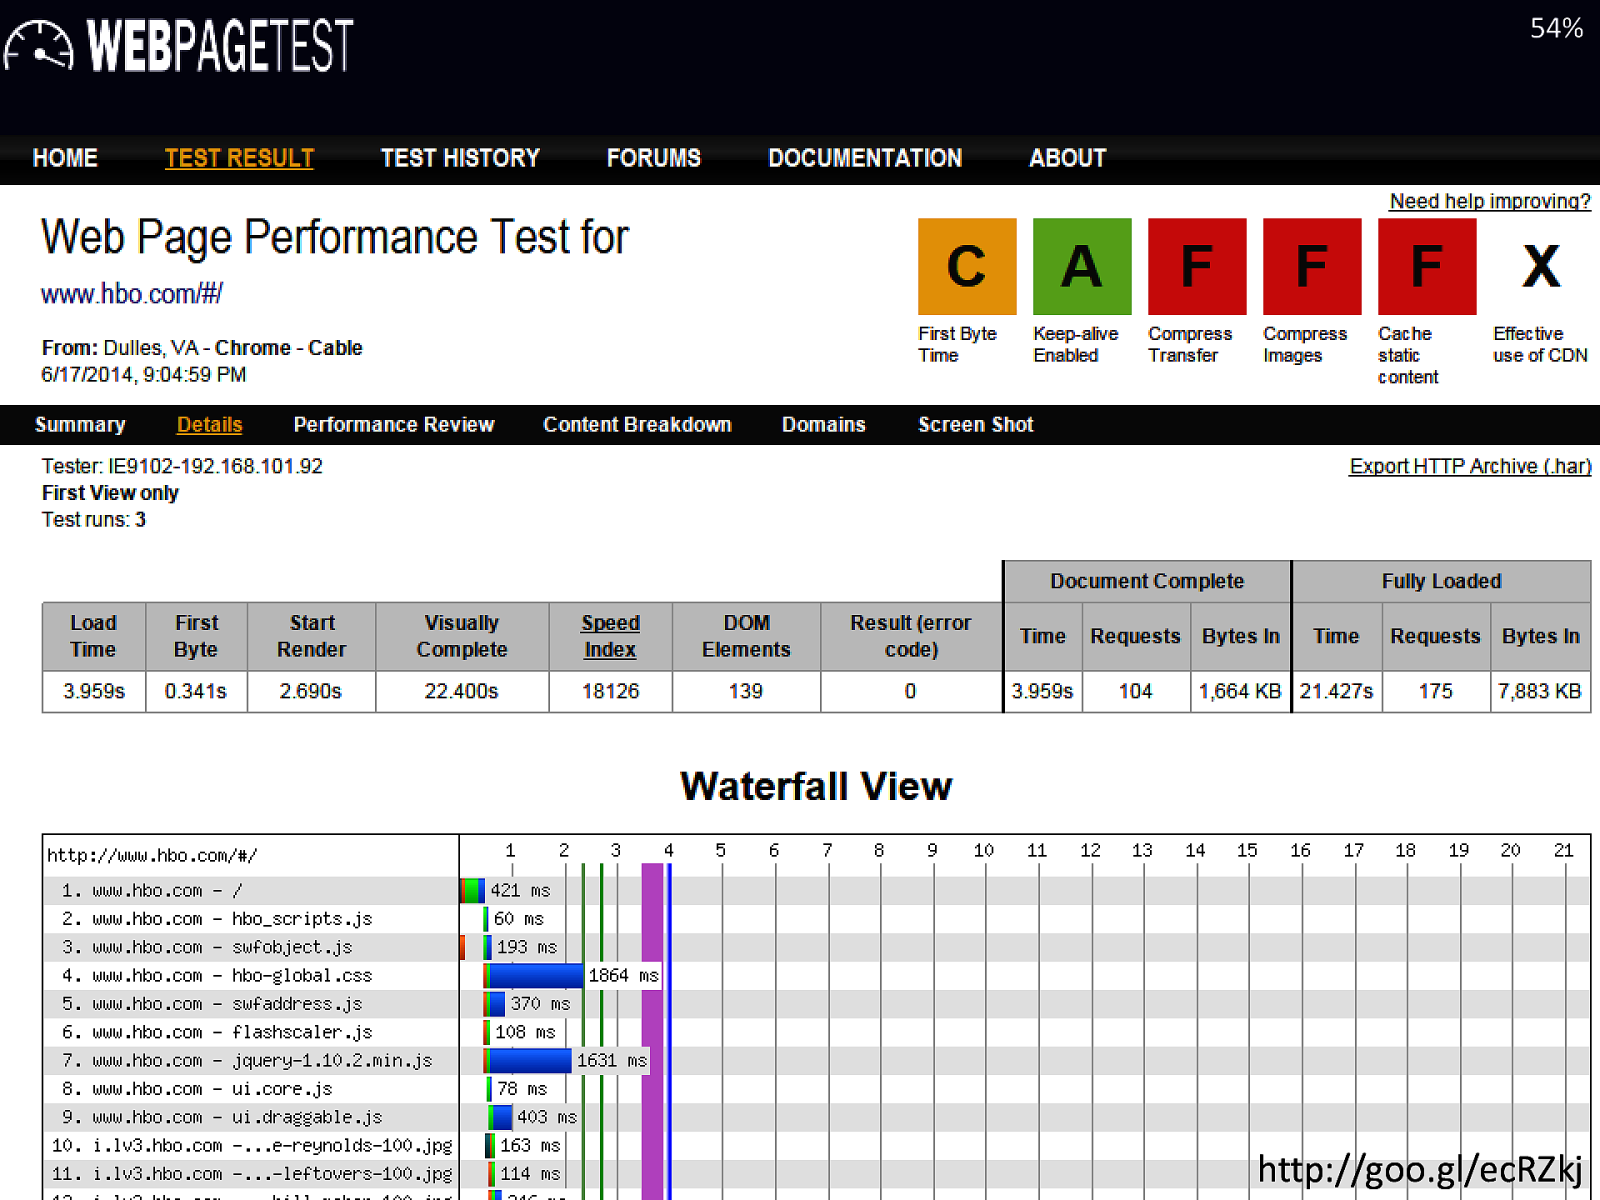
54% http://goo.gl/ecRZkj
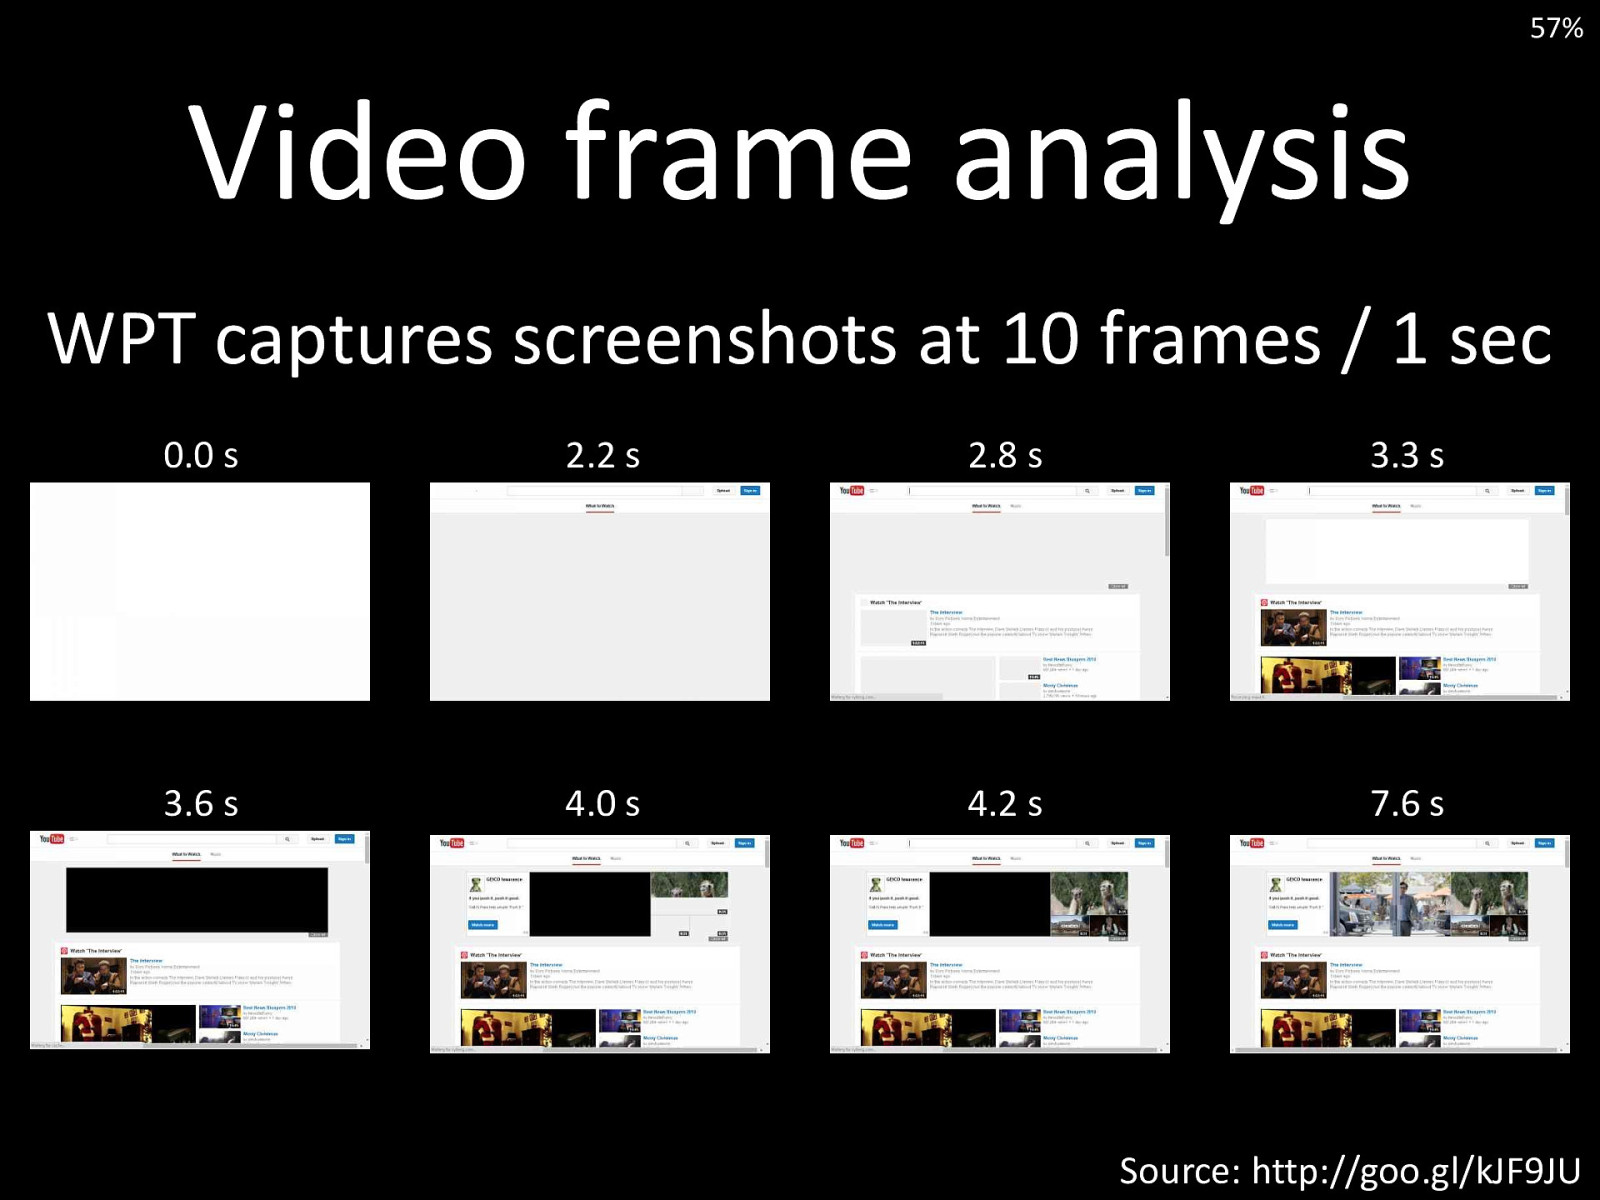
57% Video frame analysis WPT captures screenshots at 10 frames / 1 sec 0.0 s 2.2 s 2.8 s 3.3 s 3.6 s 4.0 s 4.2 s 7.6 s Source: http://goo.gl/kJF9JU
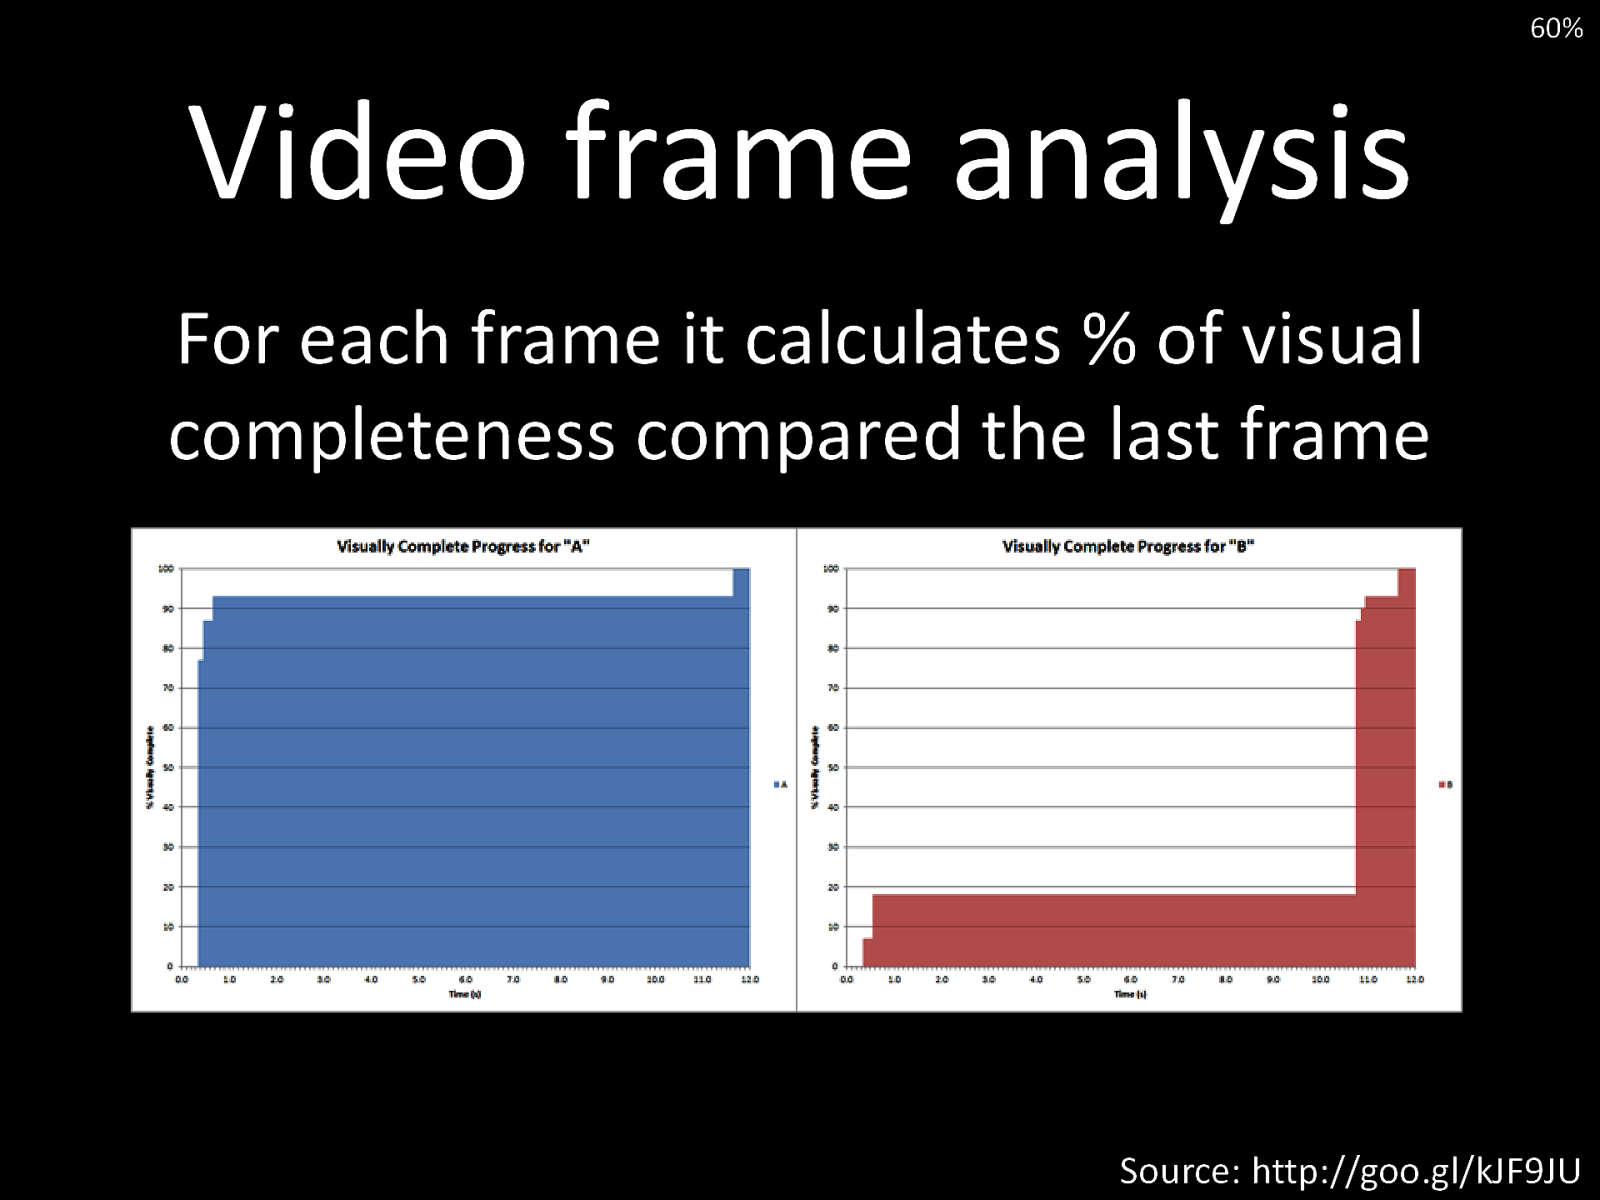
60% Video frame analysis For each frame it calculates % of visual completeness compared the last frame Source: http://goo.gl/kJF9JU
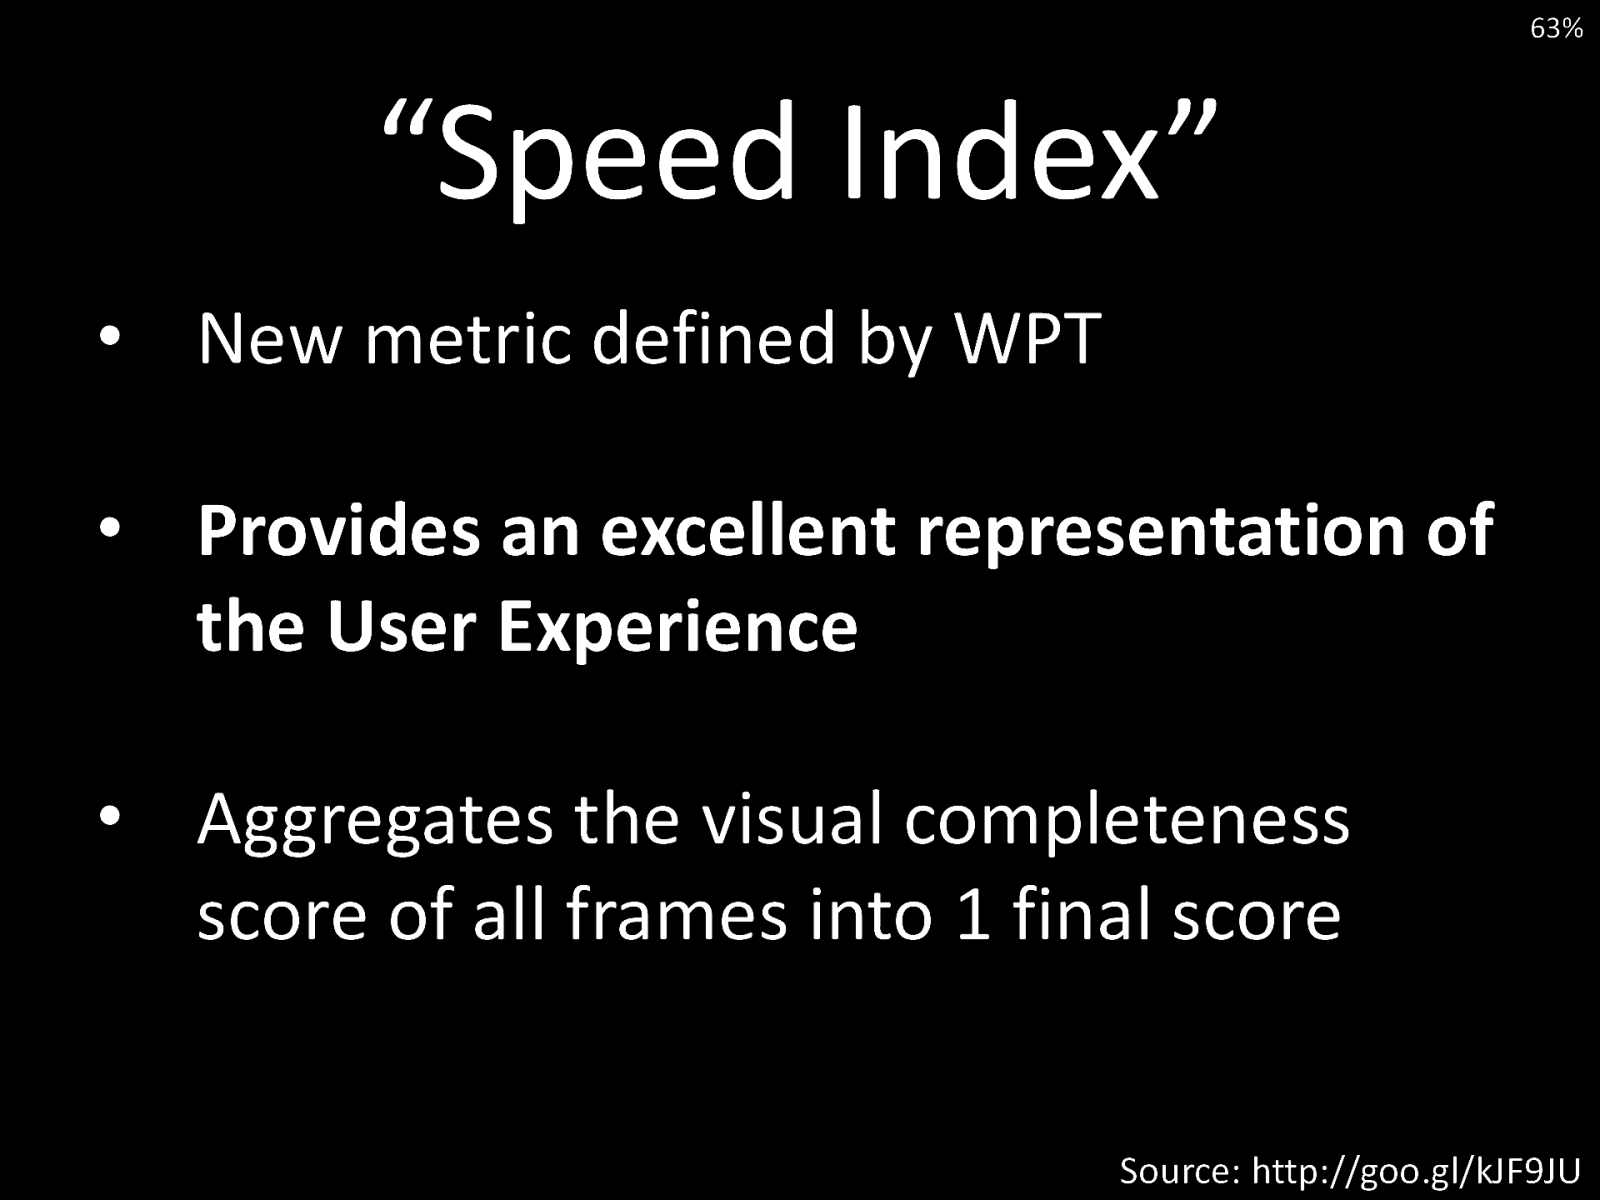
63% “Speed Index” • New metric defined by WPT • Provides an excellent representation of the User Experience • Aggregates the visual completeness score of all frames into 1 final score Source: http://goo.gl/kJF9JU

Webpagetest API 66% Exposes all of WPT's functionality via HTTP API webpagetest.org/getkey.phpcbn http://flic.kr/p/bViZ2p
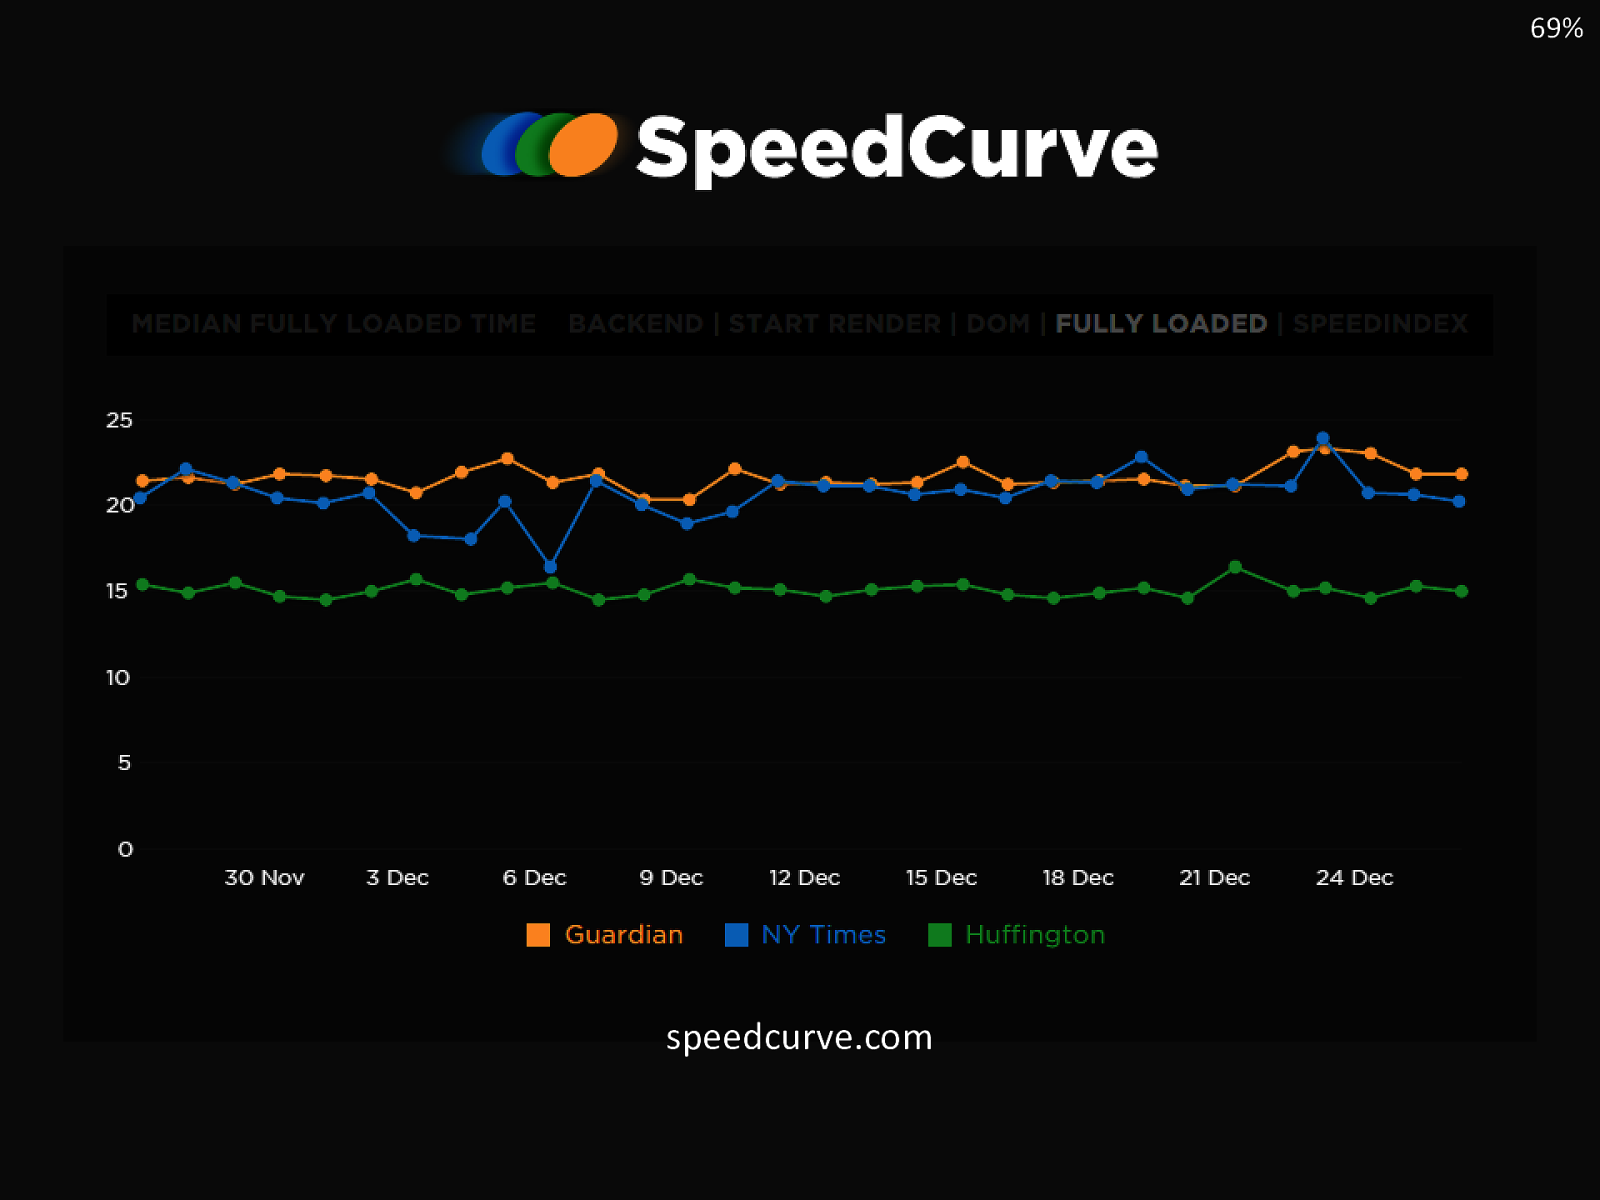
69% speedcurve.com

72% RUM Real User Monitoring http://goo.gl/JRuFyd
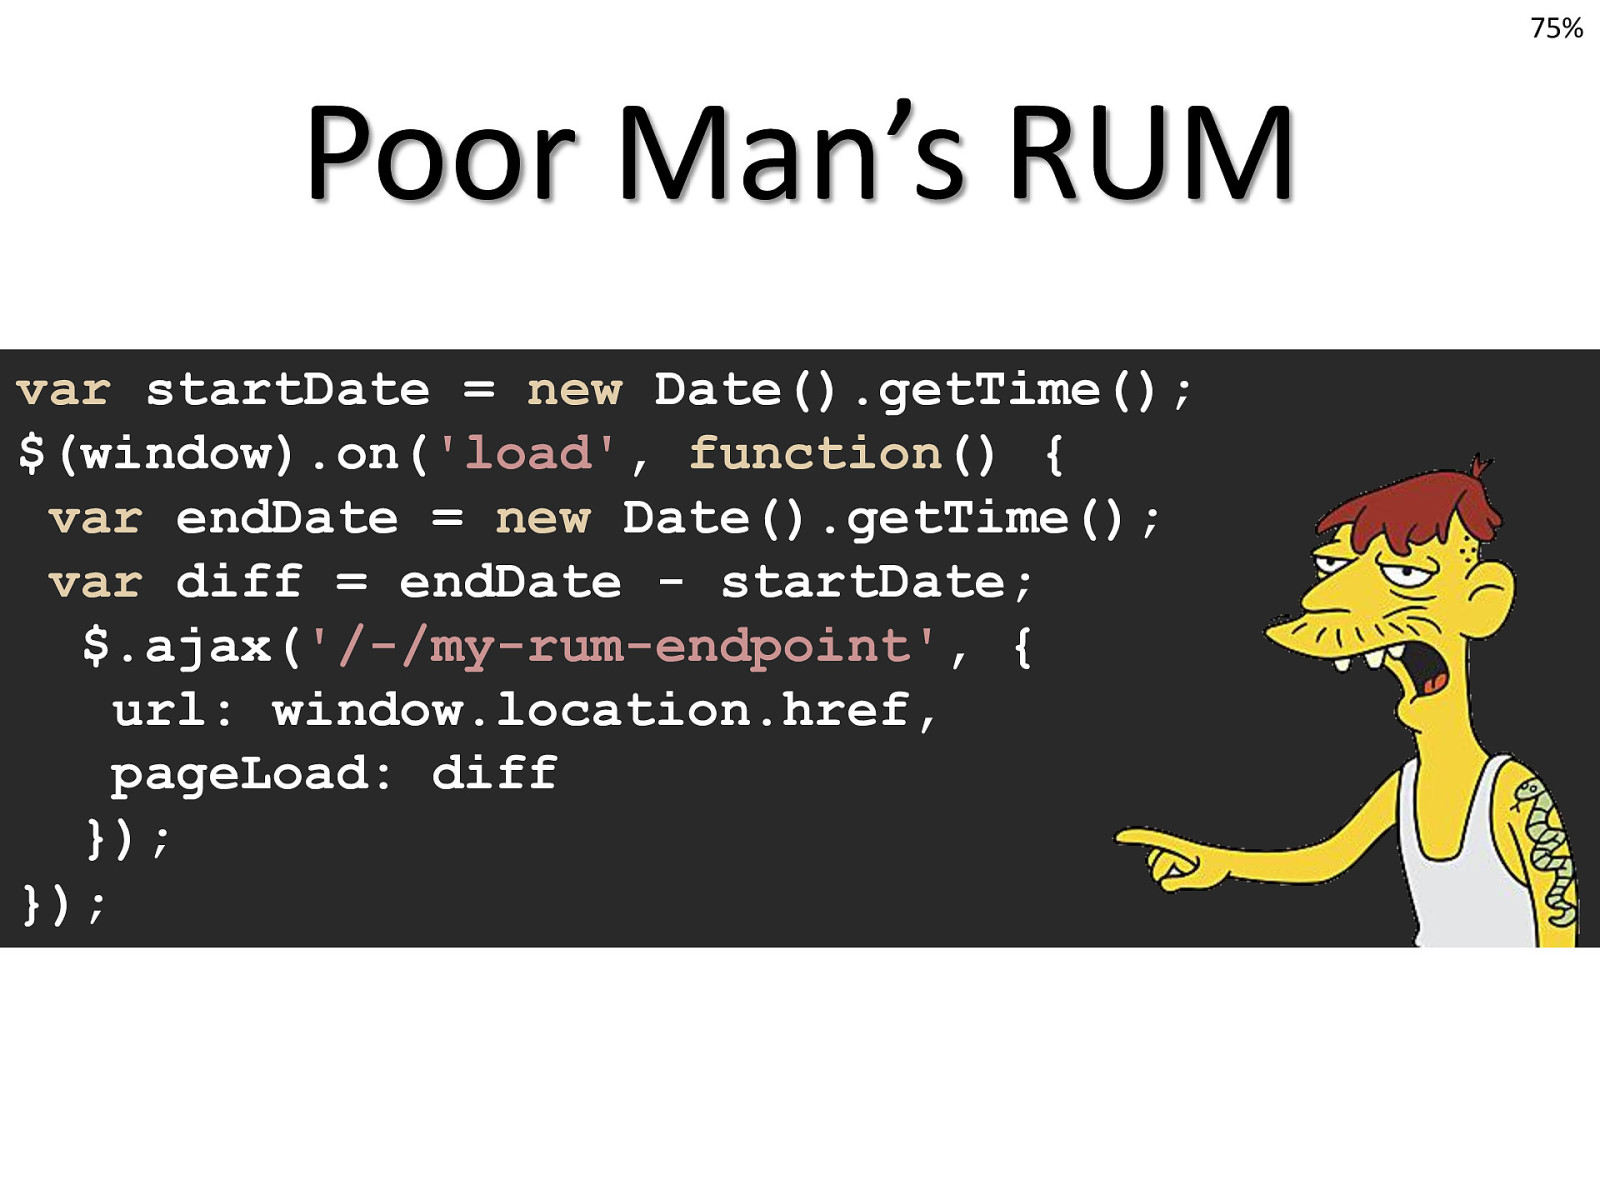
75% Poor Man’s RUM var startDate = new Date().getTime(); $(window).on('load', function() { var endDate = new Date().getTime(); var diff = endDate - startDate; $.ajax('/-/my-rum-endpoint', { url: window.location.href, pageLoad: diff }); });
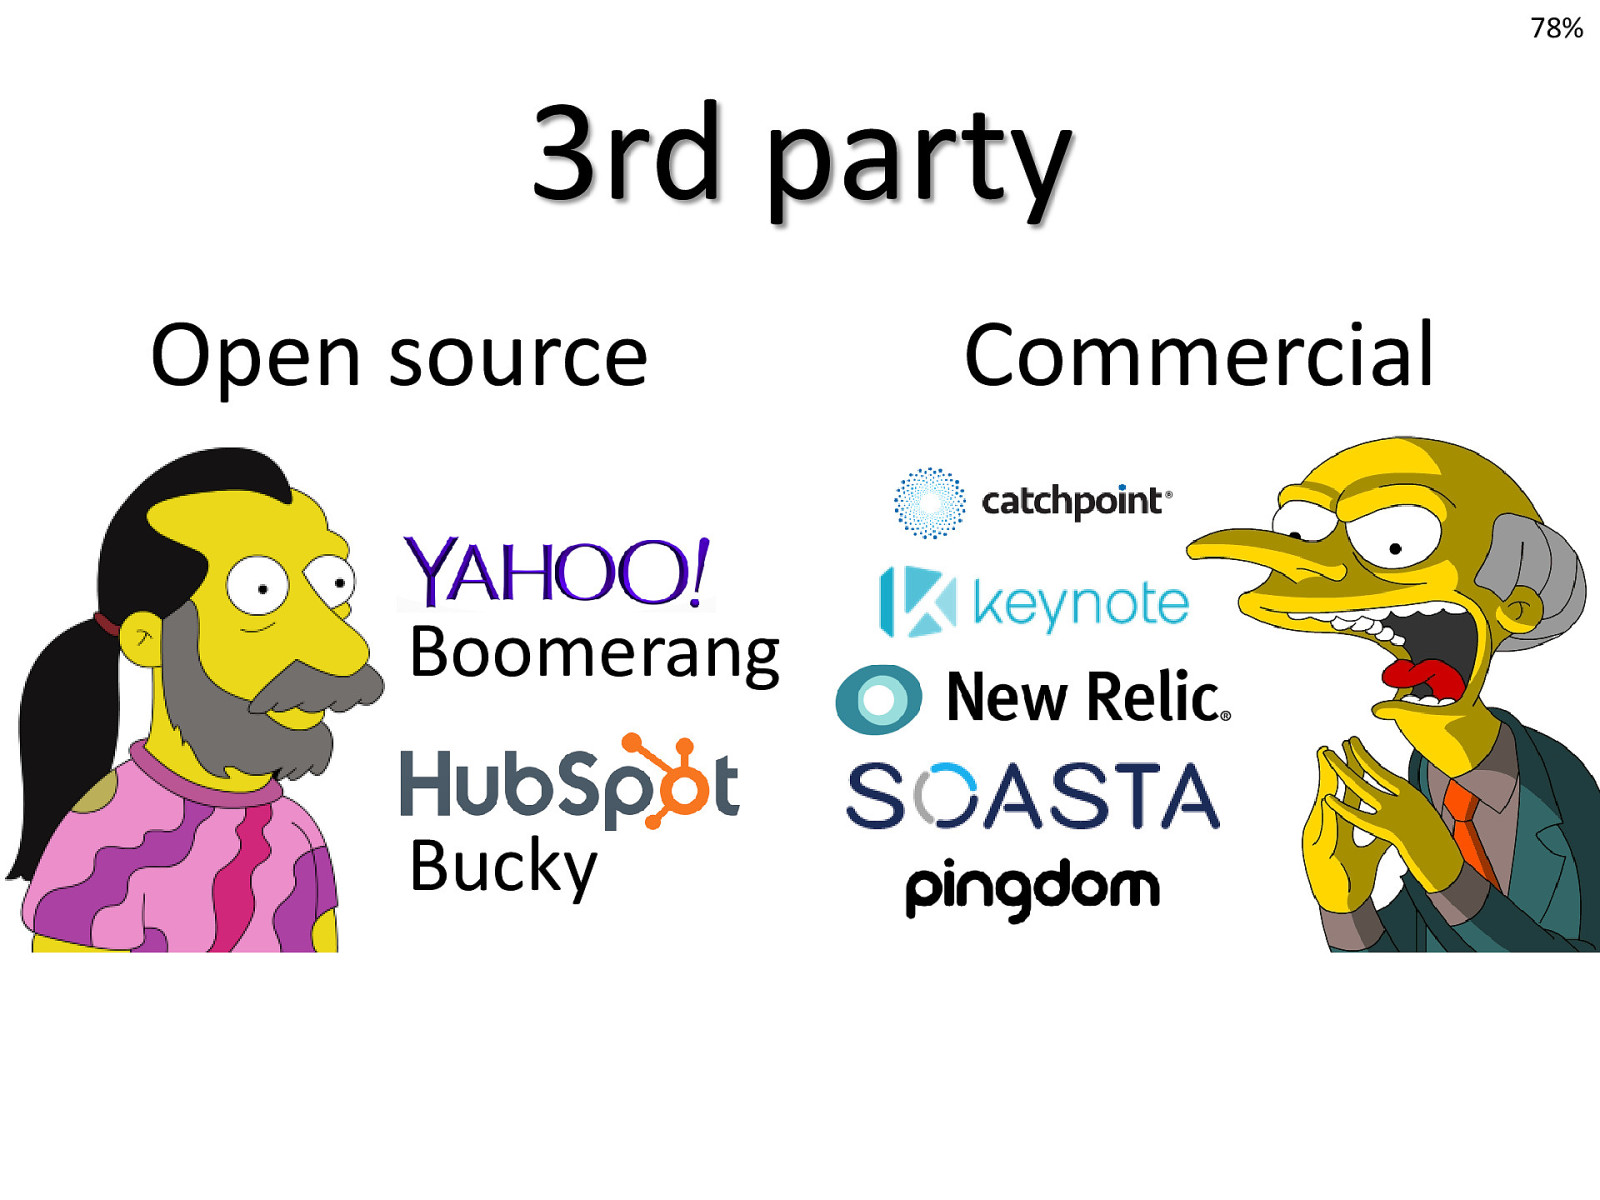
78% 3rd party Open source Boomerang Bucky Commercial
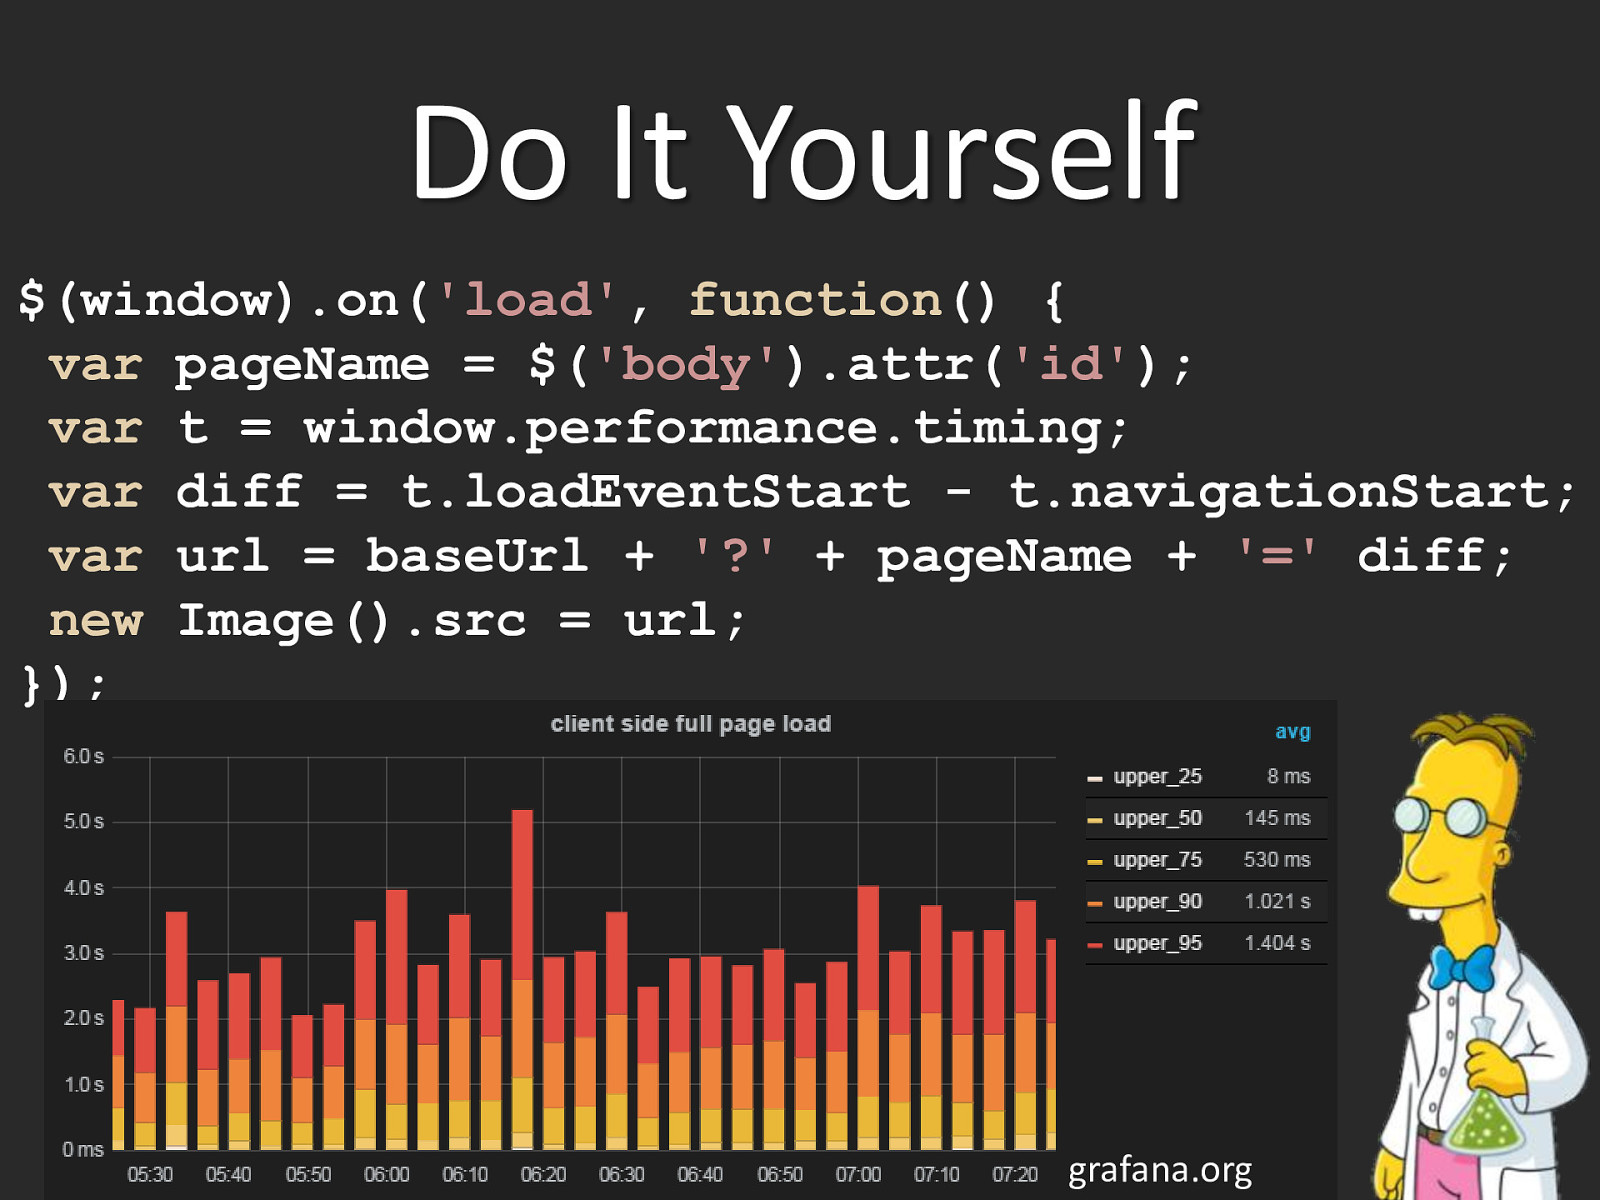
Do It Yourself $(window).on('load', function() { var pageName = $('body').attr('id'); var t = window.performance.timing; var diff = t.loadEventStart - t.navigationStart; var url = baseUrl + '?' + pageName + '=' diff; new Image().src = url; }); grafana.org
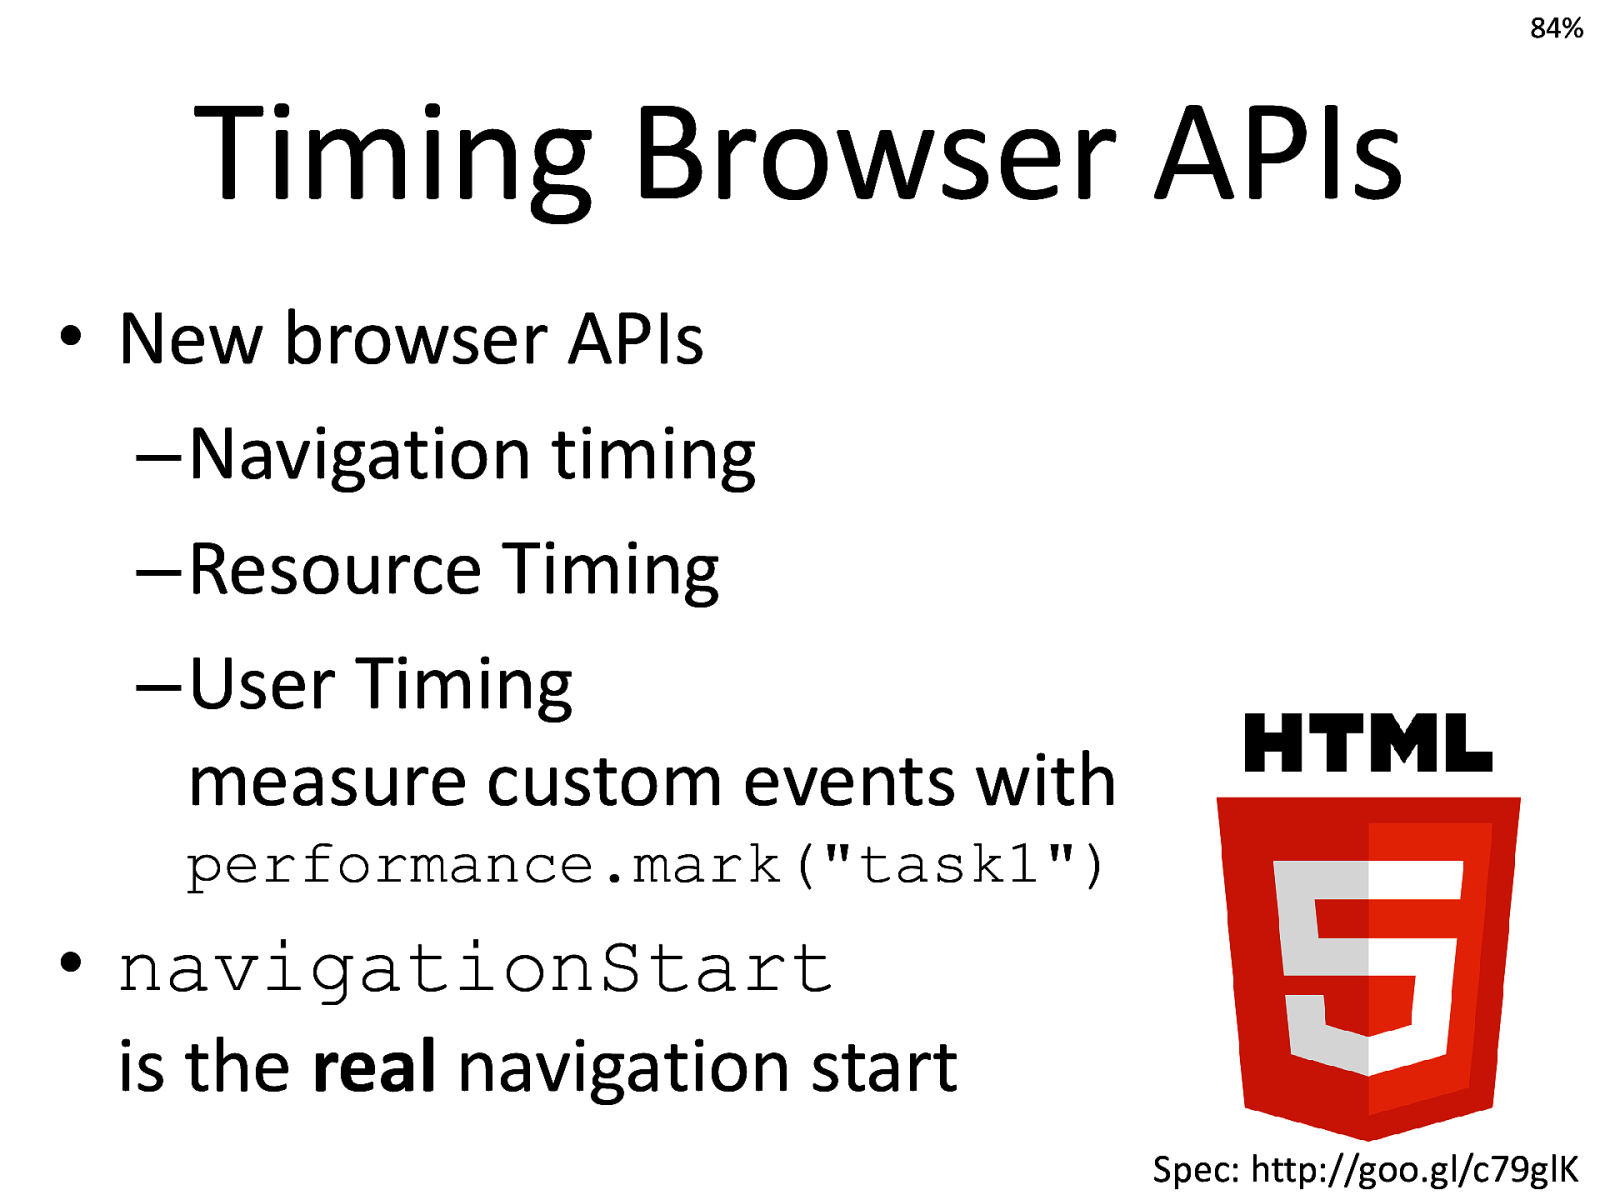
84% Timing Browser APIs • New browser APIs –Navigation timing –Resource Timing –User Timing measure custom events with performance.mark("task1") • navigationStart is the real navigation start Spec: http://goo.gl/c79glK

Synthetic & RUM 87% Page metrics & Speed Index & Custom events cb http://flic.kr/p/aEHMU

AN ENGINEER'S GUIDE TO OPTIMIZATION 90% By Tony Gentilcore • Identify a scenario which optimizing will move the needle of a business metric • Measure the scenario • Calculate light speed • Approach the speed of light Source: http://goo.gl/B6ePS2 cbn http://flic.kr/p/bF1gCw
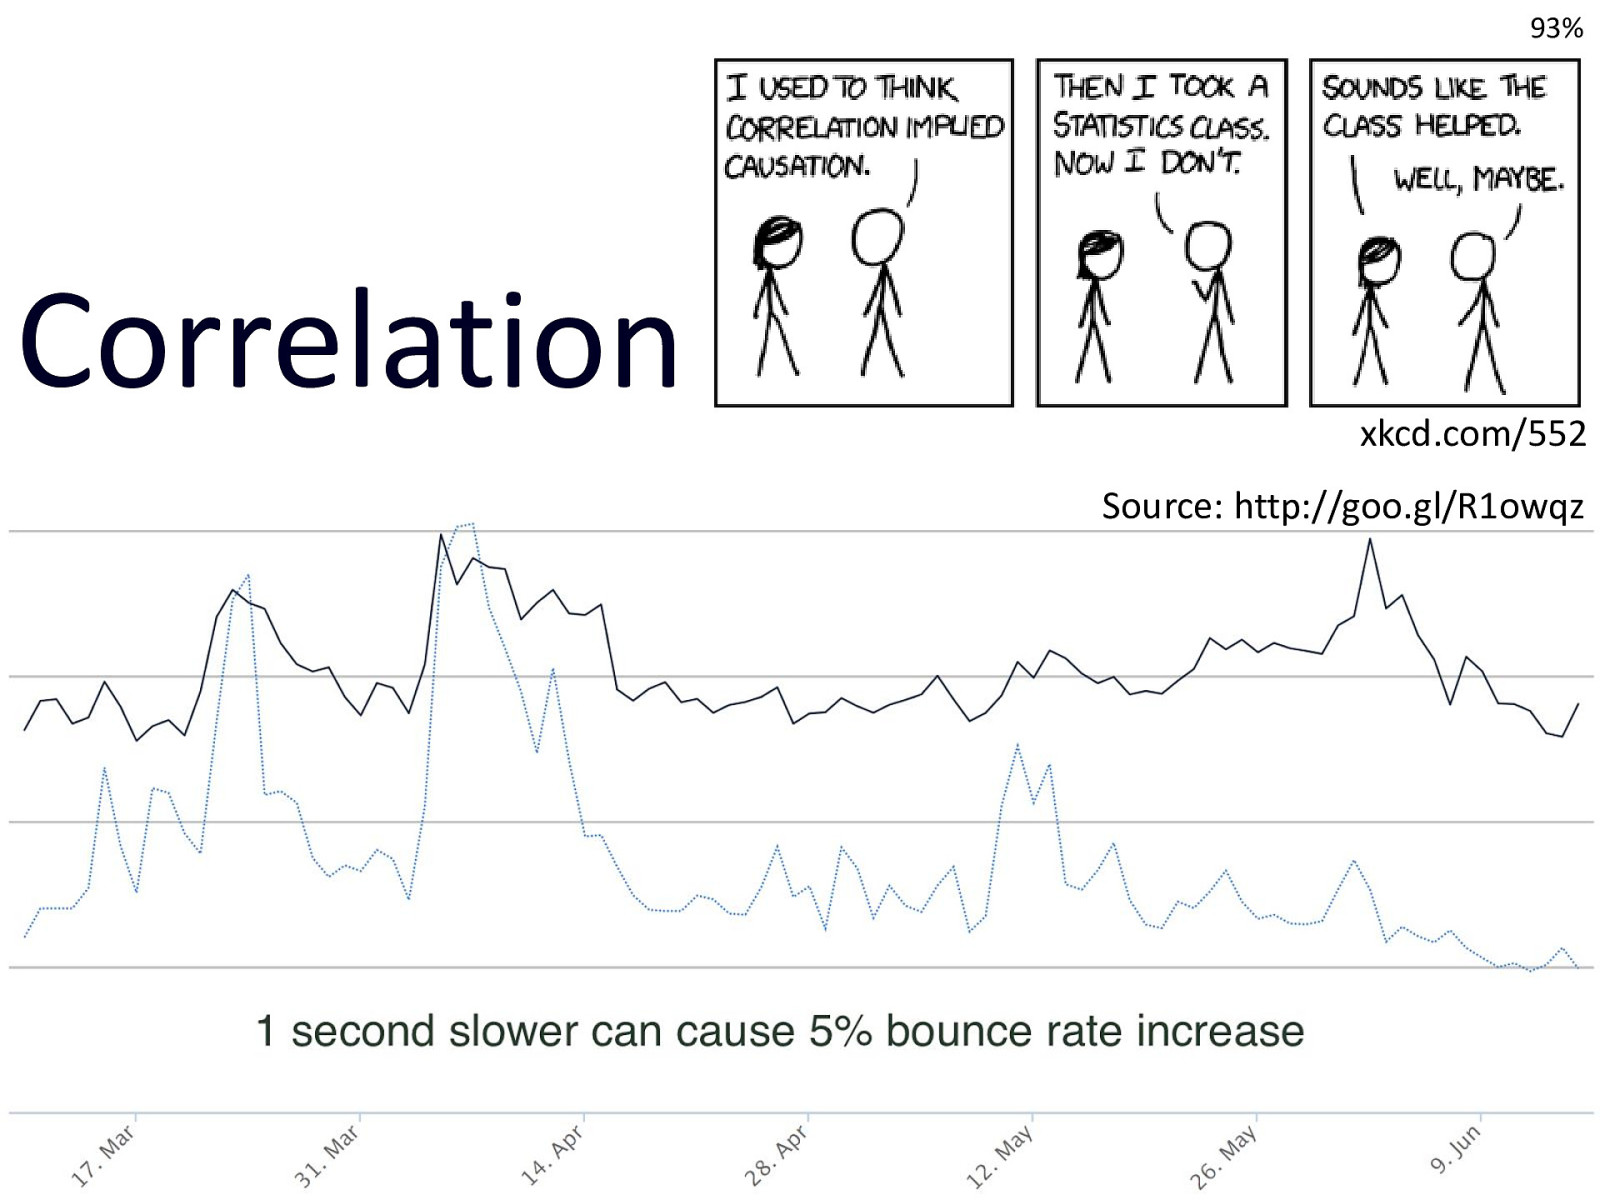
93% Correlation xkcd.com/552 Source: http://goo.gl/R1owqz

In the future… 96% Analyzing & improving cbnd http://flic.kr/p/fC19xo

100% Riddles? now or on twitter @cowchimp cbndhttp://flic.kr/p/kVkLHU