INTRO TO USER EXPERIENCE Daeng Muhammad Feisal @daengdoang

A presentation at #NgobrolUX 1 - Ilmu Komputer UPI, Bandung in October 2018 in Bandung, Bandung City, West Java, Indonesia by Daeng Muhammad Feisal
INTRO TO USER EXPERIENCE Daeng Muhammad Feisal @daengdoang
What is UX?


What is UX?
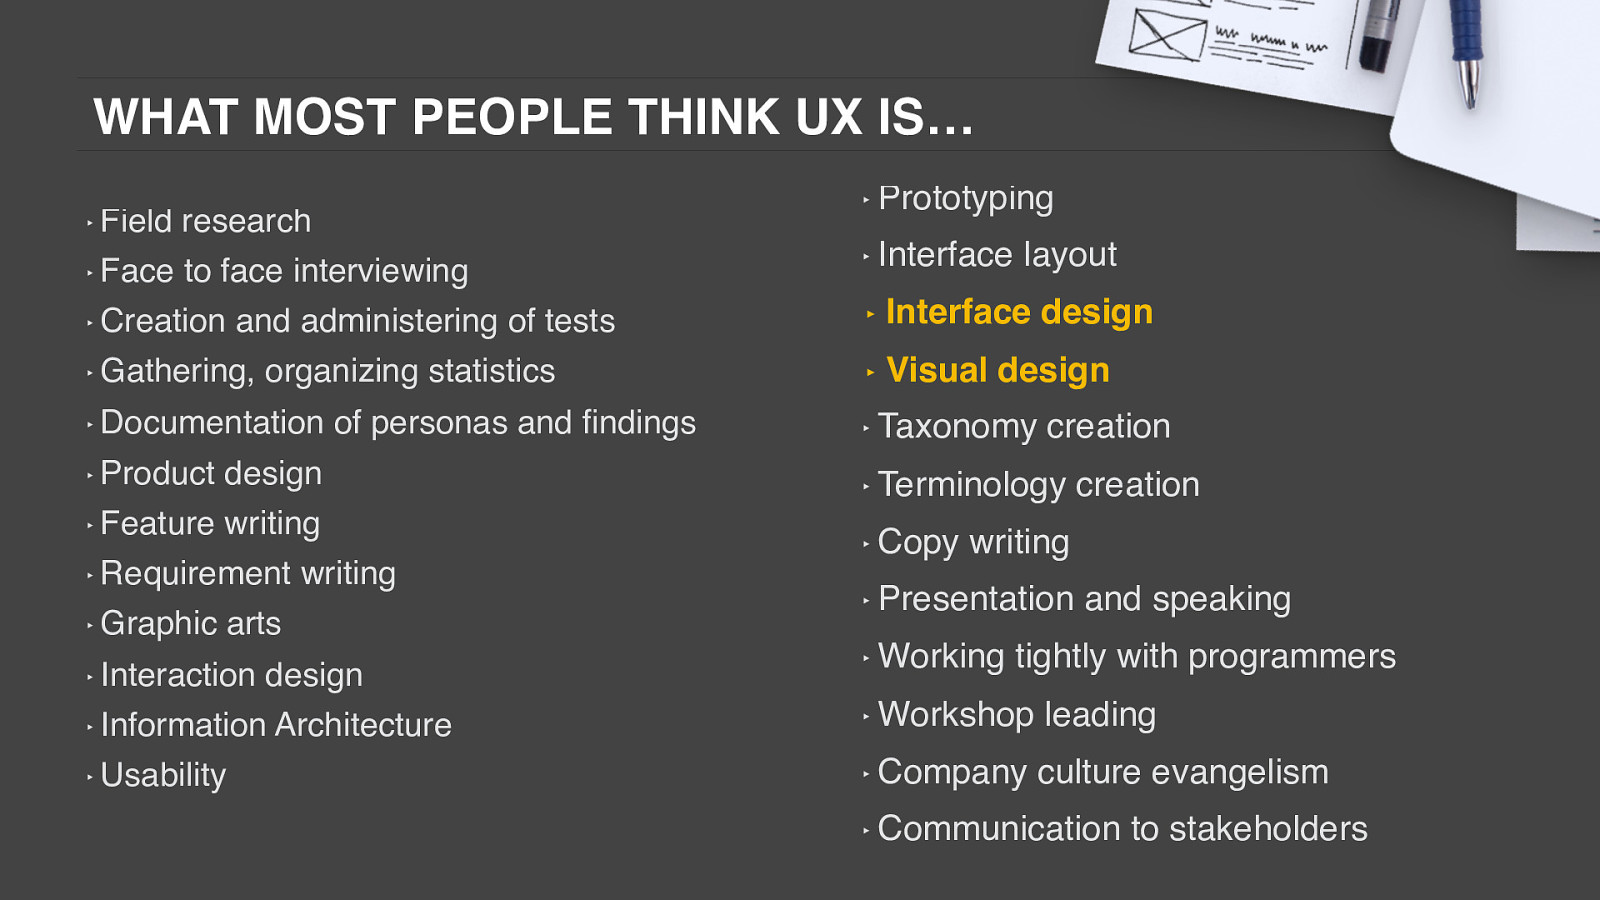
WHAT MOST PEOPLE THINK UX IS… ‣ Field research ‣ Face to face interviewing ‣ Creation and administering of tests ‣ Gathering, organizing statistics ‣ Documentation of personas and findings ‣ Product design ‣ Feature writing ‣ Requirement writing ‣ Graphic arts ‣ Interaction design ‣ Information Architecture ‣ Usability ‣ Prototyping ‣ Interface layout ‣ Interface ‣ Visual design design ‣ Taxonomy creation ‣ Terminology ‣ Copy creation writing ‣ Presentation ‣ Working and speaking tightly with programmers ‣ Workshop leading ‣ Company culture evangelism ‣ Communication to stakeholders
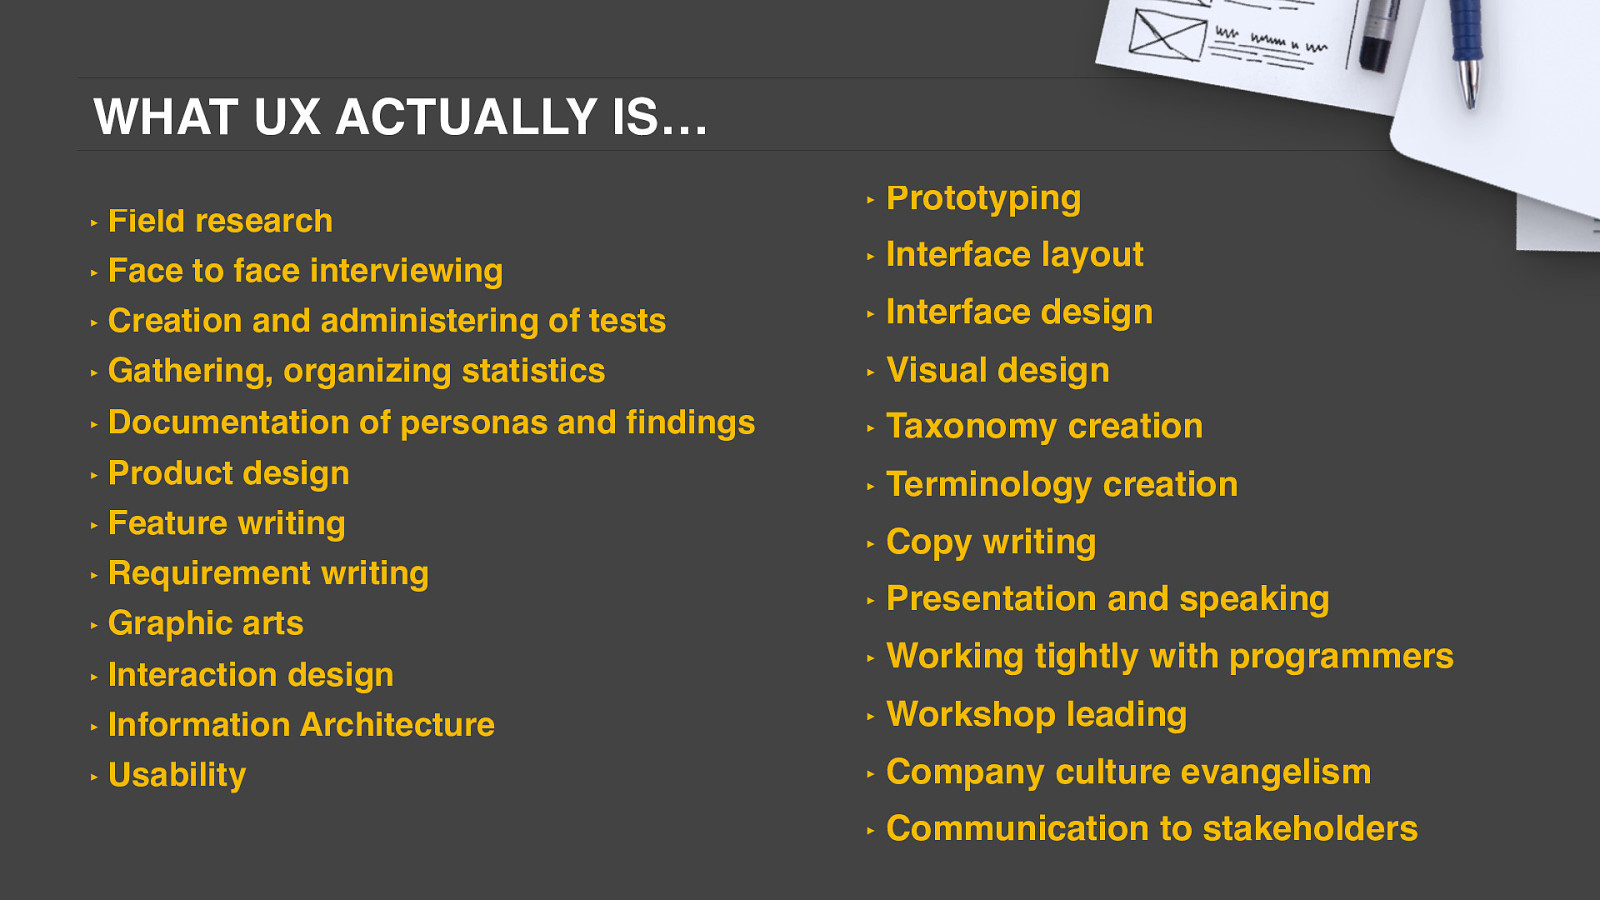
WHAT UX ACTUALLY IS… ‣ Field research ‣ Face to face interviewing ‣ Creation and administering of tests ‣ Gathering, organizing statistics ‣ Documentation of personas and findings ‣ Product design ‣ Feature writing ‣ Requirement writing ‣ Graphic arts ‣ Interaction design ‣ Information Architecture ‣ Usability ‣ Prototyping ‣ Interface layout ‣ Interface design ‣ Visual design ‣ Taxonomy creation ‣ Terminology ‣ Copy creation writing ‣ Presentation ‣ Working and speaking tightly with programmers ‣ Workshop ‣ Company leading culture evangelism ‣ Communication to stakeholders
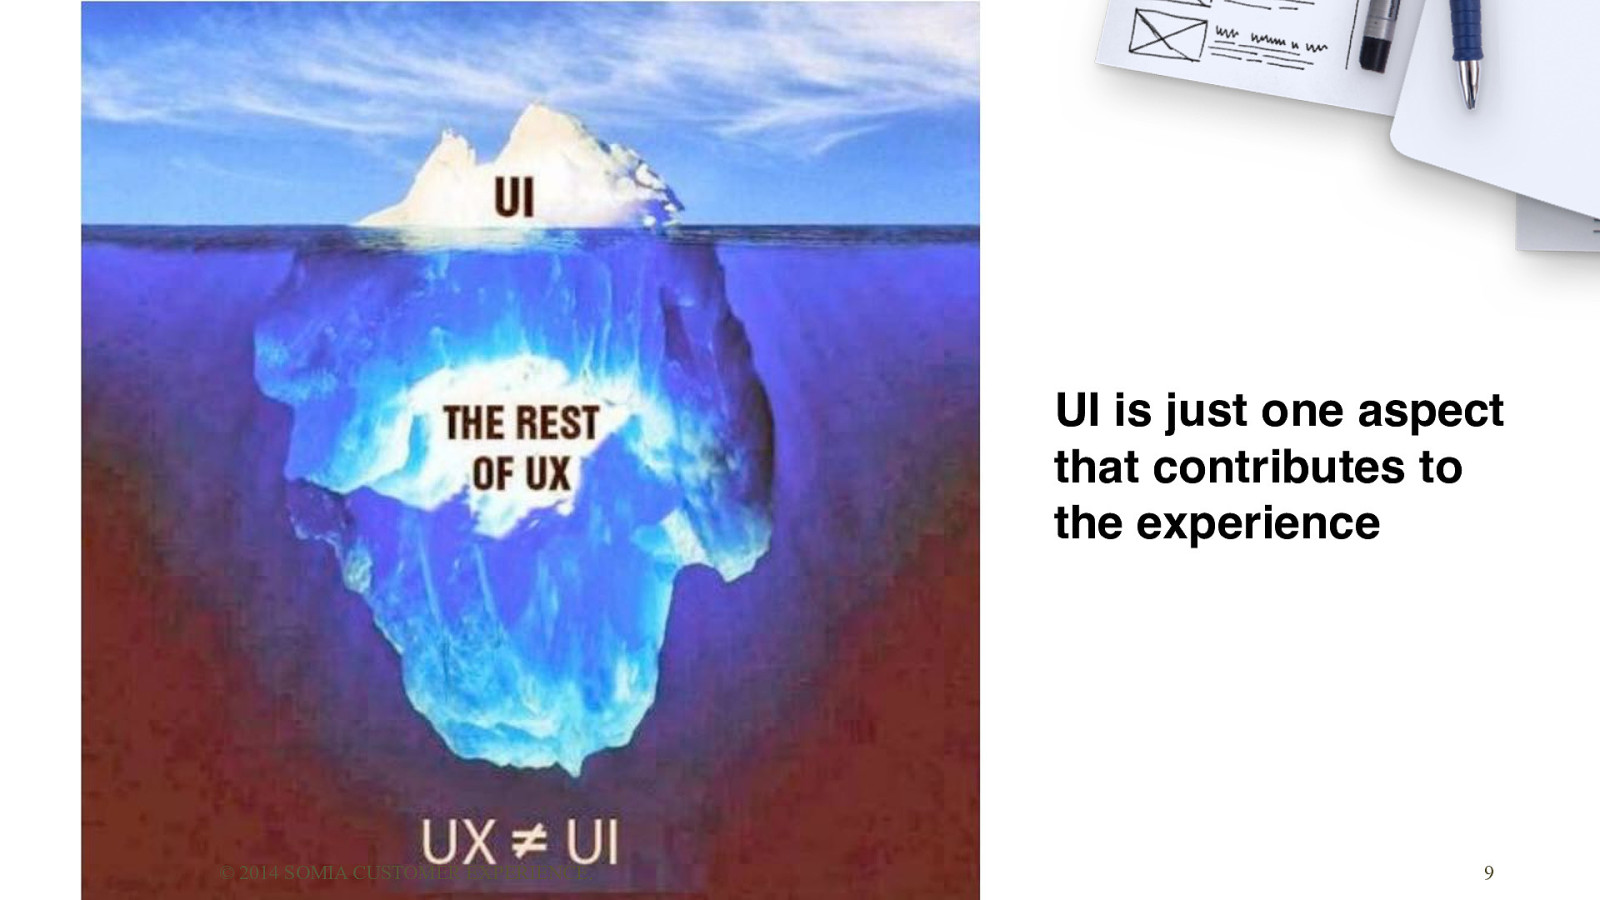
UI is just one aspect that contributes to the experience © 2014 SOMIA CUSTOMER EXPERIENCE. 9
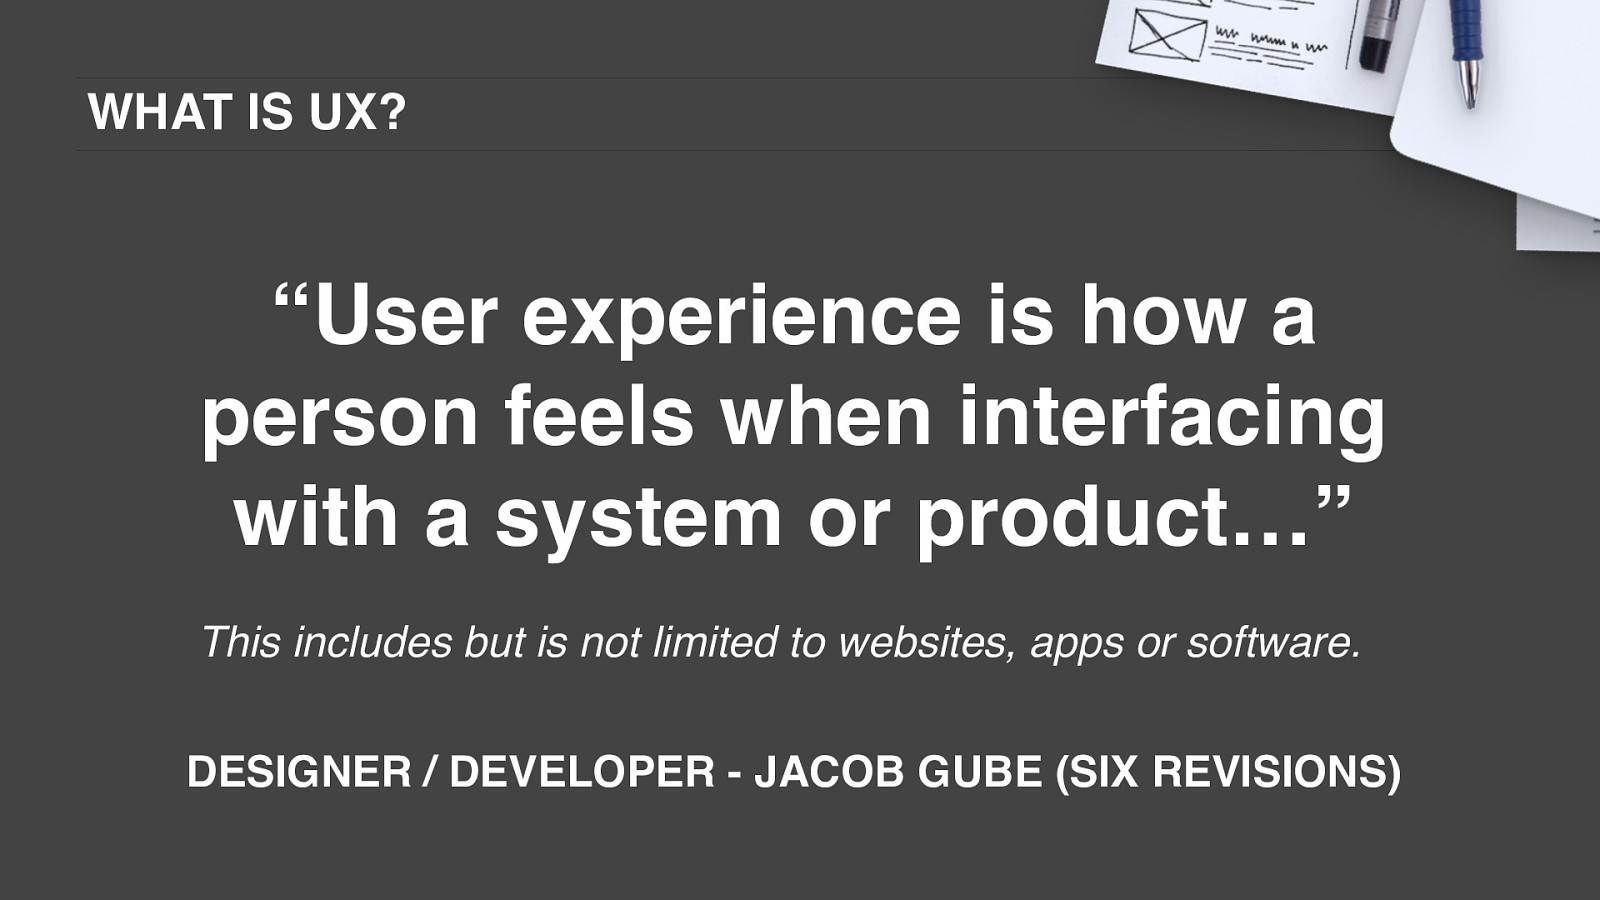
WHAT IS UX? “User experience is how a person feels when interfacing with a system or product…” This includes but is not limited to websites, apps or software. DESIGNER / DEVELOPER - JACOB GUBE (SIX REVISIONS)
WHAT IS UX? “the design of anything independent of medium or across [device] with human experience as an explicit outcome and human engagement as an explicit goal… ” UX LEGEND - JESSE JAMES GARRETT
WHAT IS UX? Everything experienced by the users of a design or service

© 2014 SOMIA CUSTOMER EXPERIENCE.
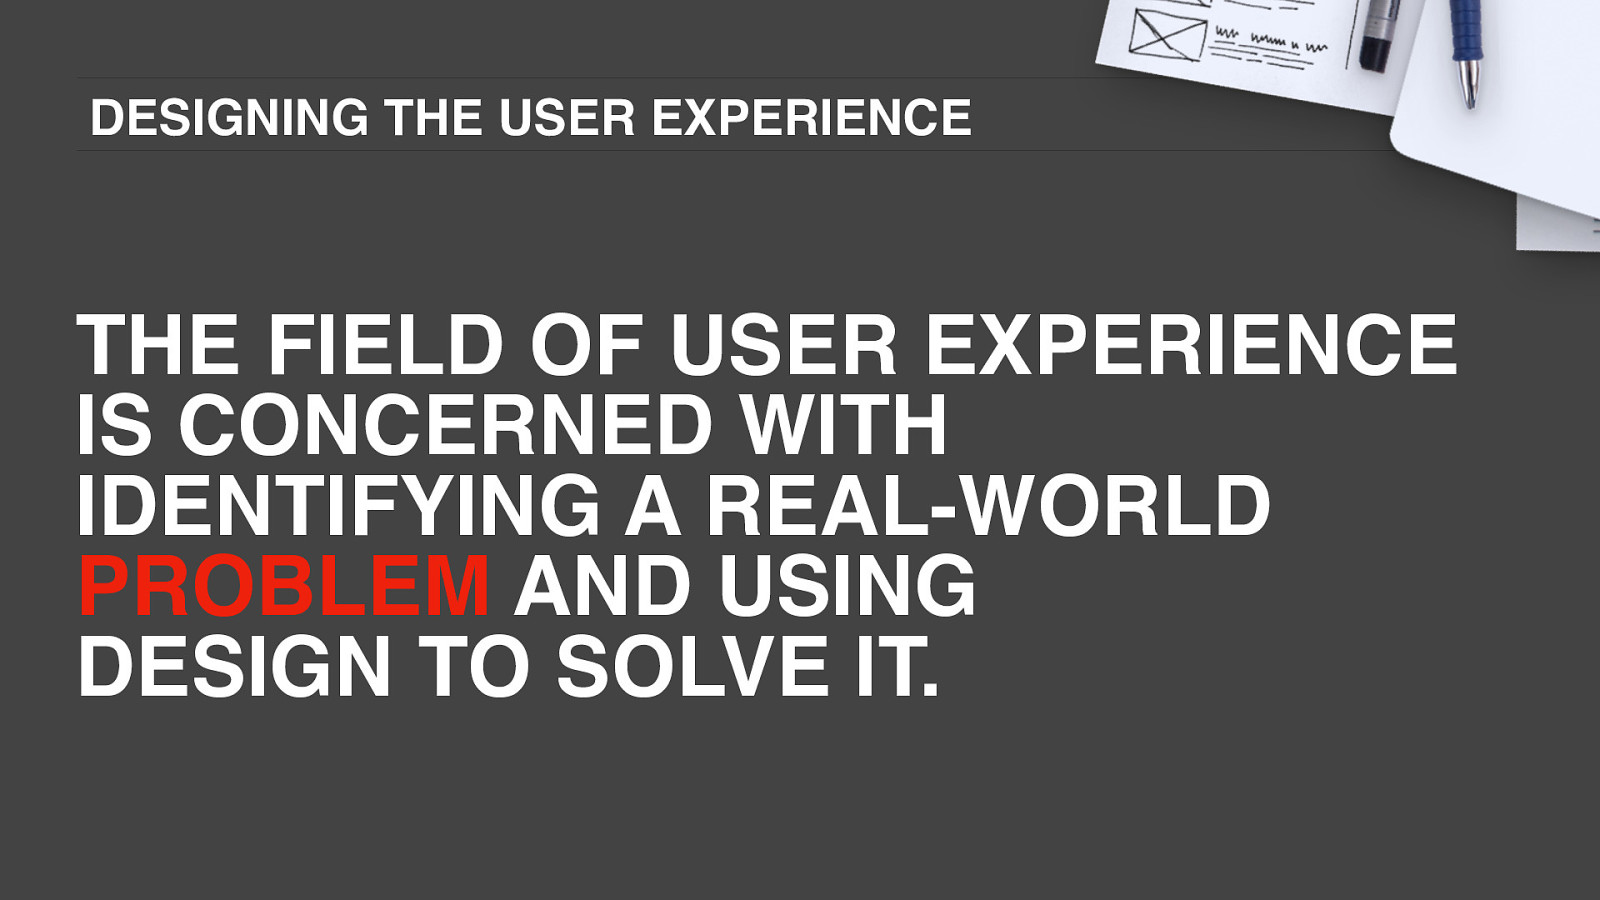
DESIGNING THE USER EXPERIENCE THE FIELD OF USER EXPERIENCE IS CONCERNED WITH IDENTIFYING A REAL-WORLD PROBLEM AND USING DESIGN TO SOLVE IT.
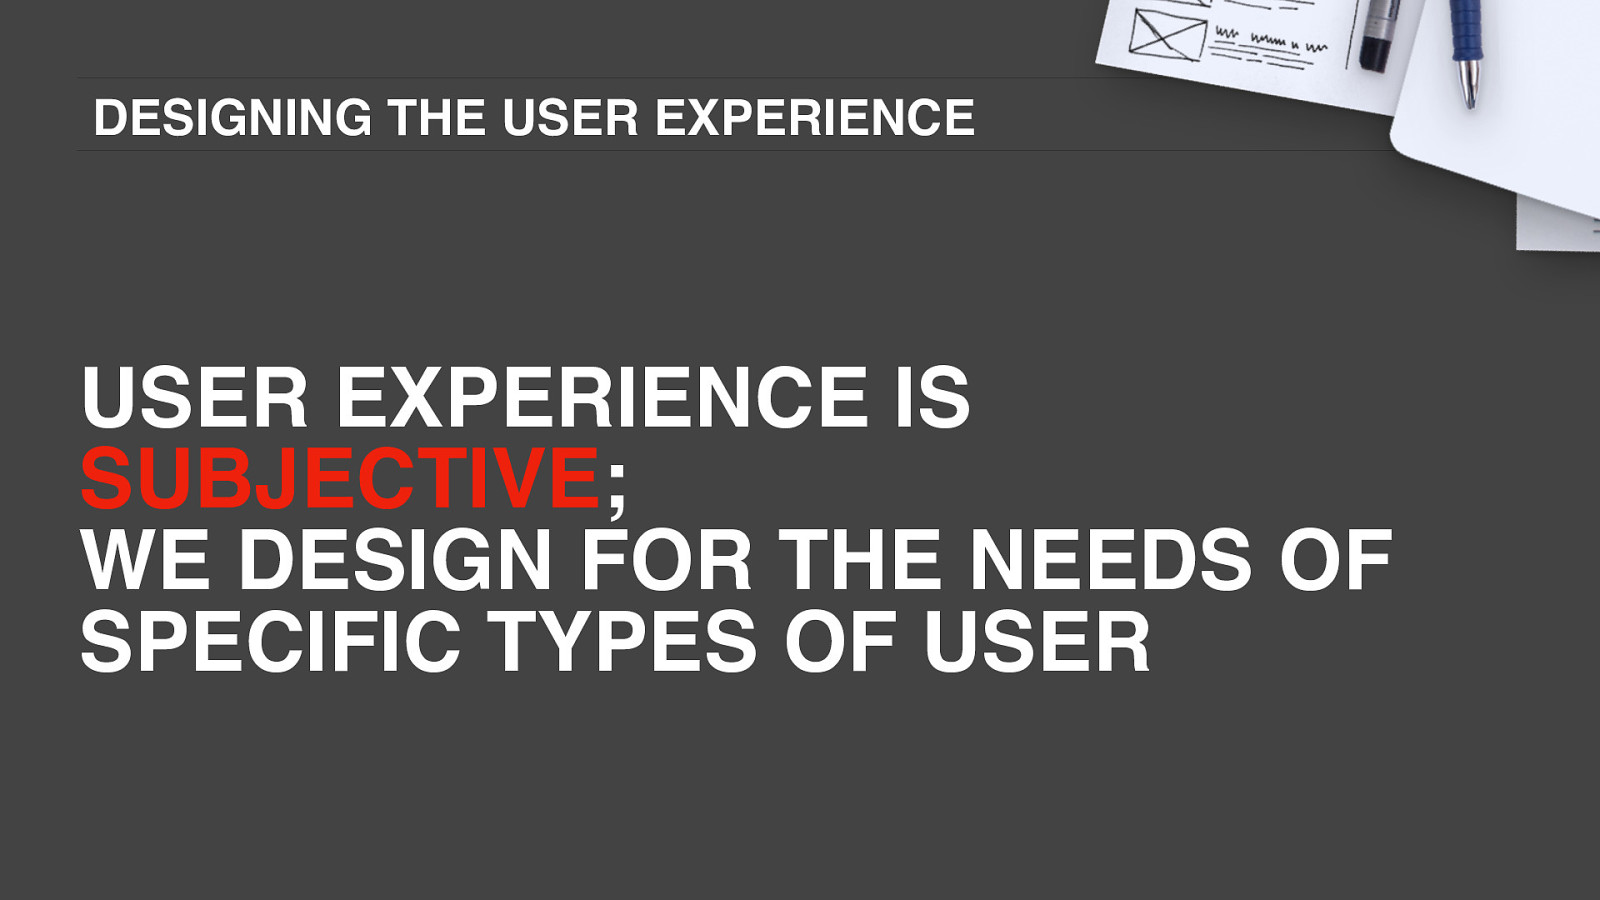
DESIGNING THE USER EXPERIENCE USER EXPERIENCE IS SUBJECTIVE; WE DESIGN FOR THE NEEDS OF SPECIFIC TYPES OF USER
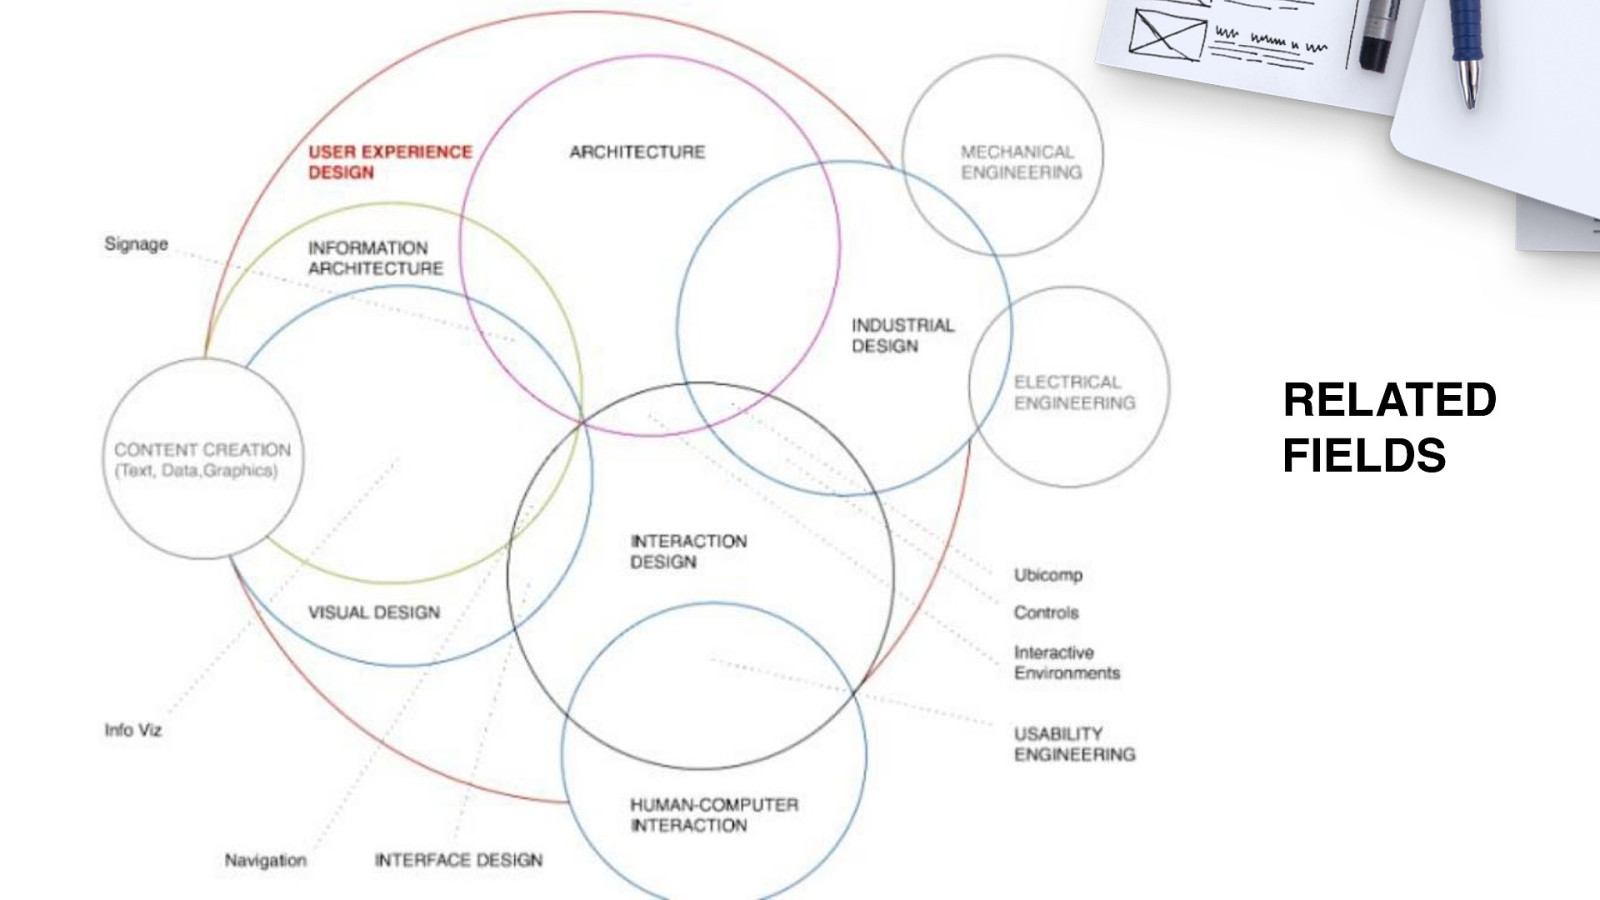
RELATED FIELDS
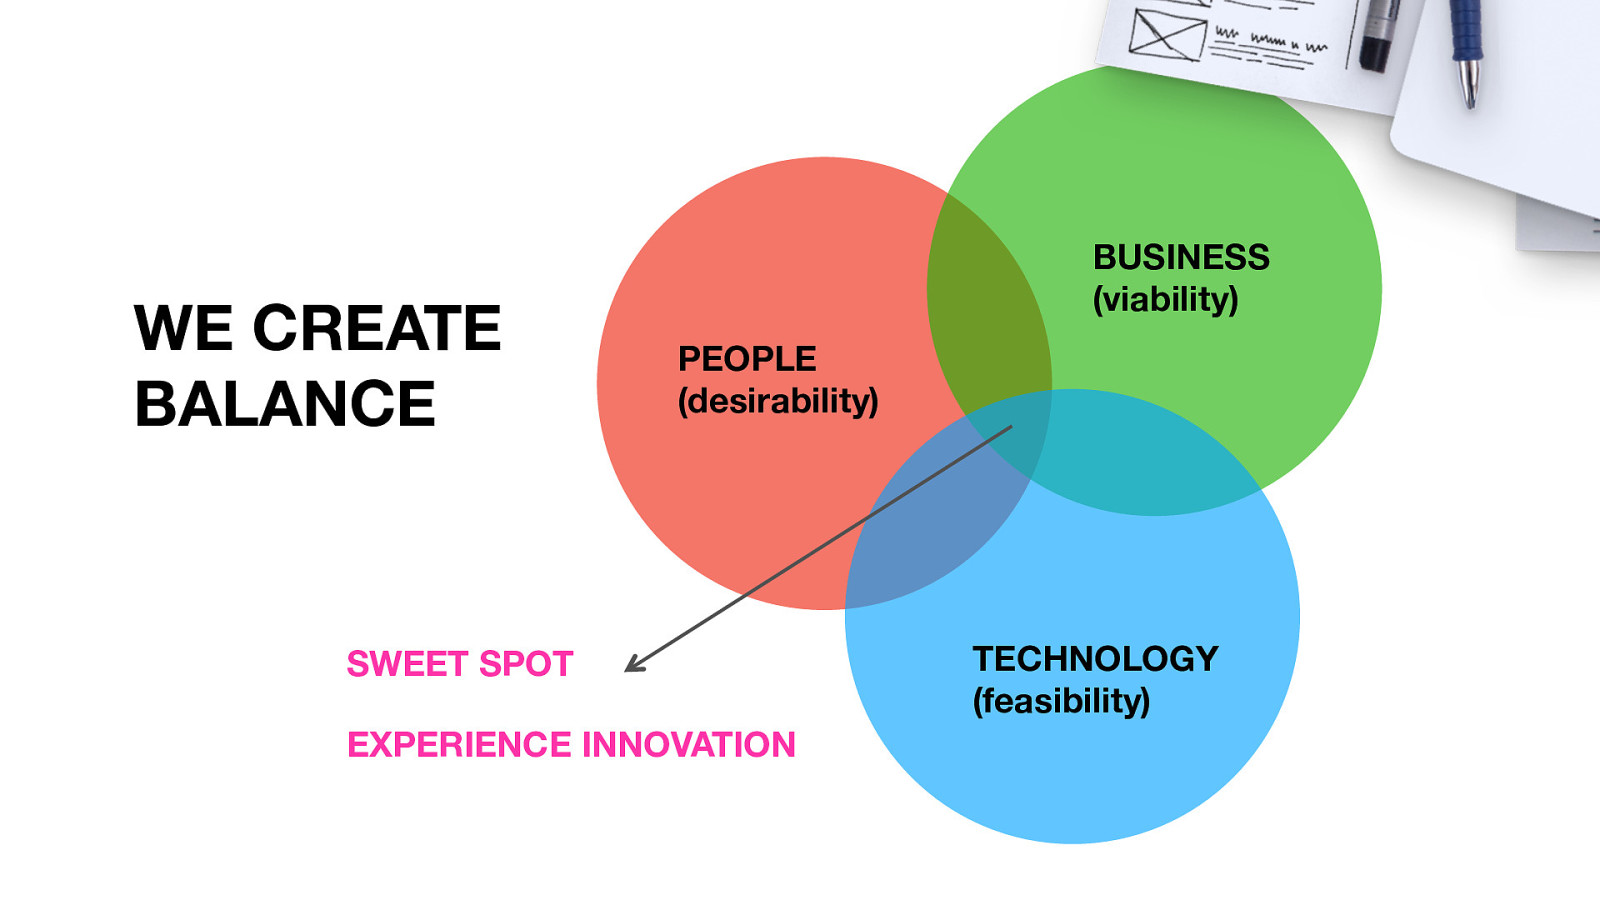
WE CREATE BALANCE BUSINESS (viability) PEOPLE (desirability) SWEET SPOT EXPERIENCE INNOVATION TECHNOLOGY (feasibility)
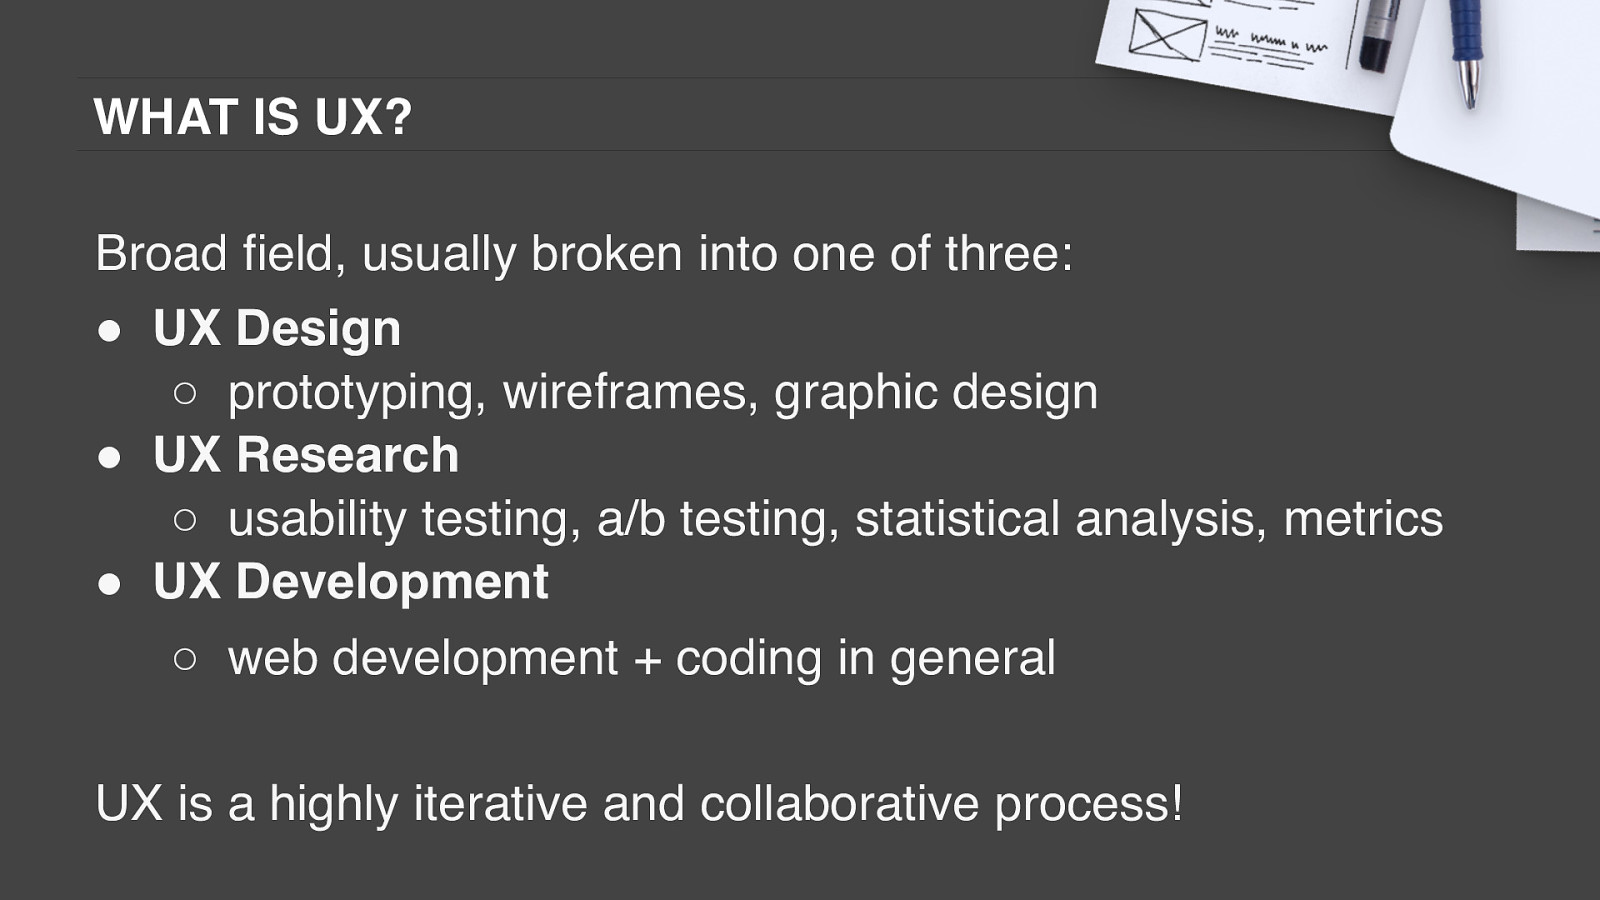
WHAT IS UX? Broad field, usually broken into one of three: ” UX Design ○ prototyping, wireframes, graphic design ” UX Research ○ usability testing, a/b testing, statistical analysis, metrics ” UX Development ○ web development + coding in general UX is a highly iterative and collaborative process!
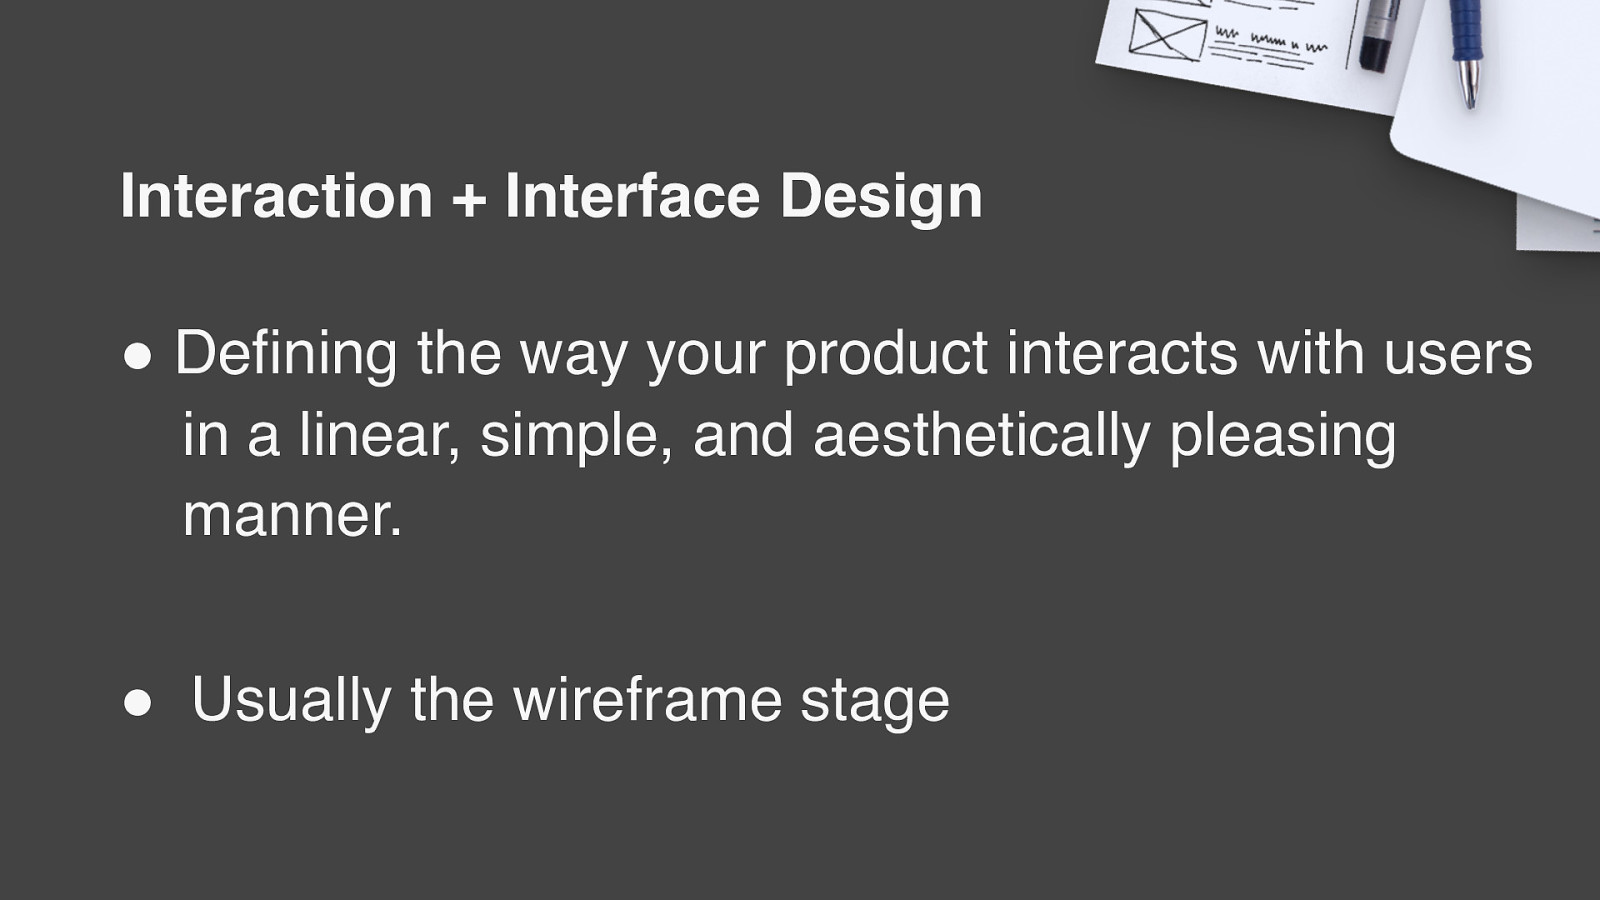
Interaction + Interface Design ” Defining the way your product interacts with users in a linear, simple, and aesthetically pleasing manner. ” Usually the wireframe stage
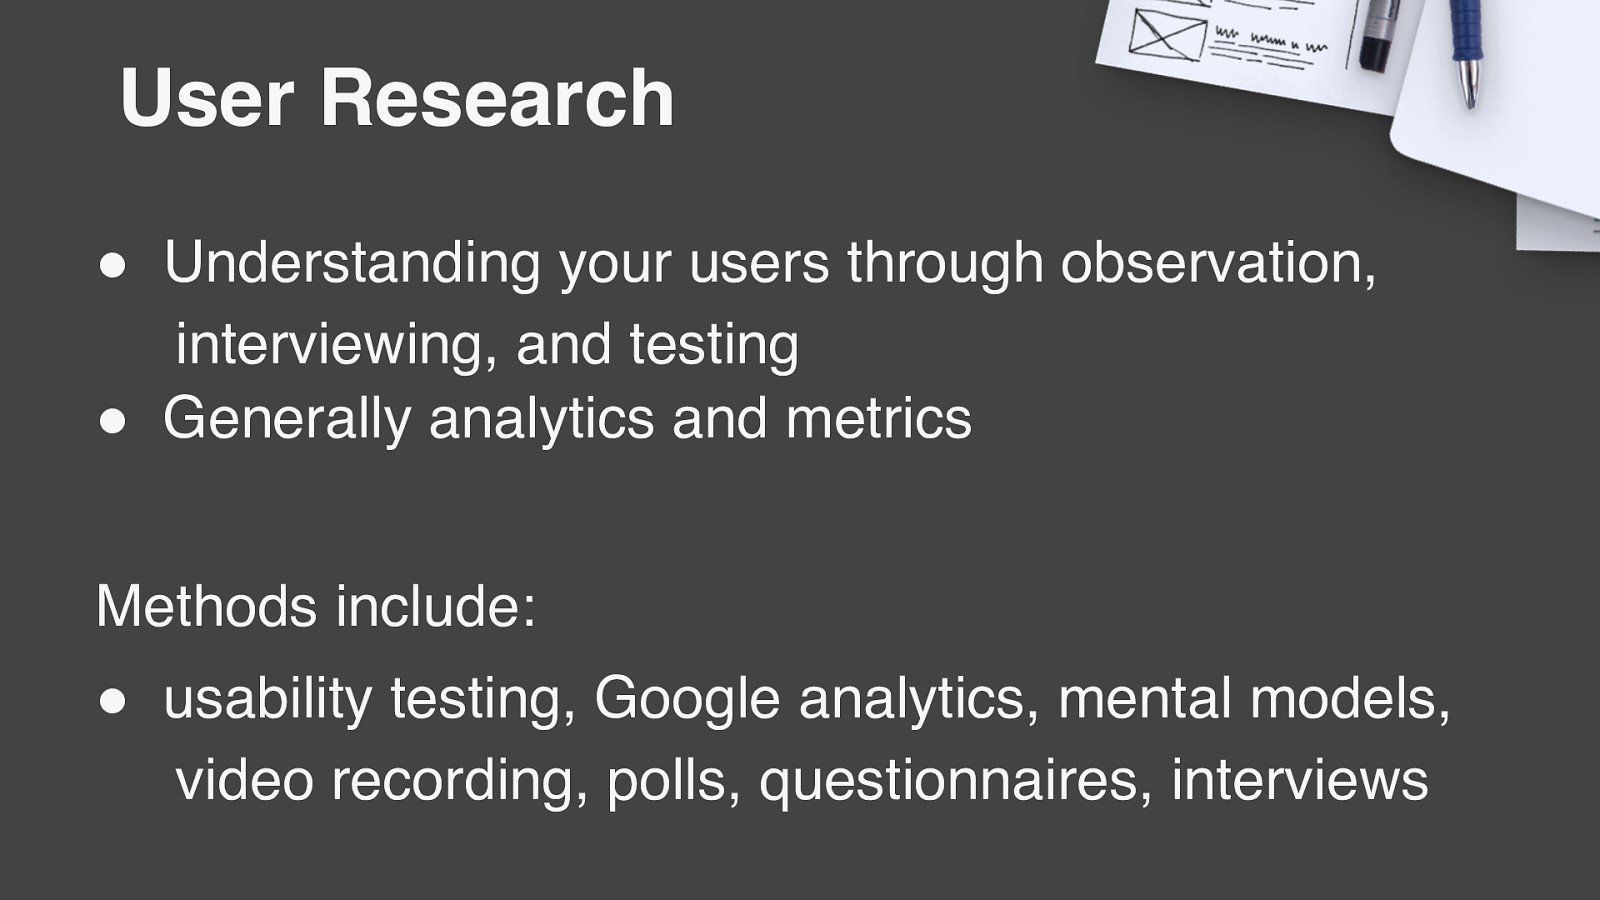
User Research ” Understanding your users through observation, interviewing, and testing ” Generally analytics and metrics Methods include: ” usability testing, Google analytics, mental models, video recording, polls, questionnaires, interviews
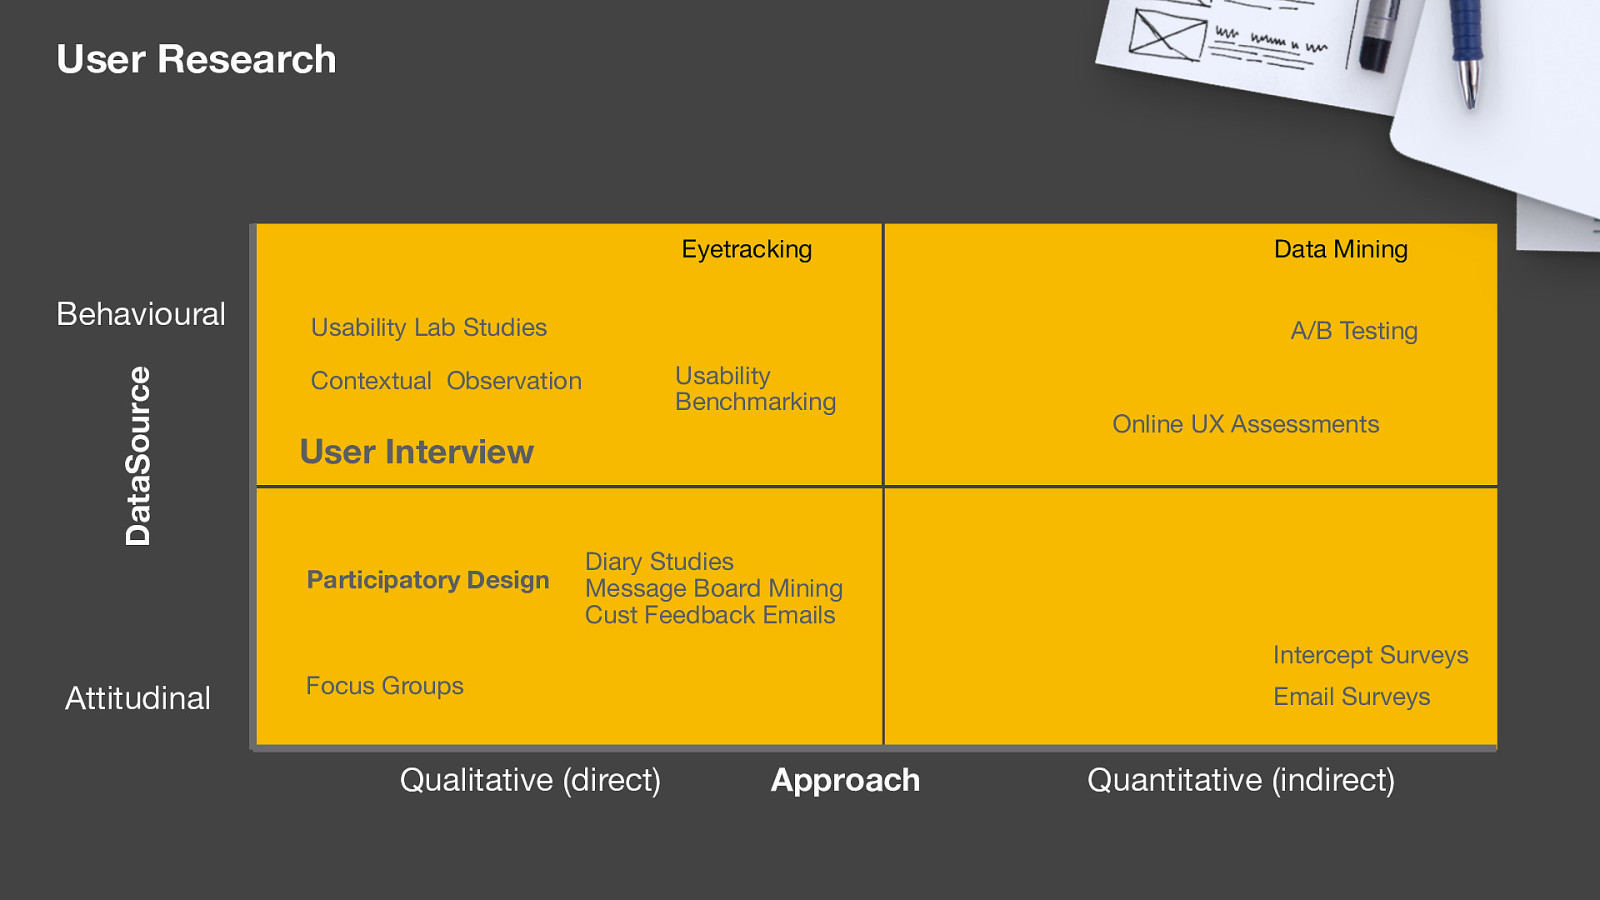
User Research Eyetracking DataSource Behavioural Usability Lab Studies A/B Testing Usability Benchmarking Contextual Observation User Interview Participatory Design Data Mining Online UX Assessments Diary Studies Message Board Mining Cust Feedback Emails Intercept Surveys Attitudinal Focus Groups Qualitative (direct) Email Surveys Approach Quantitative (indirect)
UX Development Coding up the design WHAT IS THE CHALLENGE HERE?
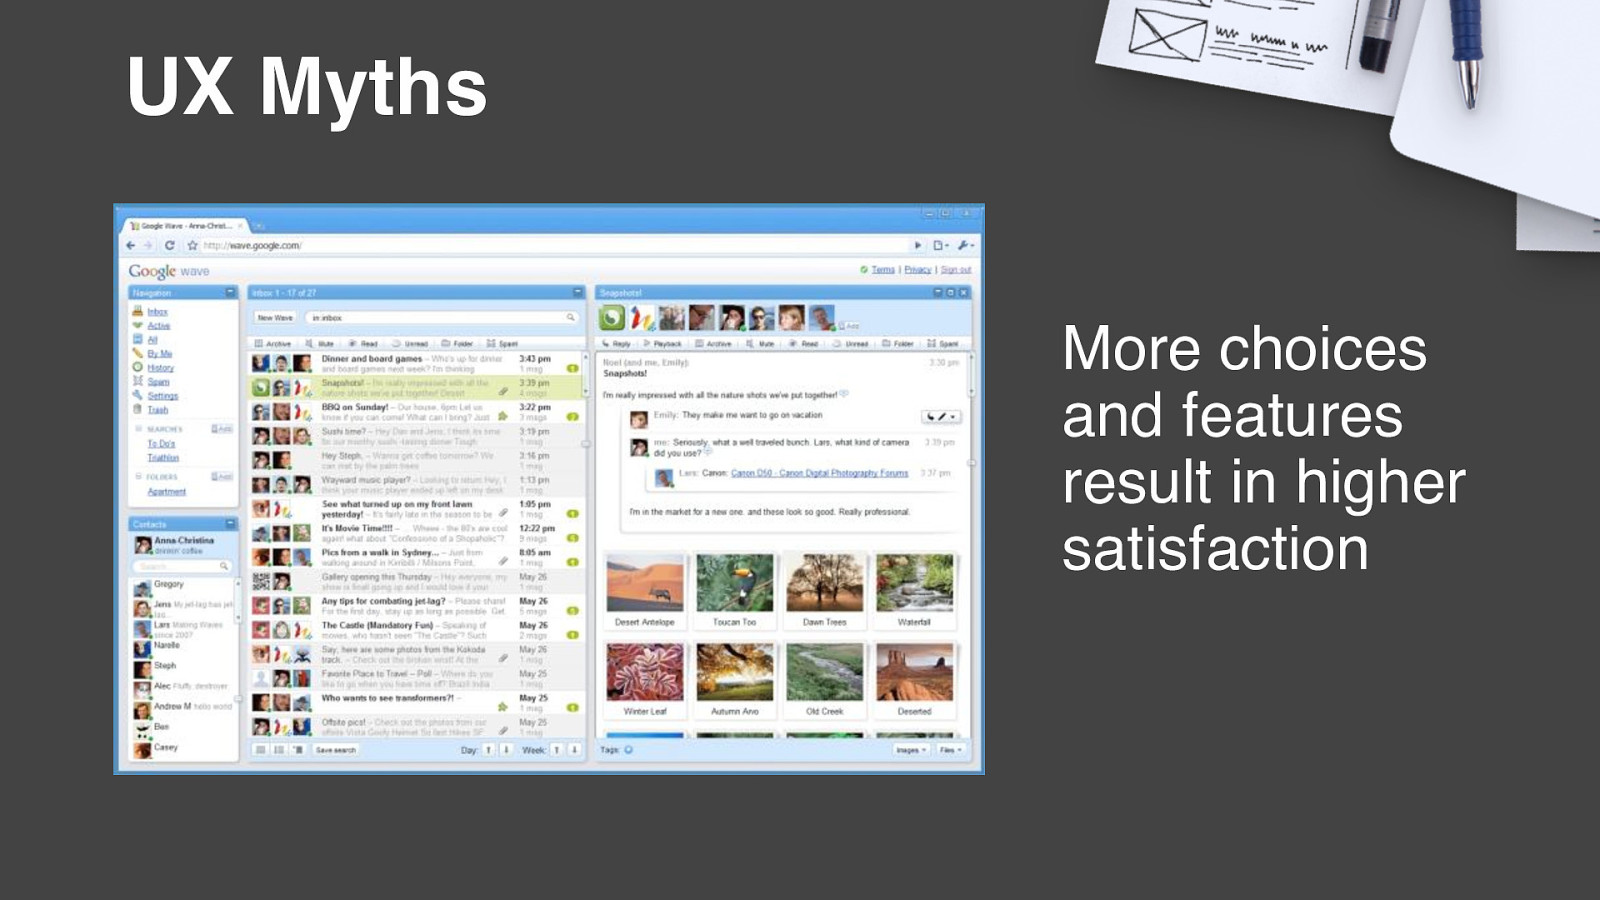
UX Myths More choices and features result in higher satisfaction
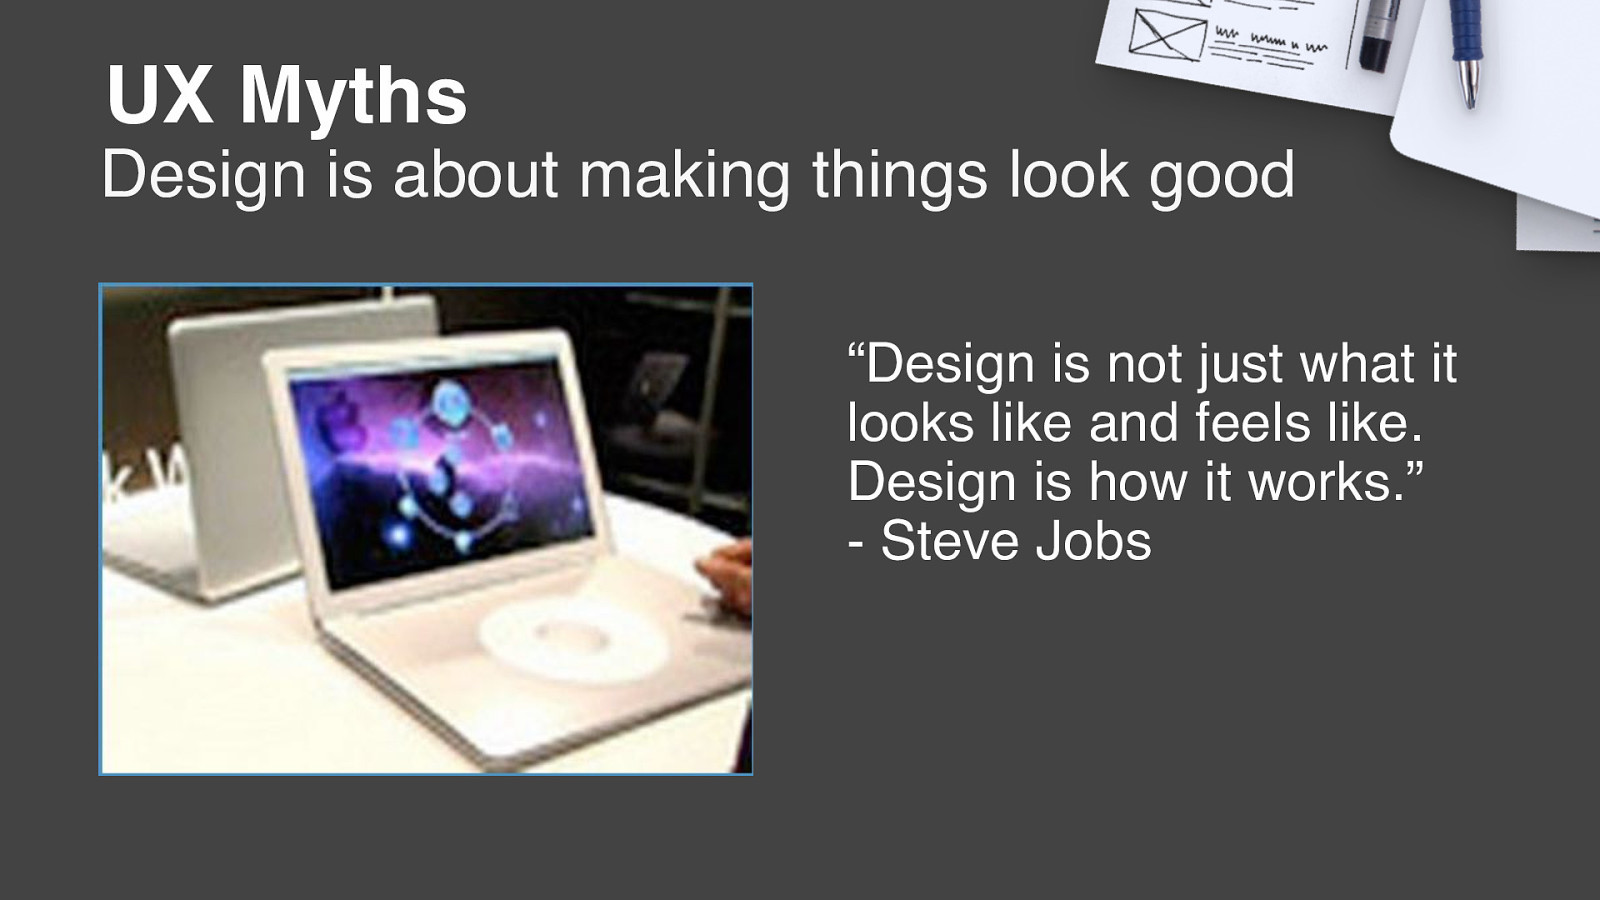
UX Myths Design is about making things look good “Design is not just what it looks like and feels like. Design is how it works.” - Steve Jobs
UX Myths Testing is for validating a final product, not discovering or prototyping
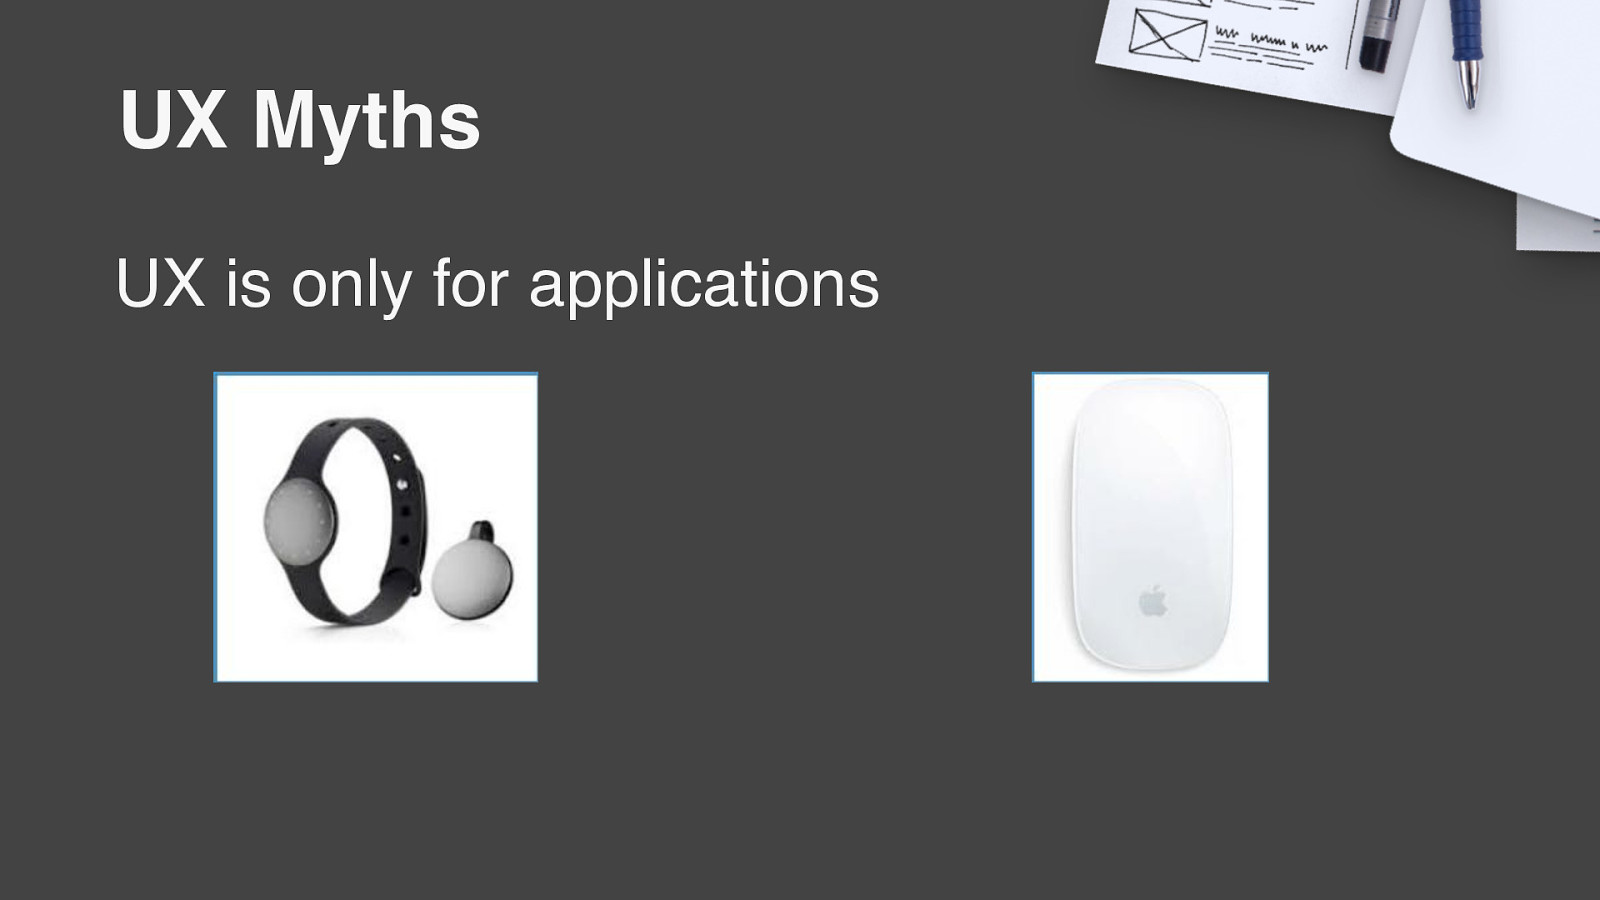
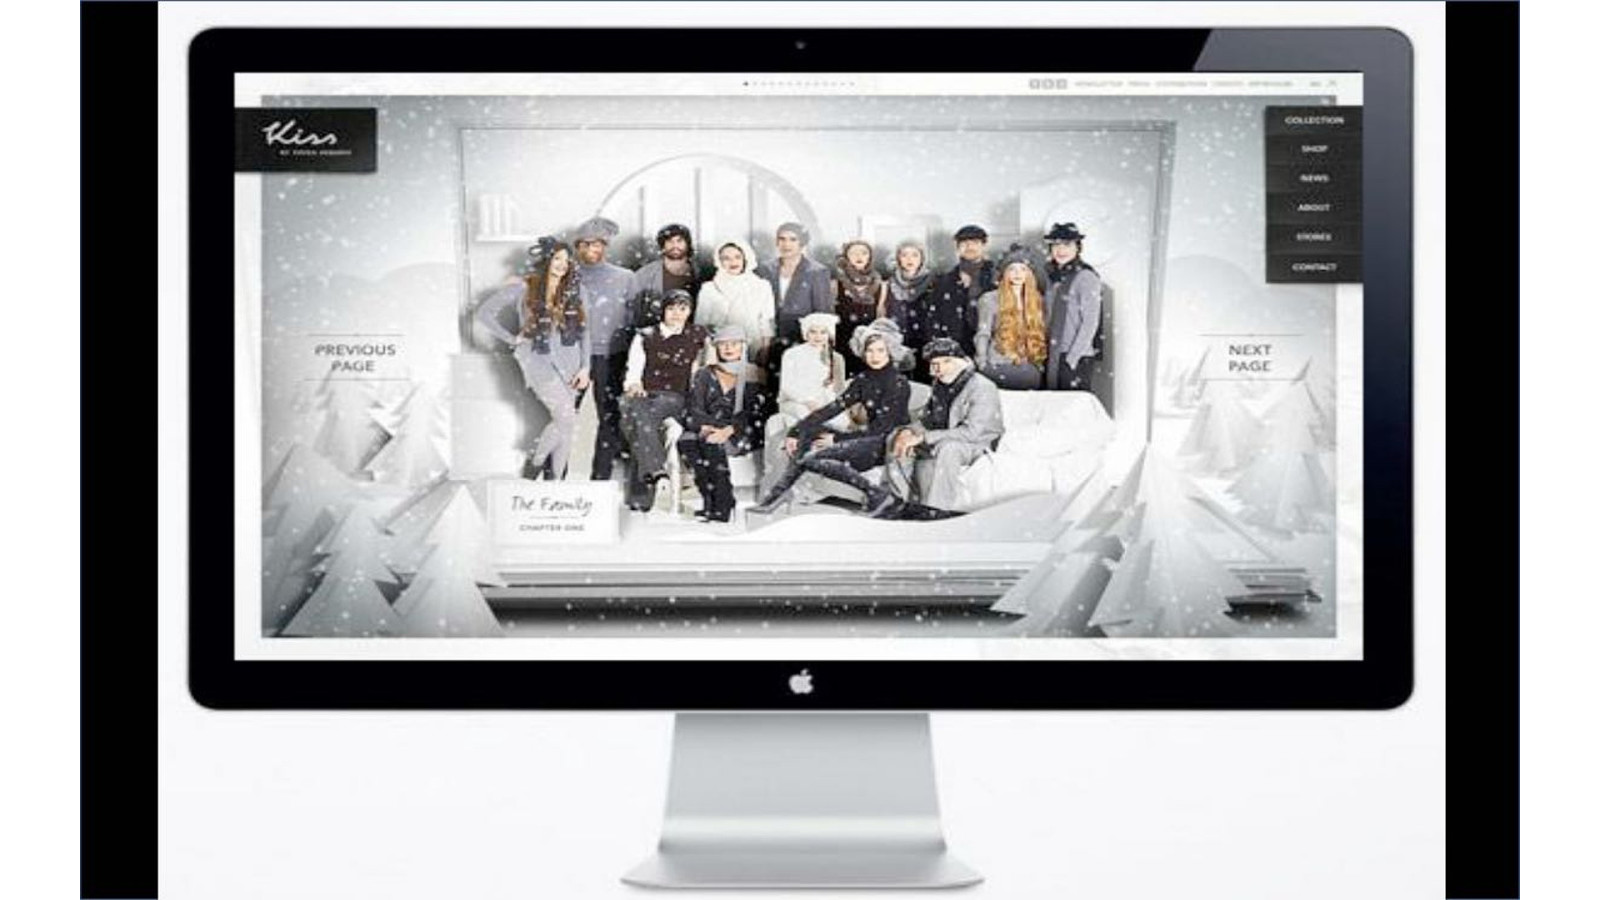
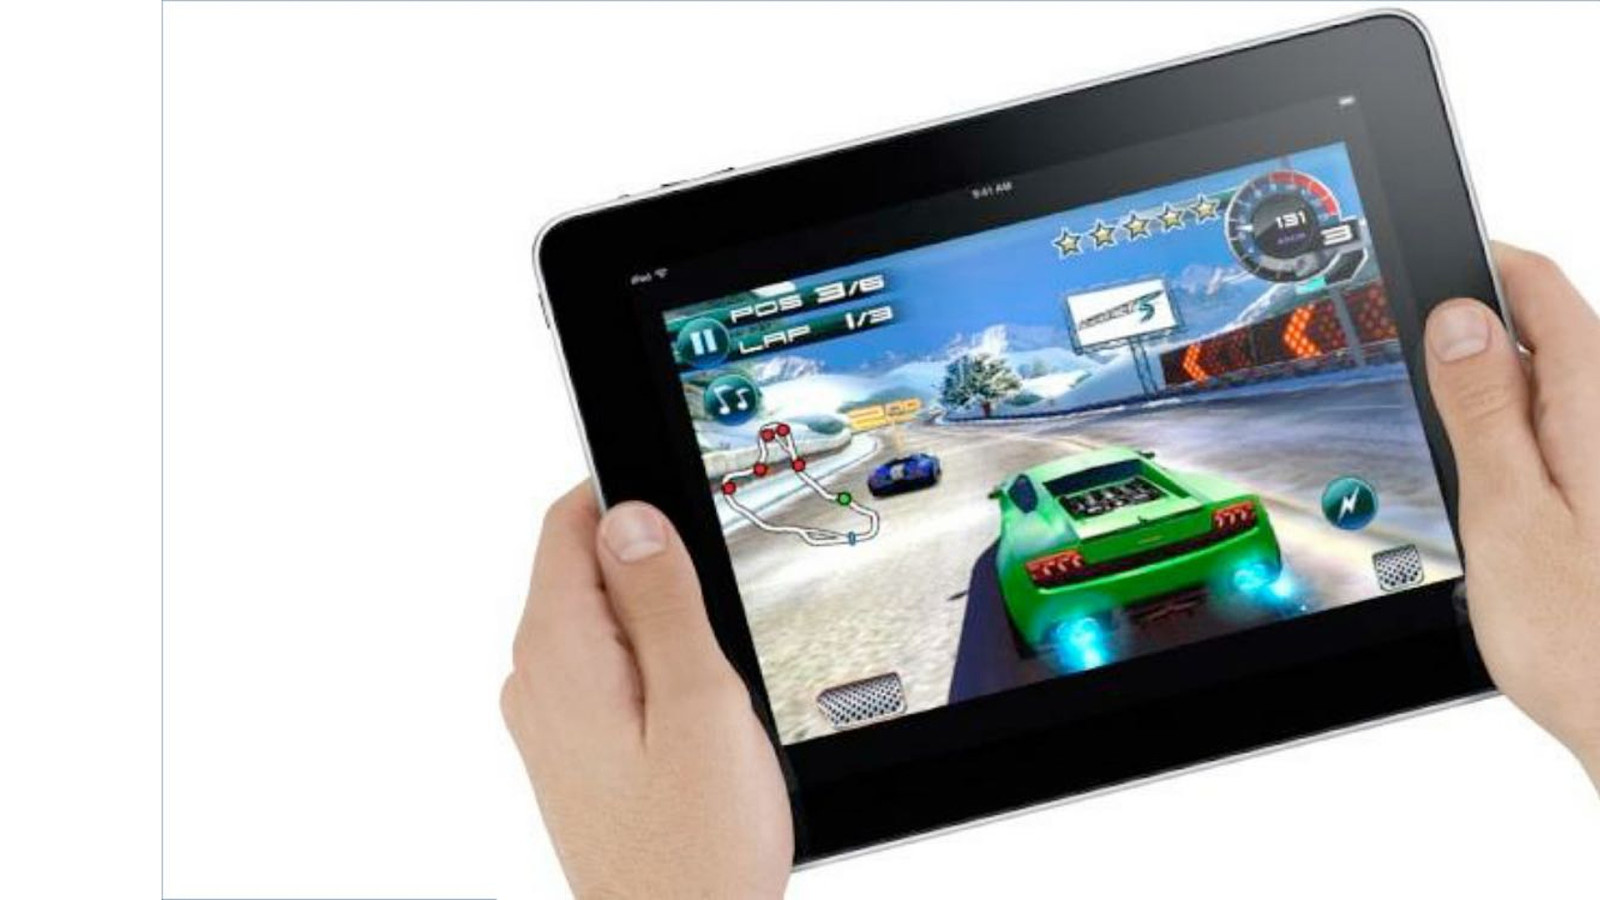
UX Myths UX is only for applications
“User-experience is not like usability - it is about feelings. The aim here is to create happiness.”

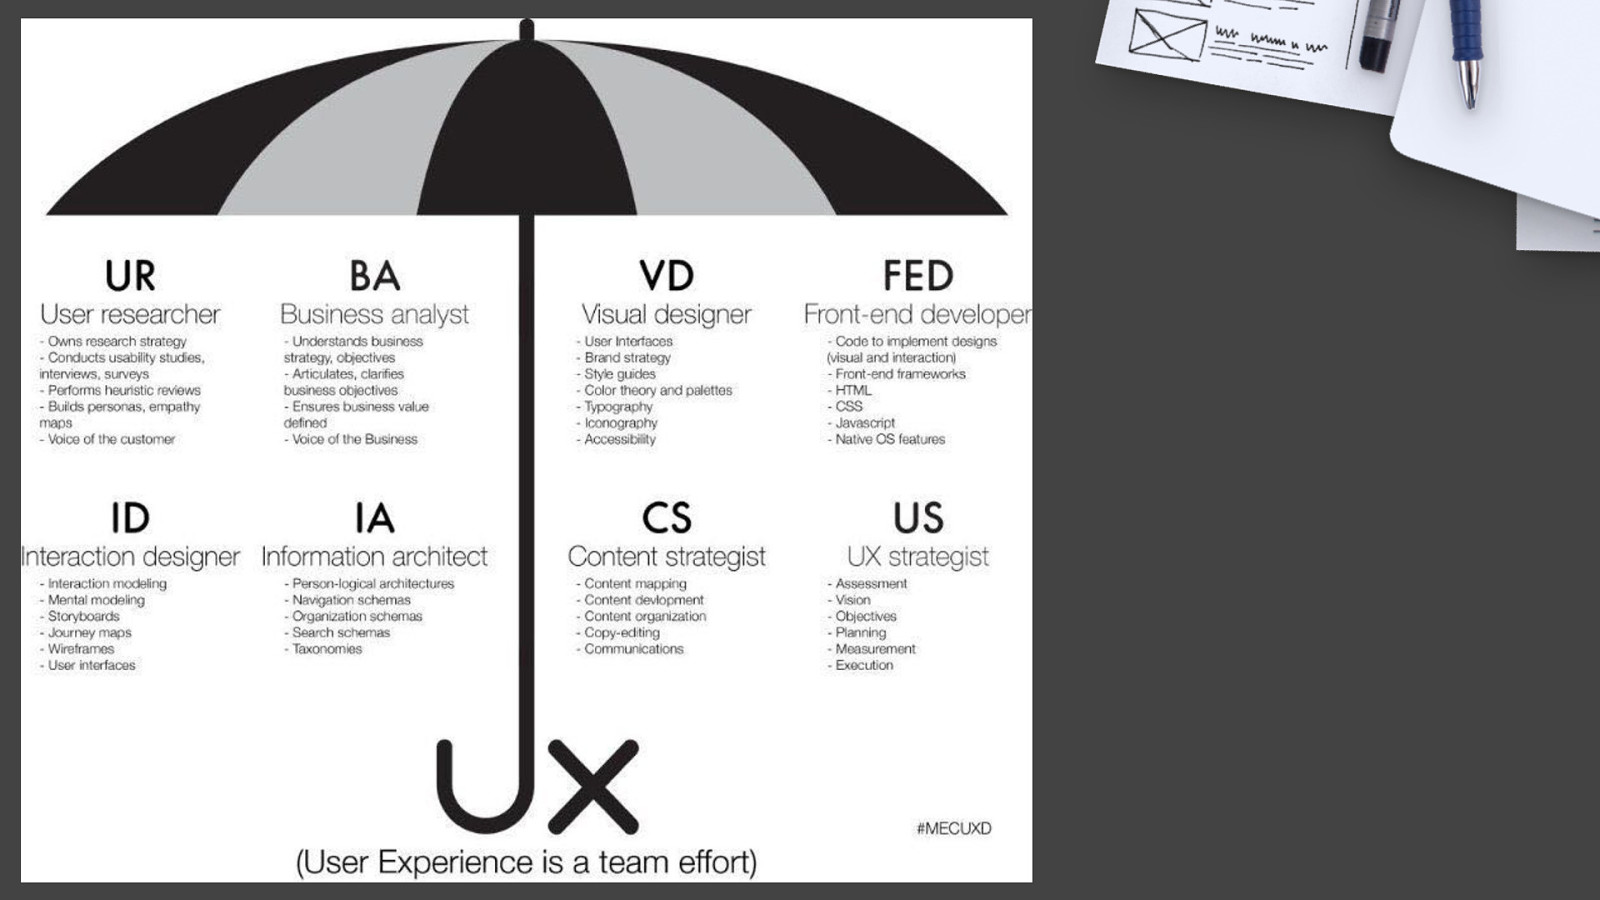
UX IS EVERYONE’S RESPONSIBILITY “A customer’s experience is affected by the whole story: brand, campaigns, literature, websites, store design, package design, out-of-box experience, product visual design, interaction design, support, user community, disposal / replacement. It’s absurd to think that one person can design all of this. UX is everyone’s job, from the copywriter perfecting his headlines so that the site speaks to the right audience, to the developer honing her code so that the app performs a touch faster. “
UX PROCESS
UX PROCESSES PROCESS AND THINKING ‣ In solving user experience problems, we place the user at the center of our thinking ‣ UX design requires process, not just tools ‣ Process is not one size fits all
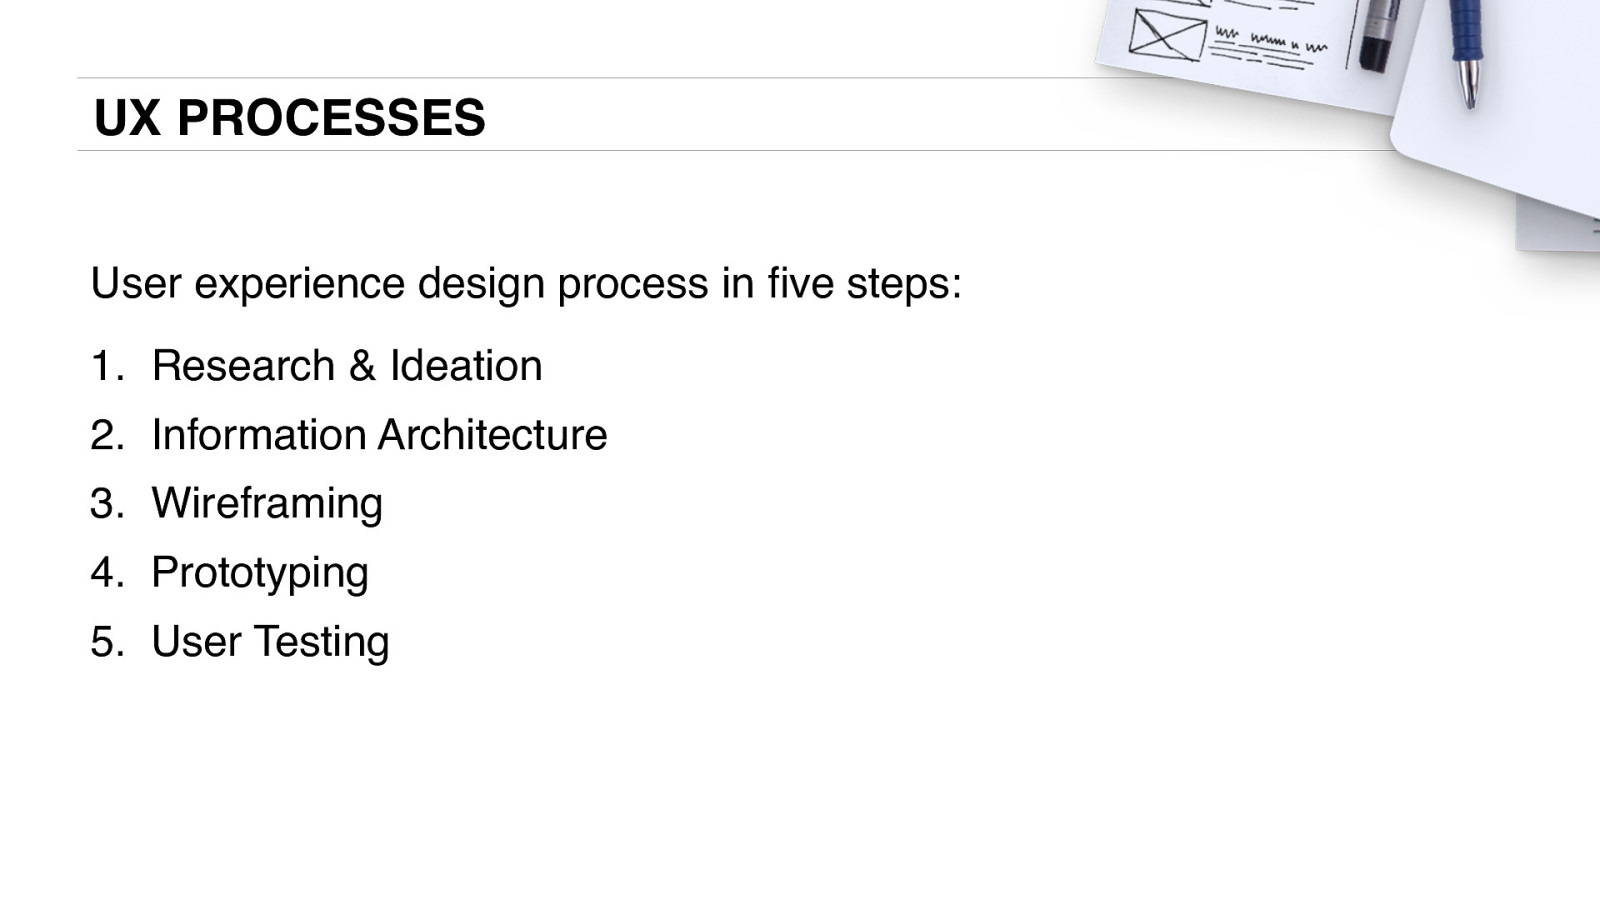
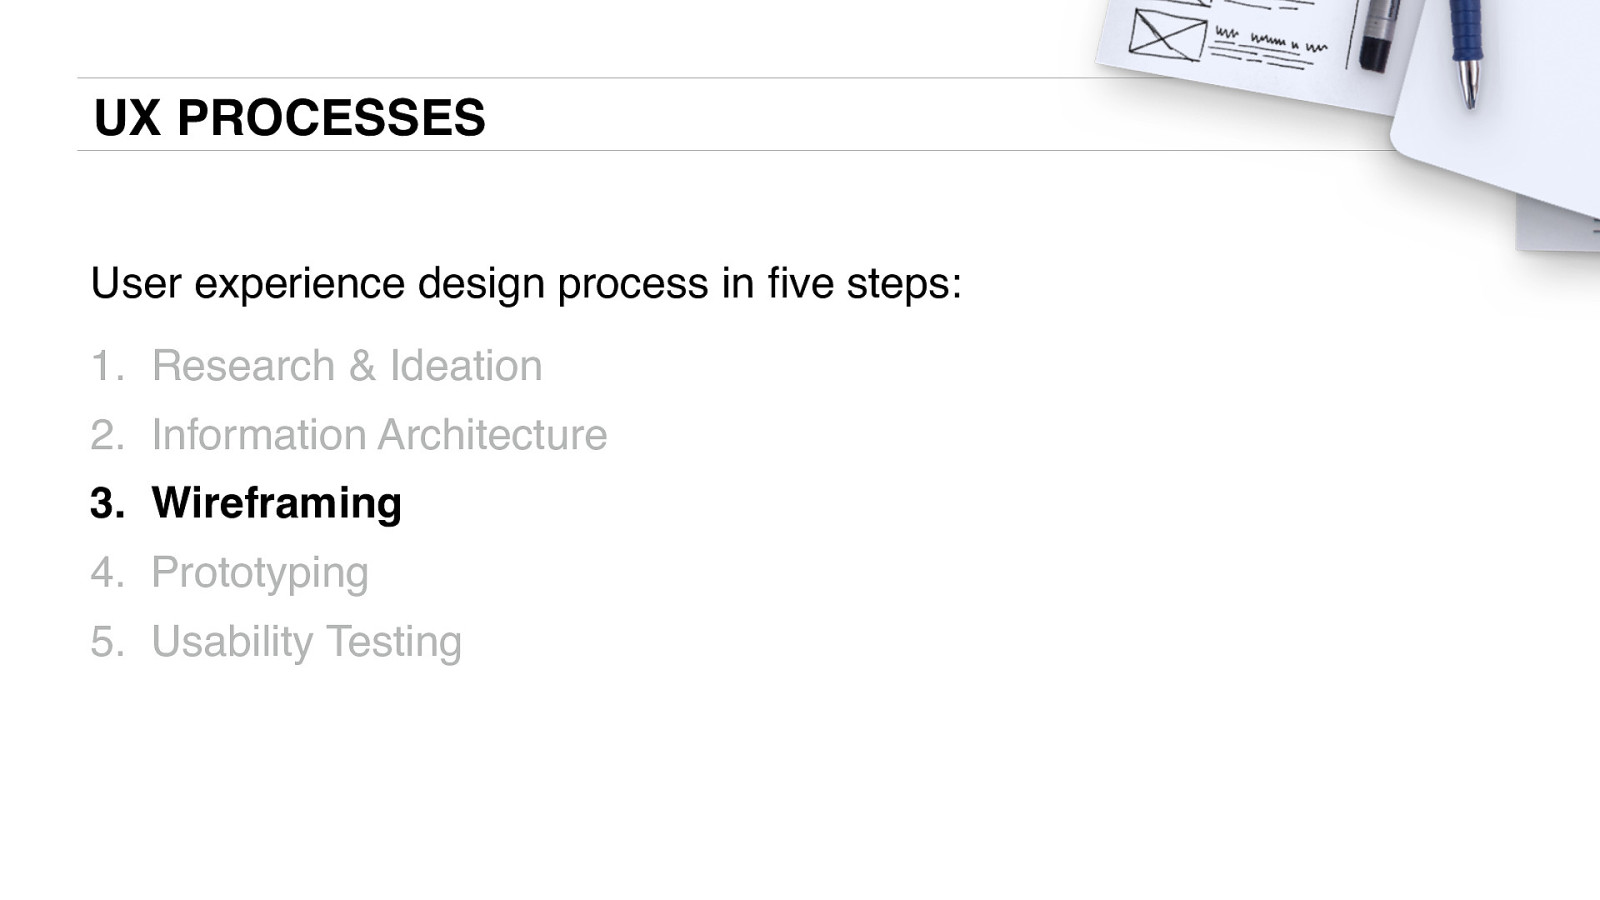
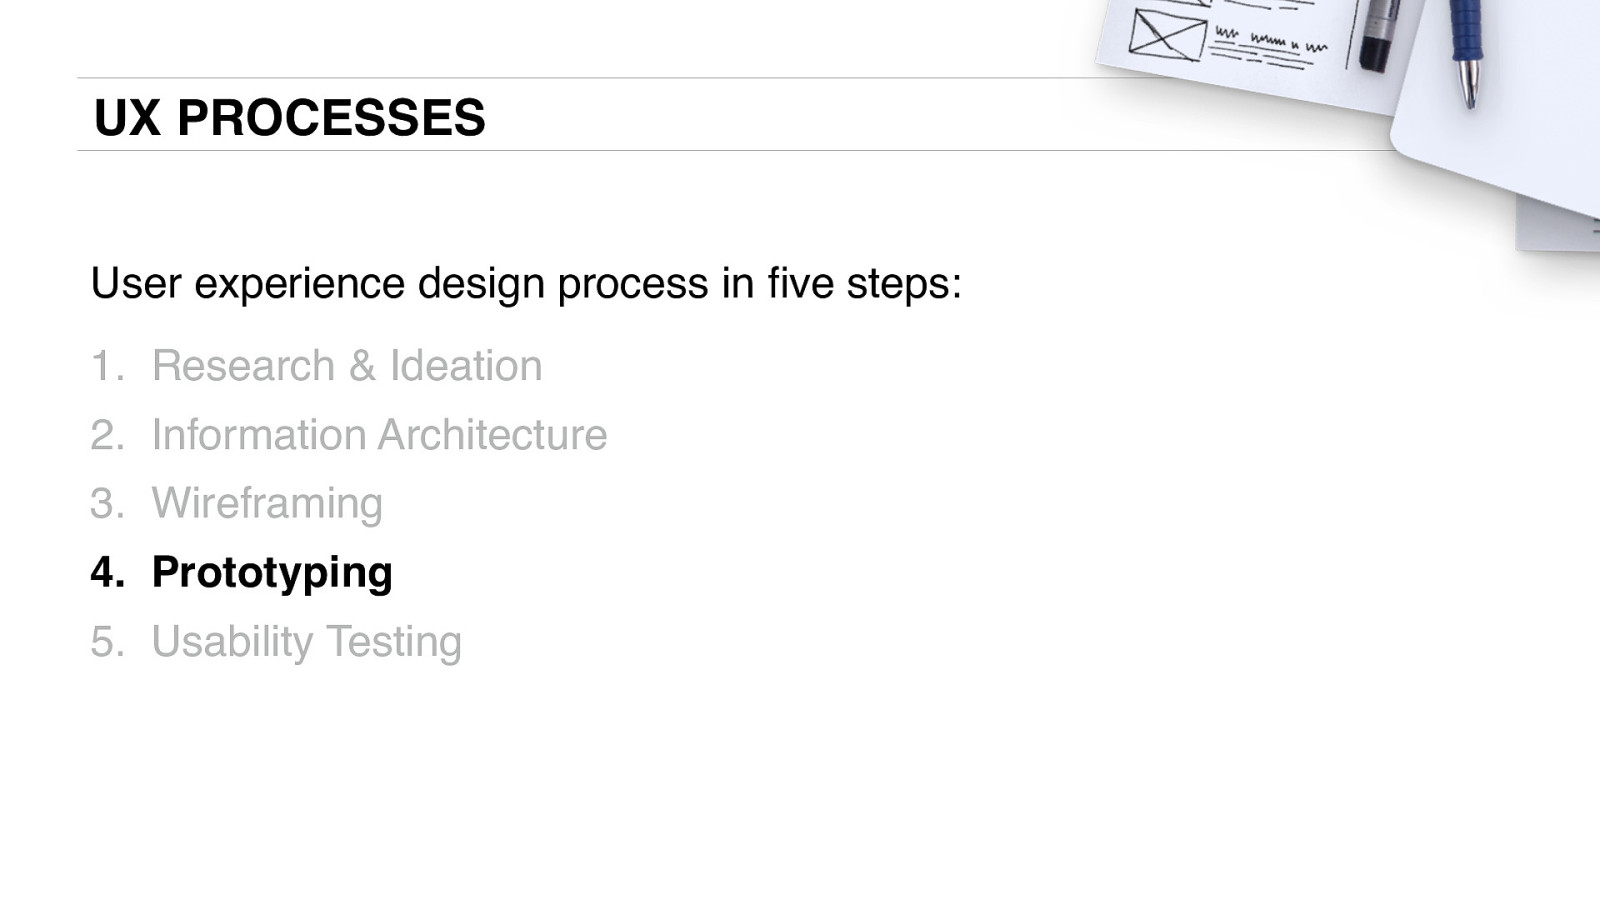
UX PROCESSES User experience design process in five steps: 1. Research & Ideation 2. Information Architecture 3. Wireframing 4. Prototyping 5. User Testing
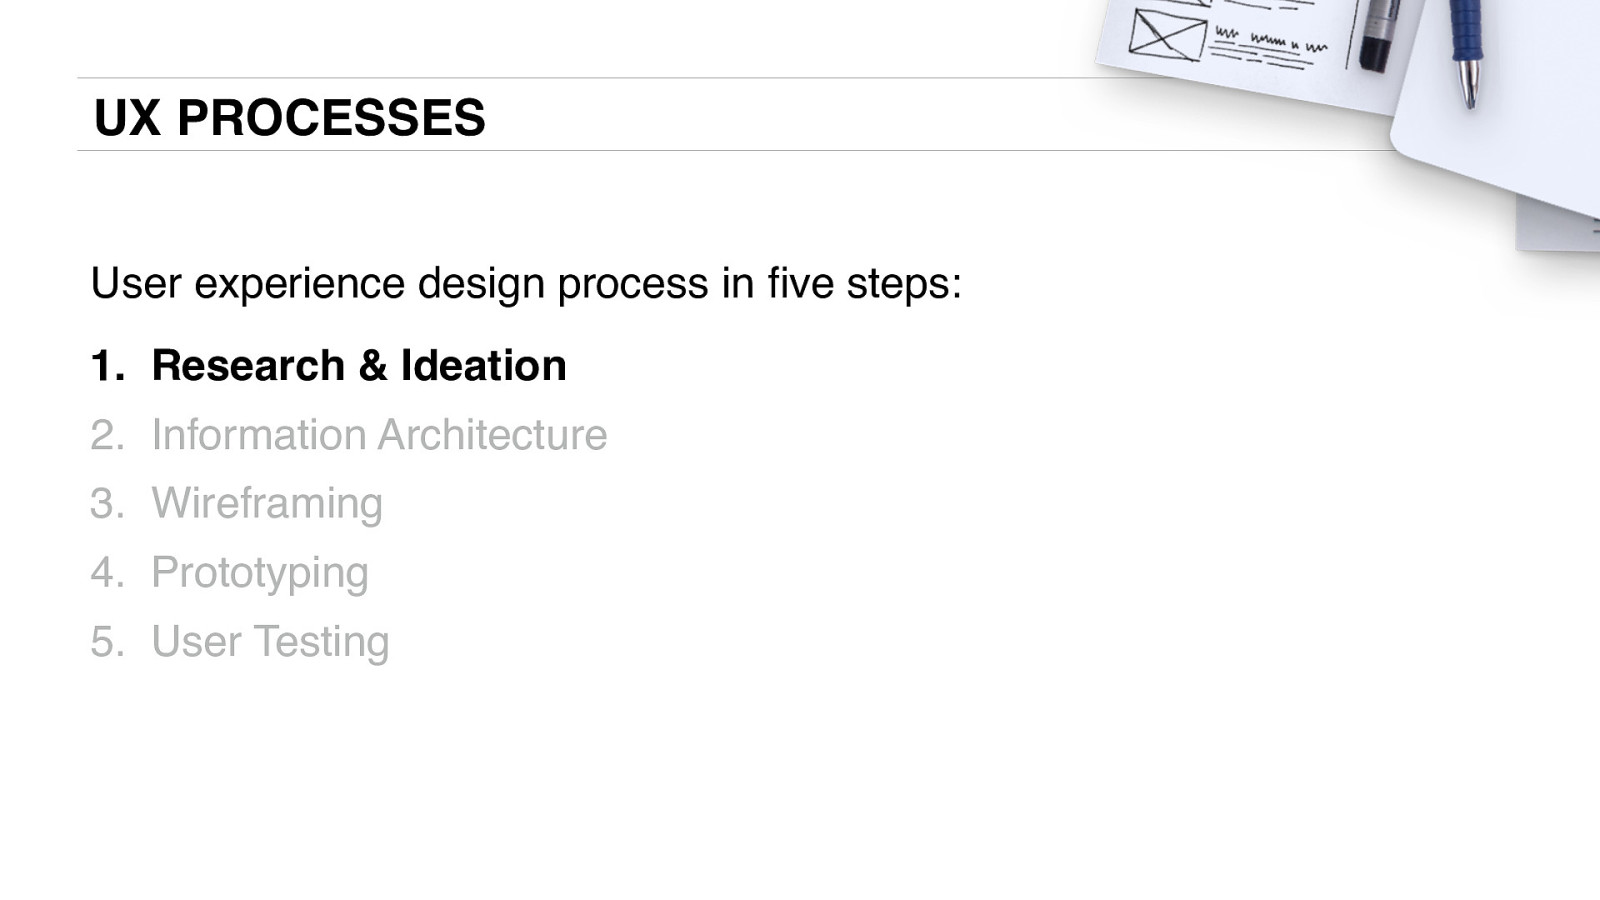
UX PROCESSES User experience design process in five steps: 1. Research & Ideation 2. Information Architecture 3. Wireframing 4. Prototyping 5. User Testing
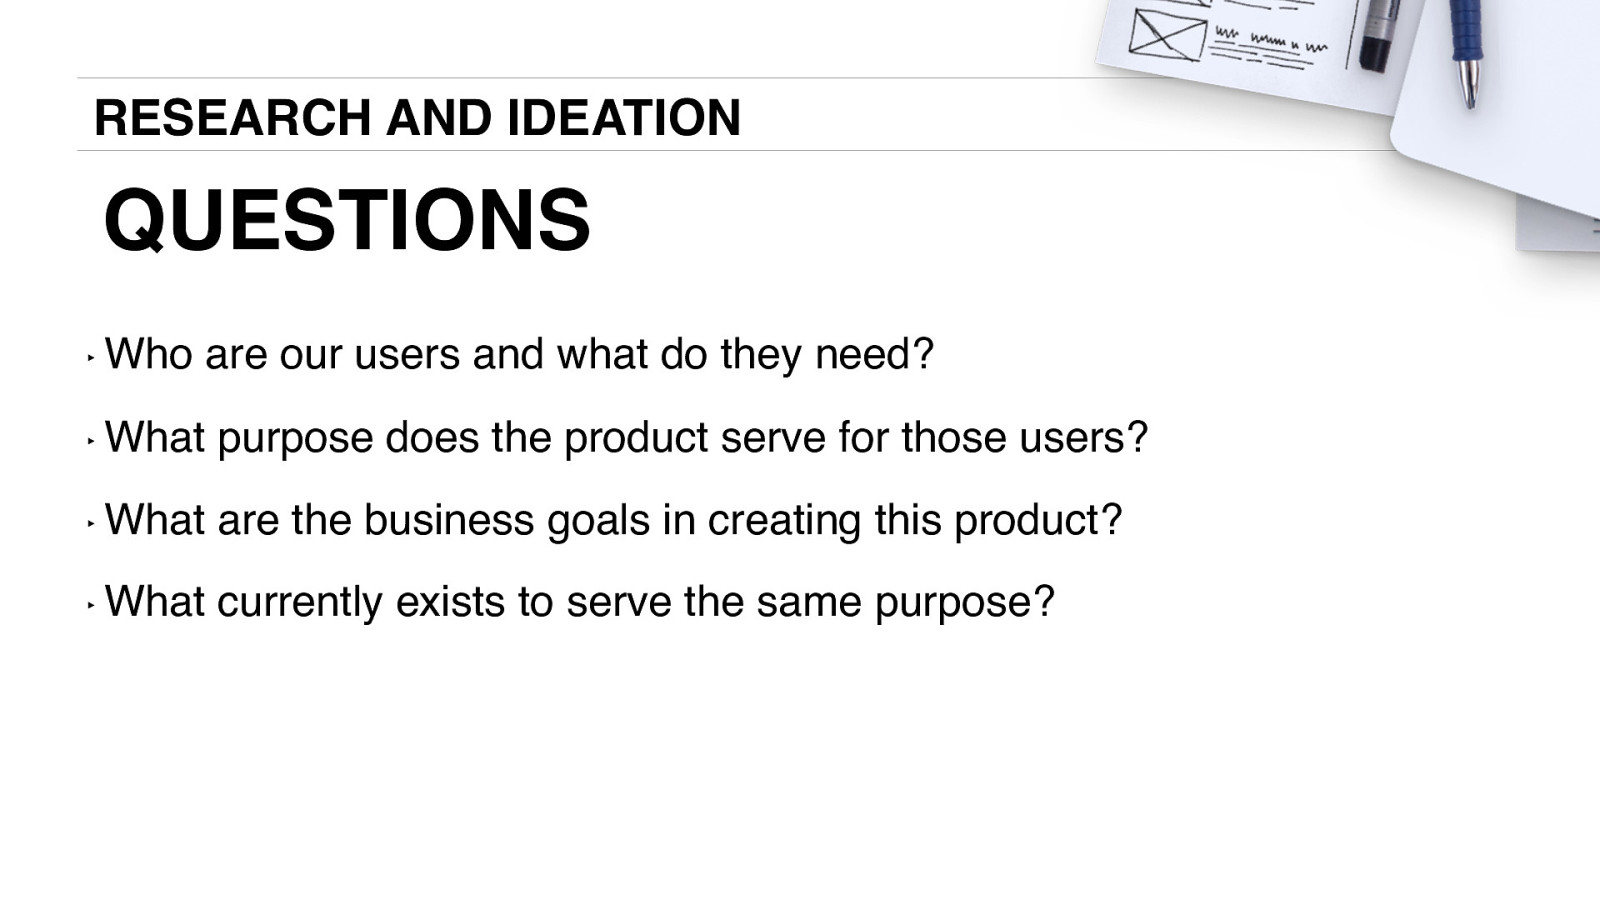
RESEARCH AND IDEATION QUESTIONS ‣ Who are our users and what do they need? ‣ What purpose does the product serve for those users? ‣ What are the business goals in creating this product? ‣ What currently exists to serve the same purpose?
RESEARCH AND IDEATION When my boss and the client are setting unrealistic goals and I’m responsible for the work UXreactions.com
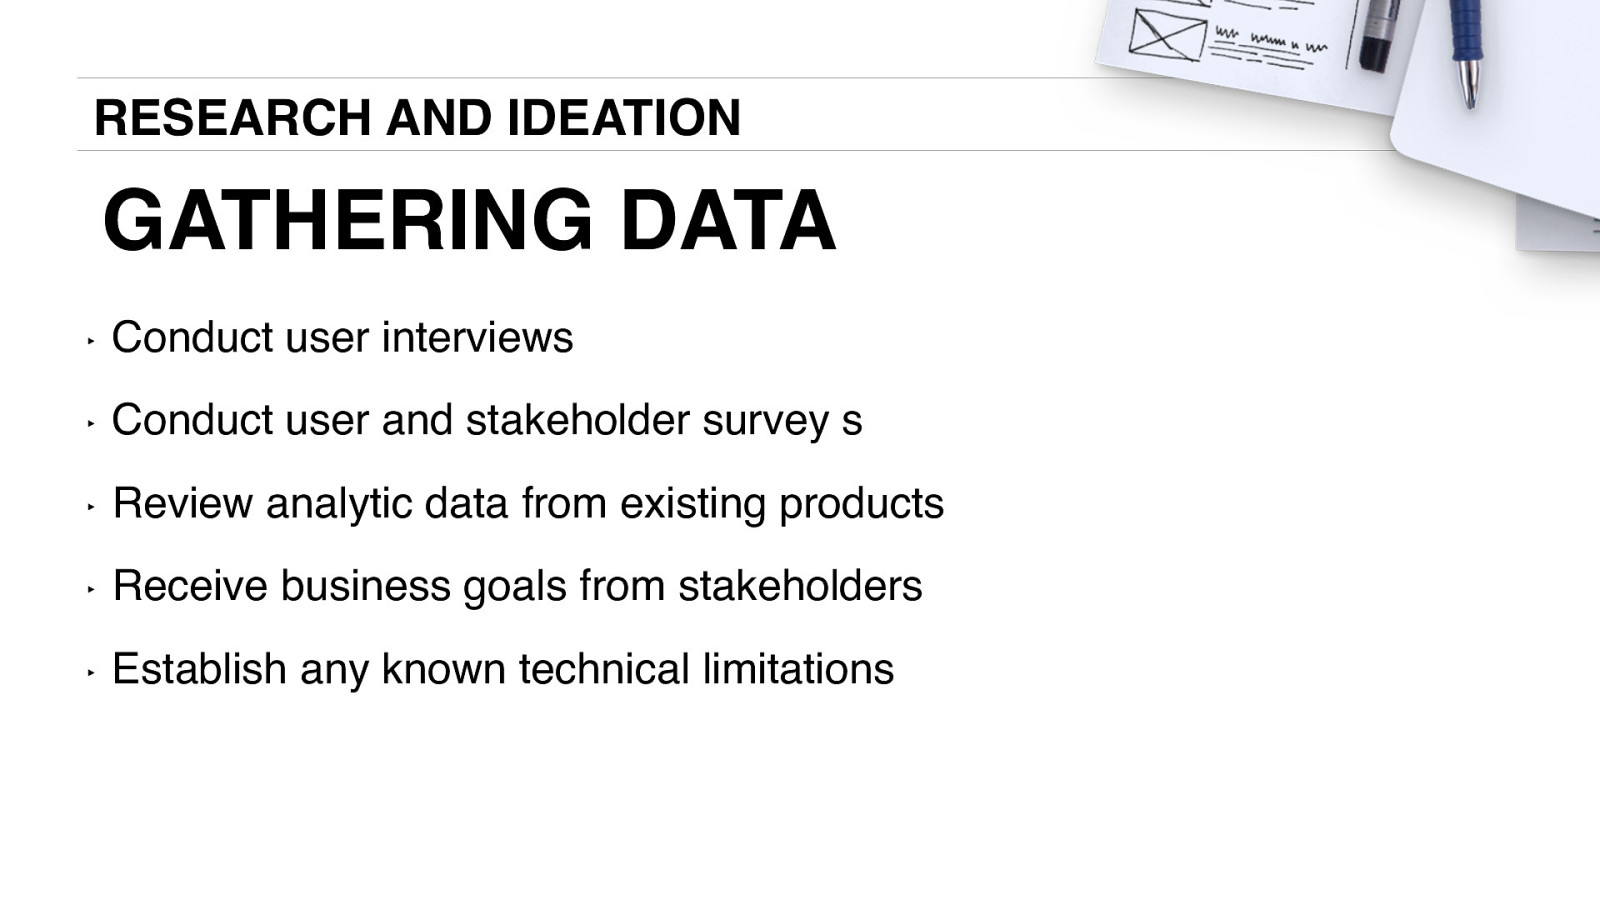
RESEARCH AND IDEATION GATHERING DATA ‣ Conduct user interviews ‣ Conduct user and stakeholder survey s ‣ Review analytic data from existing products ‣ Receive business goals from stakeholders ‣ Establish any known technical limitations
RESEARCH AND IDEATION When the products features are set by Marketing UXreactions.com
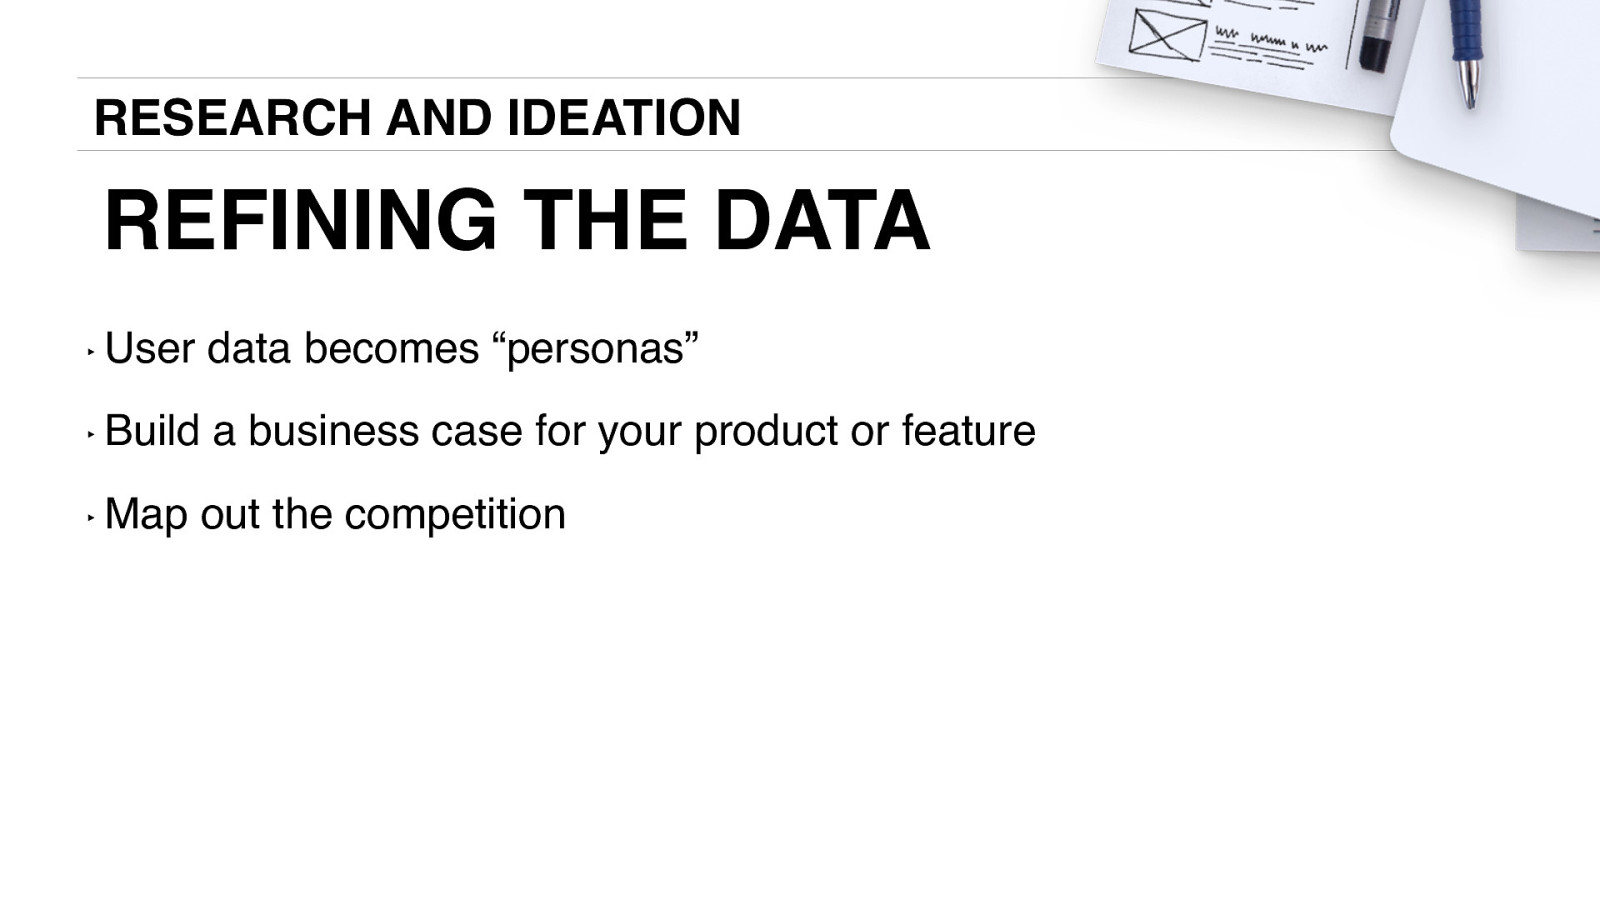
RESEARCH AND IDEATION REFINING THE DATA ‣ User data becomes “personas” ‣ Build a business case for your product or feature ‣ Map out the competition
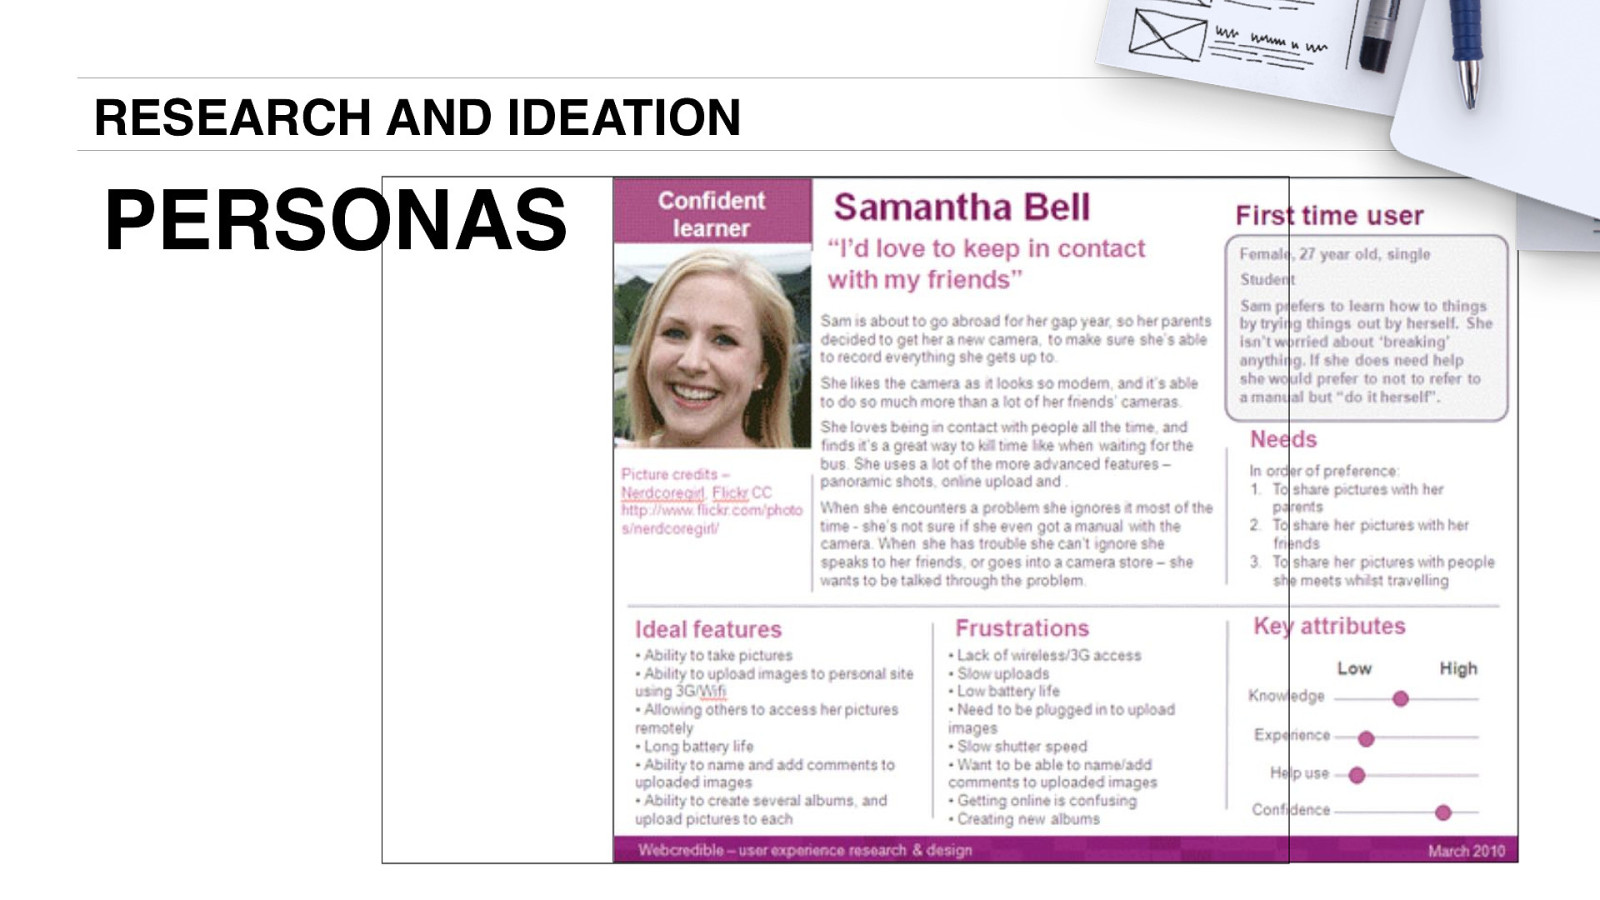
RESEARCH AND IDEATION PERSONAS
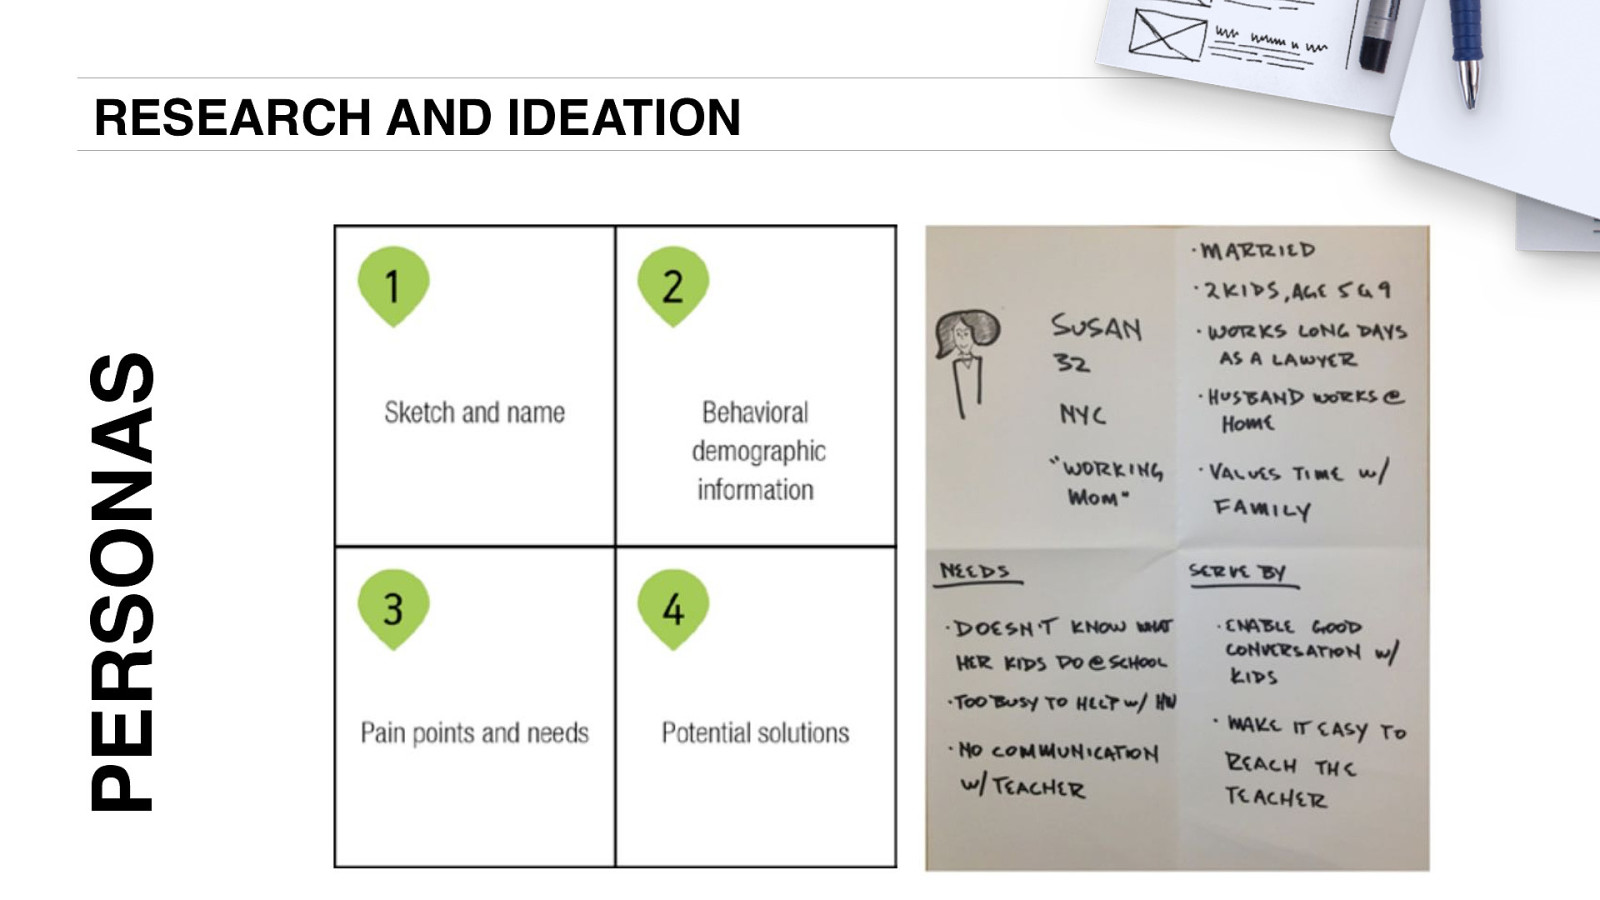
PERSONAS RESEARCH AND IDEATION
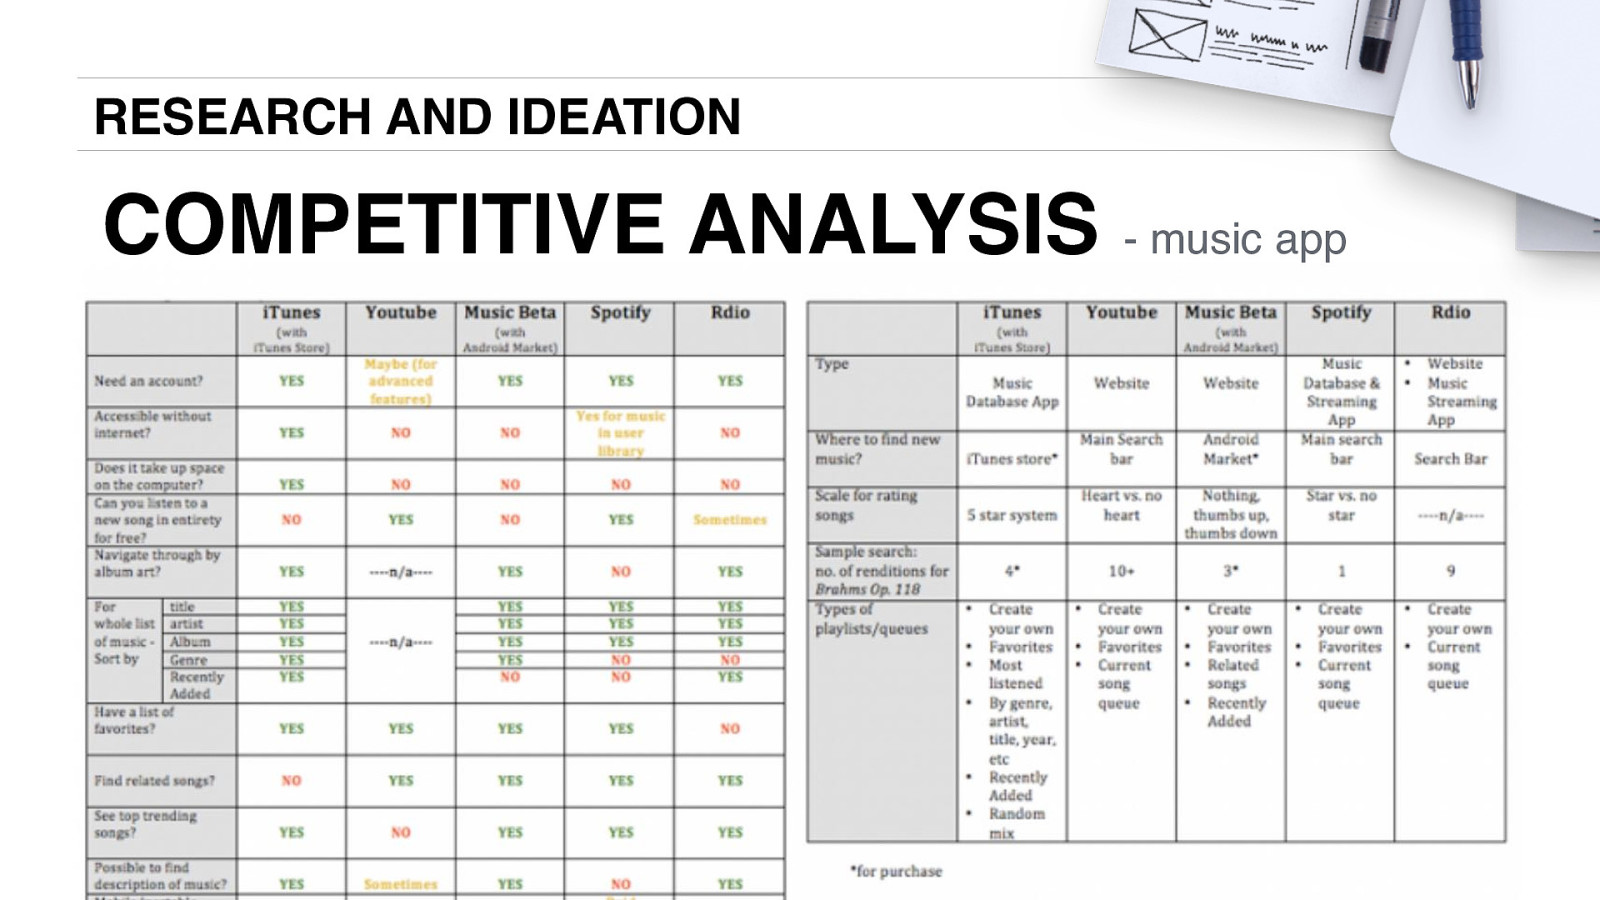
RESEARCH AND IDEATION COMPETITIVE ANALYSIS - music app
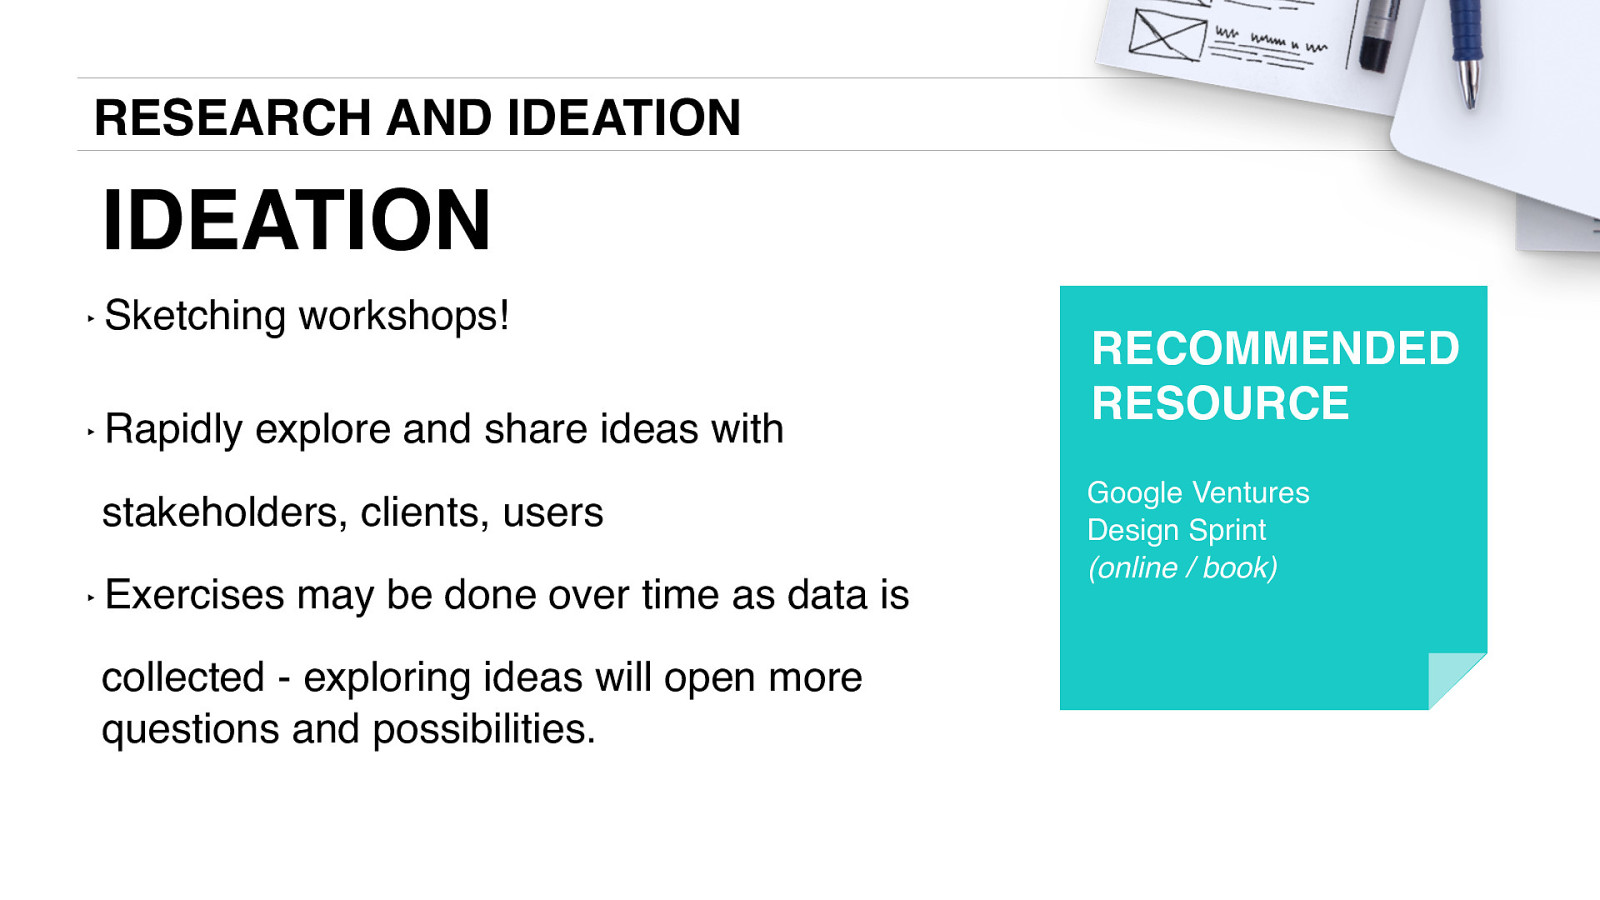
28 RESEARCH AND IDEATION IDEATION ‣ Sketching ‣ Rapidly workshops! explore and share ideas with stakeholders, clients, users ‣ Exercises may be done over time as data is collected - exploring ideas will open more questions and possibilities. RECOMMENDED RESOURCE Google Ventures Design Sprint (online / book)
RESEARCH AND IDEATION CLOSE COLLABORATION The research process develops in a number of ways, depending on the product and the experience. ‣ Close collaboration is required at all times with e.g. developers, designers, business analysts, product managers and stakeholders
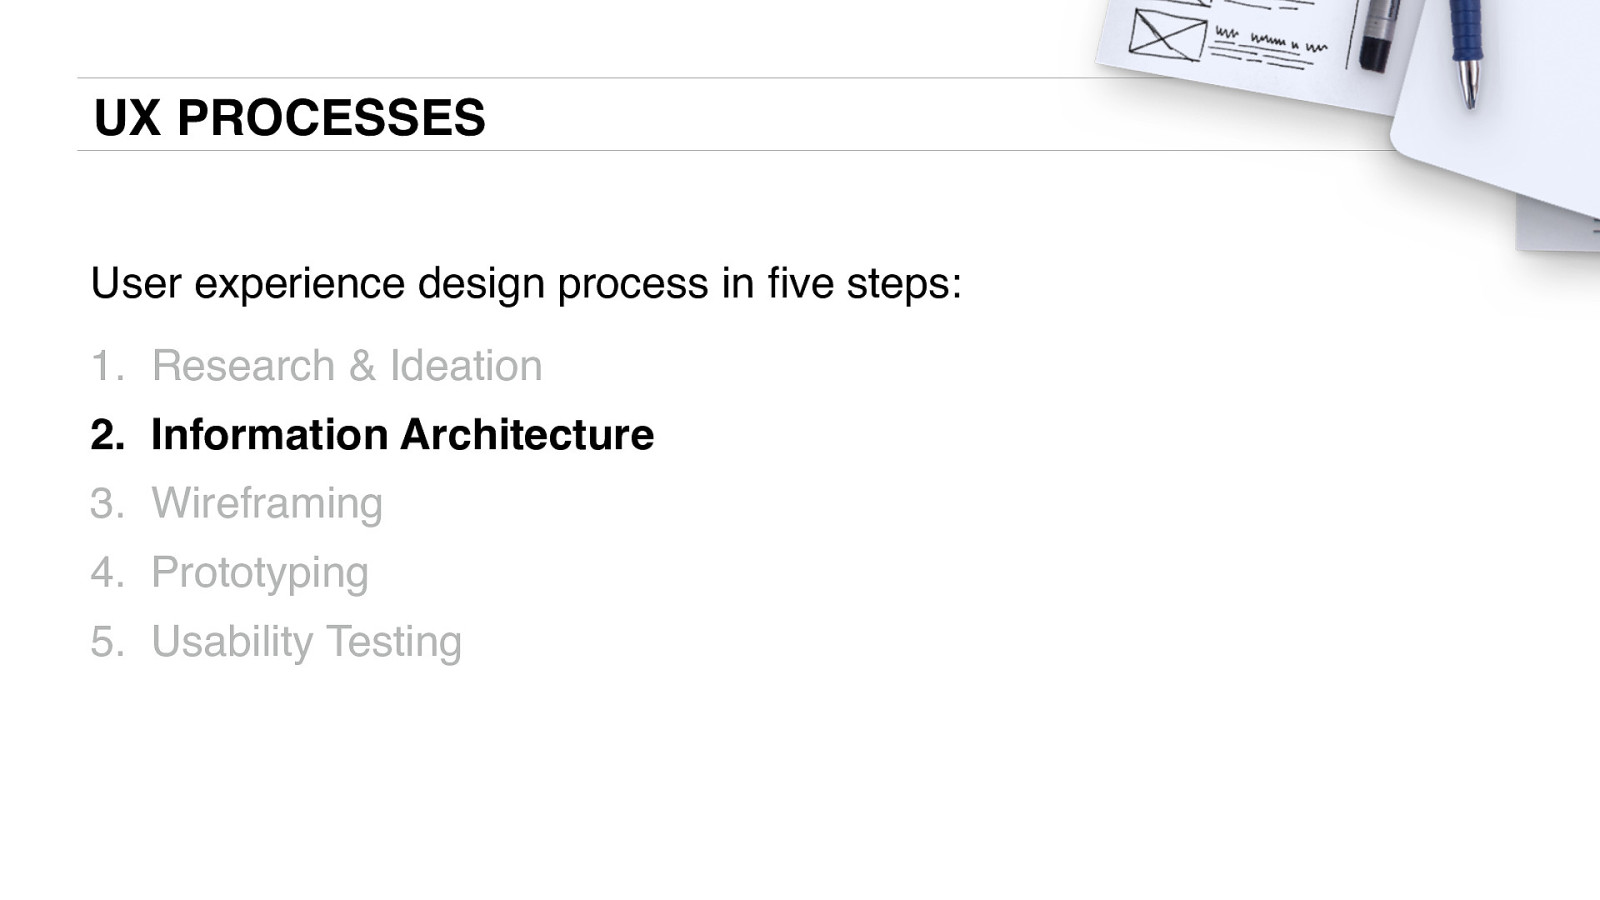
UX PROCESSES User experience design process in five steps: 1. Research & Ideation 2. Information Architecture 3. Wireframing 4. Prototyping 5. Usability Testing
INFORMATION ARCHITECTURE MAPS The content of an experience, organized in a logical manner as a basis for how the user will interact with it ‣ Taxonomy of features/functionalities ‣ Hierarchy of content ‣ The process starts out rough and refines through iteration
INFORMATION ARCHITECTURE JOURNEY MAPPING The stories that a user may follow through the experience are visualised as flow or journey maps ‣ Journey maps document movement and actions toward an end goal rather than literal locations within an experience ‣ Drawing a map often identifies points of unnecessary complexity which can be streamlined
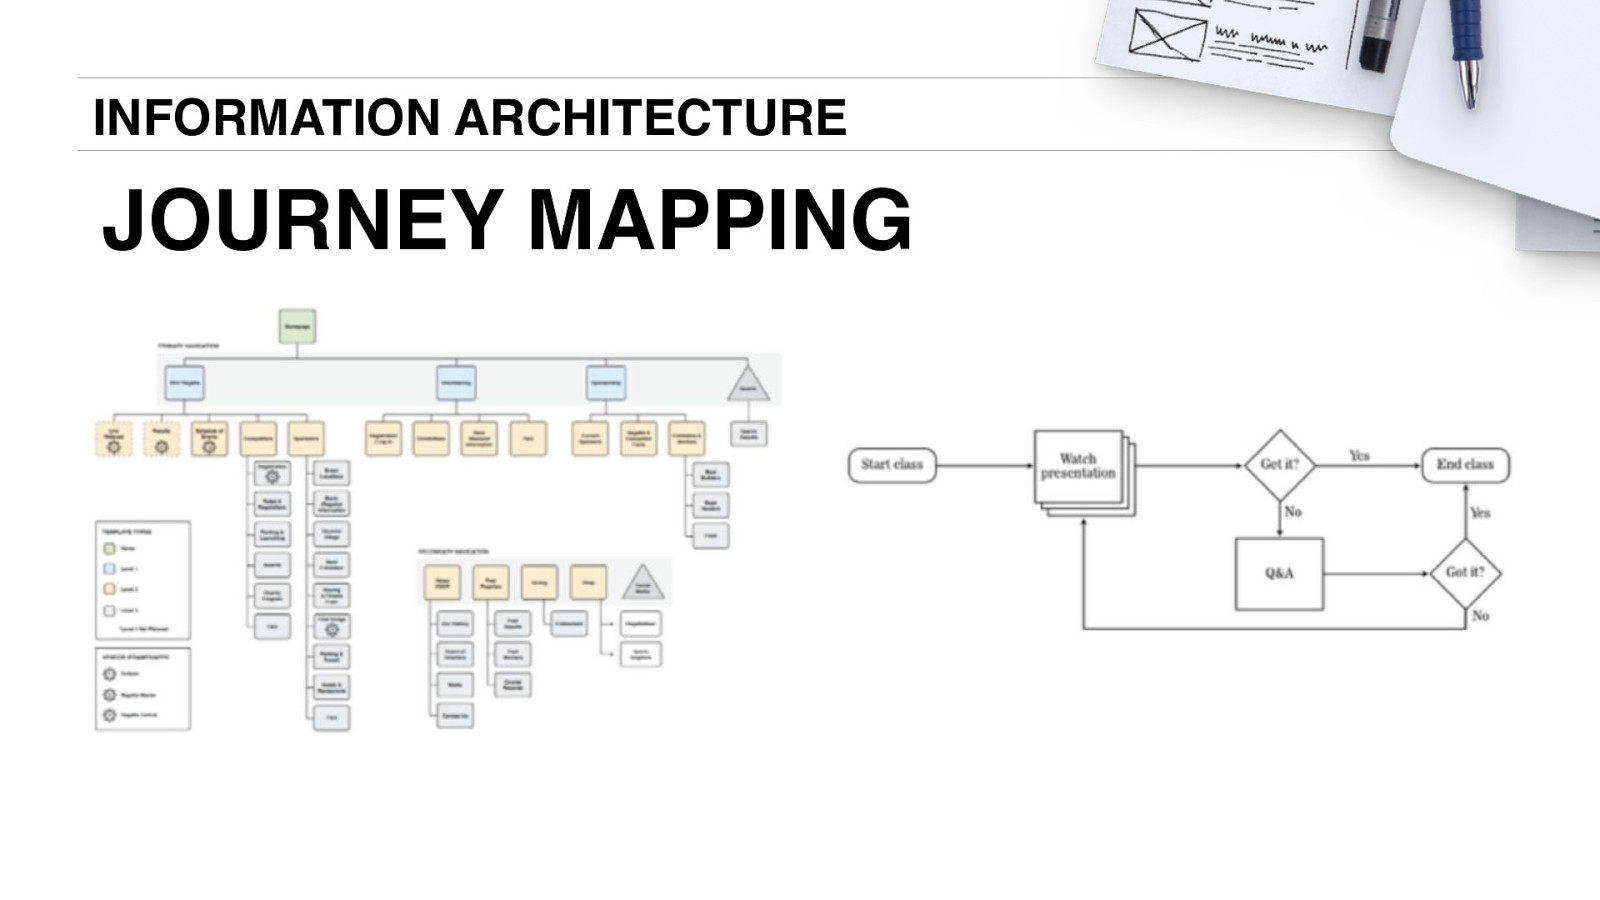
INFORMATION ARCHITECTURE JOURNEY MAPPING
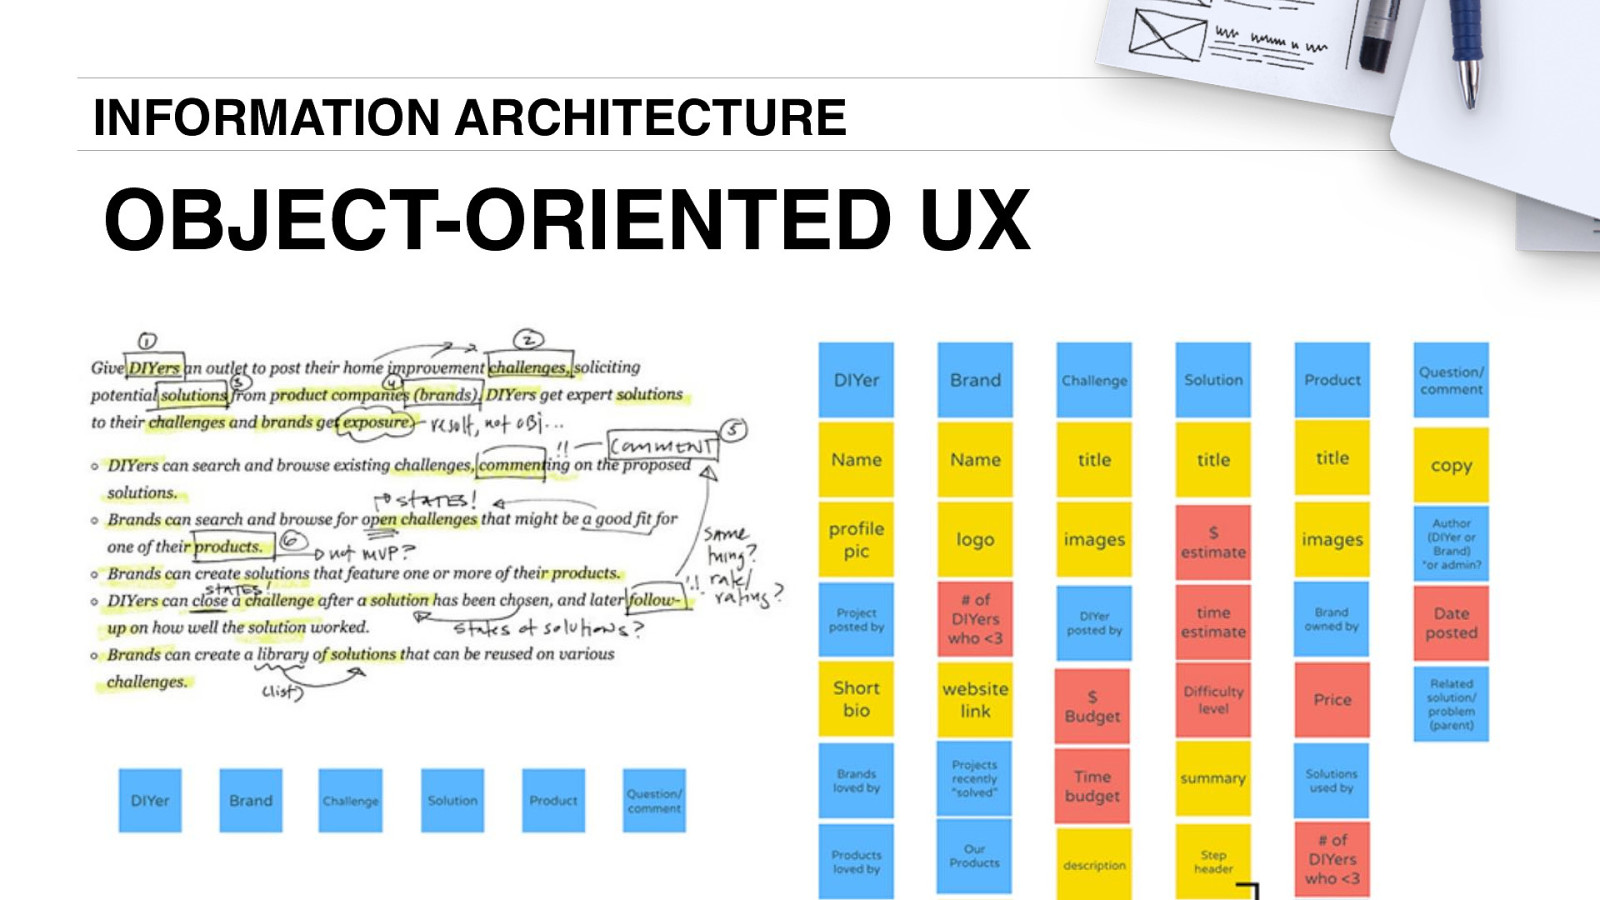
INFORMATION ARCHITECTURE OBJECT-ORIENTED UX
UX PROCESSES User experience design process in five steps: 1. Research & Ideation 2. Information Architecture 3. Wireframing 4. Prototyping 5. Usability Testing
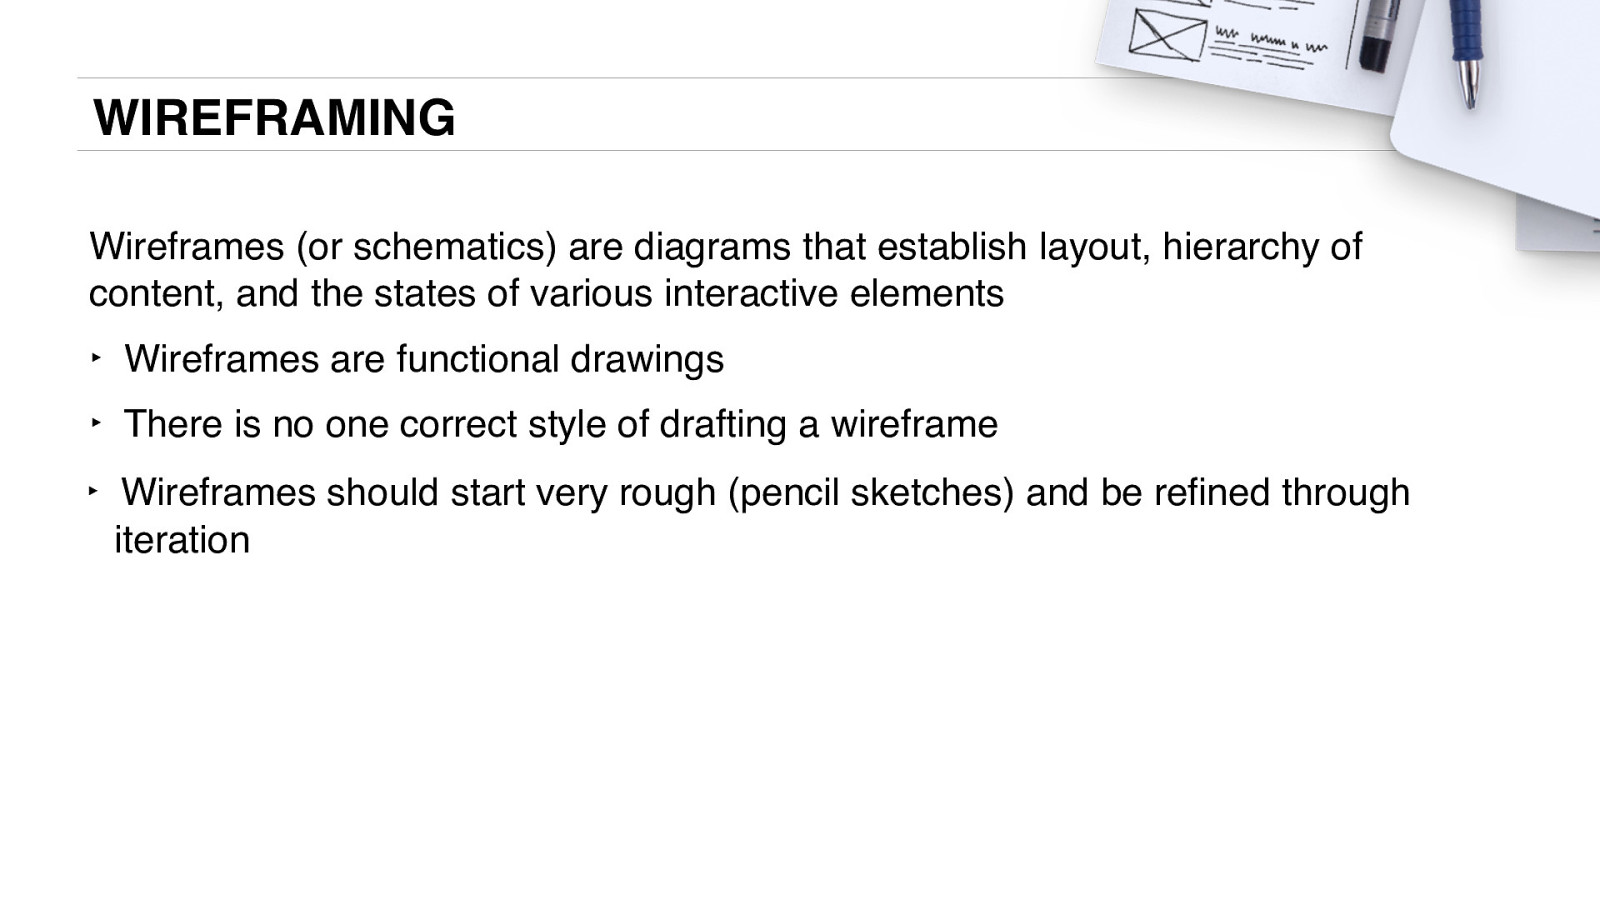
WIREFRAMING Wireframes (or schematics) are diagrams that establish layout, hierarchy of content, and the states of various interactive elements ‣ Wireframes are functional drawings ‣ There is no one correct style of drafting a wireframe ‣ Wireframes should start very rough (pencil sketches) and be refined through iteration
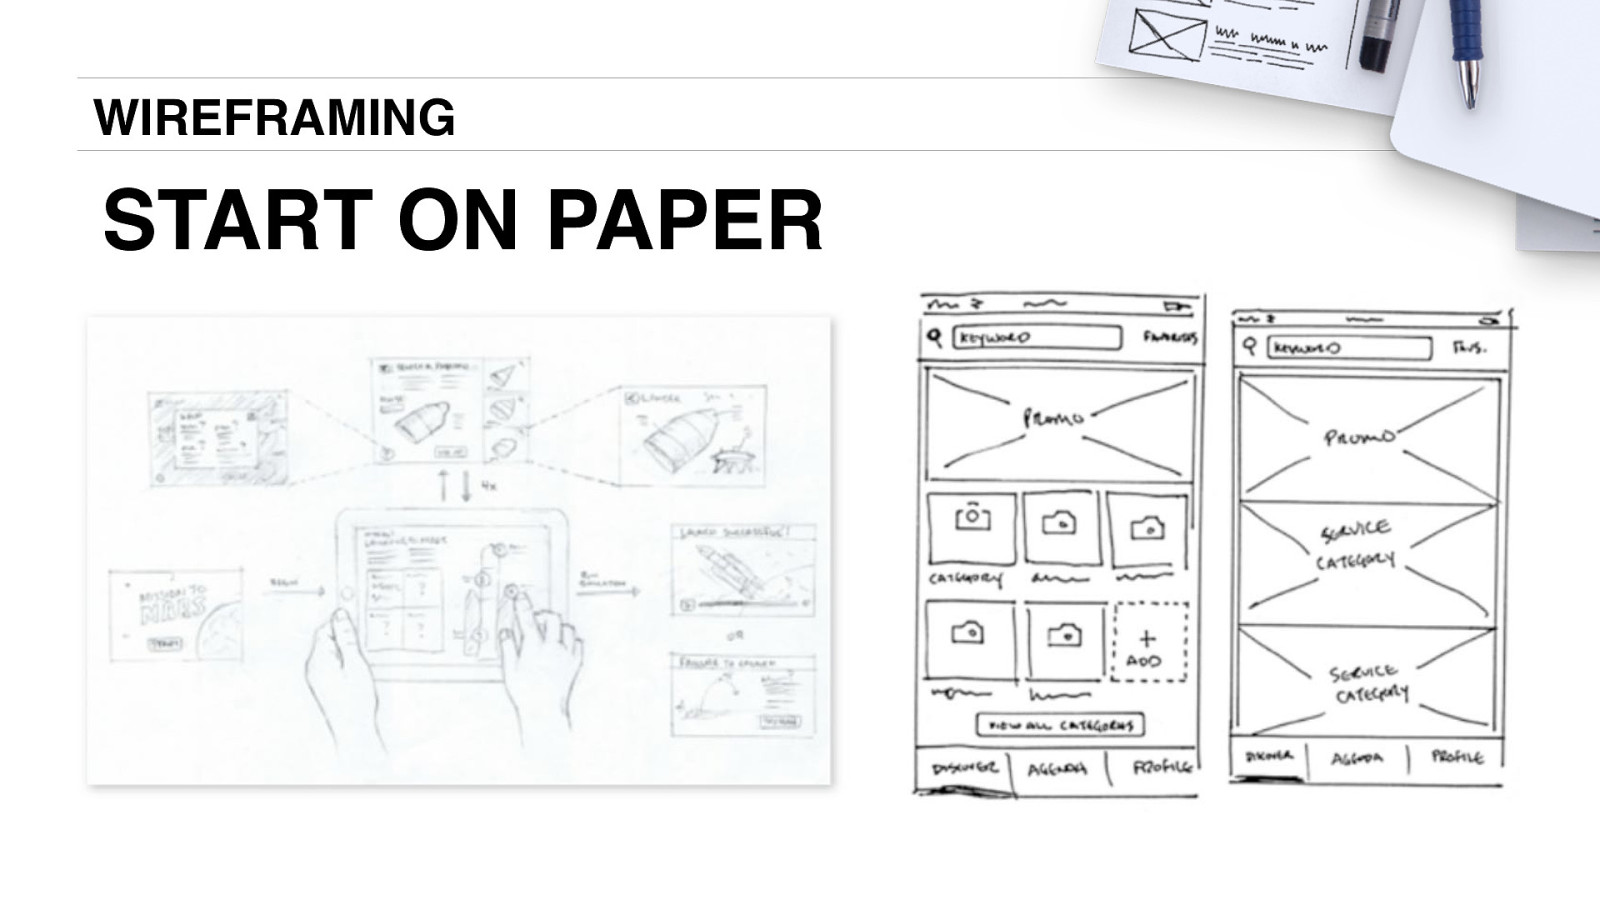
WIREFRAMING START ON PAPER
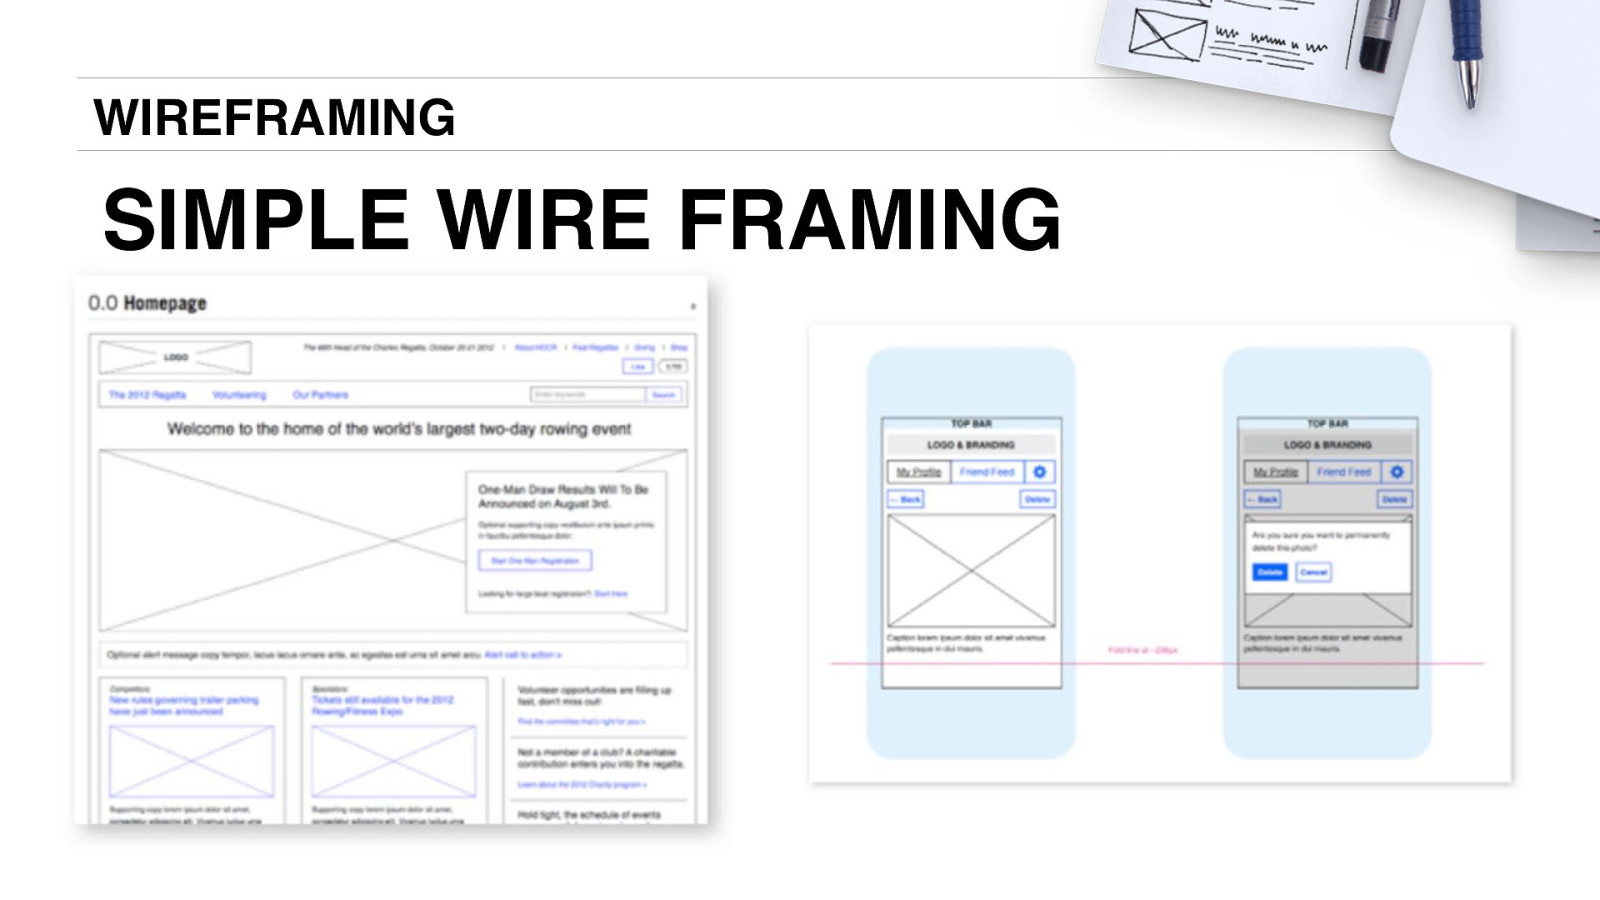
WIREFRAMING SIMPLE WIRE FRAMING
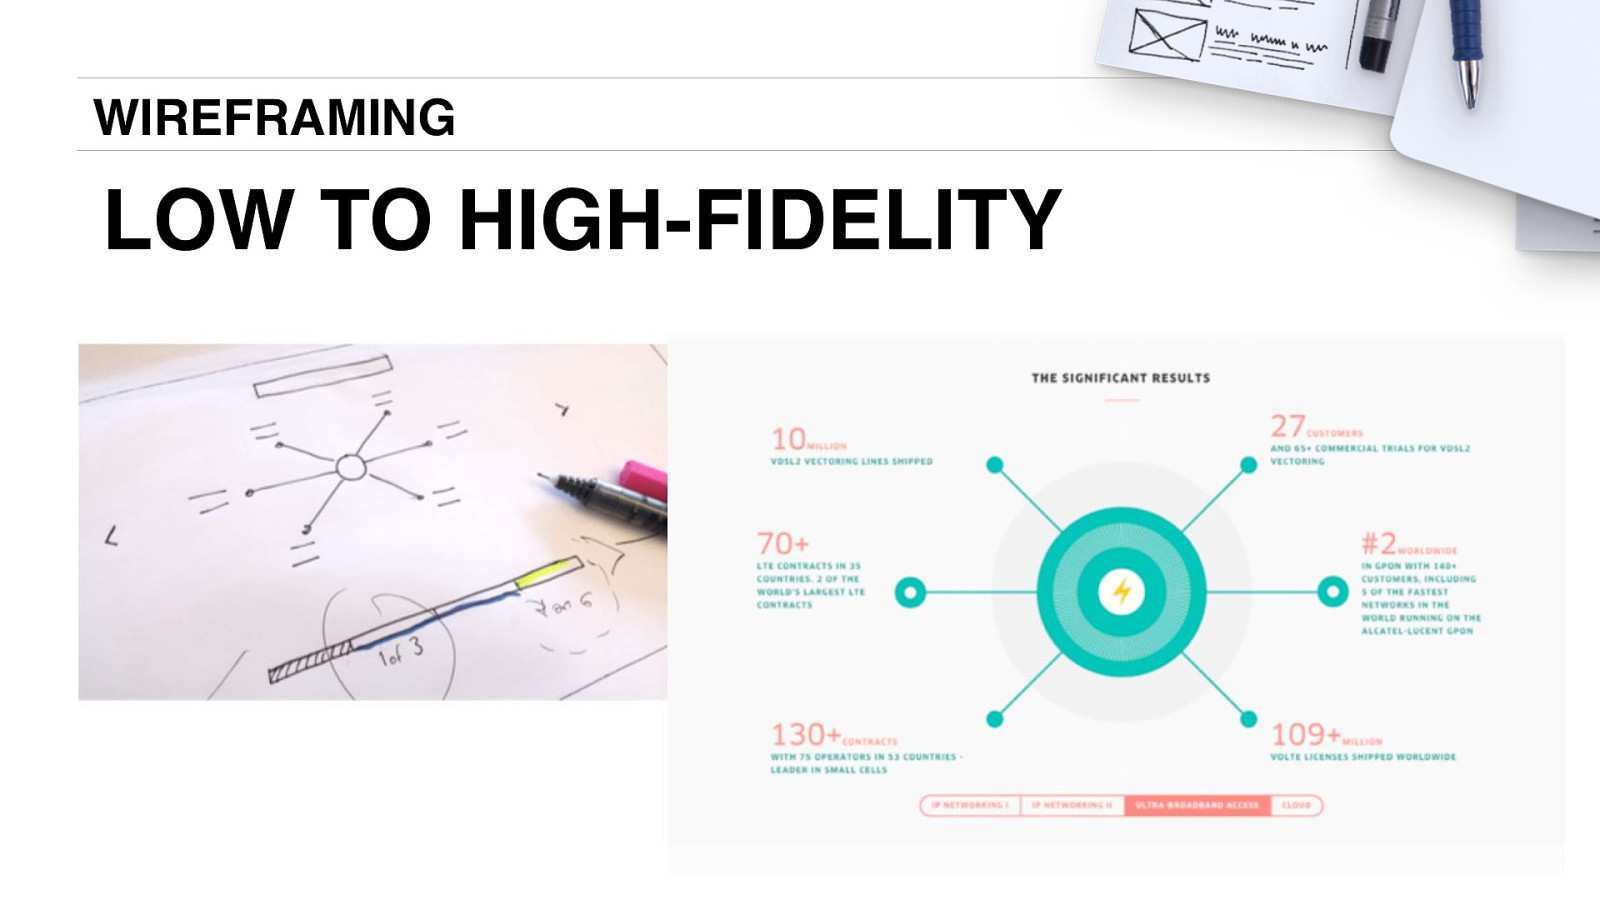
WIREFRAMING LOW TO HIGH-FIDELITY
UX PROCESSES User experience design process in five steps: 1. Research & Ideation 2. Information Architecture 3. Wireframing 4. Prototyping 5. Usability Testing
PROTOTYPING DESIGNING INTERACTIVITY ‣ Prototypes take a variety of formats, from clickable PDFs, to coded demos, to scale models of physical objects ‣ Like wireframes, they help facilitate decisions quickly ‣ Used with teams inside the company or outside with users
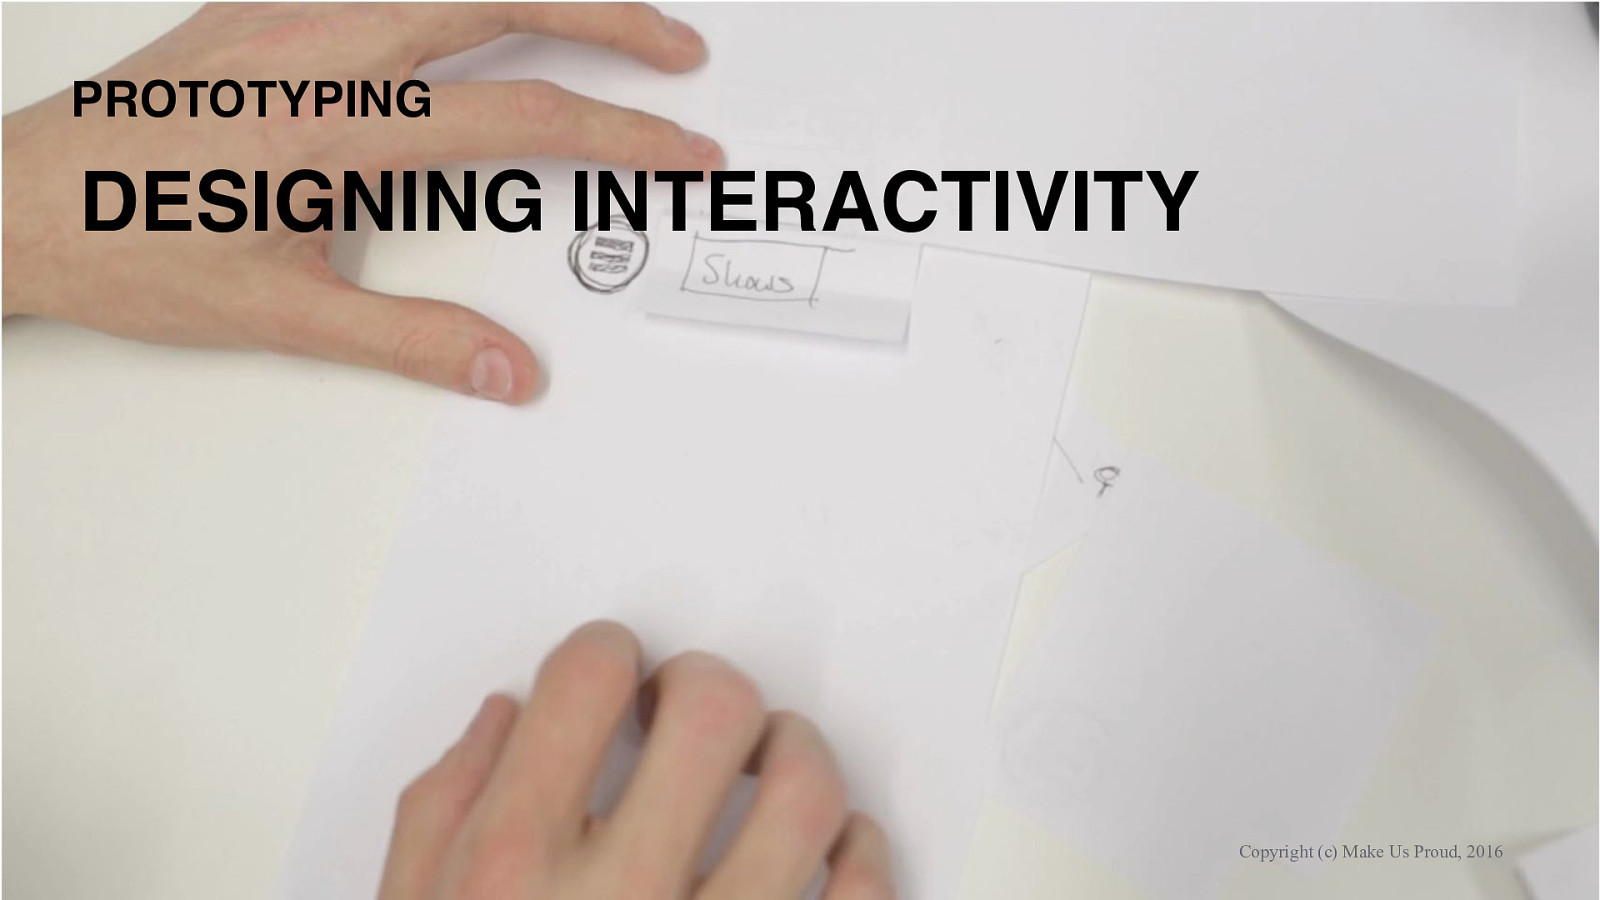
PROTOTYPING DESIGNING INTERACTIVITY Copyright (c) Make Us Proud, 2016
43 Copyright (c) Make Us Proud, 2016
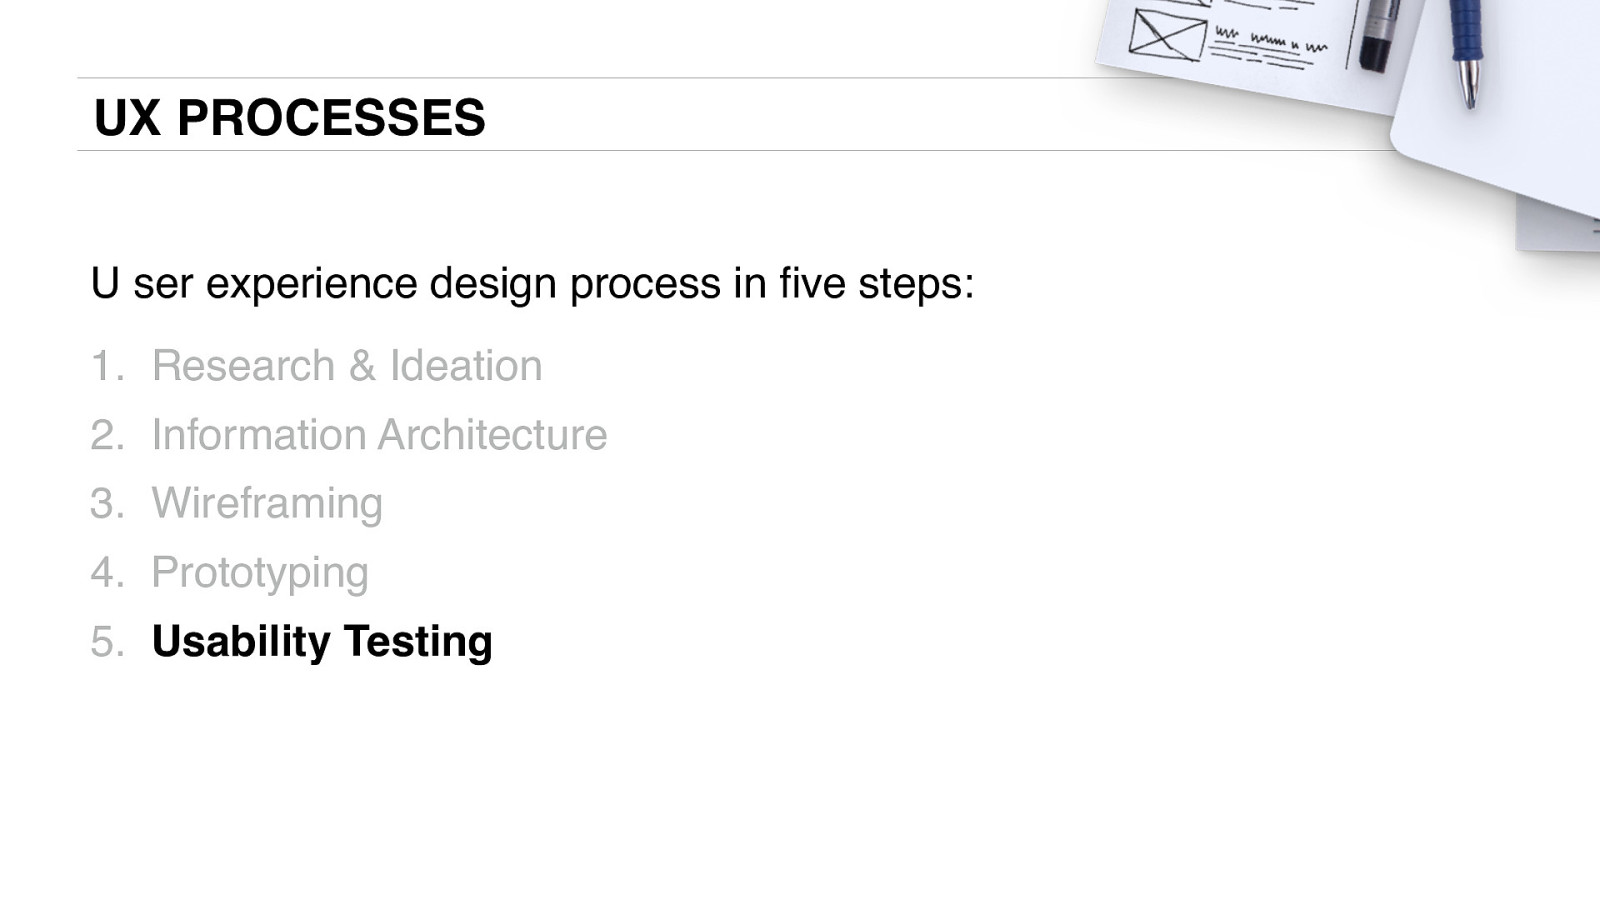
UX PROCESSES U ser experience design process in five steps: 1. Research & Ideation 2. Information Architecture 3. Wireframing 4. Prototyping 5. Usability Testing
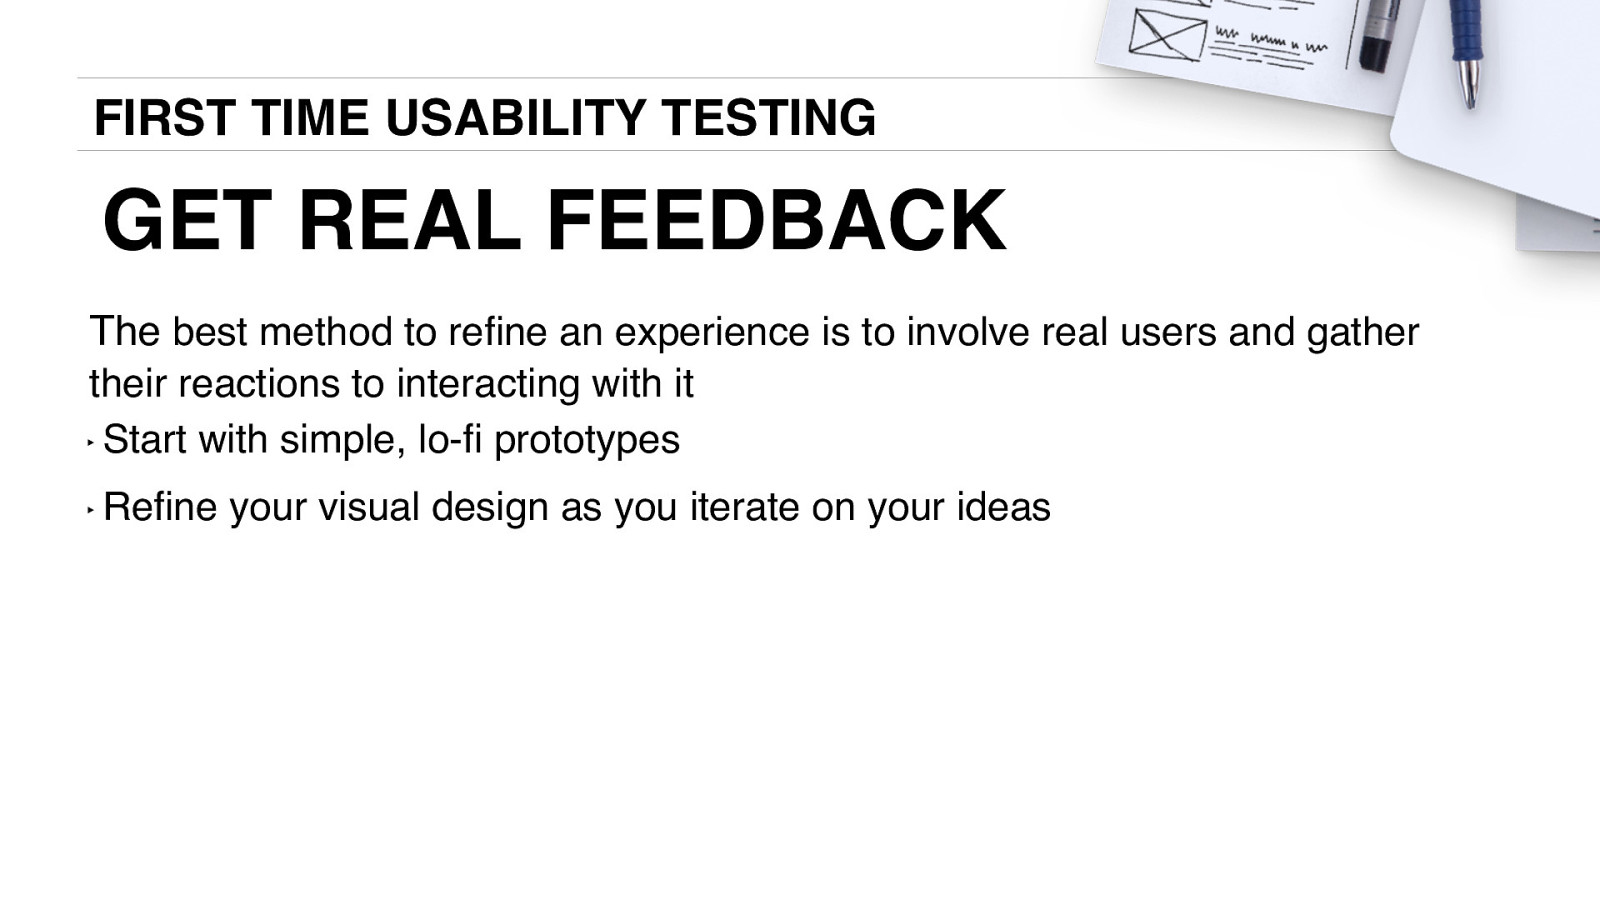
FIRST TIME USABILITY TESTING GET REAL FEEDBACK The best method to refine an experience is to involve real users and gather their reactions to interacting with it ‣ Start with simple, lo-fi prototypes ‣ Refine your visual design as you iterate on your ideas
FIRST TIME USABILITY TESTING
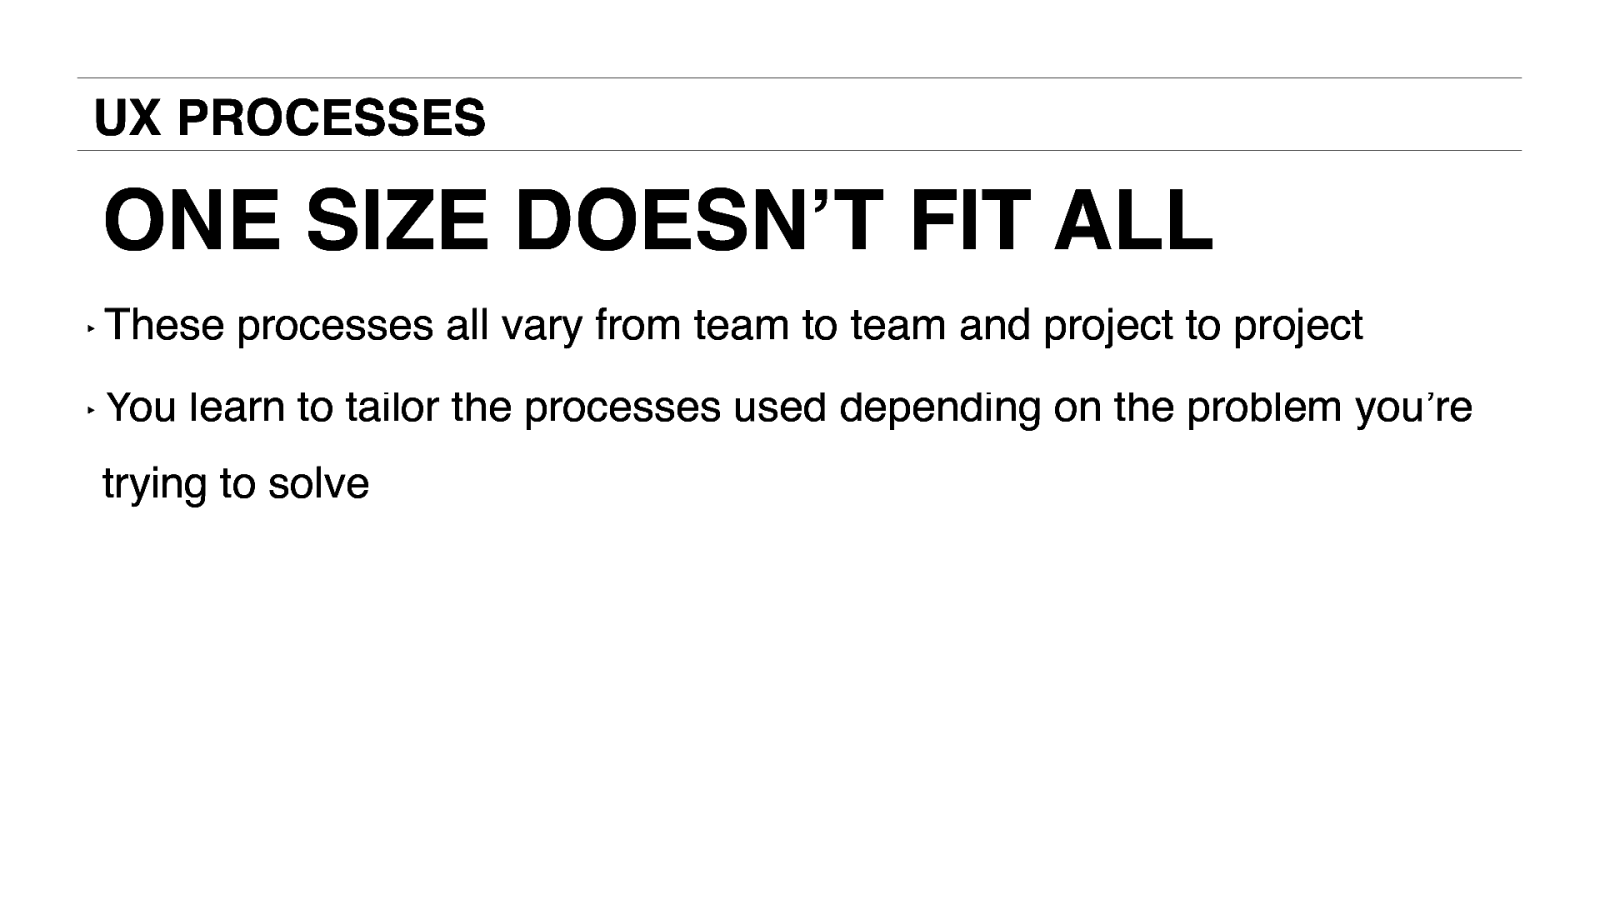
UX PROCESSES ONE SIZE DOESN’T FIT ALL ‣ These ‣ You processes all vary from team to team and project to project learn to tailor the processes used depending on the problem you’re trying to solve
Product Development Process
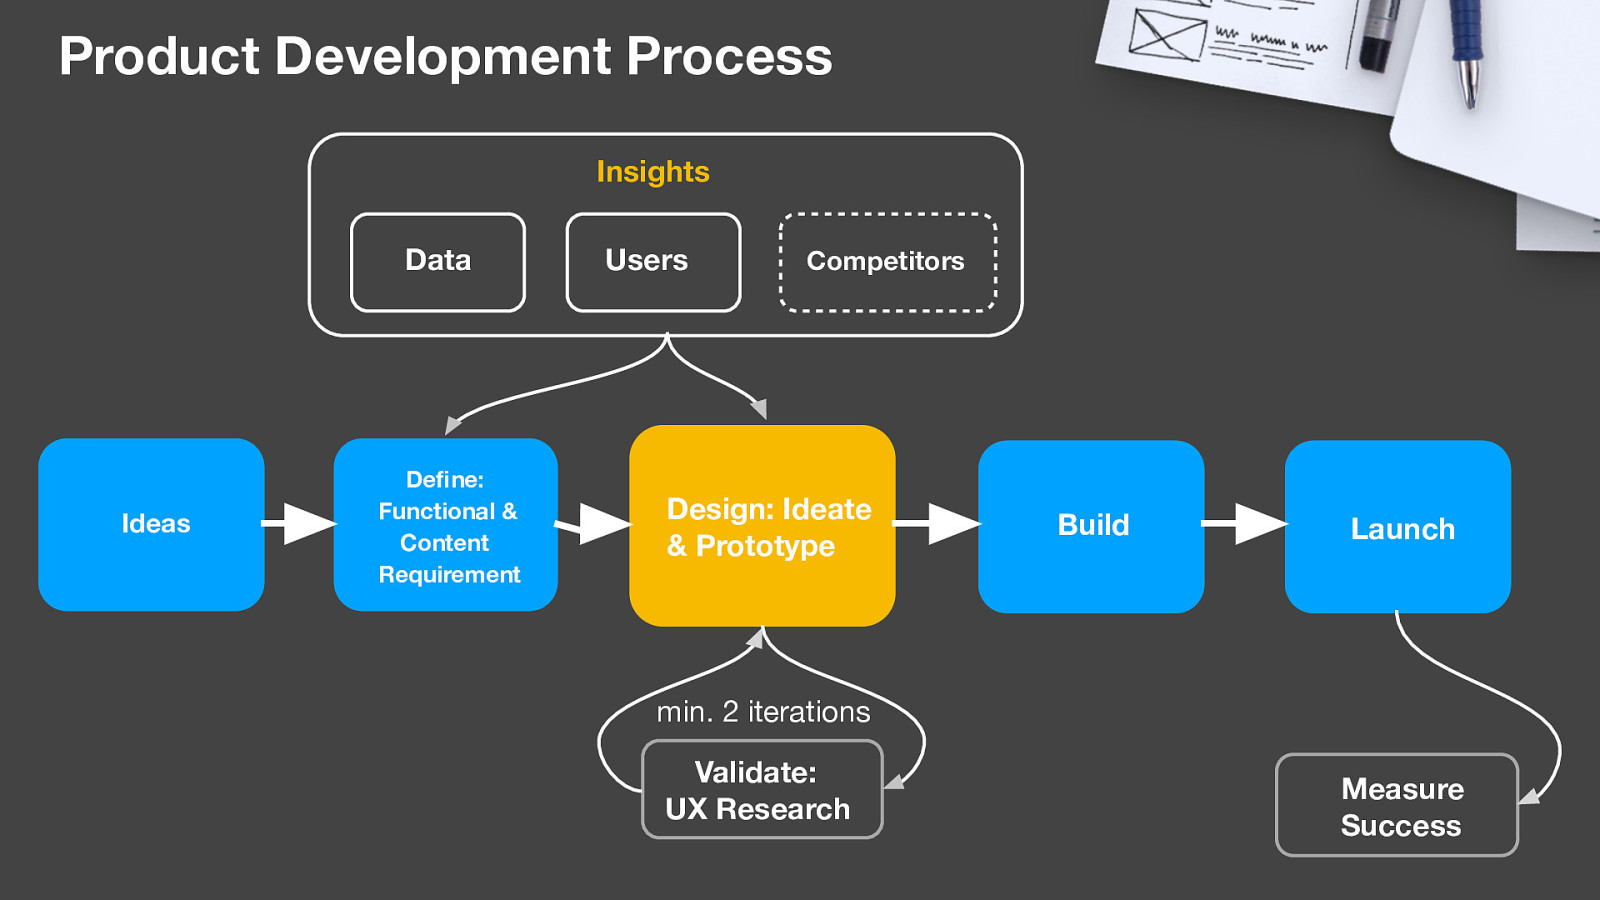
Product Development Process Insights Data Ideas Define: Functional & Content Requirement Users Competitors Design: Ideate & Prototype Build Launch min. 2 iterations Validate: UX Research Measure Success
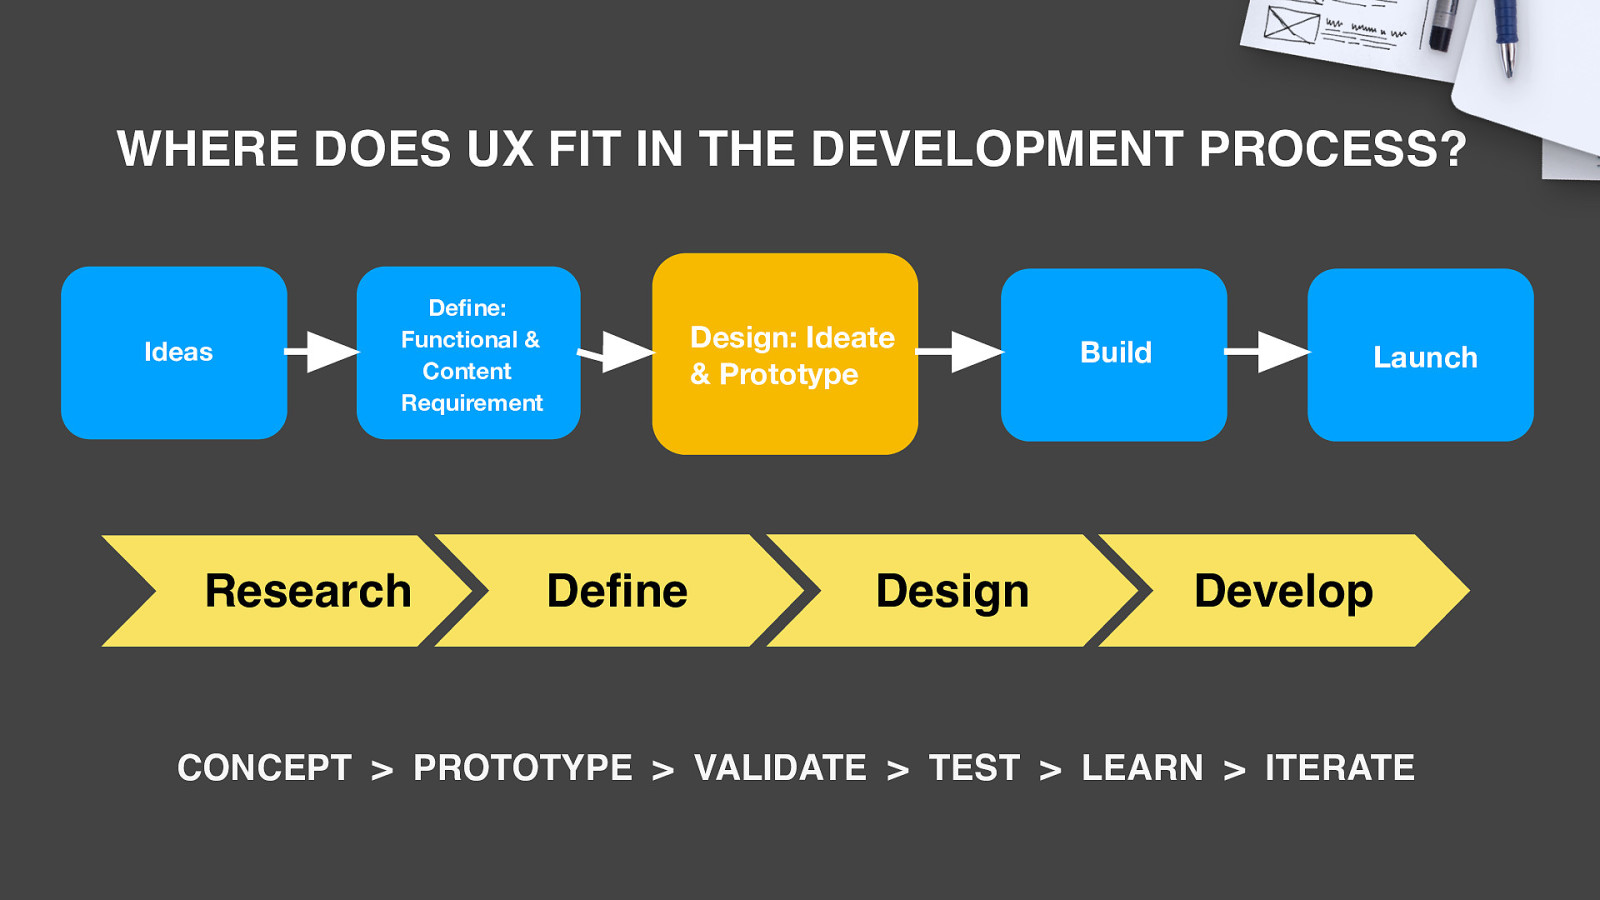
WHERE DOES UX FIT IN THE DEVELOPMENT PROCESS? Ideas Define: Functional & Content Requirement Research Design: Ideate & Prototype Define Design Build Launch Develop CONCEPT > PROTOTYPE > VALIDATE > TEST > LEARN > ITERATE
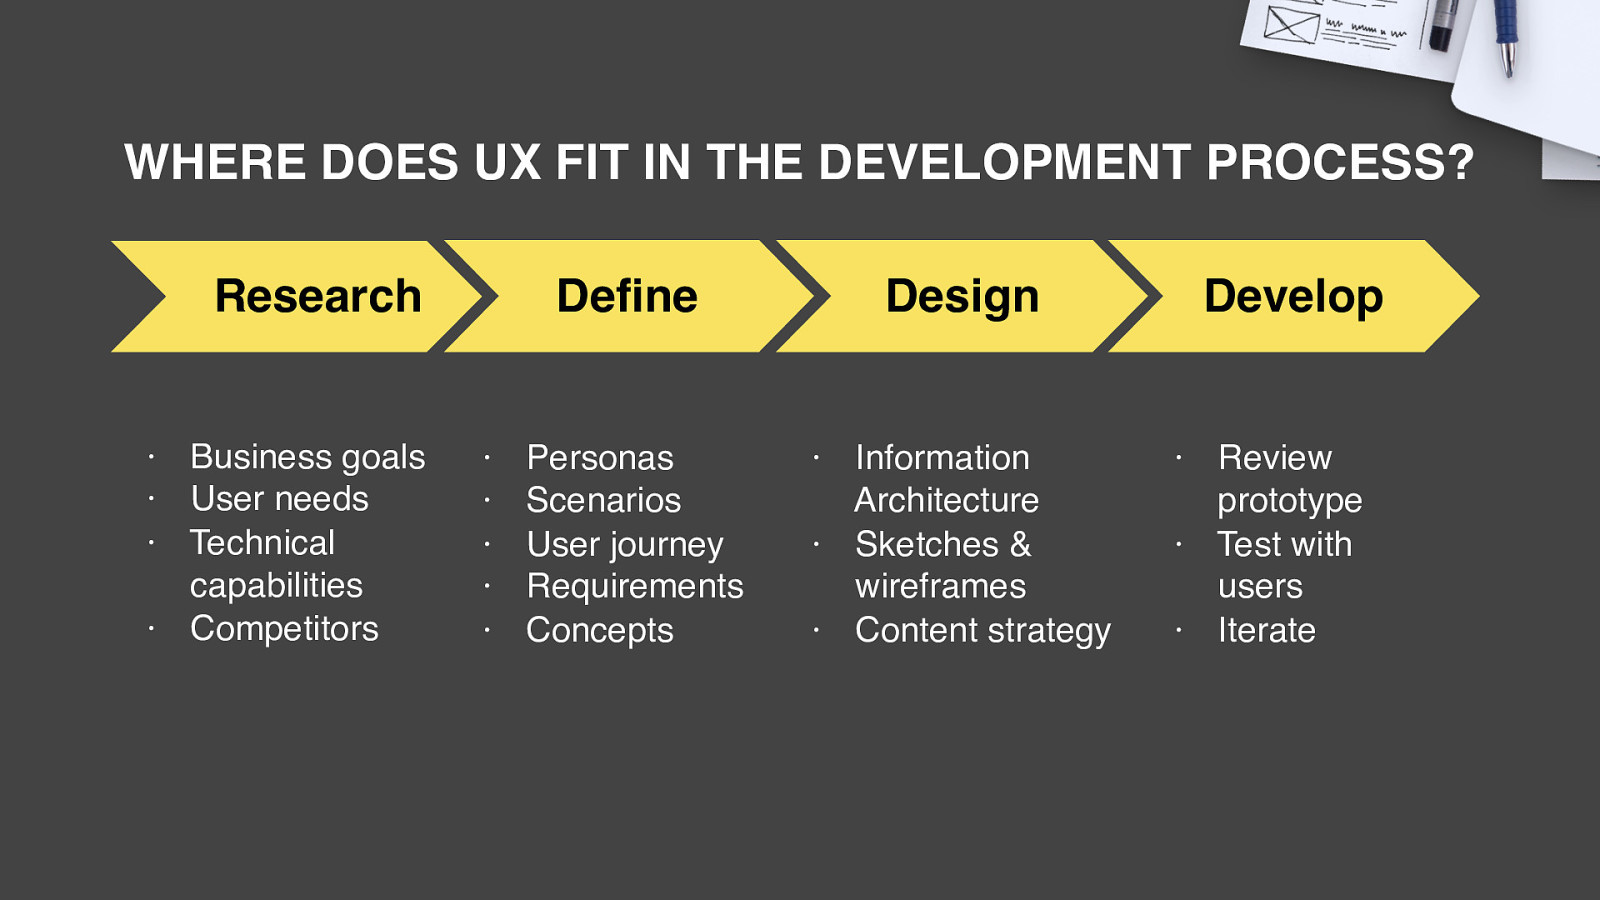
WHERE DOES UX FIT IN THE DEVELOPMENT PROCESS? Research · Business goals · User needs · Technical capabilities · Competitors · · · · · Define Design Personas Scenarios User journey Requirements Concepts · Information Architecture · Sketches & wireframes · Content strategy Develop · Review prototype · Test with users · Iterate
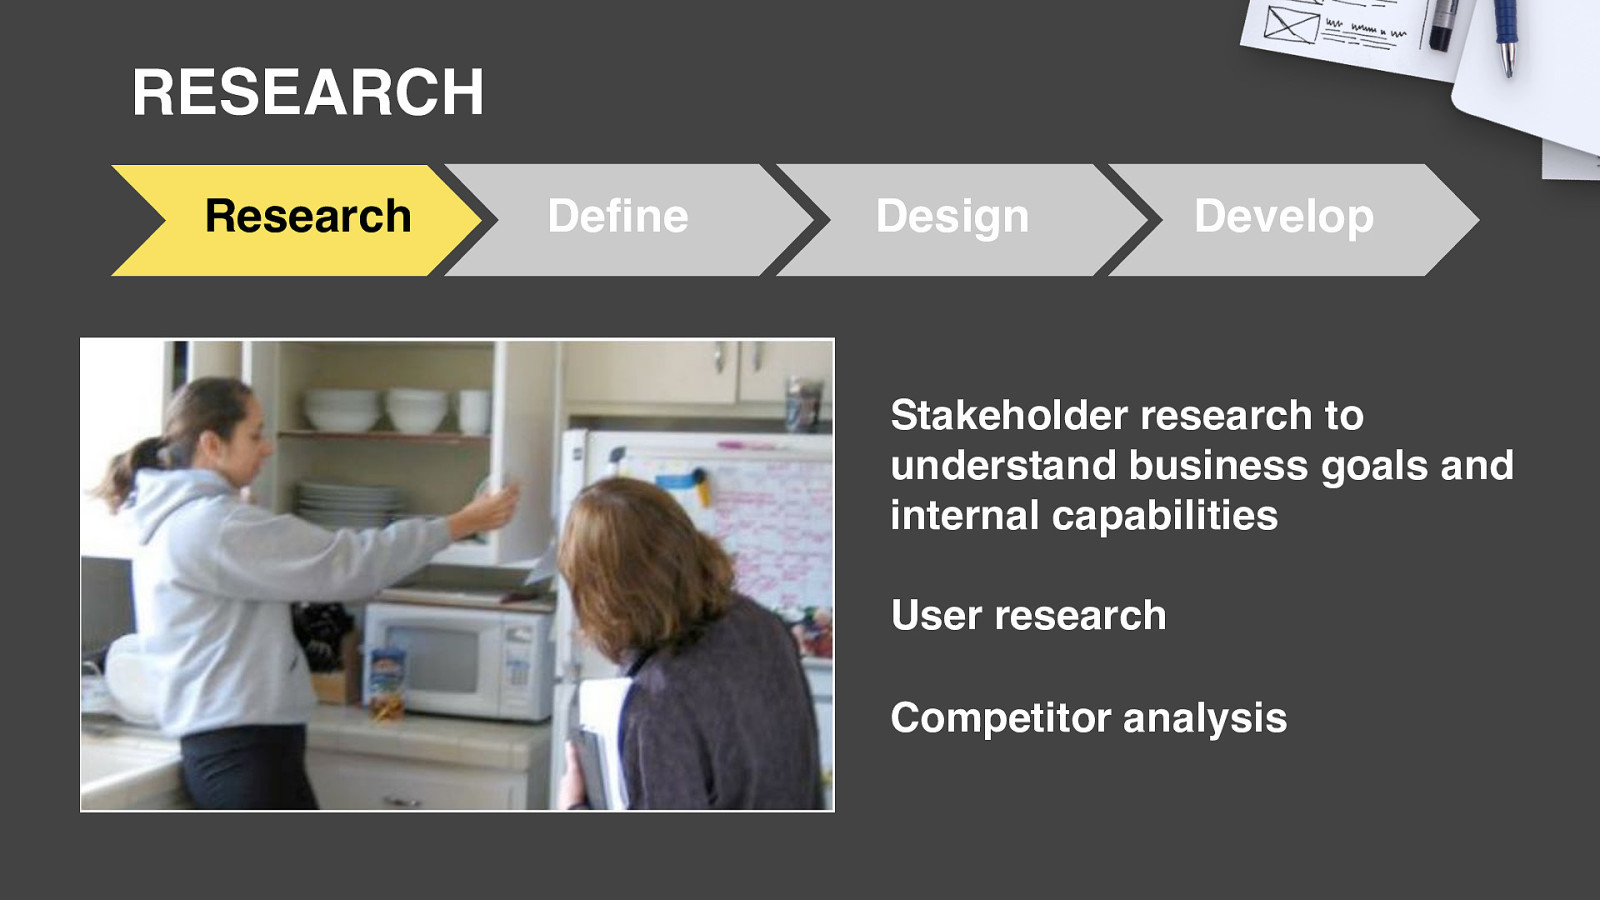
RESEARCH Research Define Design Develop Stakeholder research to understand business goals and internal capabilities User research Competitor analysis
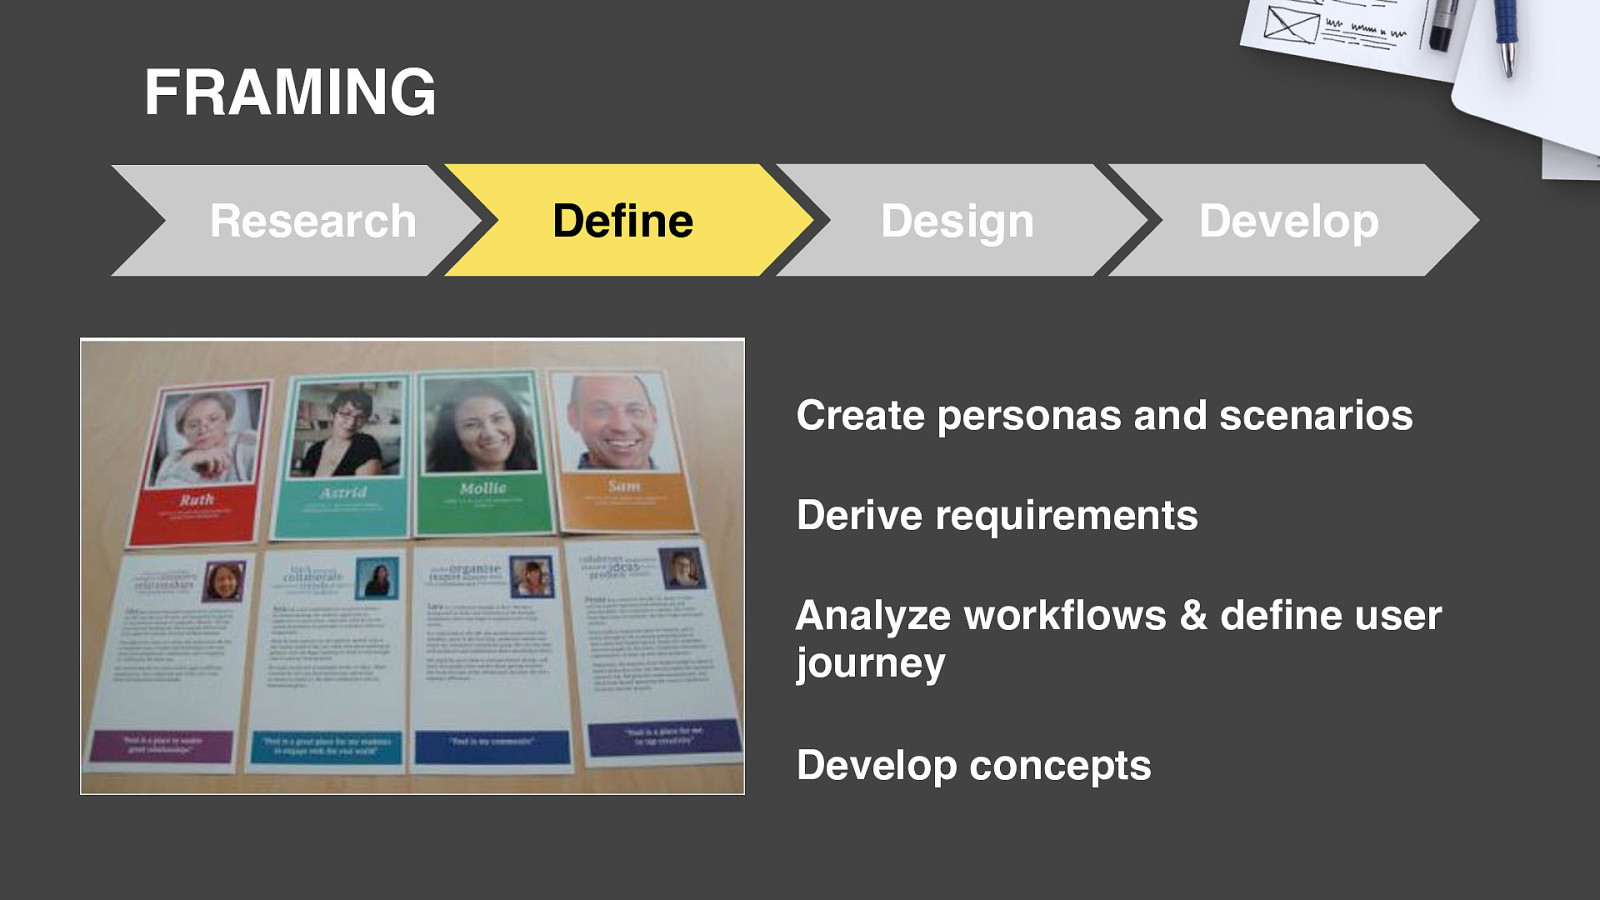
FRAMING Research Define Design Develop Create personas and scenarios Derive requirements Analyze workflows & define user journey Develop concepts
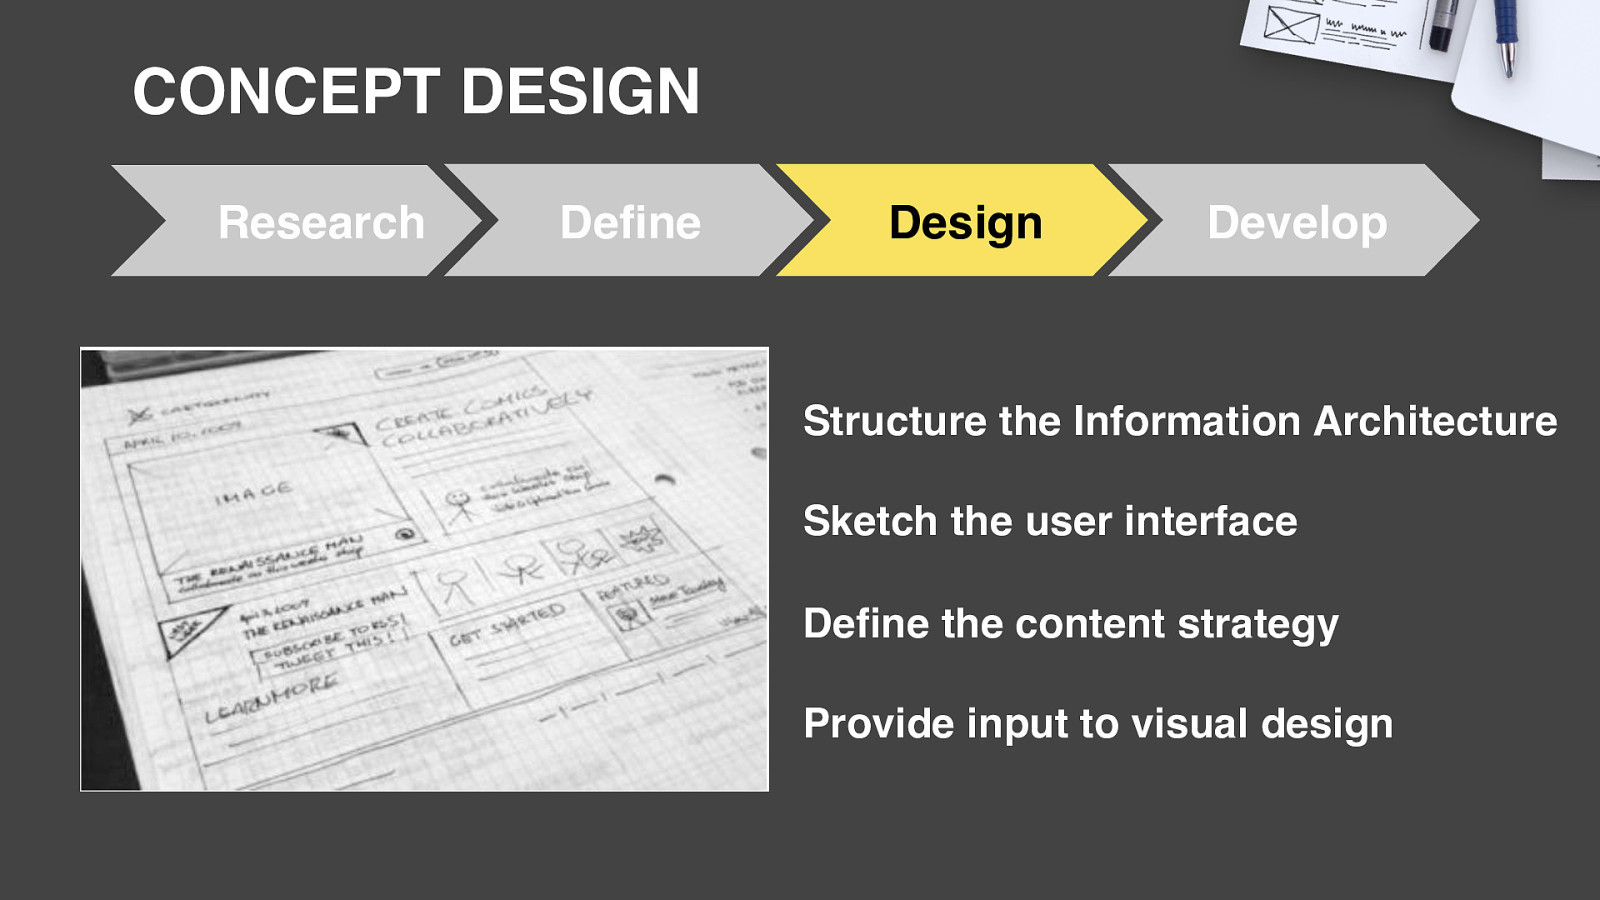
CONCEPT DESIGN Research Define Design Develop Structure the Information Architecture Sketch the user interface Define the content strategy Provide input to visual design
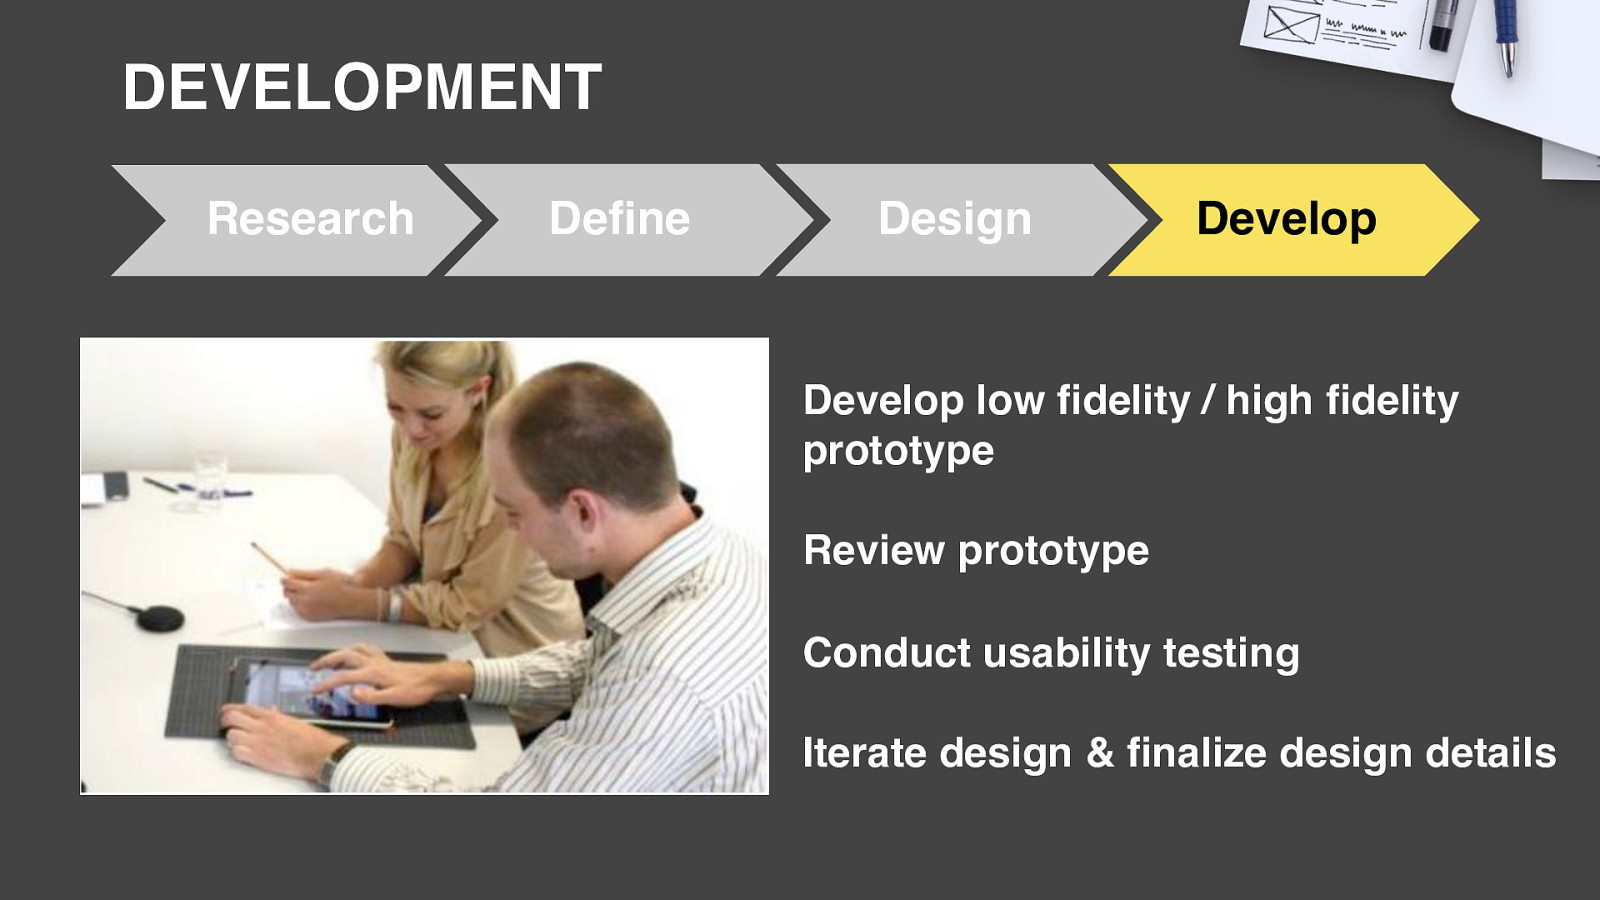
DEVELOPMENT Research Define Design Develop Develop low fidelity / high fidelity prototype Review prototype Conduct usability testing Iterate design & finalize design details
This applies to almost any type of UX work, with a varying degree of intensity =
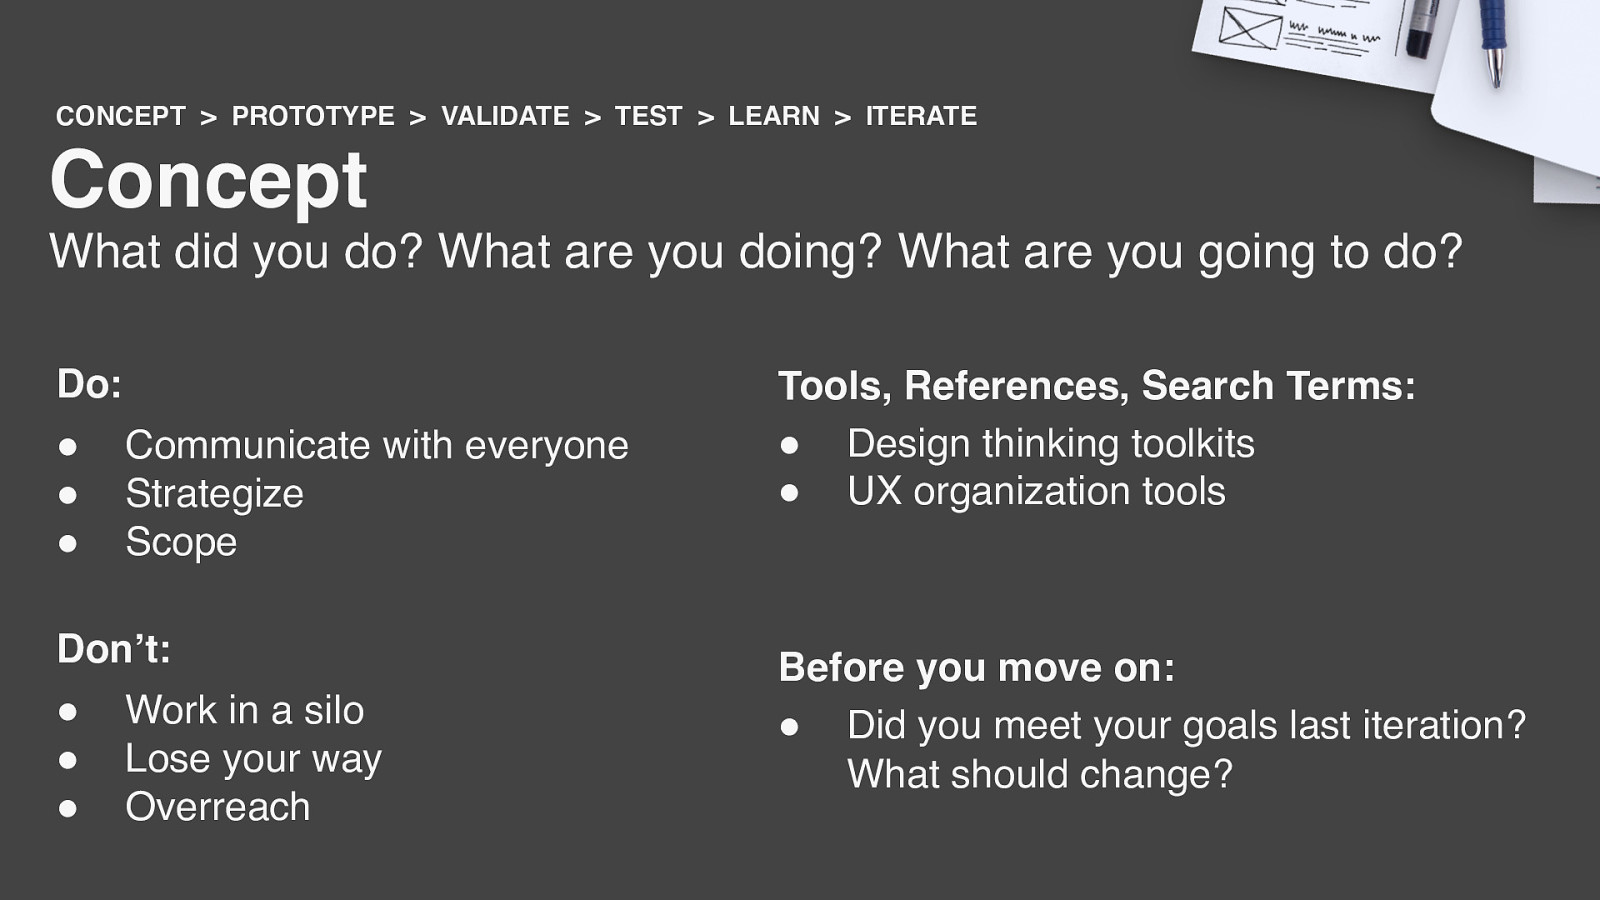
CONCEPT > PROTOTYPE > VALIDATE > TEST > LEARN > ITERATE Concept What did you do? What are you doing? What are you going to do? Do: ” ” ” Communicate with everyone Strategize Scope Don’t: ” ” ” Work in a silo Lose your way Overreach Tools, References, Search Terms: ” Design thinking toolkits ” UX organization tools Before you move on: ” Did you meet your goals last iteration? What should change?
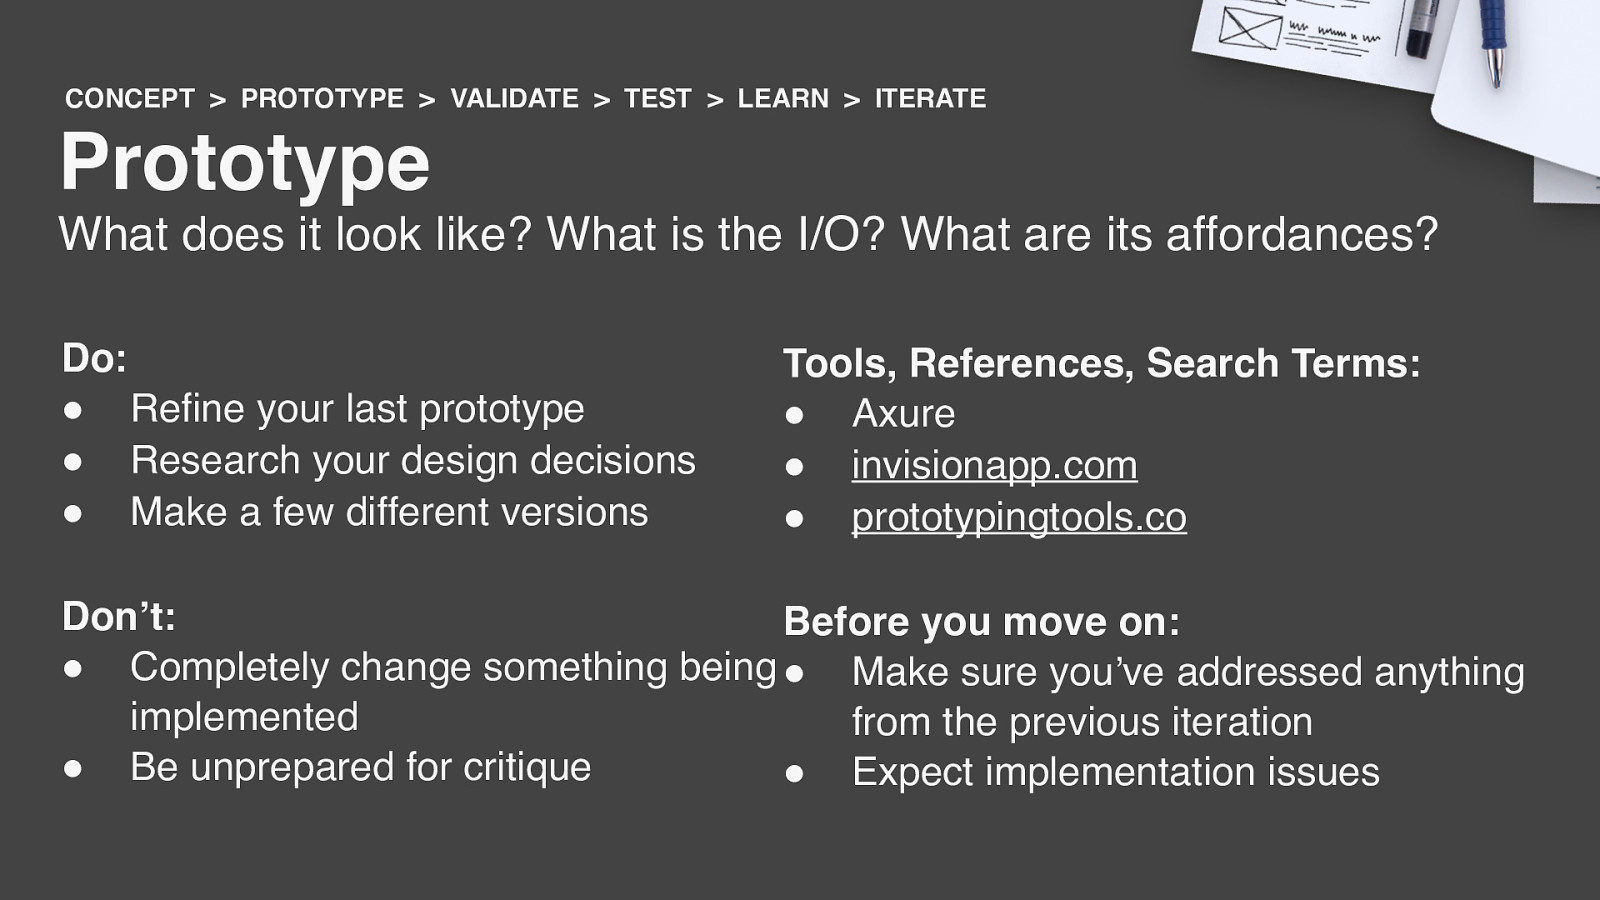
CONCEPT > PROTOTYPE > VALIDATE > TEST > LEARN > ITERATE Prototype What does it look like? What is the I/O? What are its affordances? Do: ” Refine your last prototype ” Research your design decisions ” Make a few different versions Tools, References, Search Terms: ” Axure ” invisionapp.com ” prototypingtools.co Don’t: Before you move on: ” Completely change something being ” Make sure you’ve addressed anything implemented from the previous iteration ” Be unprepared for critique ” Expect implementation issues
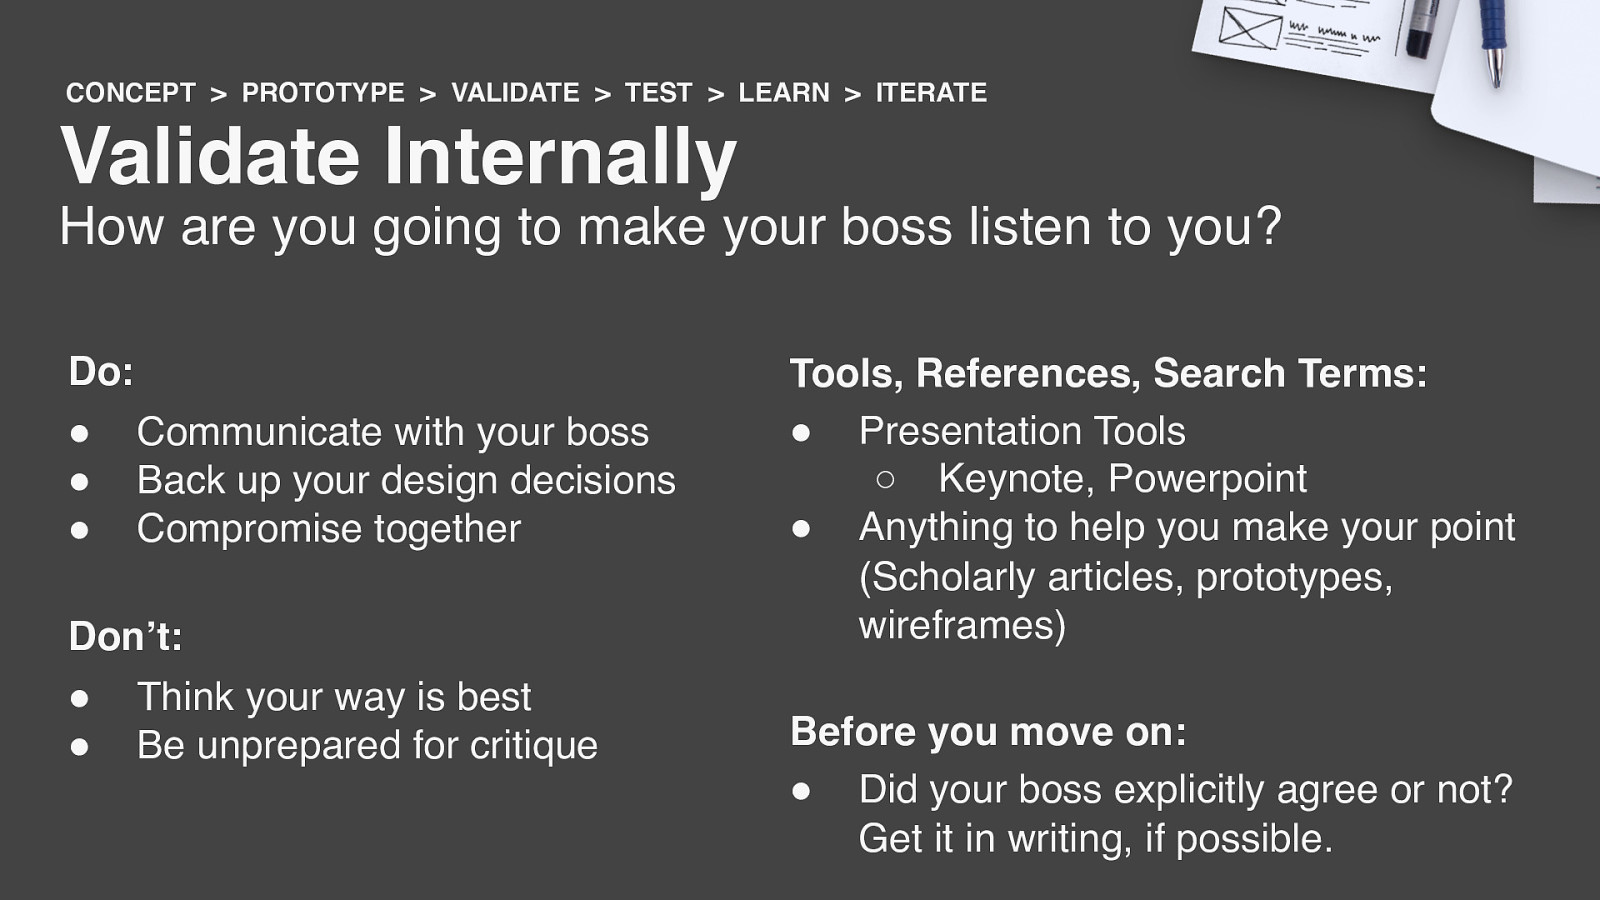
CONCEPT > PROTOTYPE > VALIDATE > TEST > LEARN > ITERATE Validate Internally How are you going to make your boss listen to you? Do: ” Communicate with your boss ” Back up your design decisions ” Compromise together Don’t: ” Think your way is best ” Be unprepared for critique Tools, References, Search Terms: ” Presentation Tools ○ Keynote, Powerpoint ” Anything to help you make your point (Scholarly articles, prototypes, wireframes) Before you move on: ” Did your boss explicitly agree or not? Get it in writing, if possible.
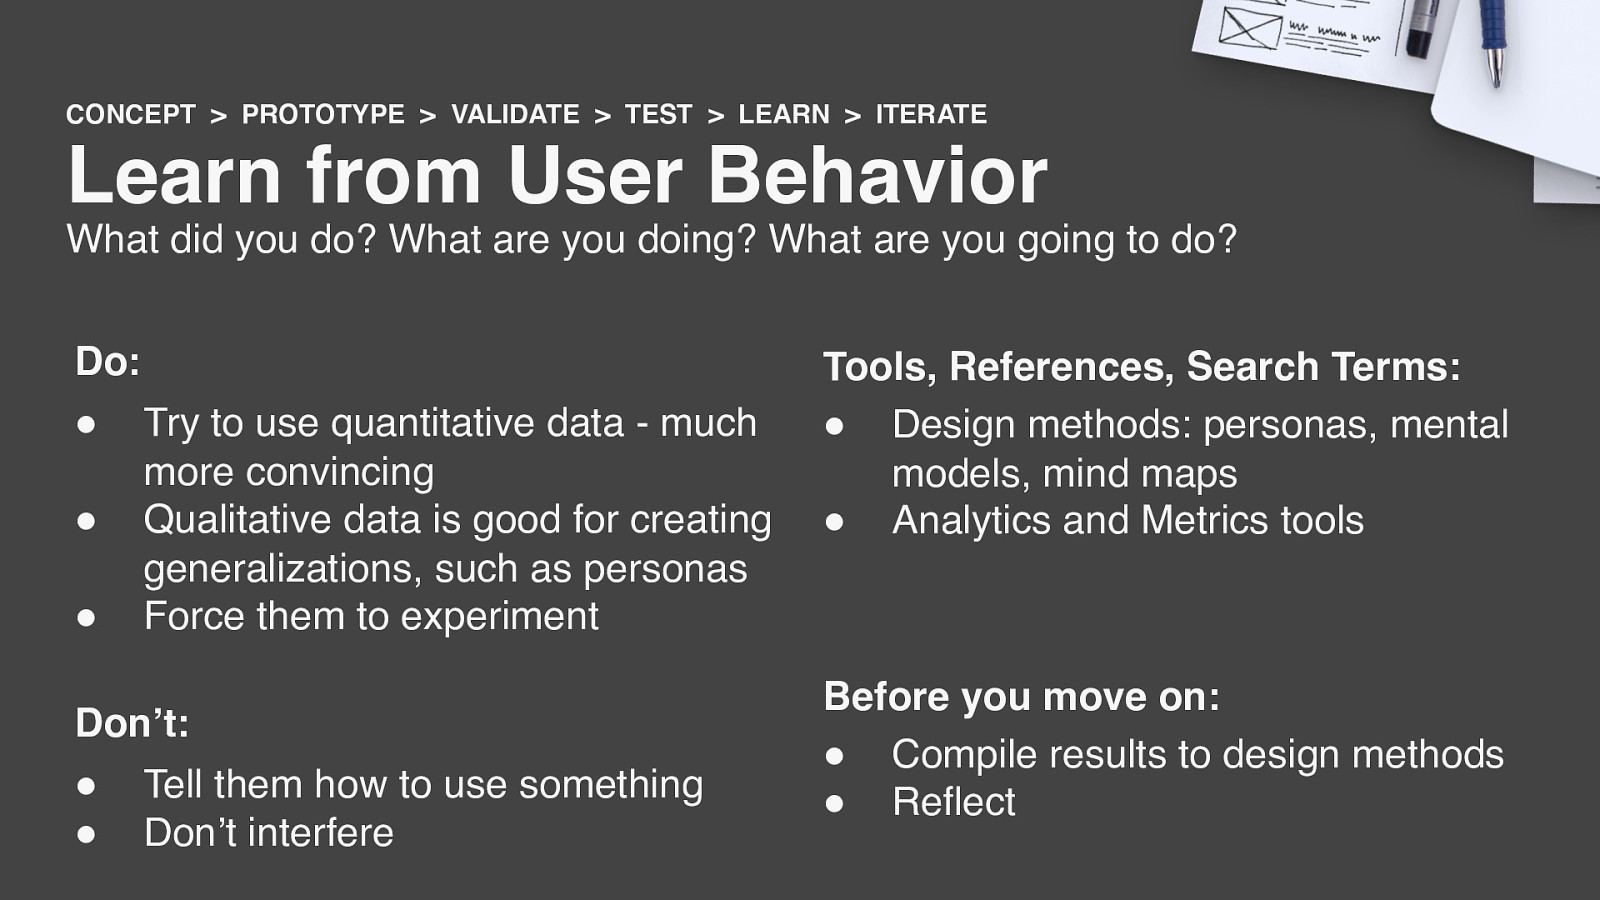
CONCEPT > PROTOTYPE > VALIDATE > TEST > LEARN > ITERATE Learn from User Behavior What did you do? What are you doing? What are you going to do? Do: ” ” ” Try to use quantitative data - much more convincing Qualitative data is good for creating generalizations, such as personas Force them to experiment Don’t: ” ” Tell them how to use something Don’t interfere Tools, References, Search Terms: ” Design methods: personas, mental models, mind maps ” Analytics and Metrics tools Before you move on: ” Compile results to design methods ” Reflect
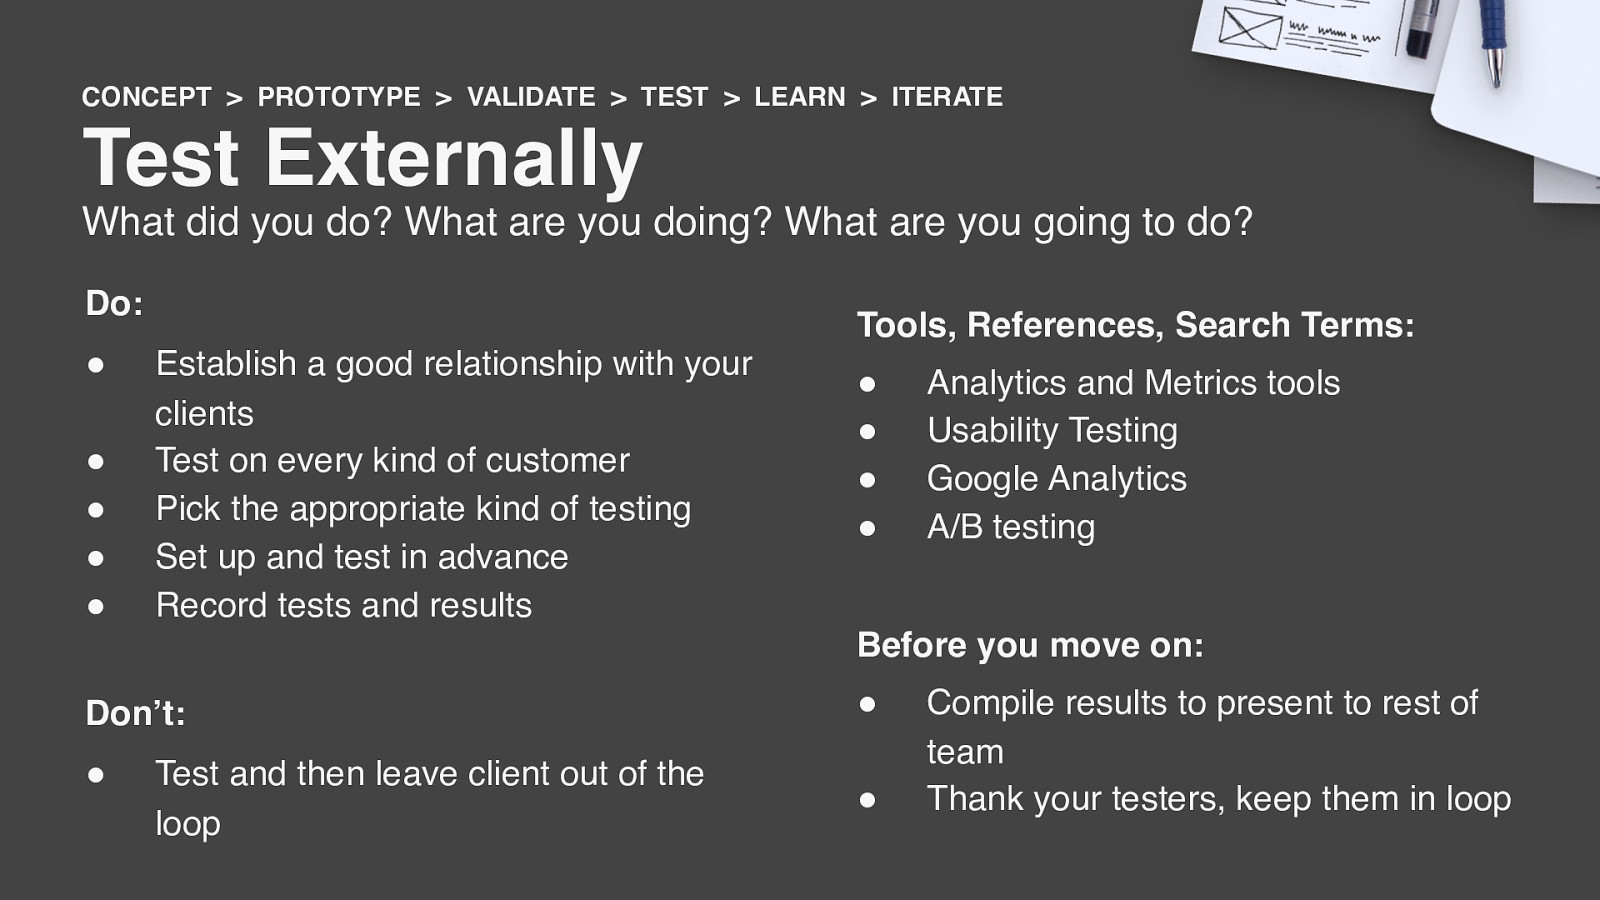
CONCEPT > PROTOTYPE > VALIDATE > TEST > LEARN > ITERATE Test Externally What did you do? What are you doing? What are you going to do? Do: ” ” ” ” ” Tools, References, Search Terms: Establish a good relationship with your clients Test on every kind of customer Pick the appropriate kind of testing Set up and test in advance Record tests and results ” ” ” ” Analytics and Metrics tools Usability Testing Google Analytics A/B testing Before you move on: Don’t: ” Test and then leave client out of the loop ” ” Compile results to present to rest of team Thank your testers, keep them in loop
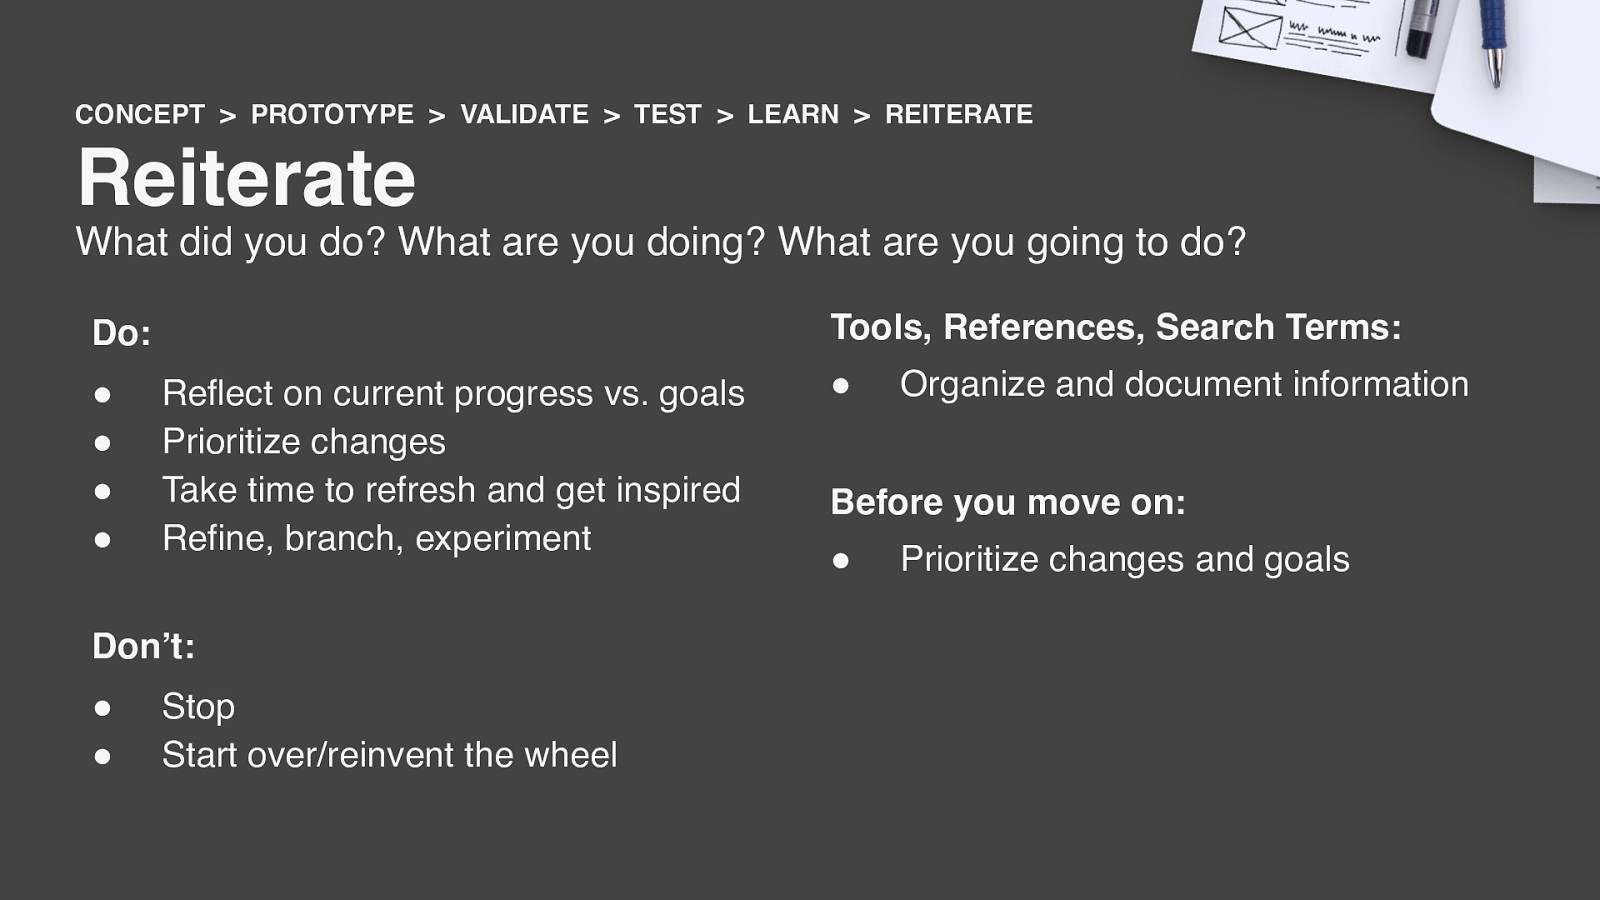
CONCEPT > PROTOTYPE > VALIDATE > TEST > LEARN > REITERATE Reiterate What did you do? What are you doing? What are you going to do? Tools, References, Search Terms: Do: ” ” ” ” Reflect on current progress vs. goals Prioritize changes Take time to refresh and get inspired Refine, branch, experiment Don’t: ” ” Stop Start over/reinvent the wheel ” Organize and document information Before you move on: ” Prioritize changes and goals
Sketching
Sketch + Brainstorming = Sketchstorming
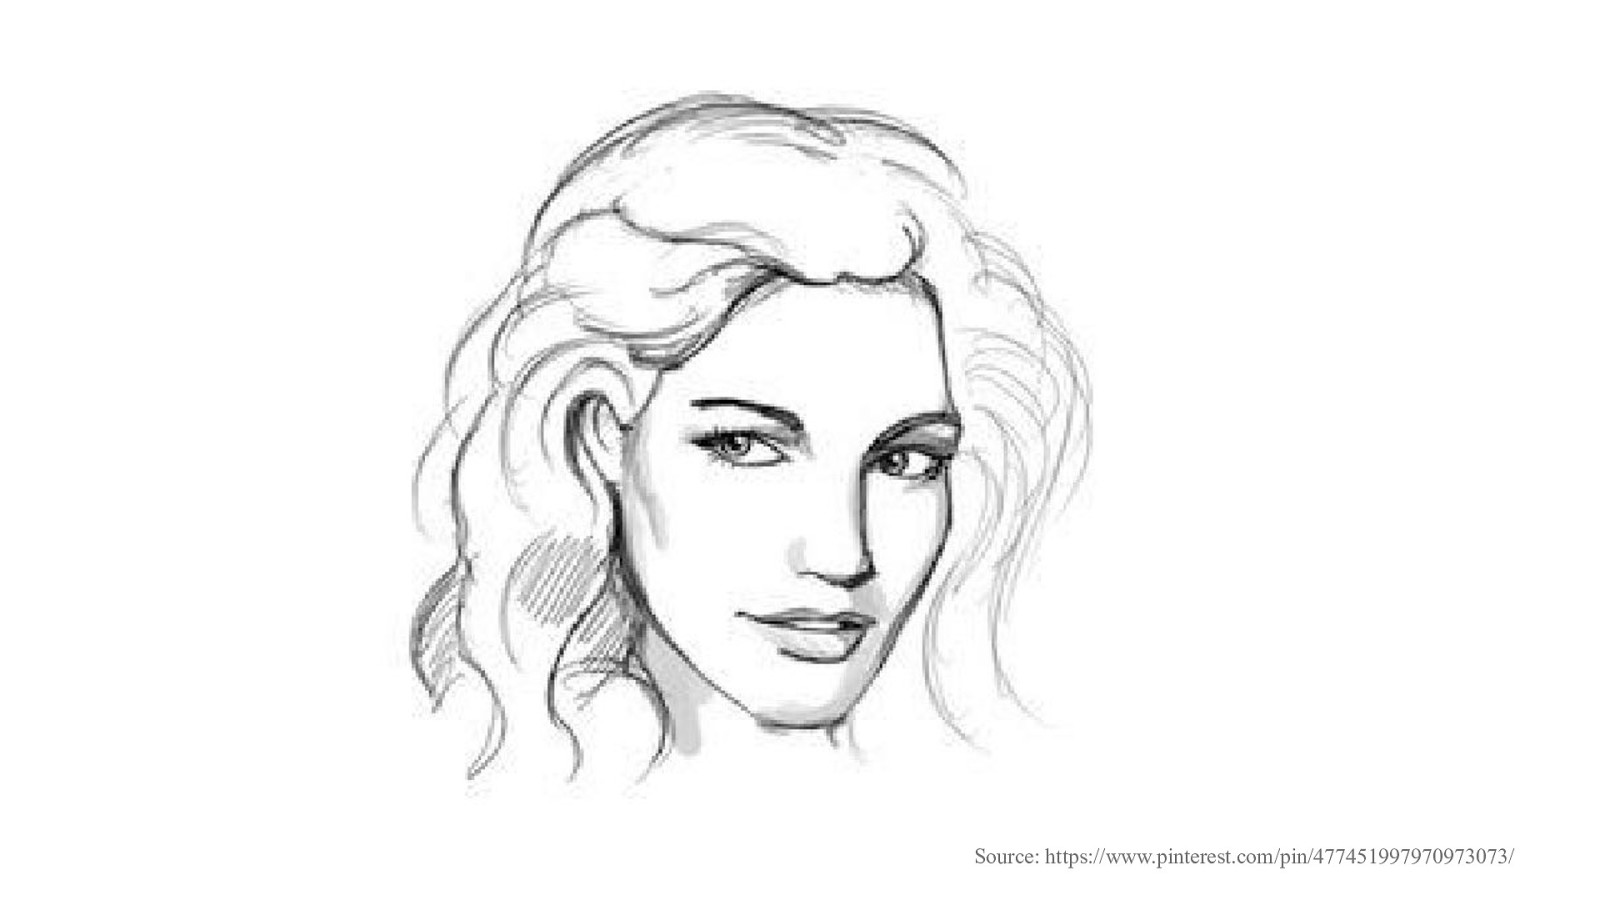
Source: https://www.pinterest.com/pin/477451997970973073/
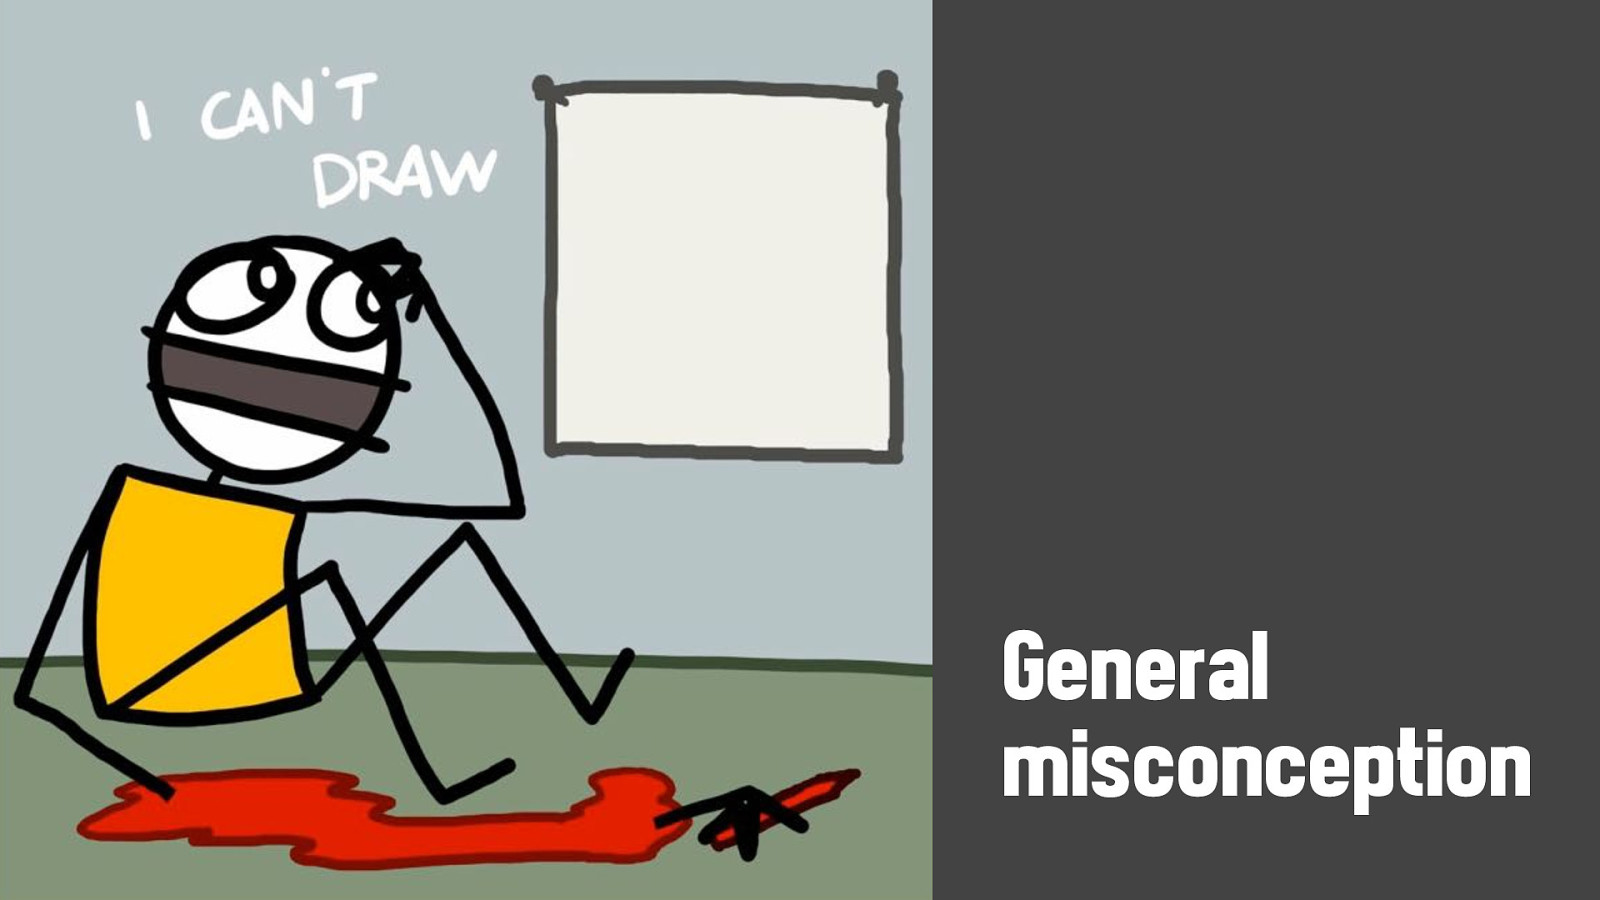
General misconception
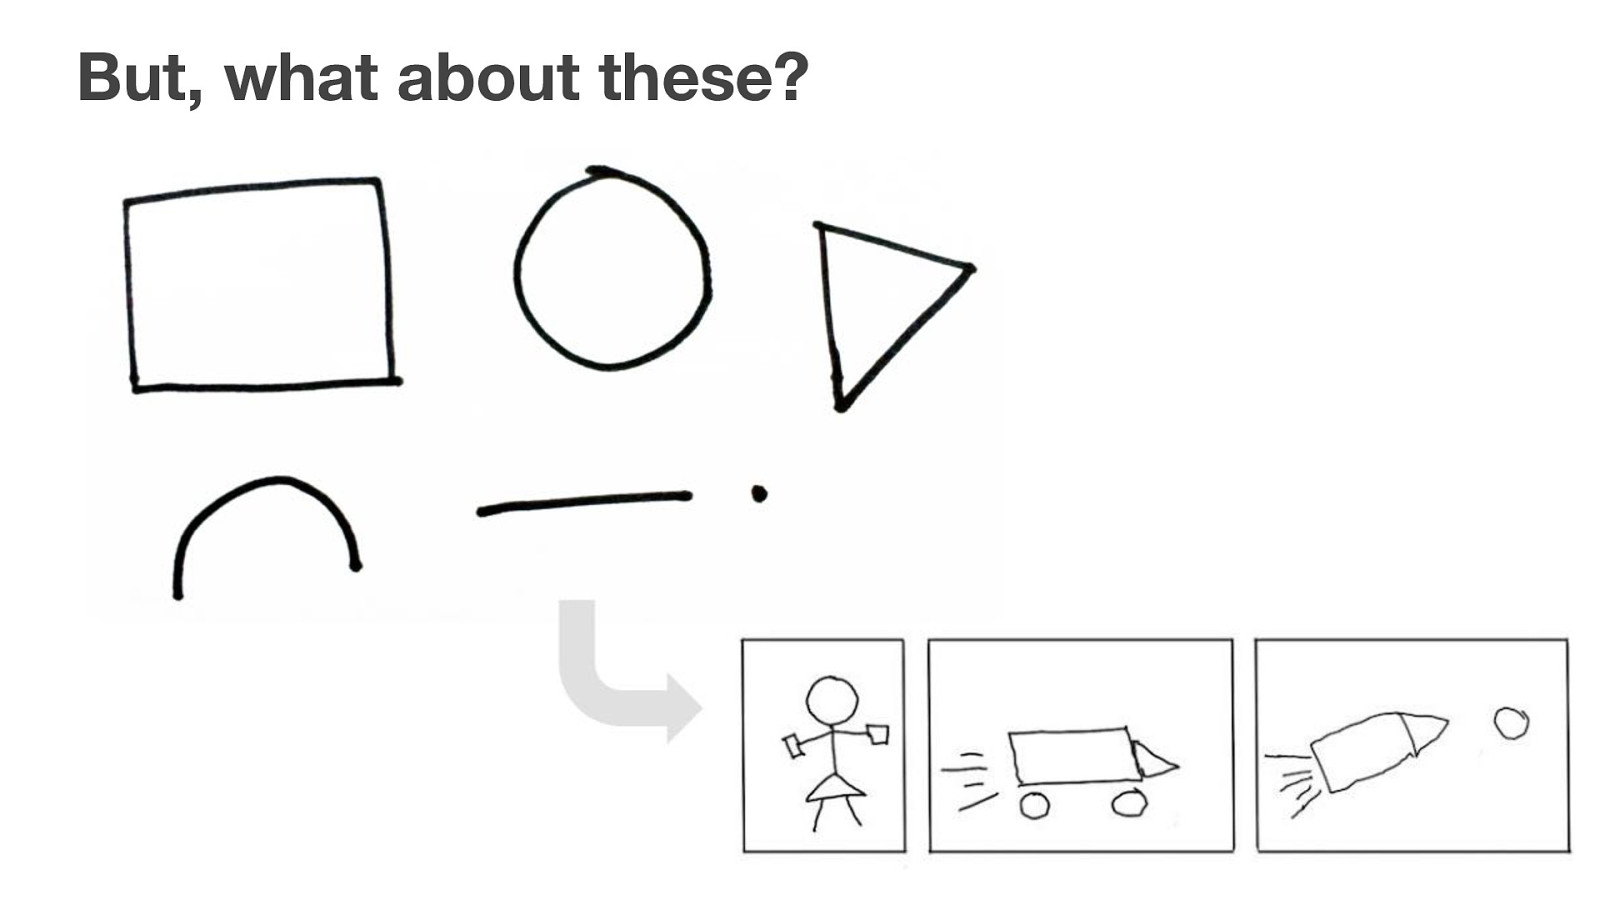
But, what about these?
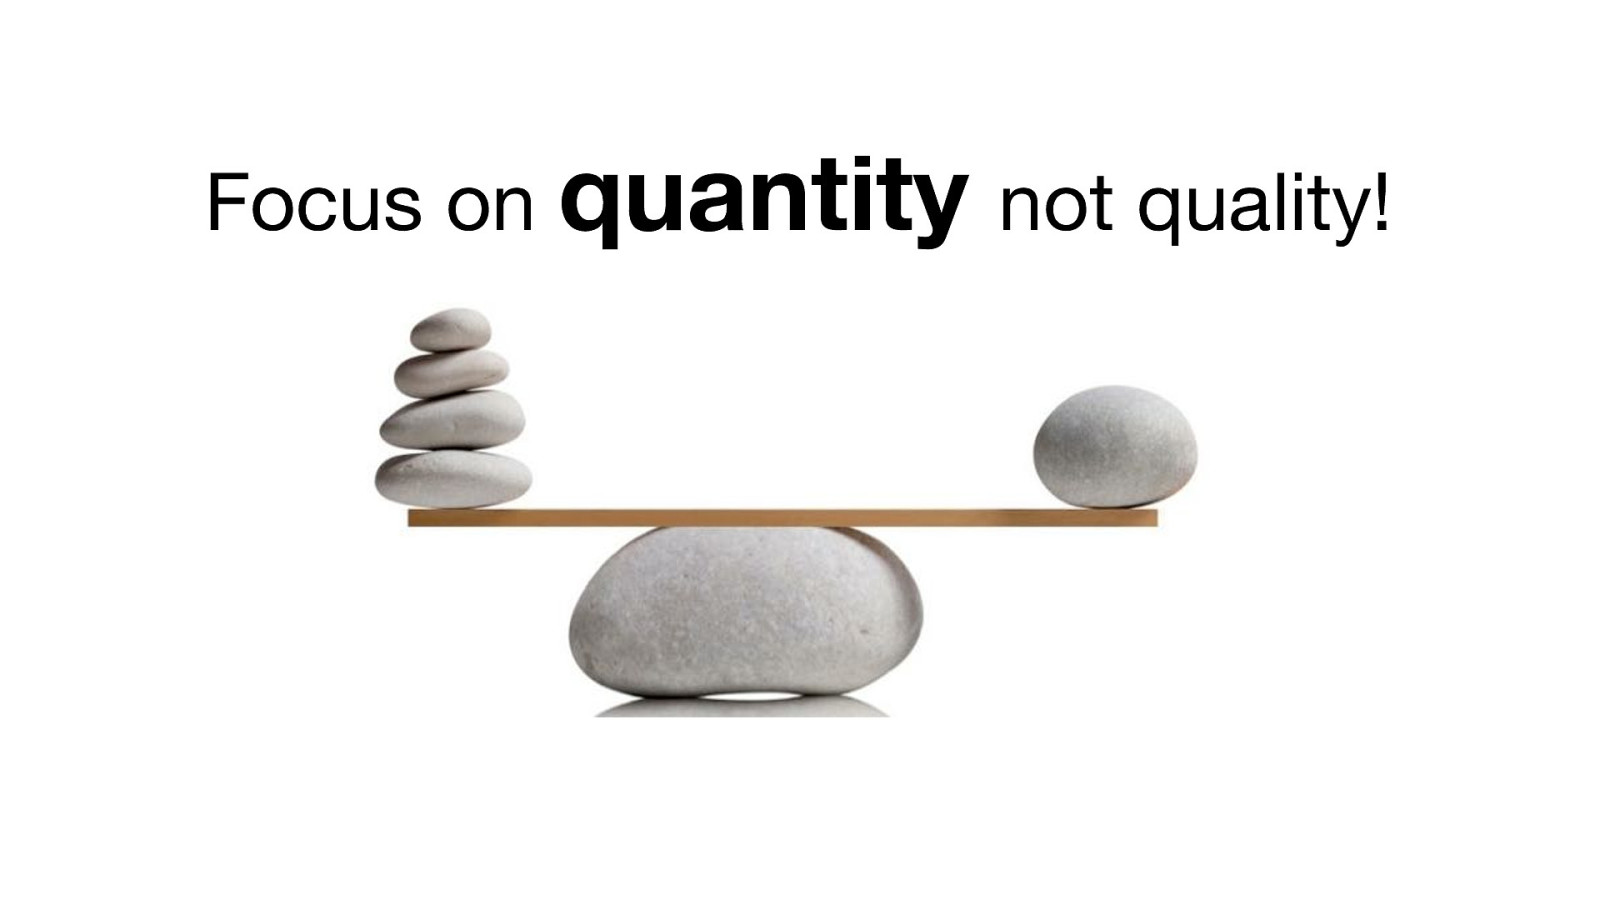
Focus on quantity not quality!
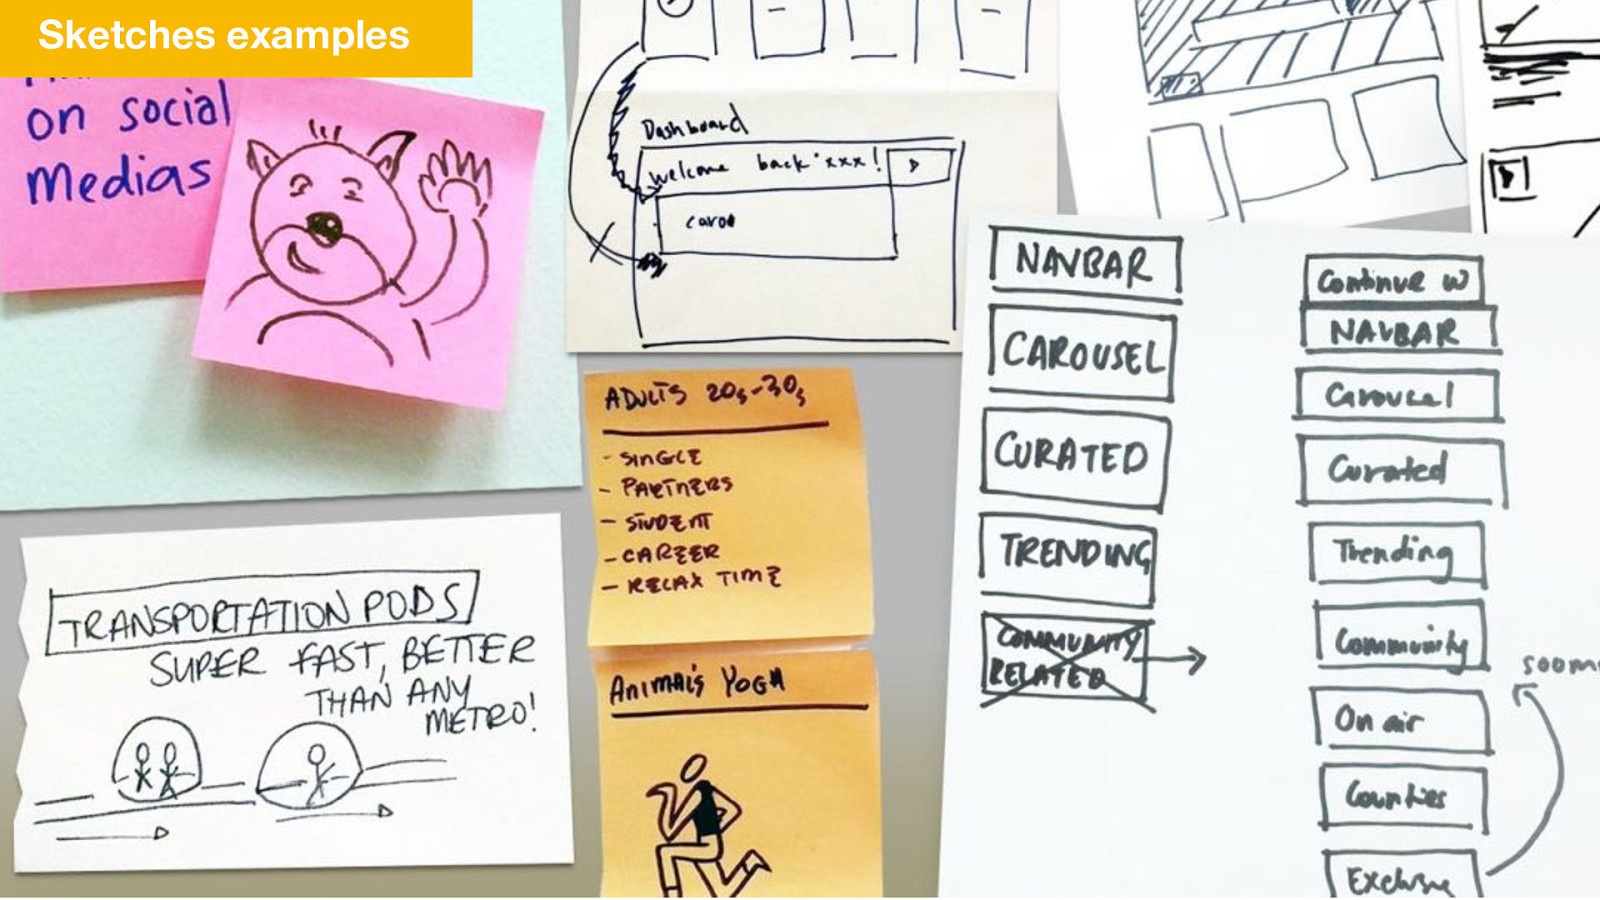
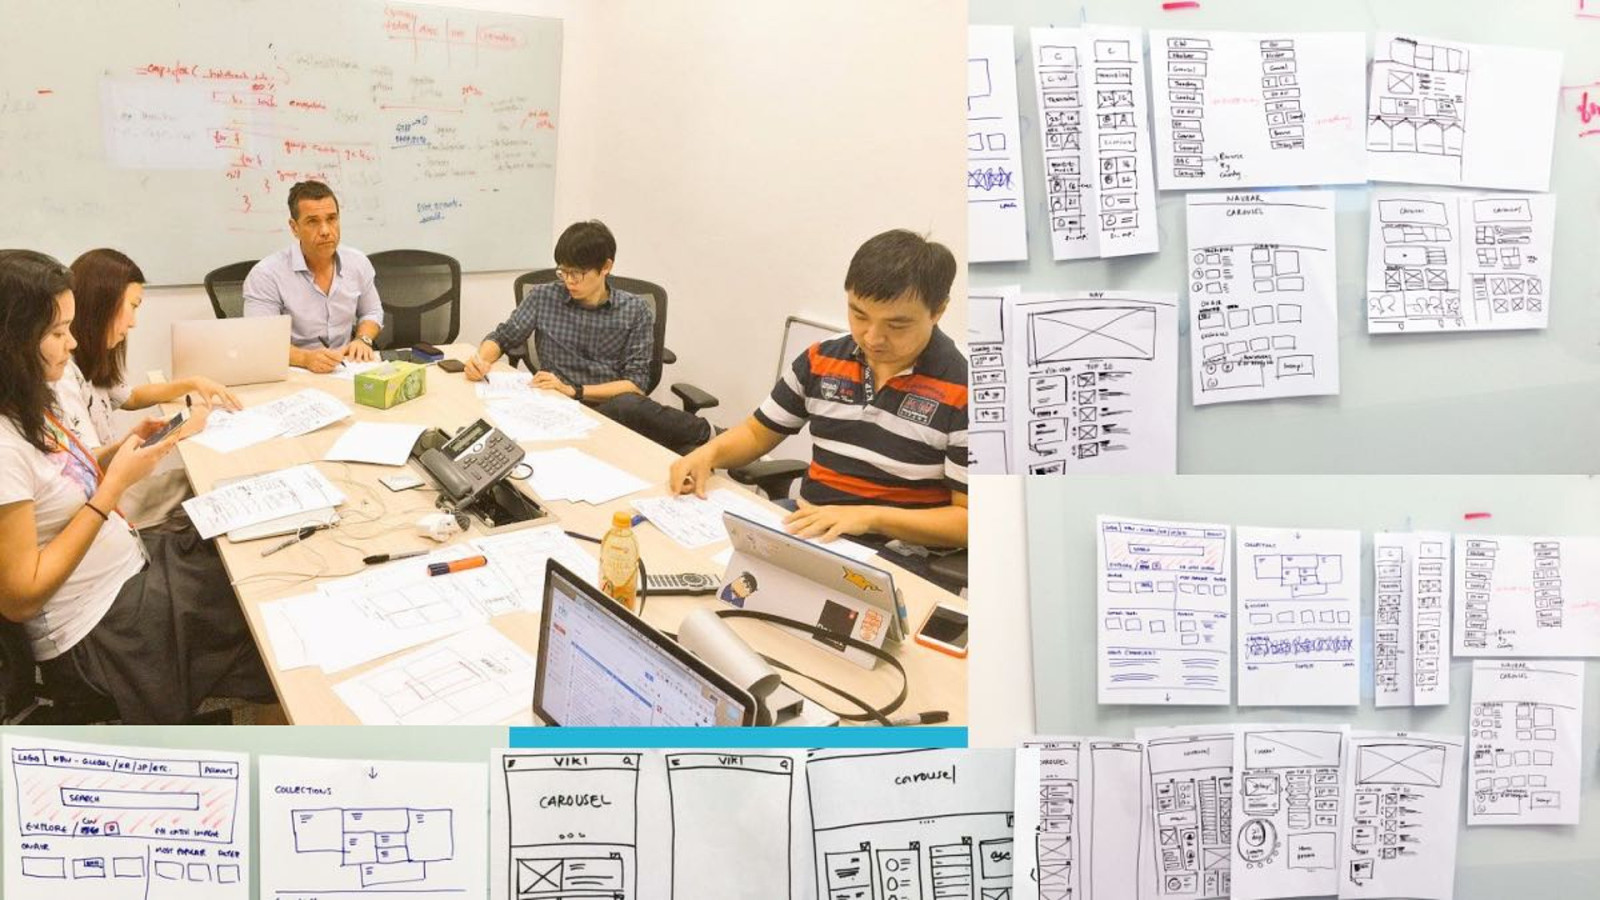
Sketches examples
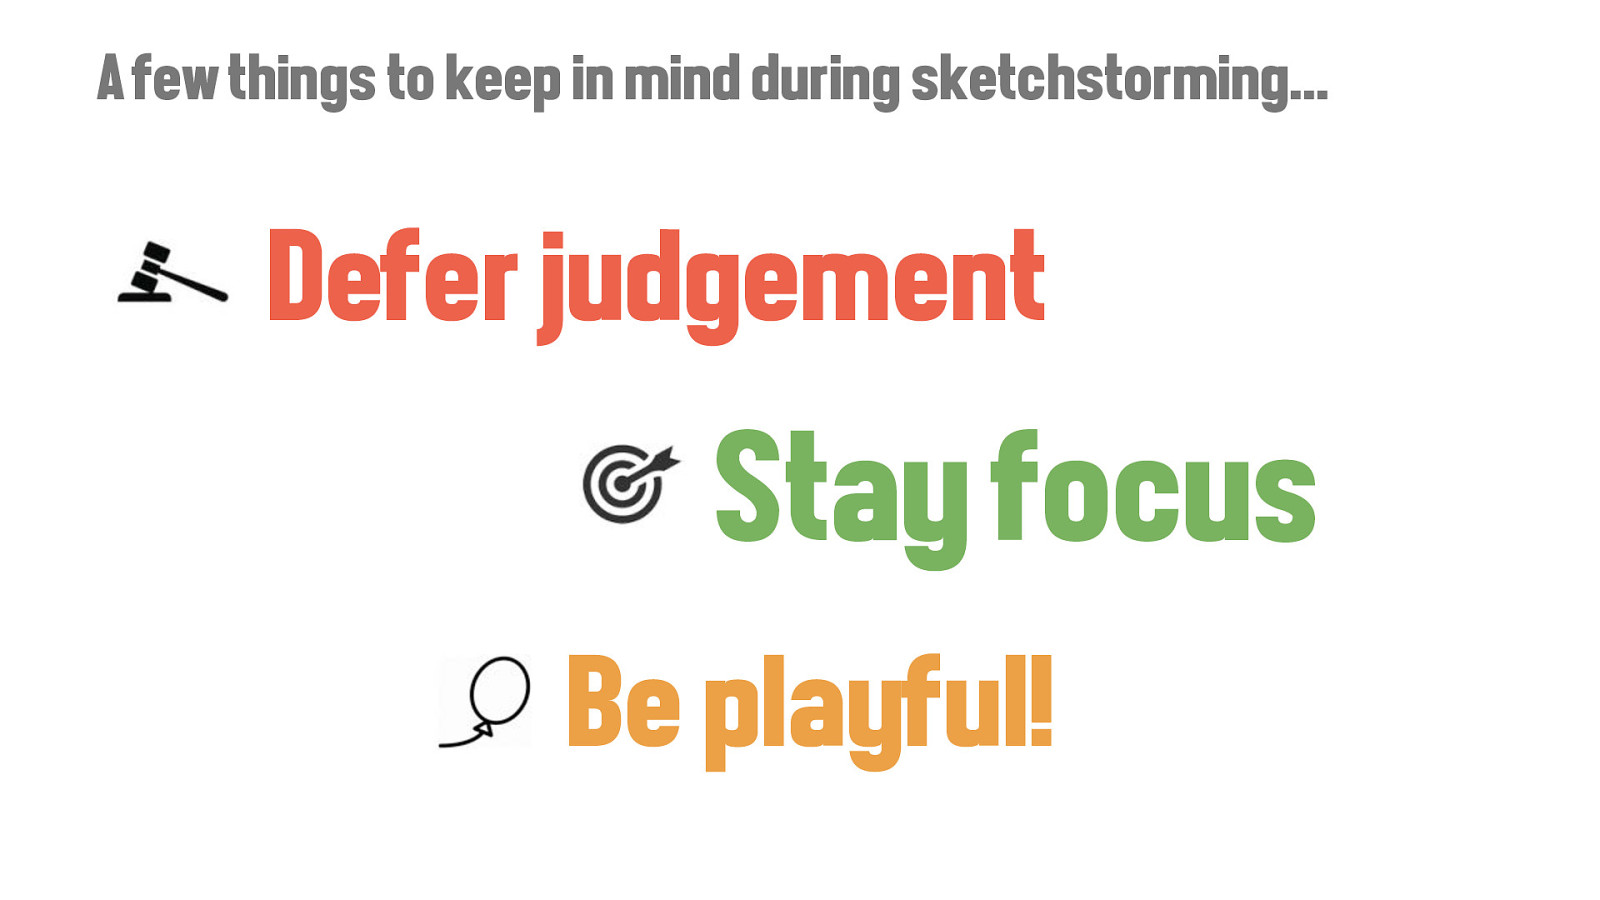
A few things to keep in mind during sketchstorming… Defer judgement Stay focus Be playful!
Activity: Sketch Warm-up Exercise 3 mins
Why are we doing this? To warm up your inner creativity by turning blank shapes into recognizable objects. To build your fluency (speed) and flexibility in ideation process.
Rapid Prototyping

What is prototype?
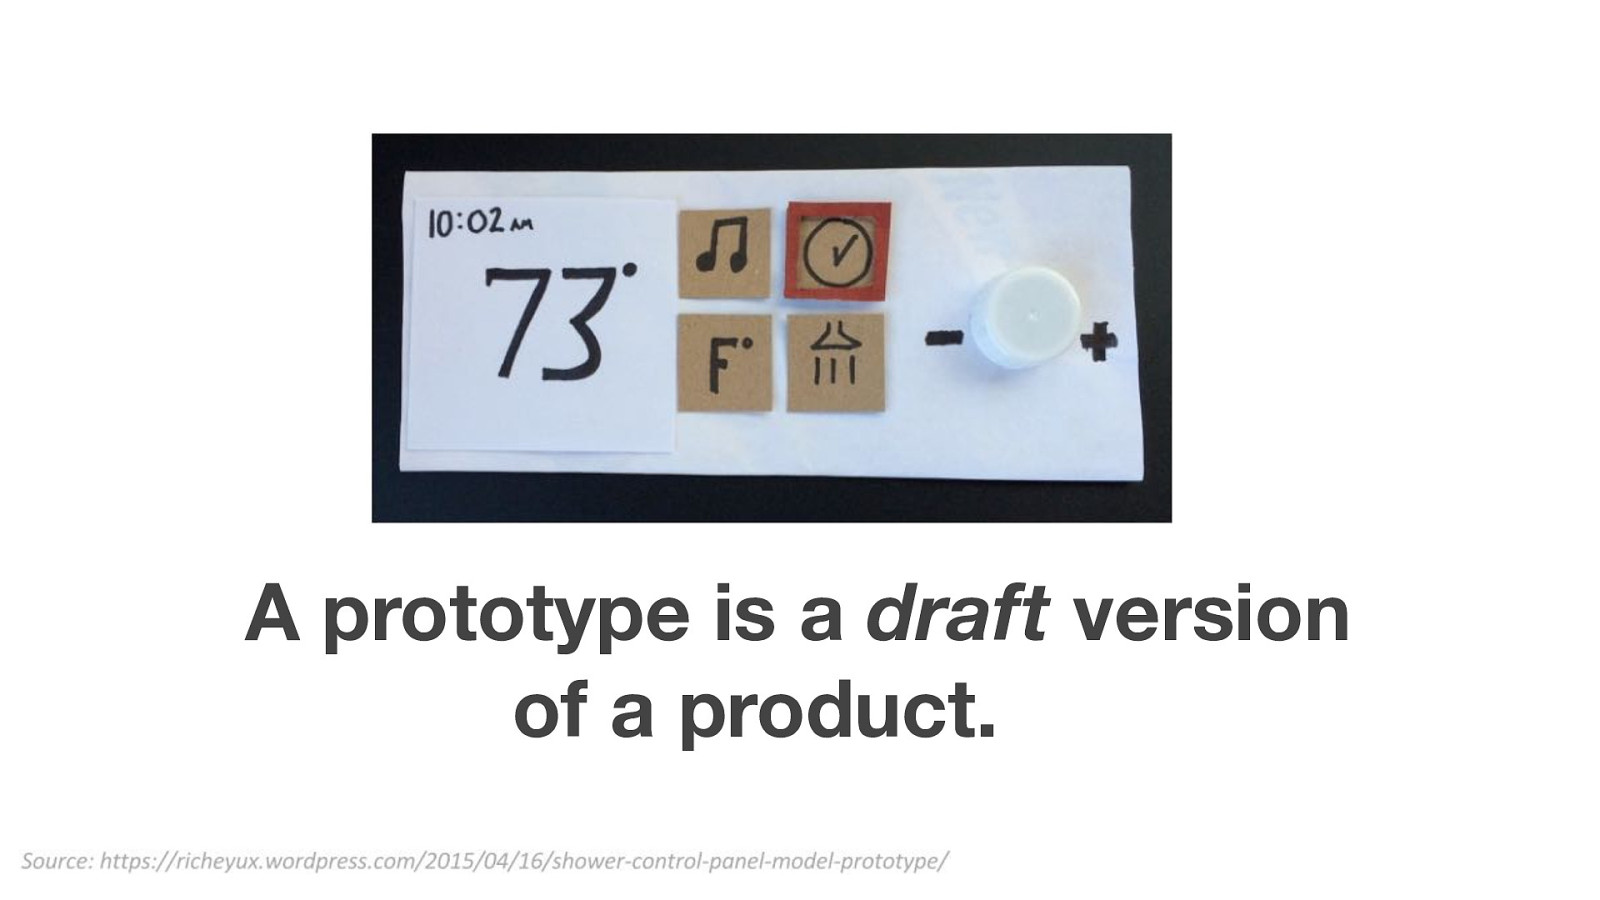
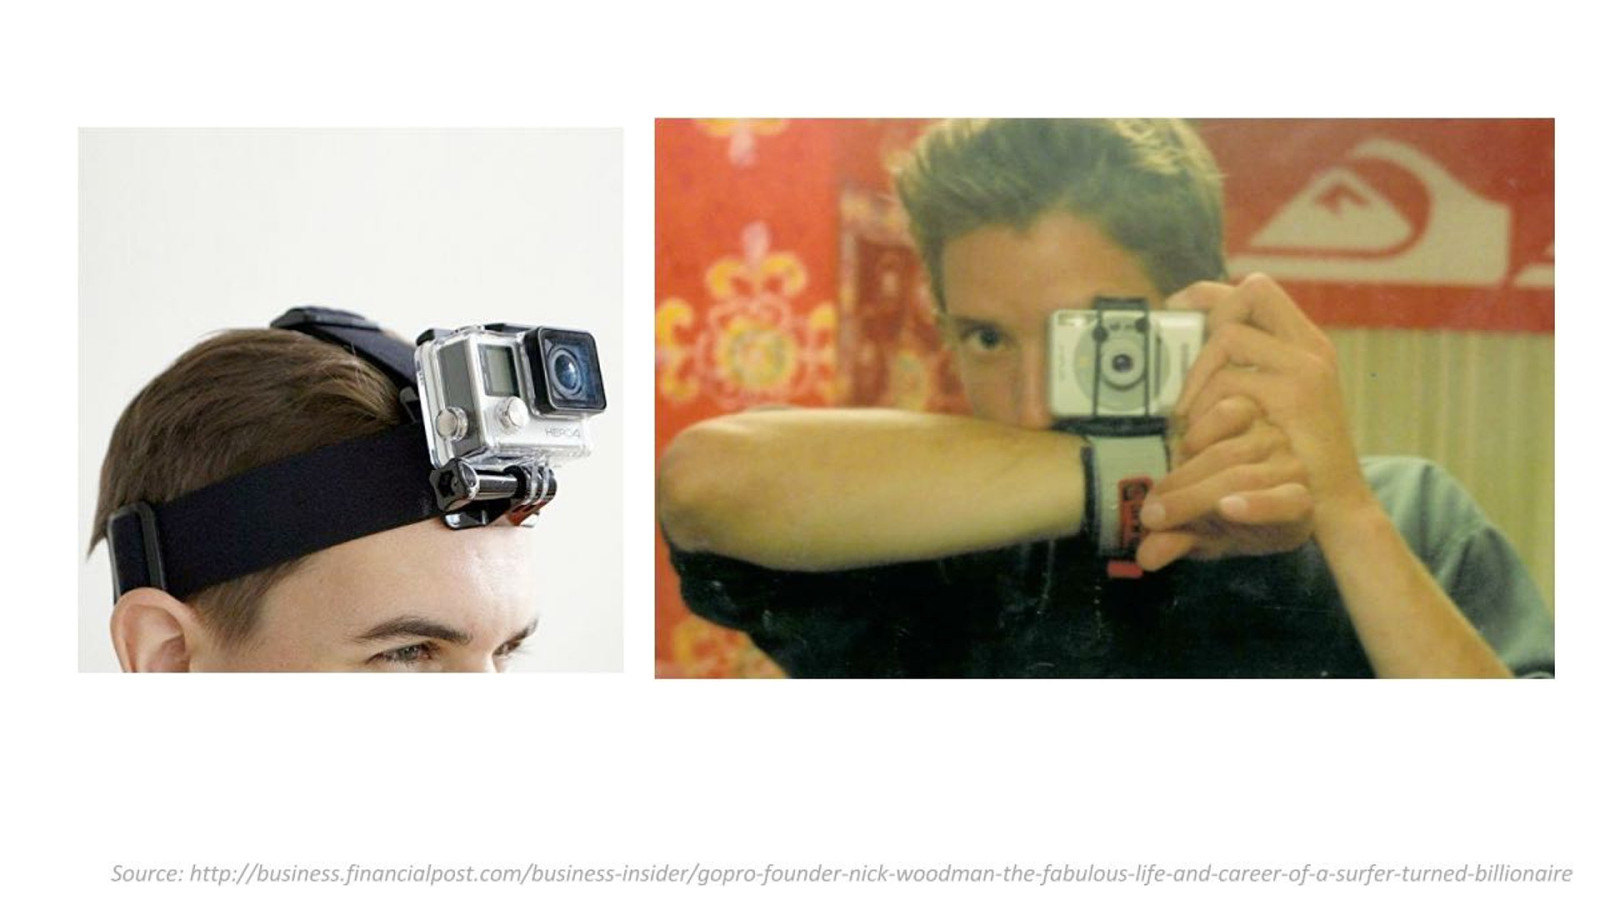
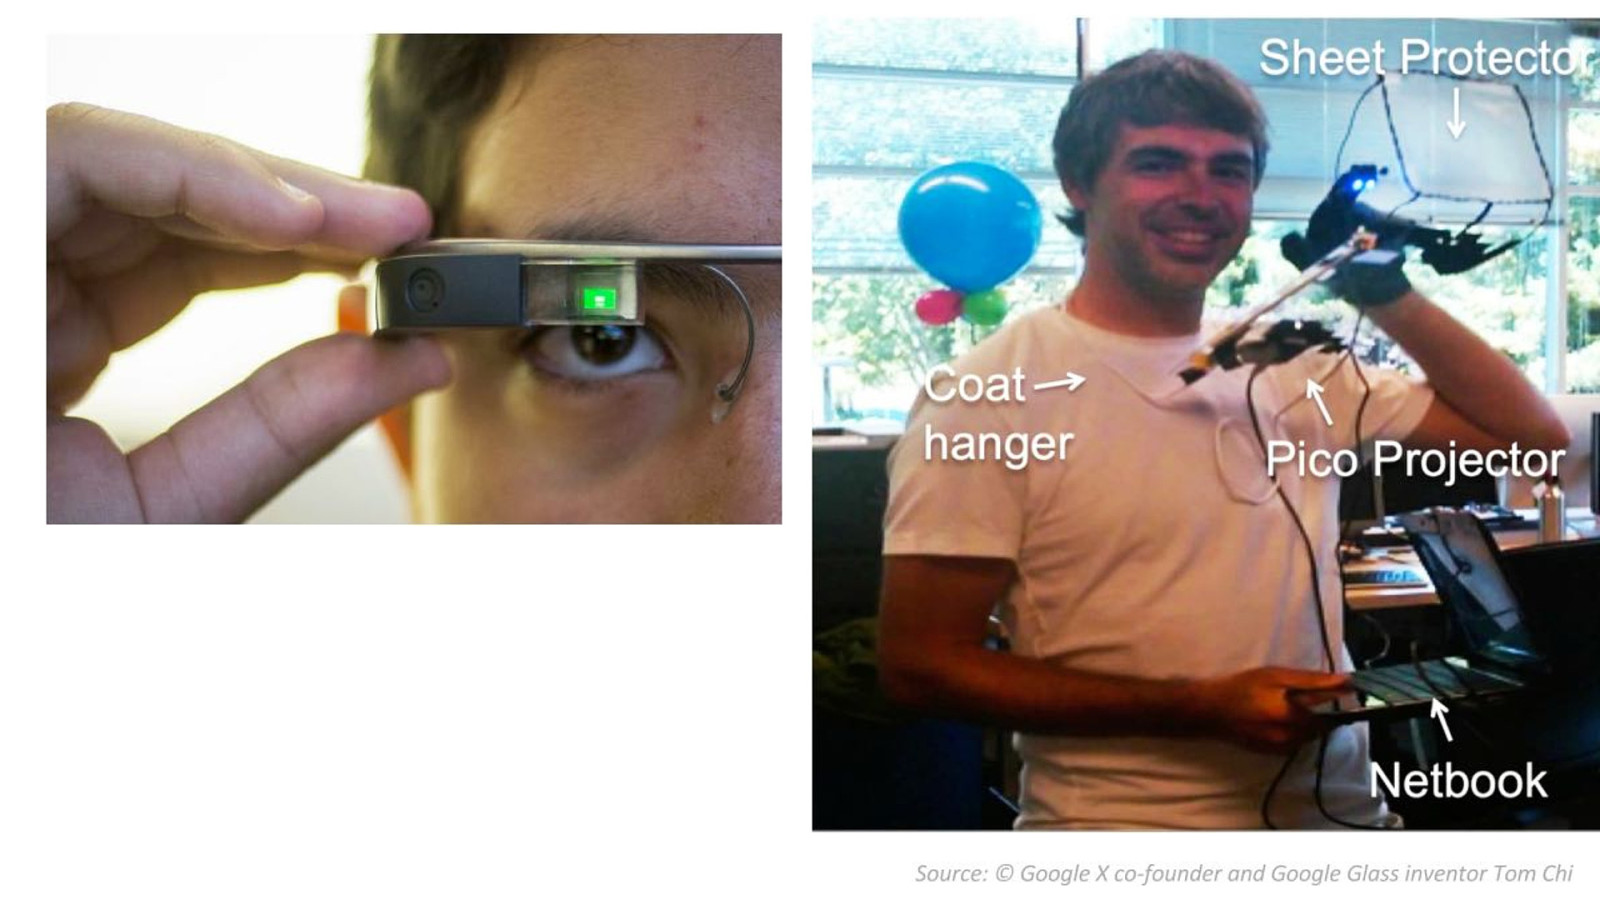
A prototype is a draft version of a product.
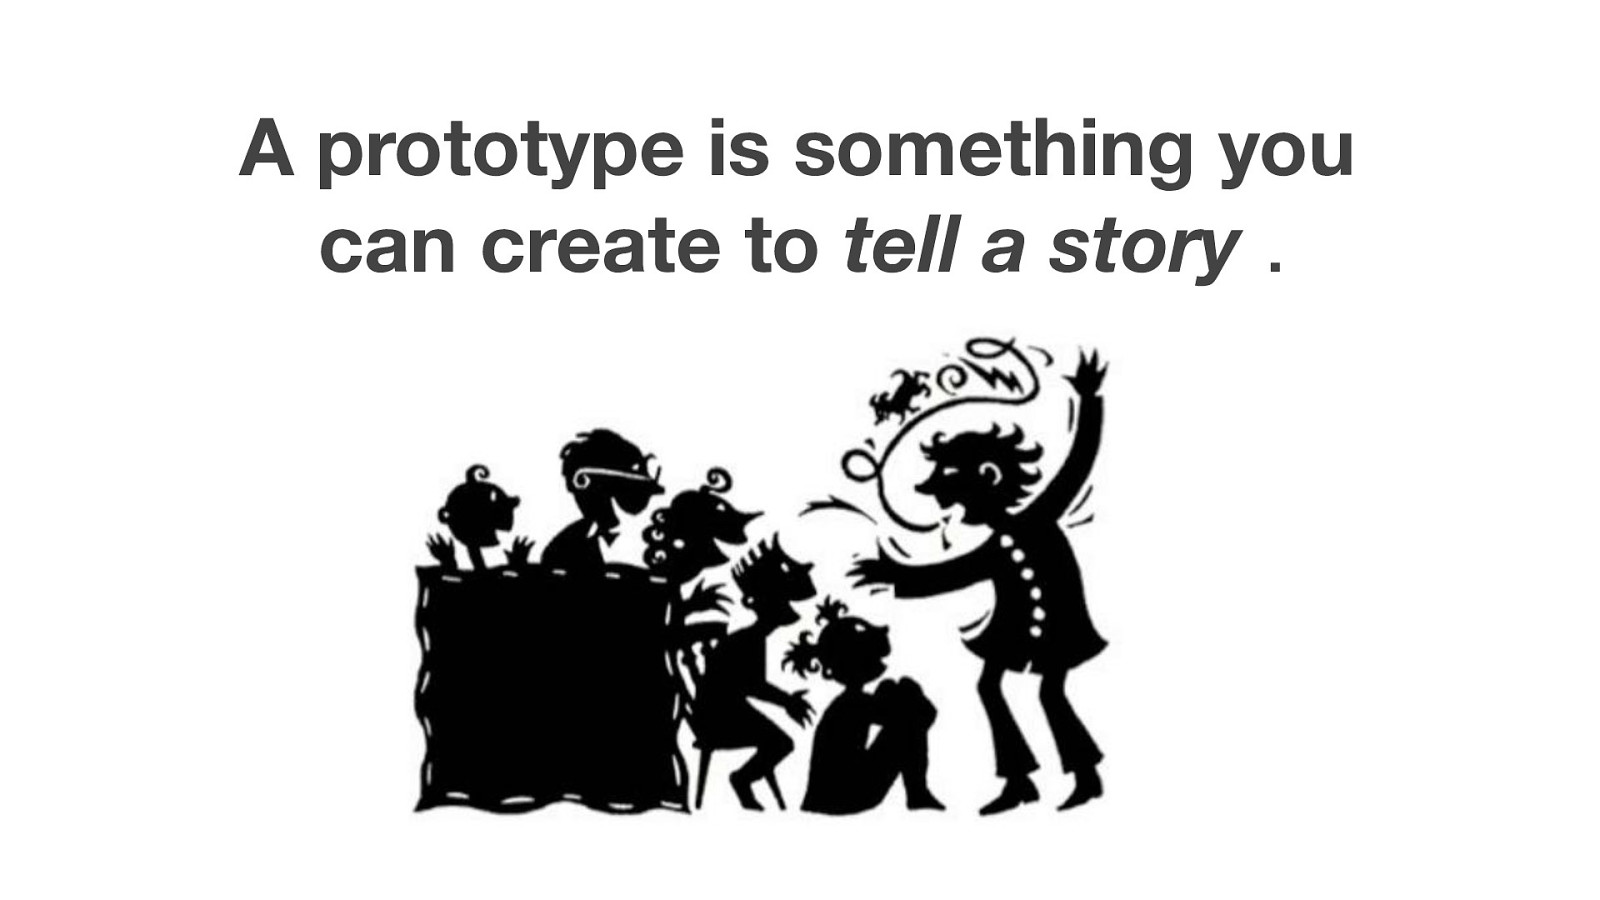
A prototype is something you can create to tell a story .

What kinds of ideas can you prototype?

Mobile Apps (e.g. paper sketches) Work schedules Cars Storyboarding Food … Anything can be prototyped

How fast?

Should always within hours

Why prototyping?

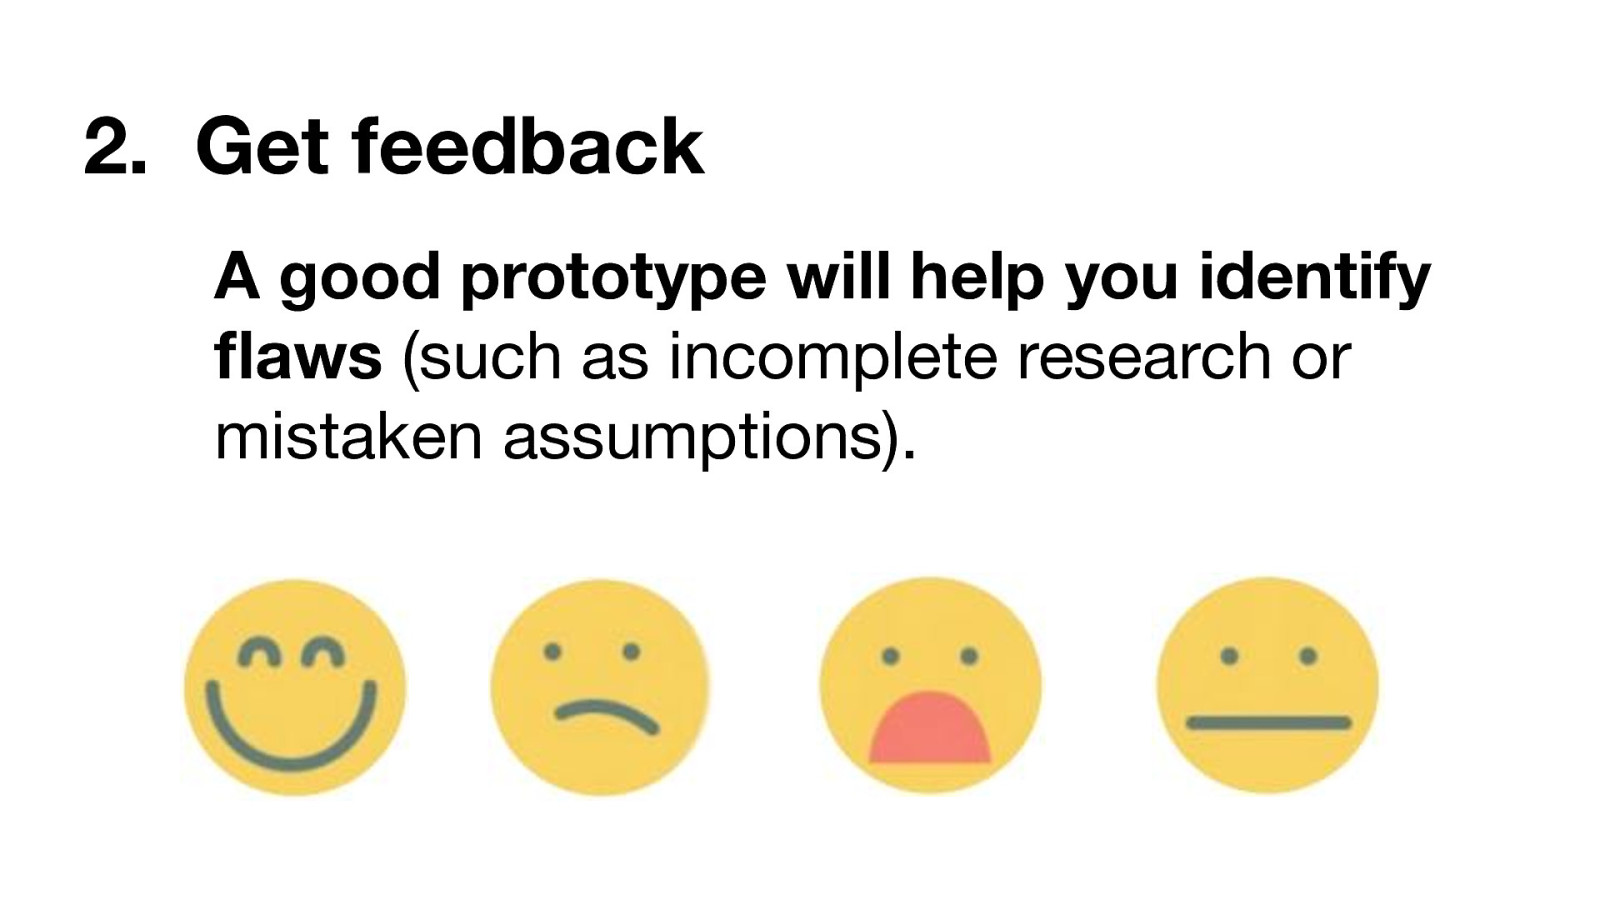
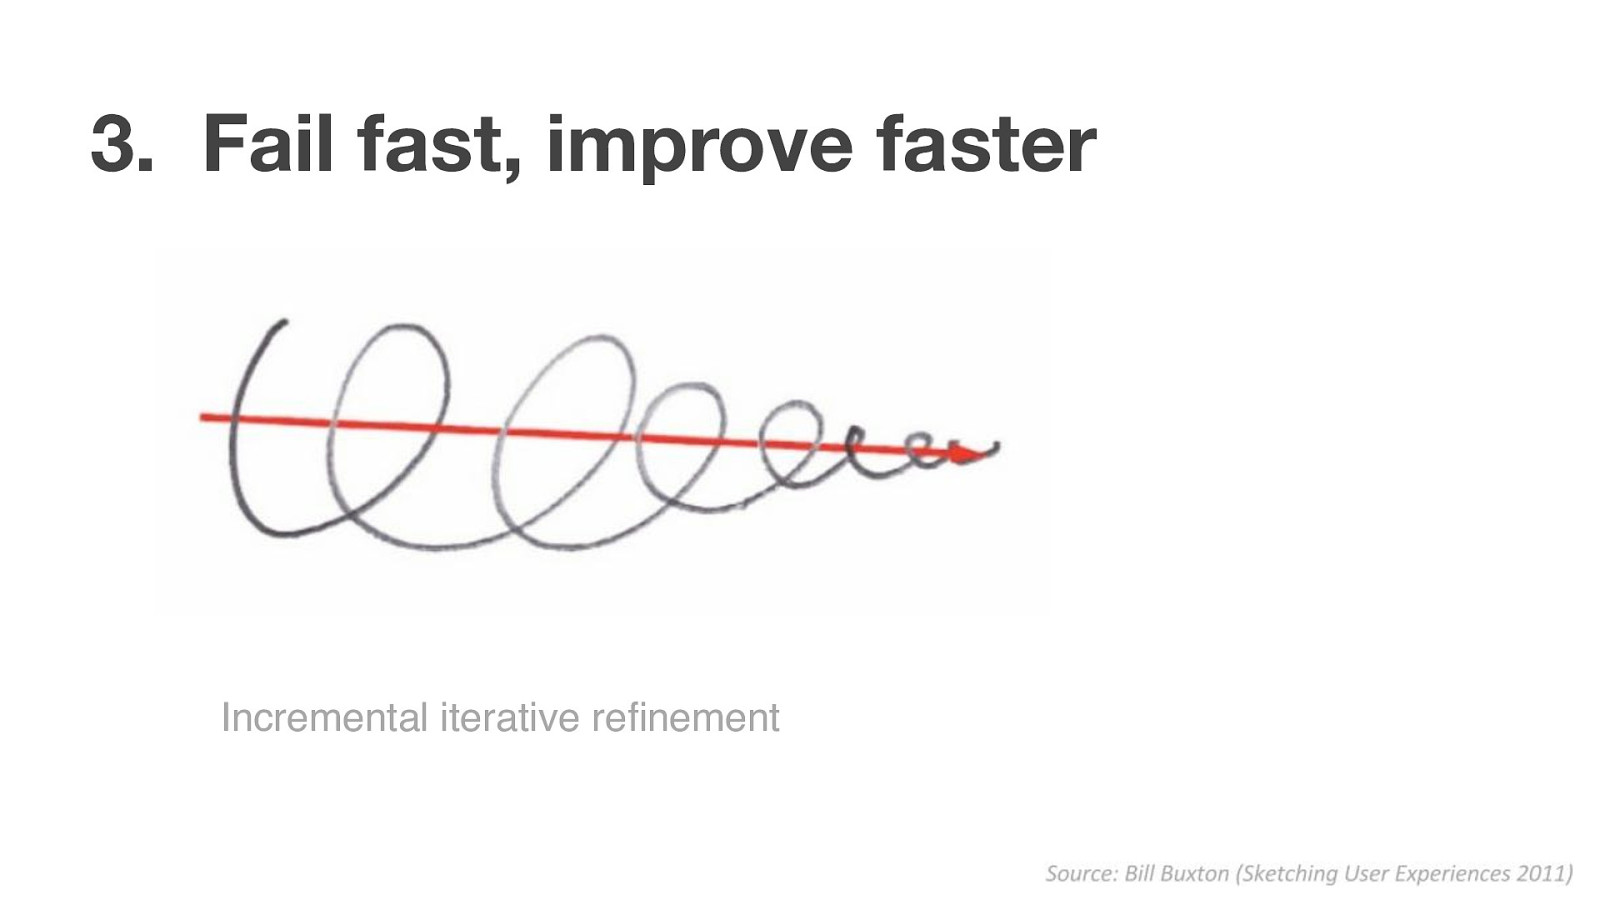
Key principles 1. Make it tangible 2. Get feedback 3. Fail fast, improve faster
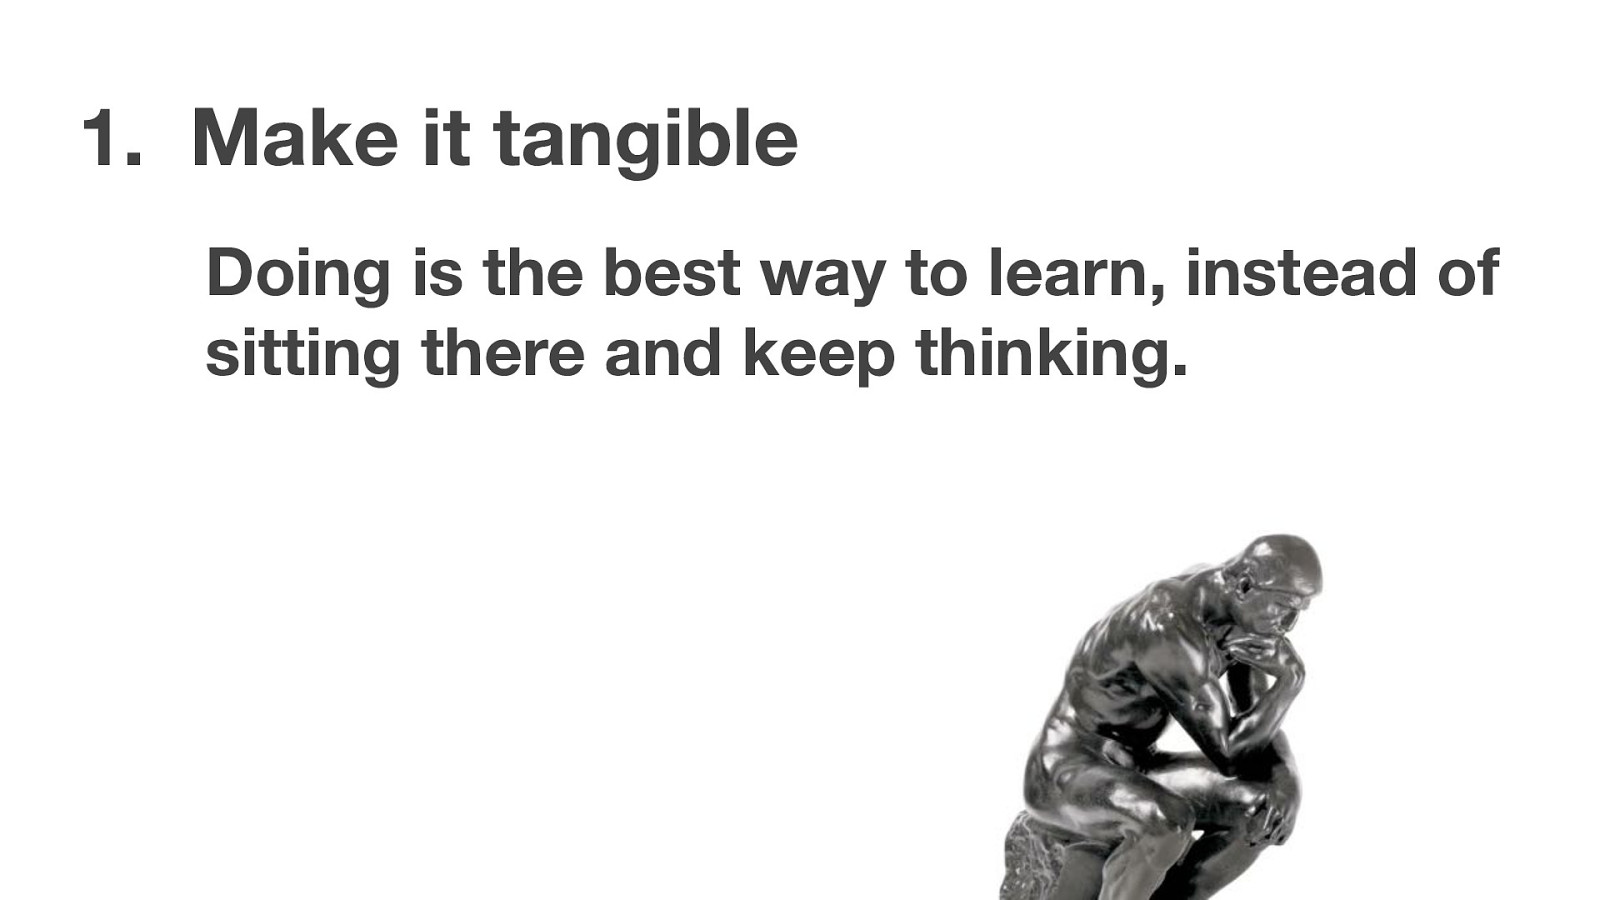

Build. Share. Improve. “Moving from abstract ideas, theories, plans to concrete tangible, experiential things.”
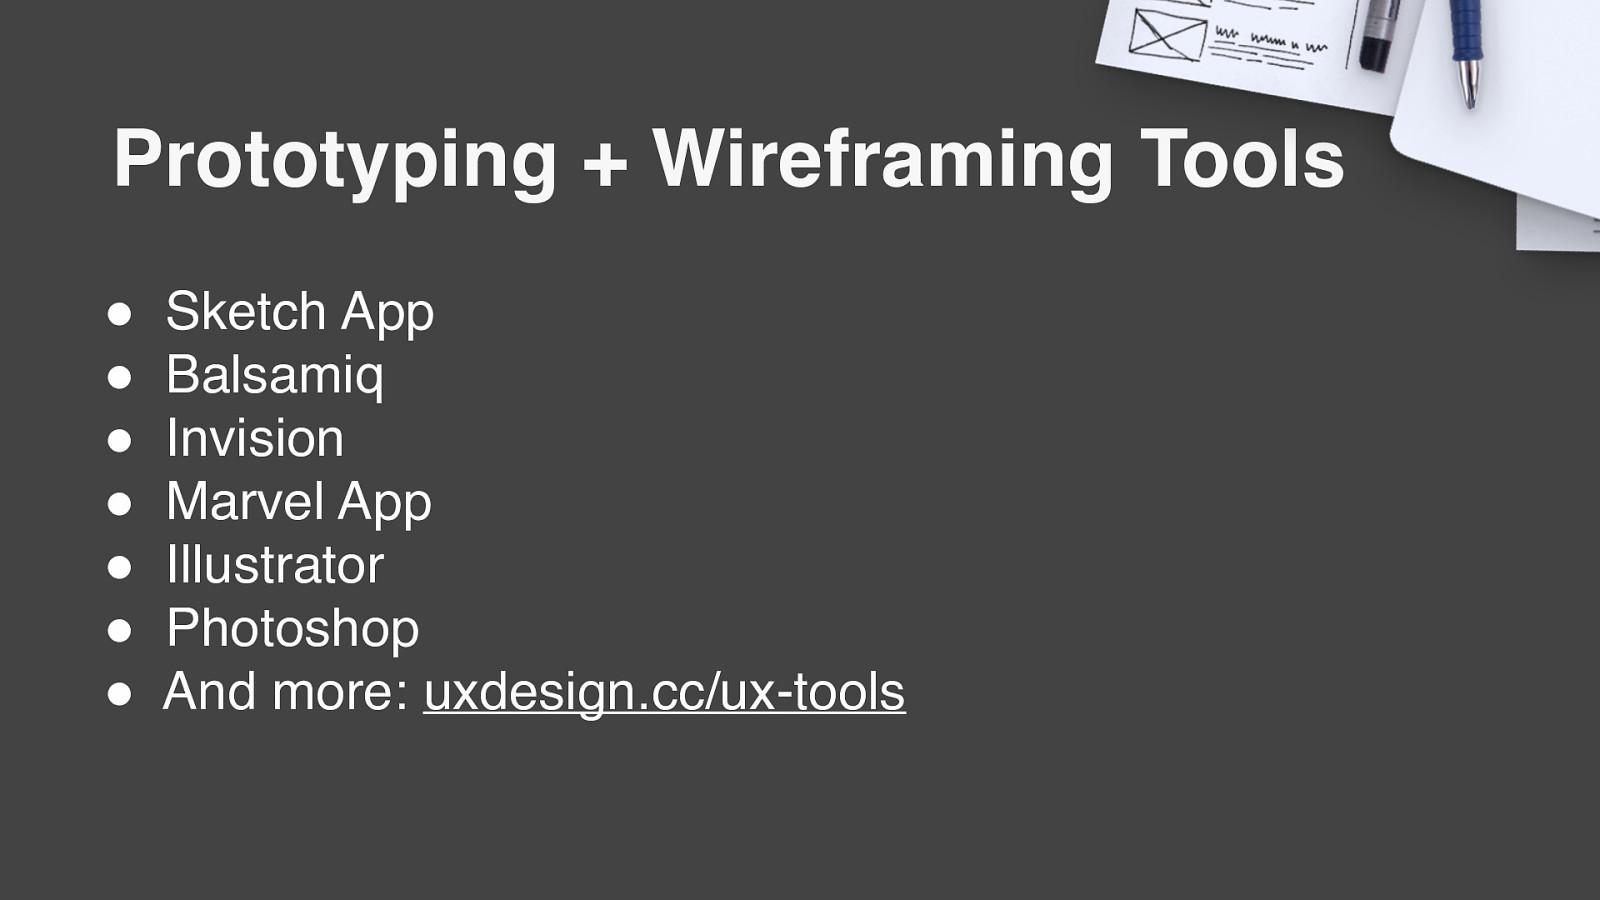
Prototyping + Wireframing Tools ” ” ” ” ” ” ” Sketch App Balsamiq Invision Marvel App Illustrator Photoshop And more: uxdesign.cc/ux-tools
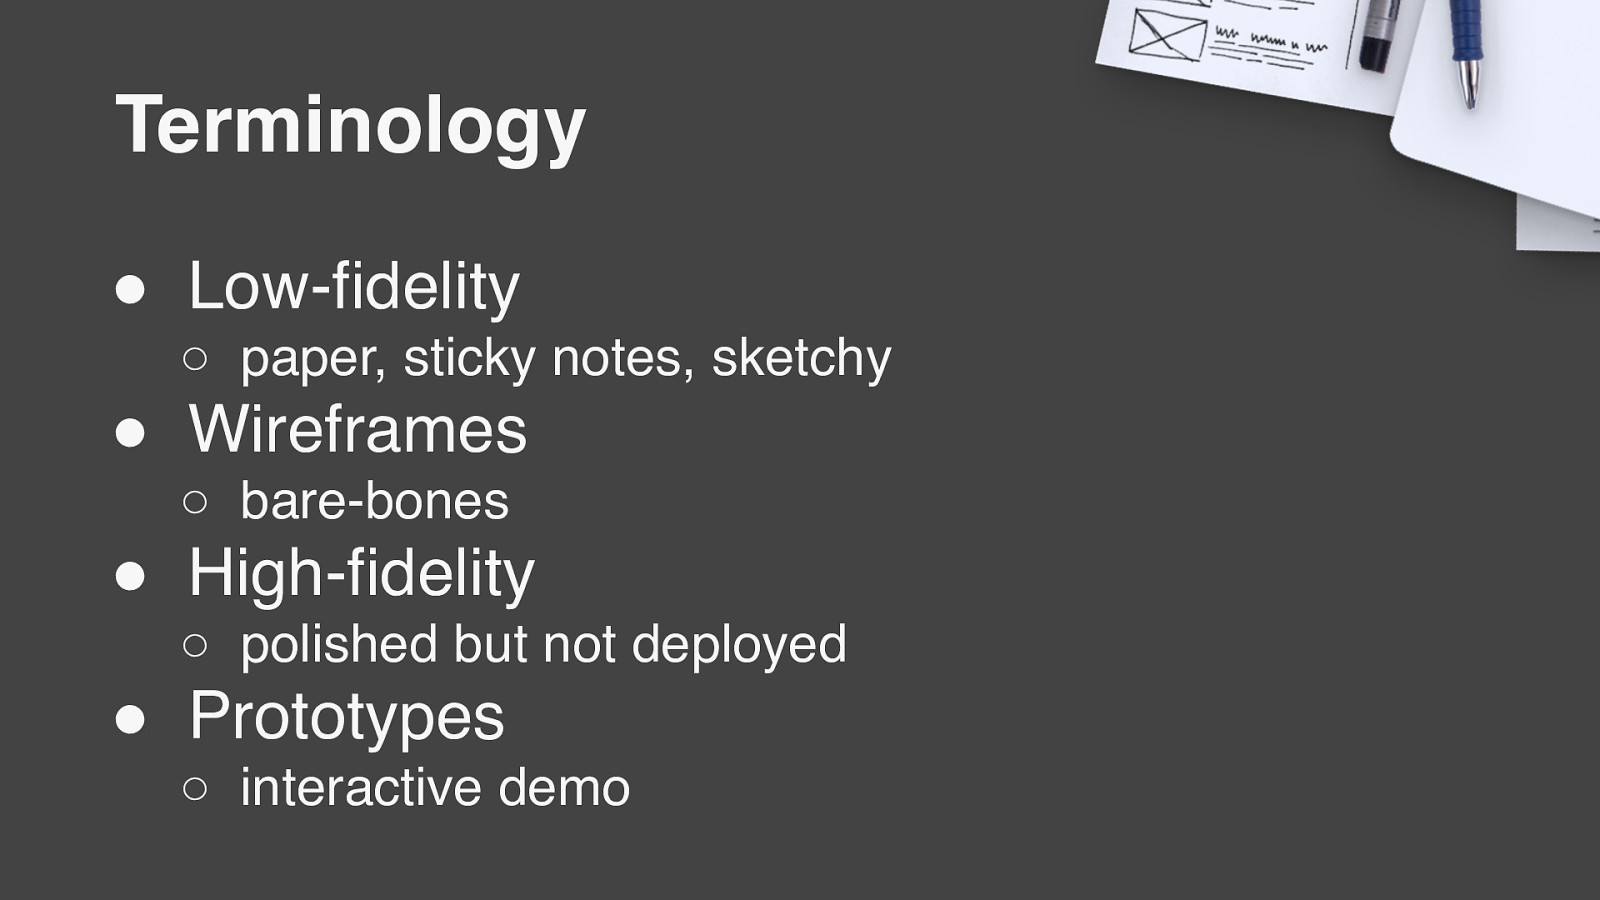
Terminology ” Low-fidelity ○ paper, sticky notes, sketchy ” Wireframes ○ bare-bones ” High-fidelity ○ polished but not deployed ” Prototypes ○ interactive demo
Examples Low-fi to high-fi is a spectrum from most sketchy to most polished, and used as an adjective to describe your deliverables (wireframes and prototypes)
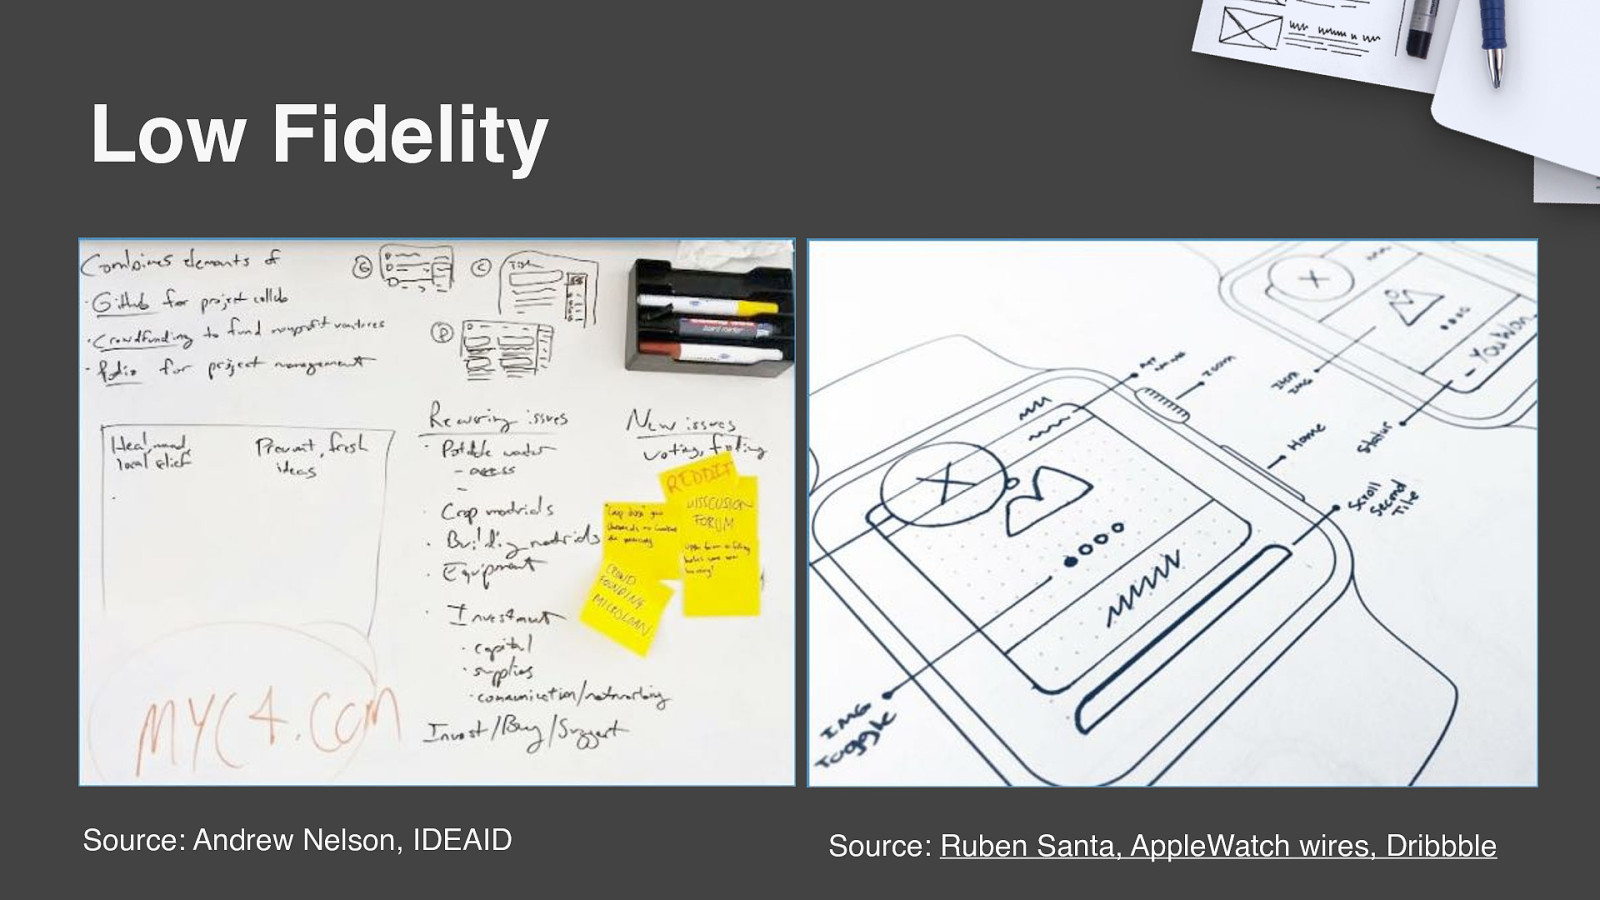
Low Fidelity Source: Andrew Nelson, IDEAID Source: Ruben Santa, AppleWatch wires, Dribbble
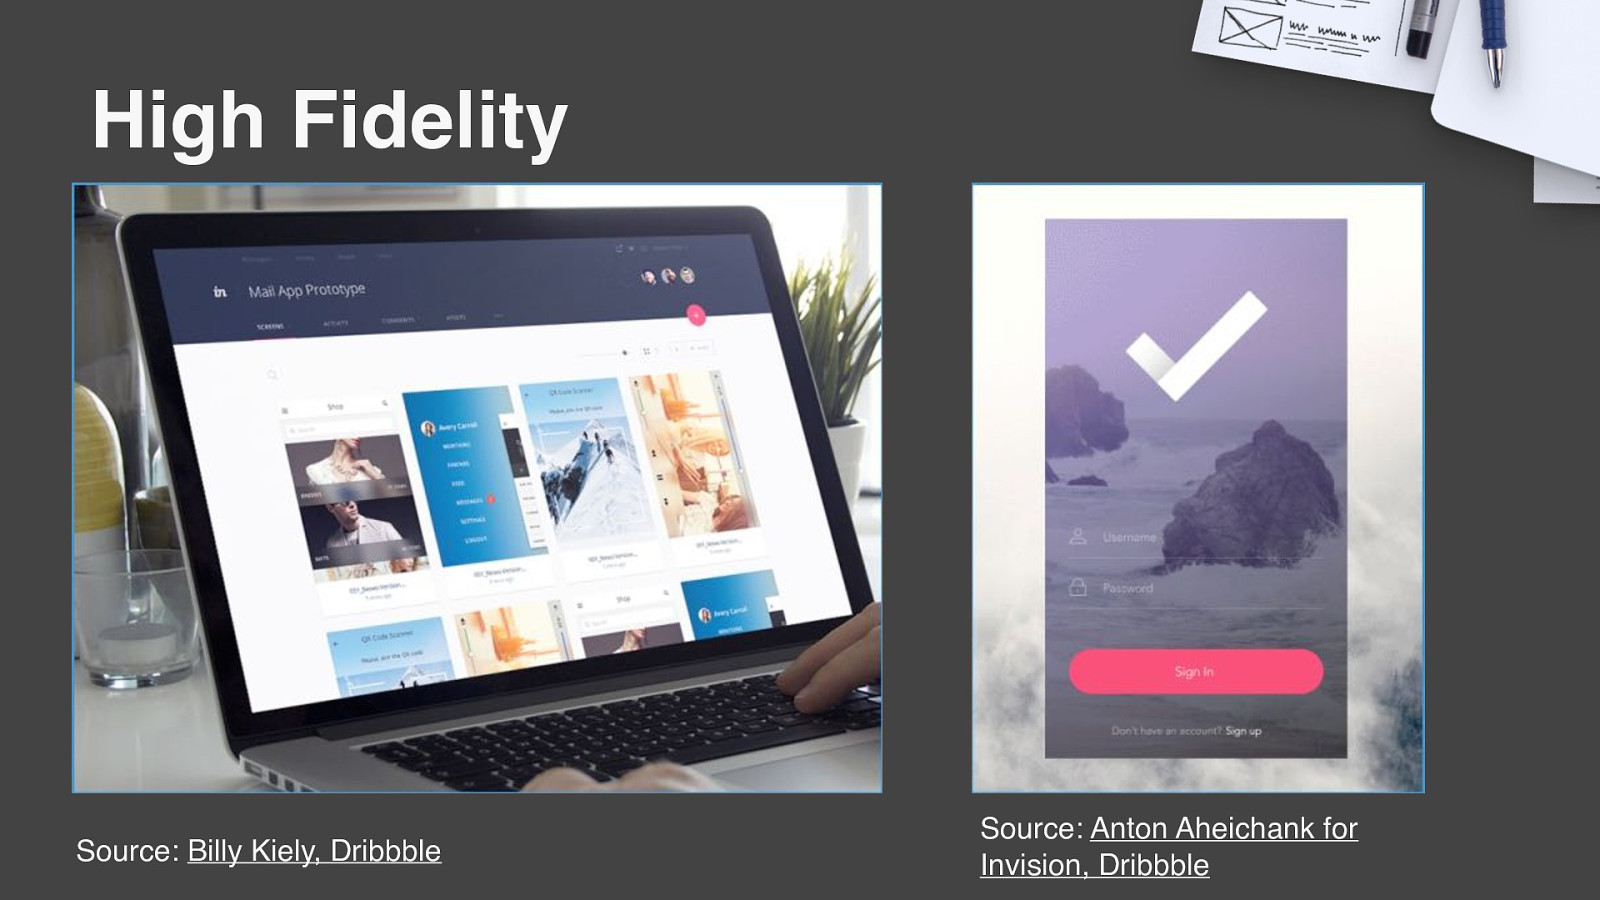
High Fidelity Source: Billy Kiely, Dribbble Source: Anton Aheichank for Invision, Dribbble
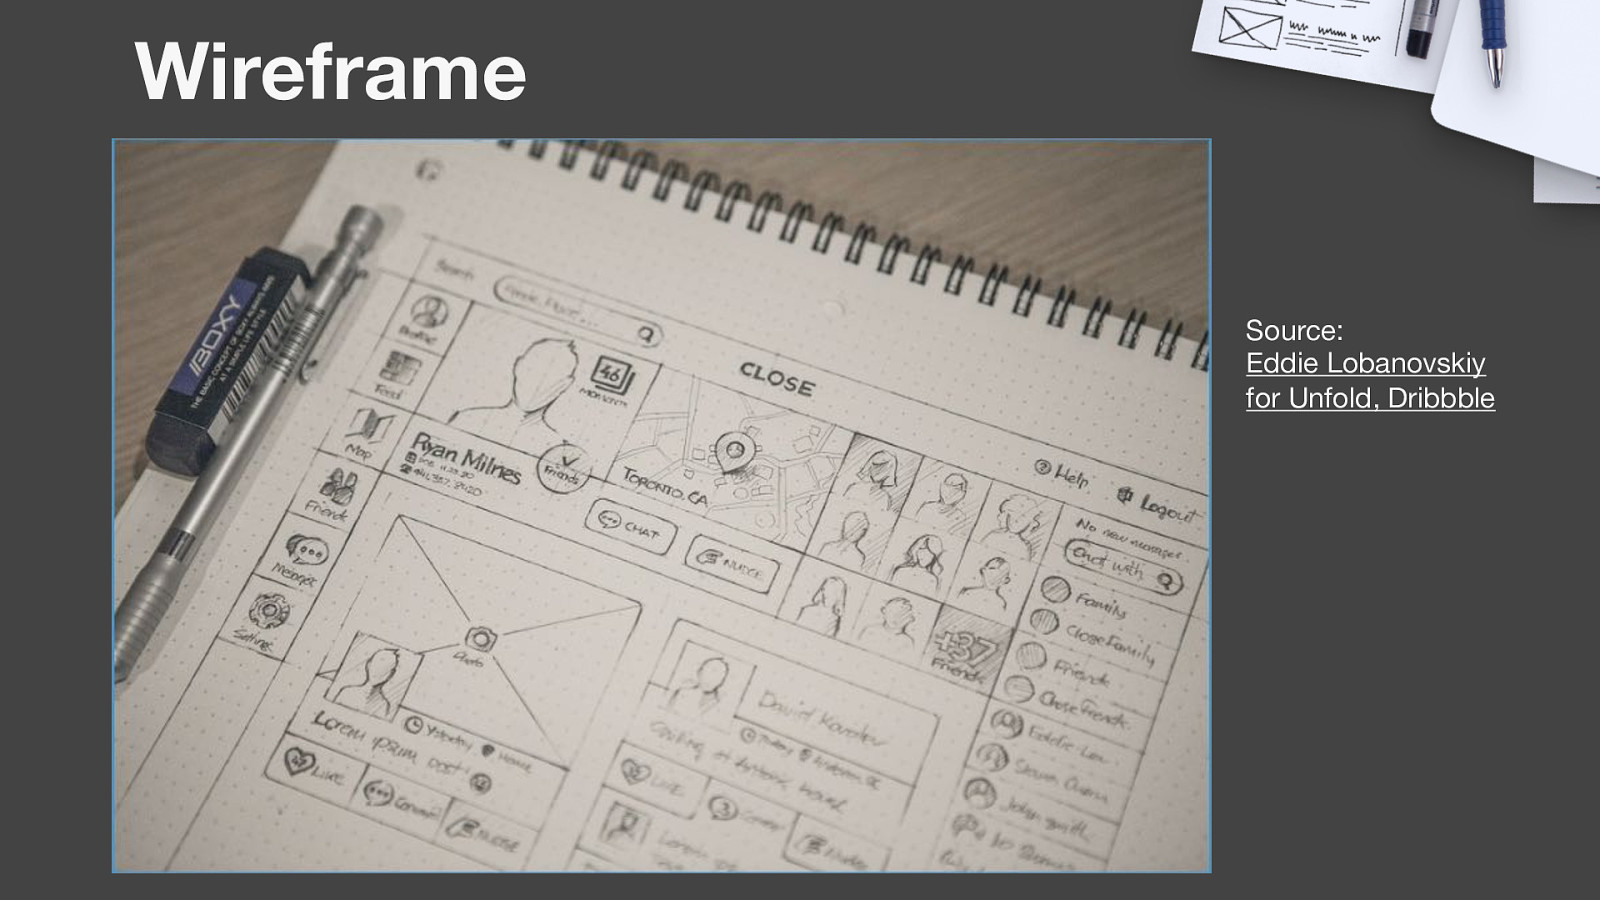
Wireframe Source: Eddie Lobanovskiy for Unfold, Dribbble
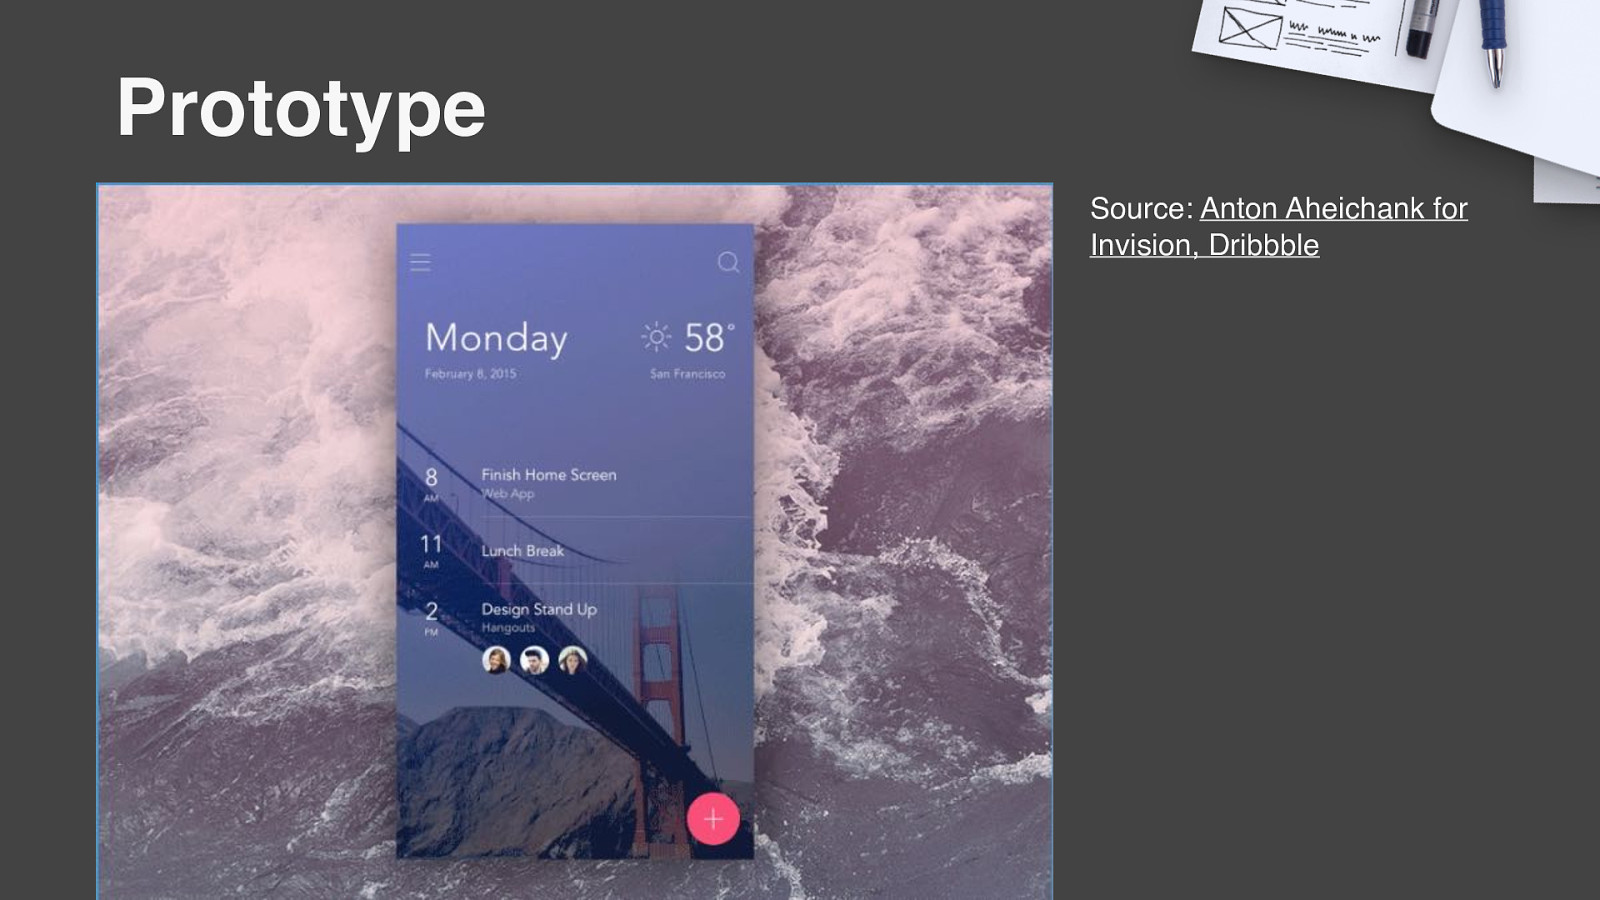
Prototype Source: Anton Aheichank for Invision, Dribbble
WORKSHOP TIME!
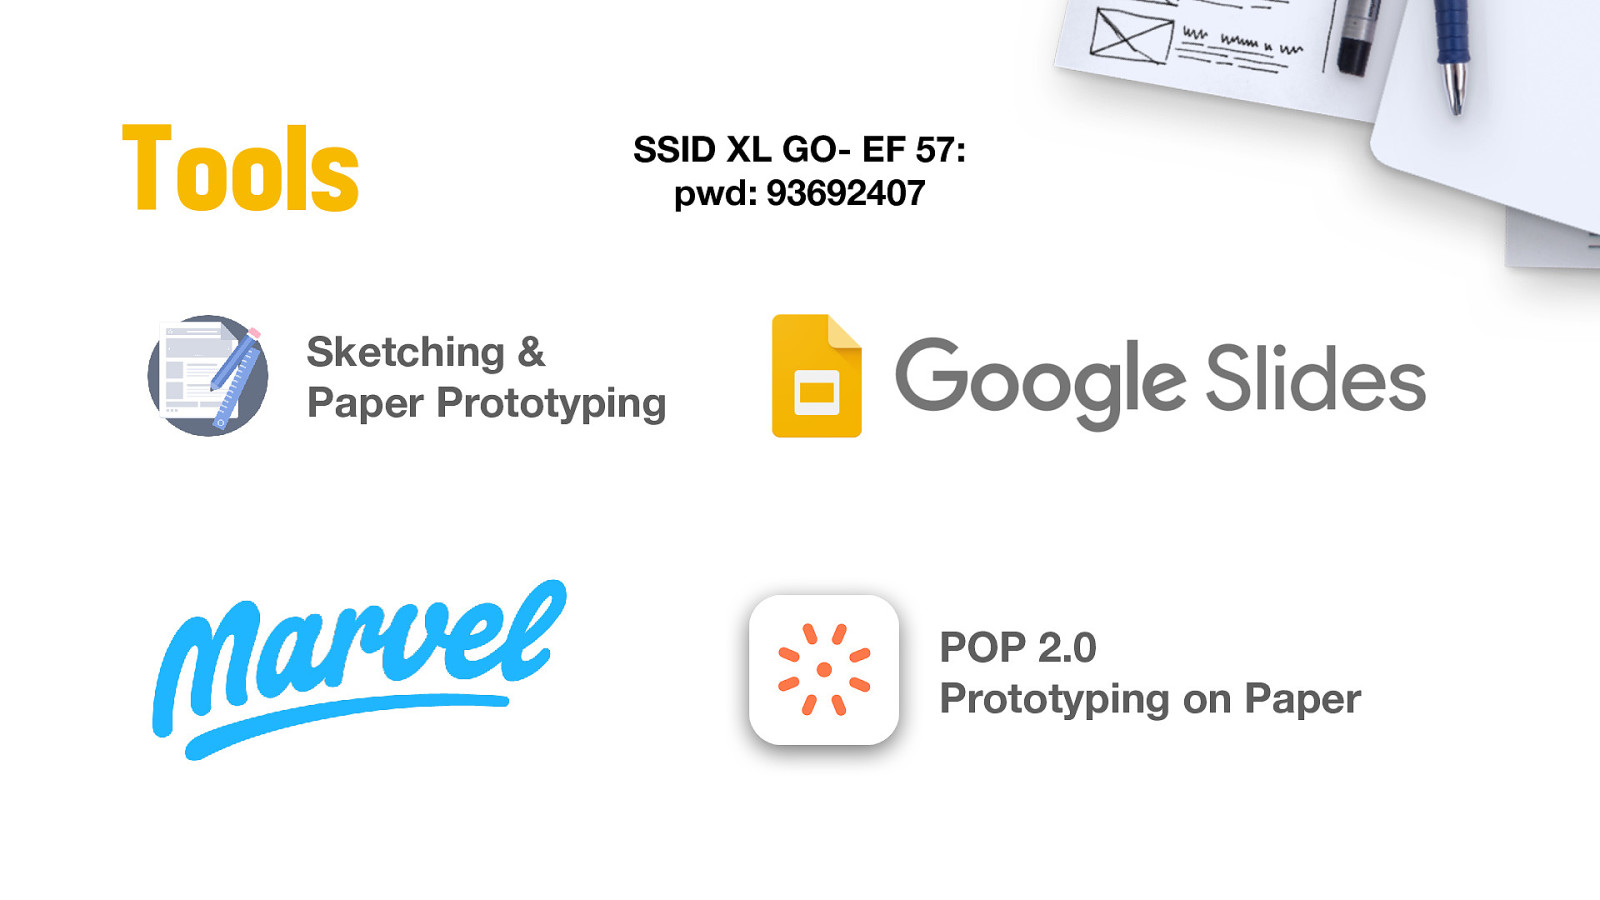
Tools SSID XL GO- EF 57: pwd: 93692407 Sketching & Paper Prototyping POP 2.0 Prototyping on Paper
UX is Everyone’s Responsibility
UX AS A PROFESSION
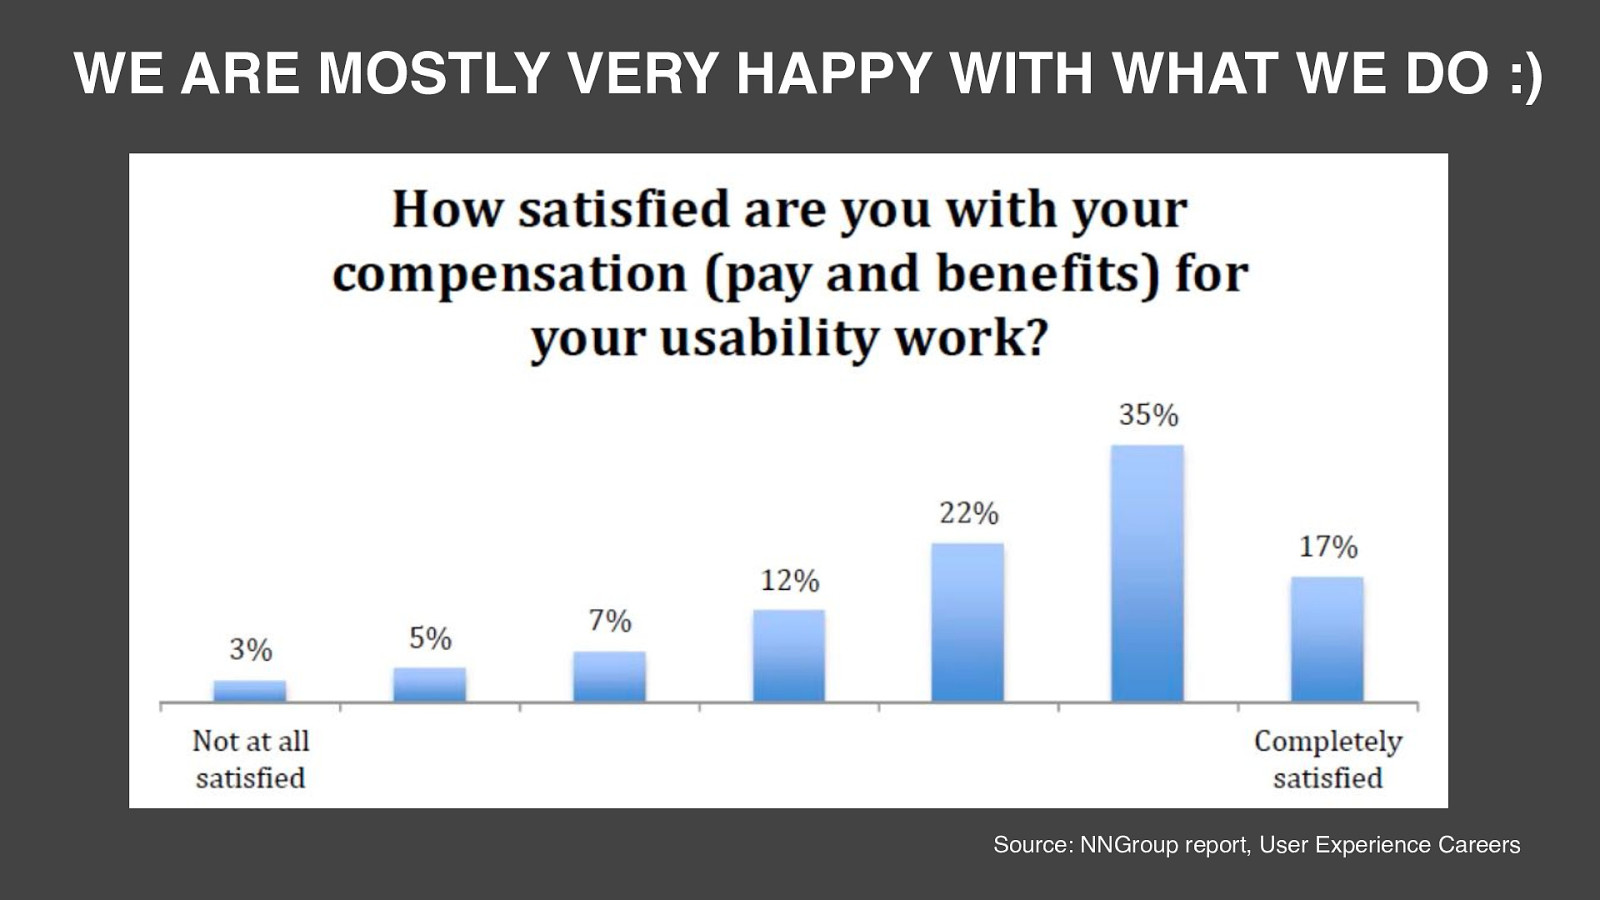
WE ARE MOSTLY VERY HAPPY WITH WHAT WE DO :) Source: NNGroup report, User Experience Careers
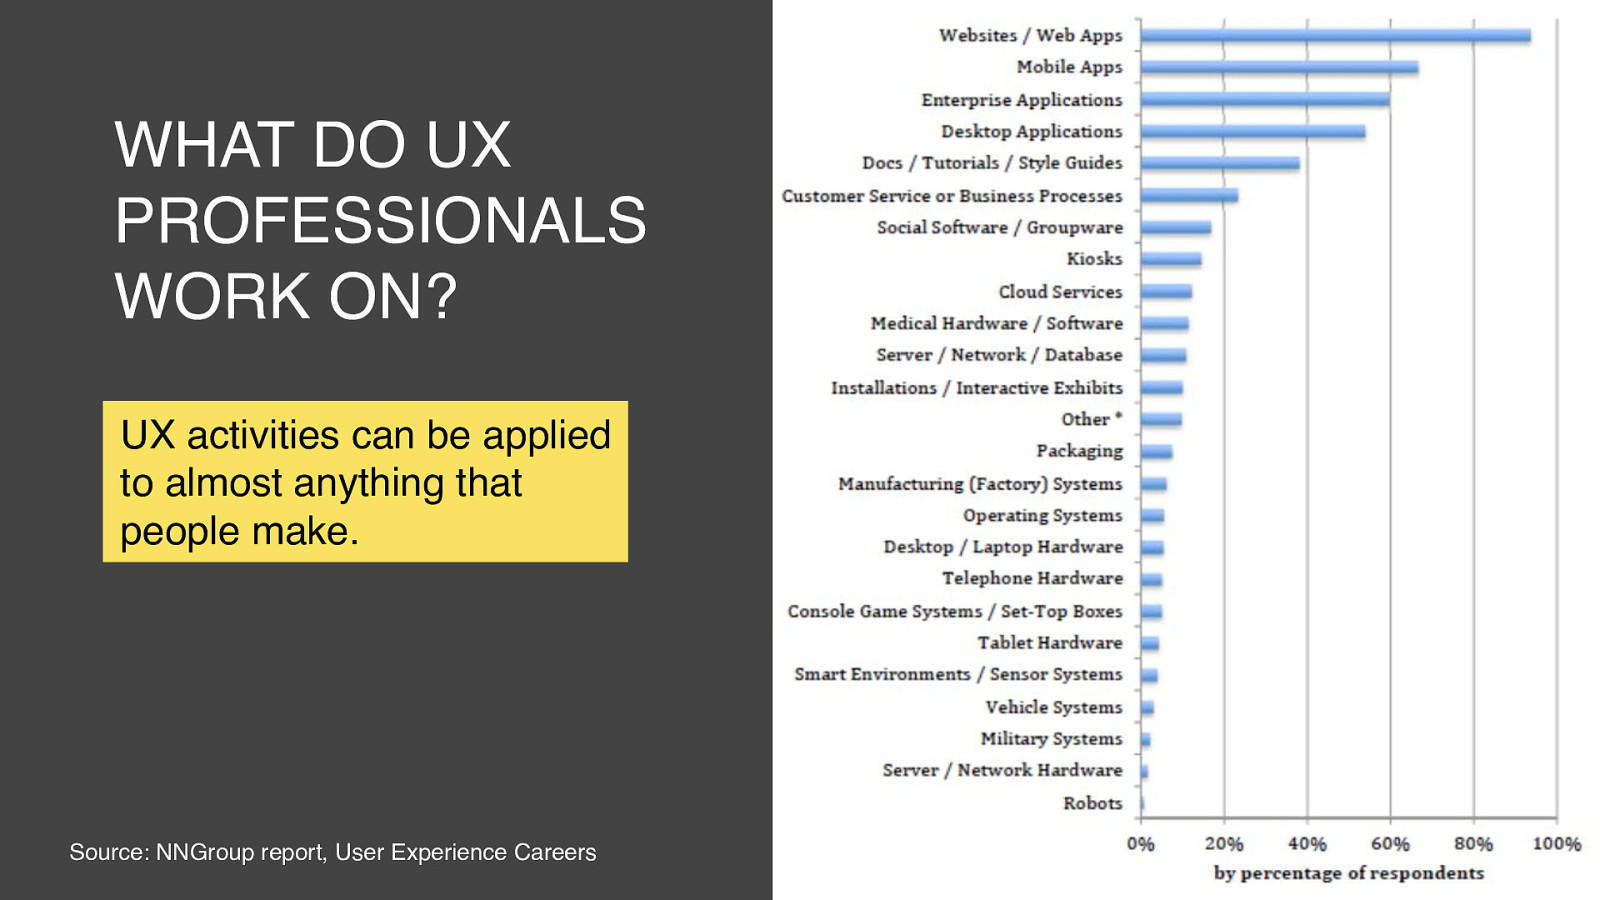
WHAT DO UX PROFESSIONALS WORK ON? UX activities can be applied to almost anything that people make. Source: NNGroup report, User Experience Careers

WHAT ARE THE JOB TITLES? Customer Experience Specialist User Researcher Design Researcher UX Consultant Experience Designer UX Specialist Human Factors Engineer UX Designer Information Architect UI Designer Interaction Designer UI / UX Designer Usability Analyst UX / UI Developer Usability Engineer Service Designer UX Copywriter UX Engineer Icon Designer Product Designer etc
Laws of UX
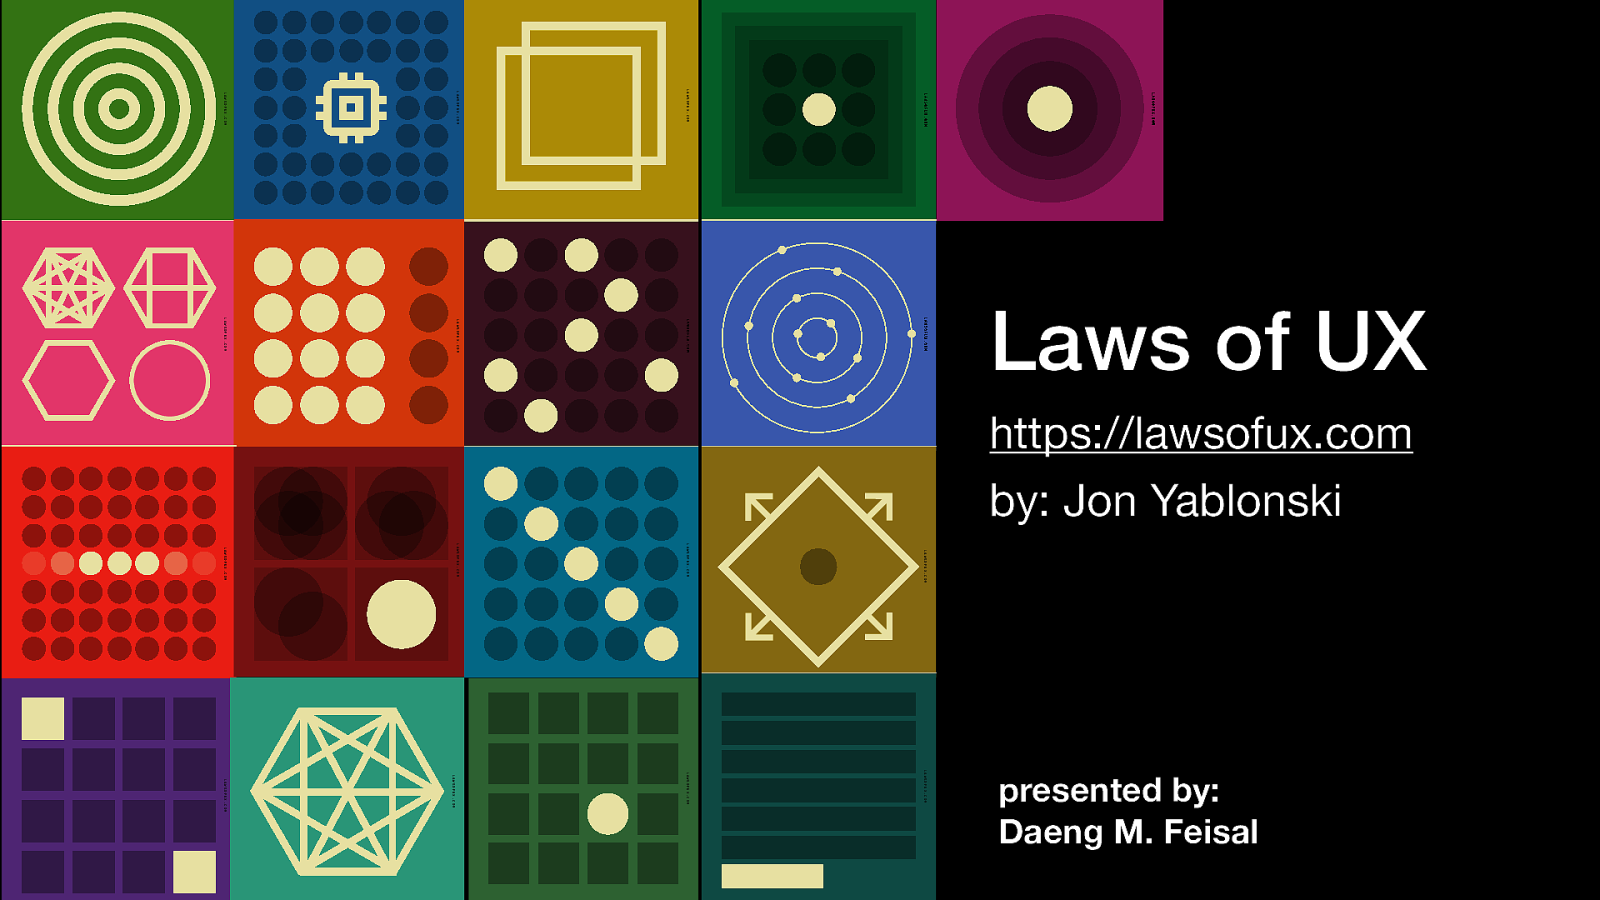
LAWSOFUX.COM LAWSOFUX.COM LAWSOFUX.COM LAWSOFUX.COM LAWSOFUX.COM Laws of UX https://lawsofux.com by: Jon Yablonski LAWSOFUX.COM LAWSOFUX.COM LAWSOFUX.COM LAWSOFUX.COM LAWSOFUX.COM LAWSOFUX.COM LAWSOFUX.COM LAWSOFUX.COM presented by: Daeng M. Feisal
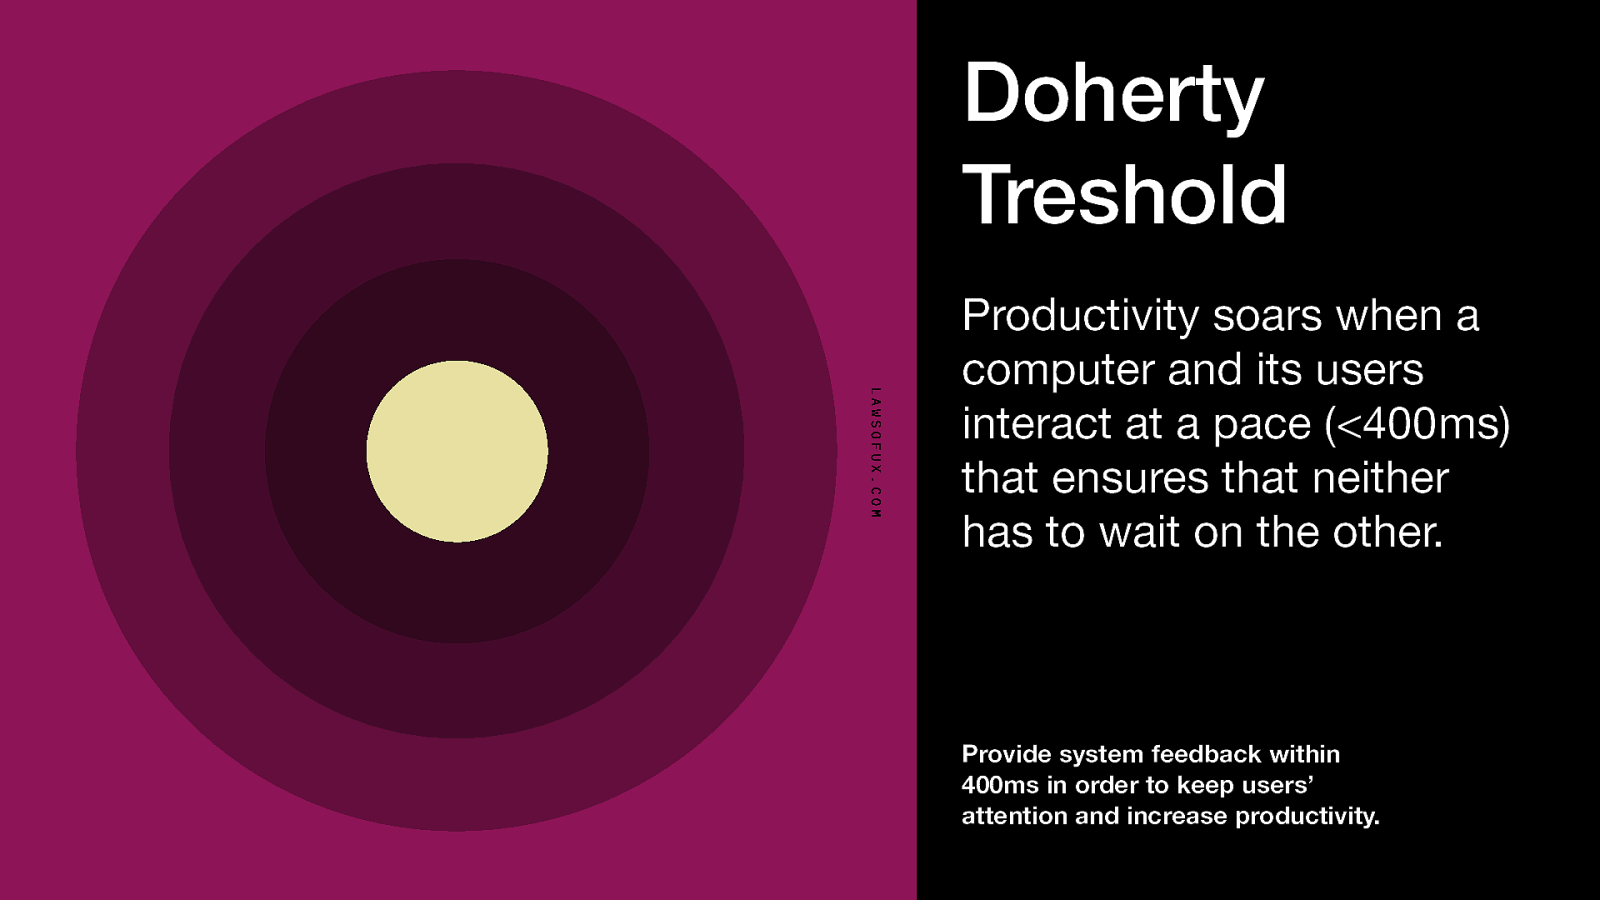
Doherty Treshold Productivity soars when a computer and its users interact at a pace (<400ms) that ensures that neither has to wait on the other. Provide system feedback within 400ms in order to keep users’ attention and increase productivity.
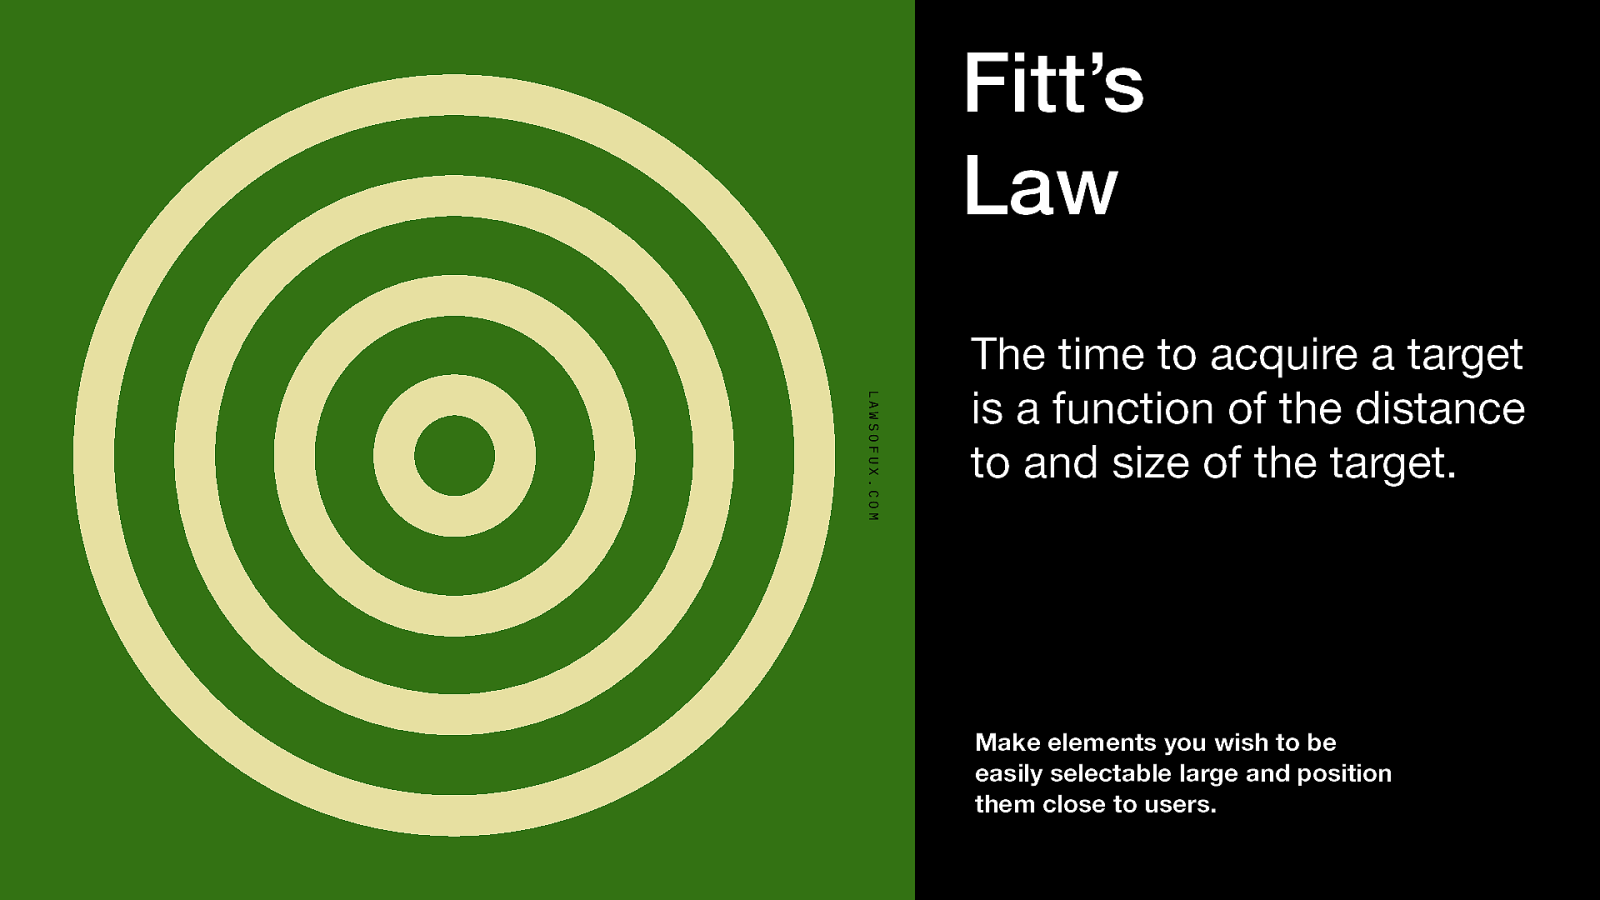
Fitt’s Law LAWSOFUX.COM The time to acquire a target is a function of the distance to and size of the target. Make elements you wish to be easily selectable large and position them close to users.
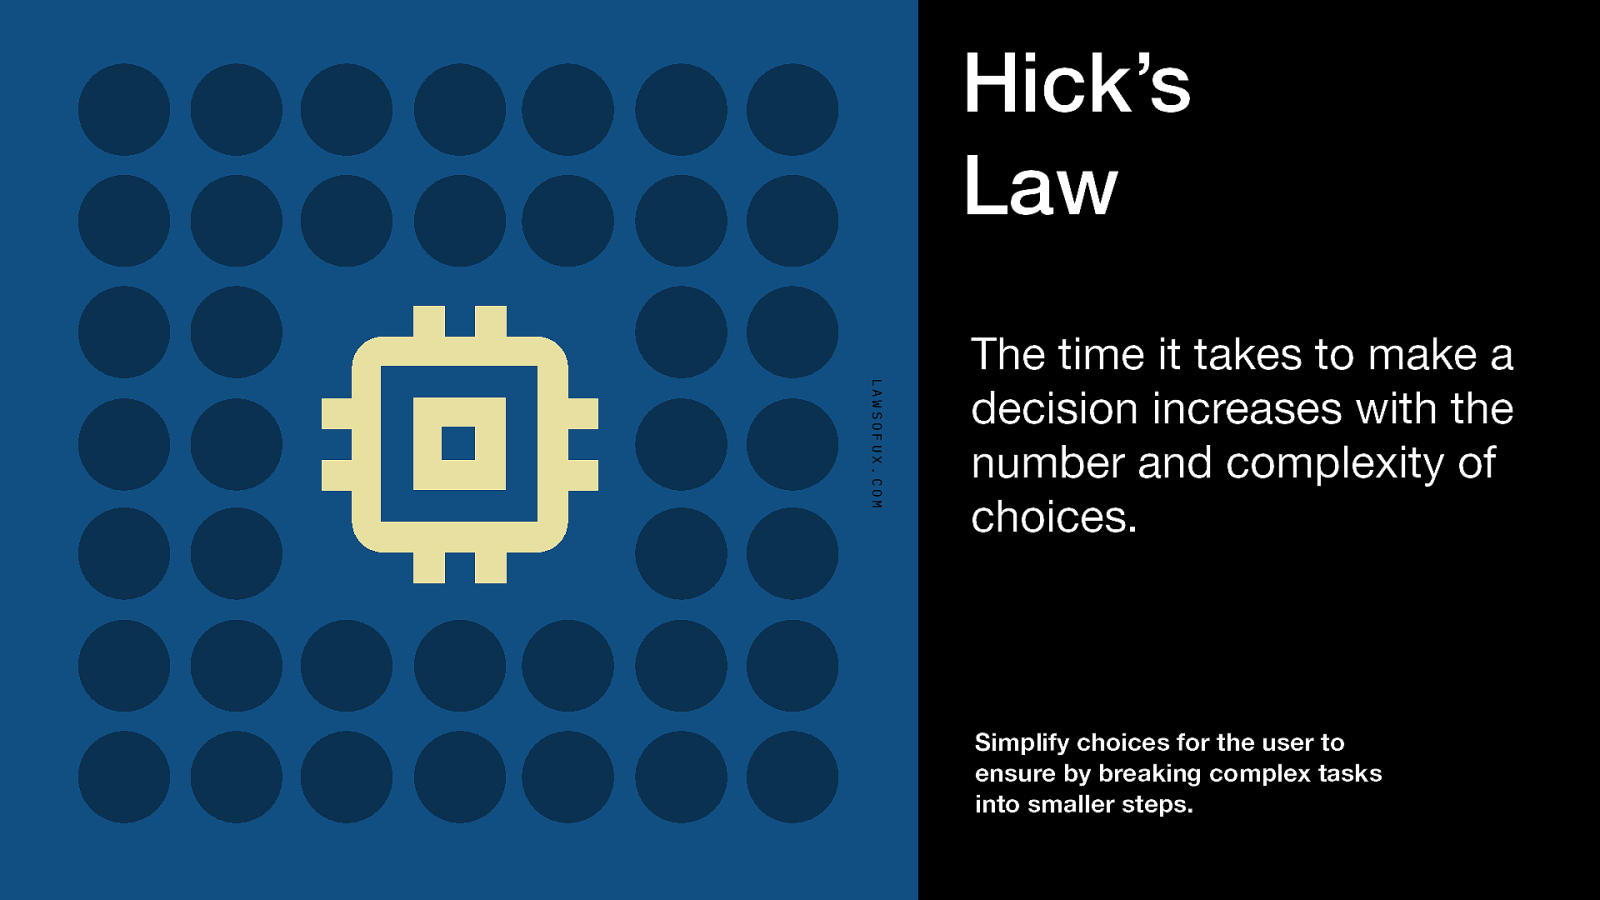
Hick’s Law LAWSOFUX.COM The time it takes to make a decision increases with the number and complexity of choices. Simplify choices for the user to ensure by breaking complex tasks into smaller steps.
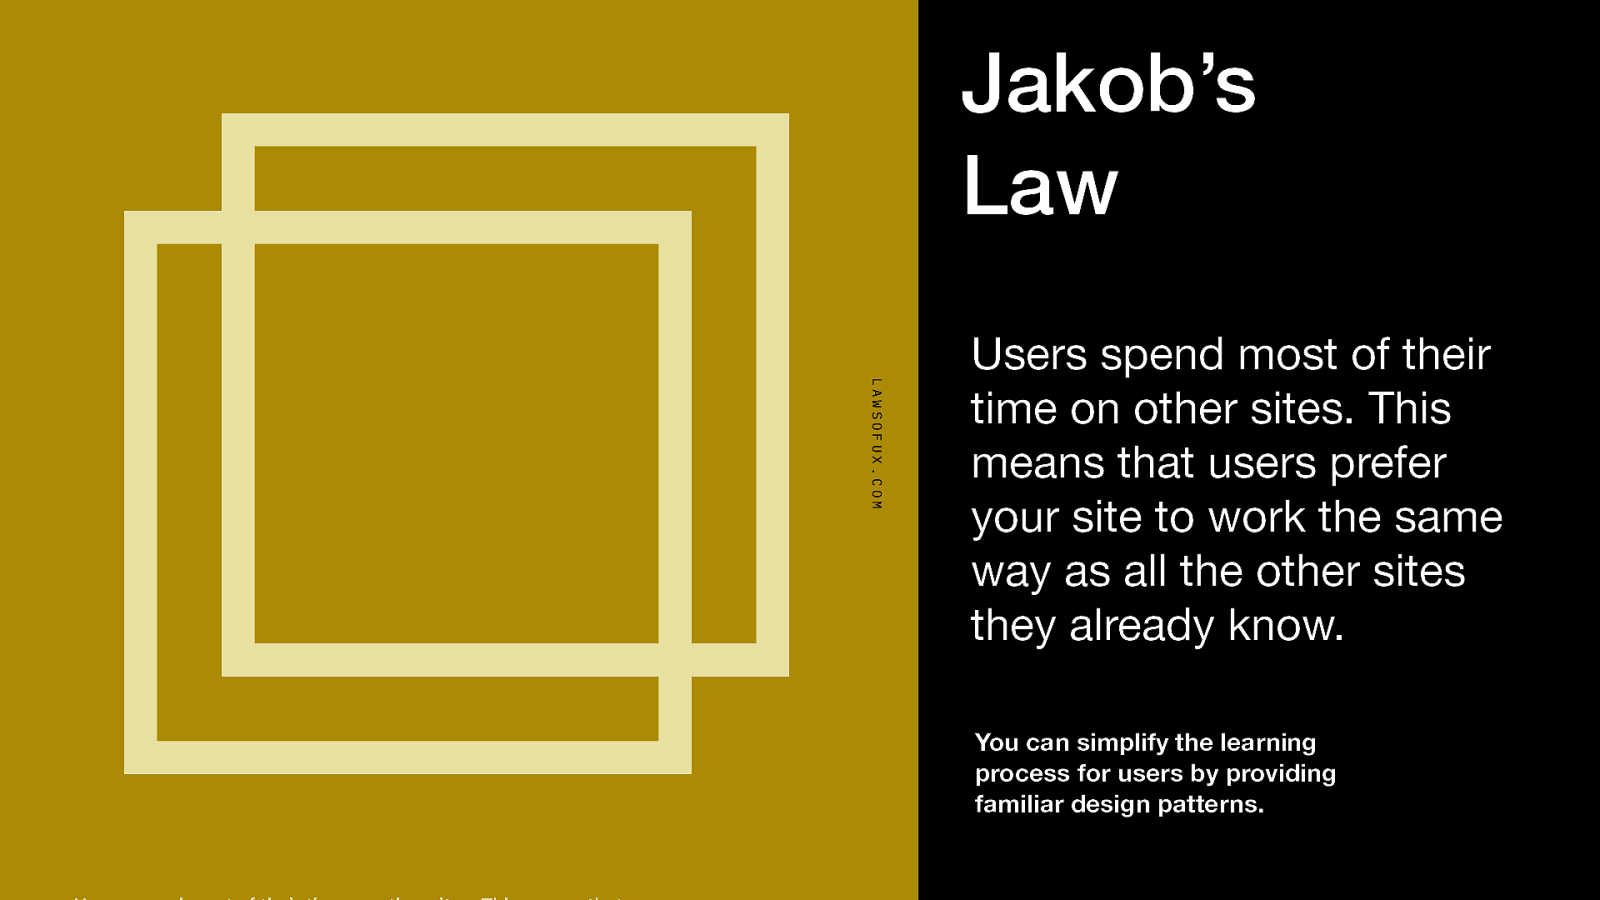
Jakob’s Law LAWSOFUX.COM Users spend most of their time on other sites. This means that users prefer your site to work the same way as all the other sites they already know. You can simplify the learning process for users by providing familiar design patterns.
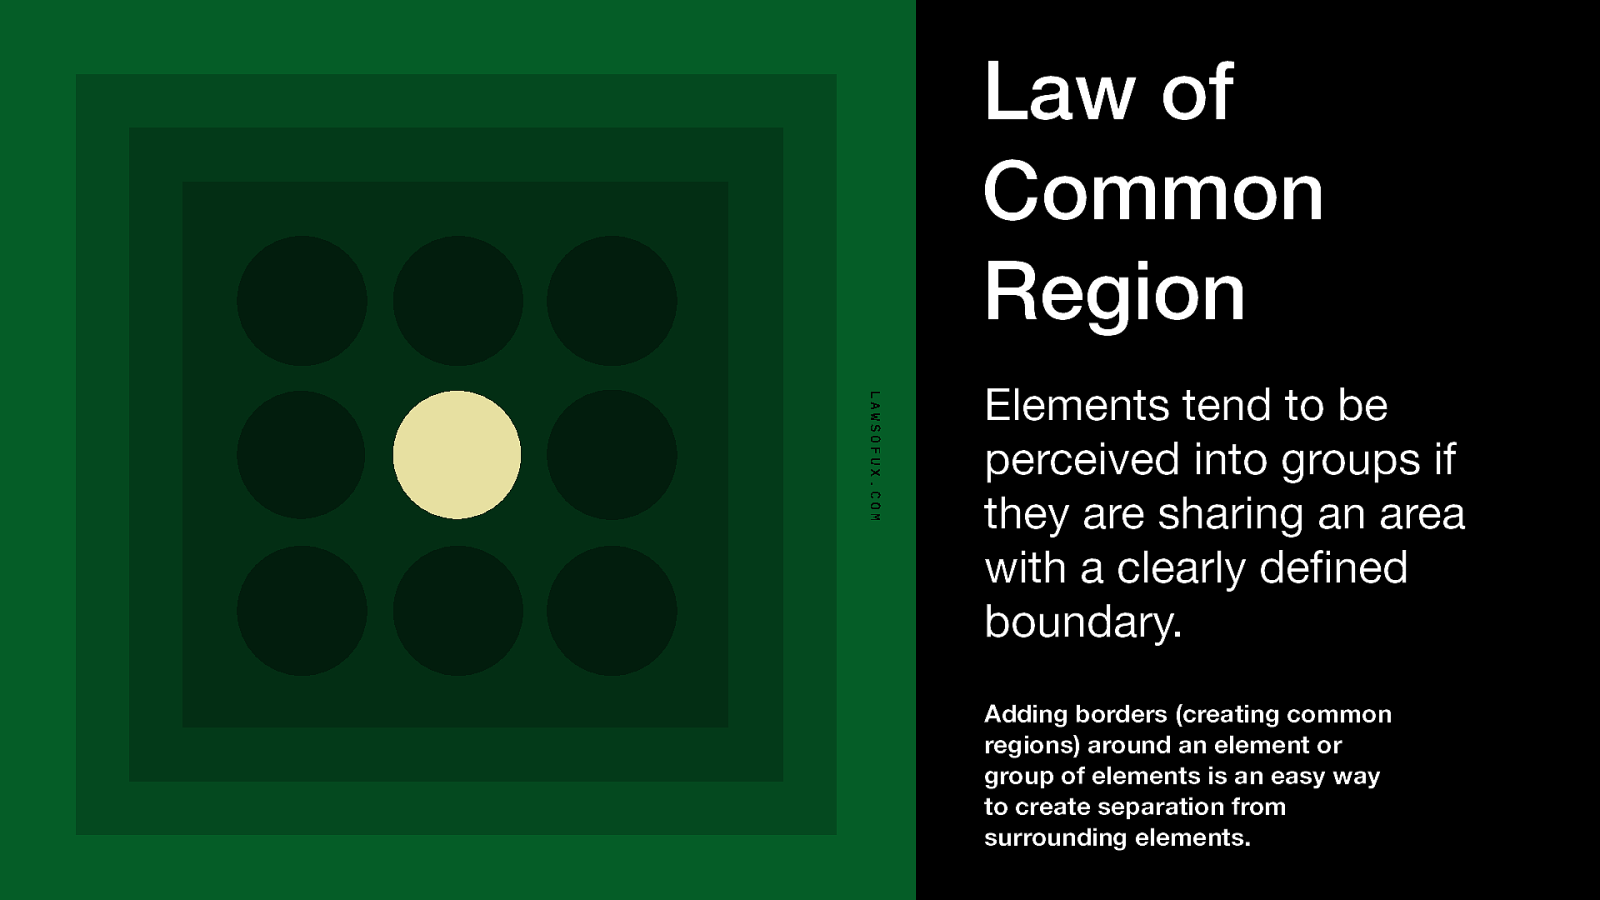
Law of Common Region Elements tend to be perceived into groups if they are sharing an area with a clearly defined boundary. Adding borders (creating common regions) around an element or group of elements is an easy way to create separation from surrounding elements.
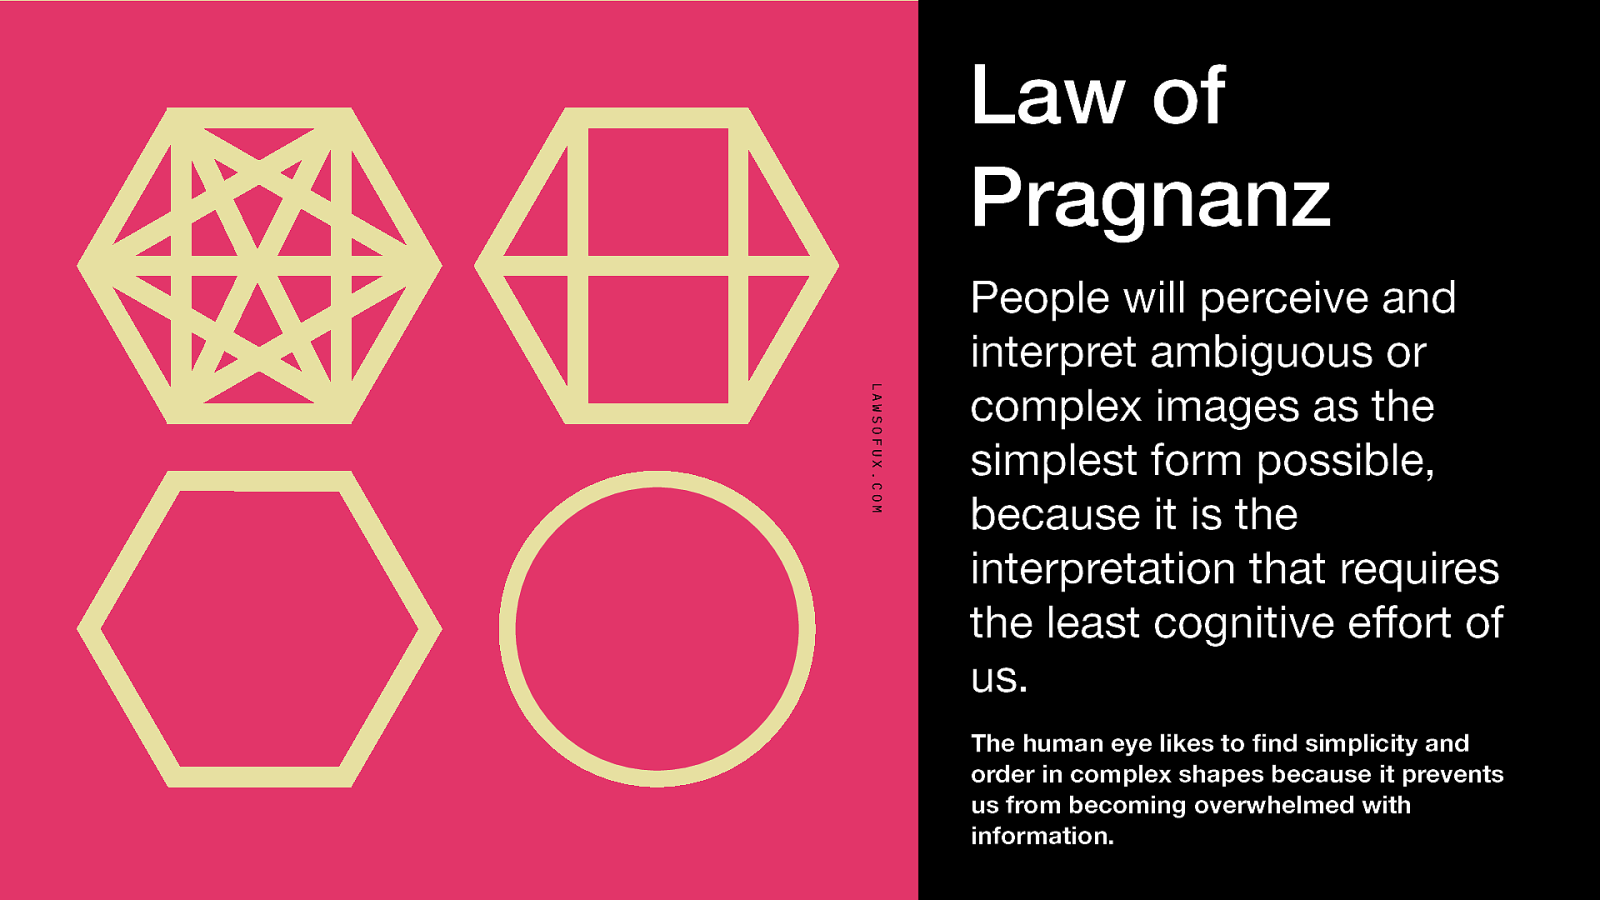
Law of Pragnanz LAWSOFUX.COM People will perceive and interpret ambiguous or complex images as the simplest form possible, because it is the interpretation that requires the least cognitive effort of us. The human eye likes to find simplicity and order in complex shapes because it prevents us from becoming overwhelmed with information.
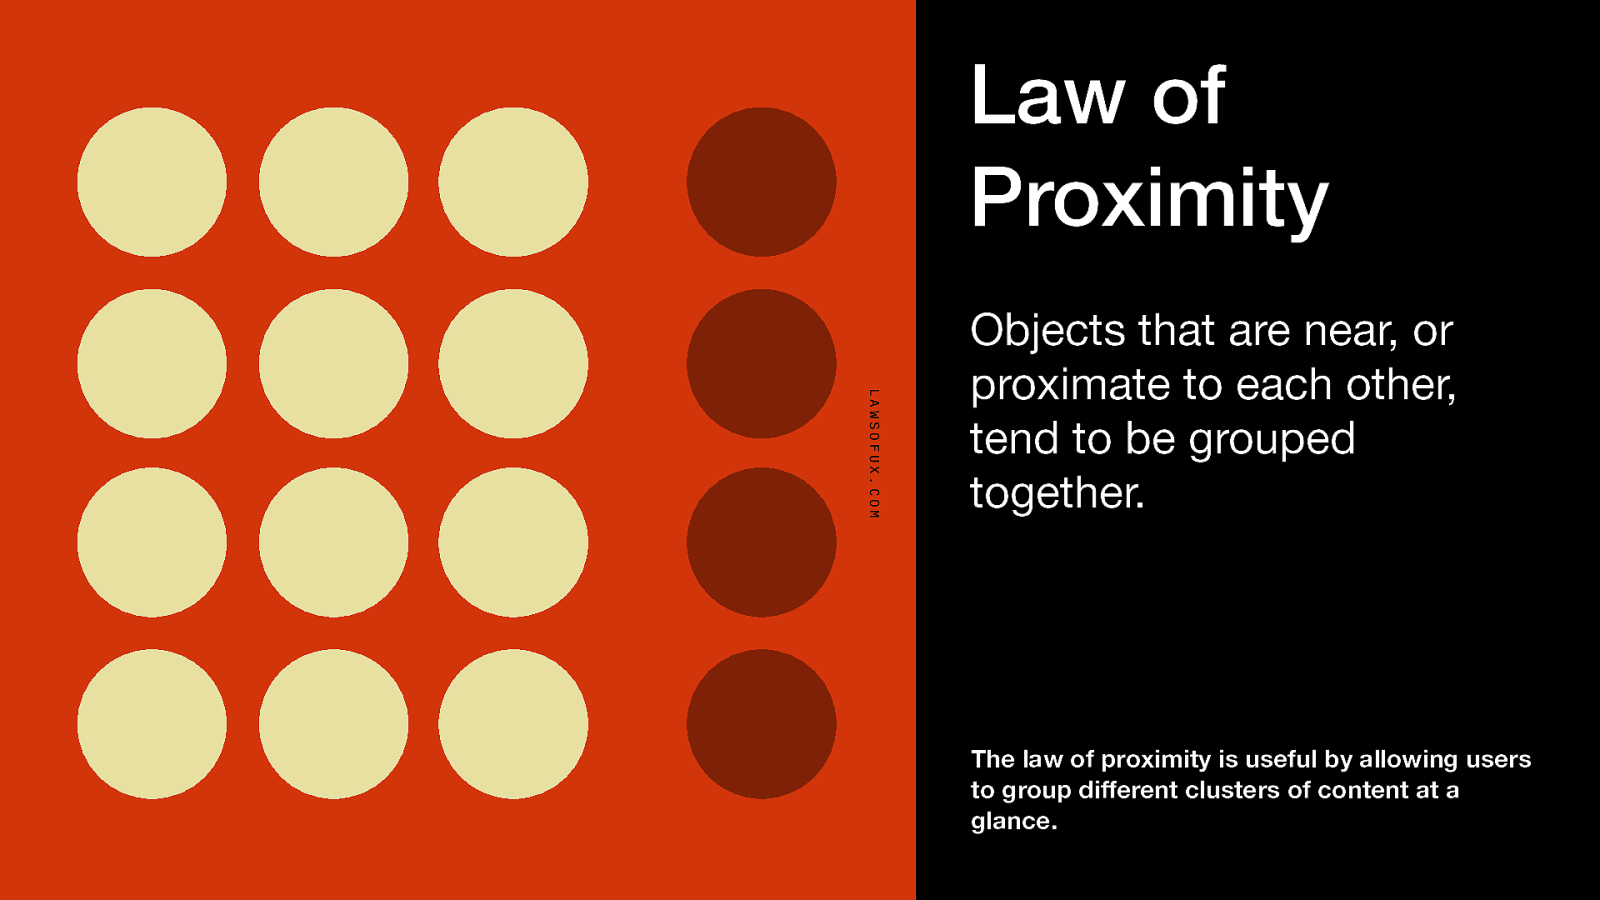
Law of Proximity LAWSOFUX.COM Objects that are near, or proximate to each other, tend to be grouped together. The law of proximity is useful by allowing users to group different clusters of content at a glance.
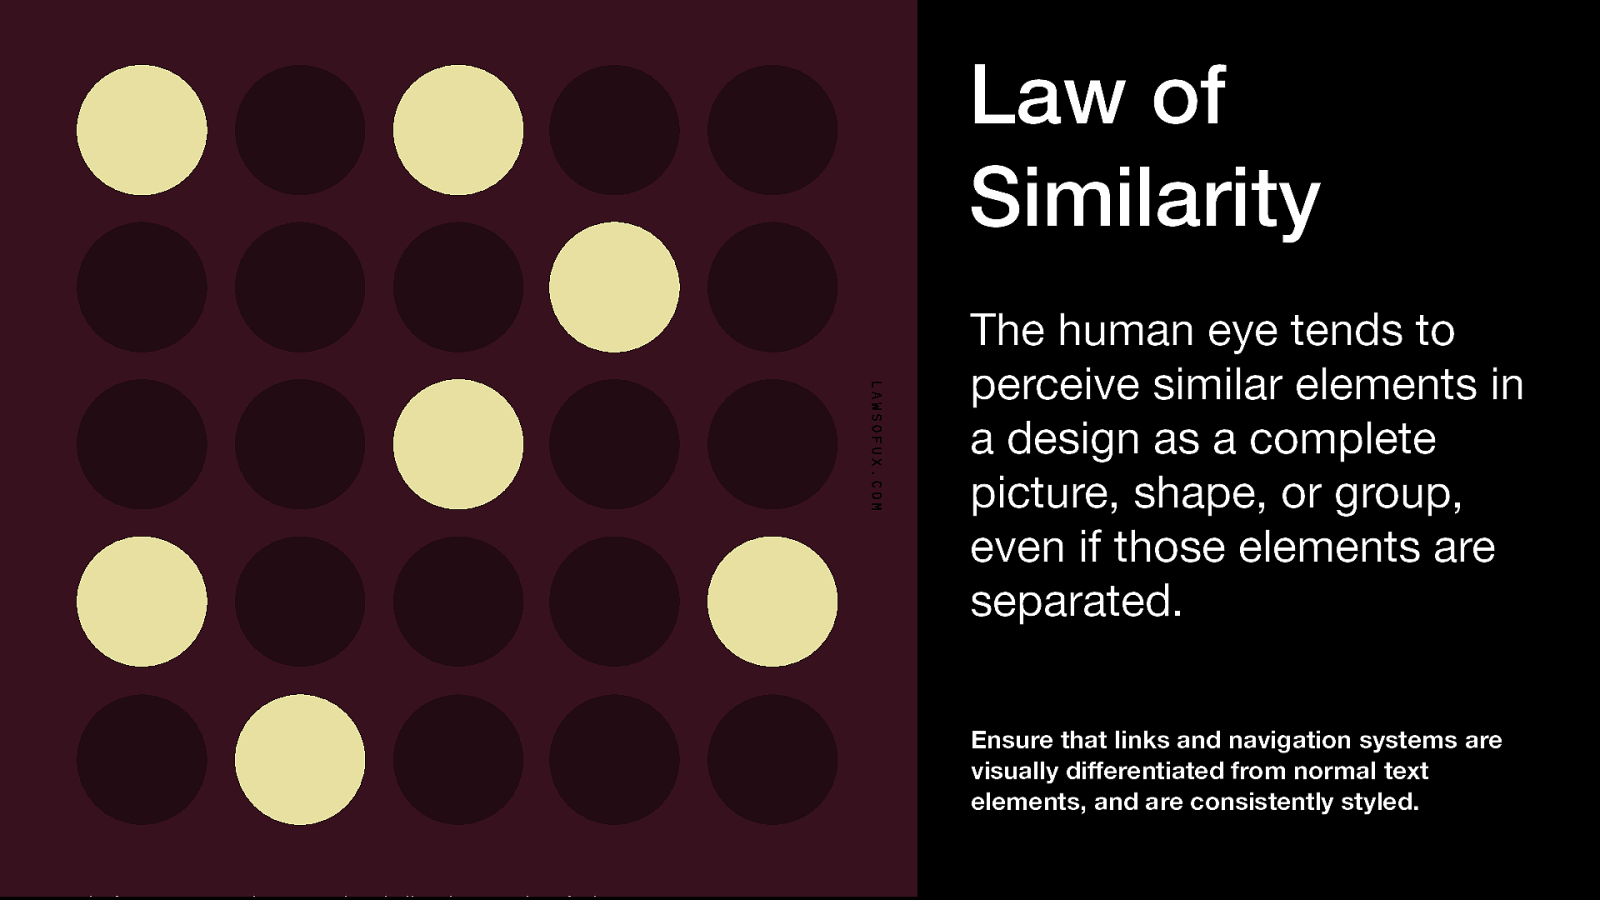
Law of Similarity The human eye tends to perceive similar elements in a design as a complete picture, shape, or group, even if those elements are separated. Ensure that links and navigation systems are visually differentiated from normal text elements, and are consistently styled.
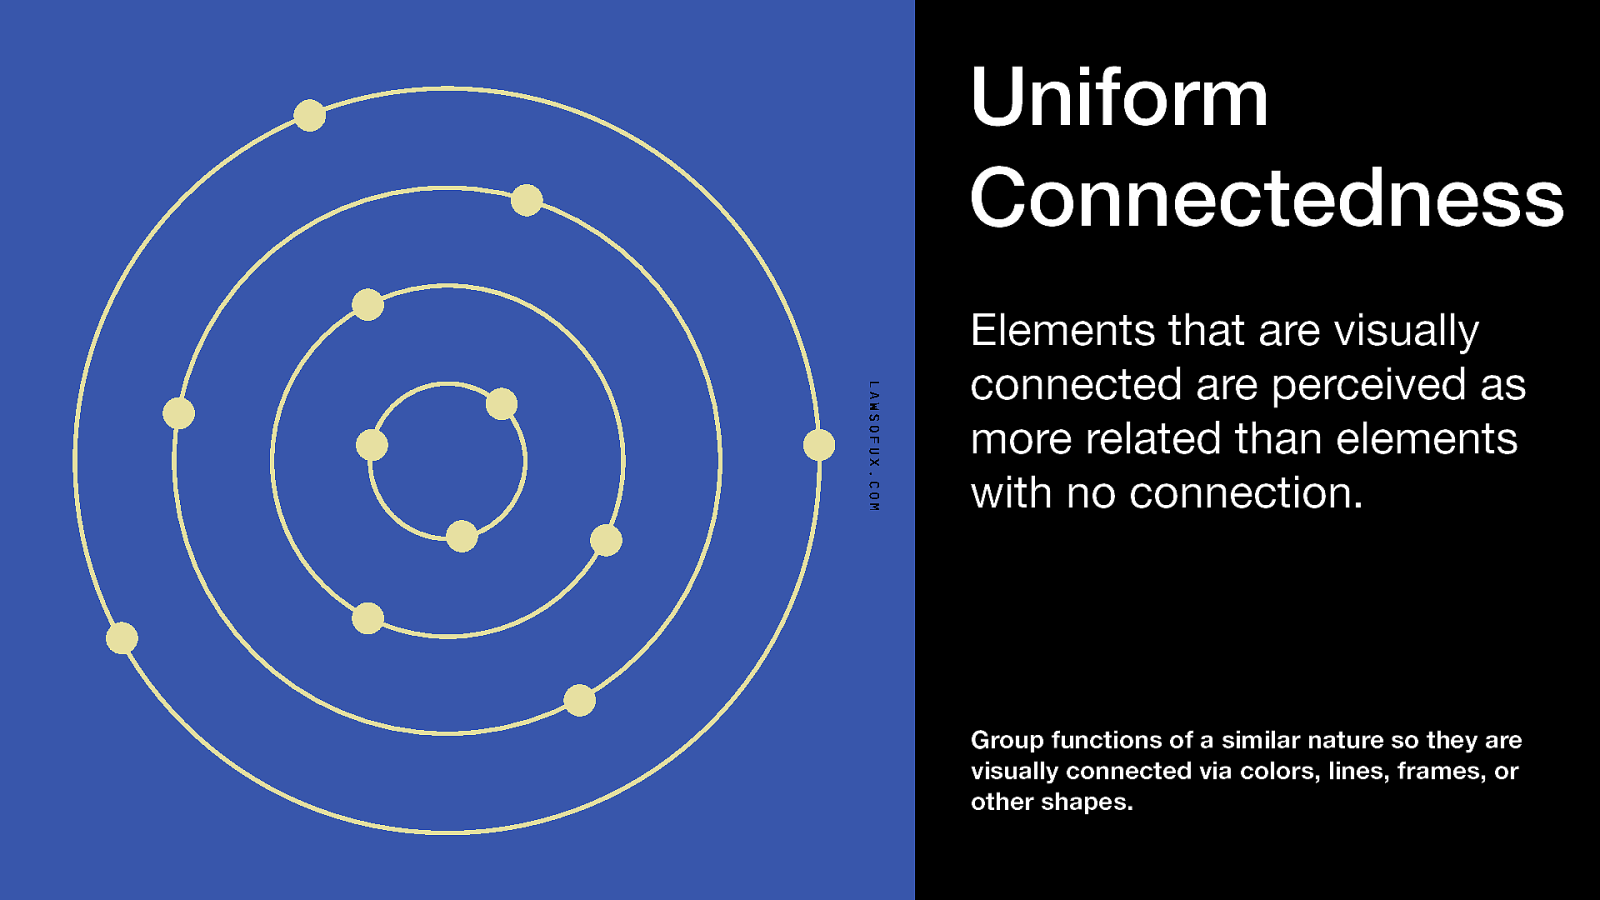
Uniform Connectedness Elements that are visually connected are perceived as more related than elements with no connection. Group functions of a similar nature so they are visually connected via colors, lines, frames, or other shapes.
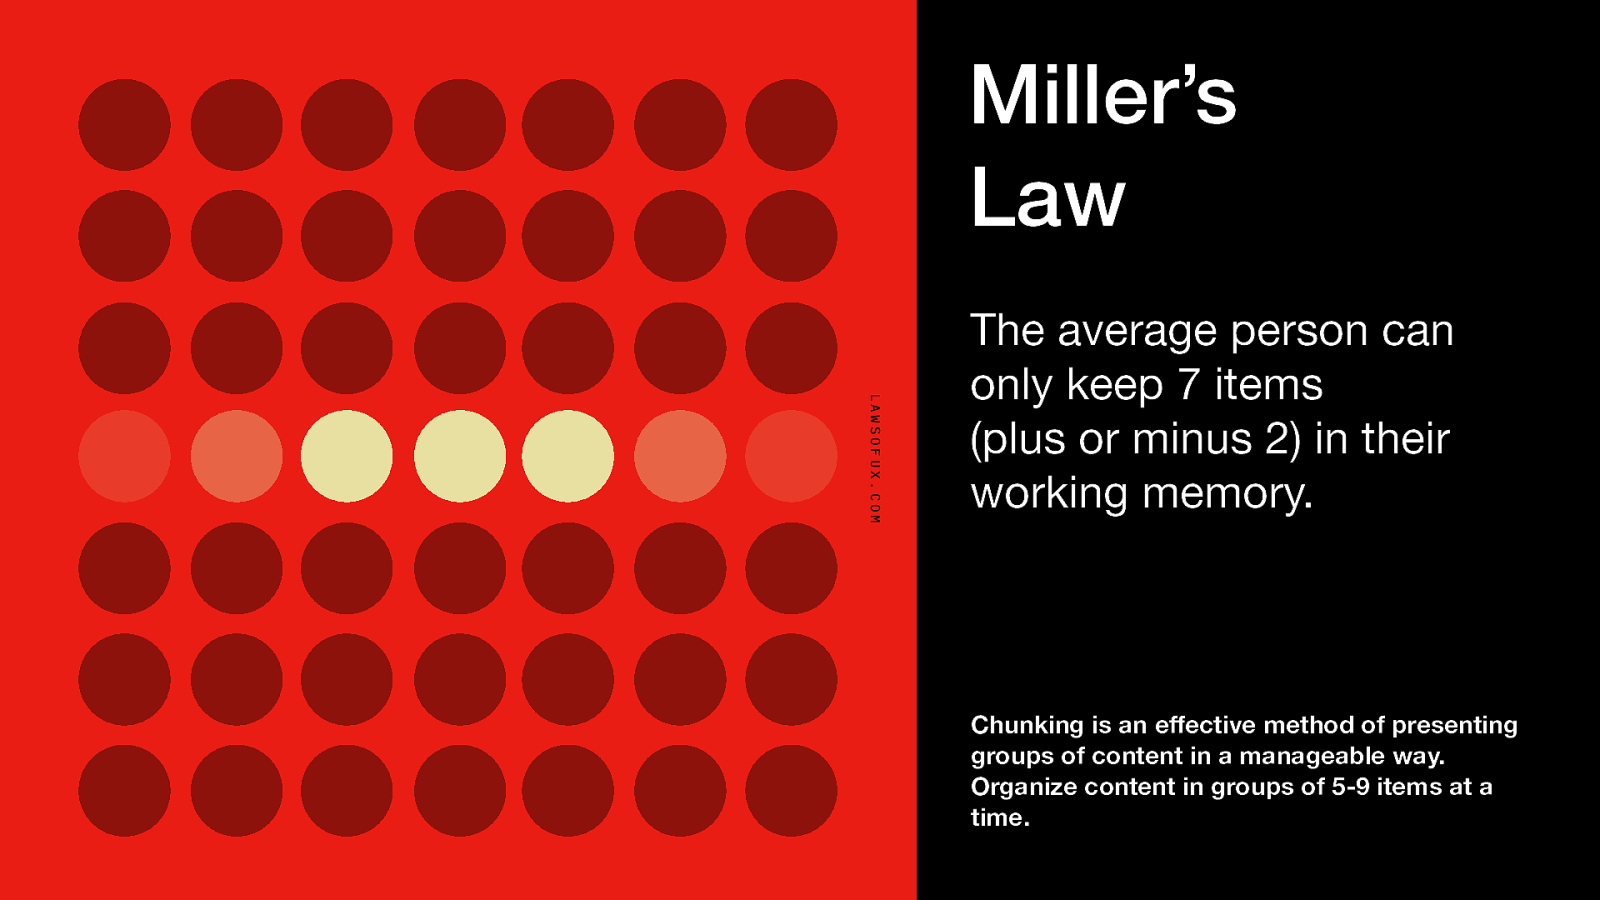
Miller’s Law LAWSOFUX.COM The average person can only keep 7 items (plus or minus 2) in their working memory. Chunking is an effective method of presenting groups of content in a manageable way. Organize content in groups of 5-9 items at a time.
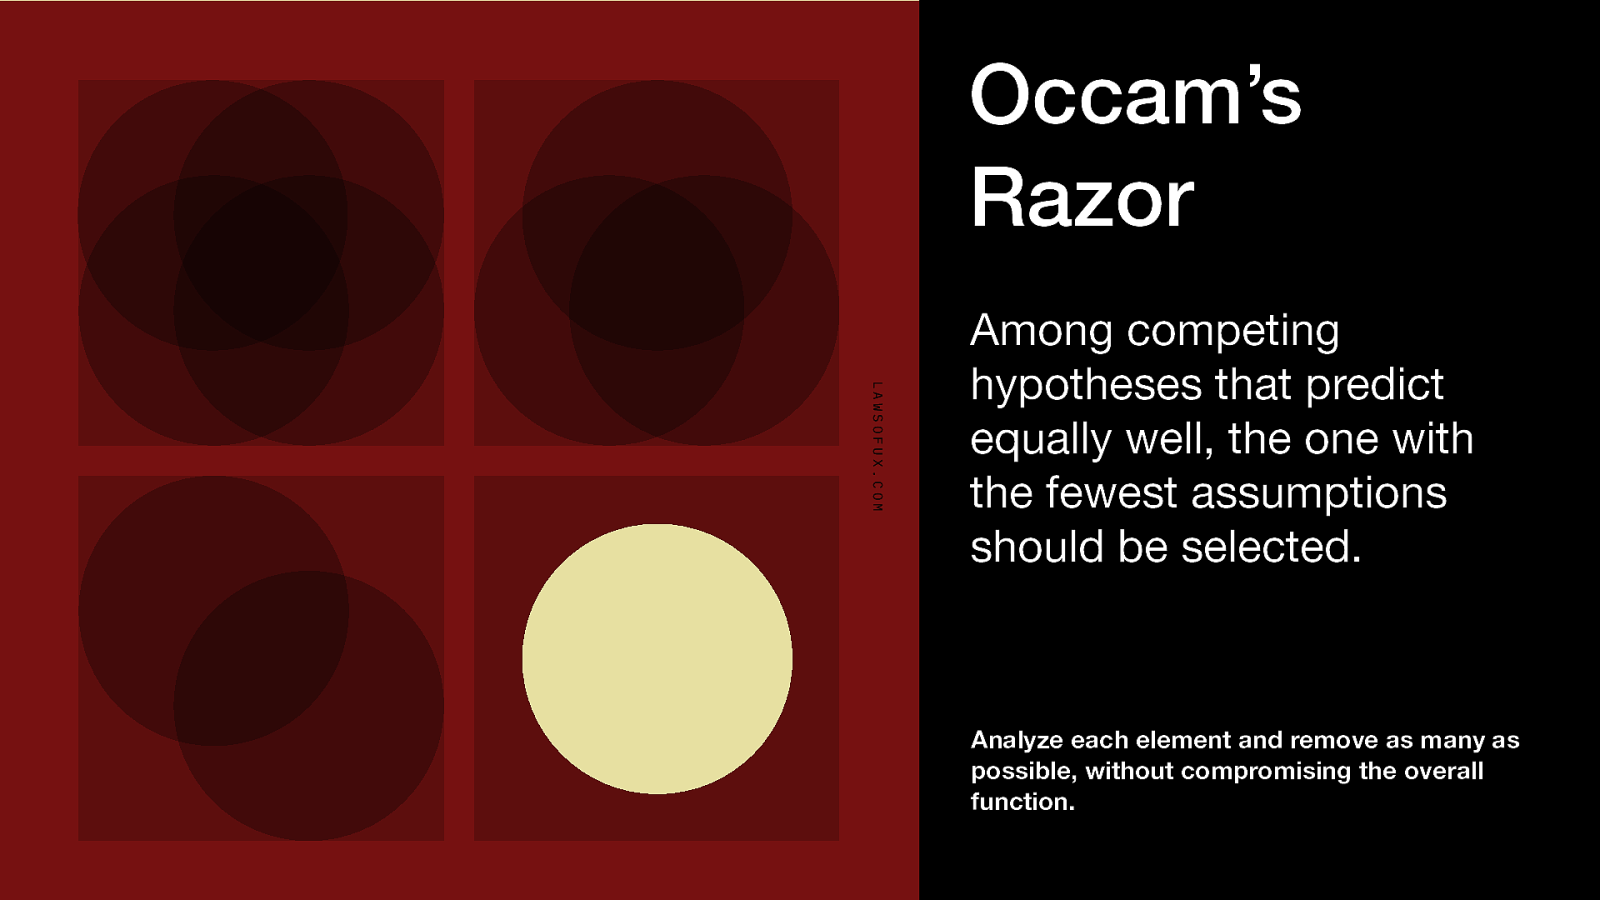
Occam’s Razor LAWSOFUX.COM Among competing hypotheses that predict equally well, the one with the fewest assumptions should be selected. Analyze each element and remove as many as possible, without compromising the overall function.
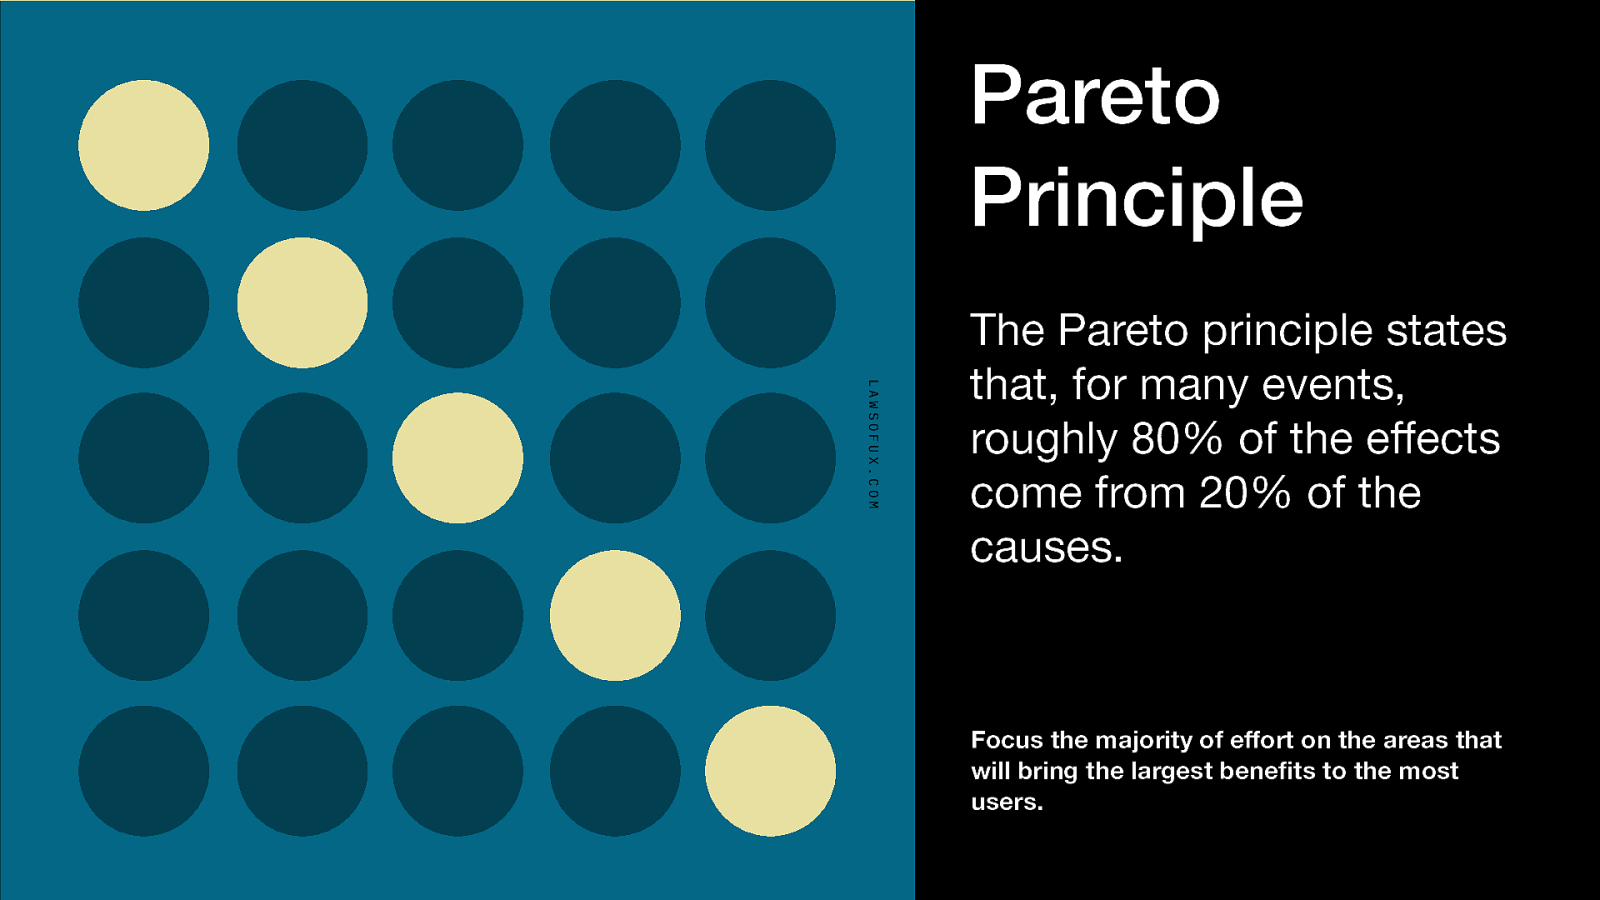
Pareto Principle LAWSOFUX.COM The Pareto principle states that, for many events, roughly 80% of the effects come from 20% of the causes. Focus the majority of effort on the areas that will bring the largest benefits to the most users.
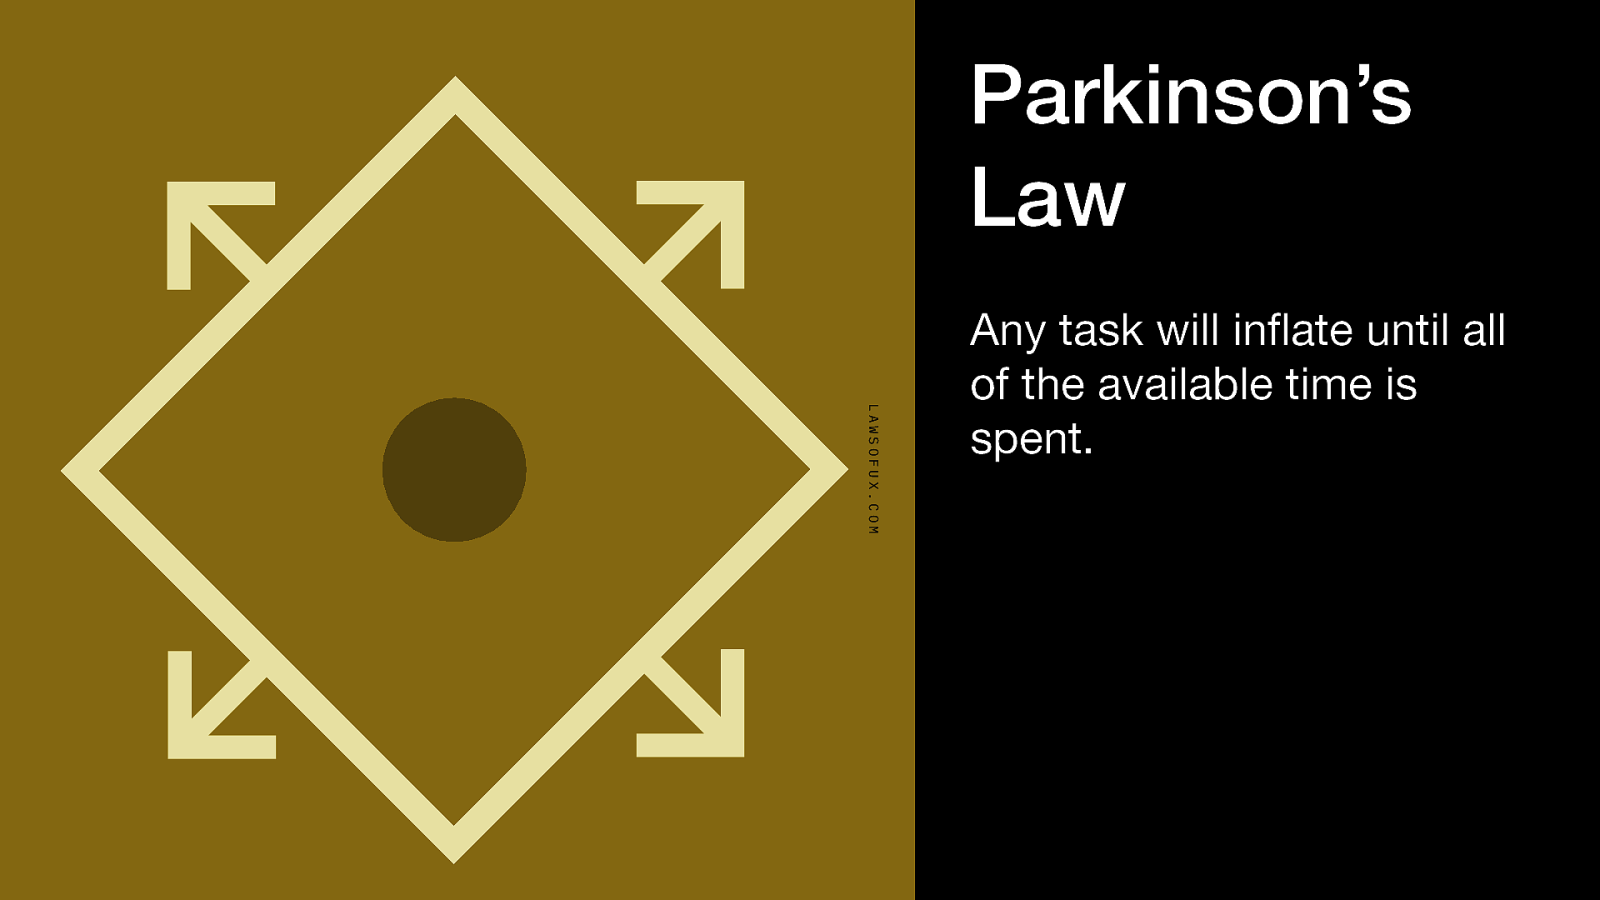
Parkinson’s Law LAWSOFUX.COM Any task will inflate until all of the available time is spent.
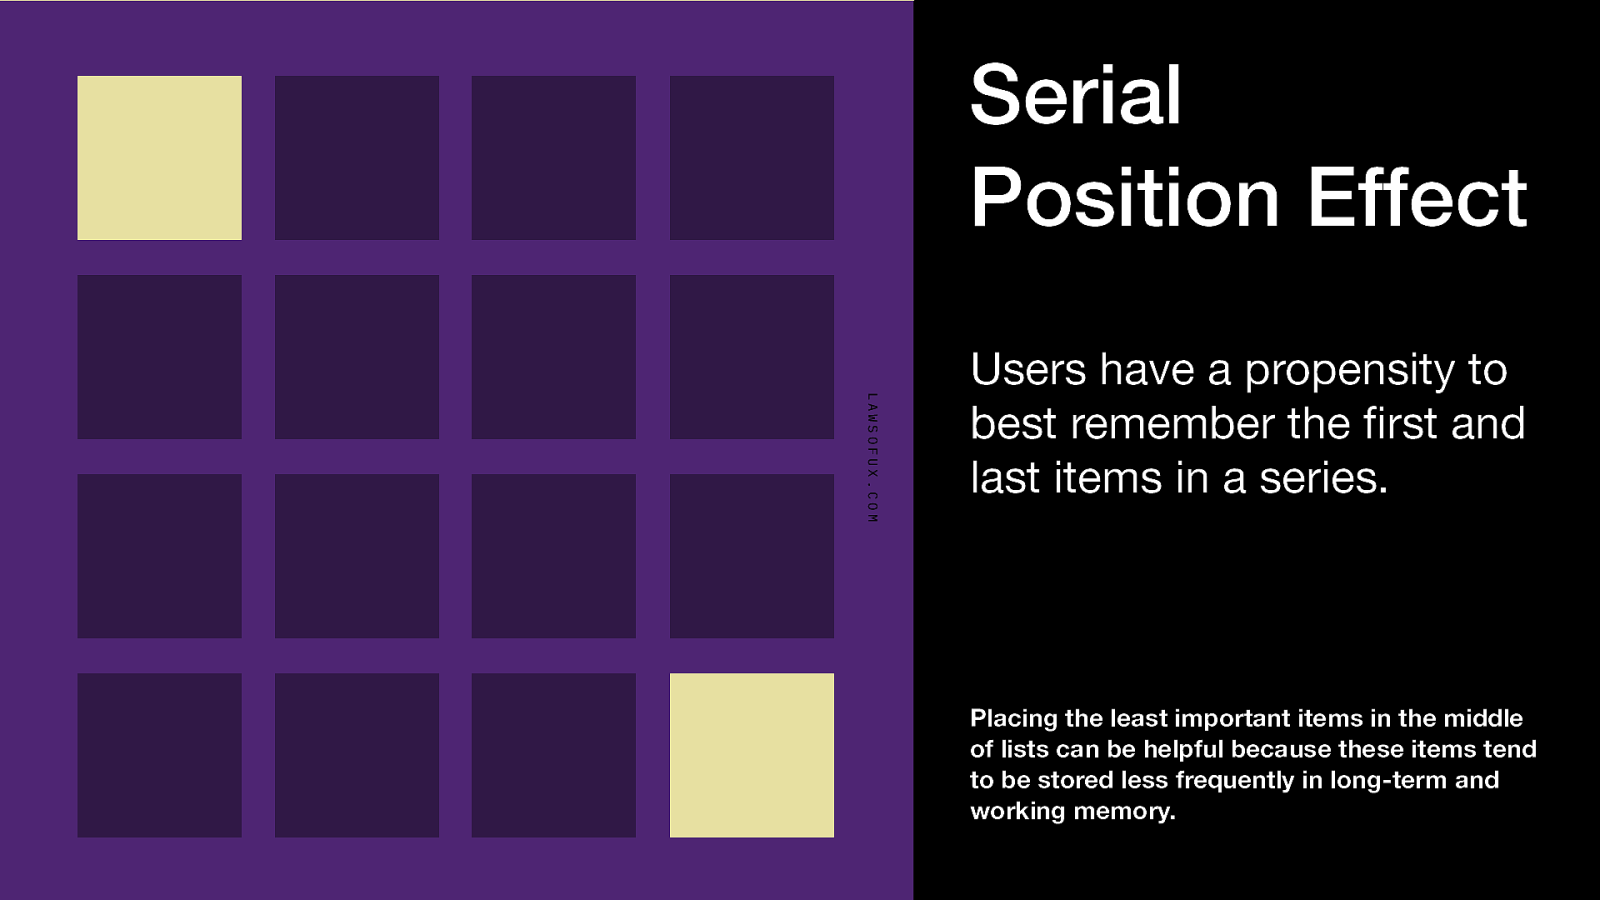
Serial Position Effect LAWSOFUX.COM Users have a propensity to best remember the first and last items in a series. Placing the least important items in the middle of lists can be helpful because these items tend to be stored less frequently in long-term and working memory.
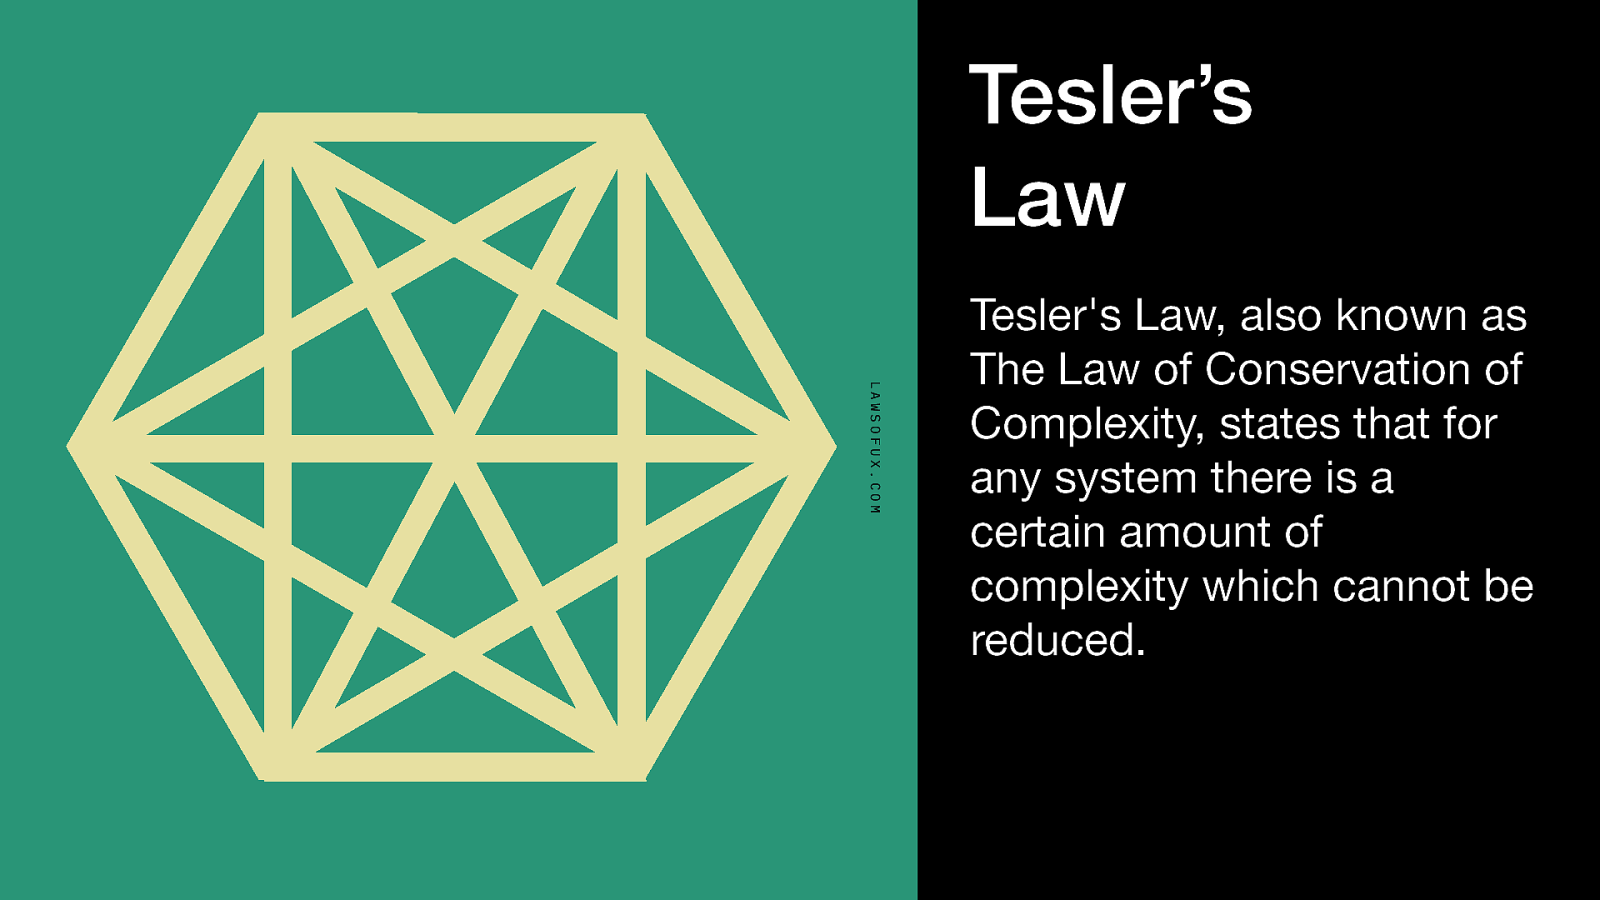
Tesler’s Law LAWSOFUX.COM Tesler’s Law, also known as The Law of Conservation of Complexity, states that for any system there is a certain amount of complexity which cannot be reduced.
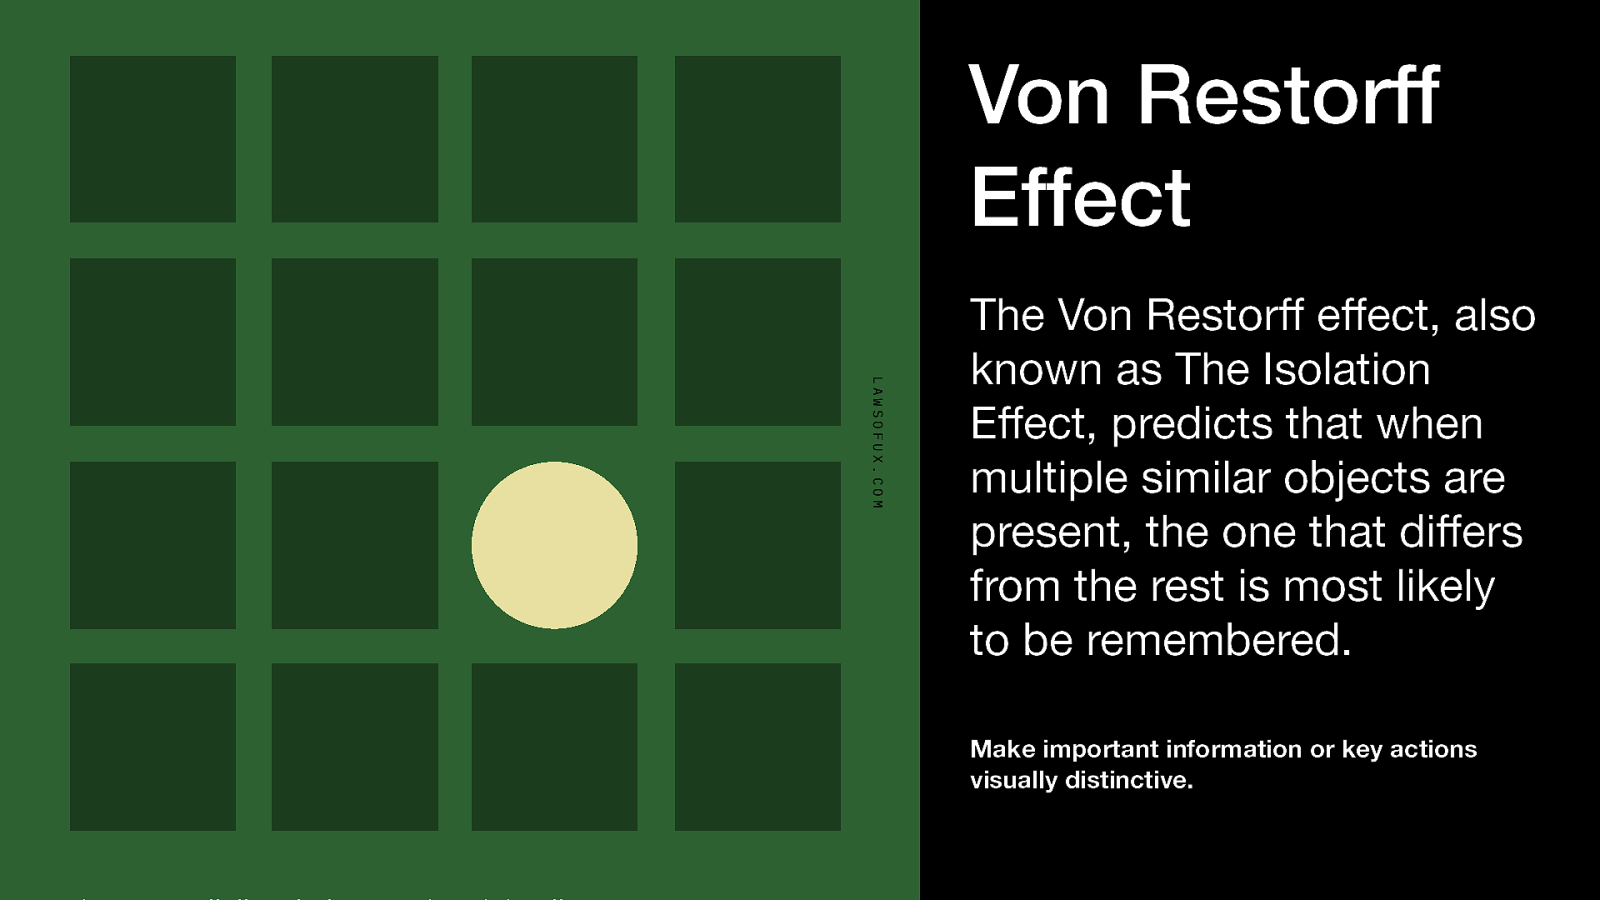
Von Restorff Effect LAWSOFUX.COM The Von Restorff effect, also known as The Isolation Effect, predicts that when multiple similar objects are present, the one that differs from the rest is most likely to be remembered. Make important information or key actions visually distinctive.
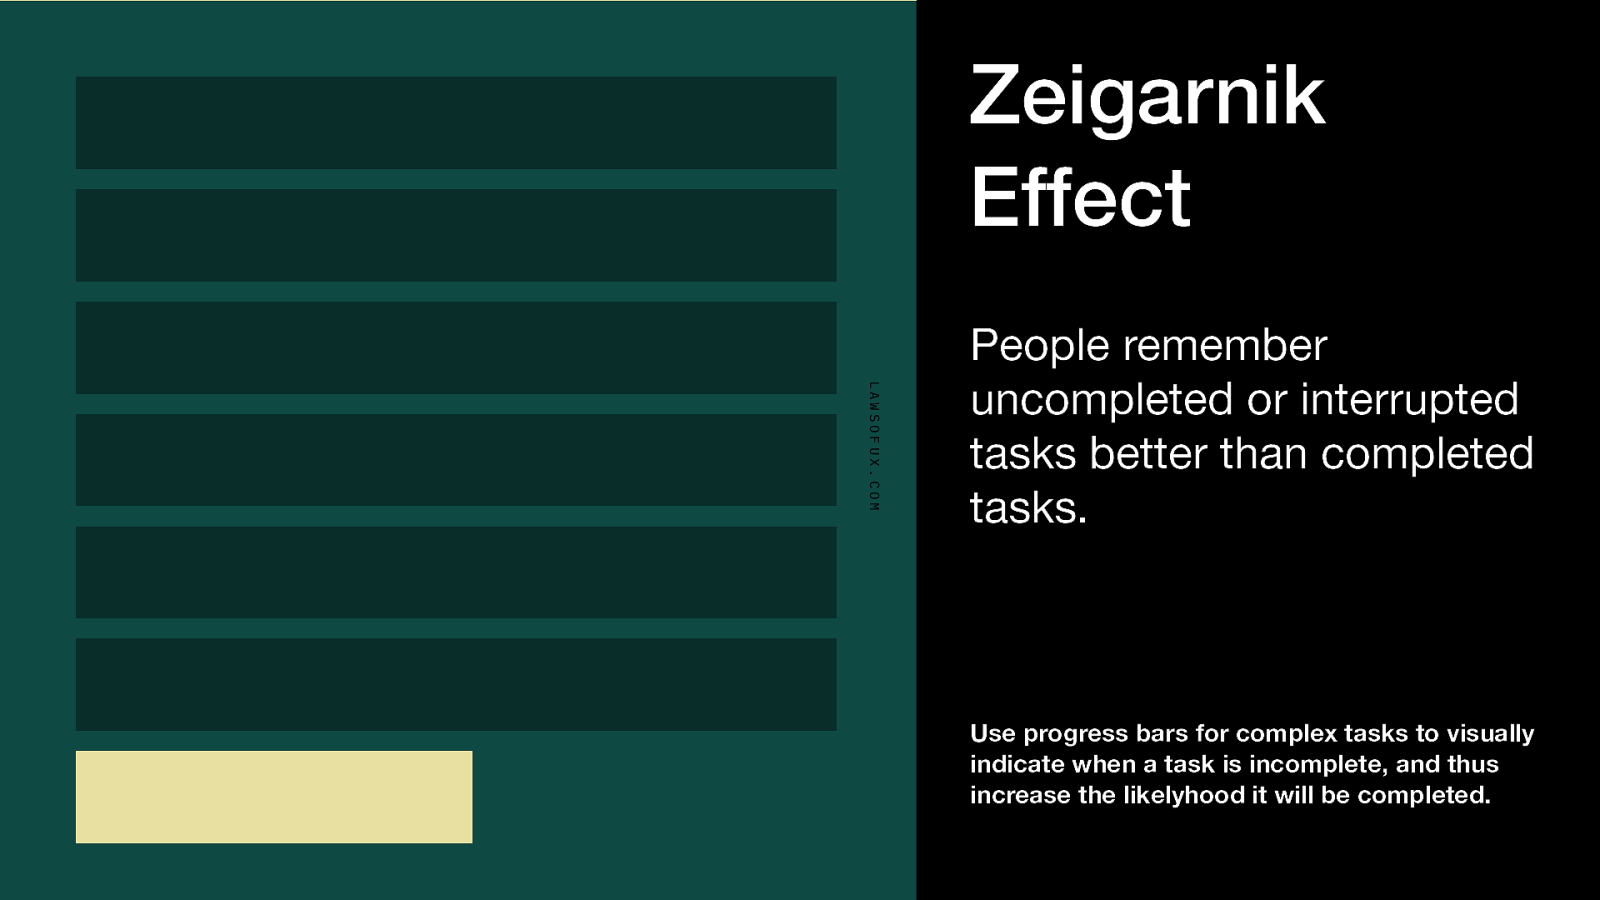
Zeigarnik Effect LAWSOFUX.COM People remember uncompleted or interrupted tasks better than completed tasks. Use progress bars for complex tasks to visually indicate when a task is incomplete, and thus increase the likelyhood it will be completed.

UX is Everyone’s Responsibility
Home Work AGILE, Scrum Design Sprint Design Thinking Growth Hacking Customer Experience
Hatur nuhun ;D Daeng M. Feisal a Happy UX Designer Learner /daengdoang