Distributed and scalable platform for collaborative analysis of massive time series data sets

A presentation at DATA 2019: International Conference on Data Science, E-learning and Information Systems in July 2019 in Prague, Czechia by Ed Duarte

Slide 1

Slide 1

Slide 2

Slide 2

Introduction

  • In the last few years we have been in the presence of the phenomenon of increased metrification;
  • How to derive meaning from huge amounts of complex raw data while it continues to grow every day? The answer: collaborative (human or automated) analysis;
  • Analysis is more agile when done within a software solution, especially when collaborators work in a shared network, evolving a mutual knowledgebase without physical presence.

Slide 3

Slide 3

Introduction - Time series analysis

  • Example domains with massive time series data sets: medical diagnosis using EEGs and ECGs, financial technical analysis, monitoring of natural phenomenons, athlete performance monitoring;
  • Analysis methodologies have to handle data entropy at storage and visual levels.

Slide 4

Slide 4

Introduction - Time series visualization

  • In highly heterogeneous use cases, there is a need to compare data from different measurements and source devices;
  • Why webapps? Because of recent developments made to web technologies and the near-universal availability of browsers.

Slide 5

Slide 5

Introduction - Annotation

  • Time series alone cannot convey meaning, only allude to it;
  • Annotations allow collaborators to critique, create memory-aids, highlight patterns, and circumventing rigid records by adding meta-data that was not originally envisioned by the creators of the input data set;
  • Annotations in time series are commonly associated ONLY with segments of time, occupying the full vertical area in the chart;
  • Because of this, annotations cannot visually relate to a subset of the visible series in a chart, but rather to all of them.

Slide 6

Slide 6

Proposal

  • The problem: current solutions do not handle realistic scenarios of analysis very well (massive data sets = too slow, unintuitive visualization);
  • Additional features include versioning, user management and authentication;
  • Focus on consistency for the ontology and availability for the series; Prototype is completely domain-agnostic.

Slide 7

Slide 7

Proposal - Data model

  • Time series are uniquely identified by source-measurement pairs;
  • Annotation types enforce a common dictionary to catalog the annotations, one that is shared by all projects;
  • Annotations explicitly mapping a set of series is one of the main differentiators of our model;
  • All entities are versioned.

Slide 8

Slide 8

Proposal - Data management (1/2)

  • InfluxDB was the best candidate for queries and long-term storage of massive time series data sets (due to rollups that summarize data optimized by timestamp);
  • InfluxDB has a more limited data model for data that is not series, so another database was required;
  • A relational database was better a better fit for the ontology because most queries required (all or part of the) related entities;
  • PostgreSQL was the best candidate for the ontology due to its highly consistent and ACID-compliant MVCC model;
  • The central backend acts as a stateless broker.

Slide 9

Slide 9

Proposal - Data management (2/2)

  • Example of a query that could lead to a bottleneck: querying series (on InfluxDB) by their annotations, types or projects (on PostgreSQL) would require a request to PostgreSQL so that these results (which include annotation’s affected series) could be used to request InfluxDB;
  • These ad-hoc links are eventually-consistent: updating an annotation’s affected series with the annotation links takes some time (inconsistency window), so querying during that time will return obsolete results;
  • So why not place all of the data in PostgreSQL, allowing series to fetch associated annotations through joins? See “Evaluation” section.

Slide 10

Slide 10

Proposal - Architecture (1/7)

  • User sends requests to frontend on the left (or to the REST API directly) -> eventually arrives at the relevant databases on the right;
  • Cache: remember the result of expensive queries (e.g. computing annotation’s and their types between a start and an end timestamp) to speed up the following calls.

Slide 11

Slide 11

Proposal - Architecture (2/7)

  • InfluxDB does not have transactions with atomic writes, and overlapping update propagations can lead to data loss;
  • This is fixed with a FIFO queue (only for writes, reads are not queued) -> eventually consistent writes (they already were, but the inconsistency window is increased).

Slide 12

Slide 12

Proposal - Architecture (3/7)

  • The backend is replicated;
  • Load balancer is the only entry point;
  • A load balancer cannot queue requests on its own, so it would keep redirecting requests even if all replicas are under strain;
  • The distributed queue allows requests to be queued when all backend replicas are under strain (and if more cannot be spawned on-the-fly).

Slide 13

Slide 13

Proposal - Architecture (4/7)

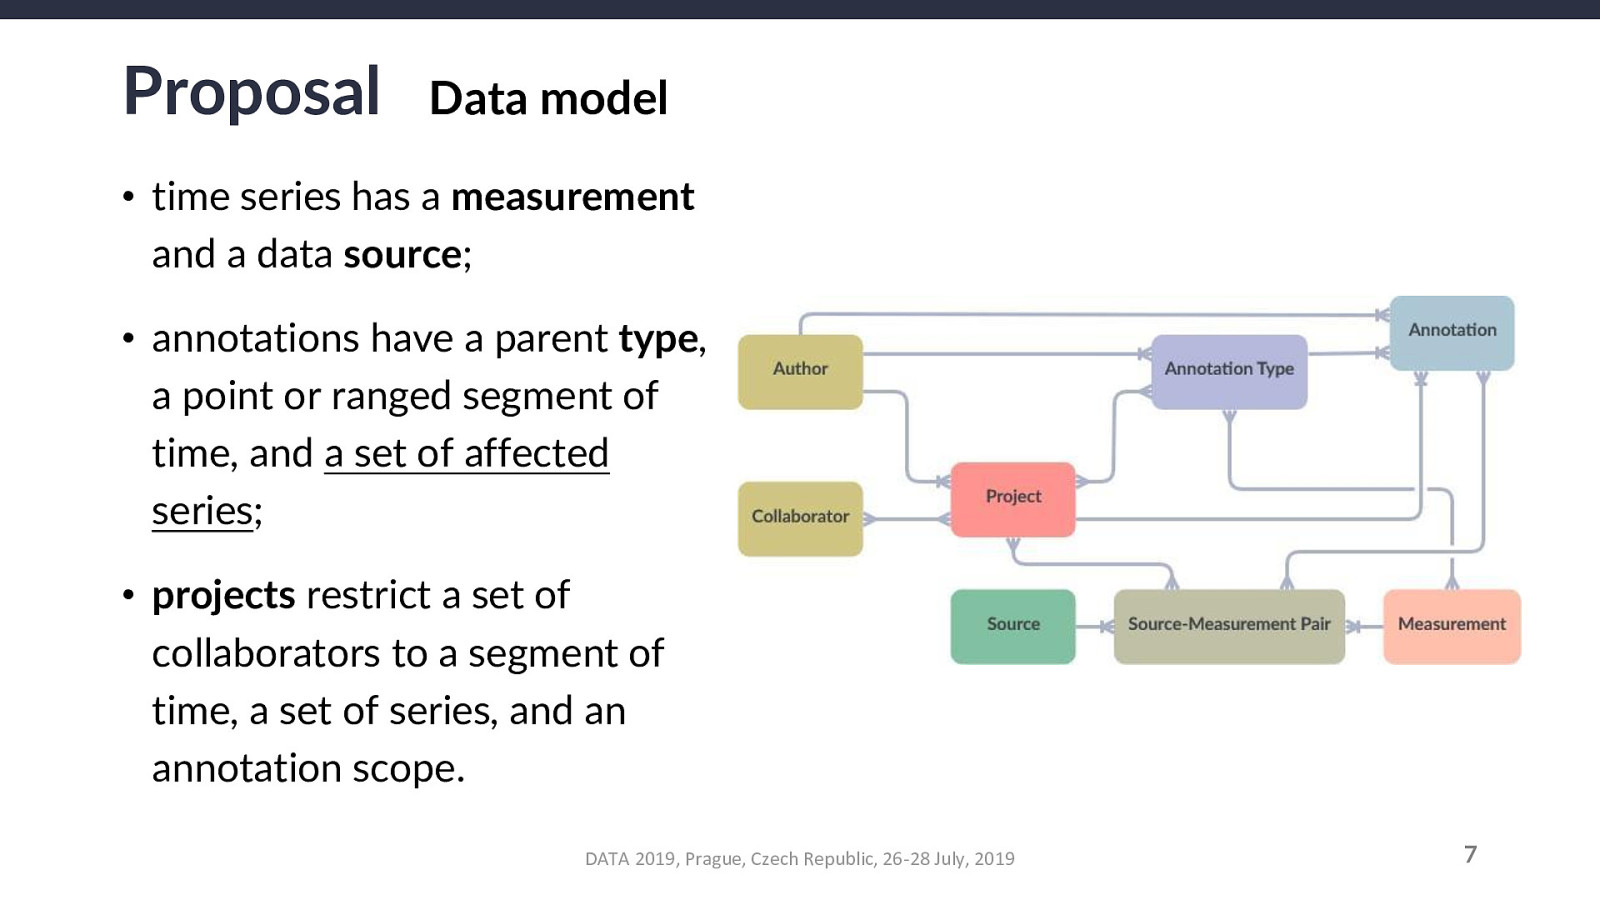
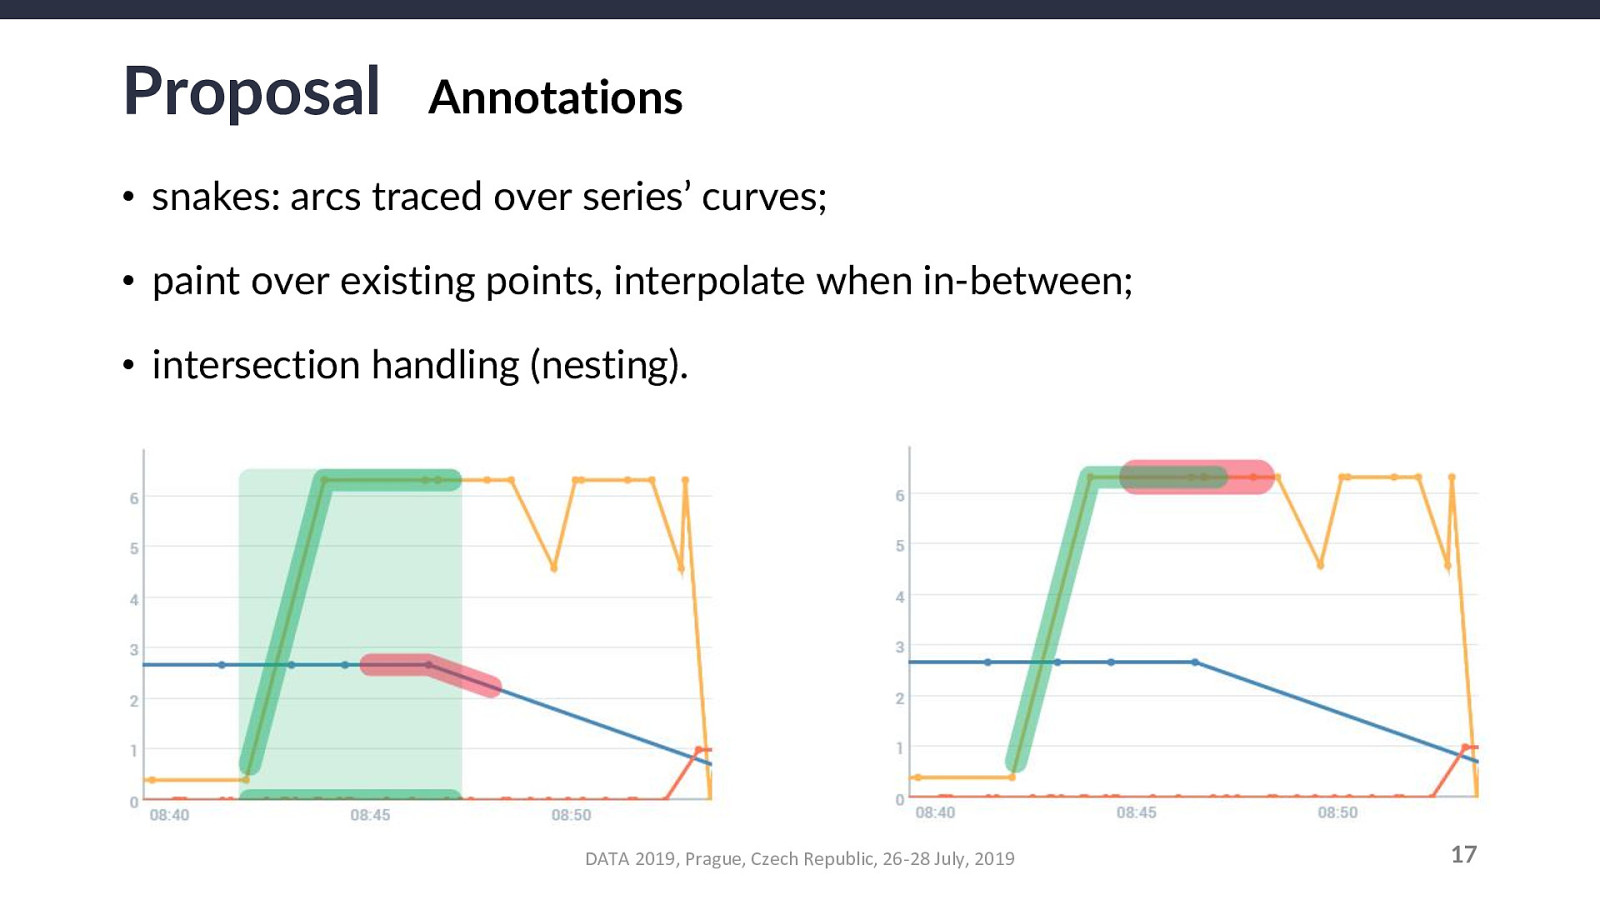
For an annotation A, a parent annotation-type T, a parent project P, a measurement M, and a source-measurement pair SM that combines any source with M, the relationship constraints that must be validated are as follows:

  • P allows T, both being parents of A;
  • A is annotating SM, which P is querying;
  • A is annotating SM, hence is annotating M, which T allows;
  • A is annotating a segment of time (point or region) that T allows.

Their corollaries (in the case of removal operations) are:

  • P cannot revoke SM if at least one of its child A is still annotating SM;
  • T cannot revoke M if at least one of its child A is still annotating SM, hence annotating M;
  • T cannot revoke a segment type (point or region) if at least one of A is set with it;
  • P cannot revoke T if at least one of A is still of type T.

Slide 14

Slide 14

Proposal - Architecture (5/7)

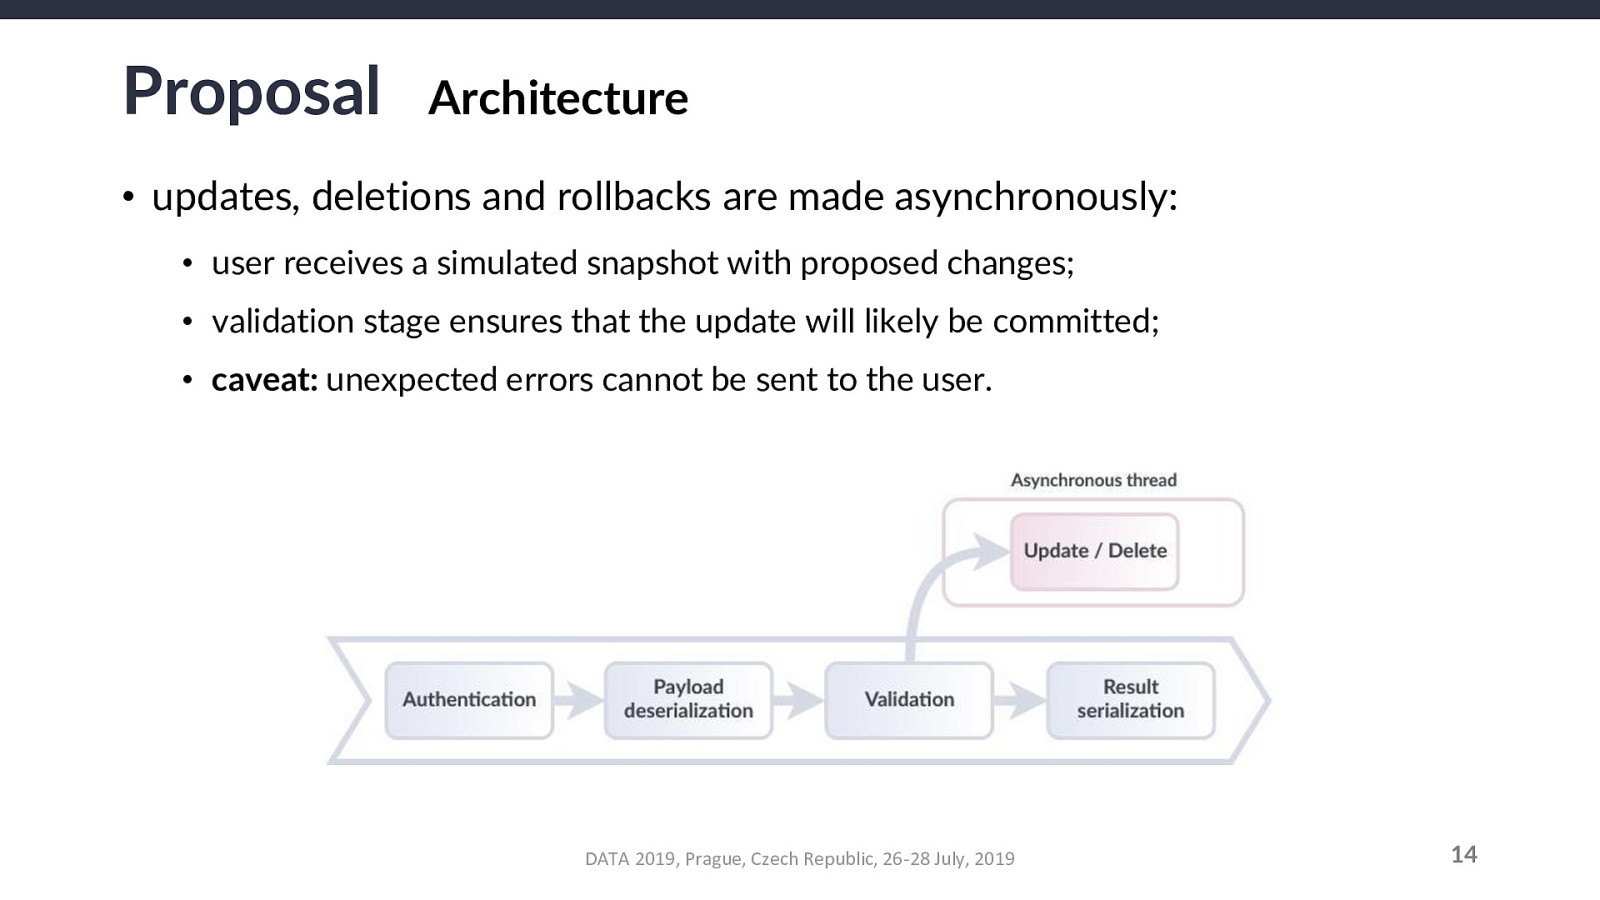
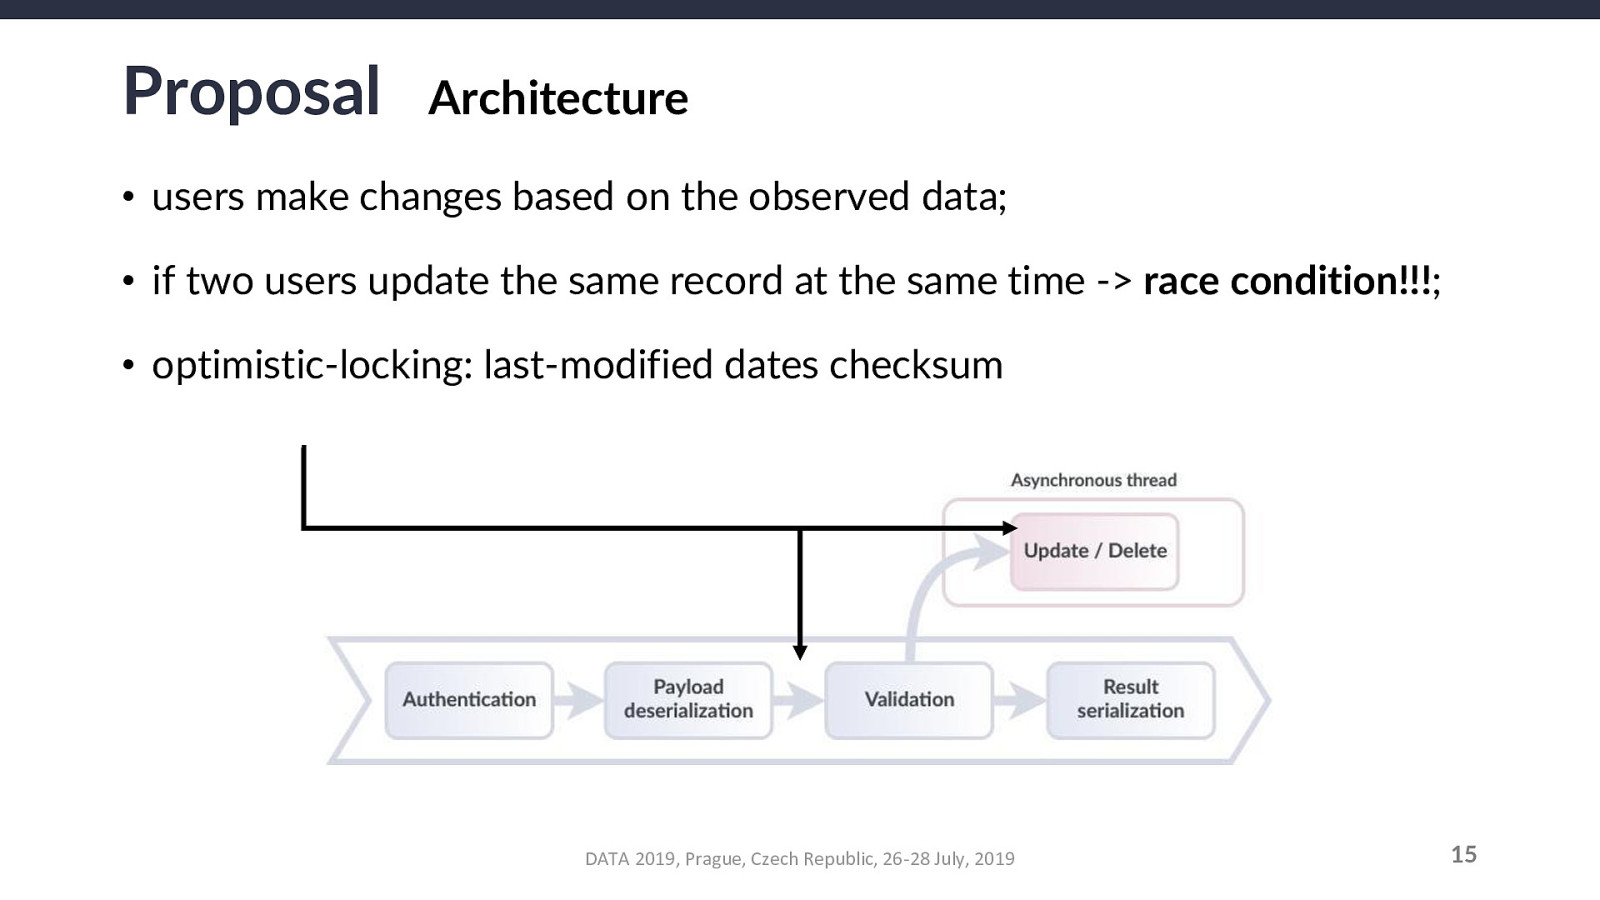
Another caveat: this opens an inconsistency window at the local level of the requesting user (between they receive the simulated snapshot and until the actual changes are committed to the database). This does NOT affect the actual system nor the other users.

Slide 15

Slide 15

Proposal - Architecture (6/7)

  • The race condition here means that the ordering of events affects the knowledge-base’s correctness;
  • The last atomically received write will overlap the previous one, and although the overlapped variant is versioned and can be recovered, the users are not properly notified of this;
  • Users must always send the local last-modified date of the edited entity on update requests;
  • If the check fails, the user is reading obsolete data and should manually refresh to merge;
  • This check should not be done solely at the backend level, as simultaneous operations could still overlap on the database;
  • Therefore, the second check occurs at the transactional level (atomic, so it’s not possible to query a “limbo” state in which the check is made and the entity is updated);
  • The first check is just to make sure we don’t waste our time doing validations if the last-modified date is already obsolete.

Slide 16

Slide 16

Proposal - Architecture (7/7)

  • Separation of Concerns: one repository, one service and one controller for each of the entities in our data model;
  • Series queries use a structured object (serialized in JSON) -> query objects follow a deterministic schema that is parseable and that can be constructed using query-builder UIs.

Slide 17

Slide 17

Proposal - Annotations

  • On left: annotations intersect in the same segment of time, but not over the same series;
  • On right: annotations intersect in both segment of time and series;
  • Width adjustment to keep both snakes (inner and outer) clickable.

Slide 18

Slide 18

DEMO

Slide 19

Slide 19

Evaluation - Time series in PostgreSQL (1/3)

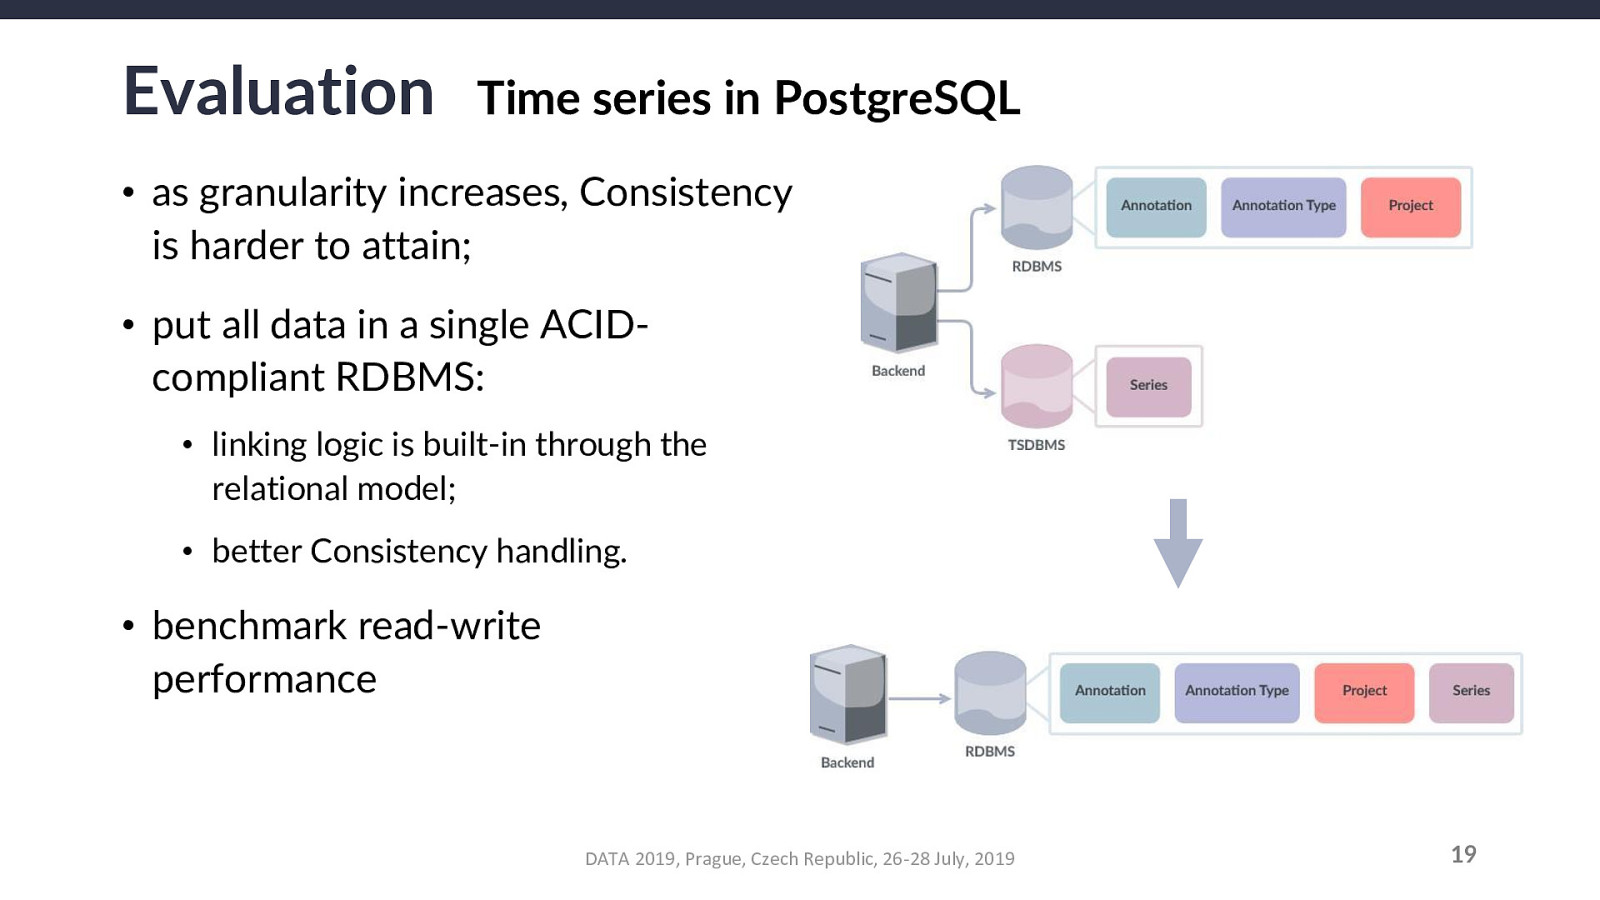
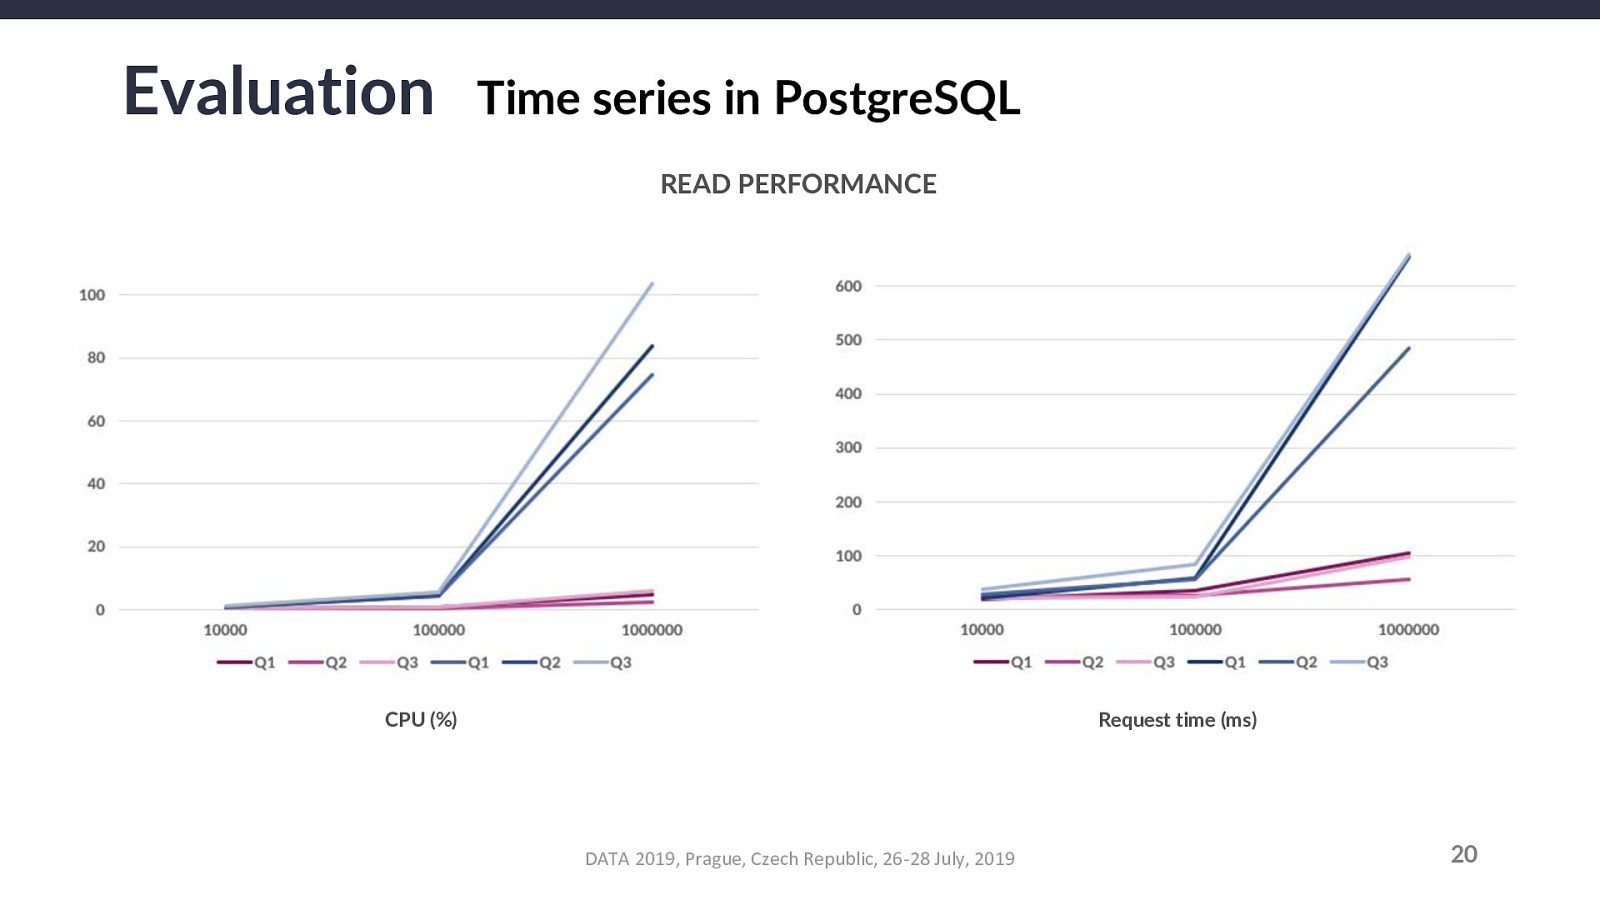
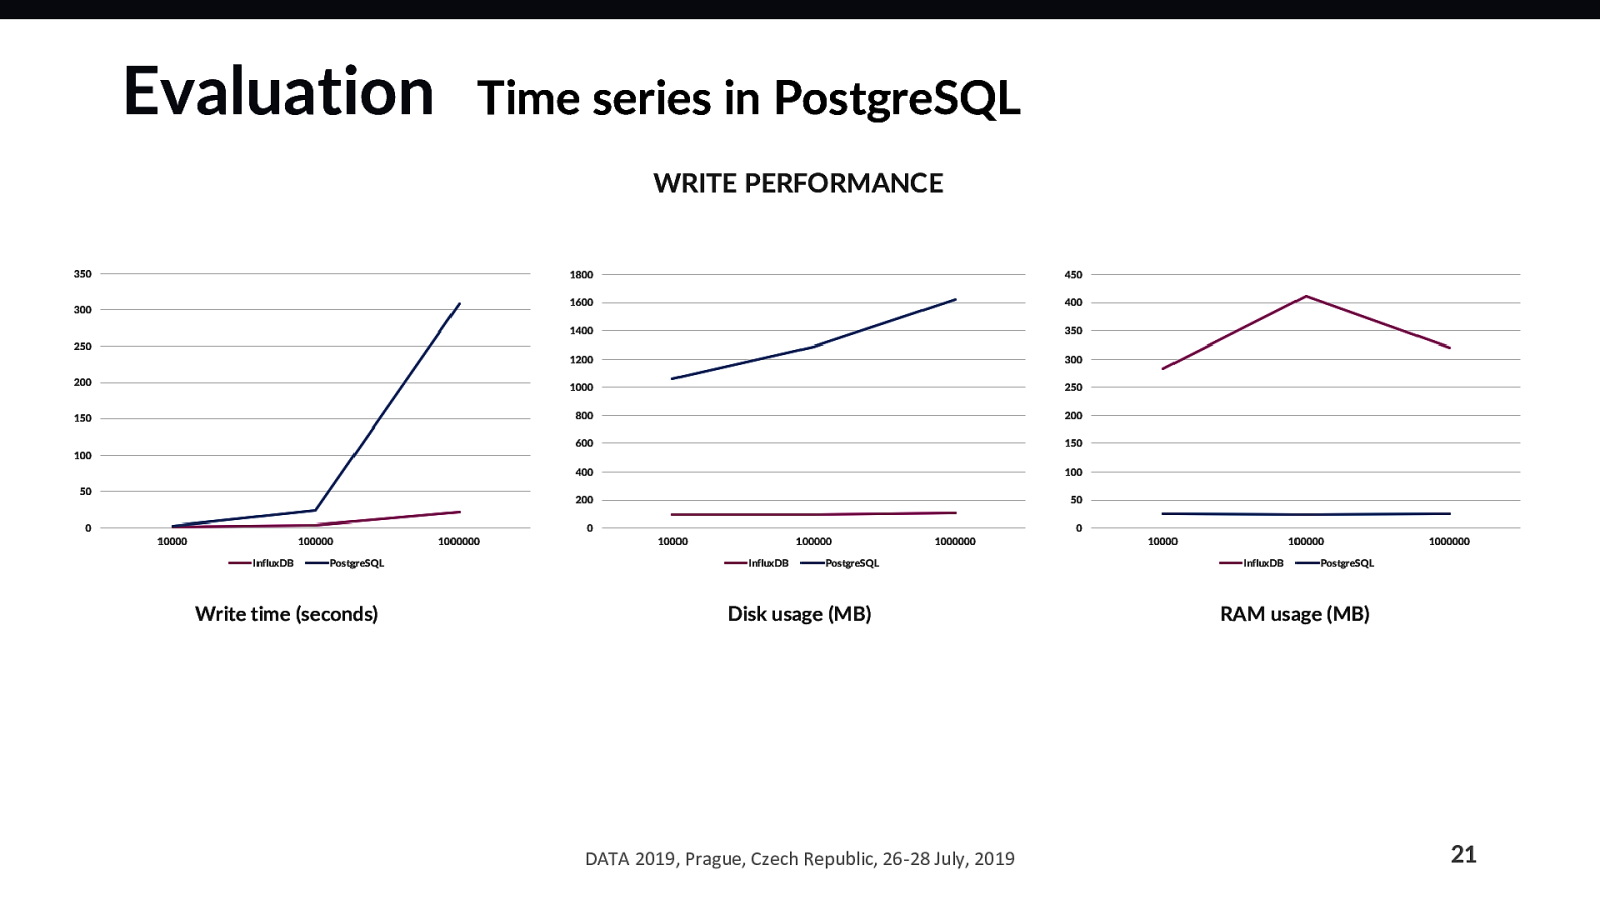
The end goal is to recognize either an improvement or a negligible drop: if PostgreSQL has an inconsequentially lower performance, it is still worth using it for series for the possible gains (higher system consistency).

Slide 20

Slide 20

Evaluation - Time series in PostgreSQL (2/3)

  • Blue lines are PostgreSQL, Purple lines are InfluxDB;
  • For smaller data sets, performance differences are negligible;
  • For larger data sets, estimated time and resource usage increase exponentially.

Slide 21

Slide 21

Evaluation - Time series in PostgreSQL (3/3)

  • InfluxDB has better data ingestion rate and data compression (more scalable);
  • InfluxDB uses more RAM (to store rollups).

Slide 22

Slide 22

Conclusion

  • The proposed platform enables stronger collaborative framework and eases the process of knowledge discovery/acquisition;
  • Annotations occupy smaller areas of the vertical space, increasing intuitiveness and reducing visual noise;
  • With this, we have a strong foundation to build stronger collaborative frameworks in other domains;
  • Future Work: user permission granularity, multiple parent annotation types (behave like tags), database sharding, snake scrubbing to edit, bezier curves for series in line graphs, streamed transmission of query results (WebSocket).

Slide 23

Slide 23

END