Malta Interaction to Next Measuring responsiveness on the web Paint Kevin Farrugia @imkevdev

A presentation at Google I/O Extended - Malta in June 2022 in Malta by Kevin Farrugia
Malta Interaction to Next Measuring responsiveness on the web Paint Kevin Farrugia @imkevdev
Responsiveness INP measures how quickly a page responds to a user interaction Malta
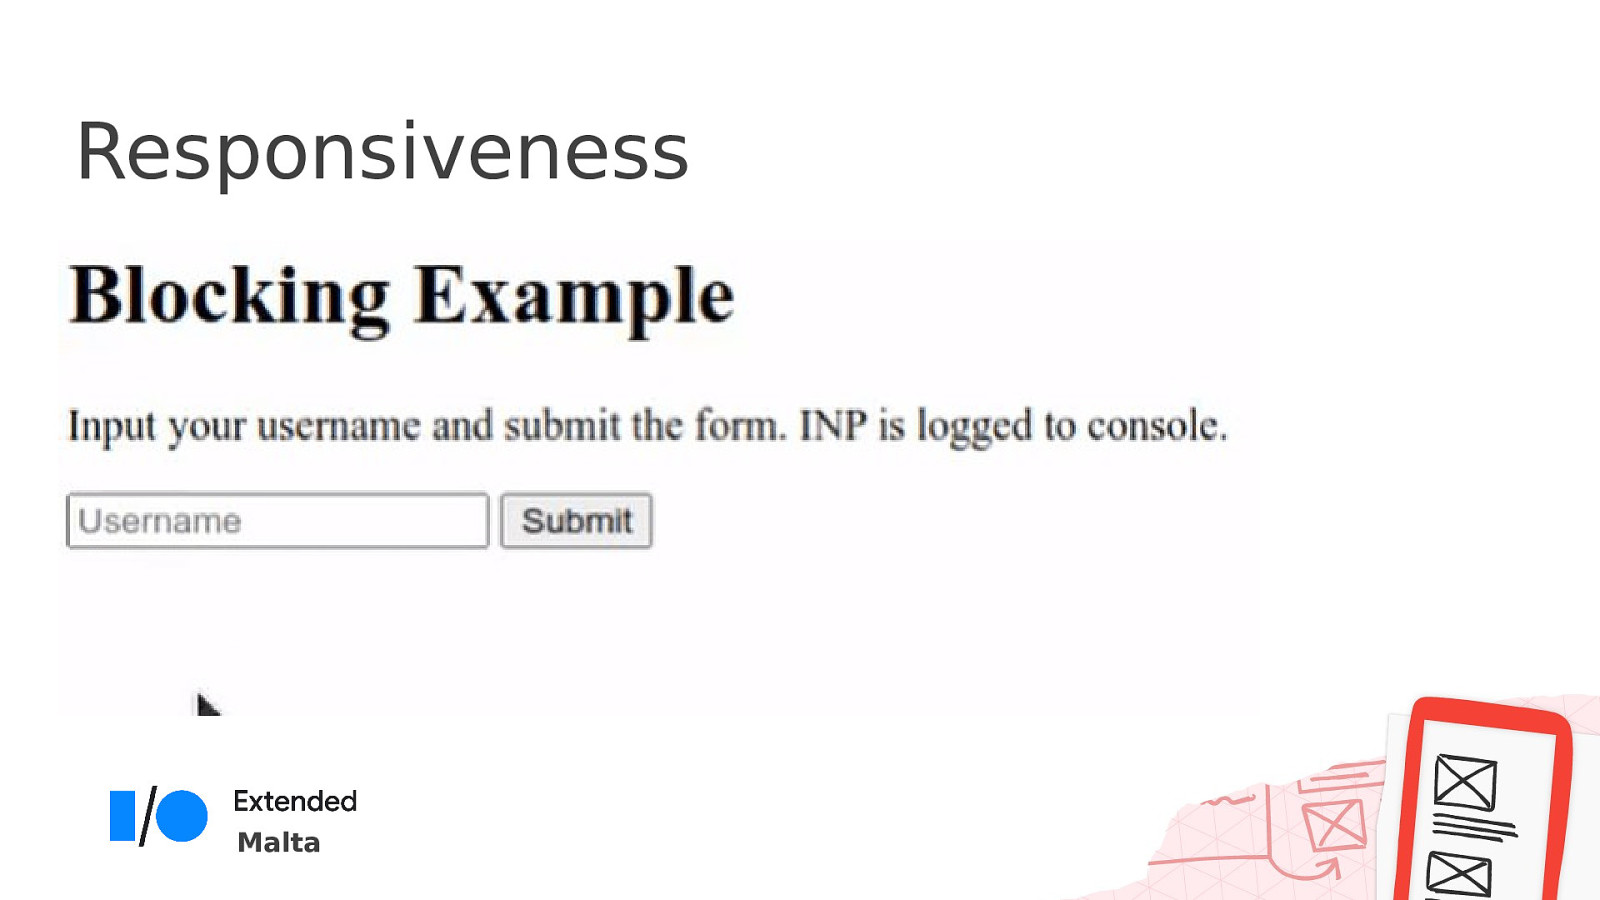
Responsiveness Malta
First Input Delay ●Measures the first interaction on a page. ●Only includes the delay in processing. Malta
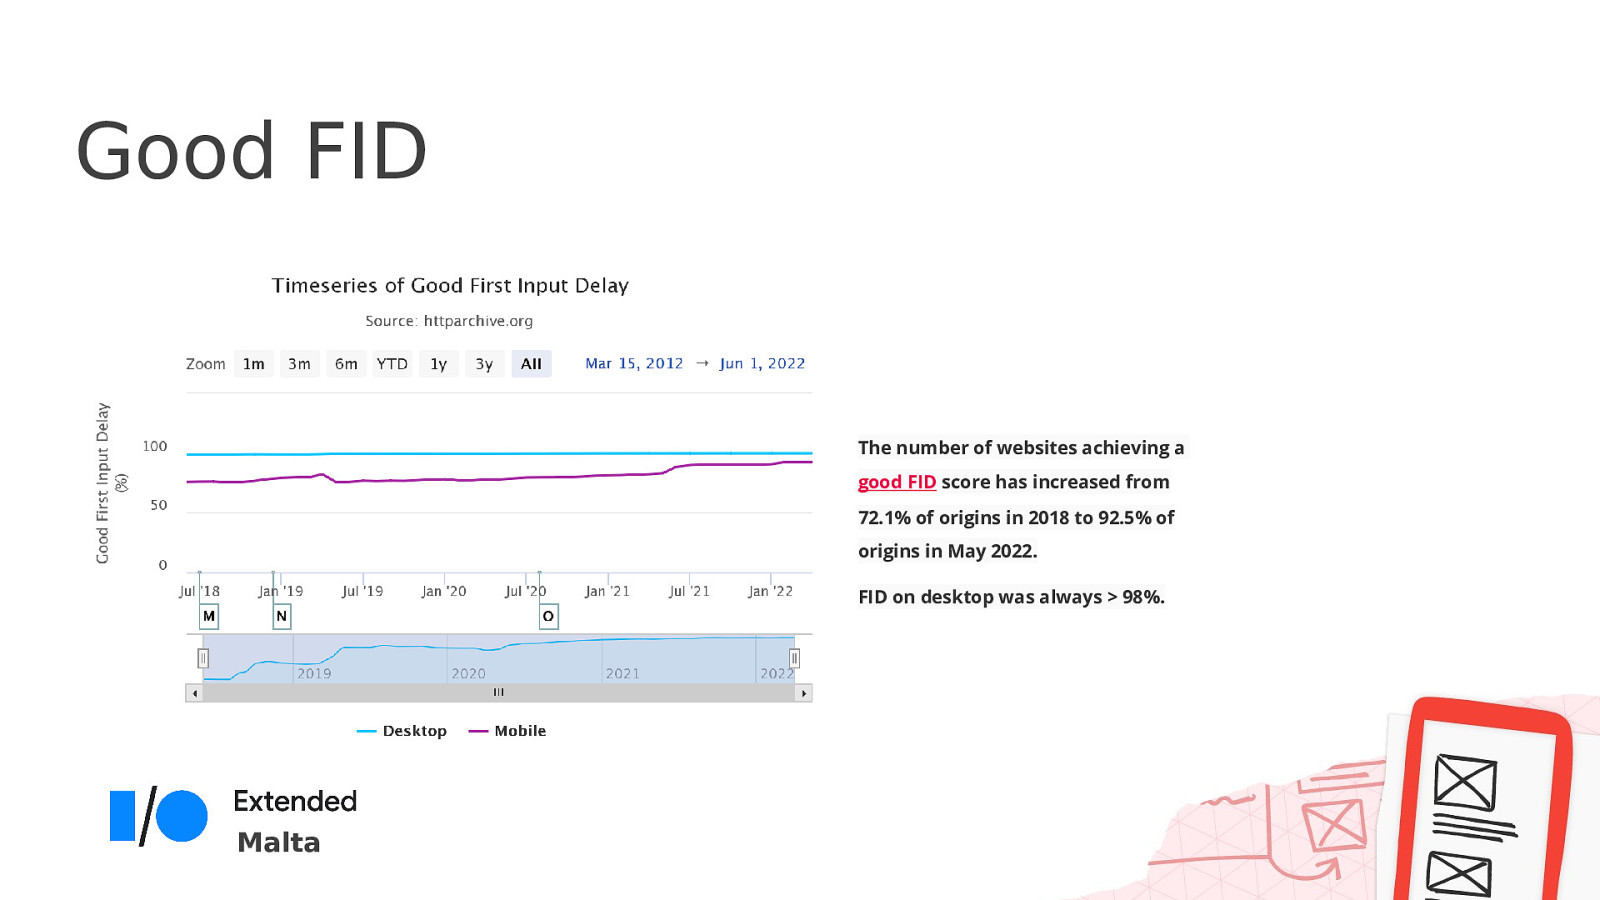
Good FID The number of websites achieving a good FID score has increased from 72.1% of origins in 2018 to 92.5% of origins in May 2022. FID on desktop was always > 98%. Malta
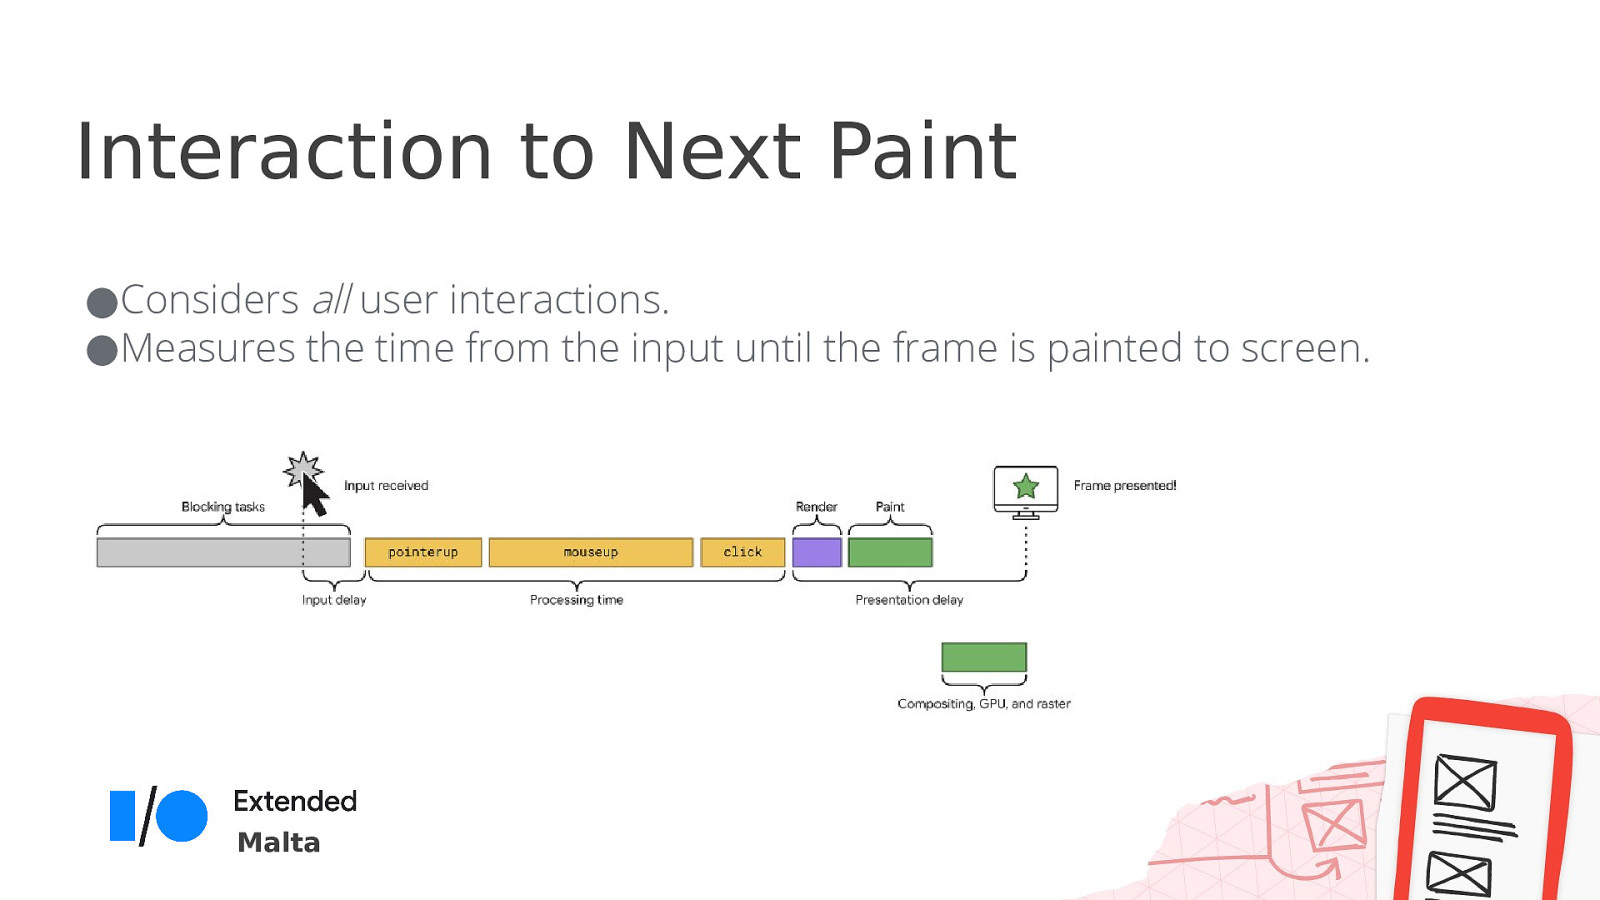
Interaction to Next Paint ●Considers all user interactions. ●Measures the time from the input until the frame is painted to screen. Malta
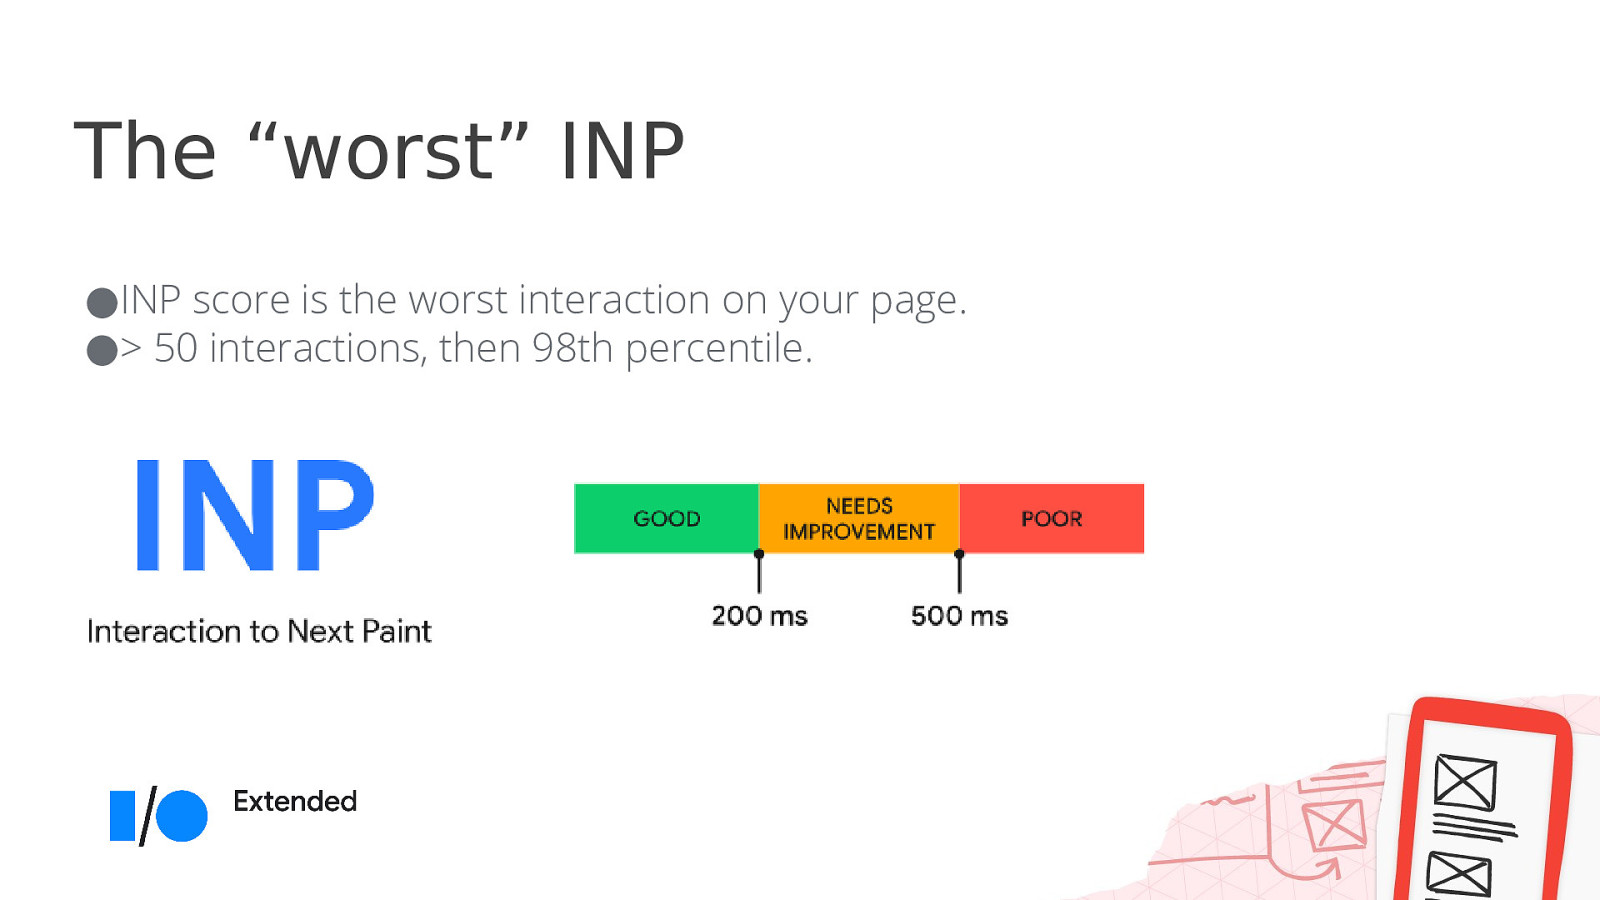
The “worst” INP ●INP score is the worst interaction on your page. ●> 50 interactions, then 98th percentile.
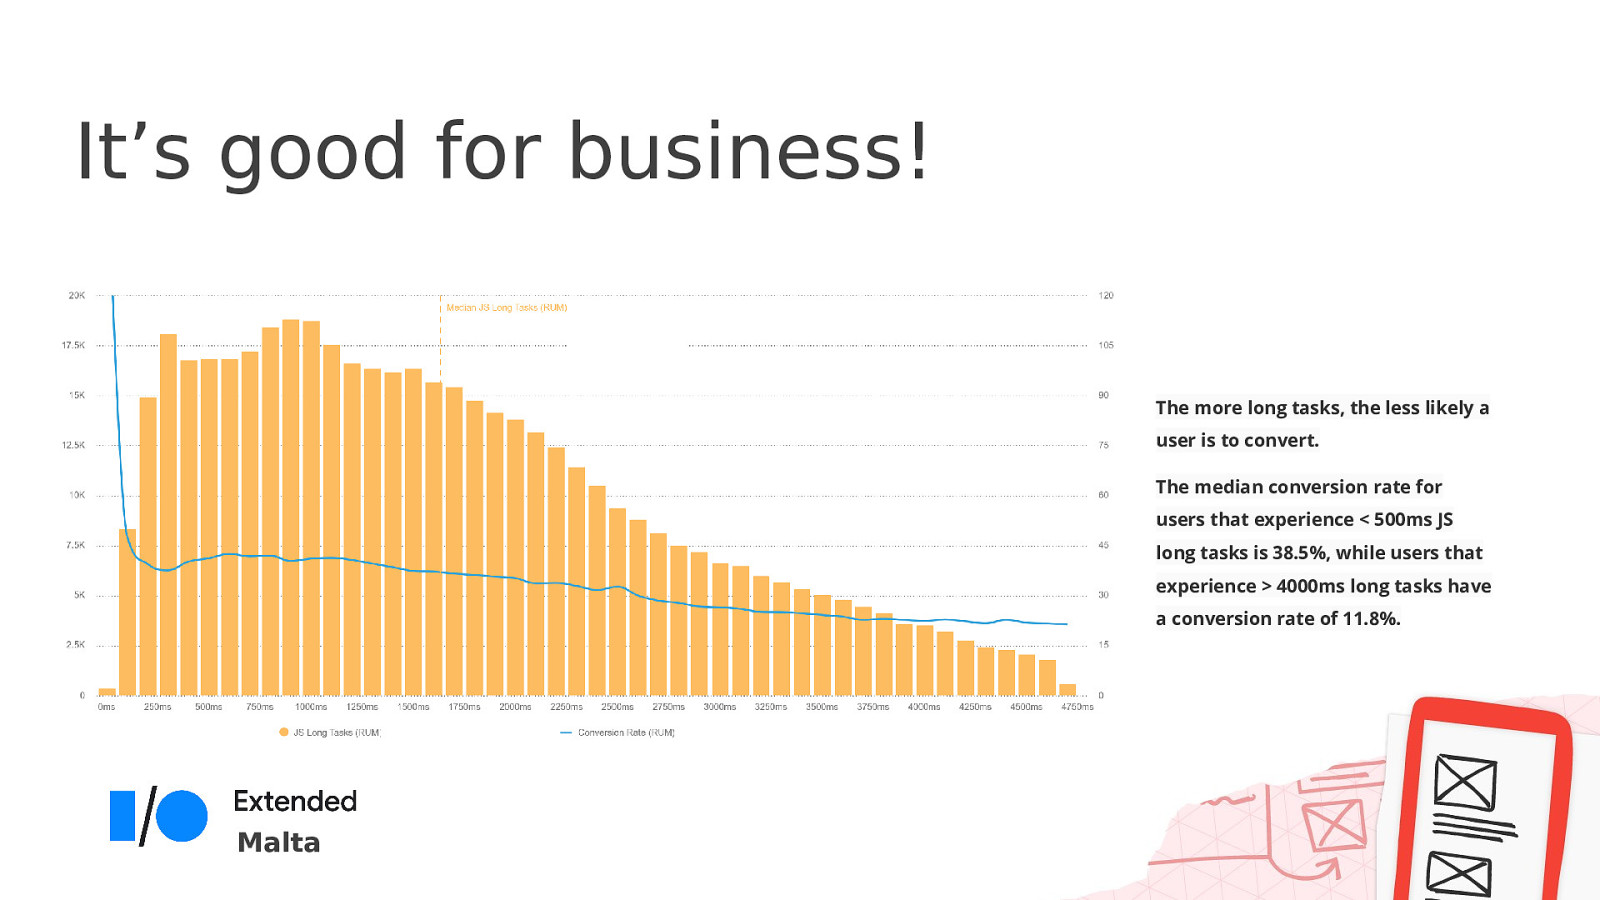
It’s good for business! The more long tasks, the less likely a user is to convert. The median conversion rate for users that experience < 500ms JS long tasks is 38.5%, while users that experience > 4000ms long tasks have a conversion rate of 11.8%. Malta
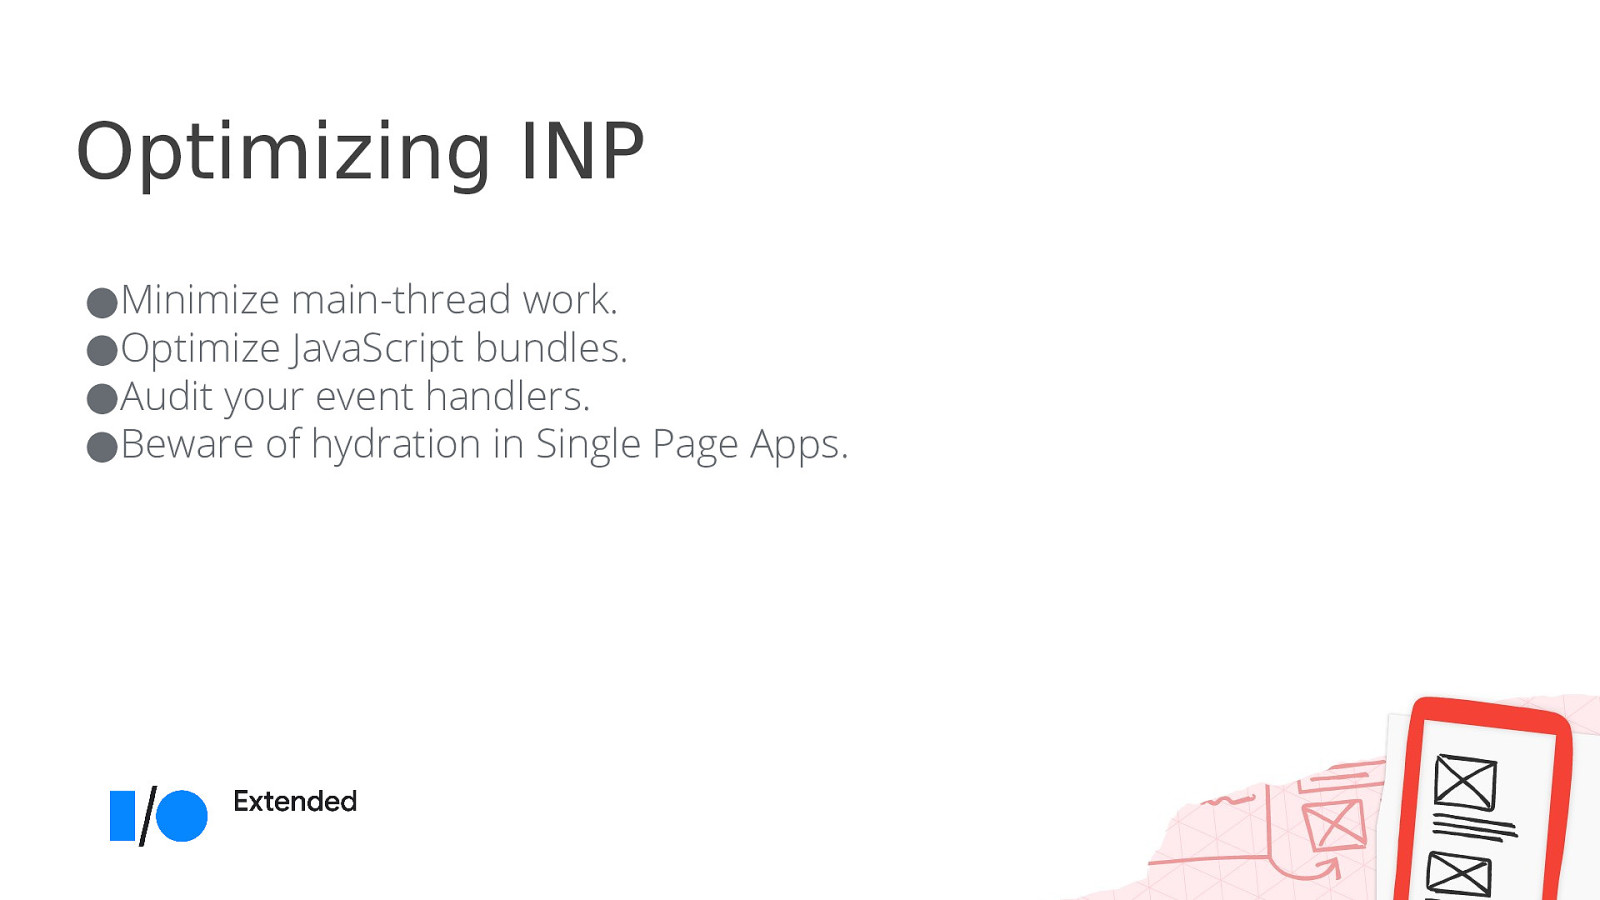
Optimizing INP ●Minimize main-thread work. ●Optimize JavaScript bundles. ●Audit your event handlers. ●Beware of hydration in Single Page Apps.
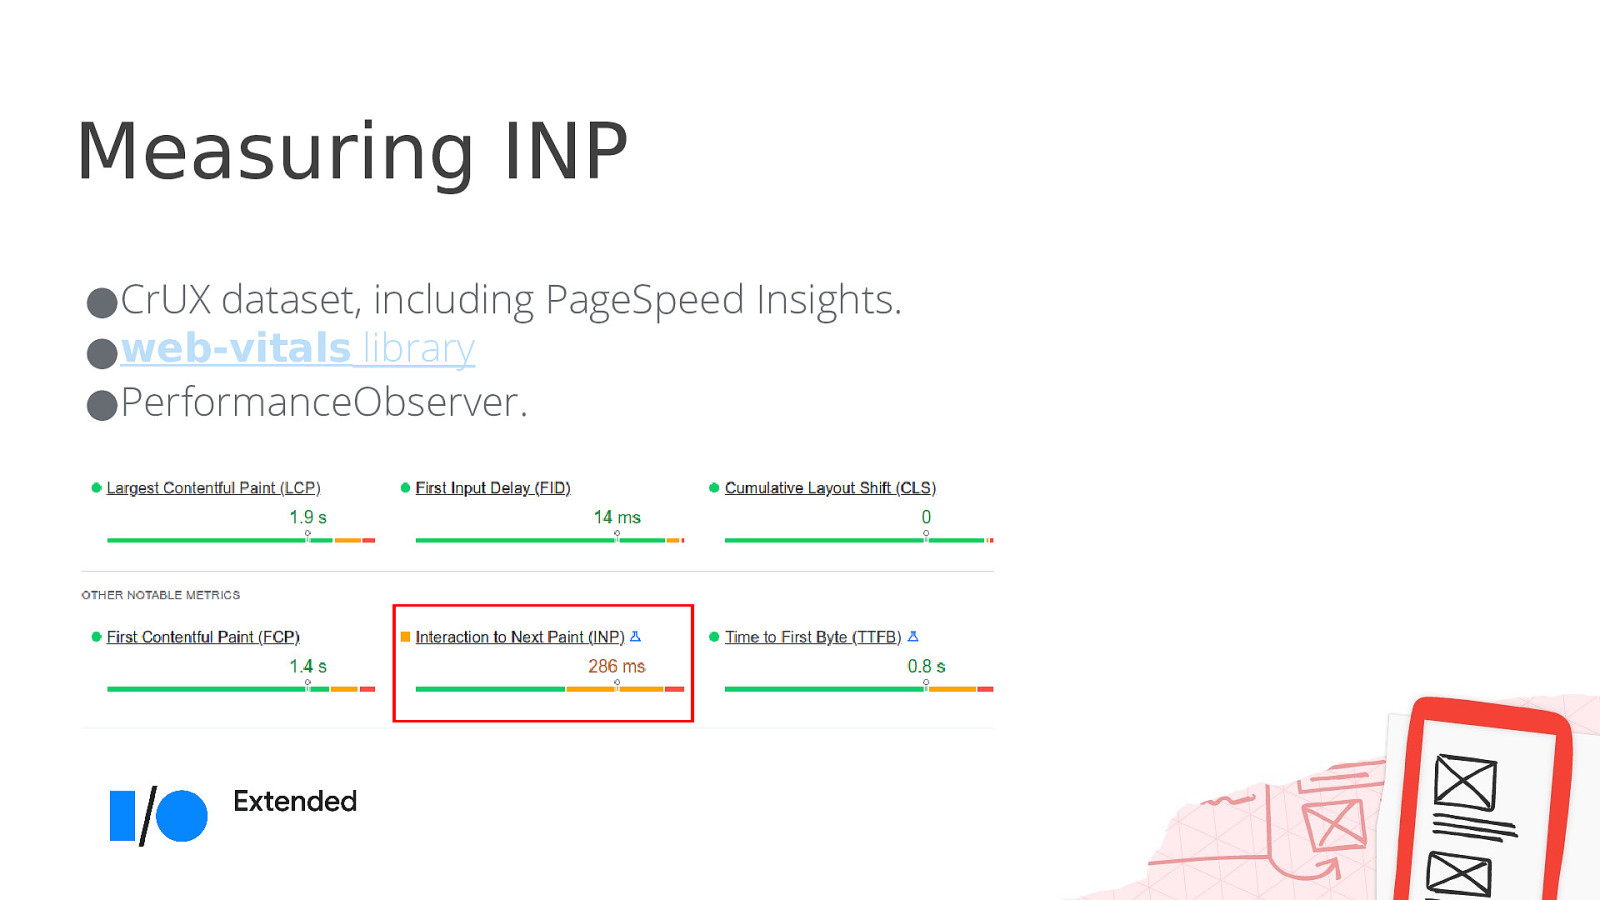
Measuring INP ●CrUX dataset, including PageSpeed Insights. ●web-vitals library ●PerformanceObserver.
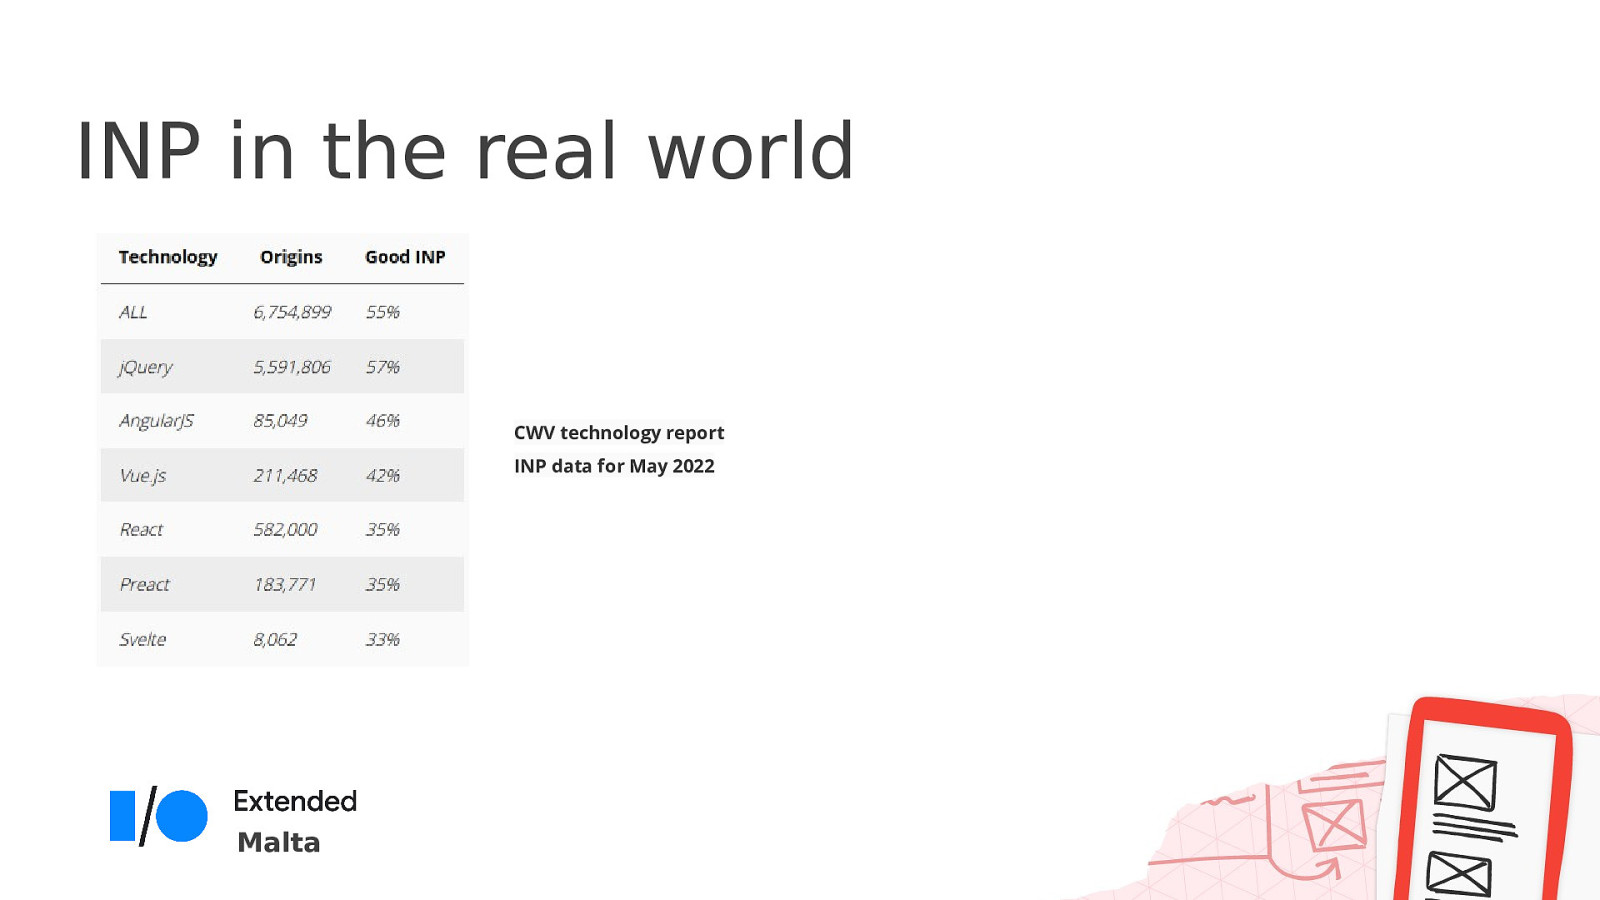
INP in the real world CWV technology report INP data for May 2022 Malta
Thank you Recommended reading: ●web.dev/inp ●debugbear.com/docs/metrics/interaction-to-next-paint ●Correlation between Total Blocking Time and Interaction to Next Paint on Mo bile (Annie Sullivan) ●imkev.dev/inp @imkevdev