Metrics for designers @calexity

A presentation at SoCal UX Camp in August 2017 in Irvine, CA, USA by Lex Roman
Metrics for designers @calexity
hi, I'm alexa roman
product design growth
product Designer who cares about growth
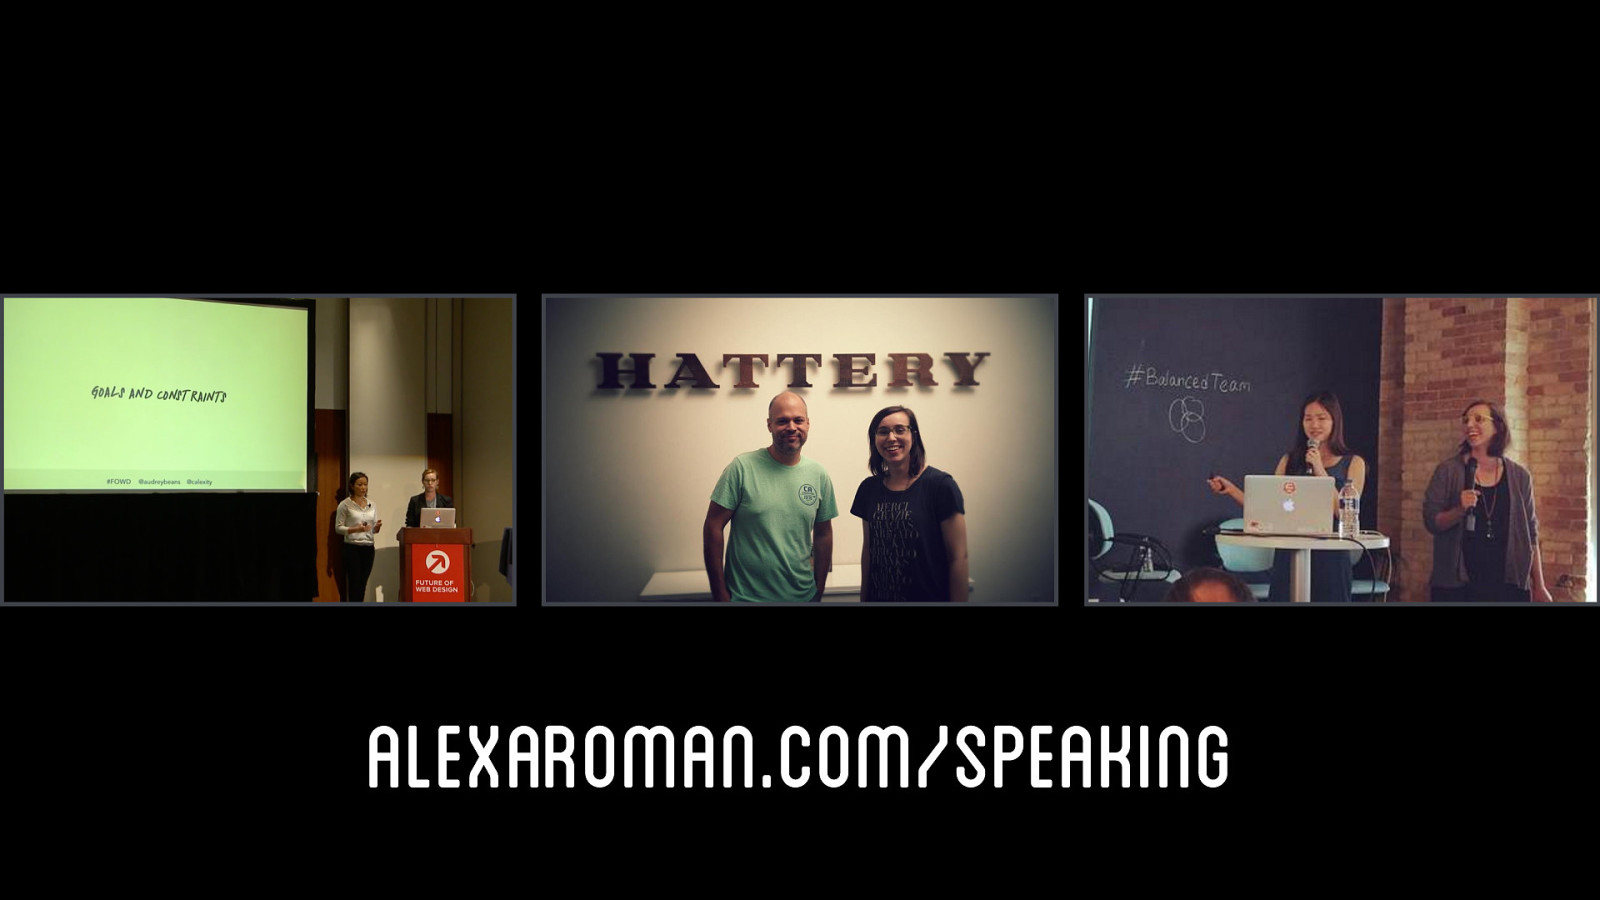
alexaroman.com/speaking
why should designers care about how their metrics work?
''conversion is up.''
''conversion is down.''
''can you make this pretty?''
''i don't want to waste more time on design.''

does your work have impact?
prove it!
what to track Where to put it how to act on it
what to track Where to put it how to act on it @calexity
how do you know your business is solving problems for people?
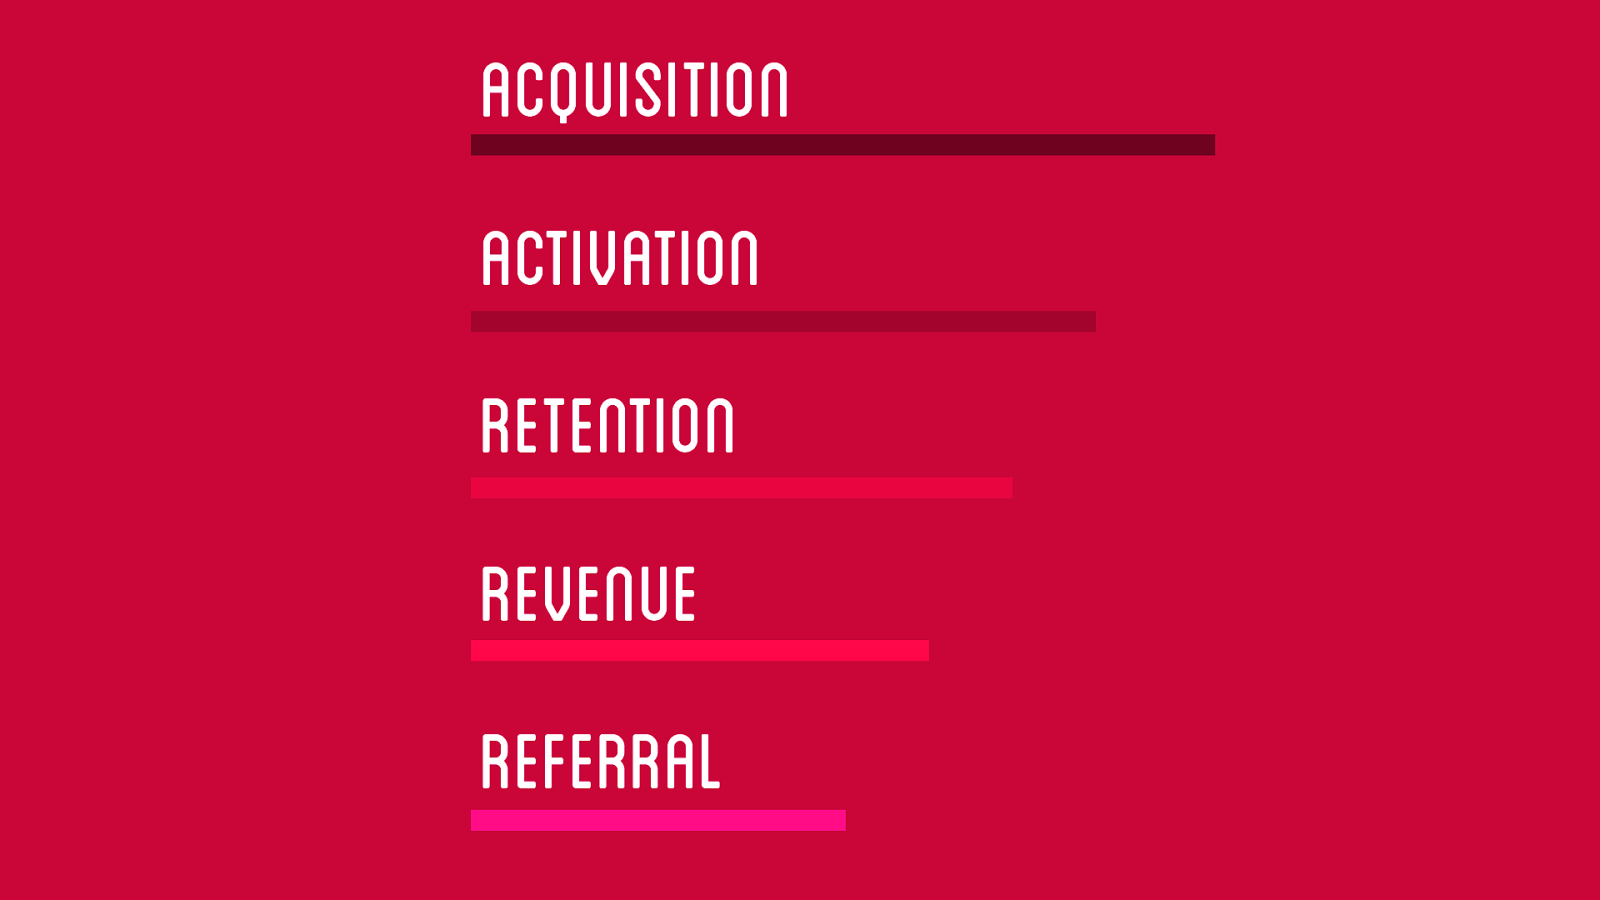
Acquisition Activation Retention Revenue Referral
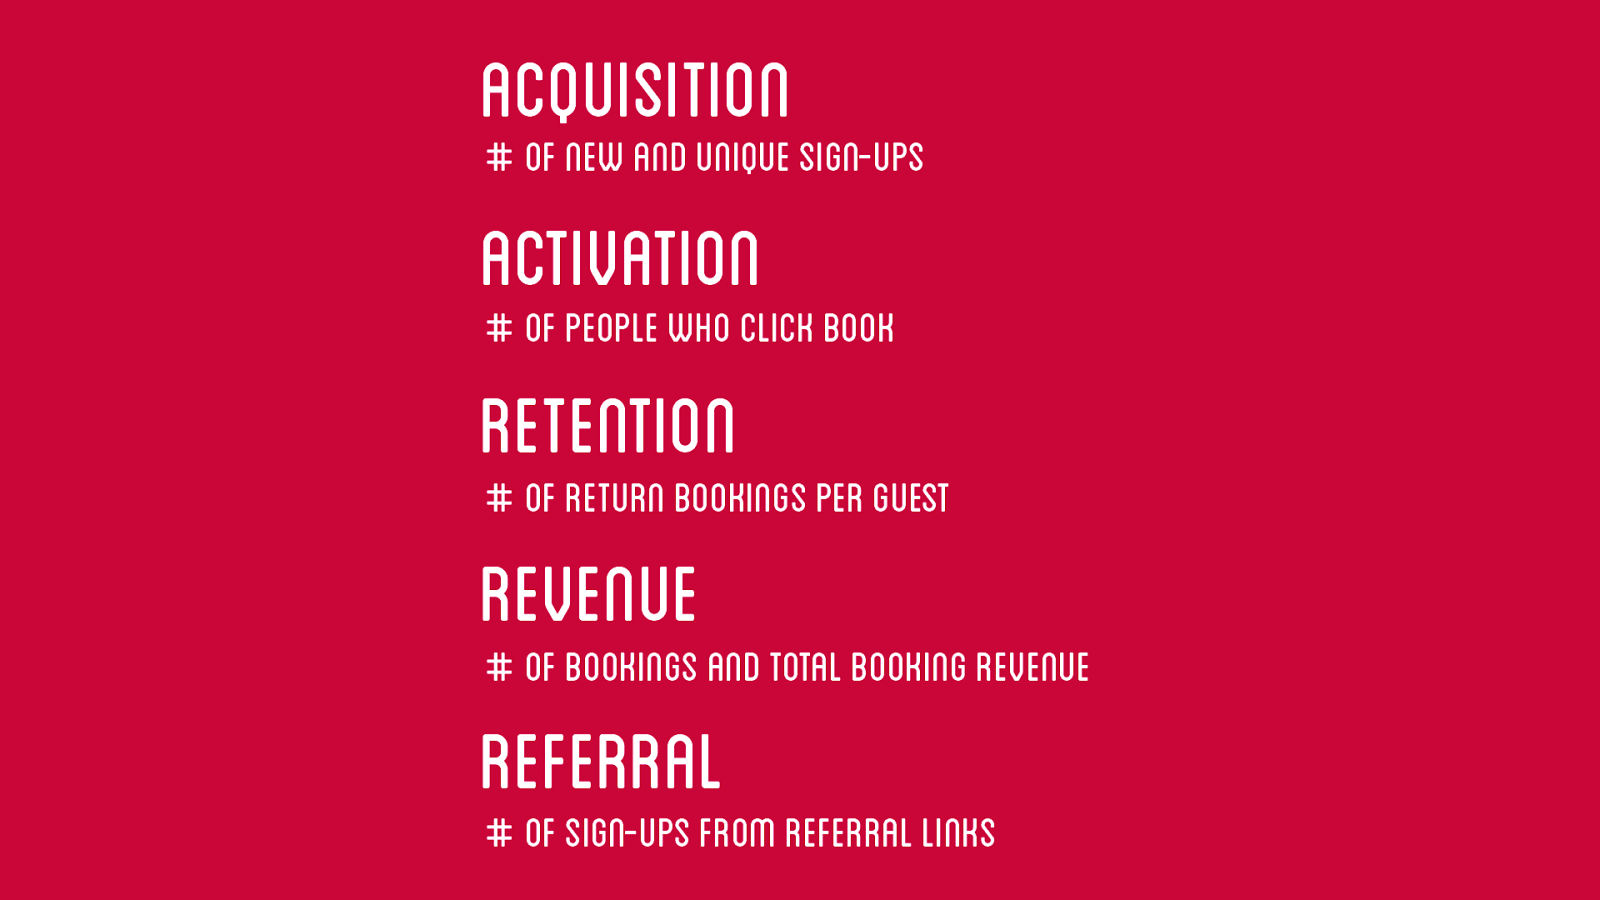
Acquisition # of new and unique sign-ups Activation
Retention
Revenue
Referral
define these moment to moment
Acquisition # of new and unique sign-ups
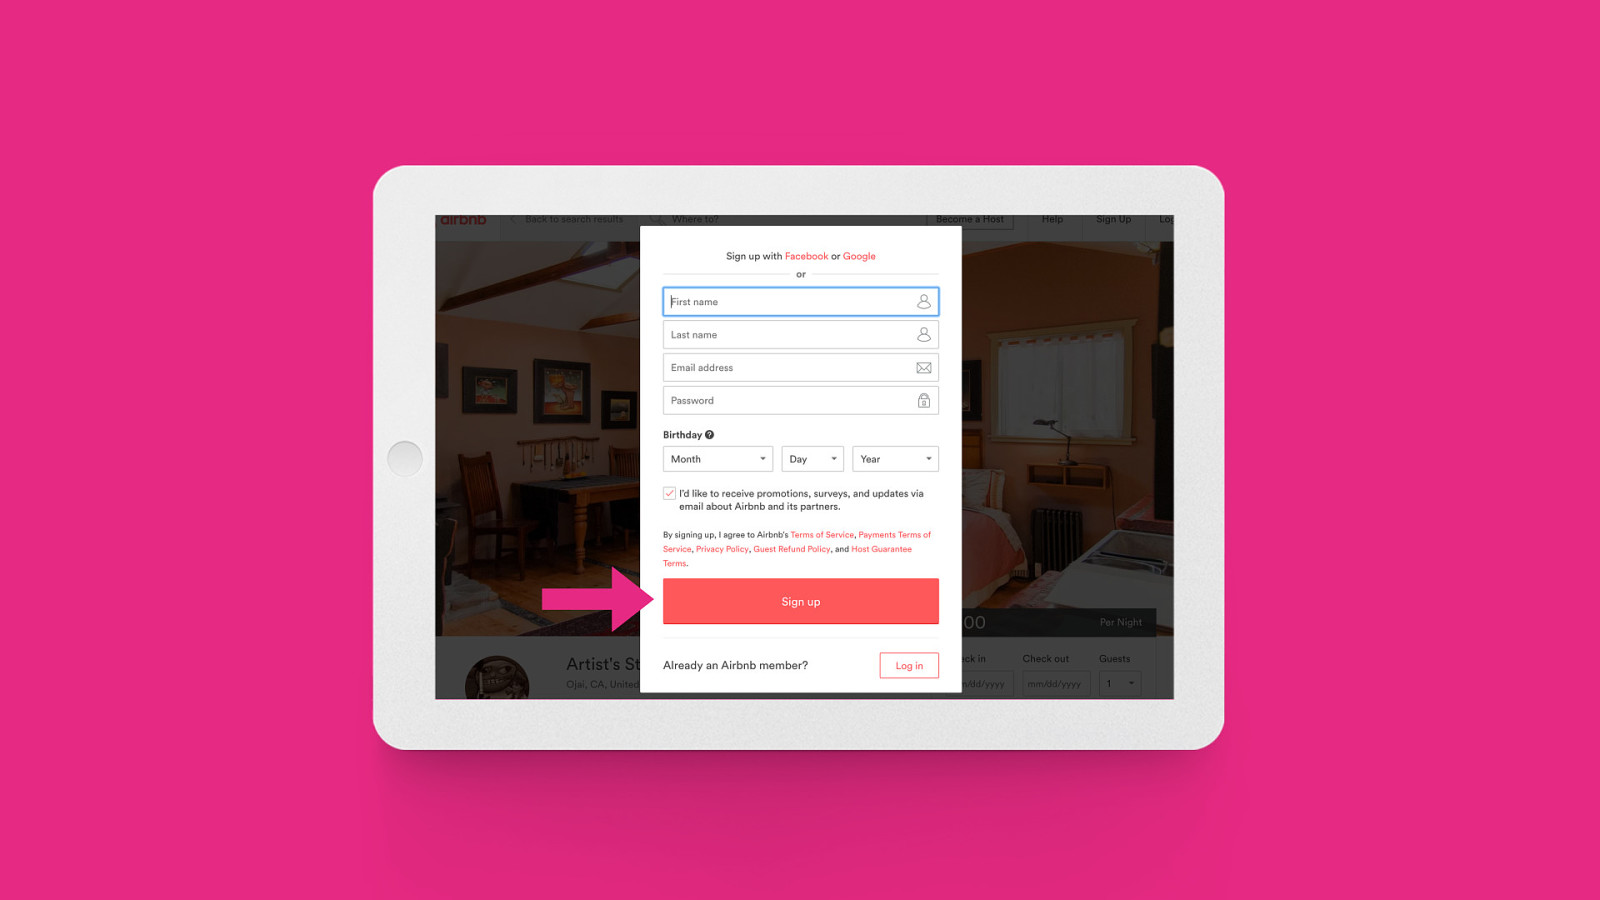
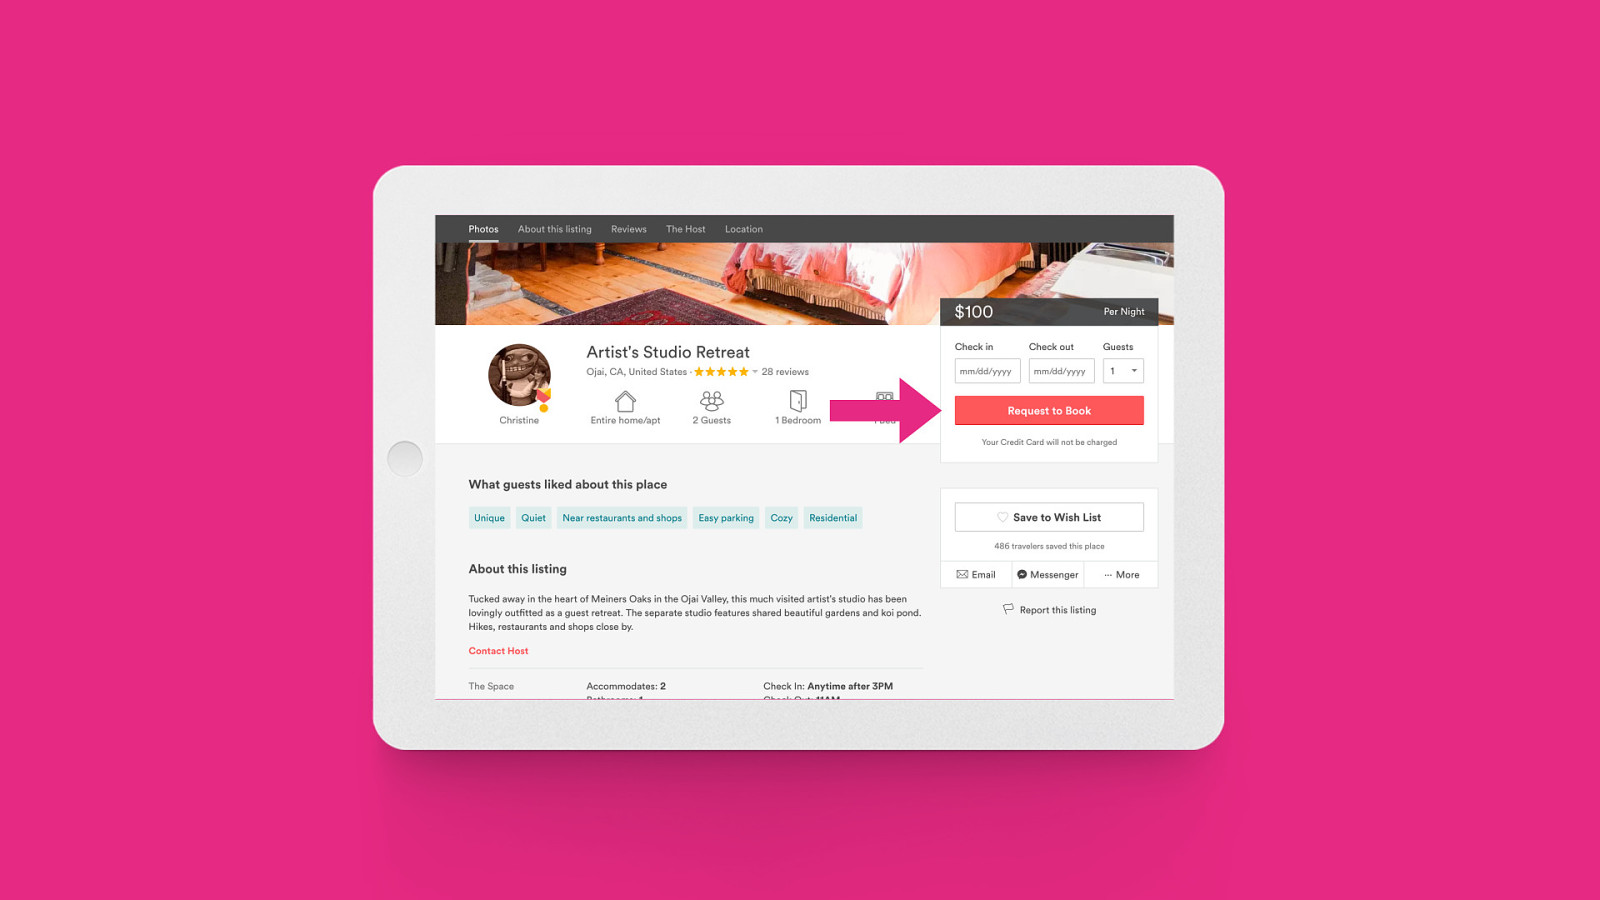
activation # of people who click book AND potential booking $ revenue
take it or leave it pirate metrics
what to track Where to put it how to act on it @calexity
2 analytics tools + 1 A/B Testing = $$$
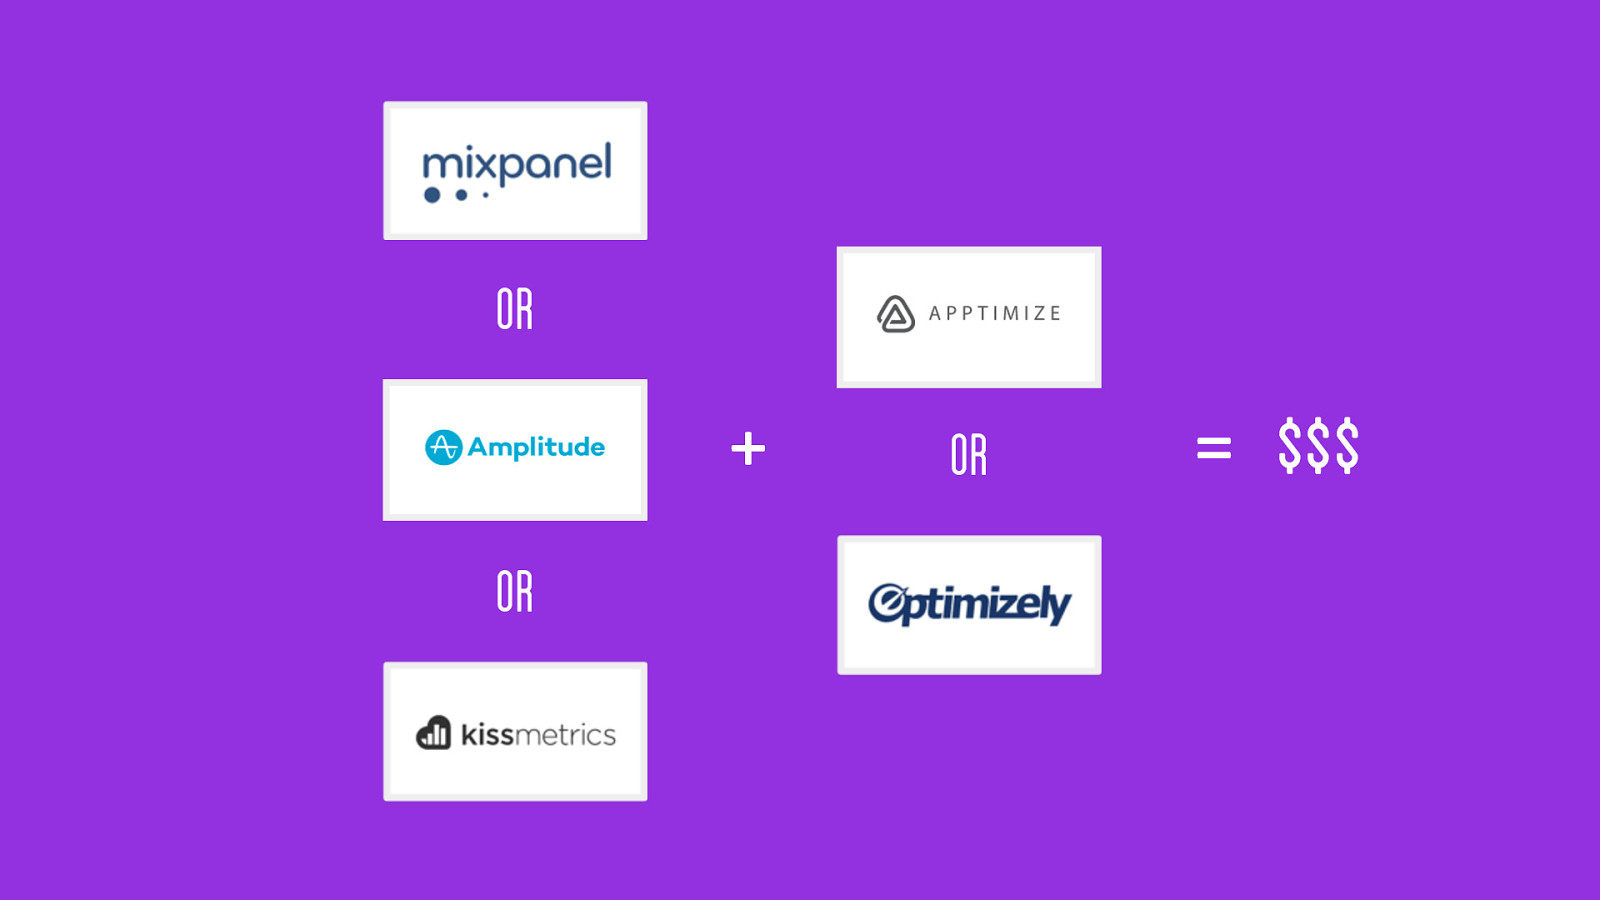
OR
blah blah blah
choosing analytics tools
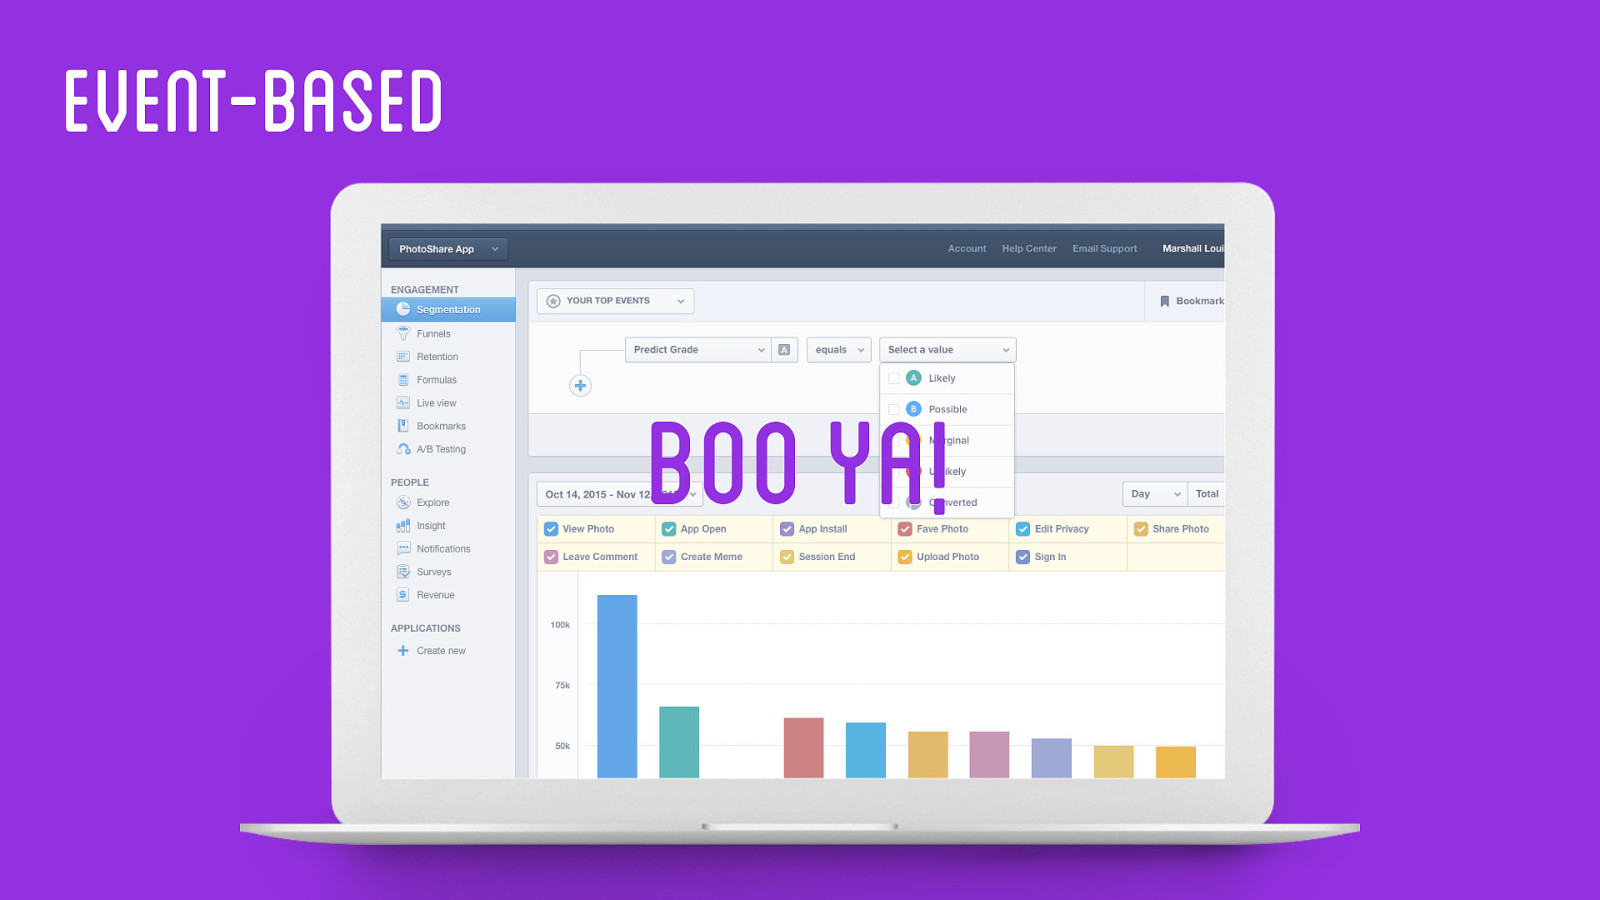
Event-based boo ya!
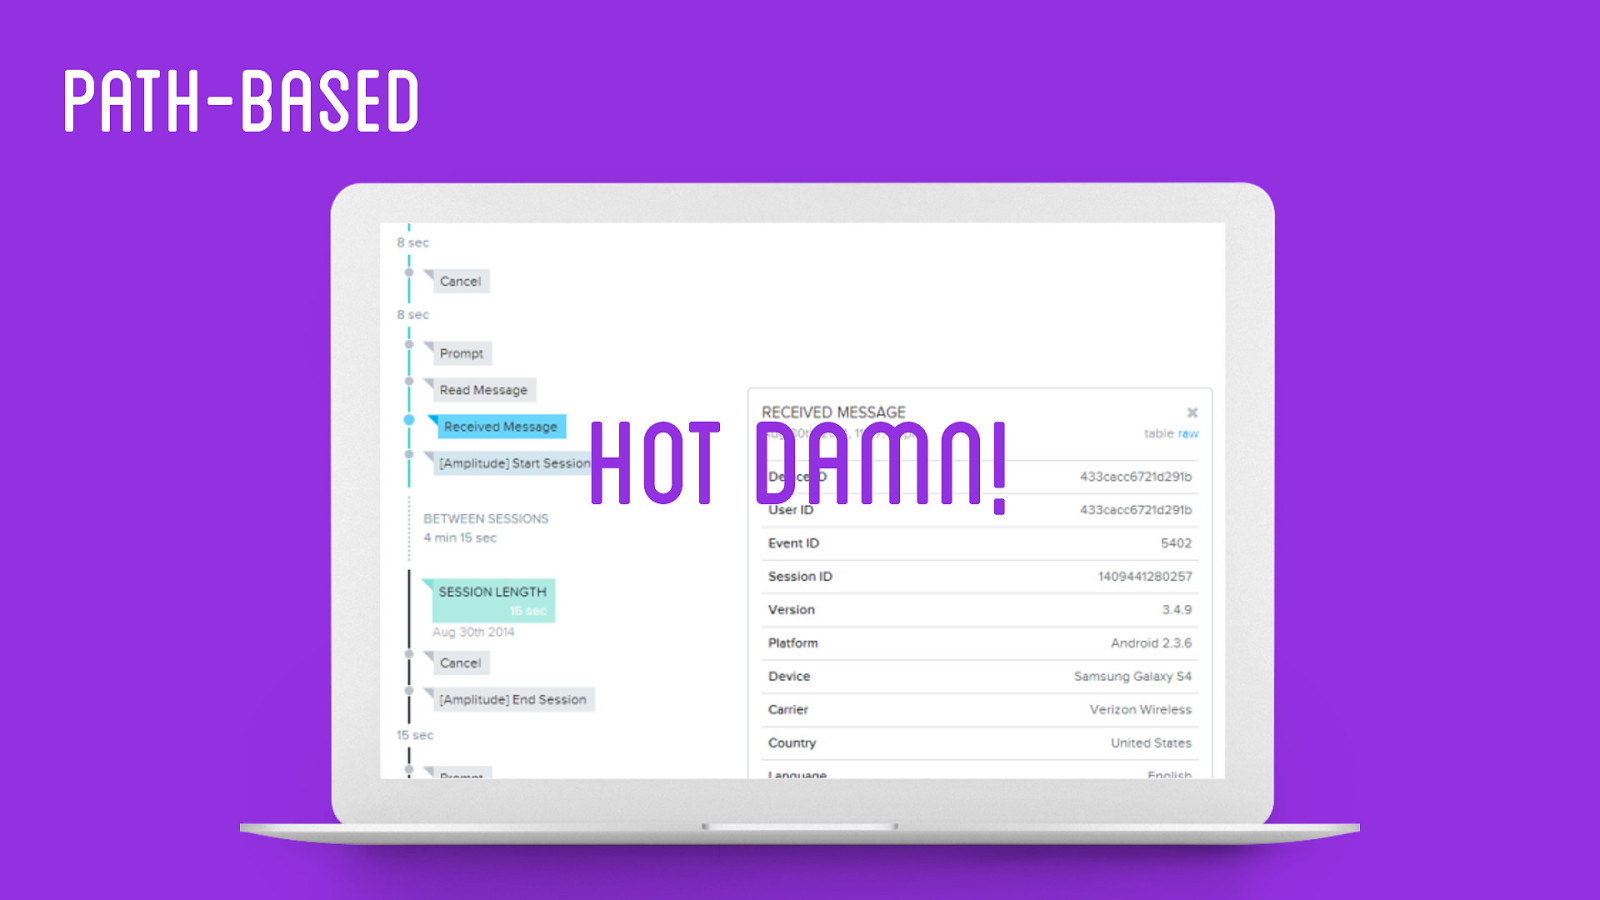
path-based hot damn!
choosing A/B testing tools
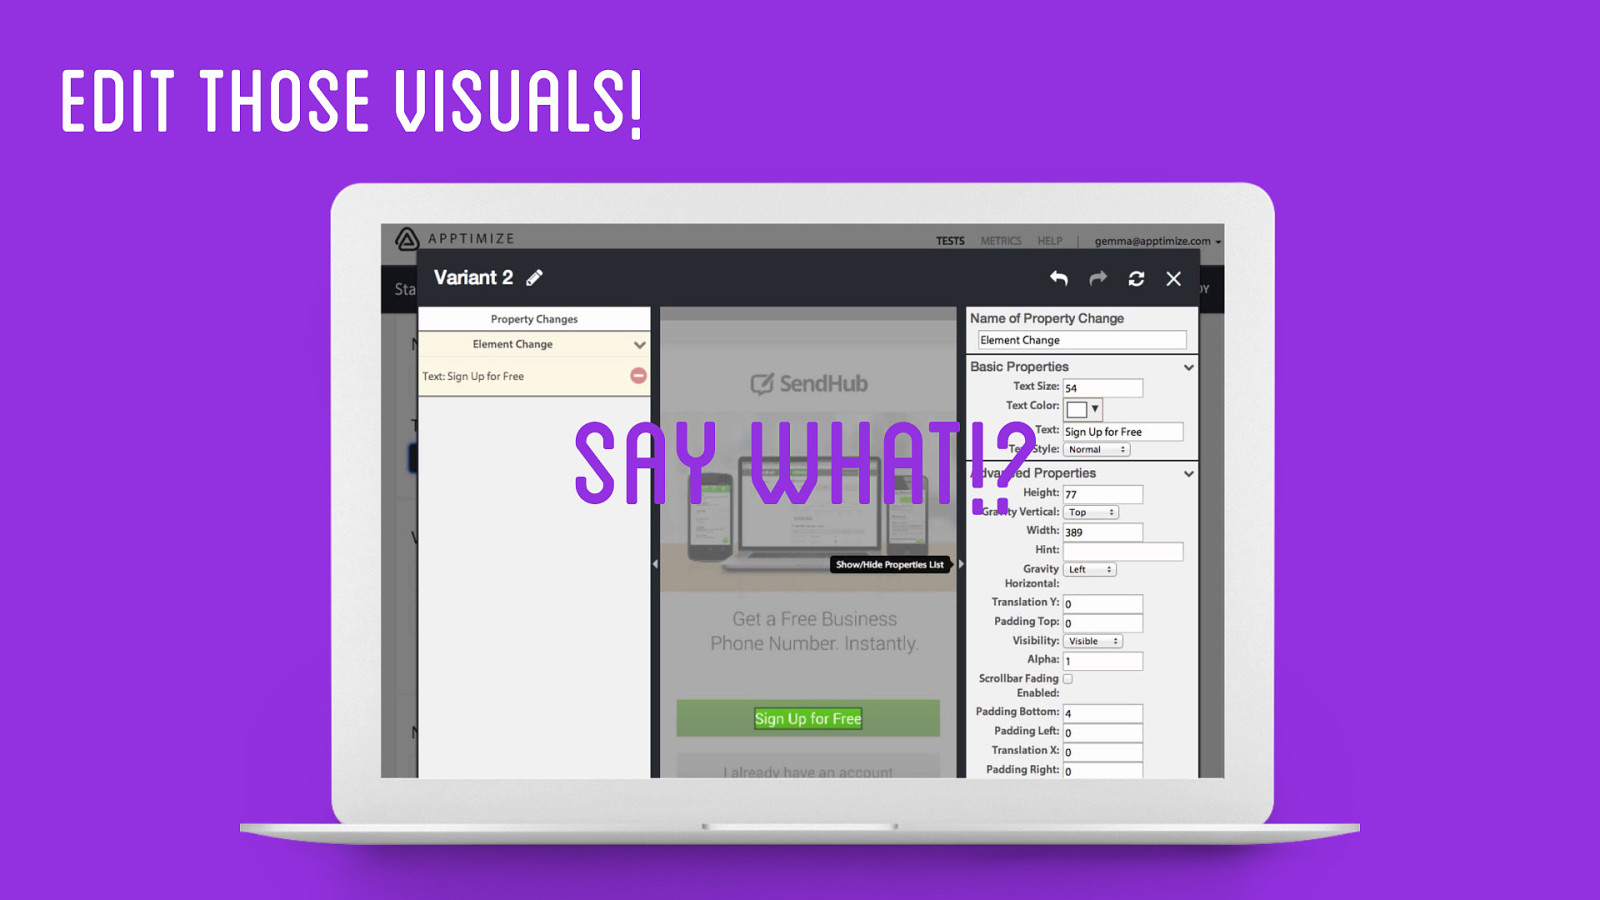
edit those visuals! say what!?
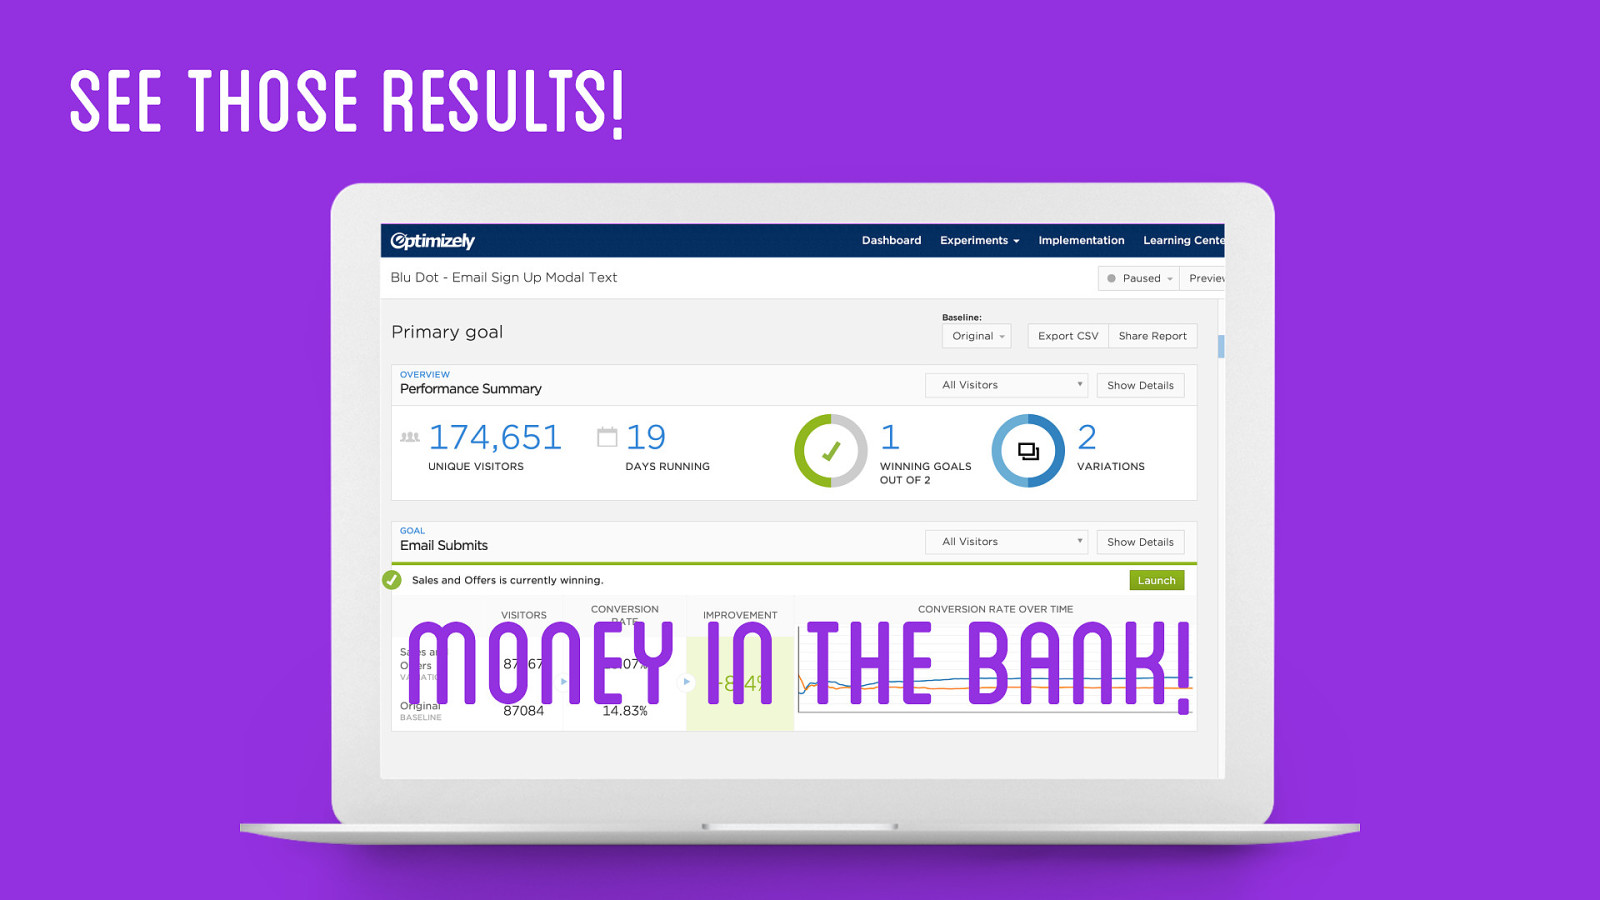
see those results! money in the bank!
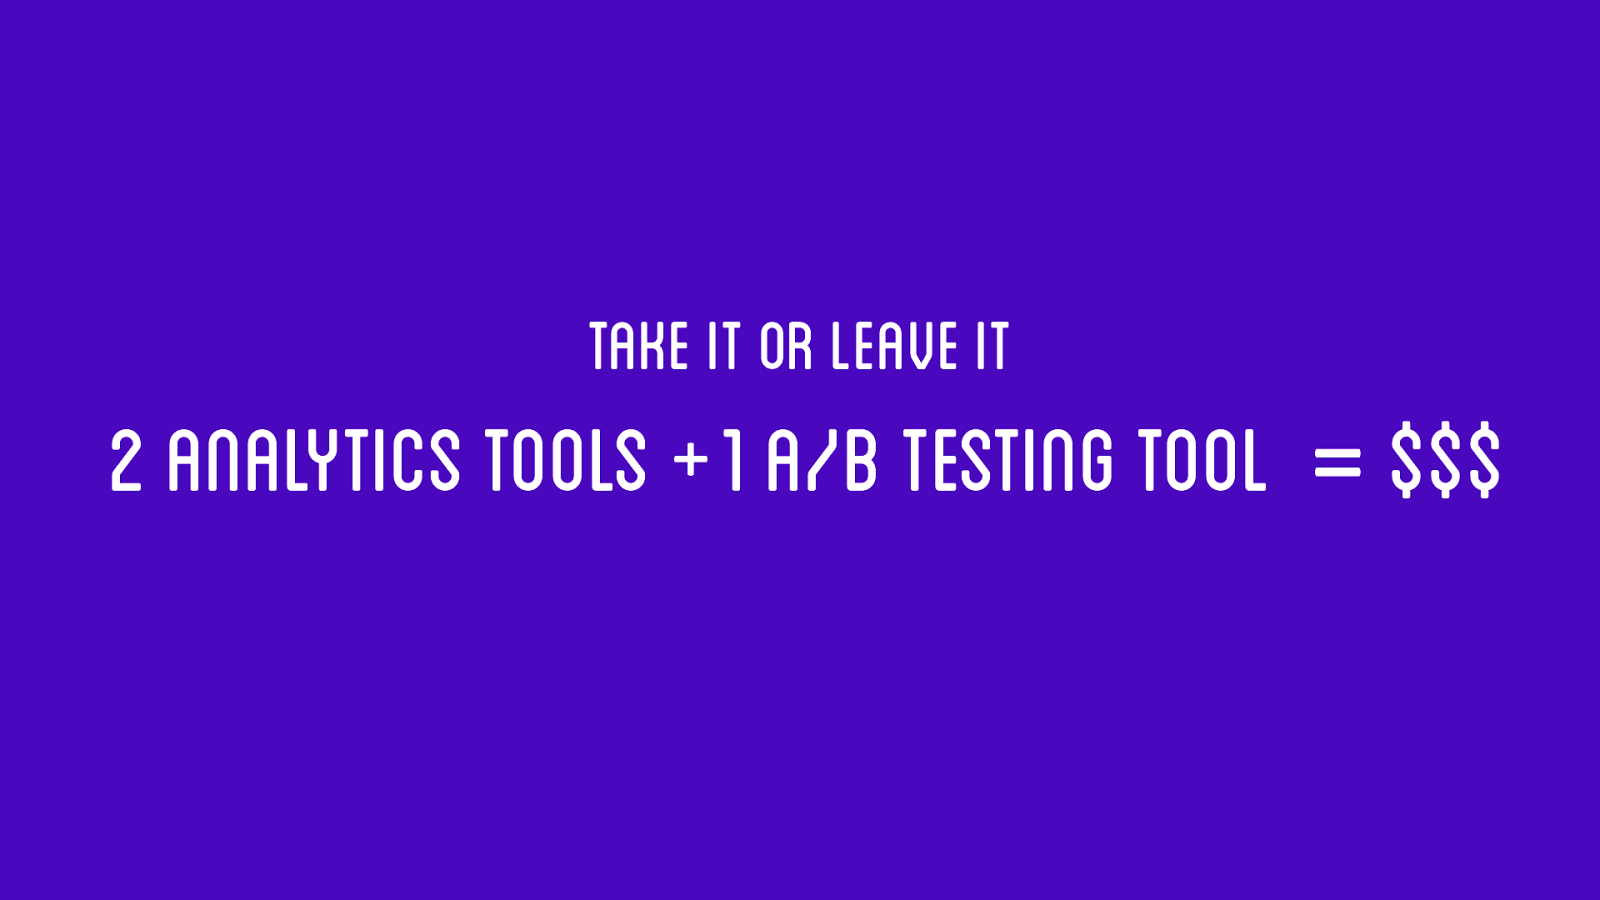
take it or leave it + 2 analytics tools 1 A/B Testing tool = $$$
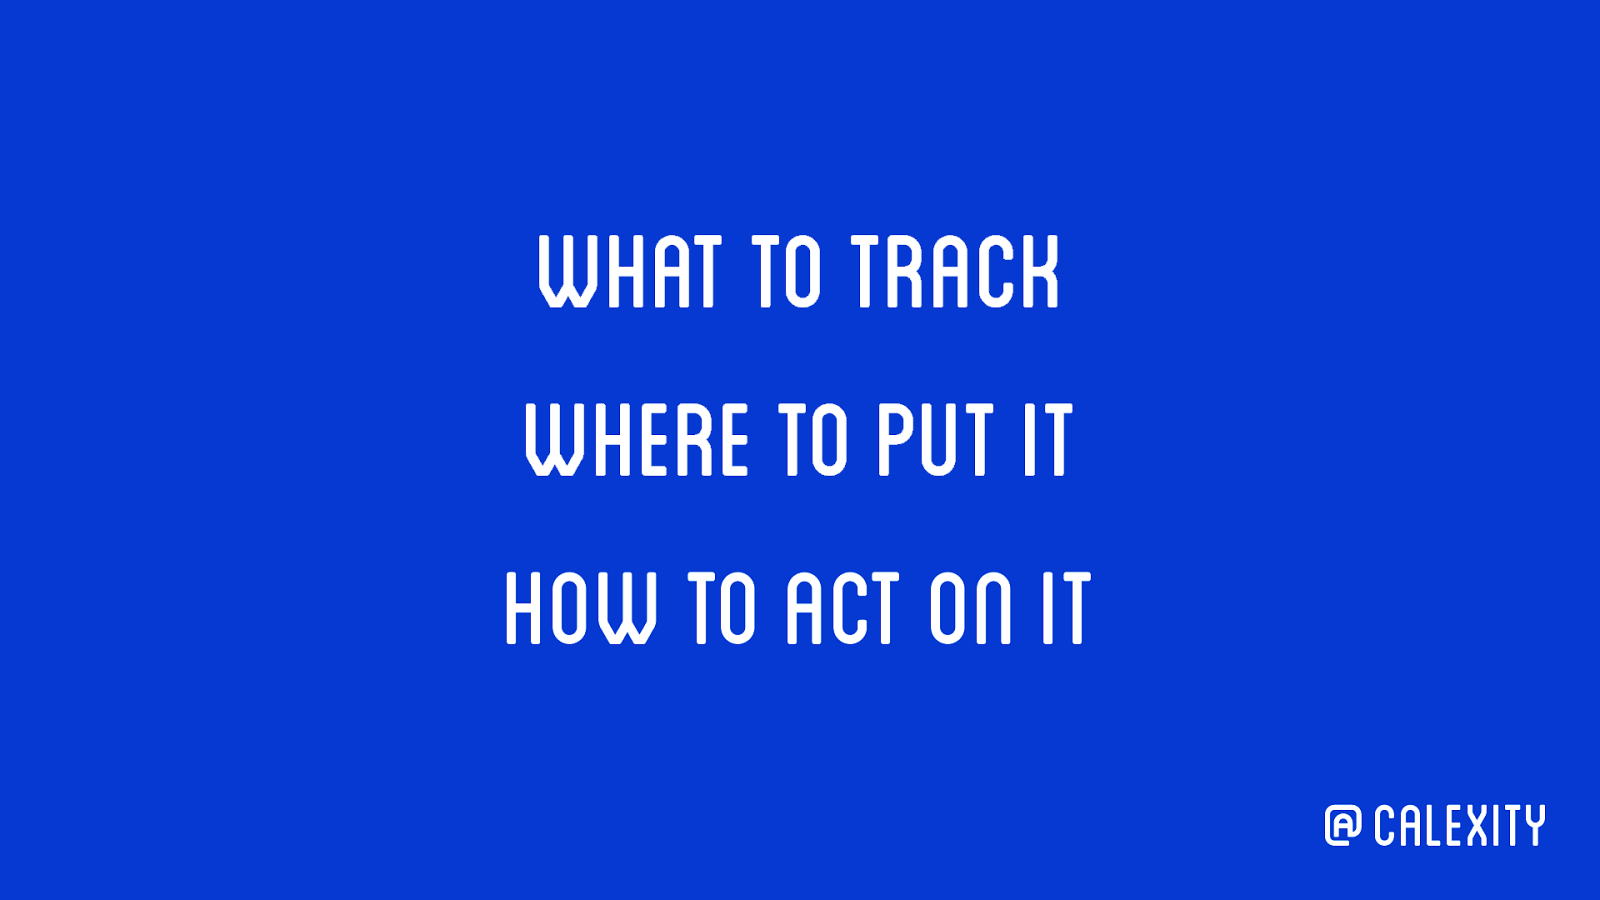
what to track Where to put it how to act on it @calexity
question. your. data.
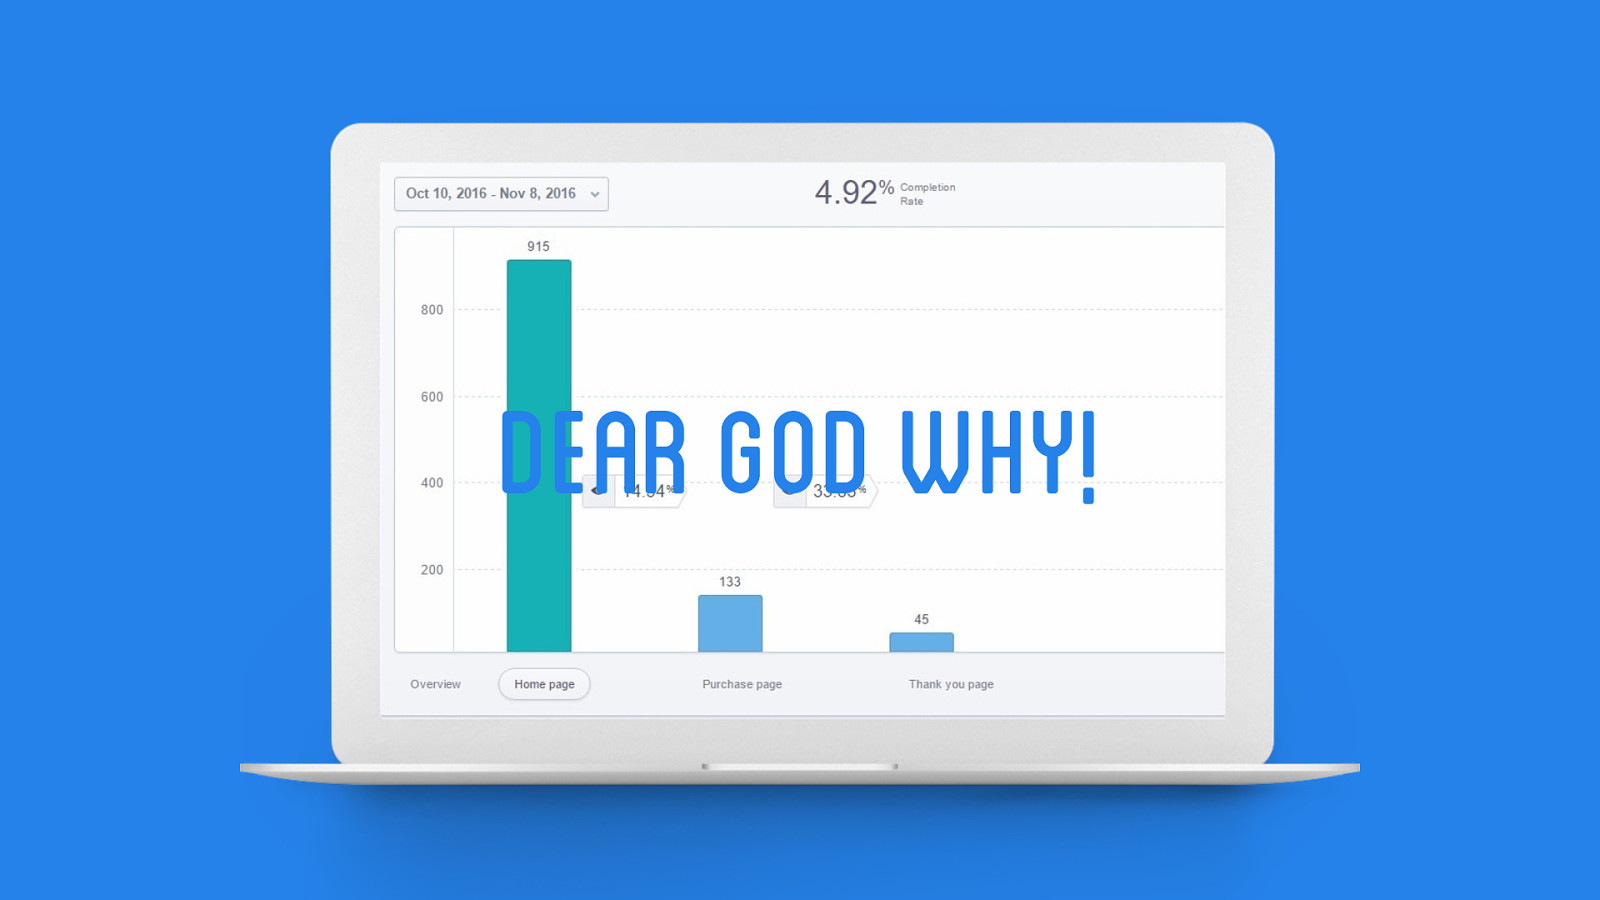
dear god why!
dig in
first - technical questions
is it instrumented correctly?
might there be an error happening?
are we tracking those errors?
did i set up this report correctly?
is this the right view?
next - human questions
what happens in between these actions?
what's the user's mindset?
what's on that screen?
can I identify a specific population?

are there any outside factors?
take it or leave it question your data
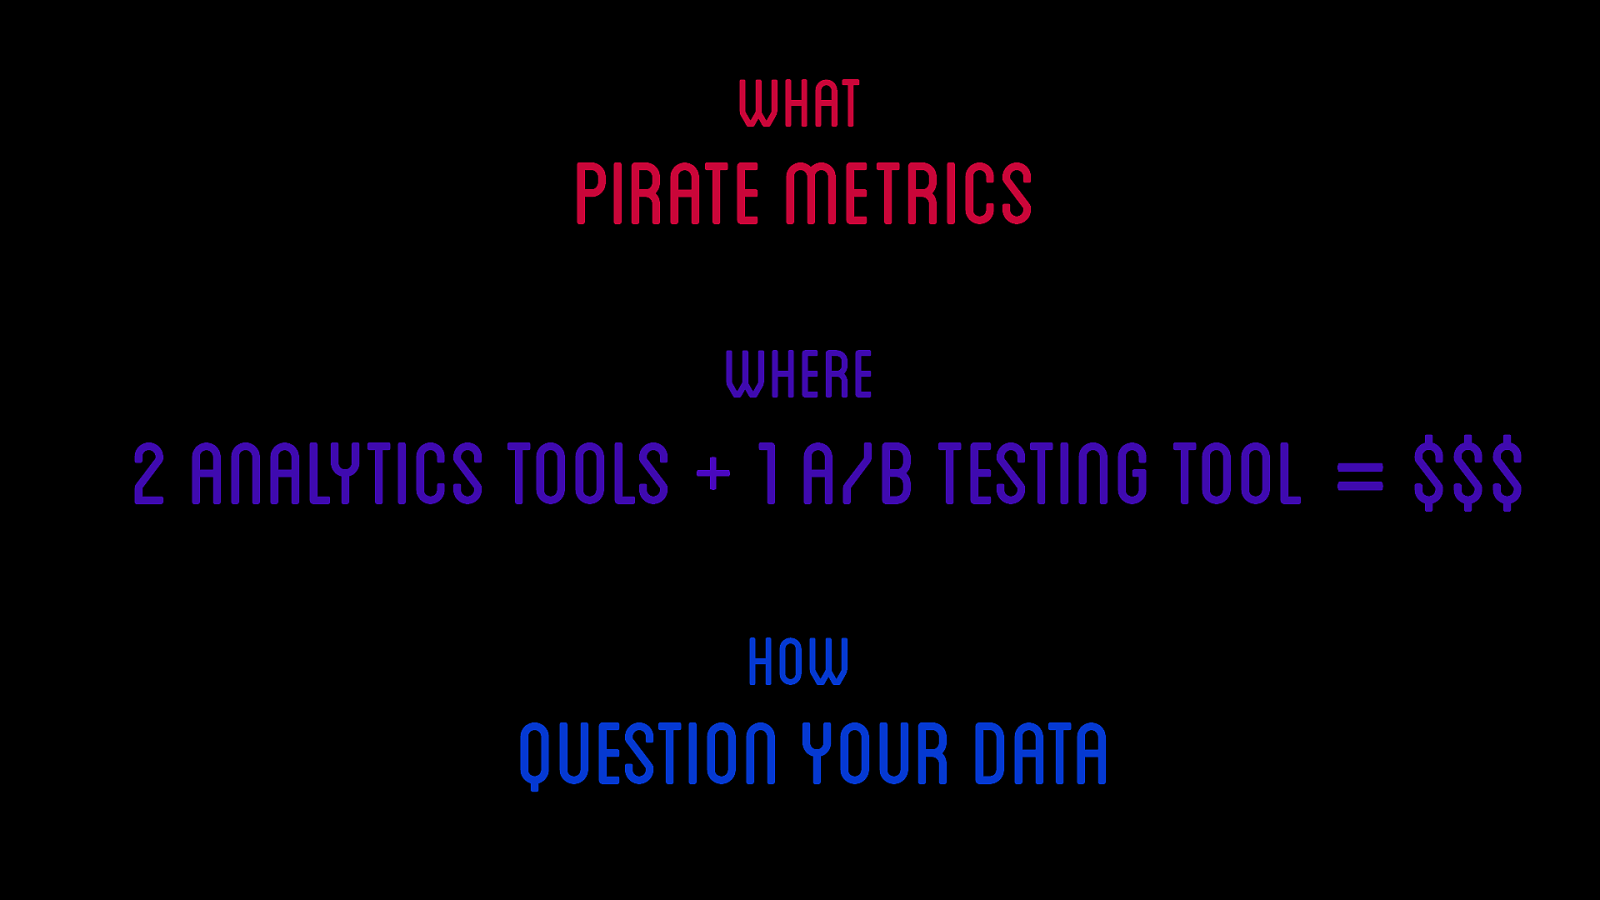
what pirate metrics Where 2 analytics tools + 1 A/B Testing tool = $$$ how question your data
design is valuable
design is valuable
design is money
your work is valued by its perceived impact
so make the impact clear
thank you