Native The Open Source Observability Toolkit on Oracle Cloud Mickey Boxell – Oracle Cloud Native Labs cloudnative.oracle.com Copyright © 2017, Oracle and/or its affiliates. All rights reserved. |

A presentation at KubeCon EU Sponsor Lightning Talks in May 2019 in Barcelona, Spain by Mickey Boxell
Native The Open Source Observability Toolkit on Oracle Cloud Mickey Boxell – Oracle Cloud Native Labs cloudnative.oracle.com Copyright © 2017, Oracle and/or its affiliates. All rights reserved. |
Safe Harbor Statement The following is intended to outline our general product direction. It is intended for information purposes only, and may not be incorporated into any contract. It is not a commitment to deliver any material, code, or functionality, and should not be relied upon in making purchasing decisions. The development, release, and timing of any features or functionality described for Oracle’s products remains at the sole discretion of Oracle. Copyright © 2019, Oracle and/or its affiliates. All rights reserved. |
Who am I? Mickey Boxell Solution Architect, Developer Advocate, etc. Oracle Cloud Native Labs Build customer-deployable cloud native/container native solutions to bridge the gap between Oracle Cloud Infrastructure (OCI) and open source communities. http://cloudnative.oracle.com/ Copyright © 2017, Oracle and/or its affiliates. All rights reserved. |
Context: An Era of Microservices Microservice environments: • Distributed • Container-based • Polyglot • Highly-scalable • Ephemeral Copyright © 2017, Oracle and/or its affiliates. All rights reserved. |
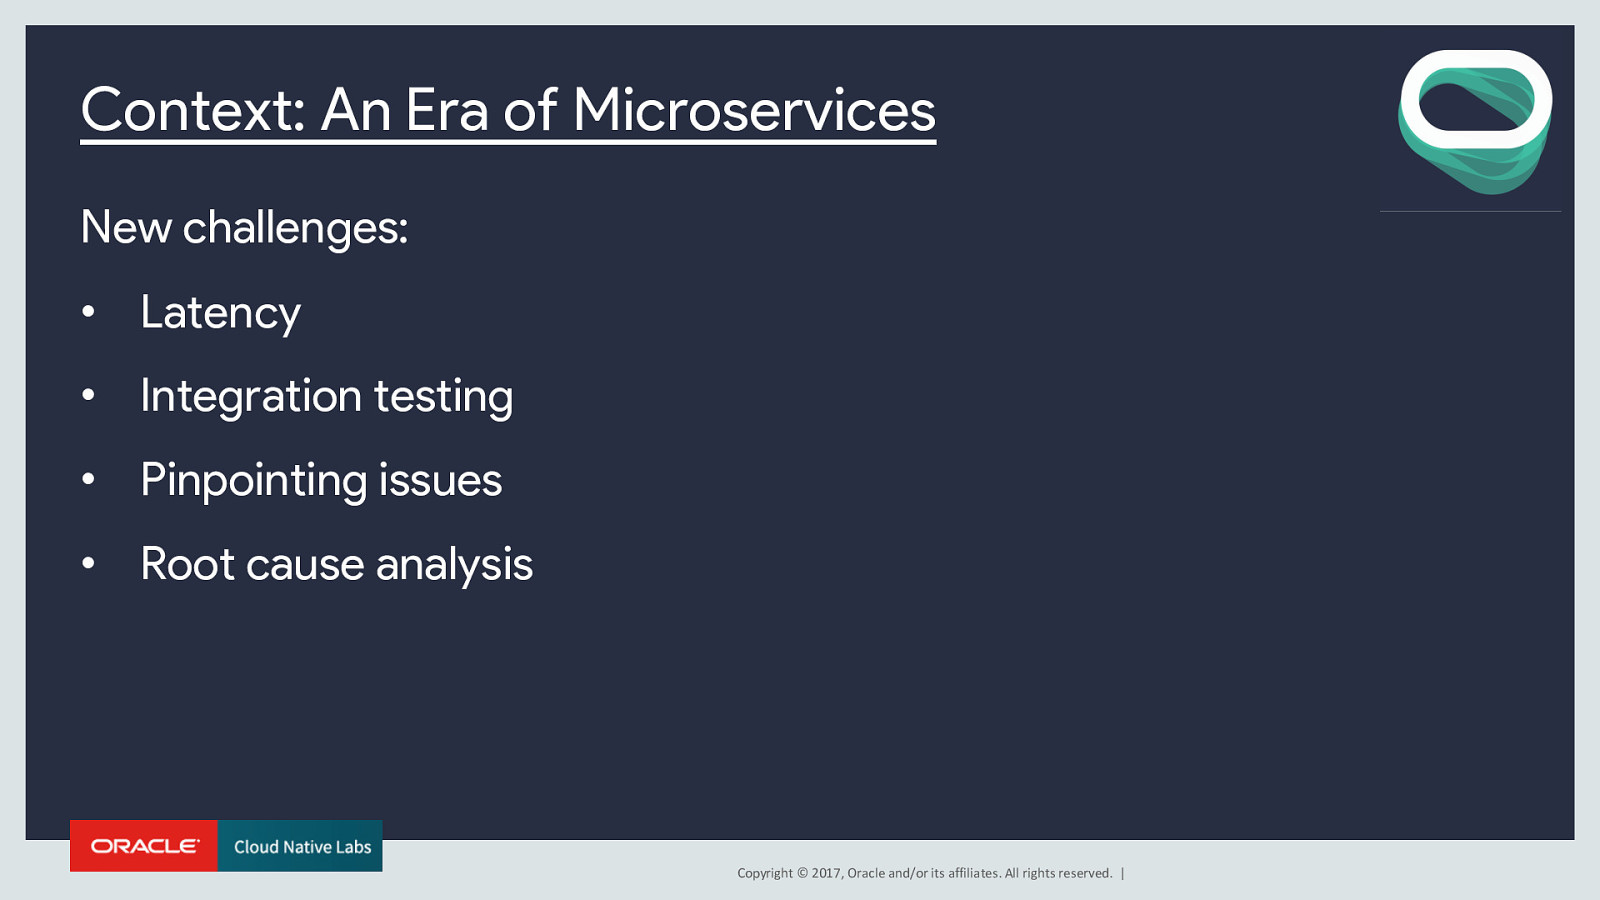
Context: An Era of Microservices New challenges: • Latency • Integration testing • Pinpointing issues • Root cause analysis Copyright © 2017, Oracle and/or its affiliates. All rights reserved. |
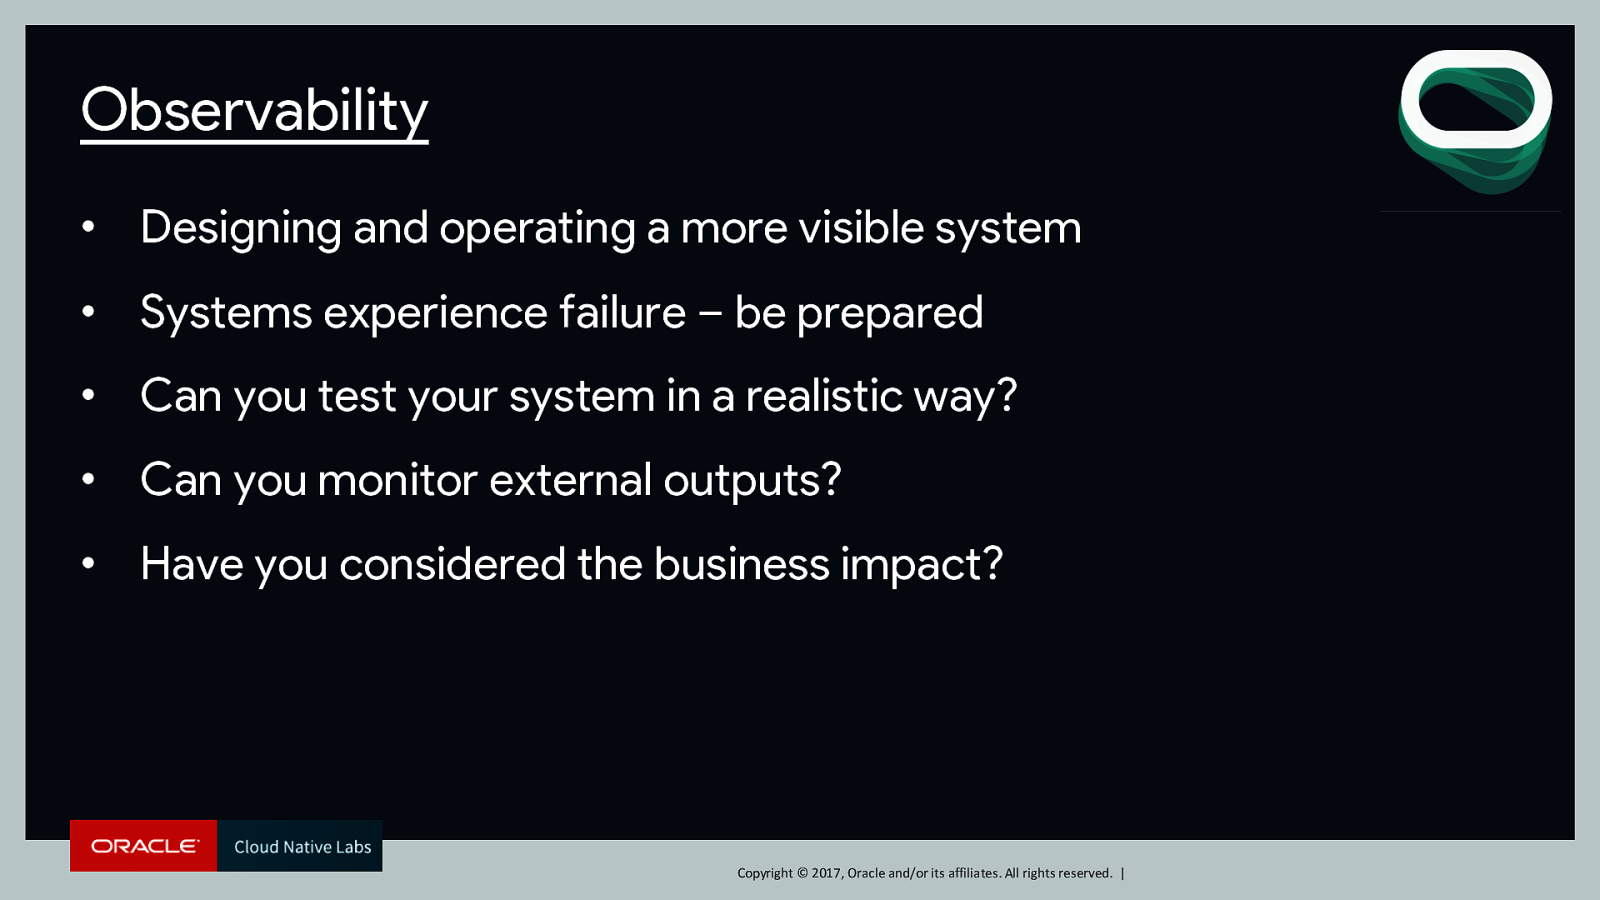
Observability • Designing and operating a more visible system • Systems experience failure – be prepared • Can you test your system in a realistic way? • Can you monitor external outputs? • Have you considered the business impact? Copyright © 2017, Oracle and/or its affiliates. All rights reserved. |
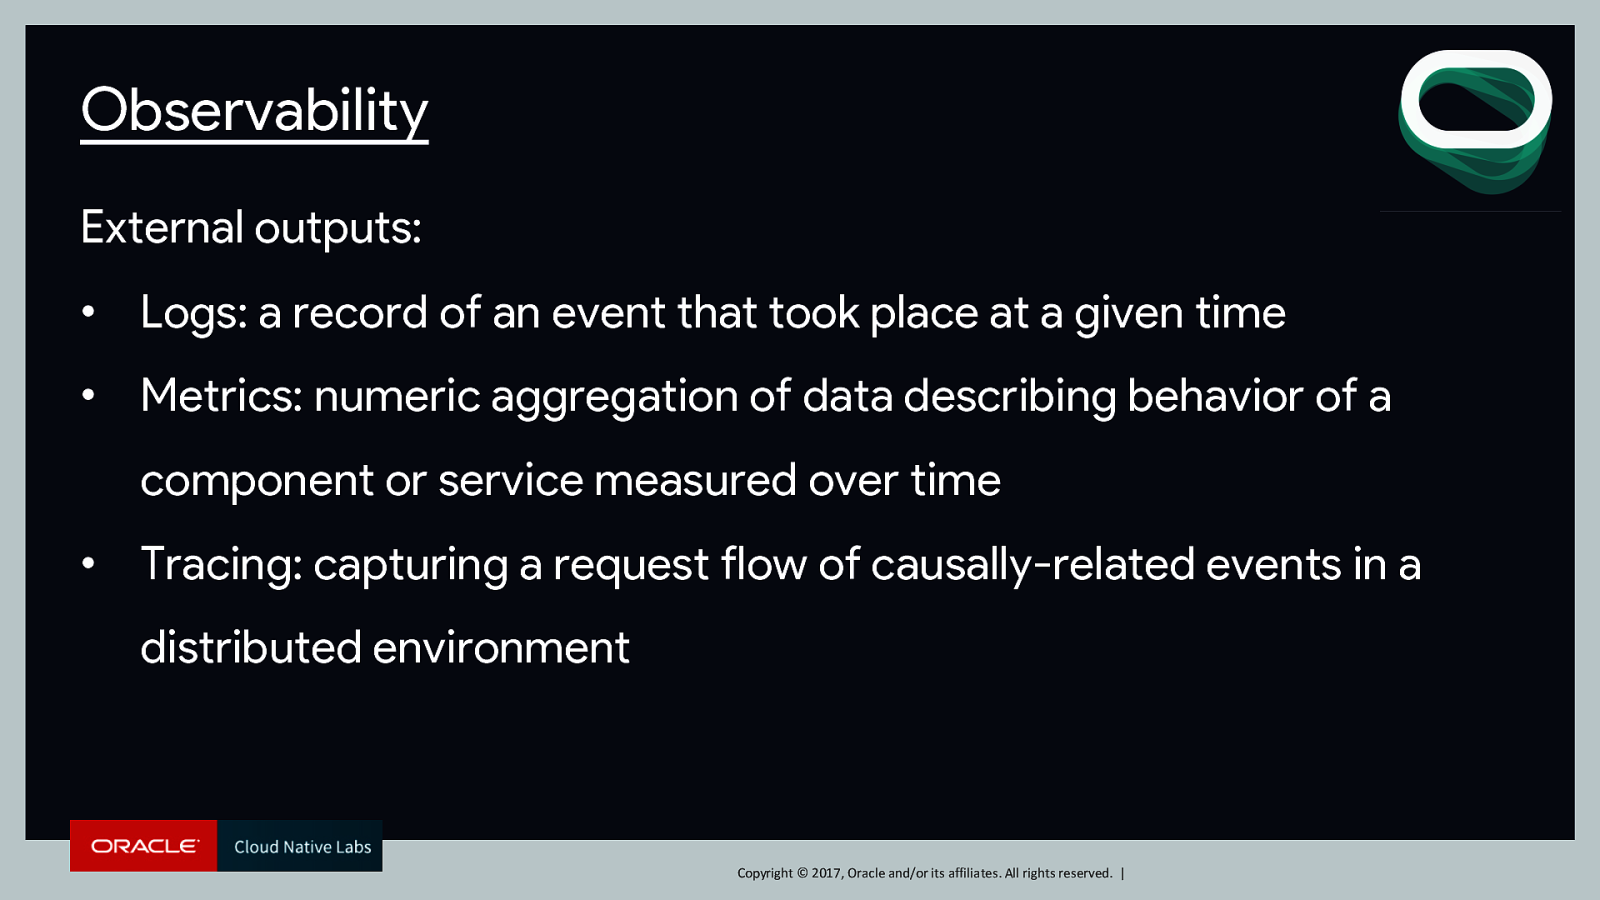
Observability External outputs: • Logs: a record of an event that took place at a given time • Metrics: numeric aggregation of data describing behavior of a component or service measured over time • Tracing: capturing a request flow of causally-related events in a distributed environment Copyright © 2017, Oracle and/or its affiliates. All rights reserved. |
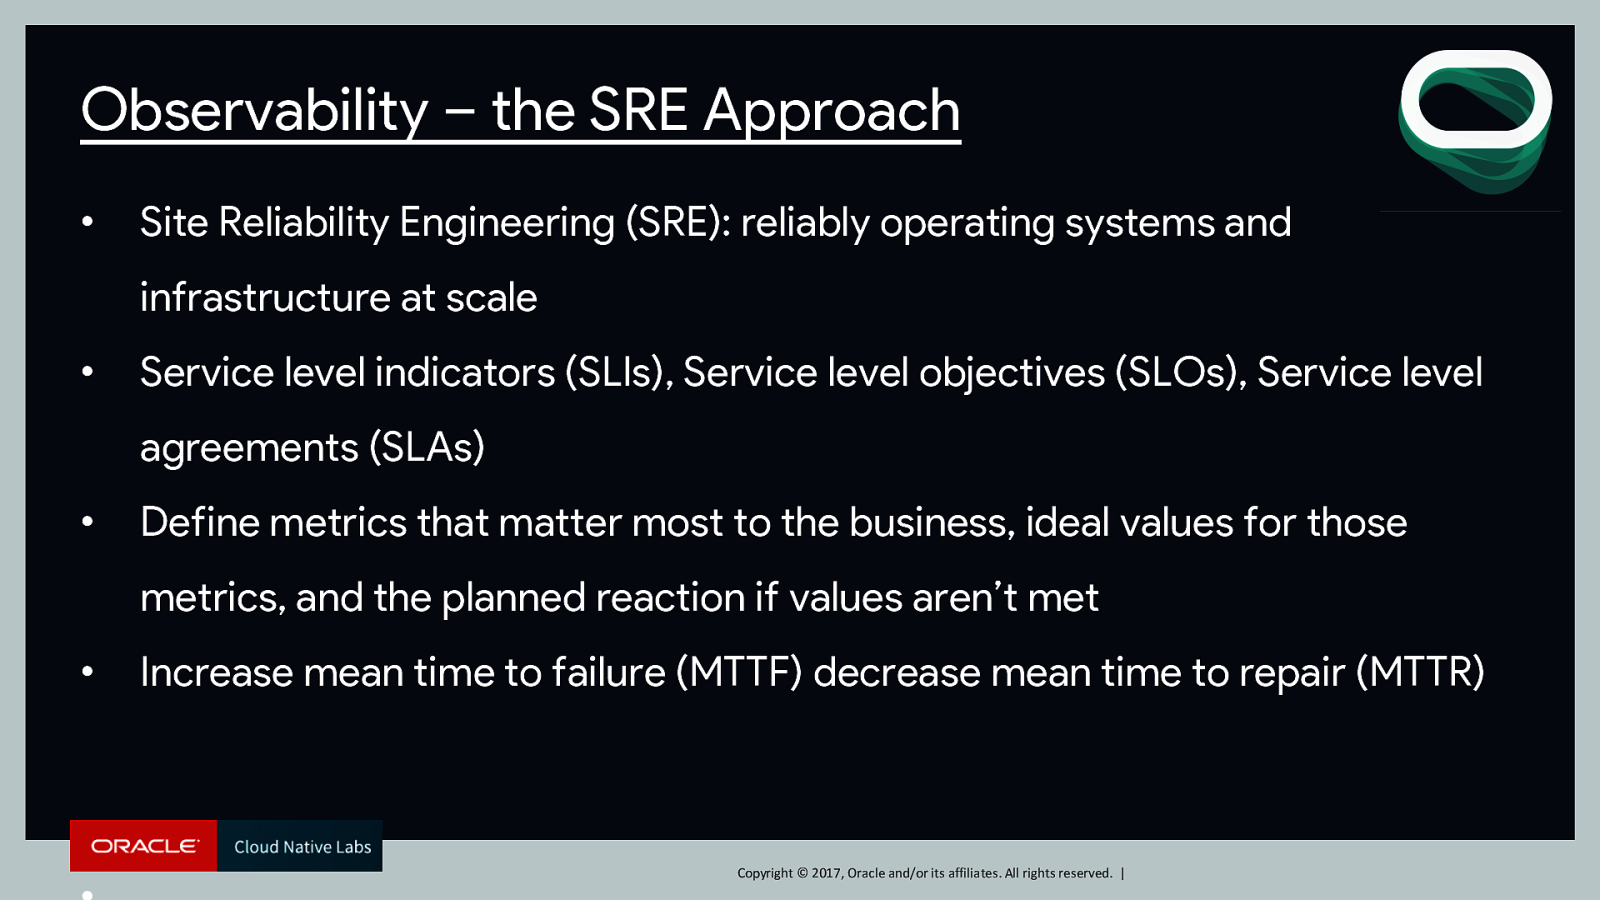
Observability – the SRE Approach • Site Reliability Engineering (SRE): reliably operating systems and infrastructure at scale • Service level indicators (SLIs), Service level objectives (SLOs), Service level agreements (SLAs) • Define metrics that matter most to the business, ideal values for those metrics, and the planned reaction if values aren’t met • Increase mean time to failure (MTTF) decrease mean time to repair (MTTR) Copyright © 2017, Oracle and/or its affiliates. All rights reserved. |
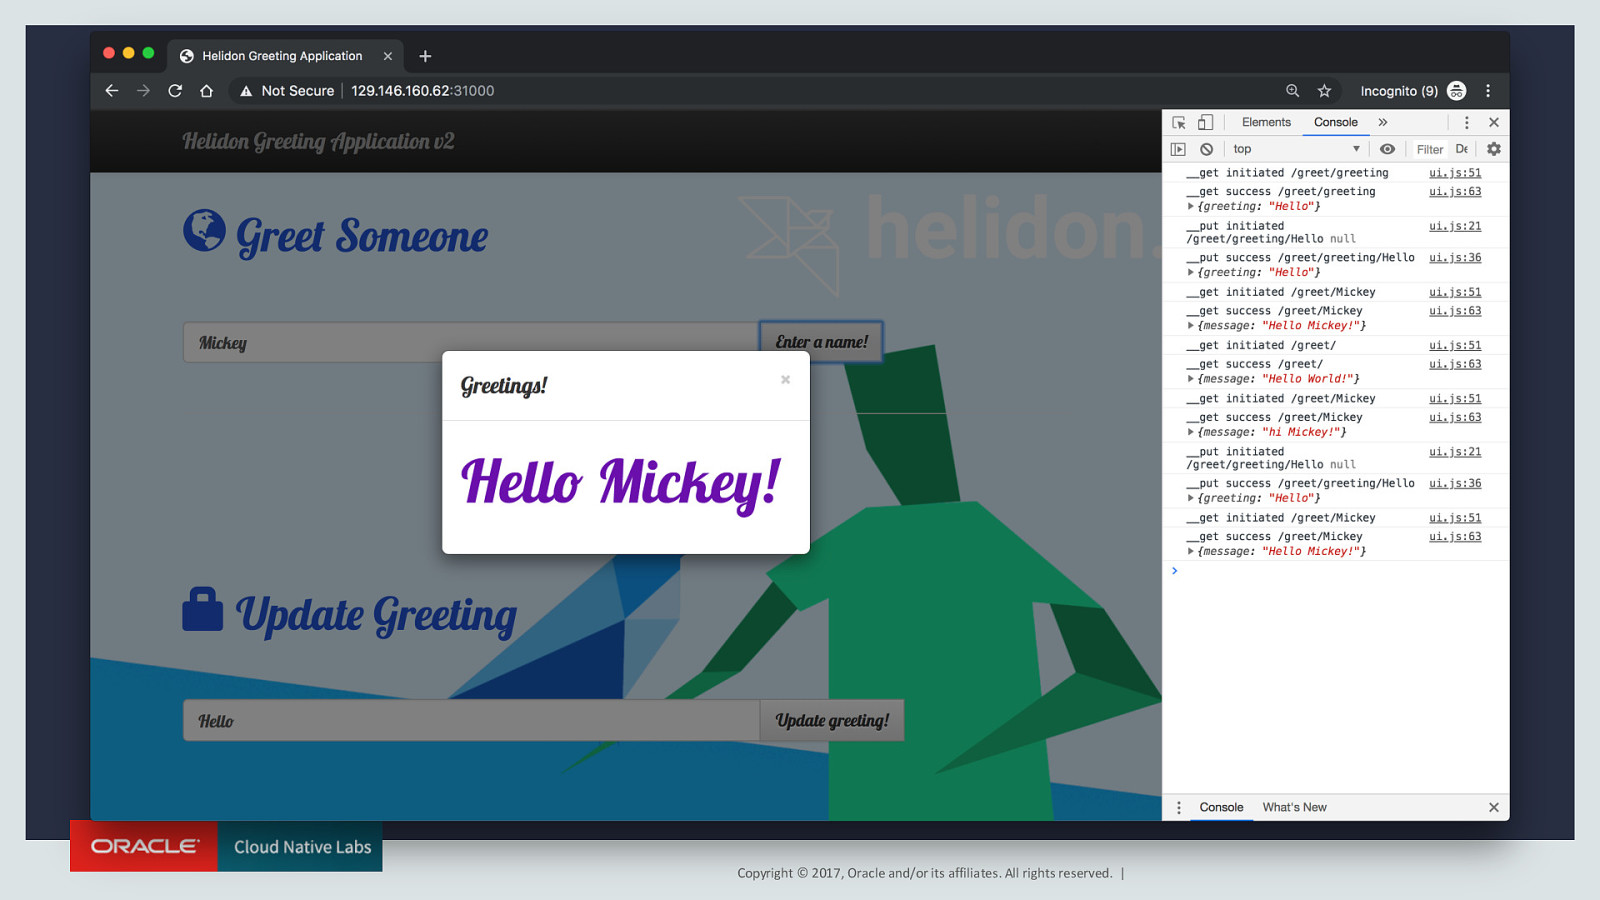
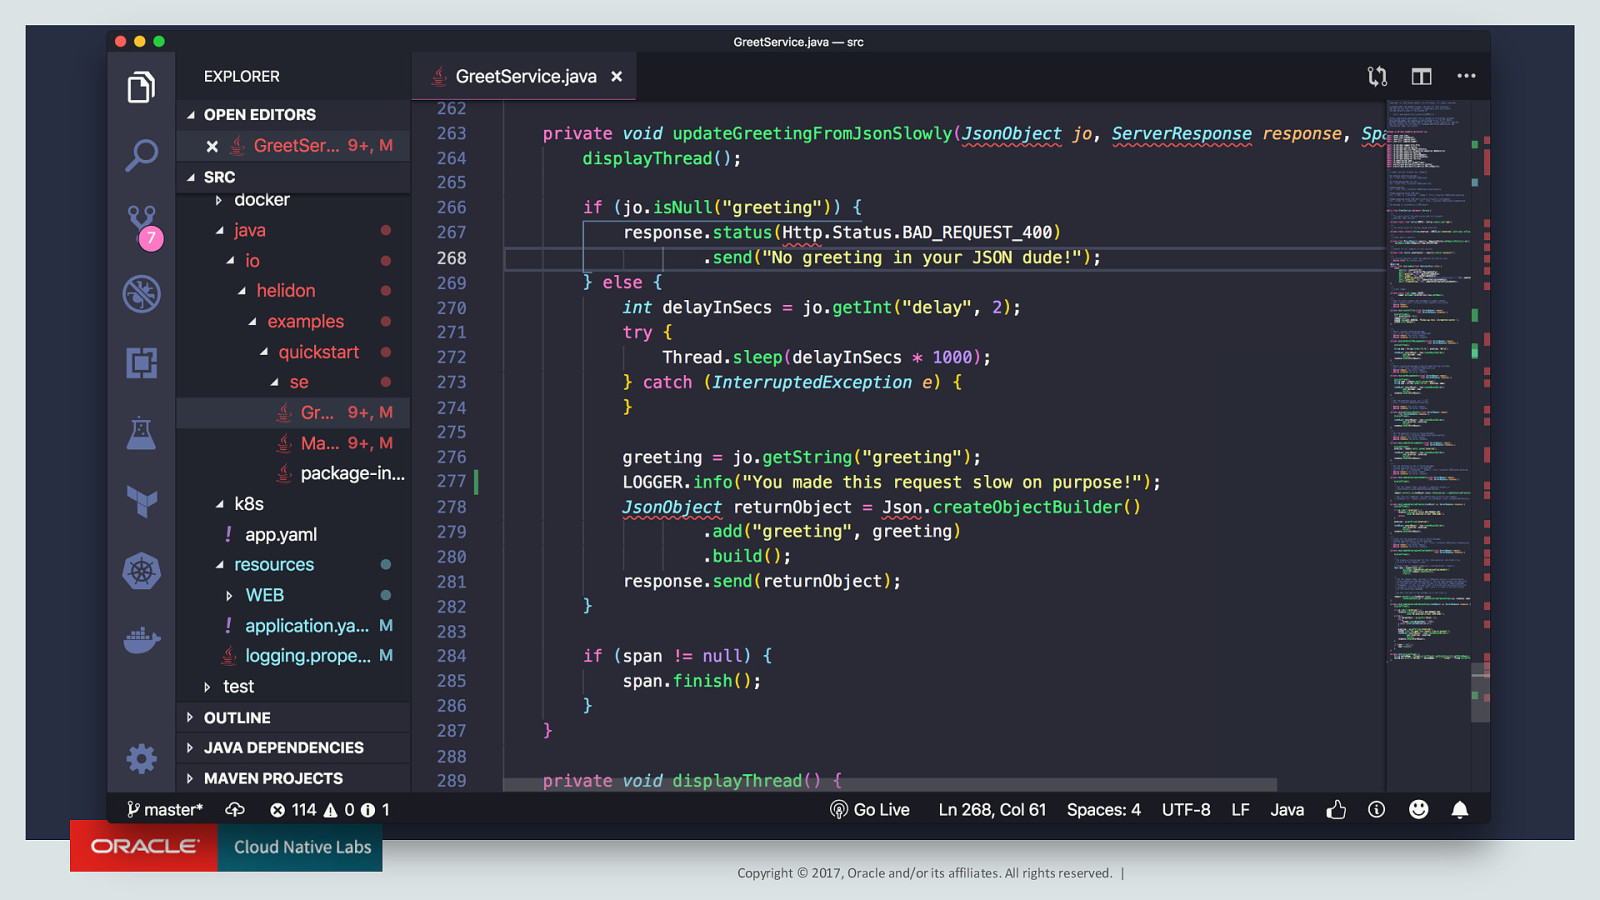
Sample Application • Built using the Helidon framework – Java libraries for microservice development • Main.java and RESTful GreetService.java along with app.yaml • Tracing, health, and metrics instrumented • Deployed on Kubernetes with sidecar injection enabled Copyright © 2017, Oracle and/or its affiliates. All rights reserved. |
Copyright © 2017, Oracle and/or its affiliates. All rights reserved. |
Logging • Logs: a record of an event that took place at a given time • Supported by most libraries • Disciplined to put meaningful logs into your code • Aggregate logs to avoid losing them • Java logging classes and a logging.properties configuration file writing to stdout Copyright © 2017, Oracle and/or its affiliates. All rights reserved. |
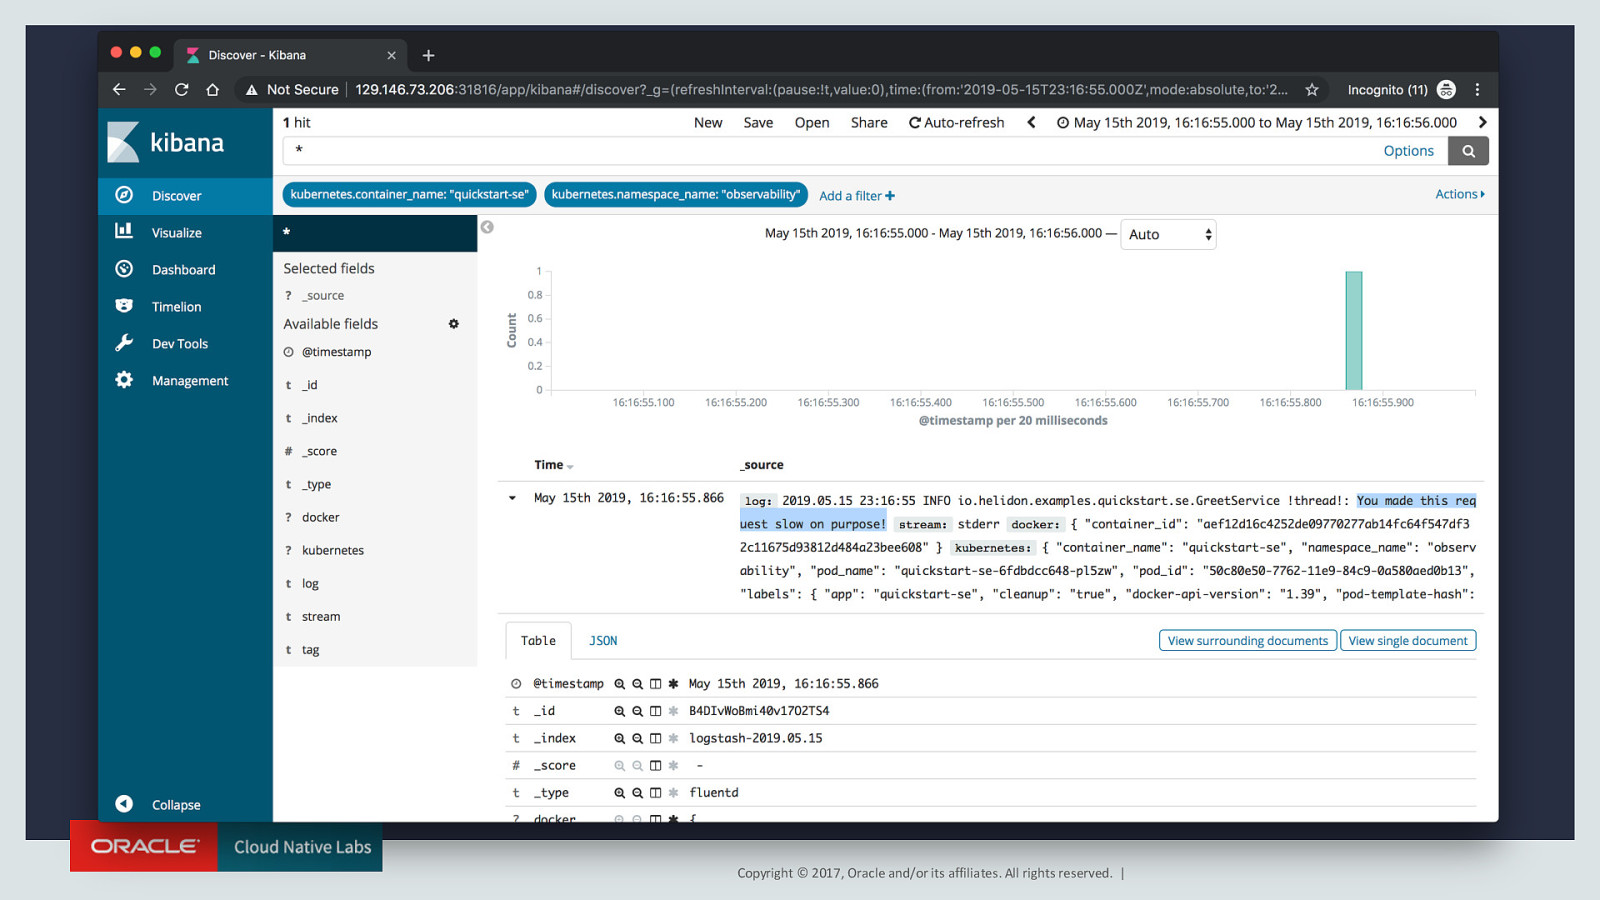
Logging • FluentD used to scrape logs, process, and ship them • Stored in a persistent data store, such as Elasticsearch, distributed analytics engine • Queried directly or interacted with by means of Kibana, a customizable visualization dashboard • Choose a tool to capture and analyze logs Copyright © 2017, Oracle and/or its affiliates. All rights reserved. |
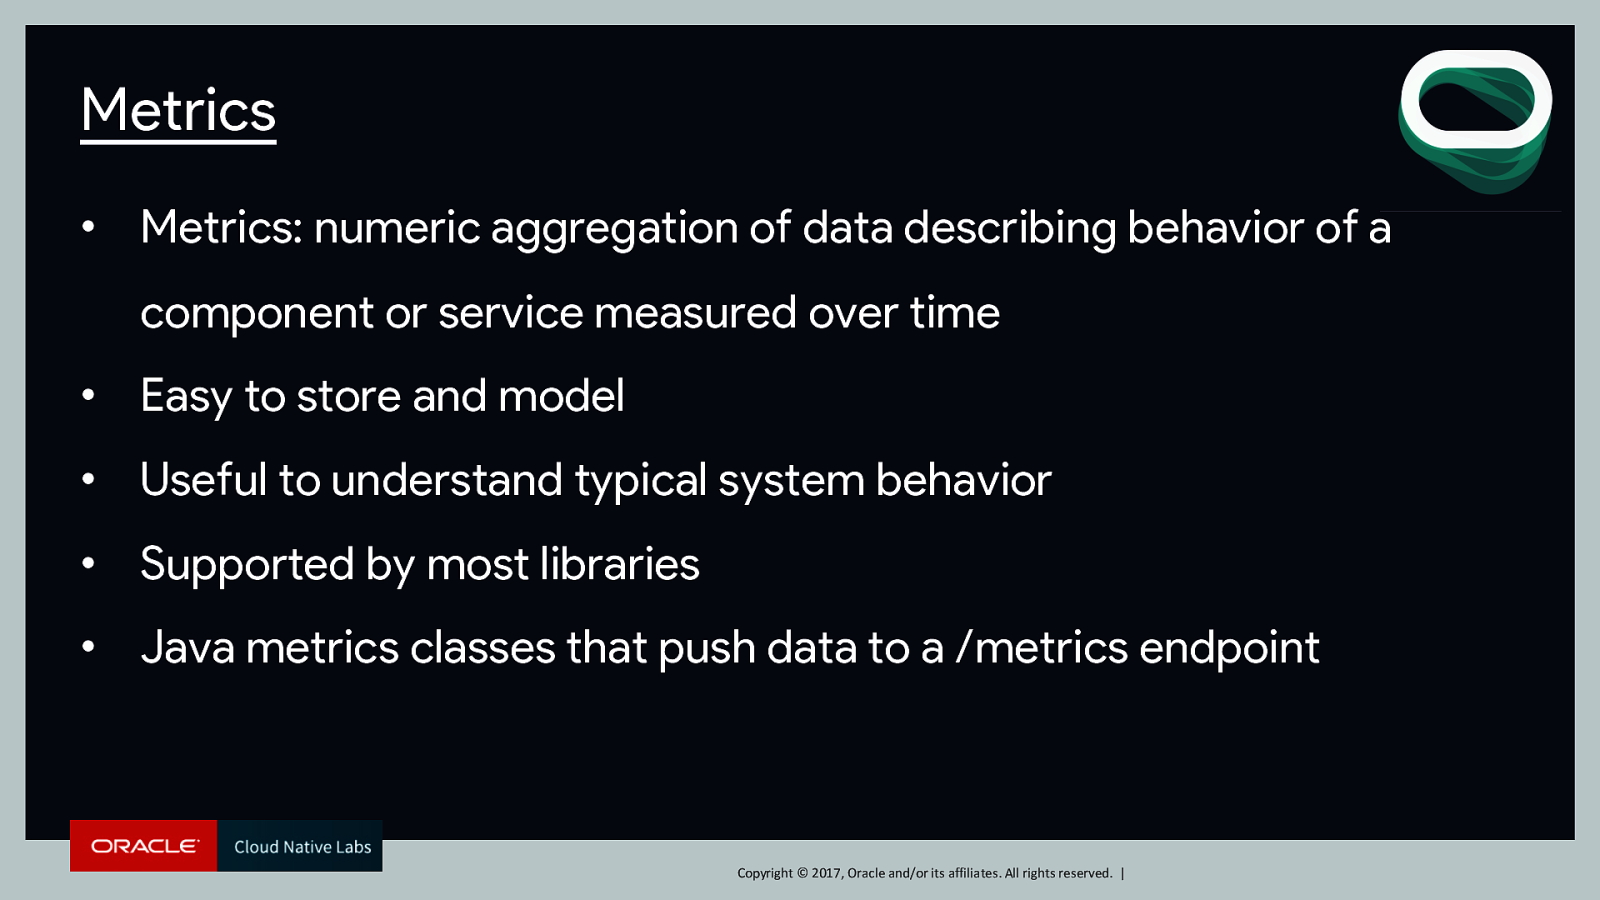
Metrics • Metrics: numeric aggregation of data describing behavior of a component or service measured over time • Easy to store and model • Useful to understand typical system behavior • Supported by most libraries • Java metrics classes that push data to a /metrics endpoint Copyright © 2017, Oracle and/or its affiliates. All rights reserved. |
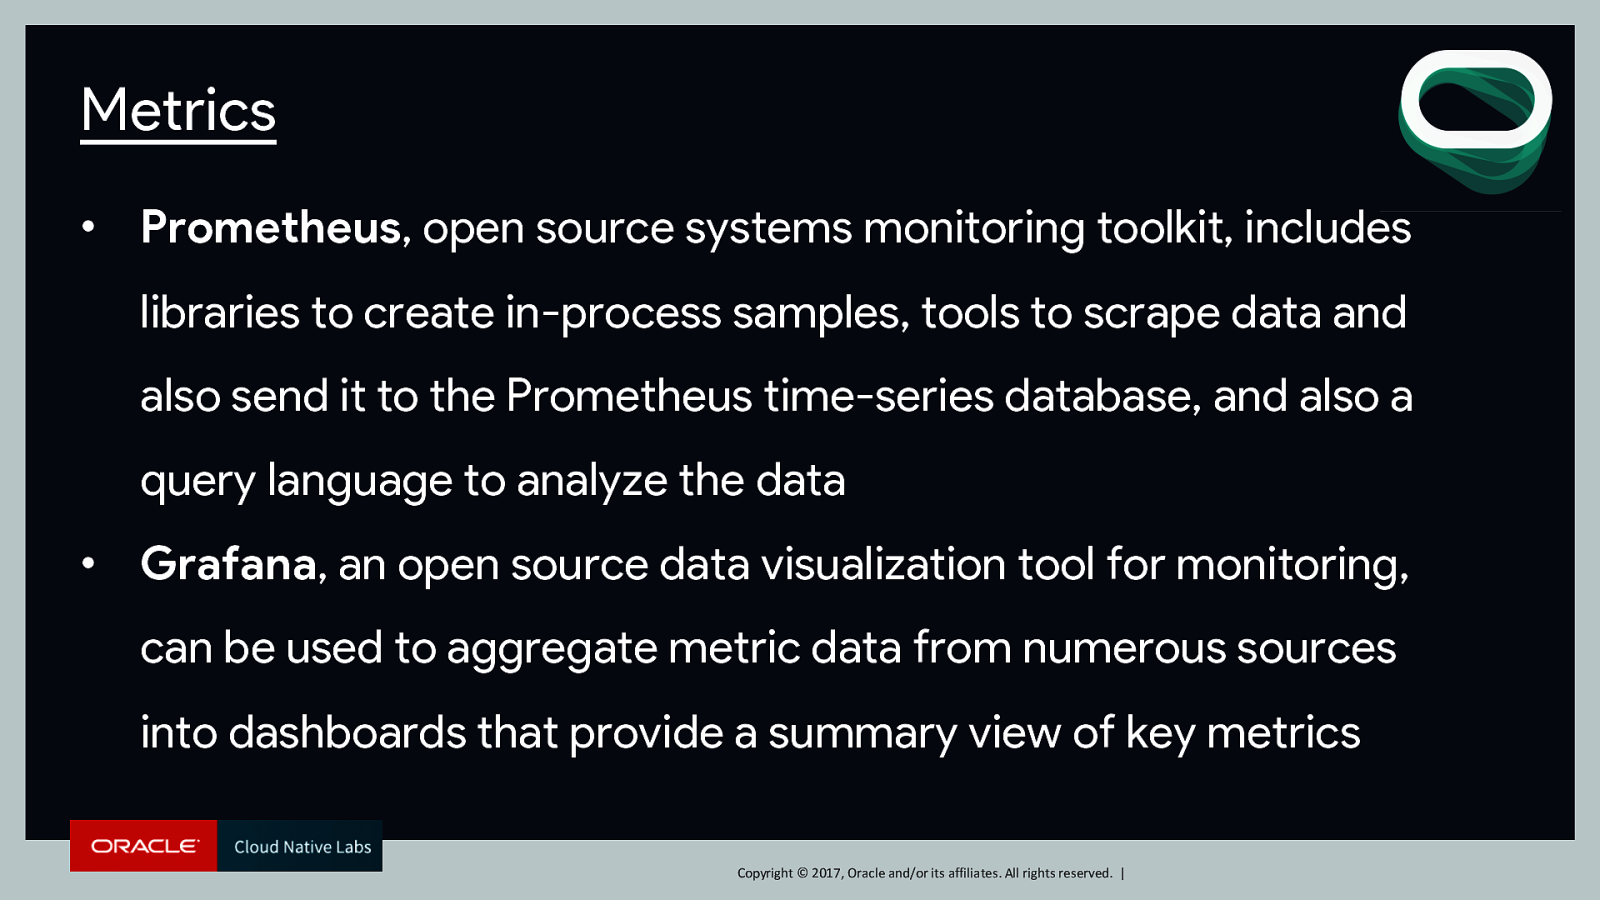
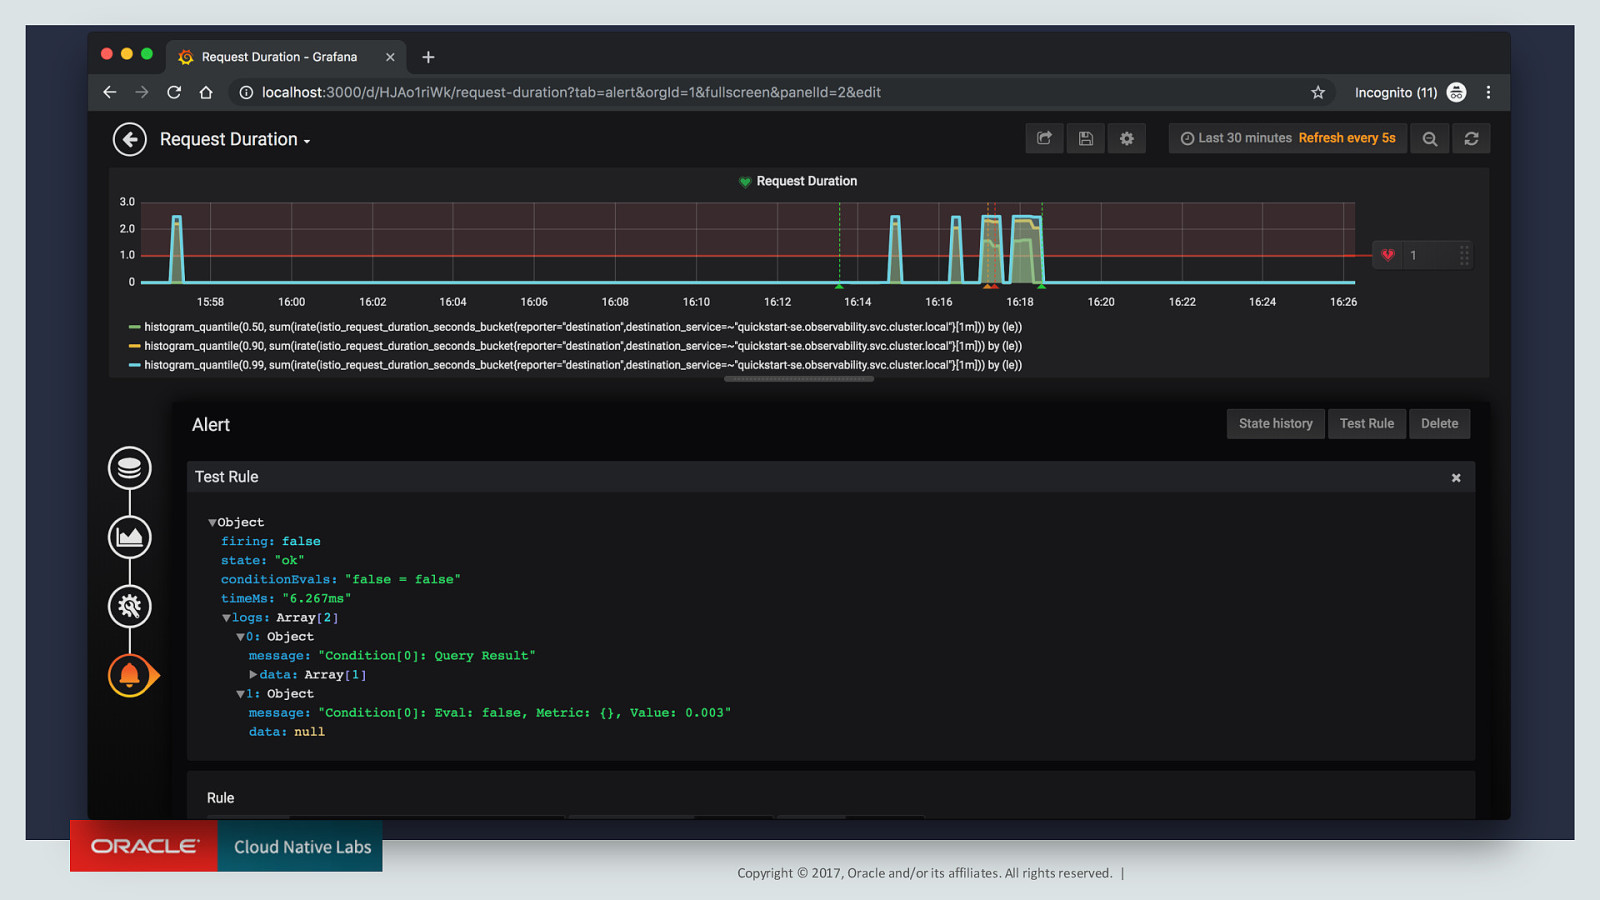
Metrics • Prometheus, open source systems monitoring toolkit, includes libraries to create in-process samples, tools to scrape data and also send it to the Prometheus time-series database, and also a query language to analyze the data • Grafana, an open source data visualization tool for monitoring, can be used to aggregate metric data from numerous sources into dashboards that provide a summary view of key metrics Copyright © 2017, Oracle and/or its affiliates. All rights reserved. |
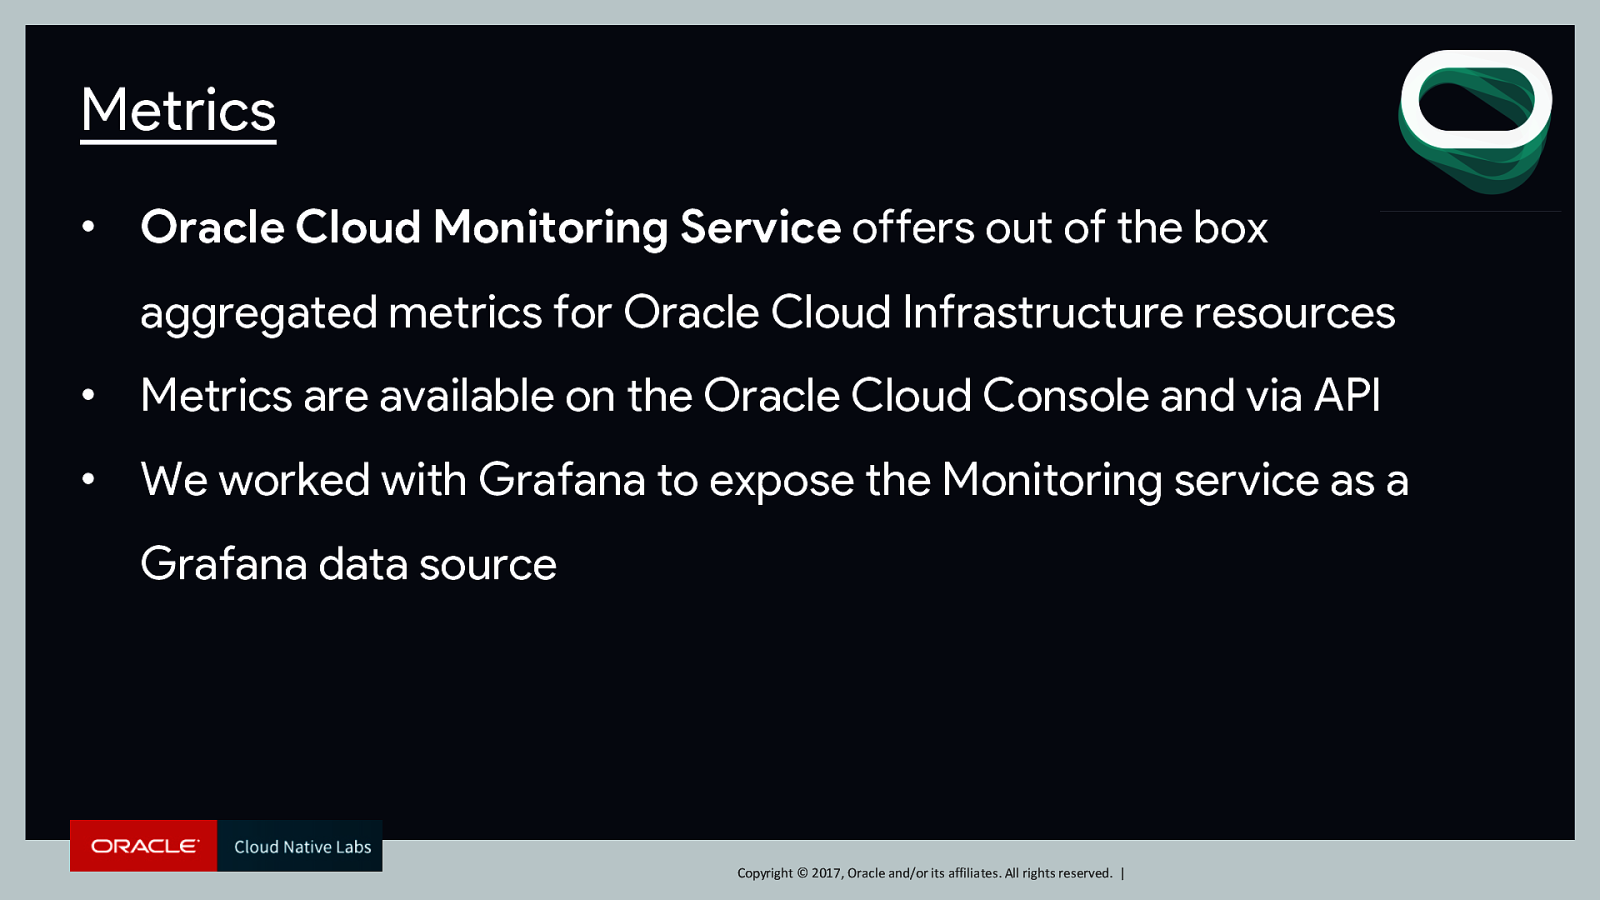
Metrics • Oracle Cloud Monitoring Service offers out of the box aggregated metrics for Oracle Cloud Infrastructure resources • Metrics are available on the Oracle Cloud Console and via API • We worked with Grafana to expose the Monitoring service as a Grafana data source Copyright © 2017, Oracle and/or its affiliates. All rights reserved. |
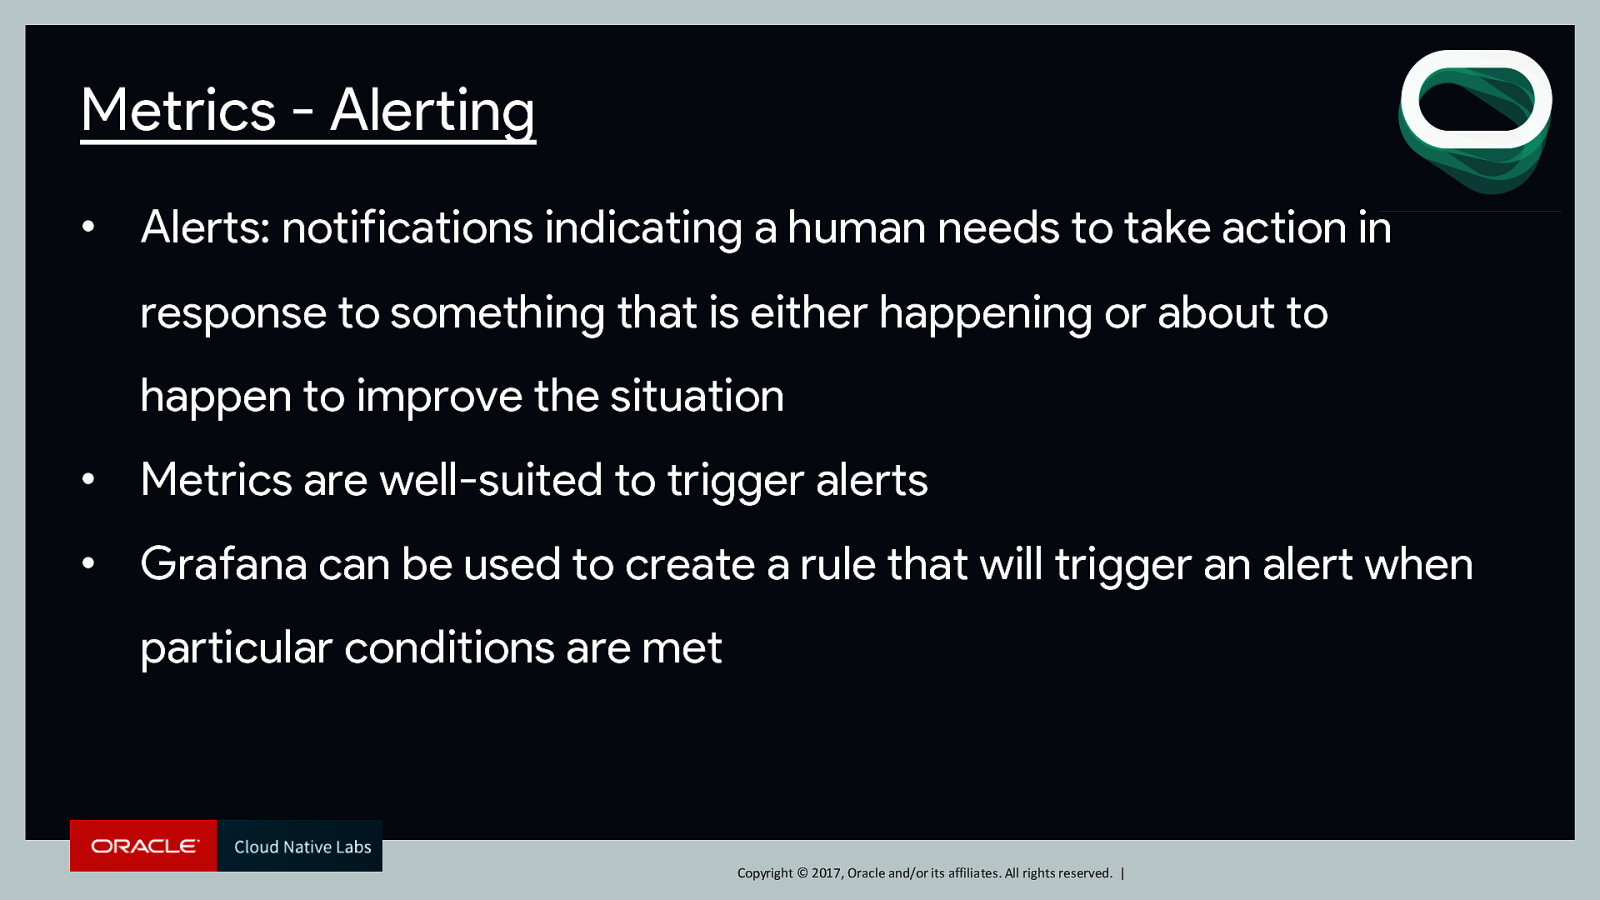
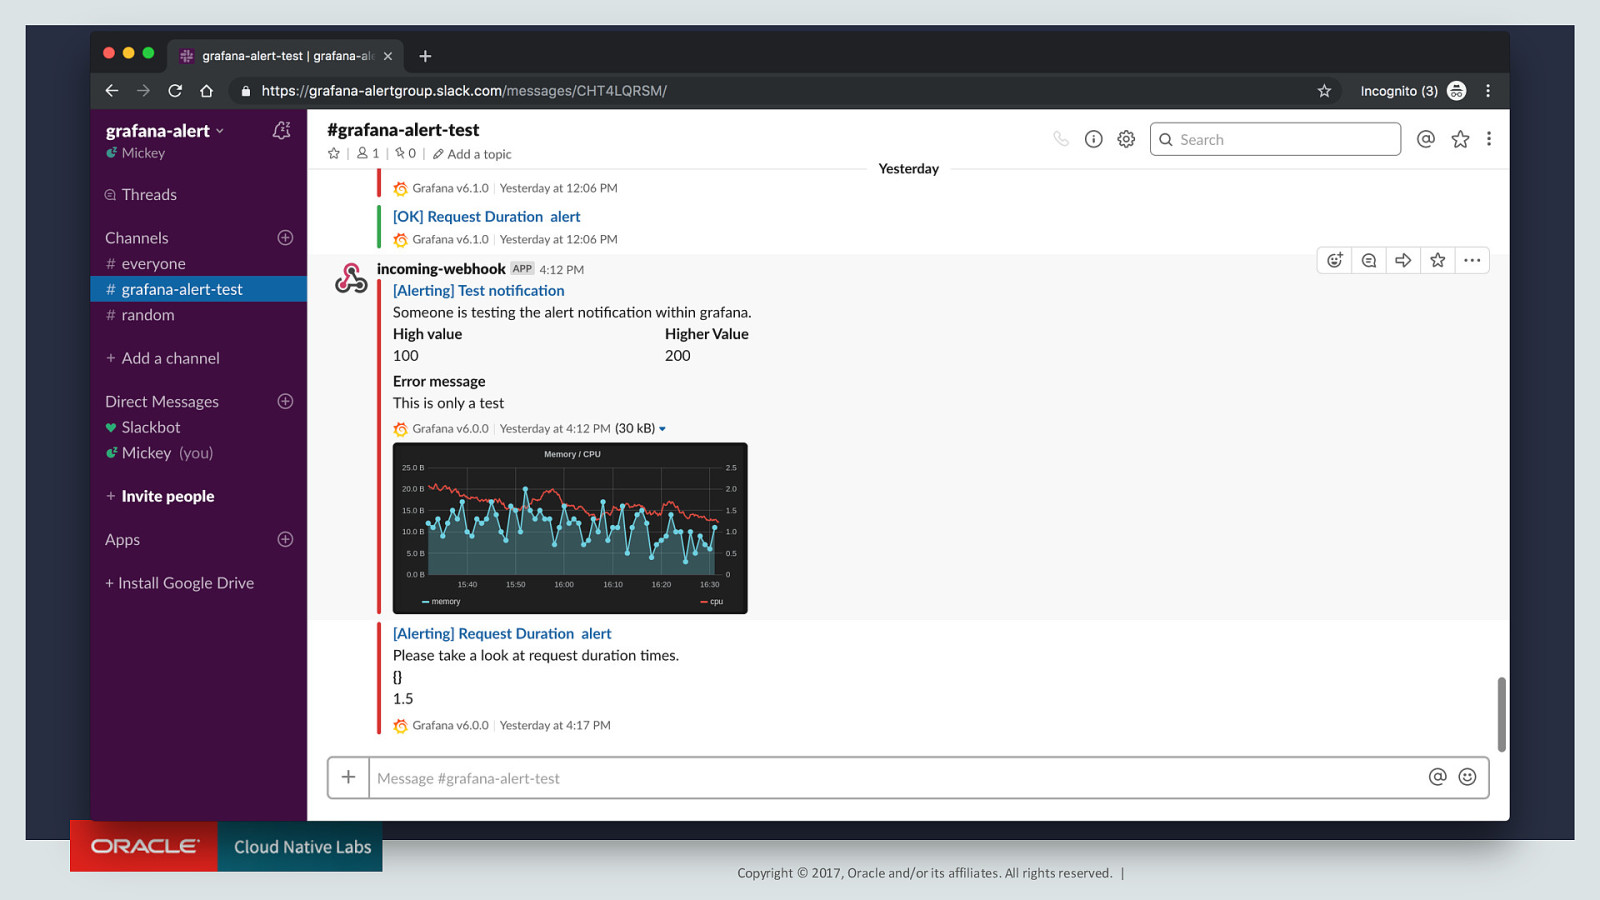
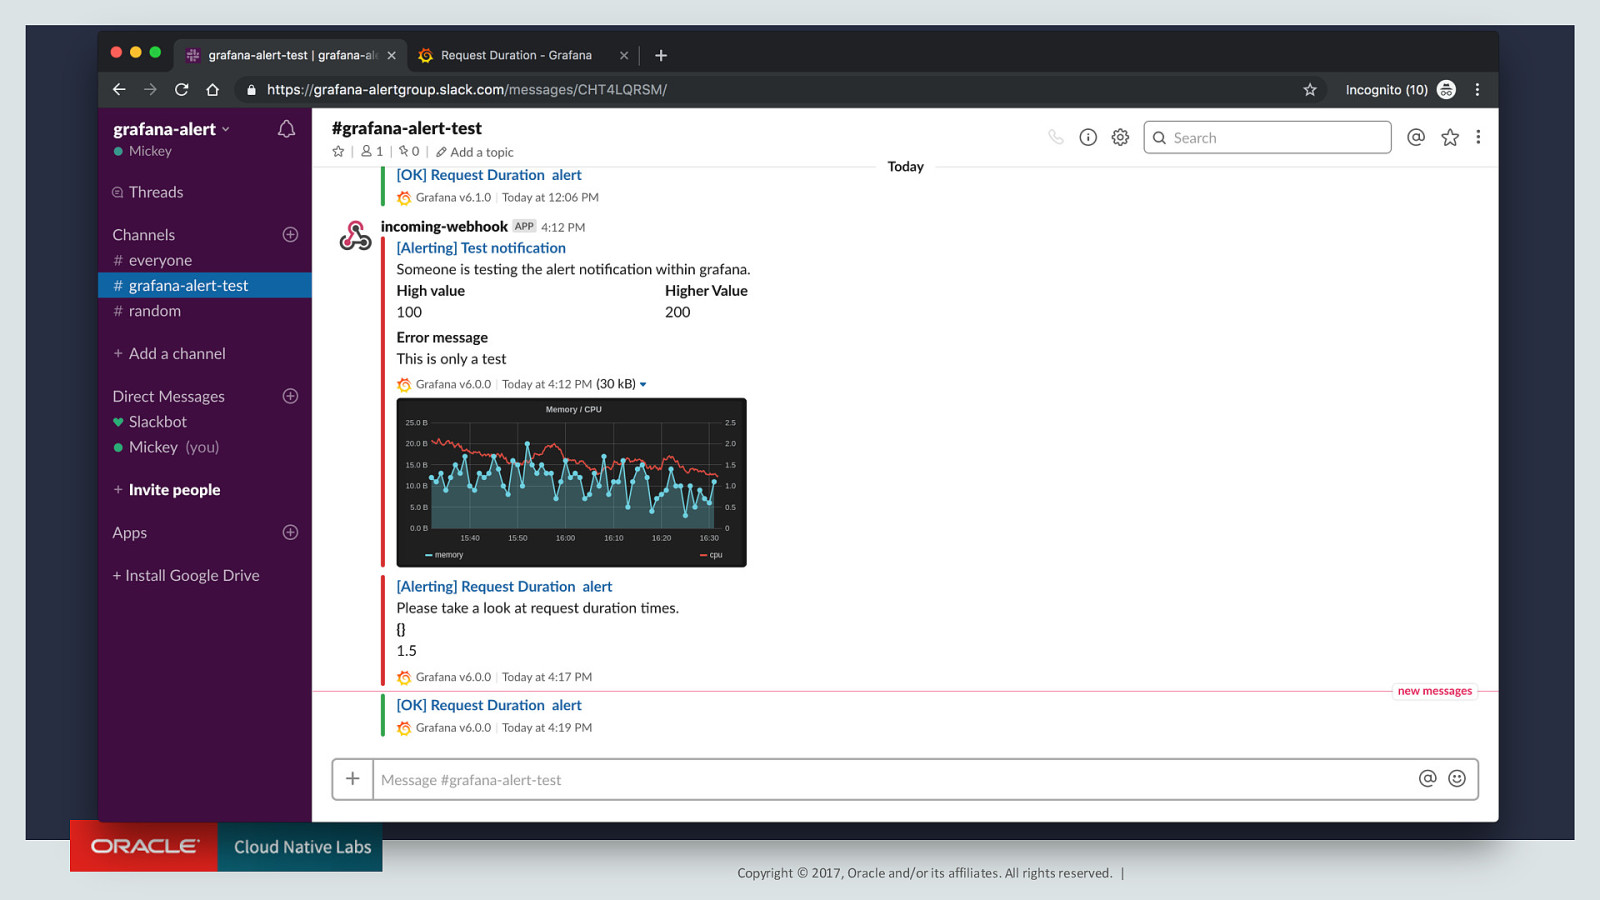
Metrics - Alerting • Alerts: notifications indicating a human needs to take action in response to something that is either happening or about to happen to improve the situation • Metrics are well-suited to trigger alerts • Grafana can be used to create a rule that will trigger an alert when particular conditions are met Copyright © 2017, Oracle and/or its affiliates. All rights reserved. |
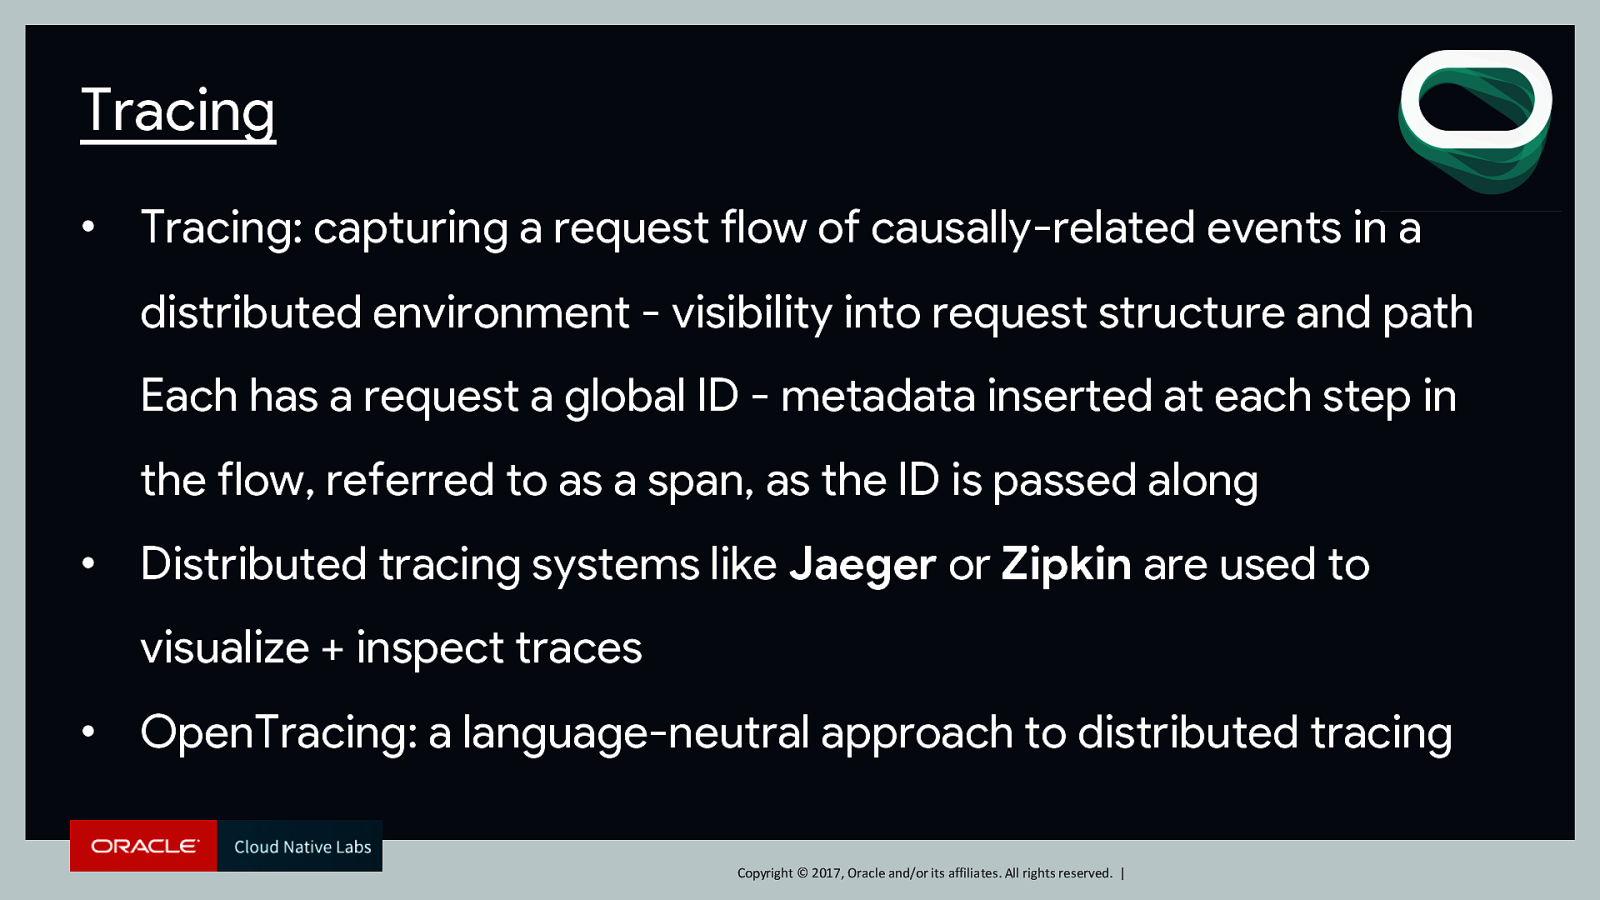
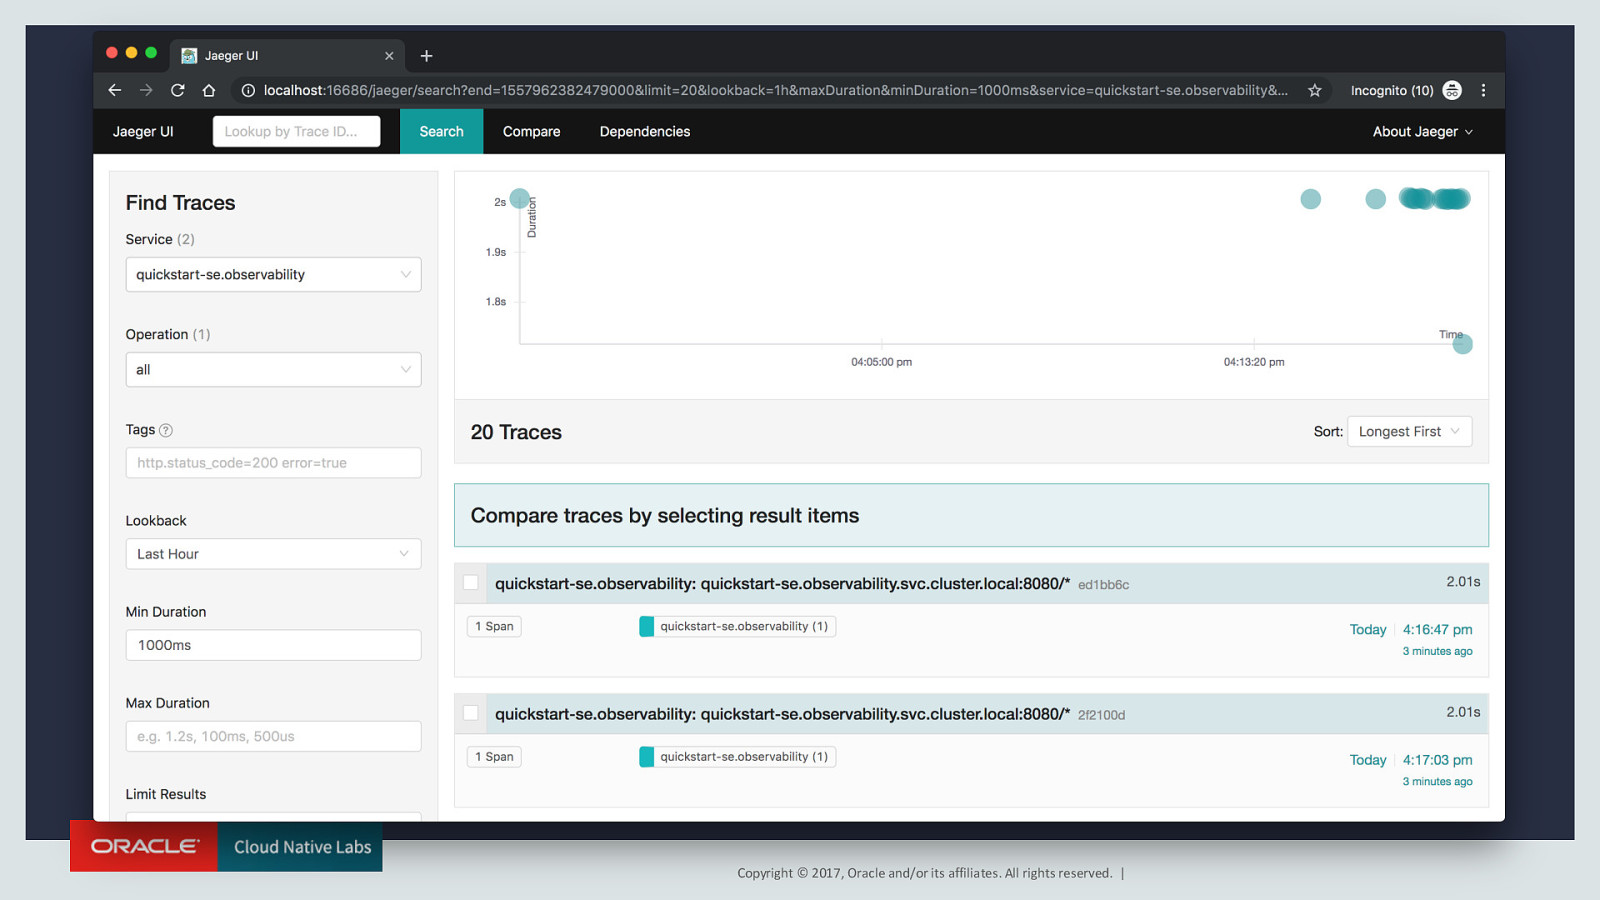
Tracing • Tracing: capturing a request flow of causally-related events in a distributed environment - visibility into request structure and path Each has a request a global ID - metadata inserted at each step in the flow, referred to as a span, as the ID is passed along • Distributed tracing systems like Jaeger or Zipkin are used to visualize + inspect traces • OpenTracing: a language-neutral approach to distributed tracing Copyright © 2017, Oracle and/or its affiliates. All rights reserved. |
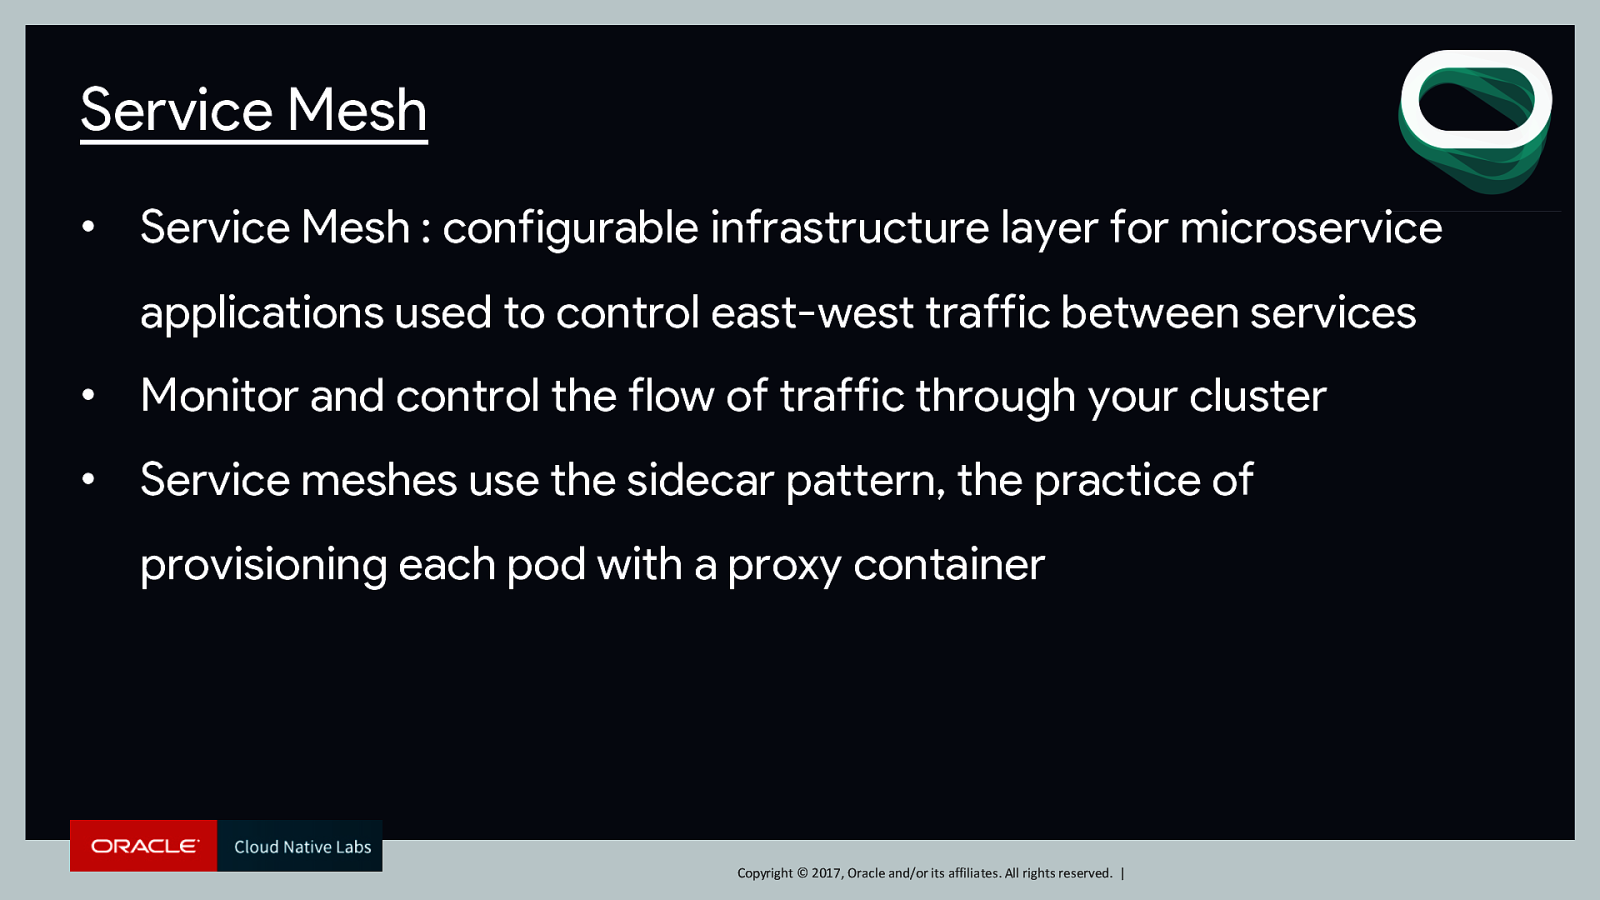
Service Mesh • Service Mesh : configurable infrastructure layer for microservice applications used to control east-west traffic between services • Monitor and control the flow of traffic through your cluster • Service meshes use the sidecar pattern, the practice of provisioning each pod with a proxy container Copyright © 2017, Oracle and/or its affiliates. All rights reserved. |
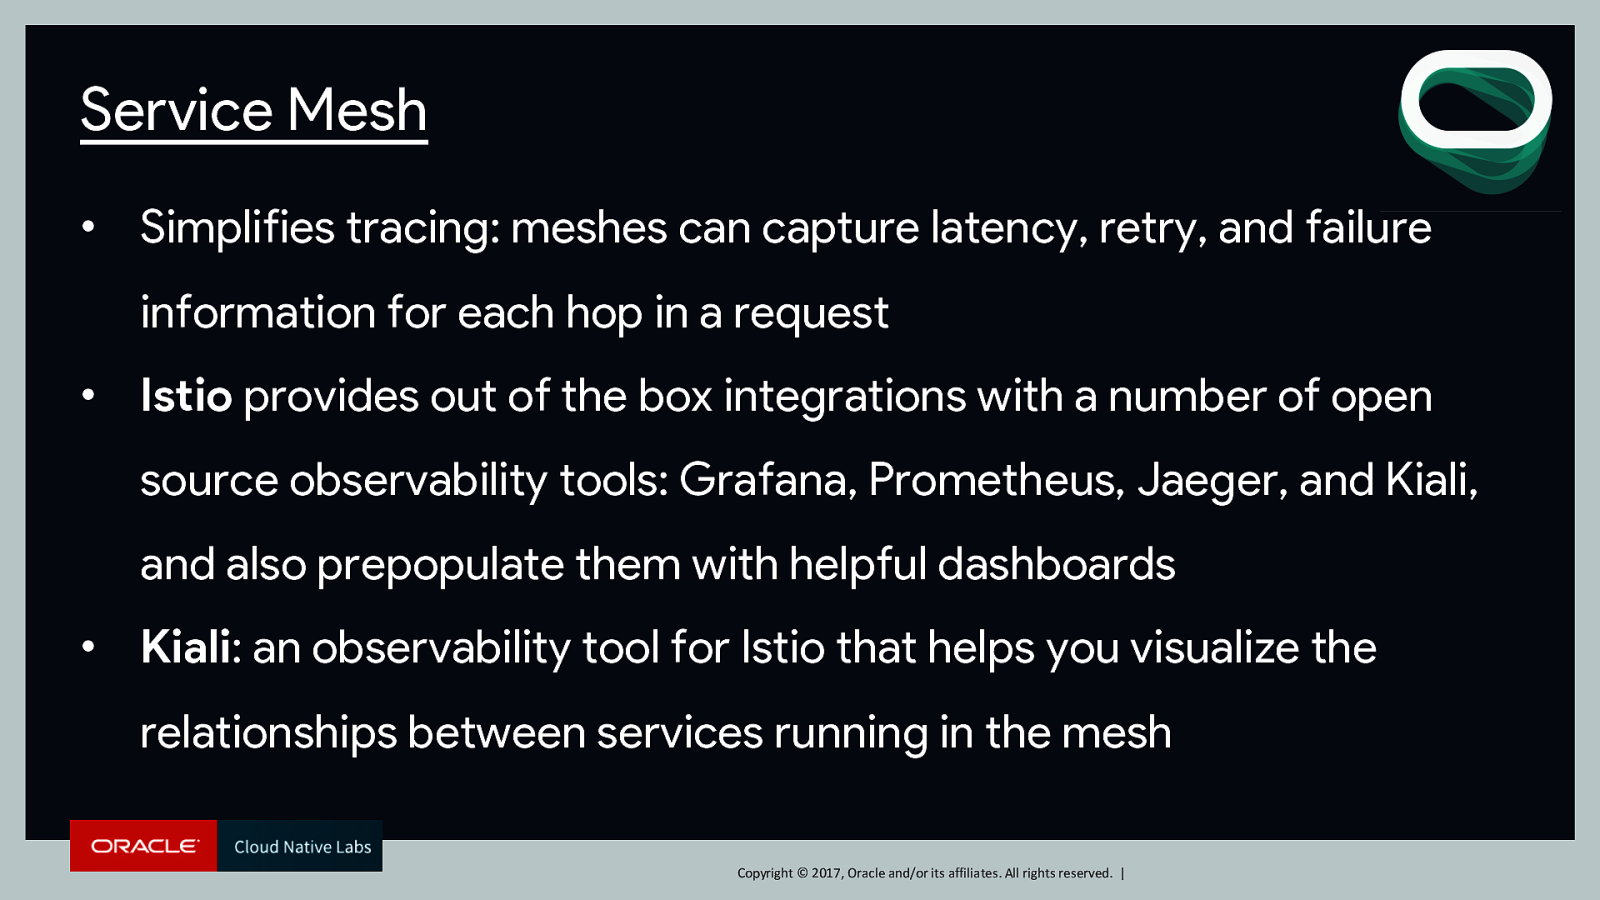
Service Mesh • Simplifies tracing: meshes can capture latency, retry, and failure information for each hop in a request • Istio provides out of the box integrations with a number of open source observability tools: Grafana, Prometheus, Jaeger, and Kiali, and also prepopulate them with helpful dashboards • Kiali: an observability tool for Istio that helps you visualize the relationships between services running in the mesh Copyright © 2017, Oracle and/or its affiliates. All rights reserved. |
Copyright © 2017, Oracle and/or its affiliates. All rights reserved. |

Copyright © 2017, Oracle and/or its affiliates. All rights reserved. |
Copyright © 2017, Oracle and/or its affiliates. All rights reserved. |
Copyright © 2017, Oracle and/or its affiliates. All rights reserved. |
Copyright © 2017, Oracle and/or its affiliates. All rights reserved. |
Copyright © 2017, Oracle and/or its affiliates. All rights reserved. |
Copyright © 2017, Oracle and/or its affiliates. All rights reserved. |
Key Takeaways • Observability takes a holistic approach to operations • Its practices give you maximum visibility into the behavior of a modern distributed system • Gain insight from logging, metrics, and tracing - discover issues, pinpoint their location, and determine a fix • Proactively test and improve system performance/efficiency • Recognize impact to the business Copyright © 2017, Oracle and/or its affiliates. All rights reserved. |
Native Stay Connected Sign up for Oracle Cloud Native Labs news, events and other updates : http://bit.ly/Oracle-CNL-Connect cloudnative.oracle.com Copyright © 2017, Oracle and/or its affiliates. All rights reserved. |