Native Oracle Cloud Infrastructure Data Source for Grafana Mickey Boxell – Oracle Cloud Native Labs cloudnative.oracle.com Copyright © 2017, Oracle and/or its affiliates. All rights reserved. |

A presentation at Grafana Customer Connect in July 2019 in by Mickey Boxell
Native Oracle Cloud Infrastructure Data Source for Grafana Mickey Boxell – Oracle Cloud Native Labs cloudnative.oracle.com Copyright © 2017, Oracle and/or its affiliates. All rights reserved. |
Safe Harbor Statement The following is intended to outline our general product direction. It is intended for information purposes only, and may not be incorporated into any contract. It is not a commitment to deliver any material, code, or functionality, and should not be relied upon in making purchasing decisions. The development, release, and timing of any features or functionality described for Oracle’s products remains at the sole discretion of Oracle. Copyright © 2017, Oracle and/or its affiliates. All rights reserved. |
Who am I? Mickey Boxell Cloud Advocate, etc. Oracle Cloud Native Labs Share best practices and build original solutions and content for cloud developers with a key focus on cloud native/container native, open source, and DevOps http://cloudnative.oracle.com/ Copyright © 2017, Oracle and/or its affiliates. All rights reserved. |
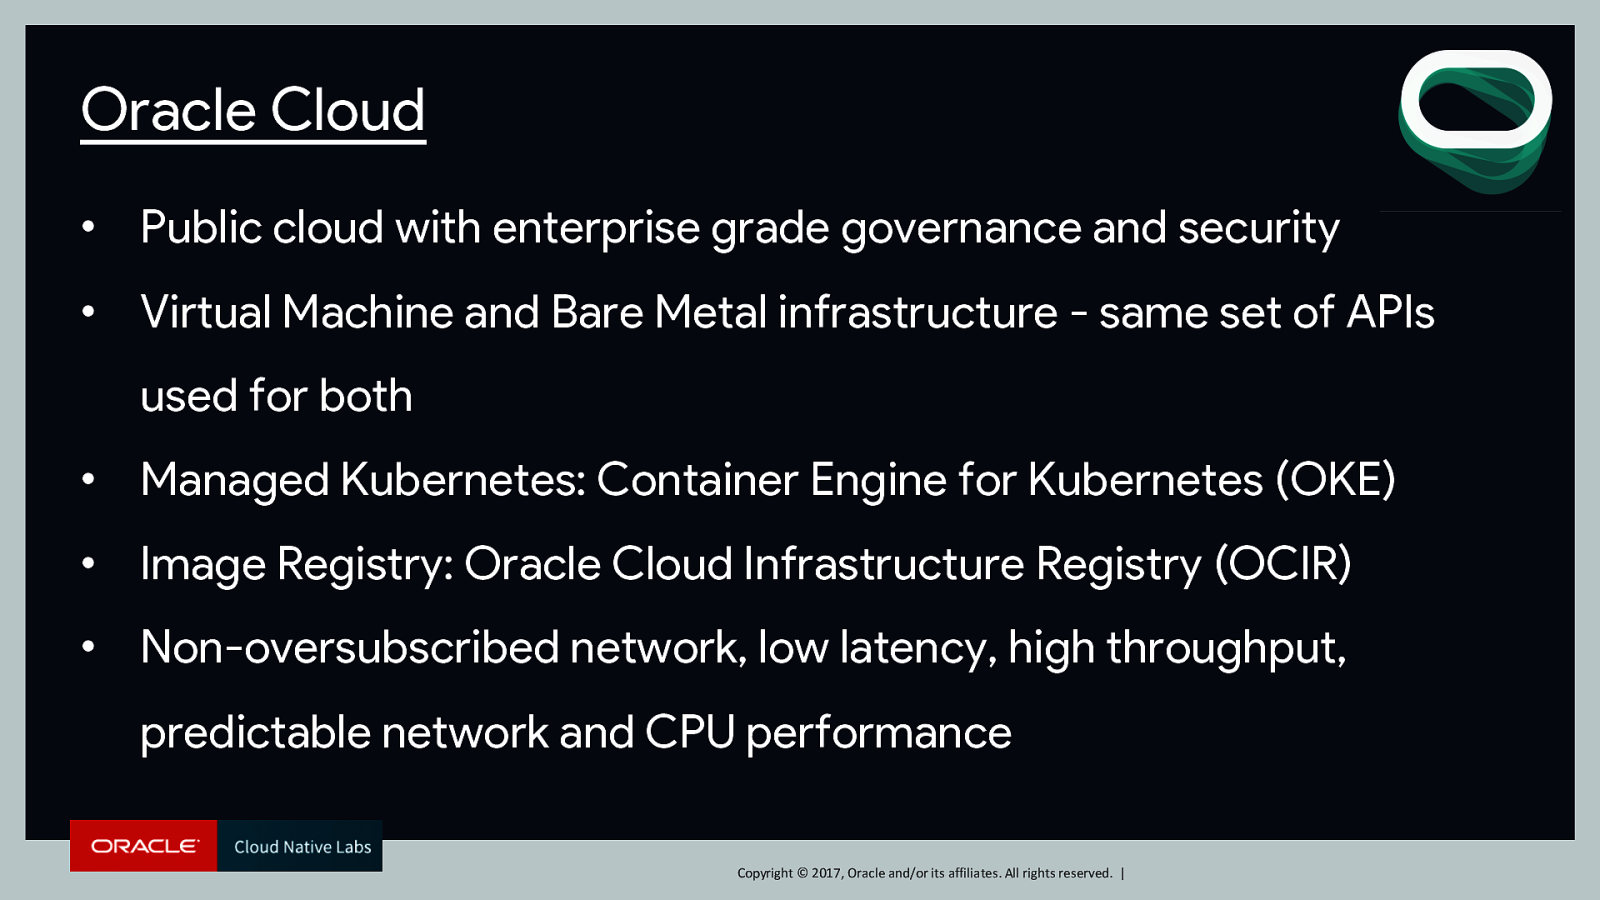
Oracle Cloud • Public cloud with enterprise grade governance and security • Virtual Machine and Bare Metal infrastructure - same set of APIs used for both • Managed Kubernetes: Container Engine for Kubernetes (OKE) • Image Registry: Oracle Cloud Infrastructure Registry (OCIR) • Non-oversubscribed network, low latency, high throughput, predictable network and CPU performance Copyright © 2017, Oracle and/or its affiliates. All rights reserved. |
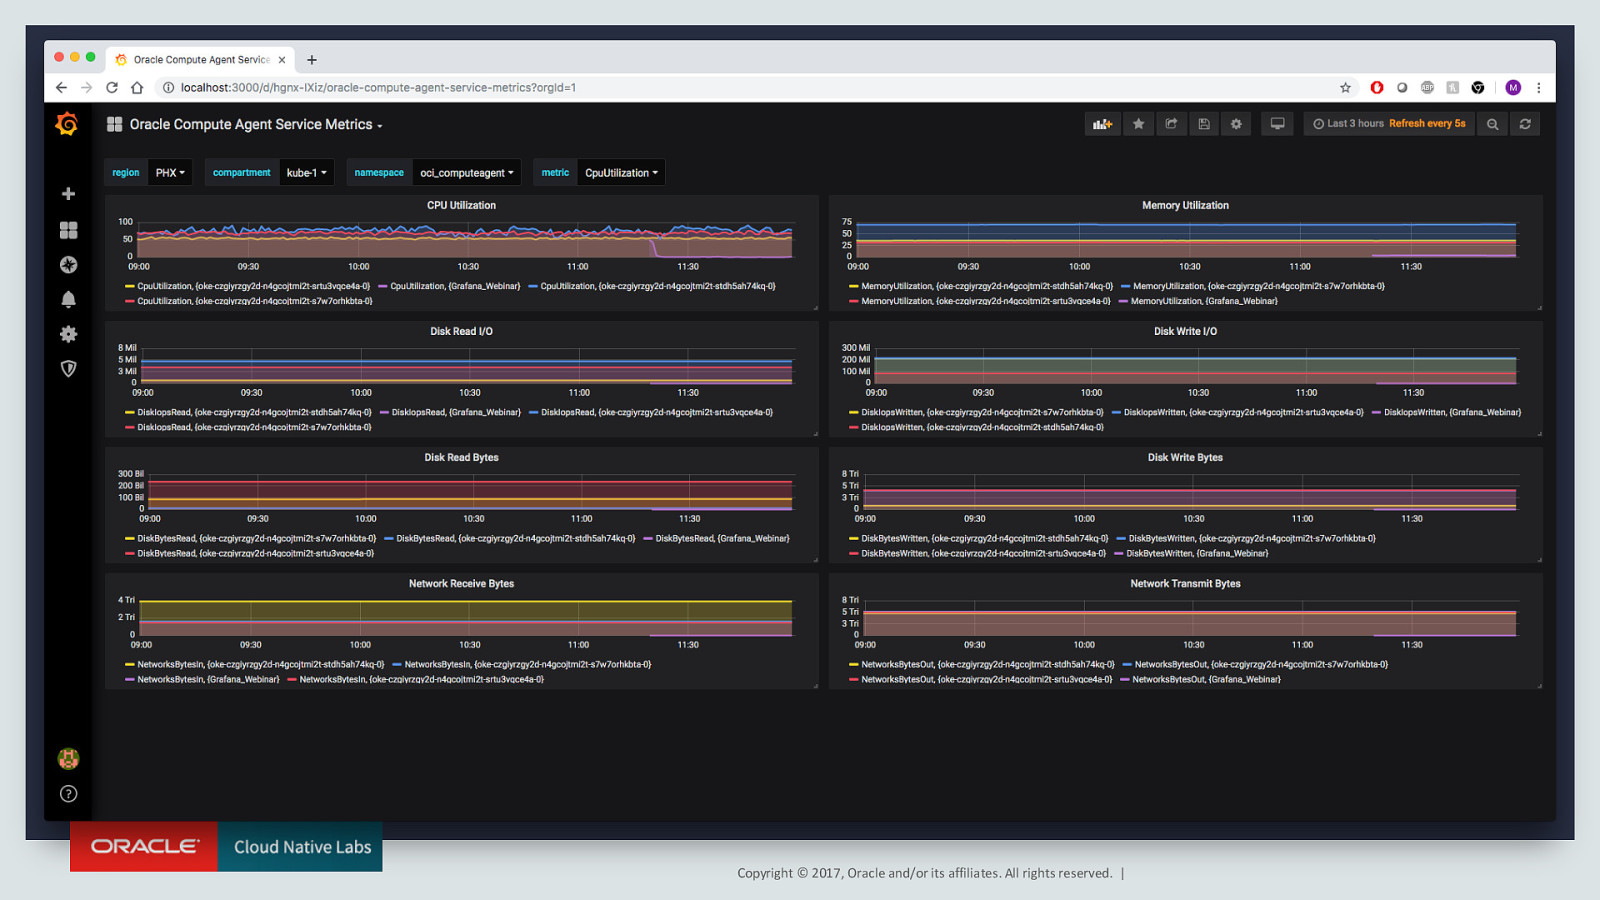
Why Grafana? • Oracle Cloud Monitoring offers valuable telemetry data from a number of resources • Our users have enough dashboards to keep track of already • Grafana offers a centralized dashboard to view metrics from countless different sources Copyright © 2017, Oracle and/or its affiliates. All rights reserved. |
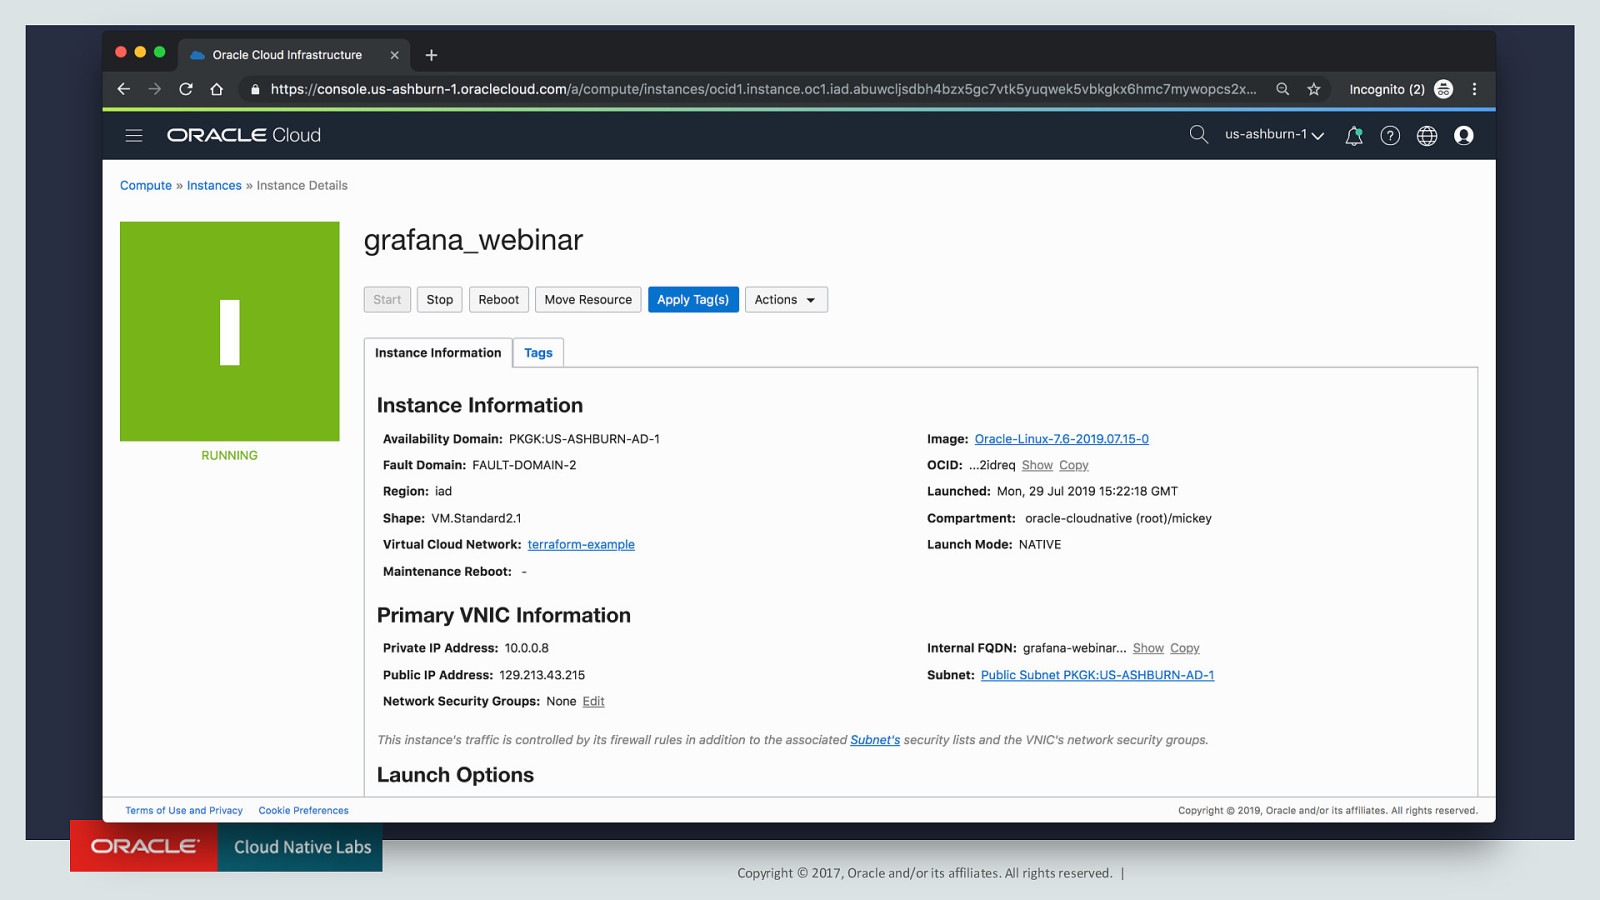
Copyright © 2017, Oracle and/or its affiliates. All rights reserved. |
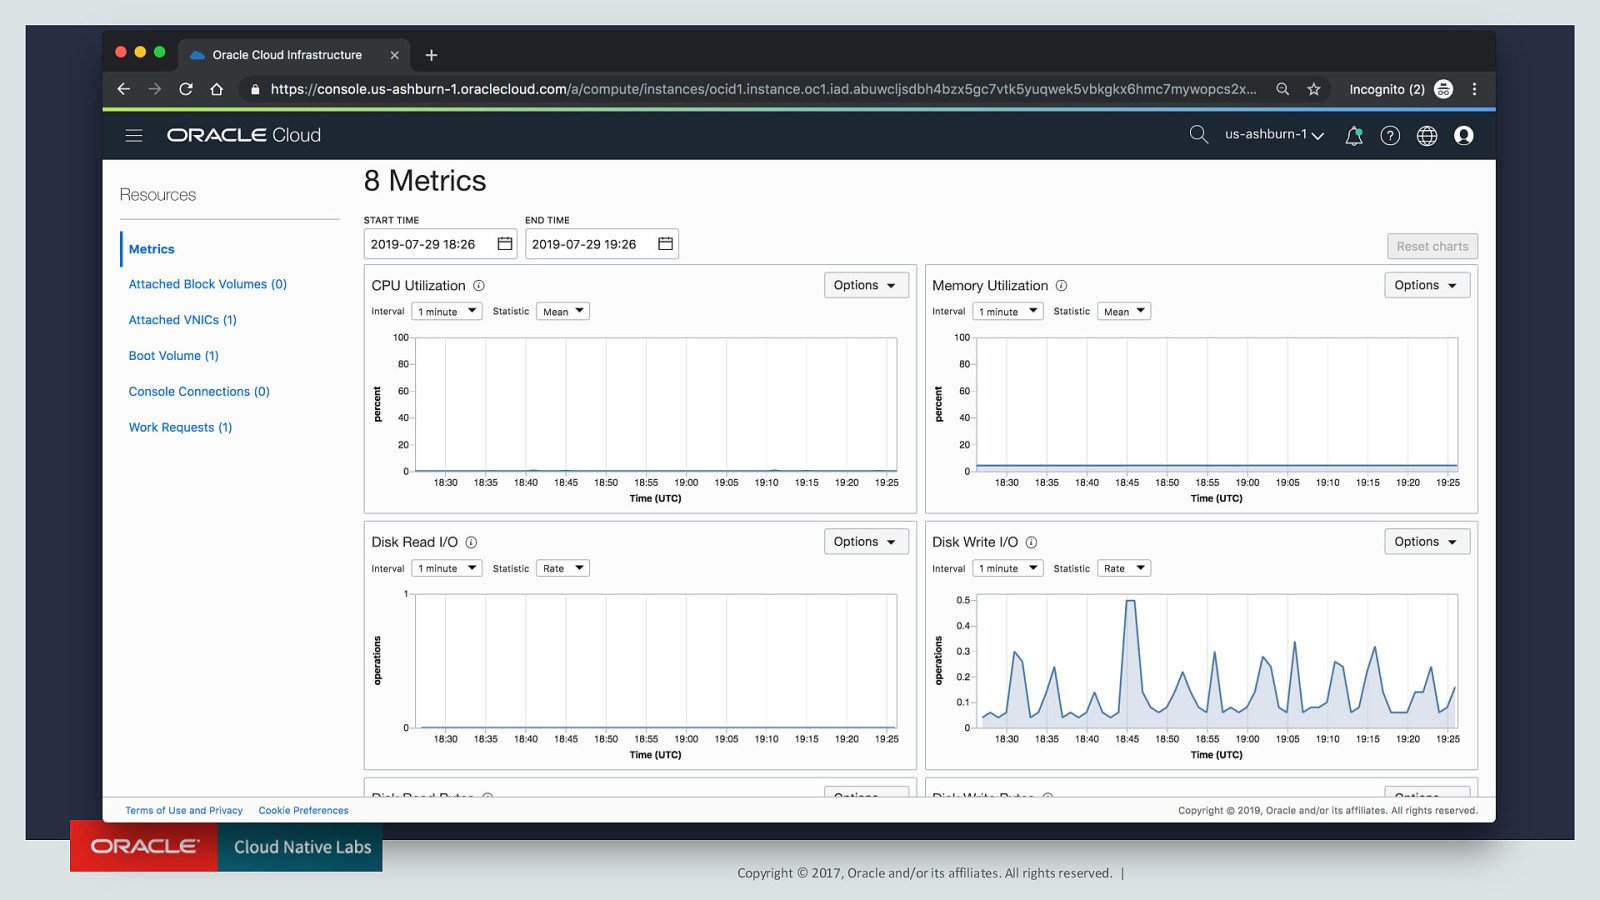
Copyright © 2017, Oracle and/or its affiliates. All rights reserved. |
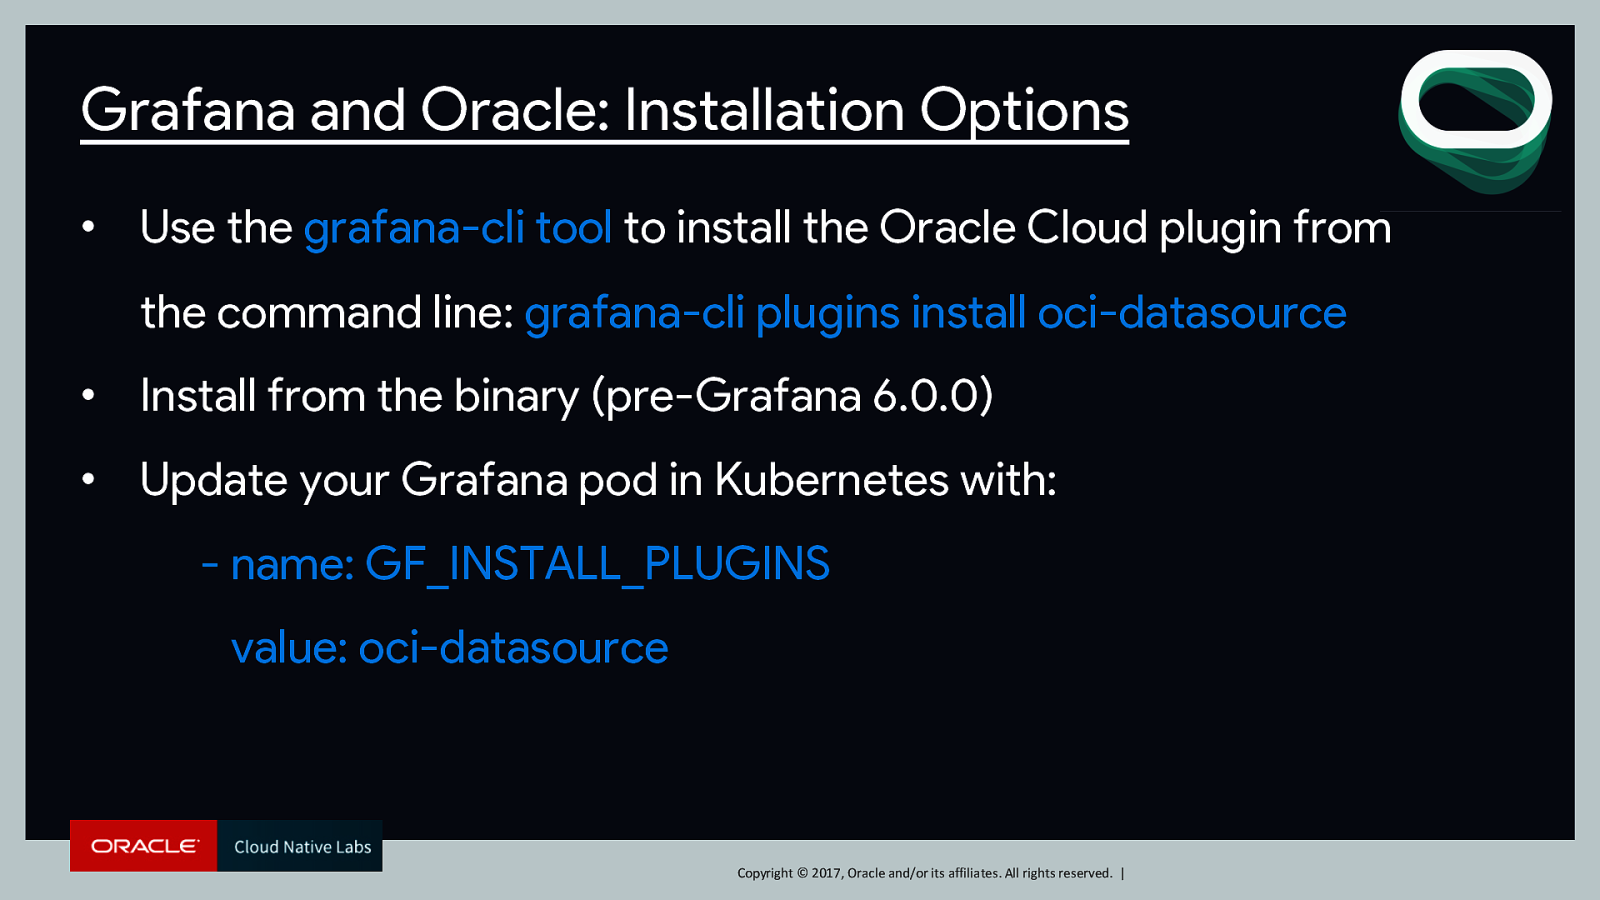
Grafana and Oracle: Installation Options • Use the grafana-cli tool to install the Oracle Cloud plugin from the command line: grafana-cli plugins install oci-datasource • Install from the binary (pre-Grafana 6.0.0) • Update your Grafana pod in Kubernetes with: - name: GF_INSTALL_PLUGINS value: oci-datasource Copyright © 2017, Oracle and/or its affiliates. All rights reserved. |
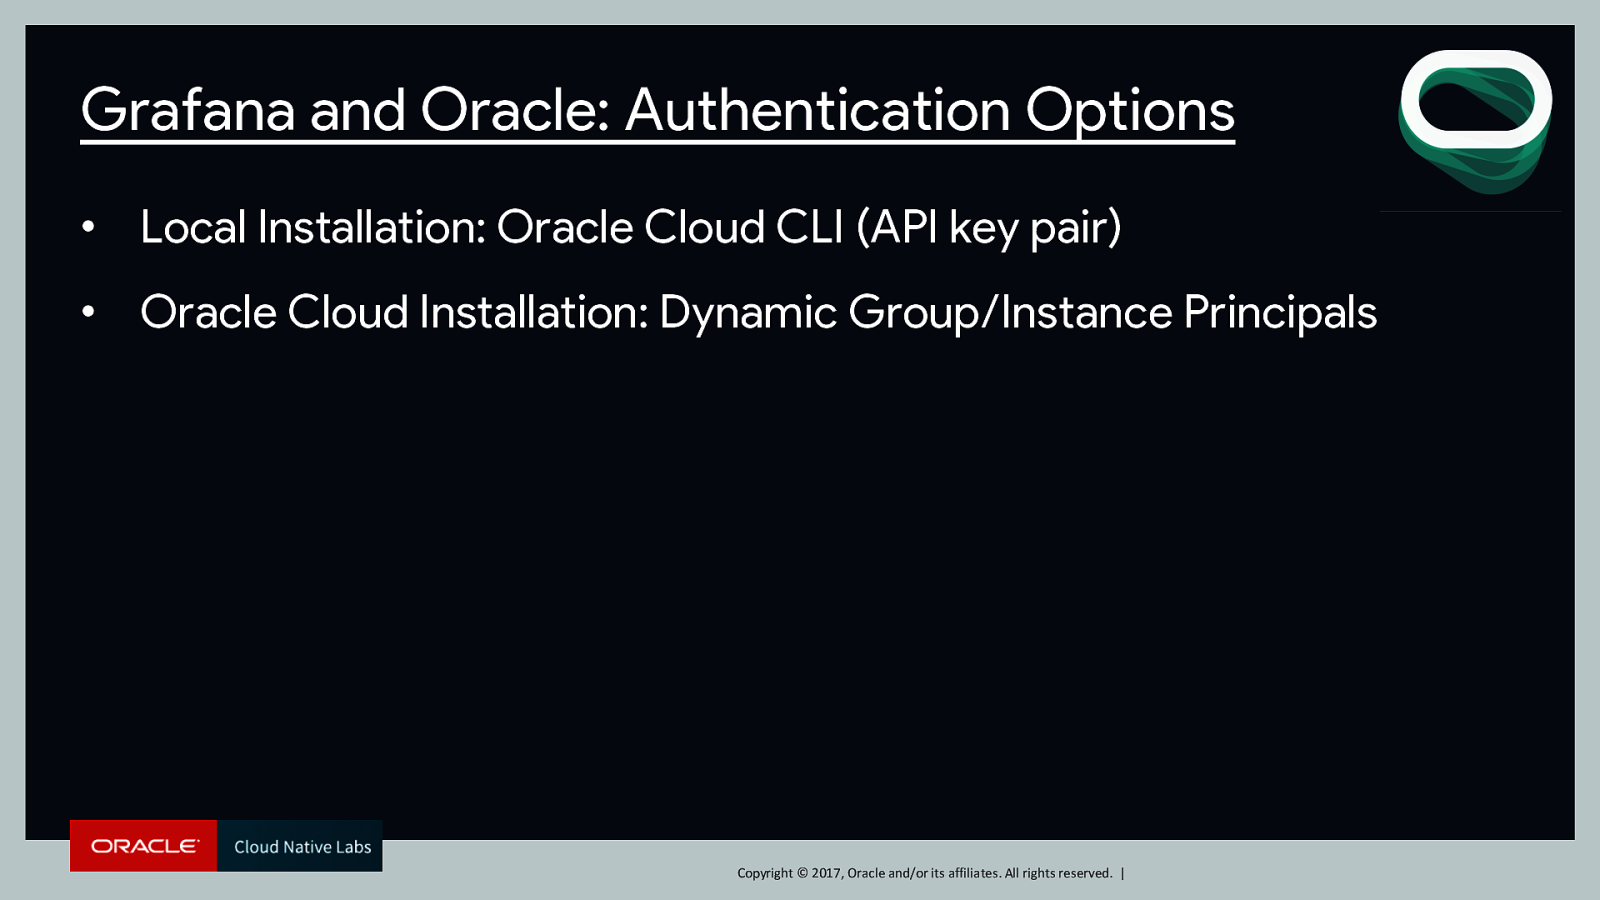
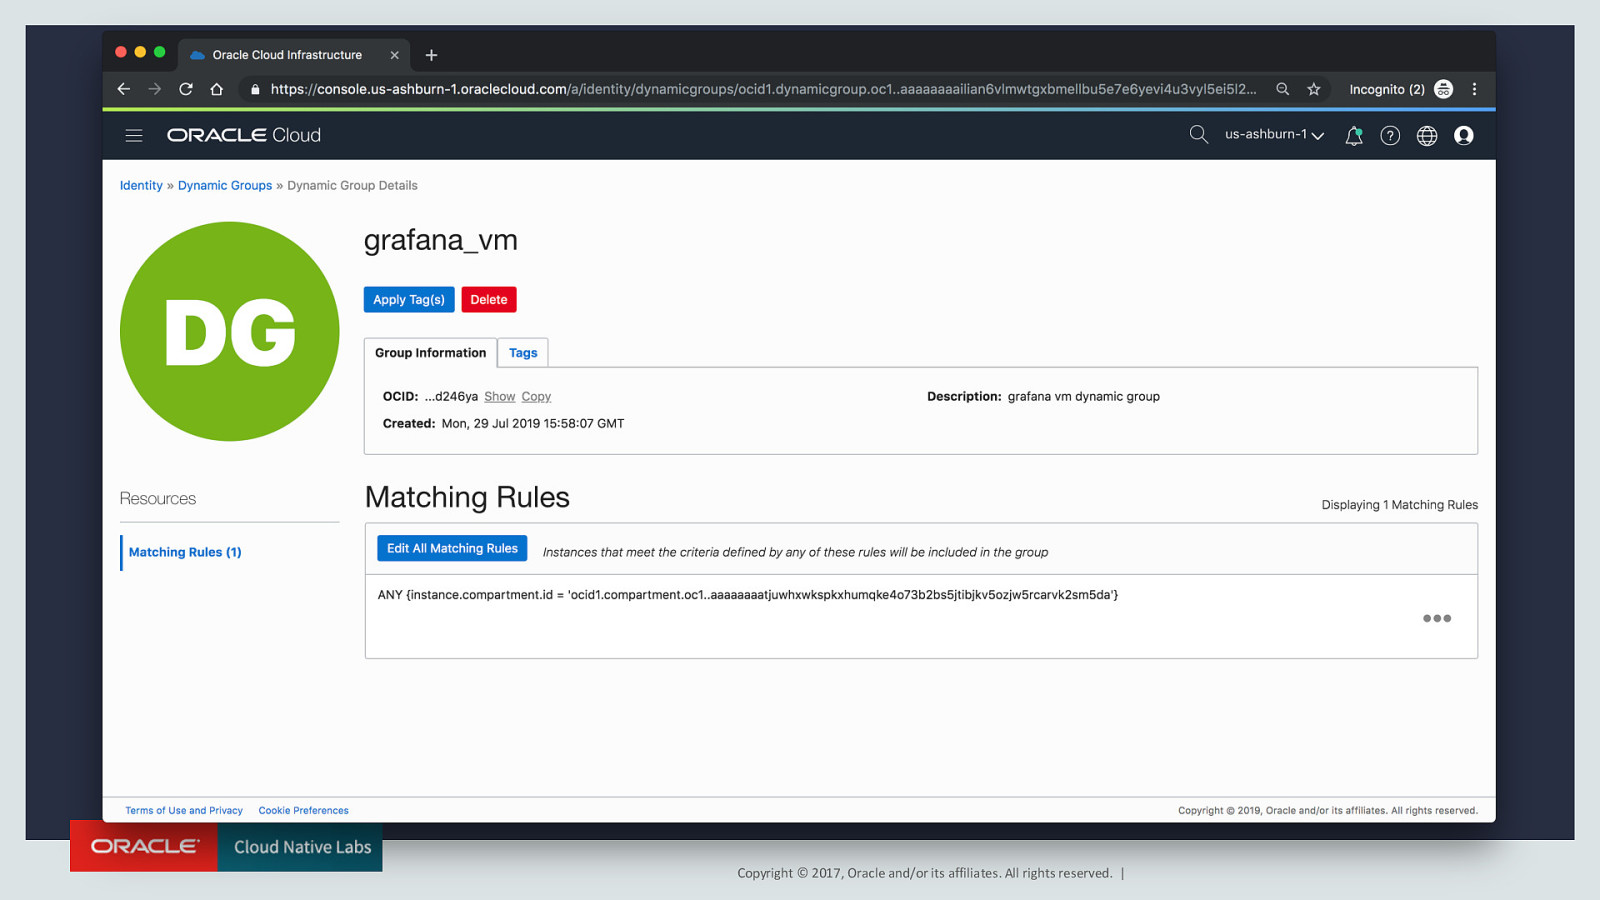
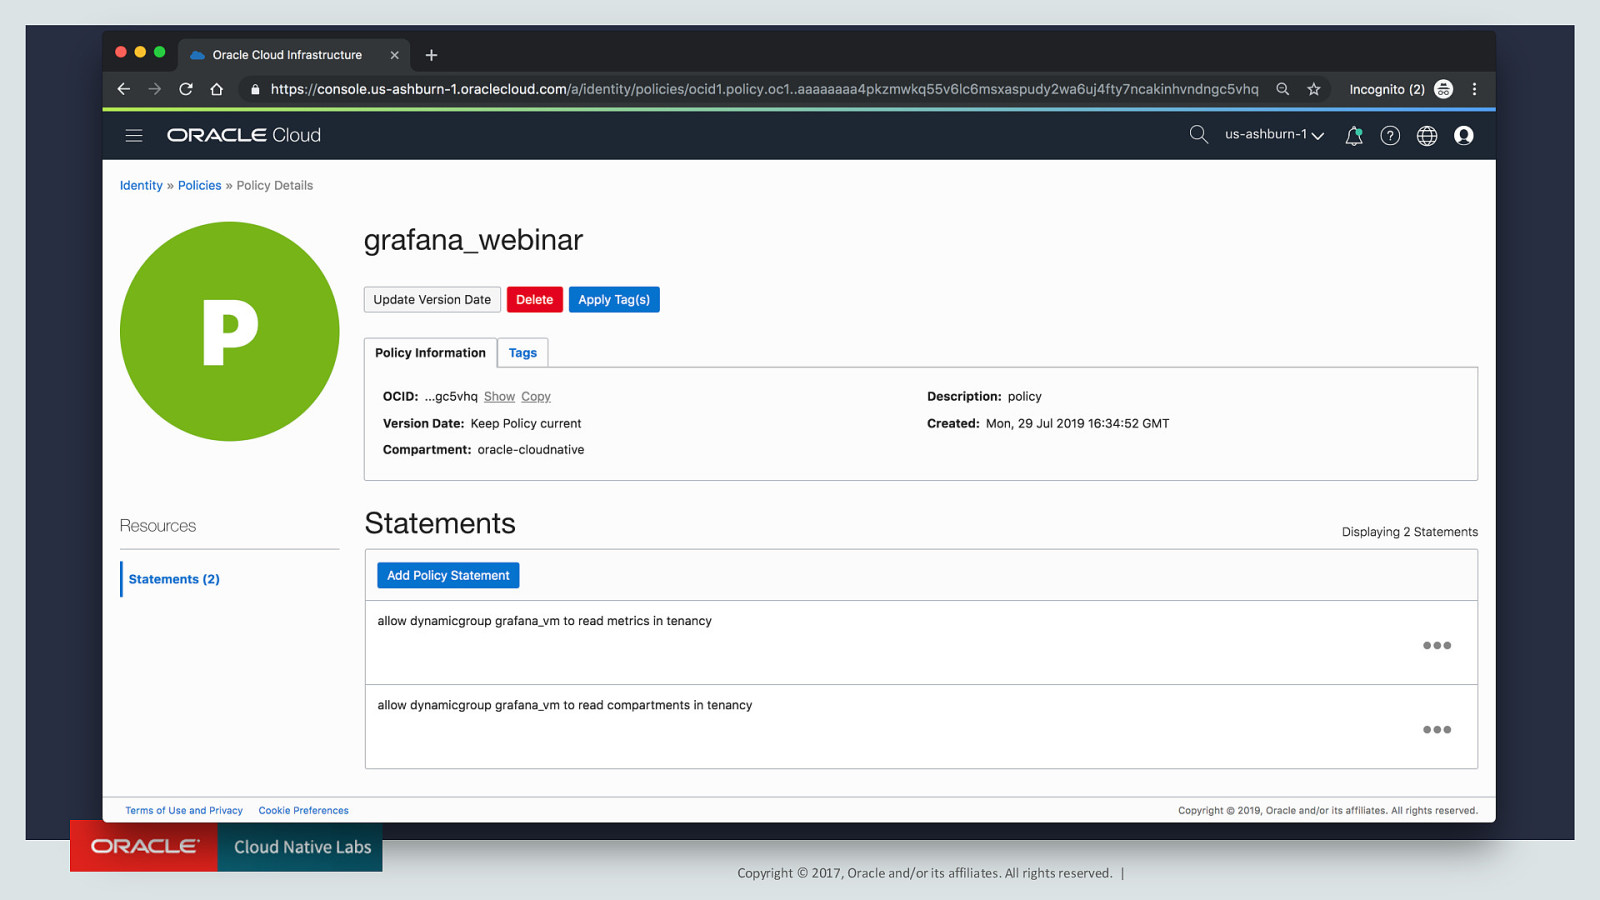
Grafana and Oracle: Authentication Options • Local Installation: Oracle Cloud CLI (API key pair) • Oracle Cloud Installation: Dynamic Group/Instance Principals Copyright © 2017, Oracle and/or its affiliates. All rights reserved. |
Copyright © 2017, Oracle and/or its affiliates. All rights reserved. |
Copyright © 2017, Oracle and/or its affiliates. All rights reserved. |
Features • Query Editor • Dimensions • Templating • Custom Metrics Namespaces Copyright © 2017, Oracle and/or its affiliates. All rights reserved. |
Copyright © 2017, Oracle and/or its affiliates. All rights reserved. |
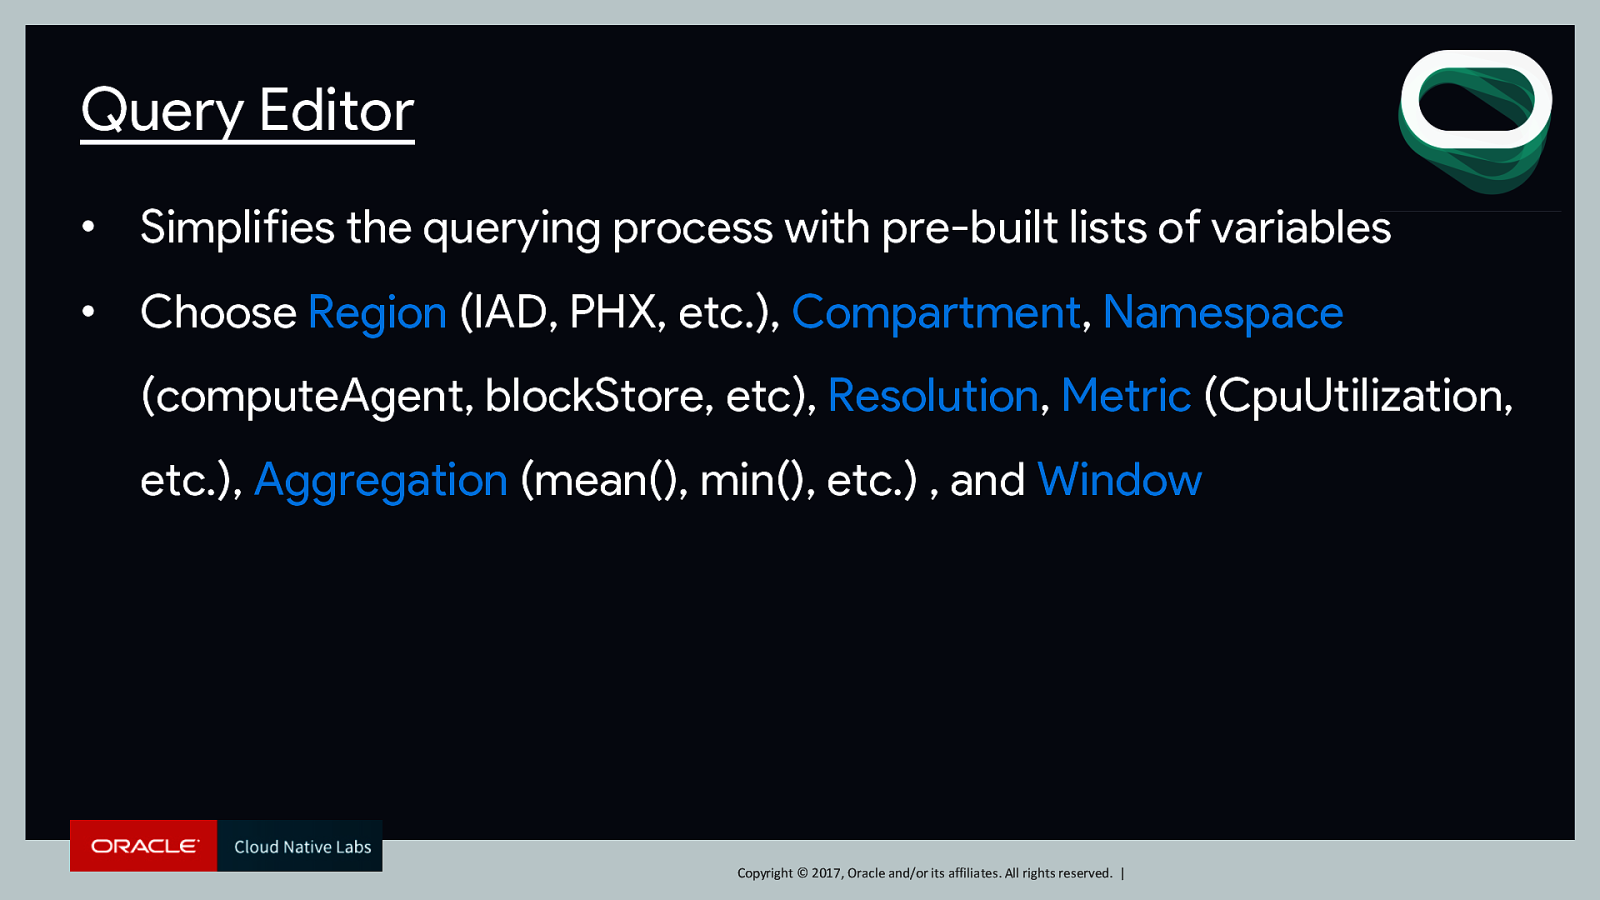
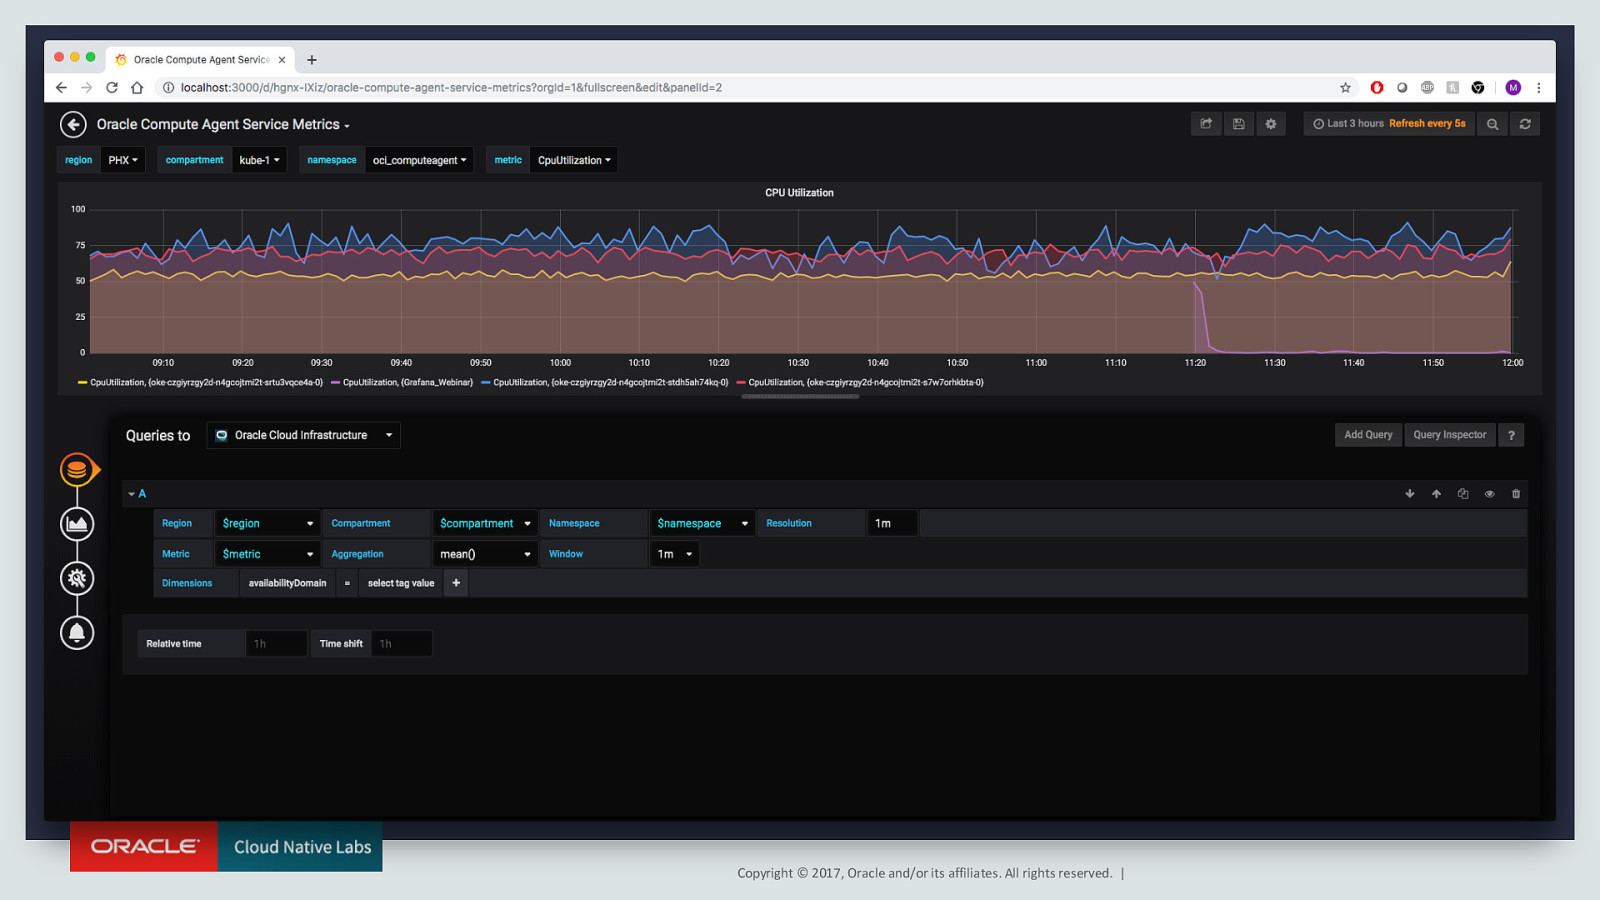
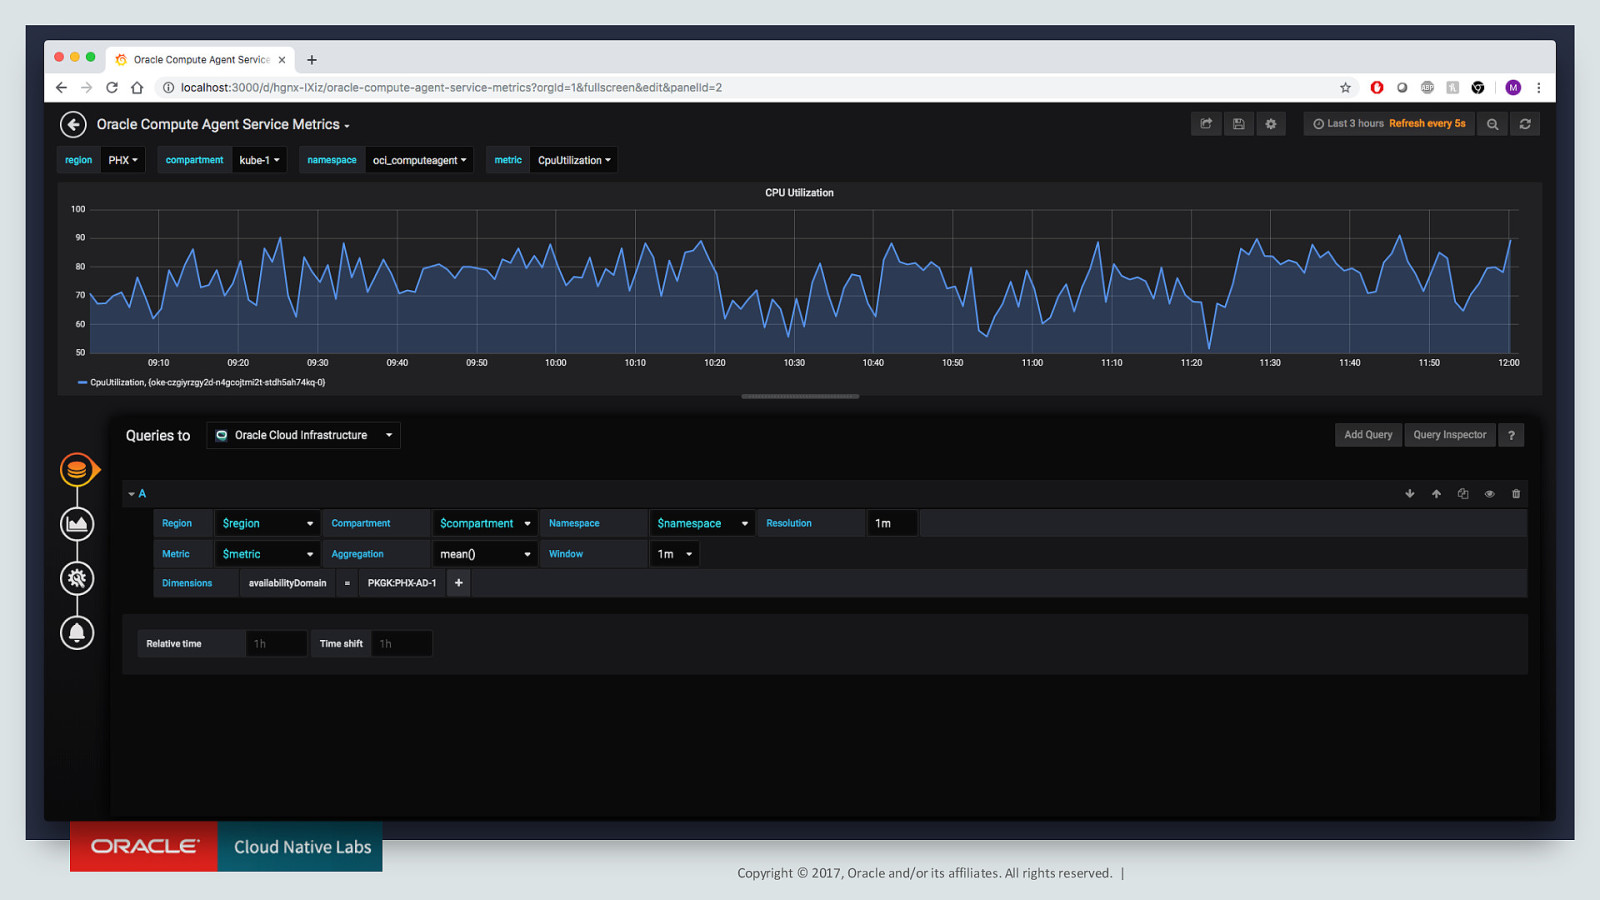
Query Editor • Simplifies the querying process with pre-built lists of variables • Choose Region (IAD, PHX, etc.), Compartment, Namespace (computeAgent, blockStore, etc), Resolution, Metric (CpuUtilization, etc.), Aggregation (mean(), min(), etc.) , and Window Copyright © 2017, Oracle and/or its affiliates. All rights reserved. |
Copyright © 2017, Oracle and/or its affiliates. All rights reserved. |
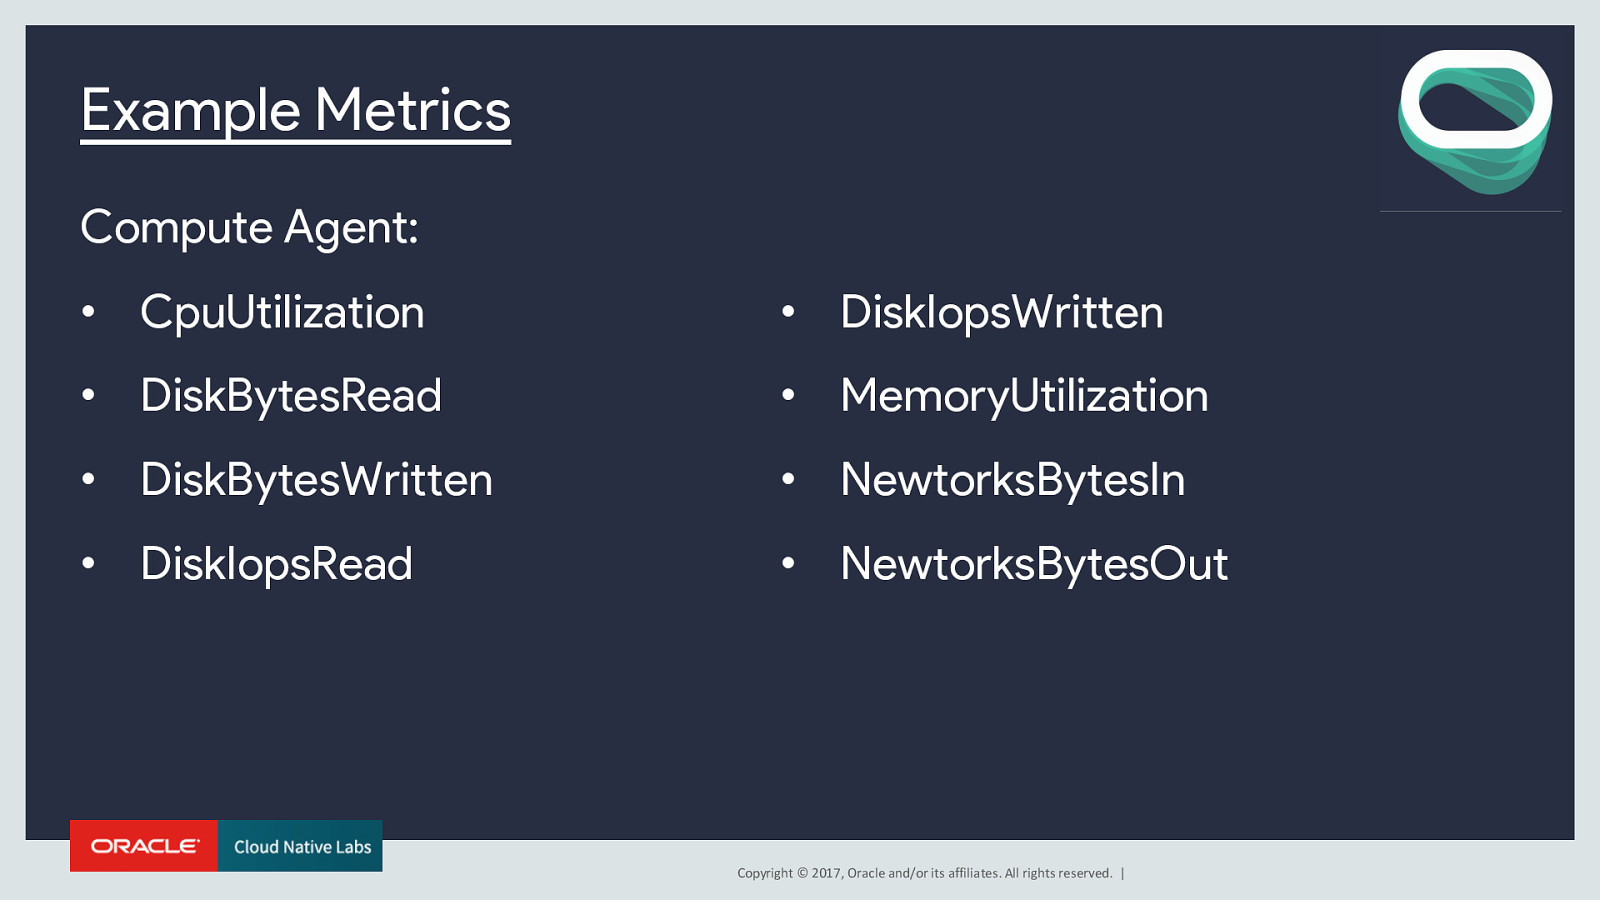
Example Metrics Compute Agent: • CpuUtilization • DiskIopsWritten • DiskBytesRead • MemoryUtilization • DiskBytesWritten • NewtorksBytesIn • DiskIopsRead • NewtorksBytesOut Copyright © 2017, Oracle and/or its affiliates. All rights reserved. |
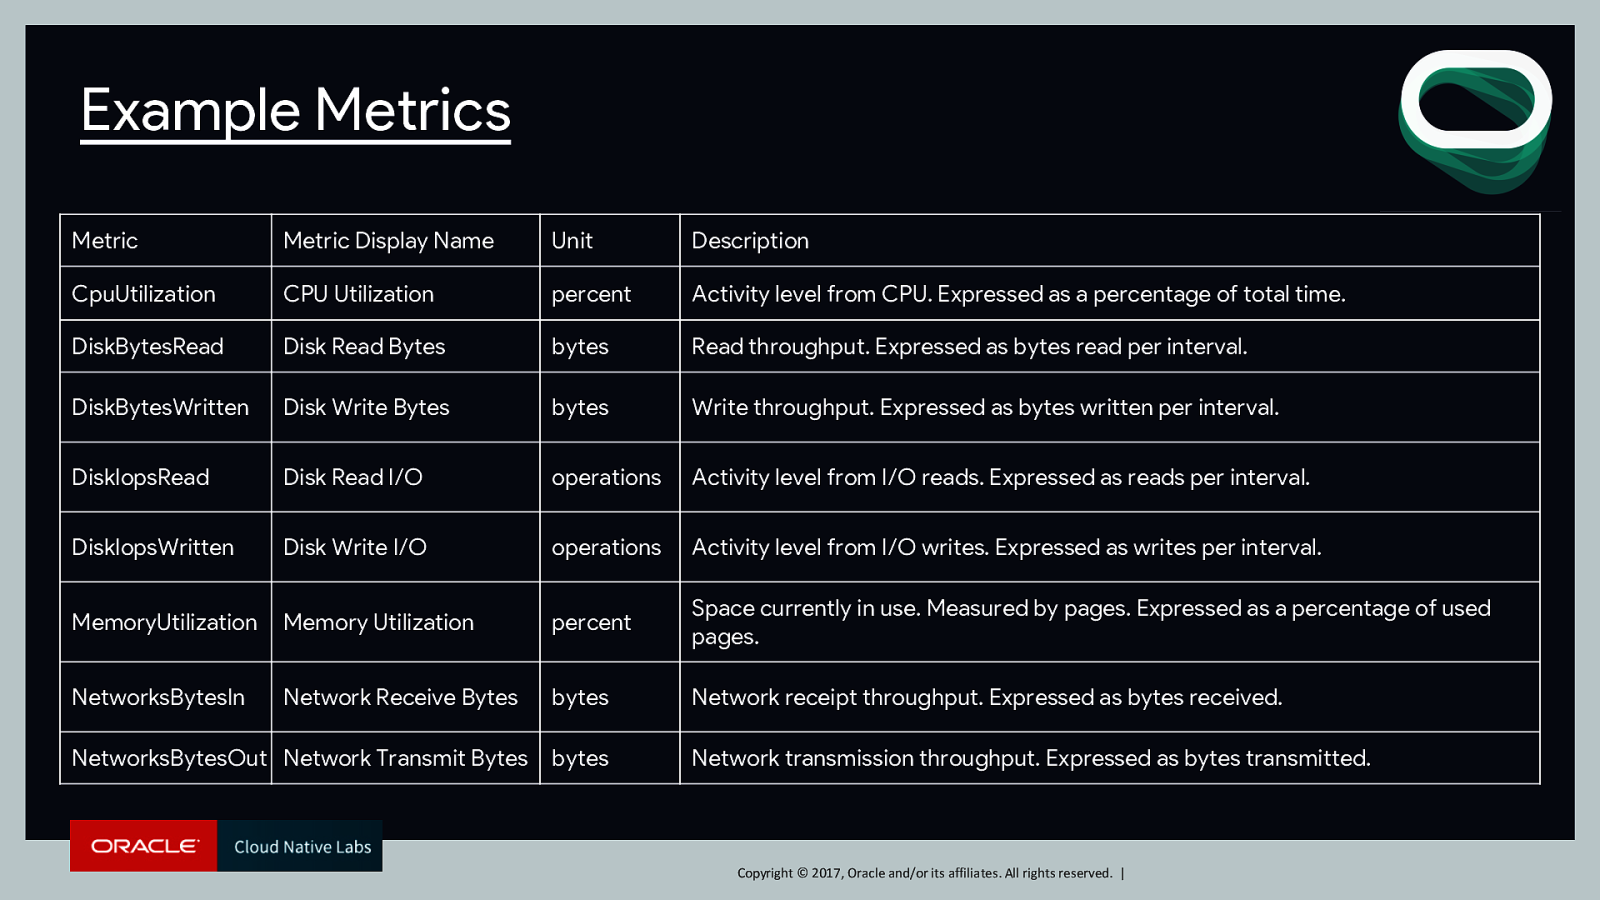
Example Metrics Metric Metric Display Name Unit Description CpuUtilization CPU Utilization percent Activity level from CPU. Expressed as a percentage of total time. DiskBytesRead Disk Read Bytes bytes Read throughput. Expressed as bytes read per interval. DiskBytesWritten Disk Write Bytes bytes Write throughput. Expressed as bytes written per interval. DiskIopsRead Disk Read I/O operations Activity level from I/O reads. Expressed as reads per interval. DiskIopsWritten Disk Write I/O operations Activity level from I/O writes. Expressed as writes per interval. MemoryUtilization Memory Utilization percent Space currently in use. Measured by pages. Expressed as a percentage of used pages. NetworksBytesIn Network Receive Bytes bytes Network receipt throughput. Expressed as bytes received. bytes Network transmission throughput. Expressed as bytes transmitted. NetworksBytesOut Network Transmit Bytes Copyright © 2017, Oracle and/or its affiliates. All rights reserved. |
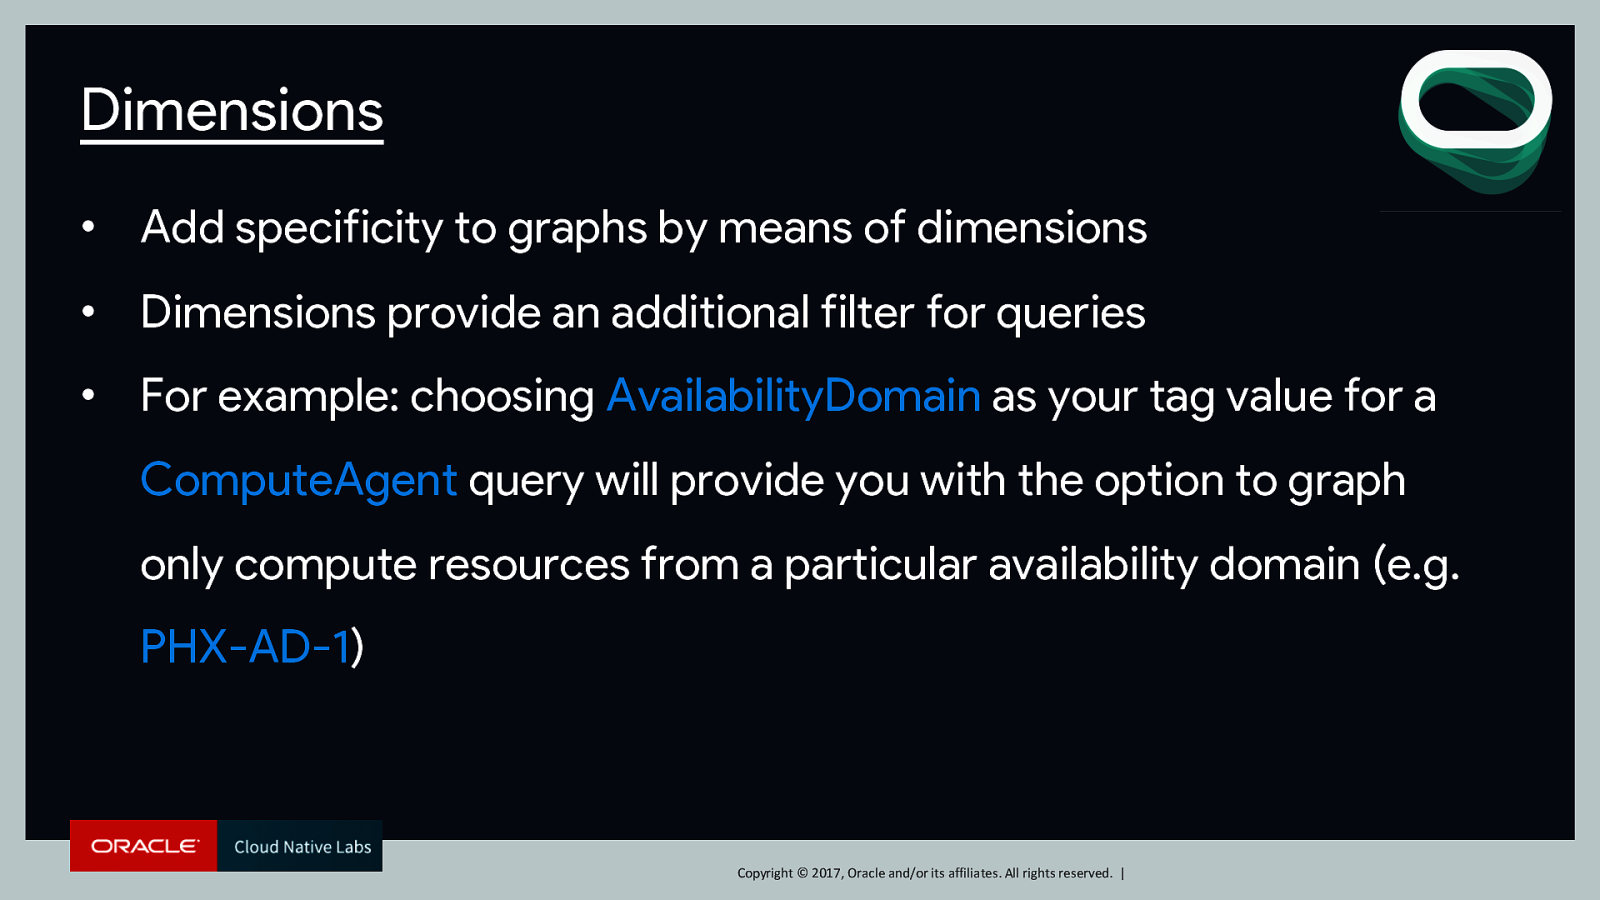
Dimensions • Add specificity to graphs by means of dimensions • Dimensions provide an additional filter for queries • For example: choosing AvailabilityDomain as your tag value for a ComputeAgent query will provide you with the option to graph only compute resources from a particular availability domain (e.g. PHX-AD-1) Copyright © 2017, Oracle and/or its affiliates. All rights reserved. |
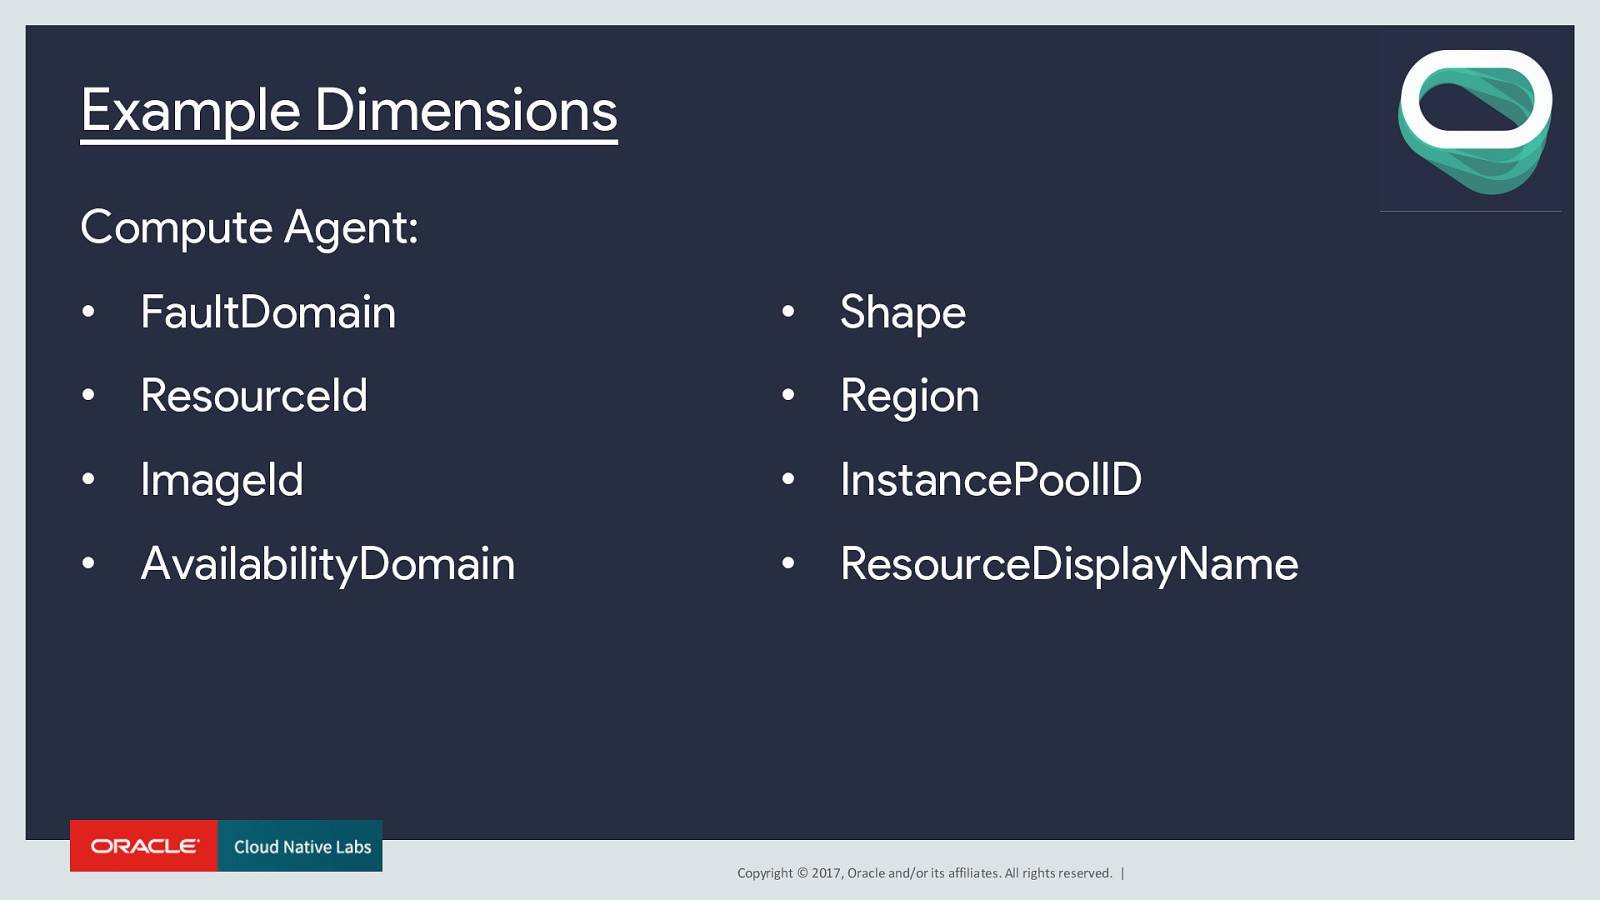
Example Dimensions Compute Agent: • FaultDomain • Shape • ResourceId • Region • ImageId • InstancePoolID • AvailabilityDomain • ResourceDisplayName Copyright © 2017, Oracle and/or its affiliates. All rights reserved. |
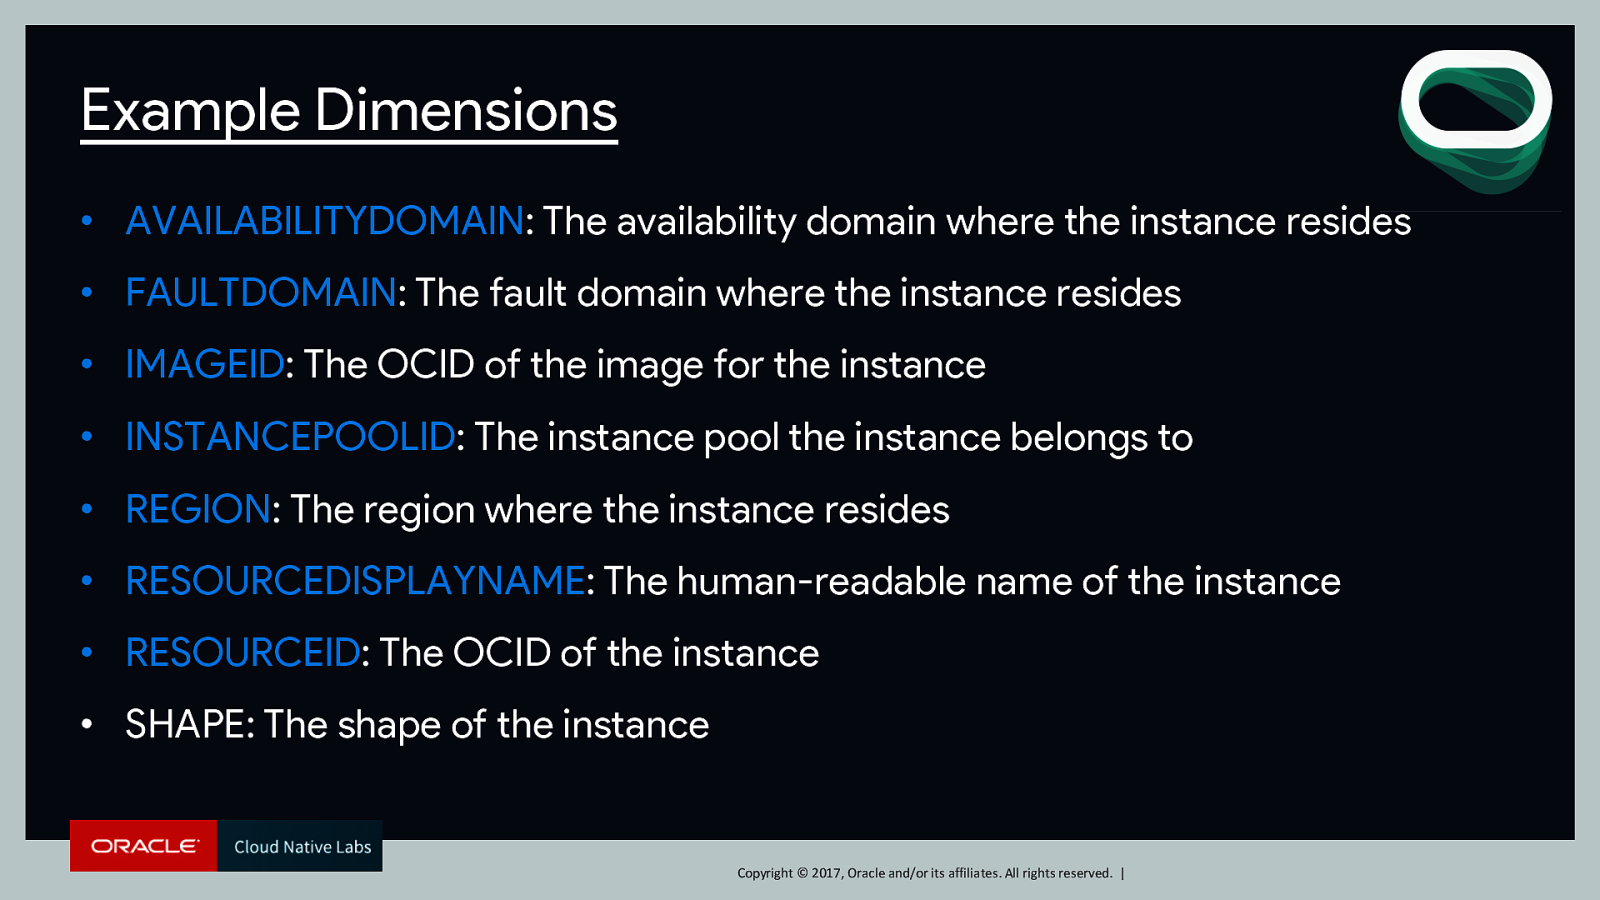
Example Dimensions • AVAILABILITYDOMAIN: The availability domain where the instance resides • FAULTDOMAIN: The fault domain where the instance resides • IMAGEID: The OCID of the image for the instance • INSTANCEPOOLID: The instance pool the instance belongs to • REGION: The region where the instance resides • RESOURCEDISPLAYNAME: The human-readable name of the instance • RESOURCEID: The OCID of the instance • SHAPE: The shape of the instance Copyright © 2017, Oracle and/or its affiliates. All rights reserved. |
Copyright © 2017, Oracle and/or its affiliates. All rights reserved. |
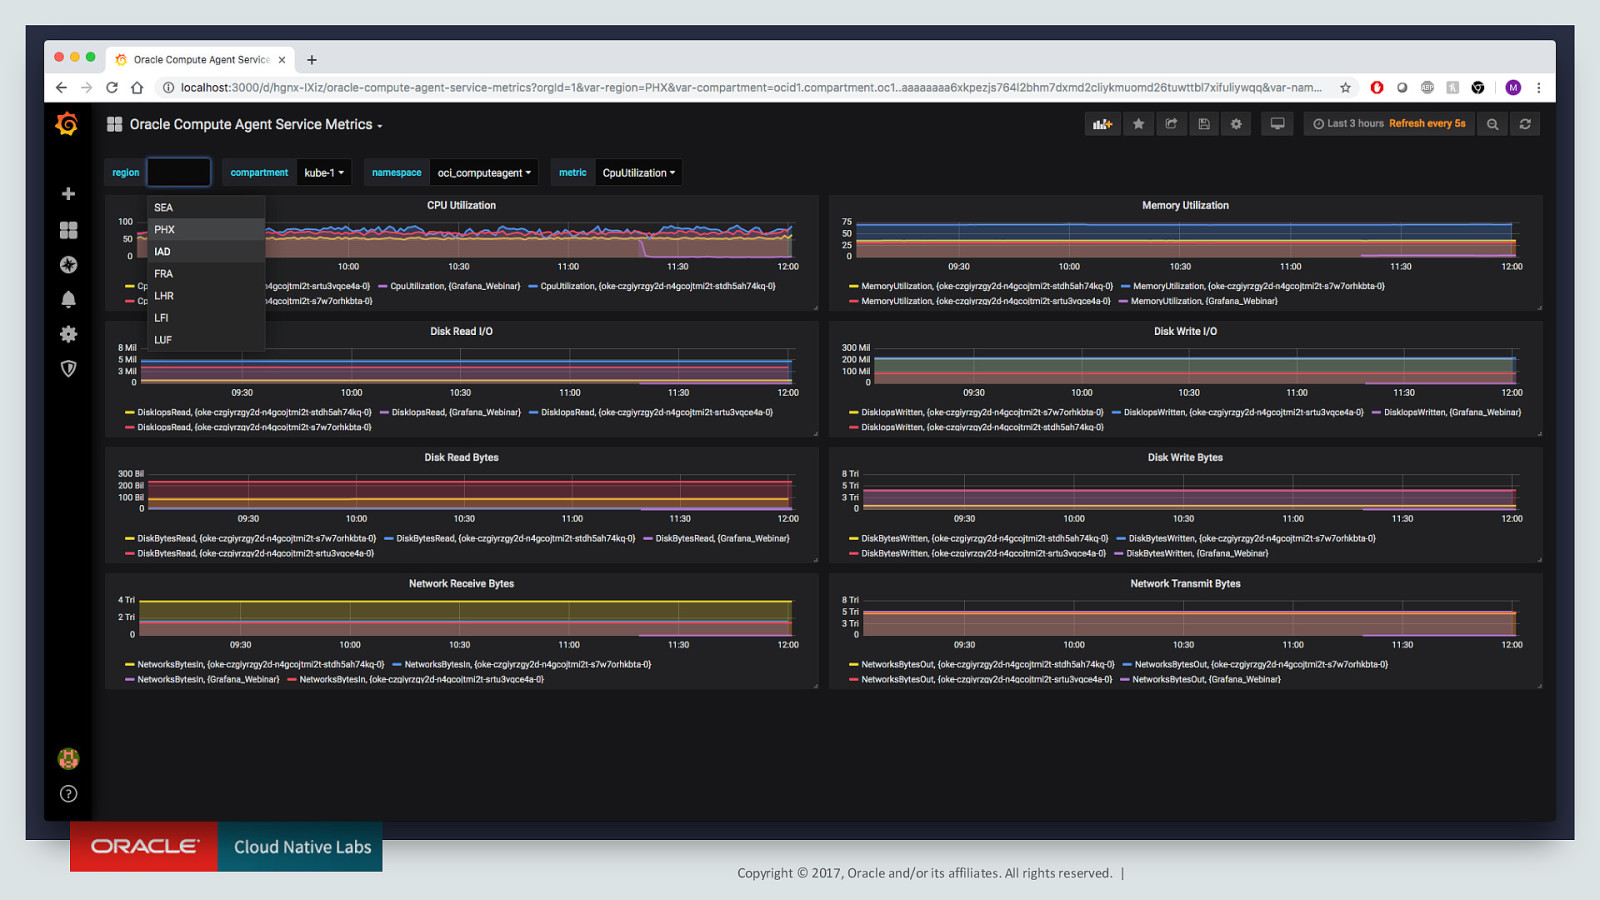
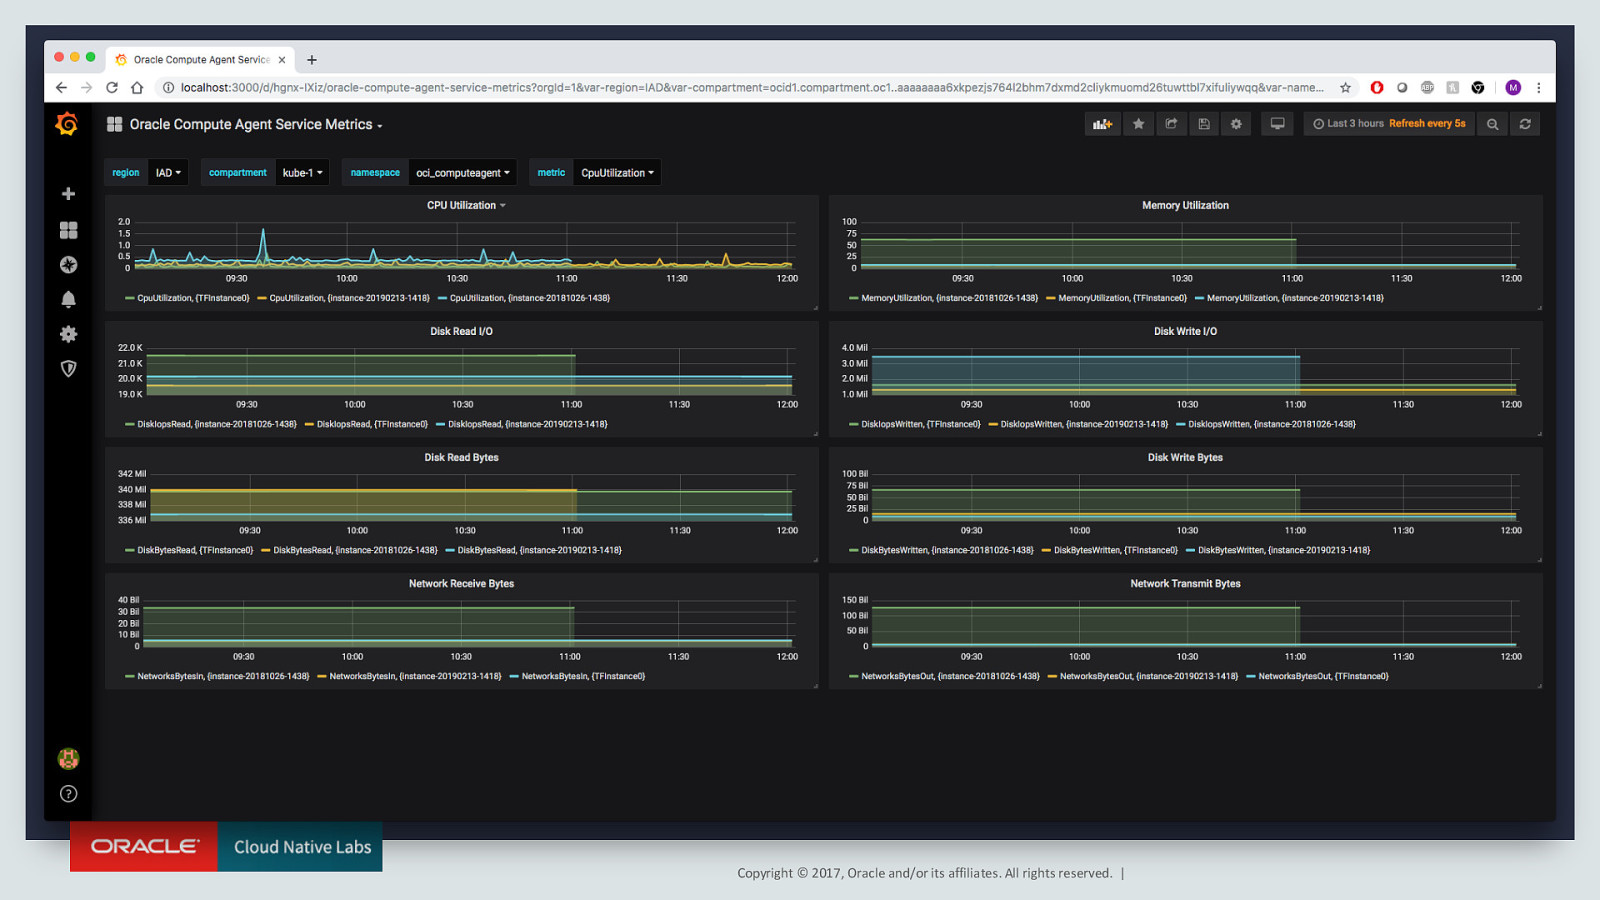
Templating • Dynamically interact with graphs using templating • Change graphs on the fly to visualize additional information • For example: switch the region being queried for all graphs on a given dashboard from PHX to IAD Copyright © 2017, Oracle and/or its affiliates. All rights reserved. |

Copyright © 2017, Oracle and/or its affiliates. All rights reserved. |
Copyright © 2017, Oracle and/or its affiliates. All rights reserved. |
Copyright © 2017, Oracle and/or its affiliates. All rights reserved. |
Custom Metrics • Publish custom metrics data points to the Monitoring service using PostMetricData in the Monitoring API • Query those metrics from the Grafana UI as you would any other resource metrics Copyright © 2017, Oracle and/or its affiliates. All rights reserved. |
Key Takeaways • The Oracle Cloud Infrastructure Data Source for Grafana provides access to monitoring data for Oracle Cloud resources • Grafana can be used as a centralized dashboard to view helpful data from Oracle and non-Oracle resources side by side Copyright © 2017, Oracle and/or its affiliates. All rights reserved. |
Native Questions? cloudnative.oracle.com Copyright © 2017, Oracle and/or its affiliates. All rights reserved. |
Native Thank You! And special thanks to Grafana for hosting this webinar! cloudnative.oracle.com Copyright © 2017, Oracle and/or its affiliates. All rights reserved. |
Native Stay Connected Medium: https://medium.com/@m.r.boxell Twitter: @mickeyboxell Linkedin: https://www.linkedin.com/in/mickeyboxell/ Try Oracle Cloud: https://cloud.oracle.com/tryit cloudnative.oracle.com Copyright © 2017, Oracle and/or its affiliates. All rights reserved. |