Toward a Carbon-Aware Cloud

A presentation at Devoxx Belgium in October 2023 in Antwerp, Belgium by Olivier Bierlaire
Toward a Carbon-Aware Cloud
Olivier Bierlaire @obierlaire carbonifer
“I have all my infra in the cloud, so I do not emit CO2.”
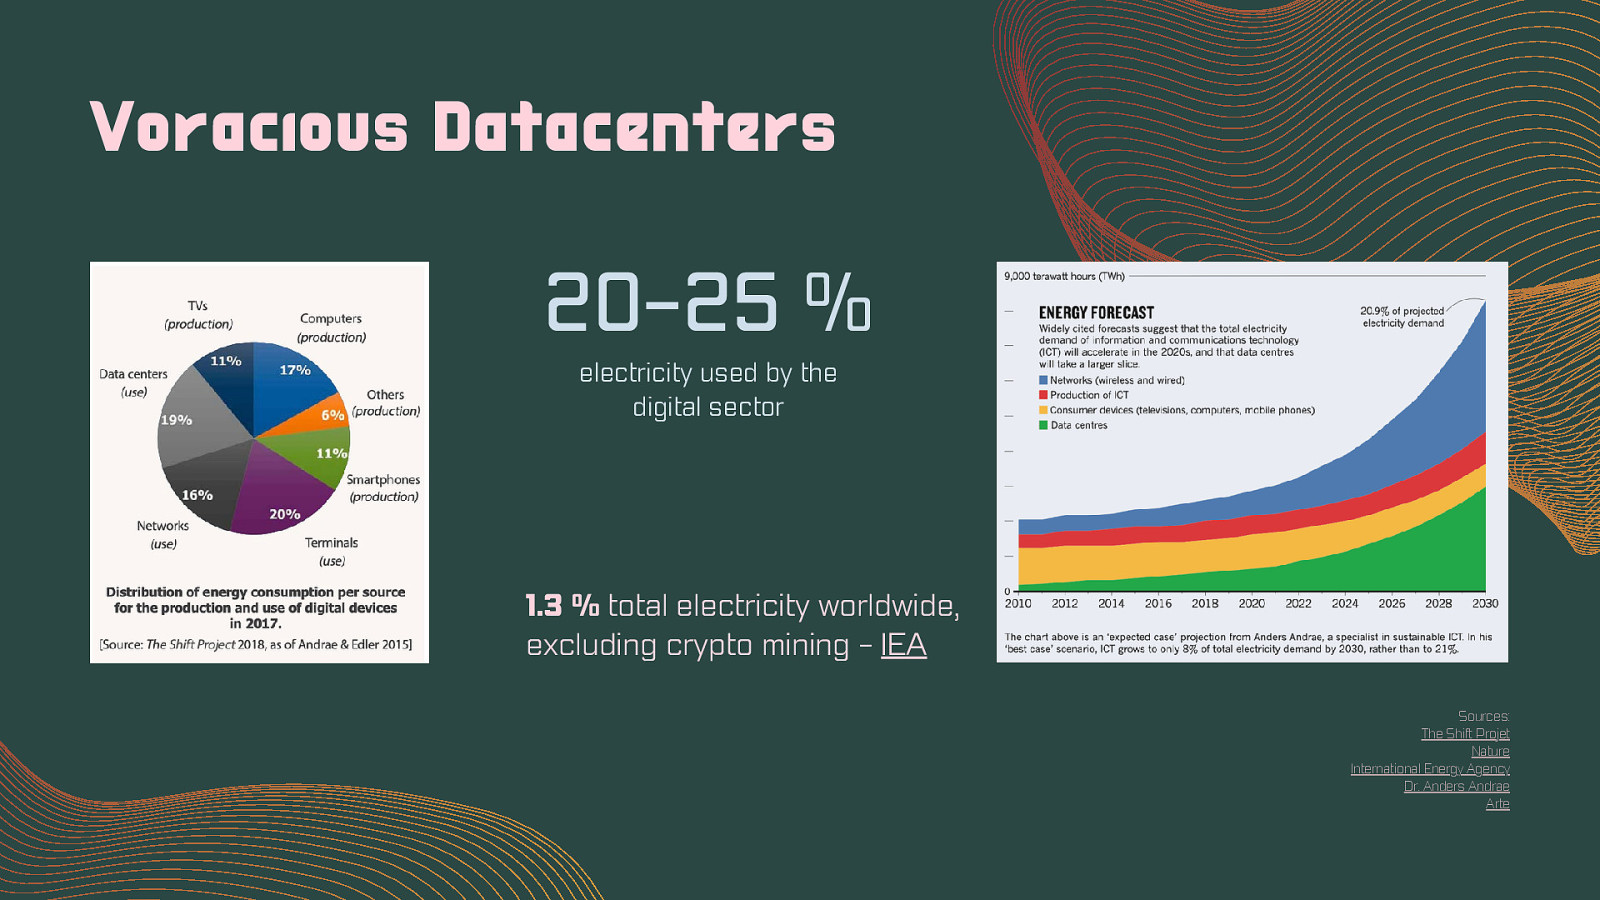
Voracious Datacenters 20-25 % electricity used by the digital sector 1.3 % total electricity worldwide, excluding crypto mining - IEA Sources: The Shift Projet Nature International Energy Agency Dr. Anders Andrae Arte
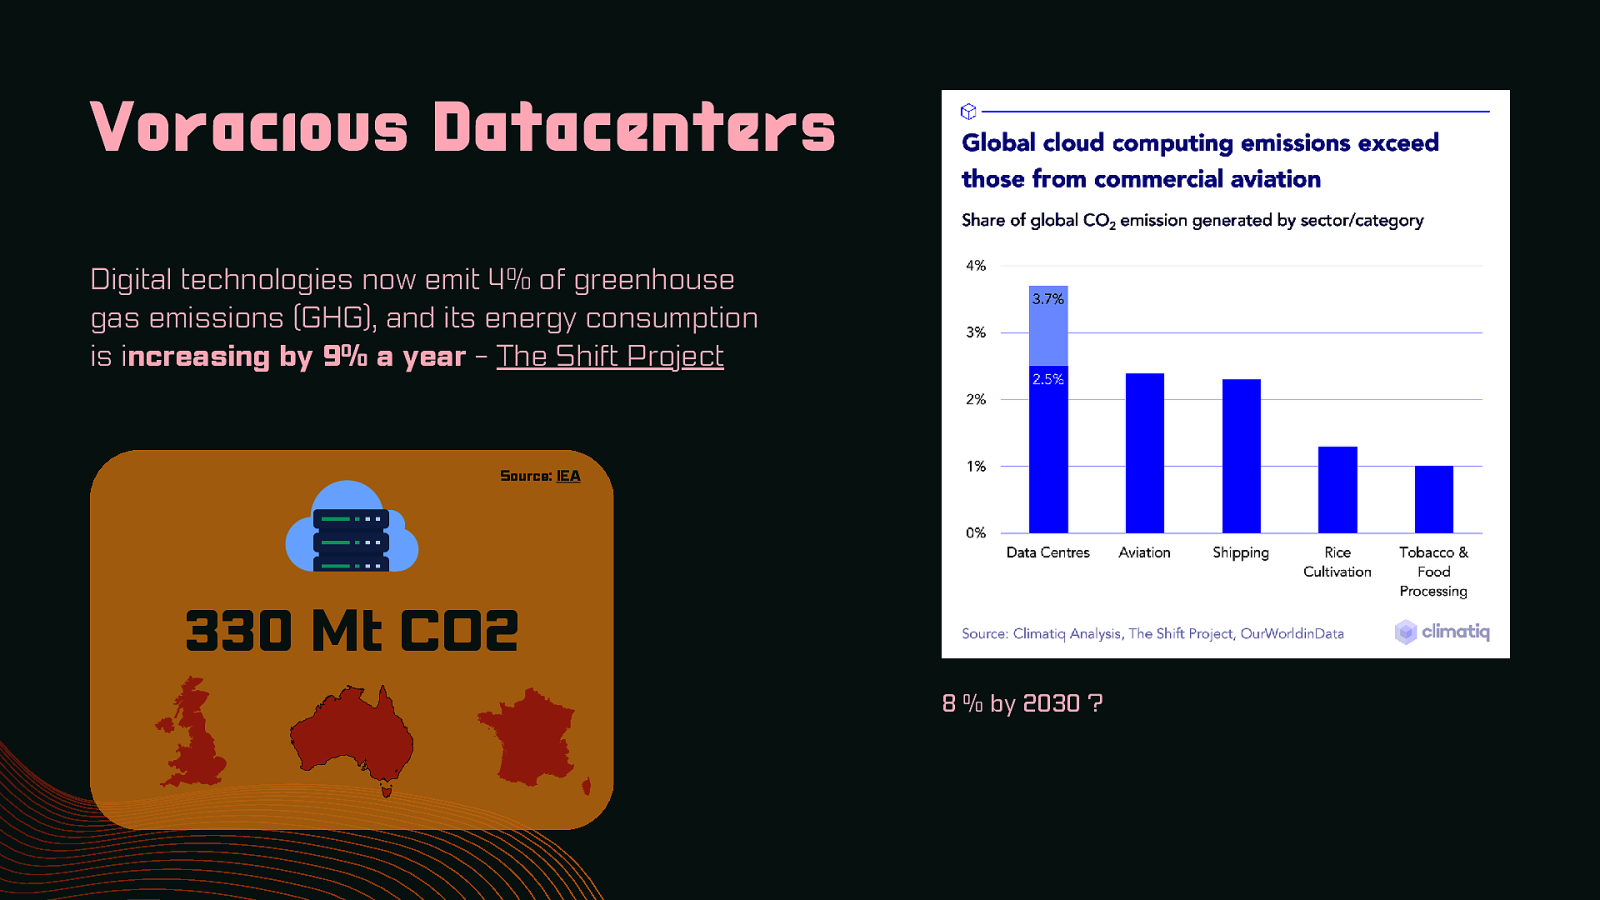
Voracious Datacenters Digital technologies now emit 4% of greenhouse gas emissions (GHG), and its energy consumption is increasing by 9% a year - The Shift Project Source: IEA 330 Mt CO2 8 % by 2030 ?
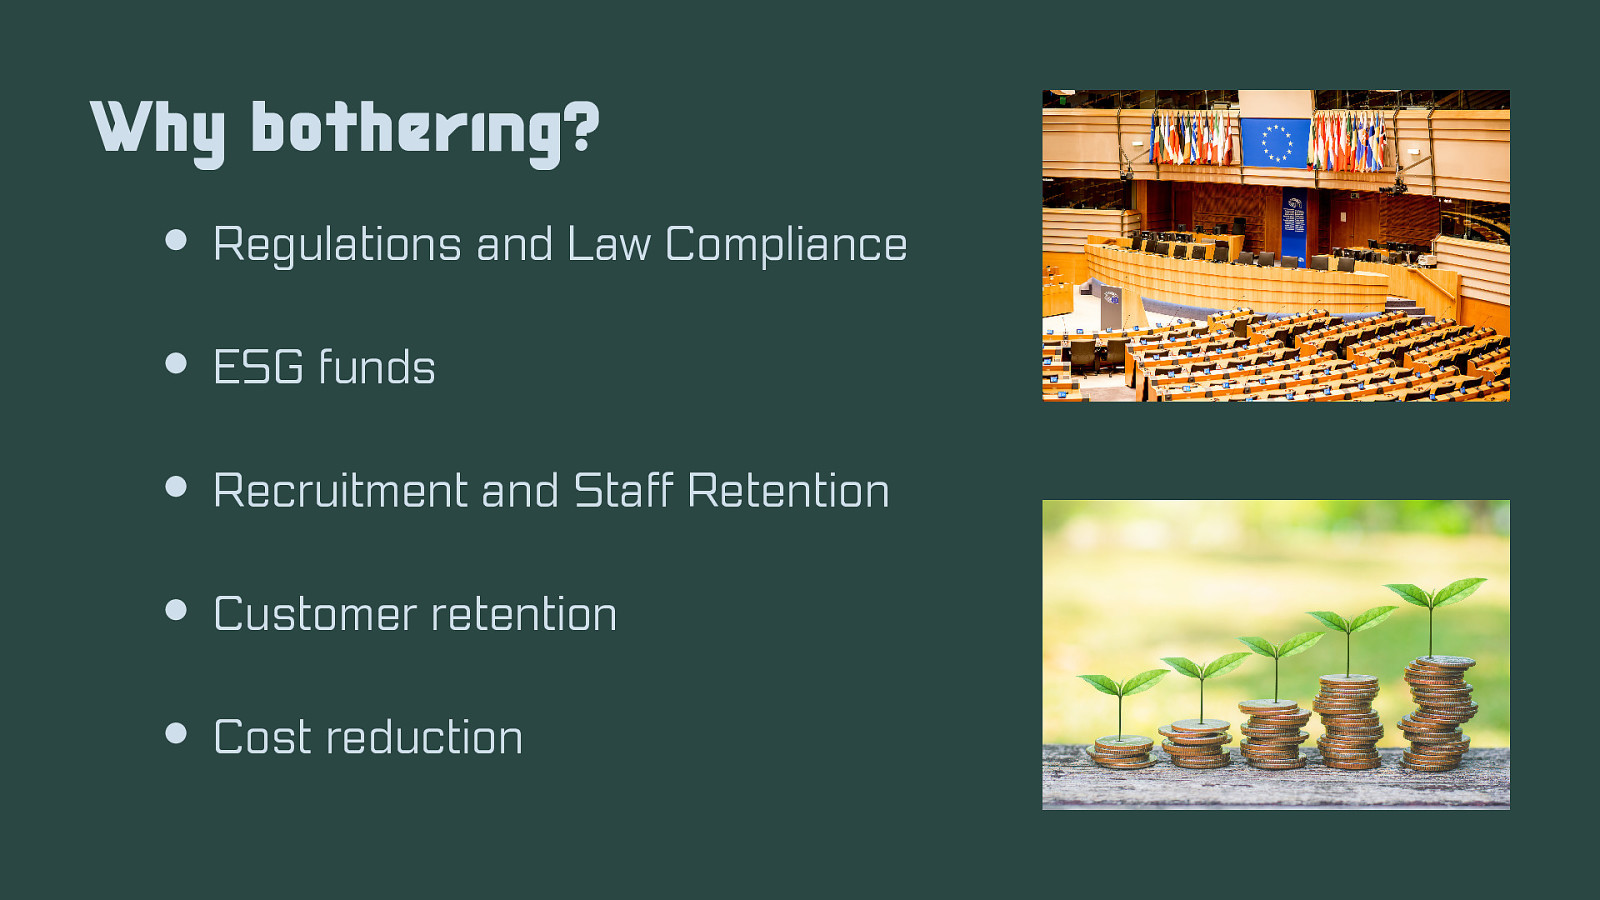
Why bothering? Regulations and Law Compliance ESG funds Recruitment and Staff Retention Customer retention Cost reduction

The GHG protocol Scope 1 : Direct emissions Scope 2 : Indirect emissions related purchased energy Scope 3 : Other indirect emissions ( value chain emissions) business travel raw material purchased services purchased …
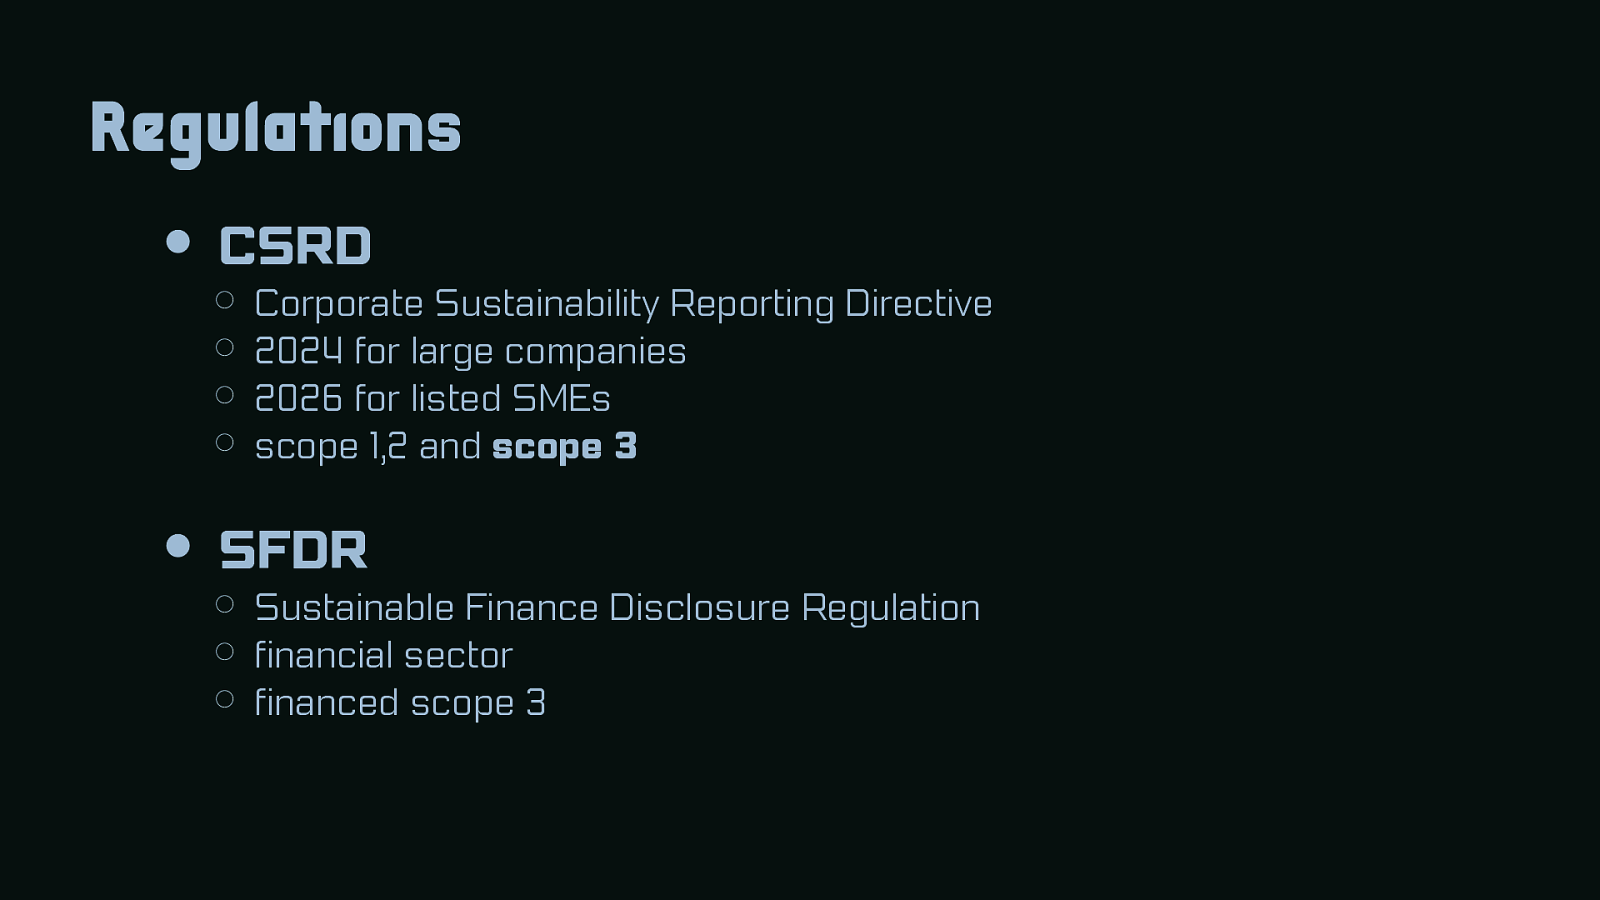
Regulations CSRD Corporate Sustainability Reporting Directive 2024 for large companies 2026 for listed SMEs scope 1,2 and scope 3 SFDR Sustainable Finance Disclosure Regulation financial sector financed scope 3
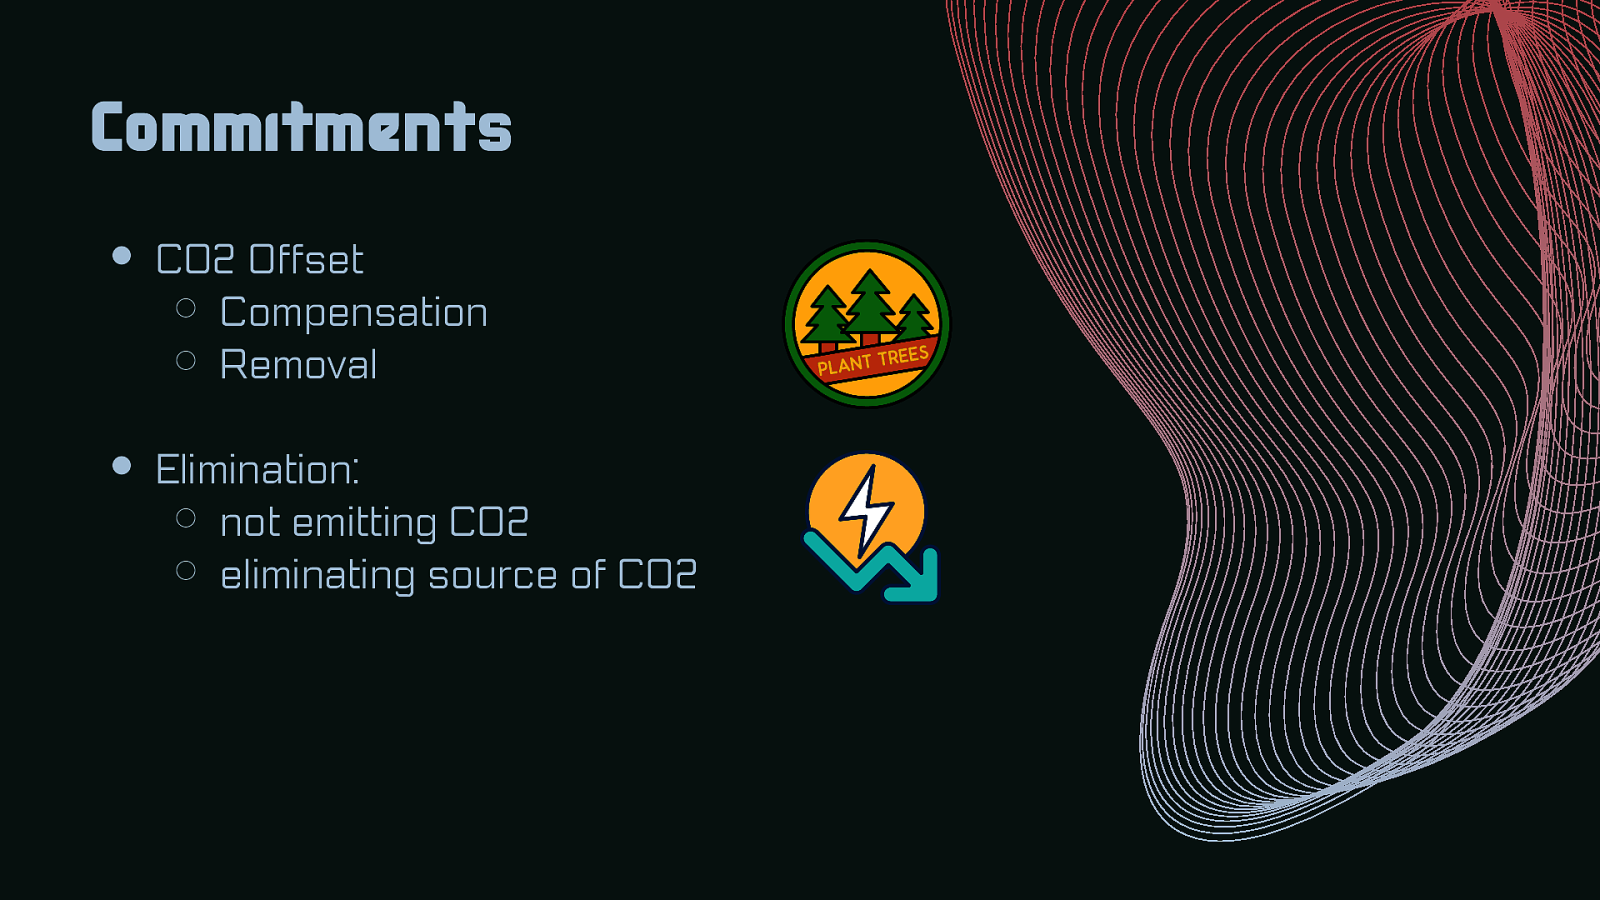
Commitments CO2 Offset Compensation Removal Elimination: not emitting CO2 eliminating source of CO2
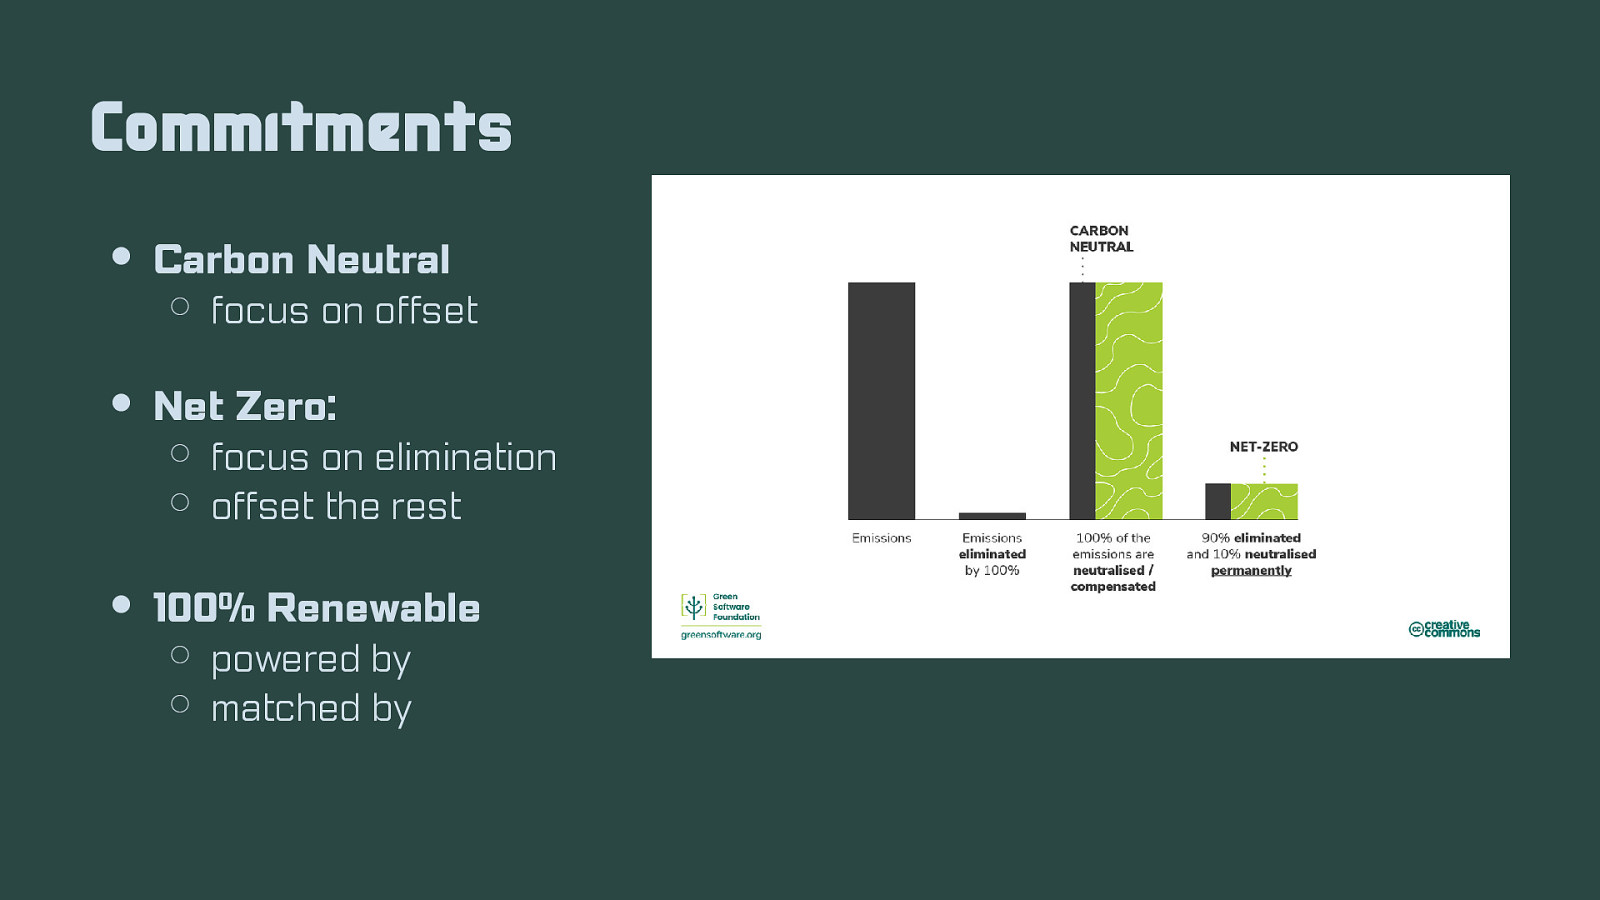
Commitments Carbon Neutral focus on offset Net Zero: focus on elimination offset the rest 100% Renewable powered by matched by

Measure cloud infrastructure
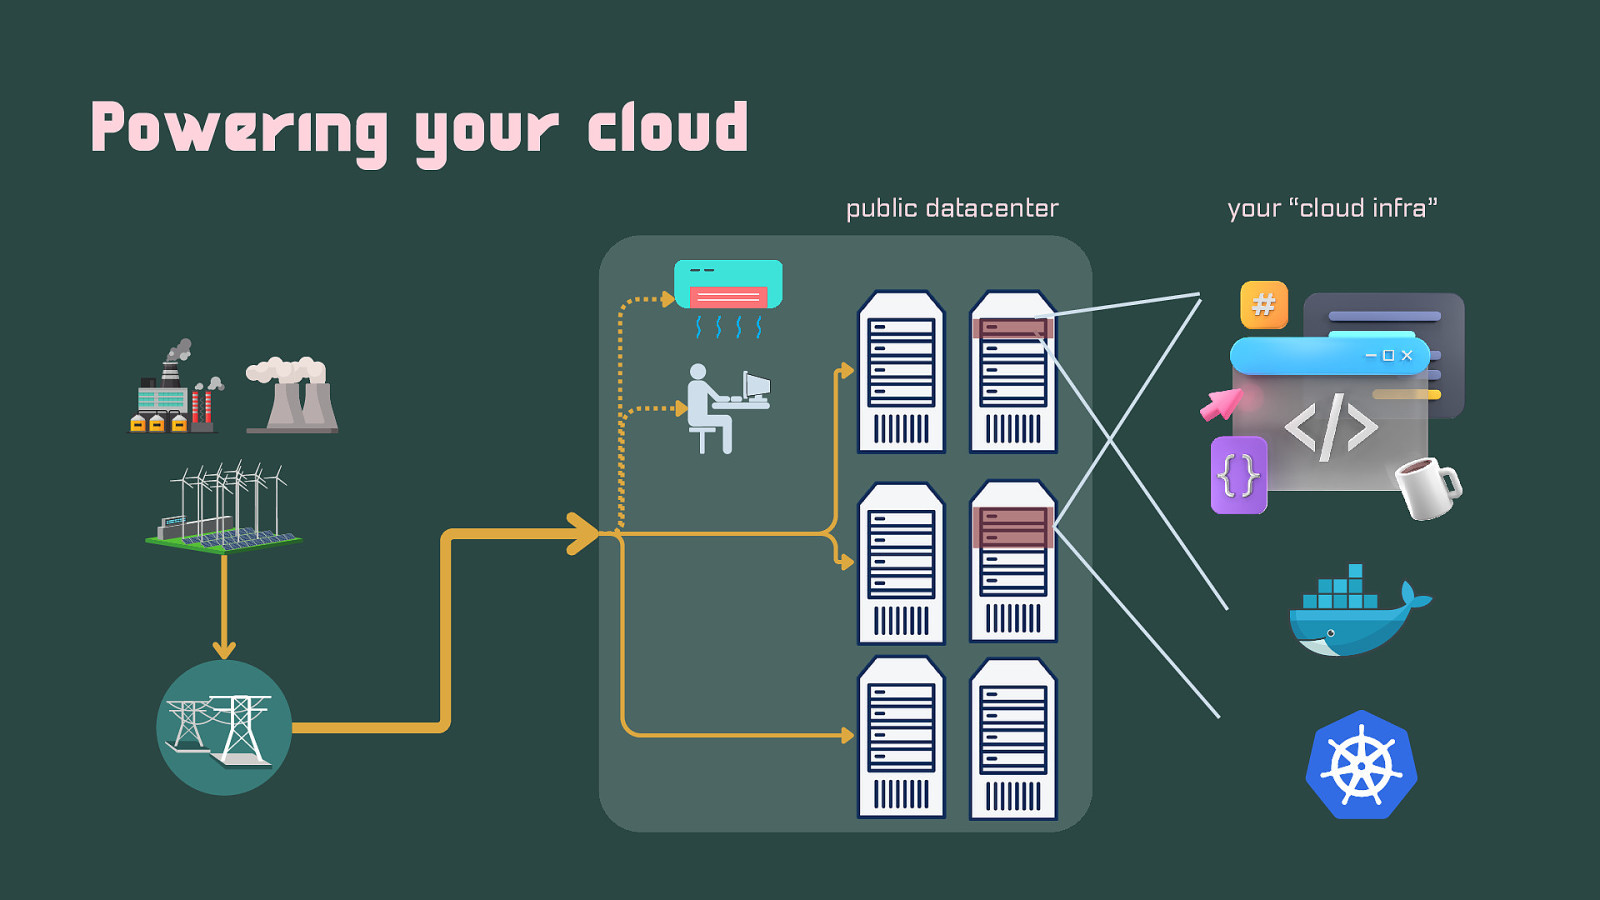
Powering your cloud public datacenter your “cloud infra”
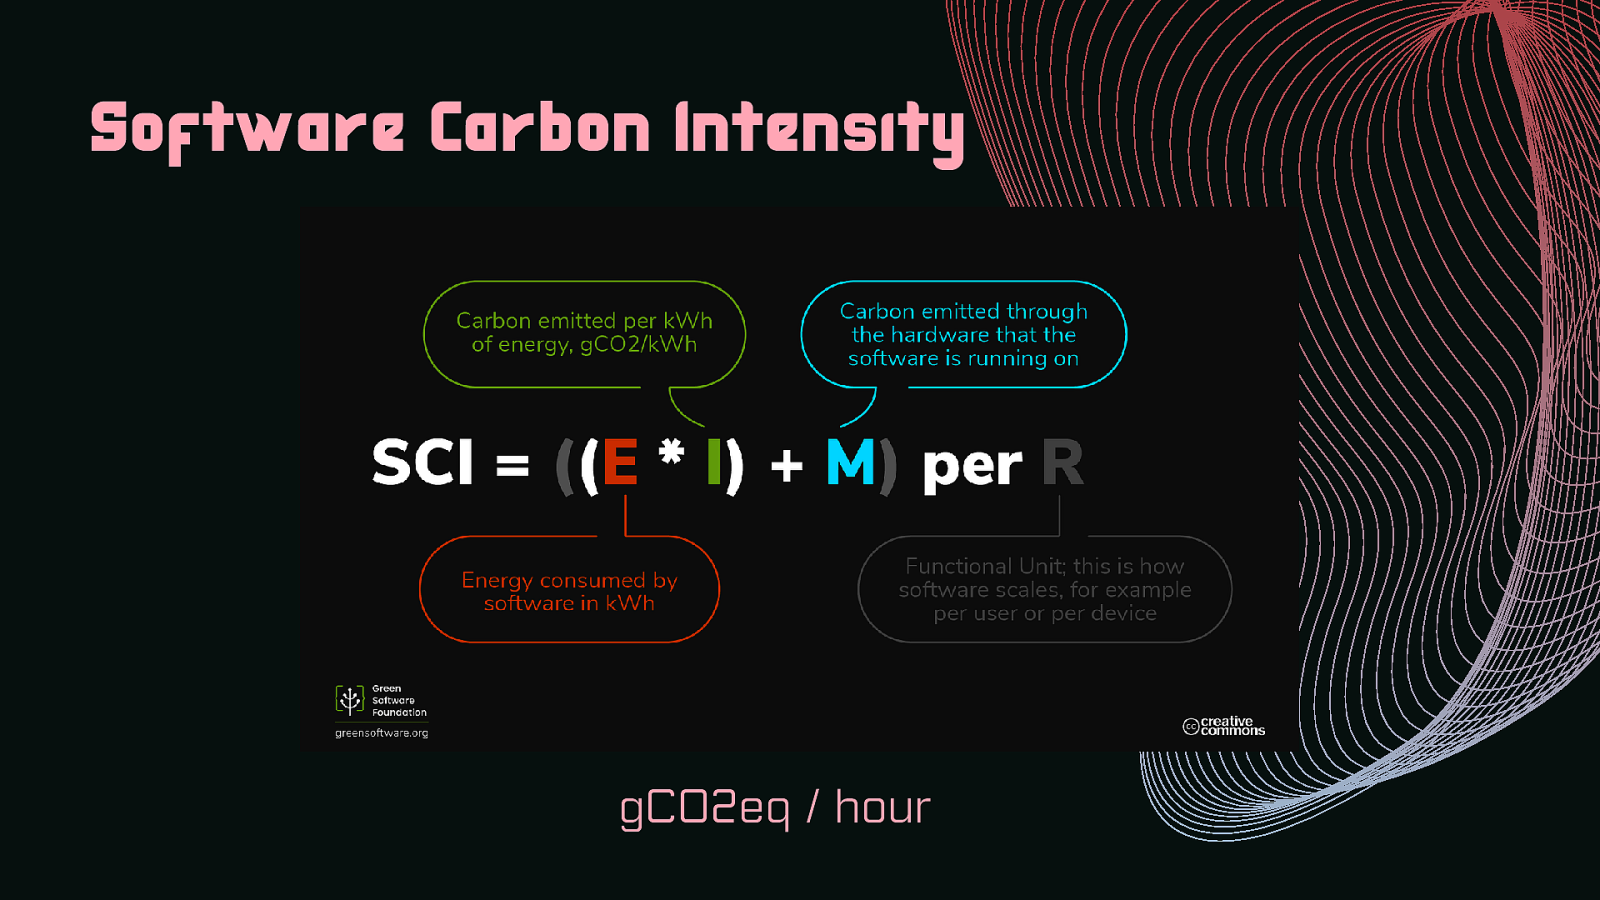
Software Carbon Intensity gCO2eq / hour
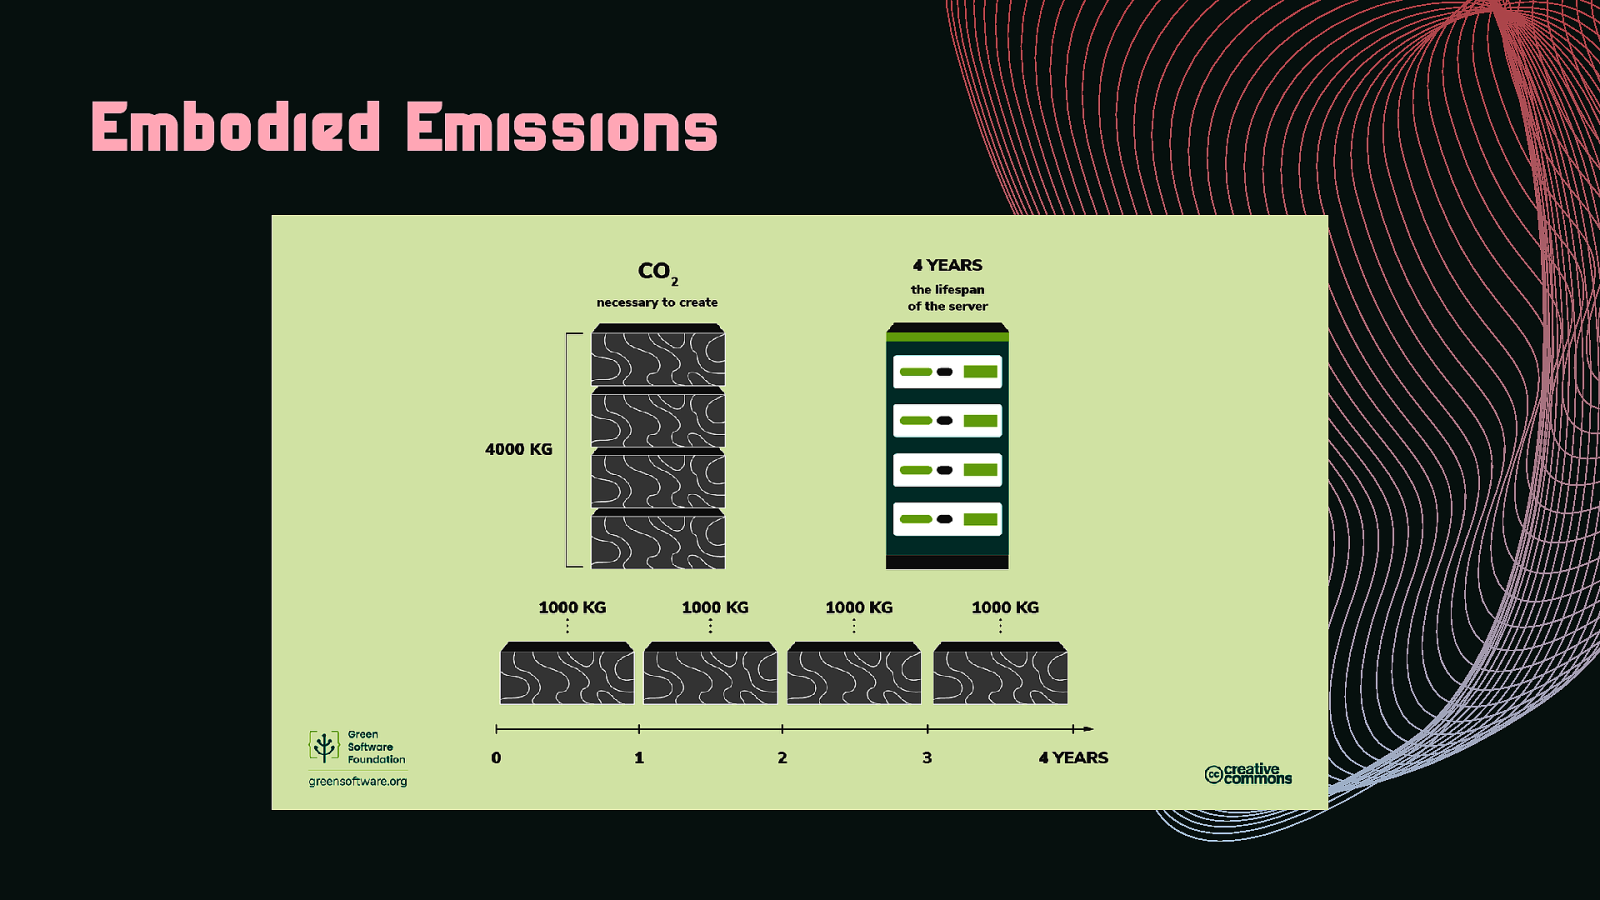
Embodied Emissions
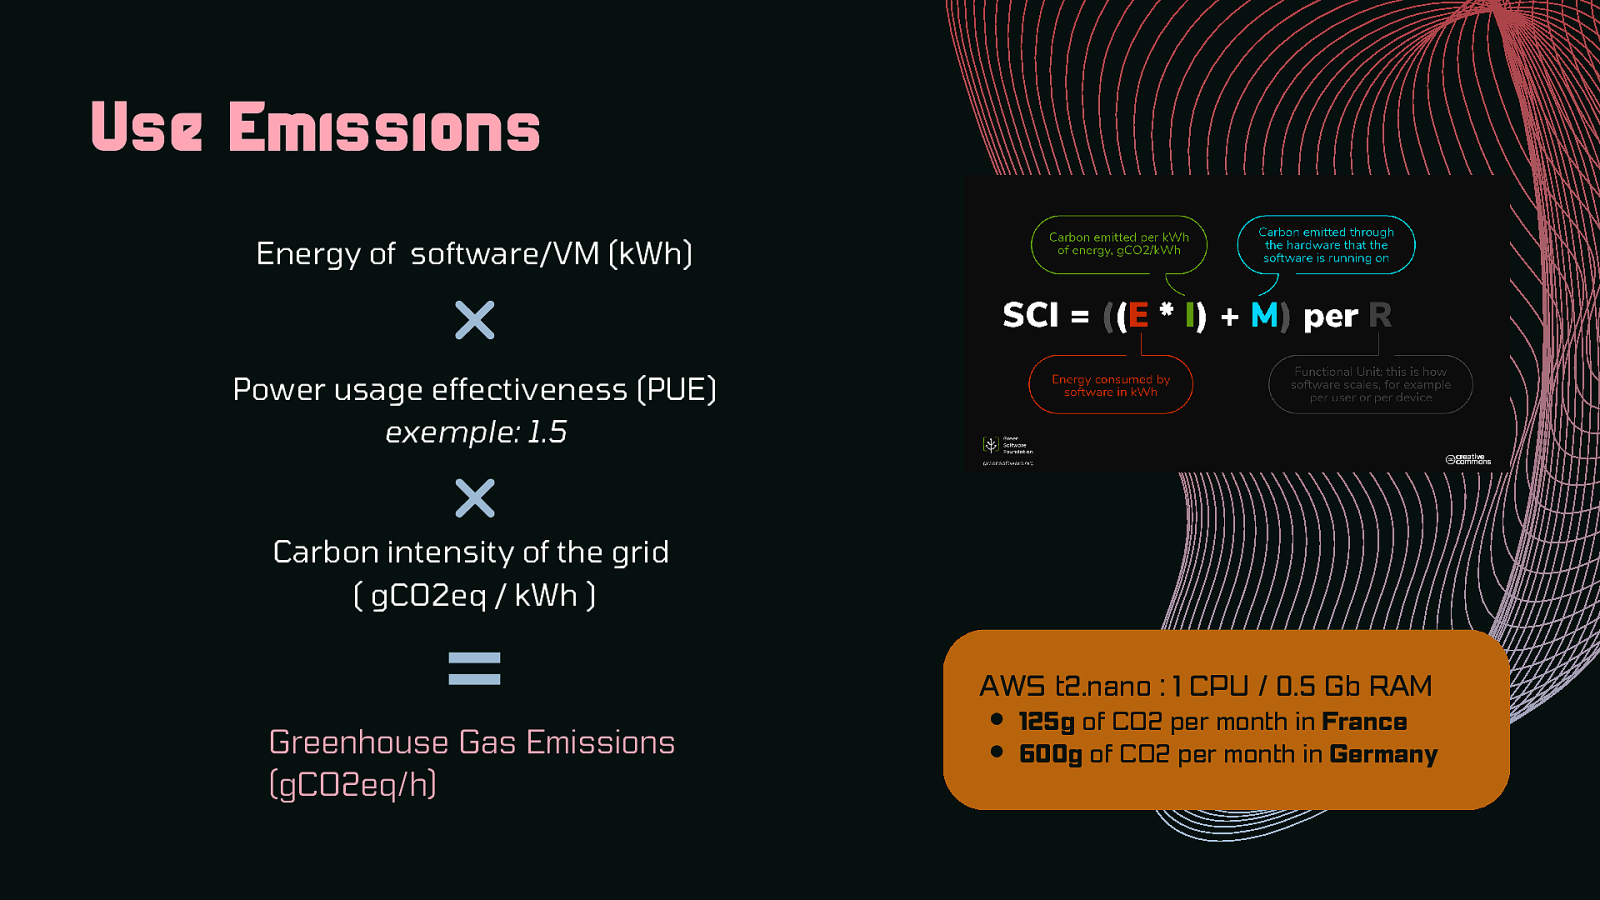
Use Emissions Energy of software/VM (kWh) Power usage effectiveness (PUE) exemple: 1.5 Carbon intensity of the grid ( gCO2eq / kWh ) Greenhouse Gas Emissions (gCO2eq/h) AWS t2.nano : 1 CPU / 0.5 Gb RAM 125g of CO2 per month in France 600g of CO2 per month in Germany
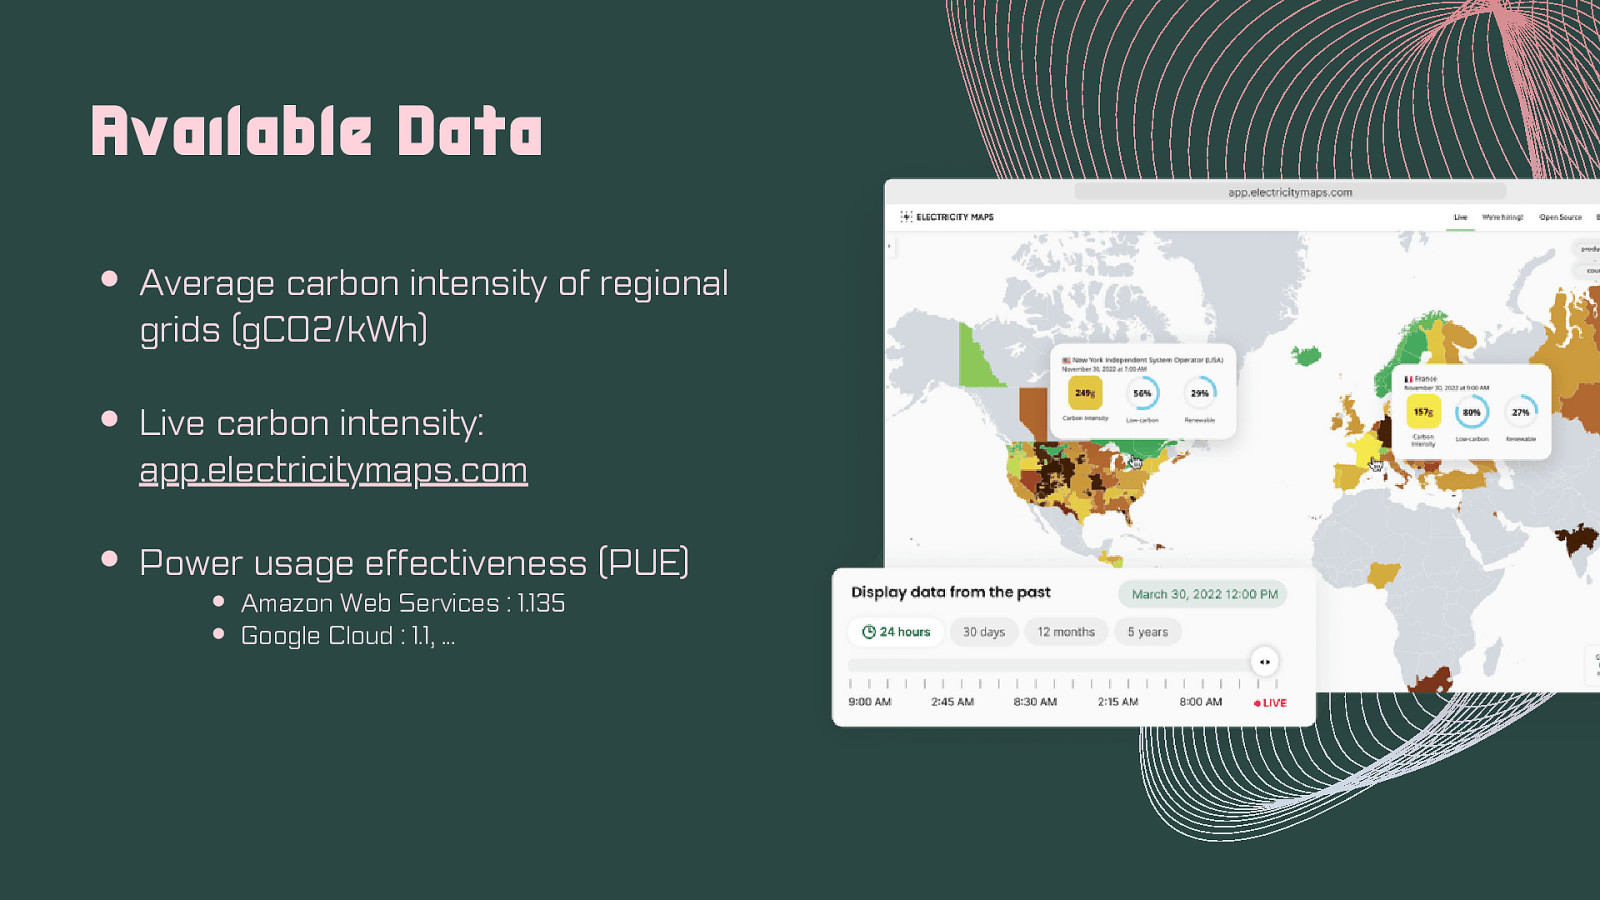
Available Data Average carbon intensity of regional grids (gCO2/kWh) Live carbon intensity: app.electricitymaps.com Power usage effectiveness (PUE) Amazon Web Services : 1.135 Google Cloud : 1.1, …
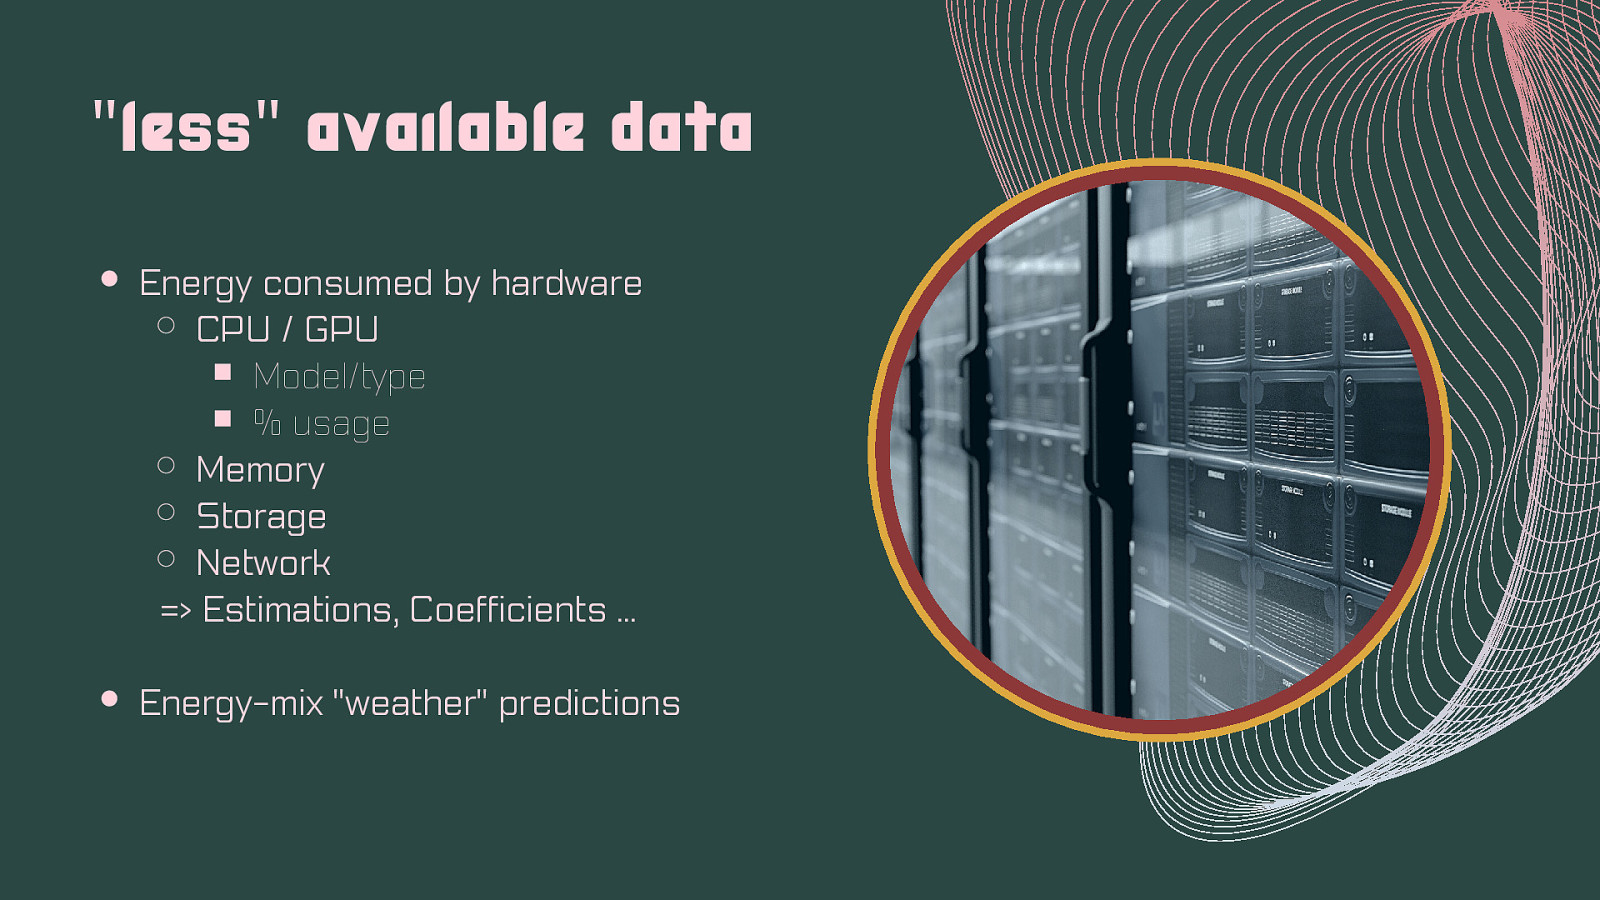
“less” available data Energy consumed by hardware CPU / GPU Model/type % usage Memory Storage Network => Estimations, Coefficients … Energy-mix “weather” predictions
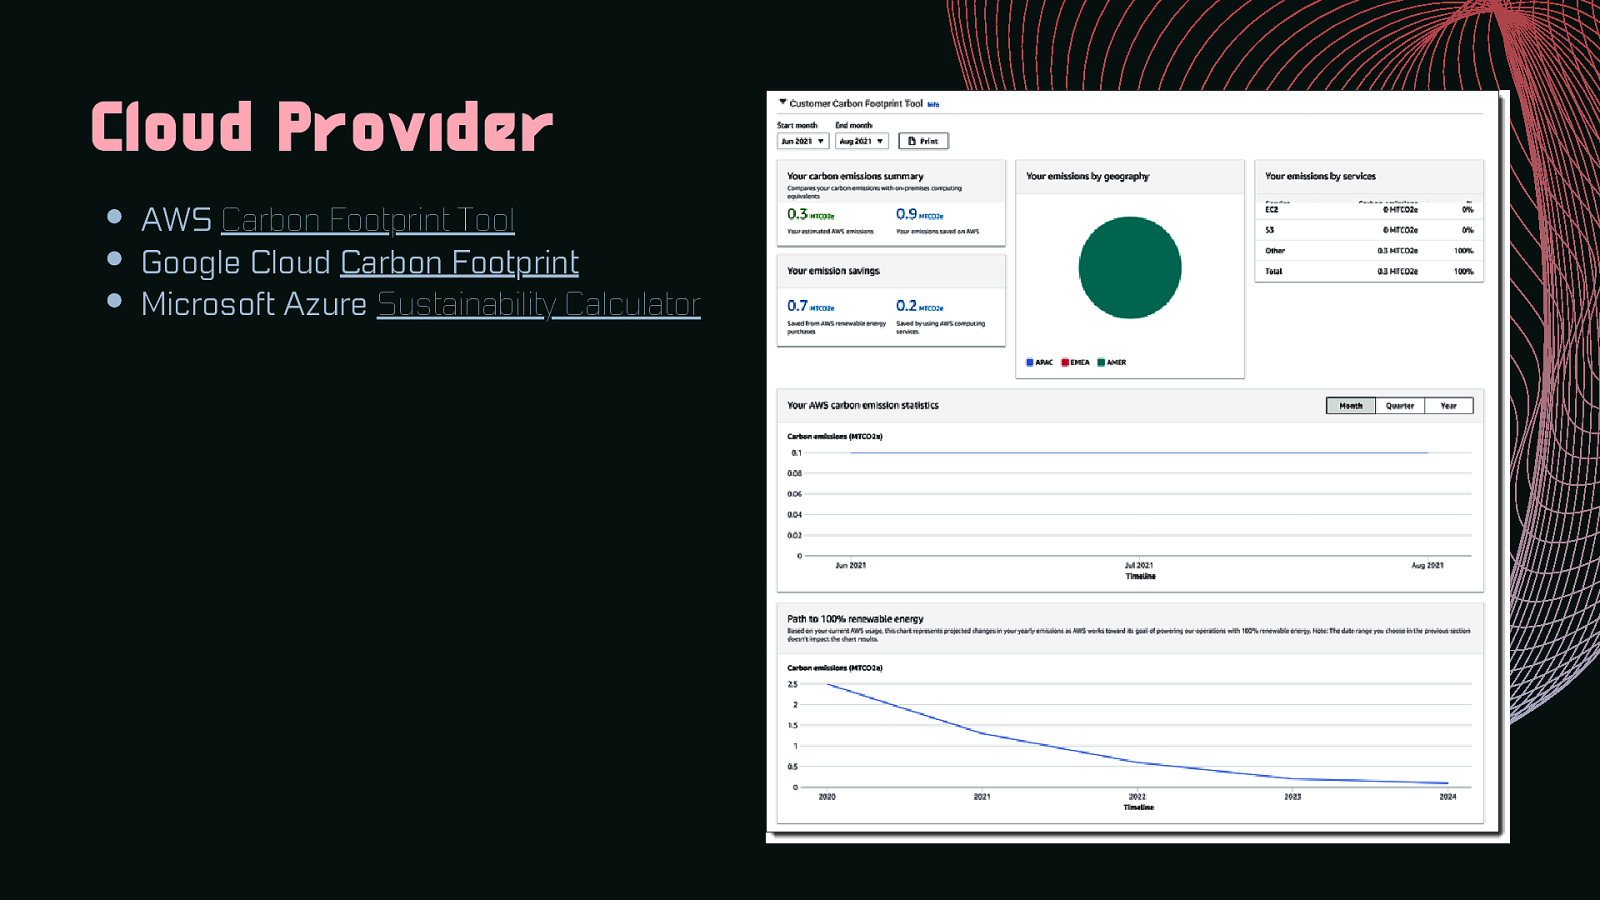
Cloud Provider AWS Carbon Footprint Tool Google Cloud Carbon Footprint Microsoft Azure Sustainability Calculator
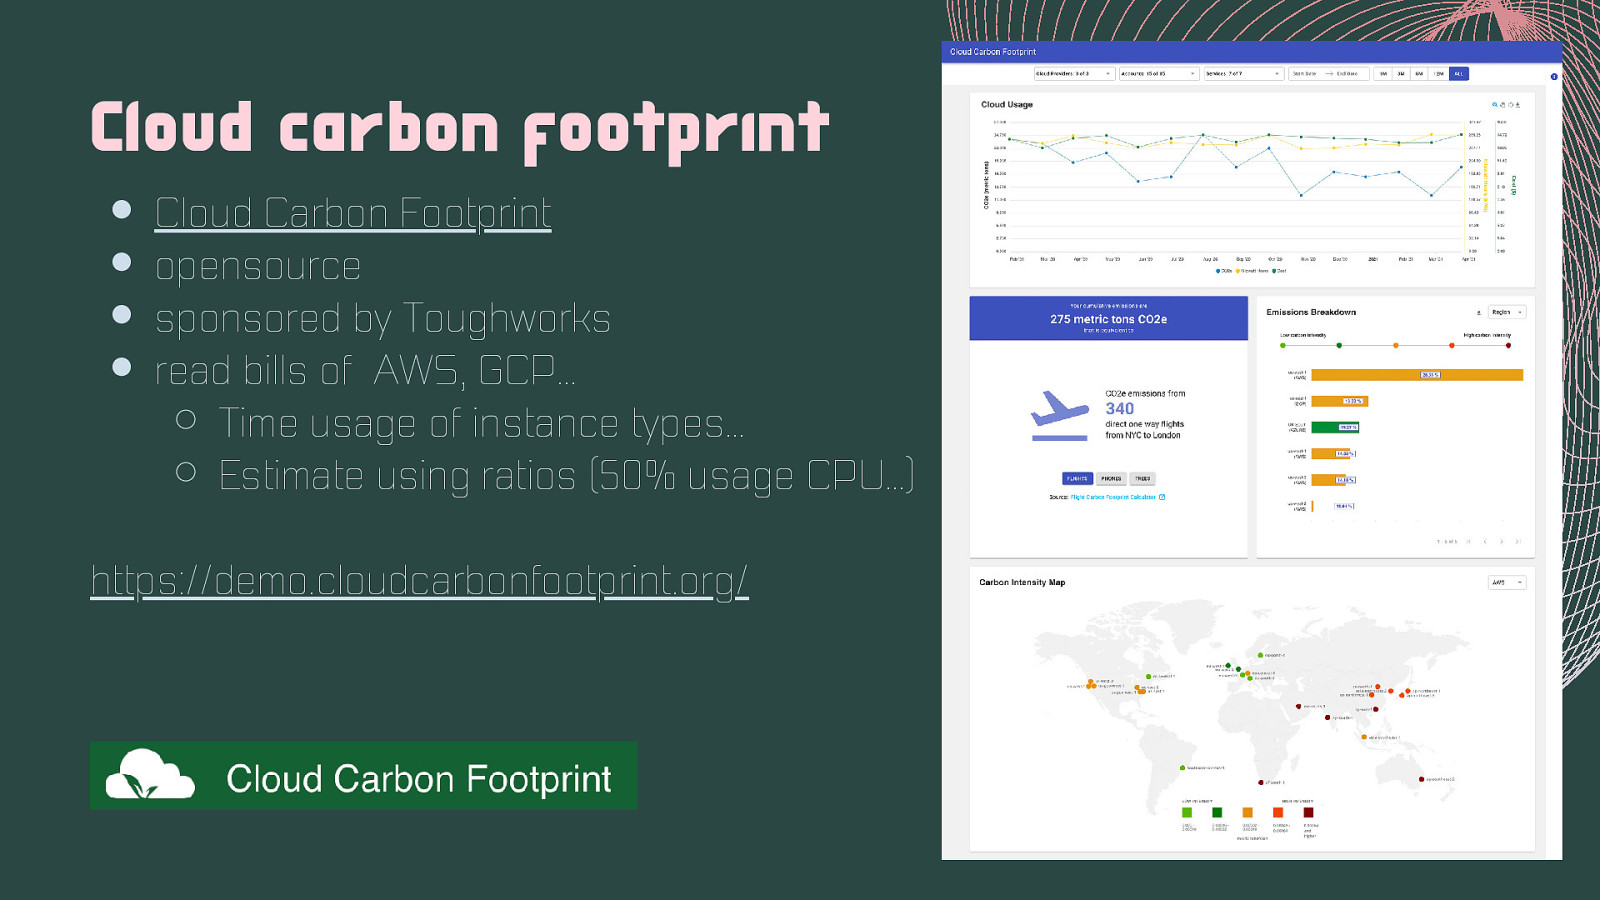
Cloud carbon footprint Cloud Carbon Footprint opensource sponsored by Toughworks read bills of AWS, GCP… Time usage of instance types… Estimate using ratios (50% usage CPU…) https://demo.cloudcarbonfootprint.org/
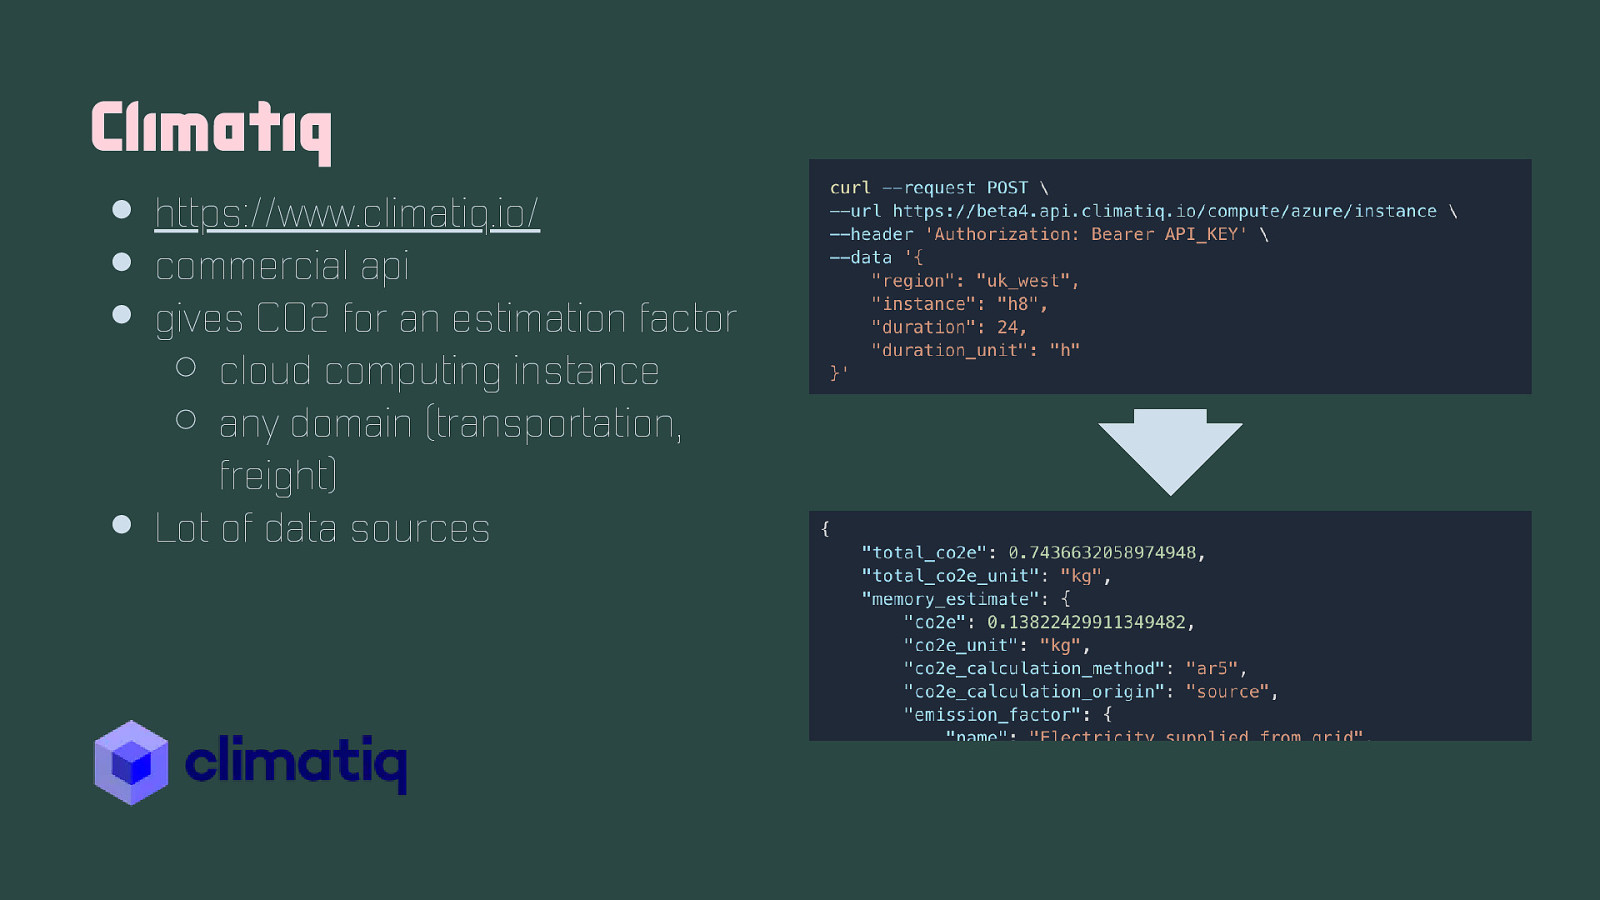
Climatiq https://www.climatiq.io/ commercial api gives CO2 for an estimation factor cloud computing instance any domain (transportation, freight) Lot of data sources
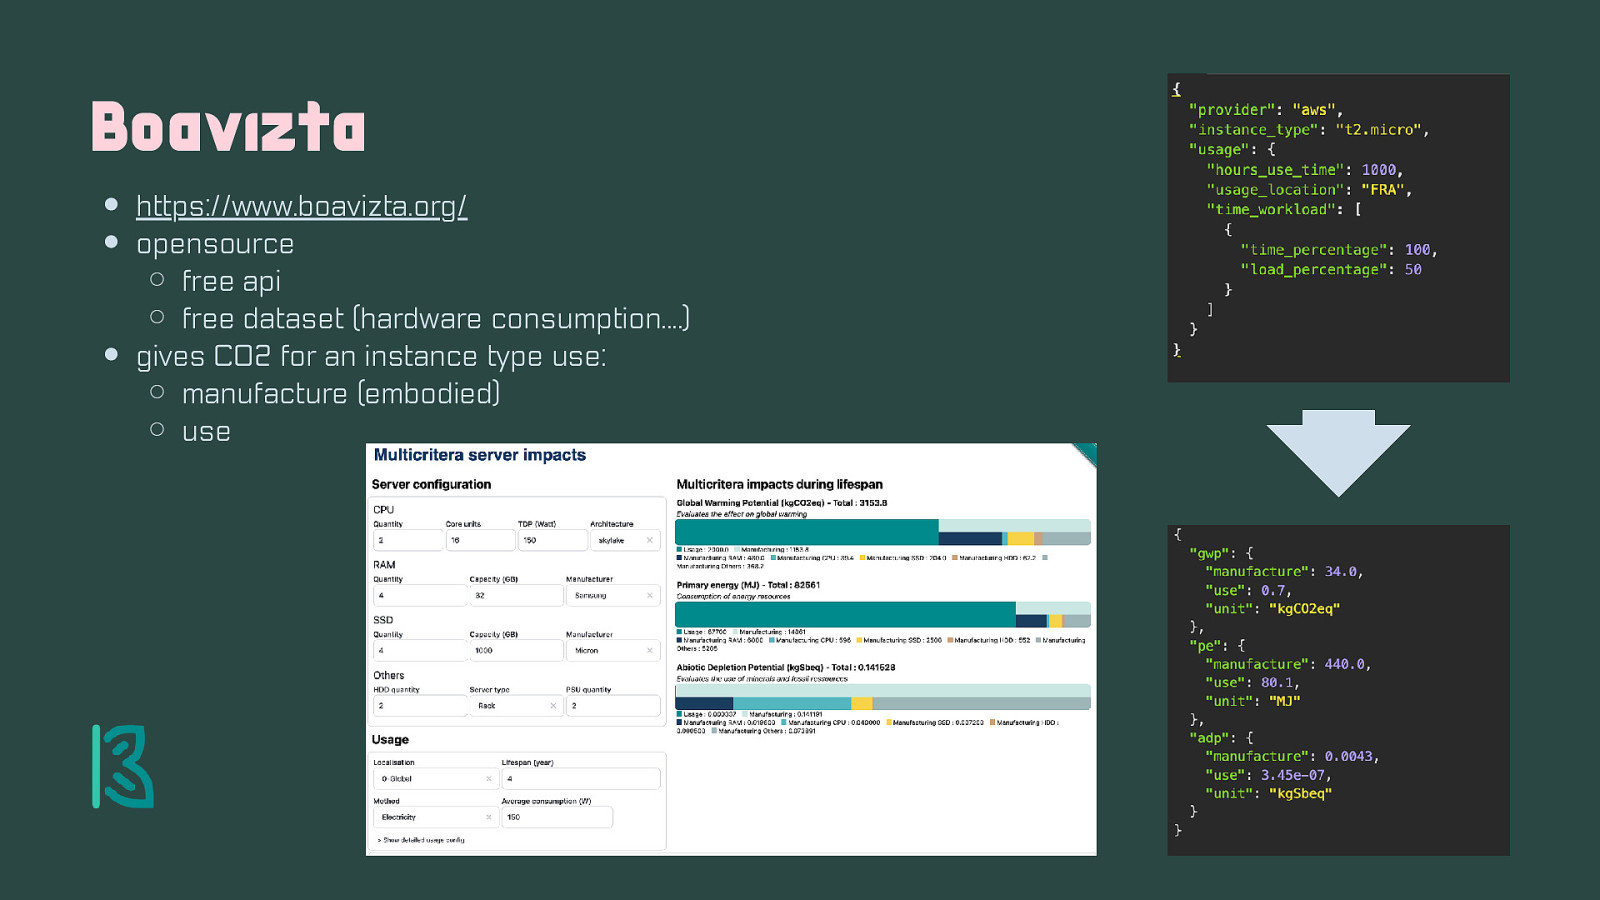
Boavizta https://www.boavizta.org/ opensource free api free dataset (hardware consumption….) gives CO2 for an instance type use: manufacture (embodied) use
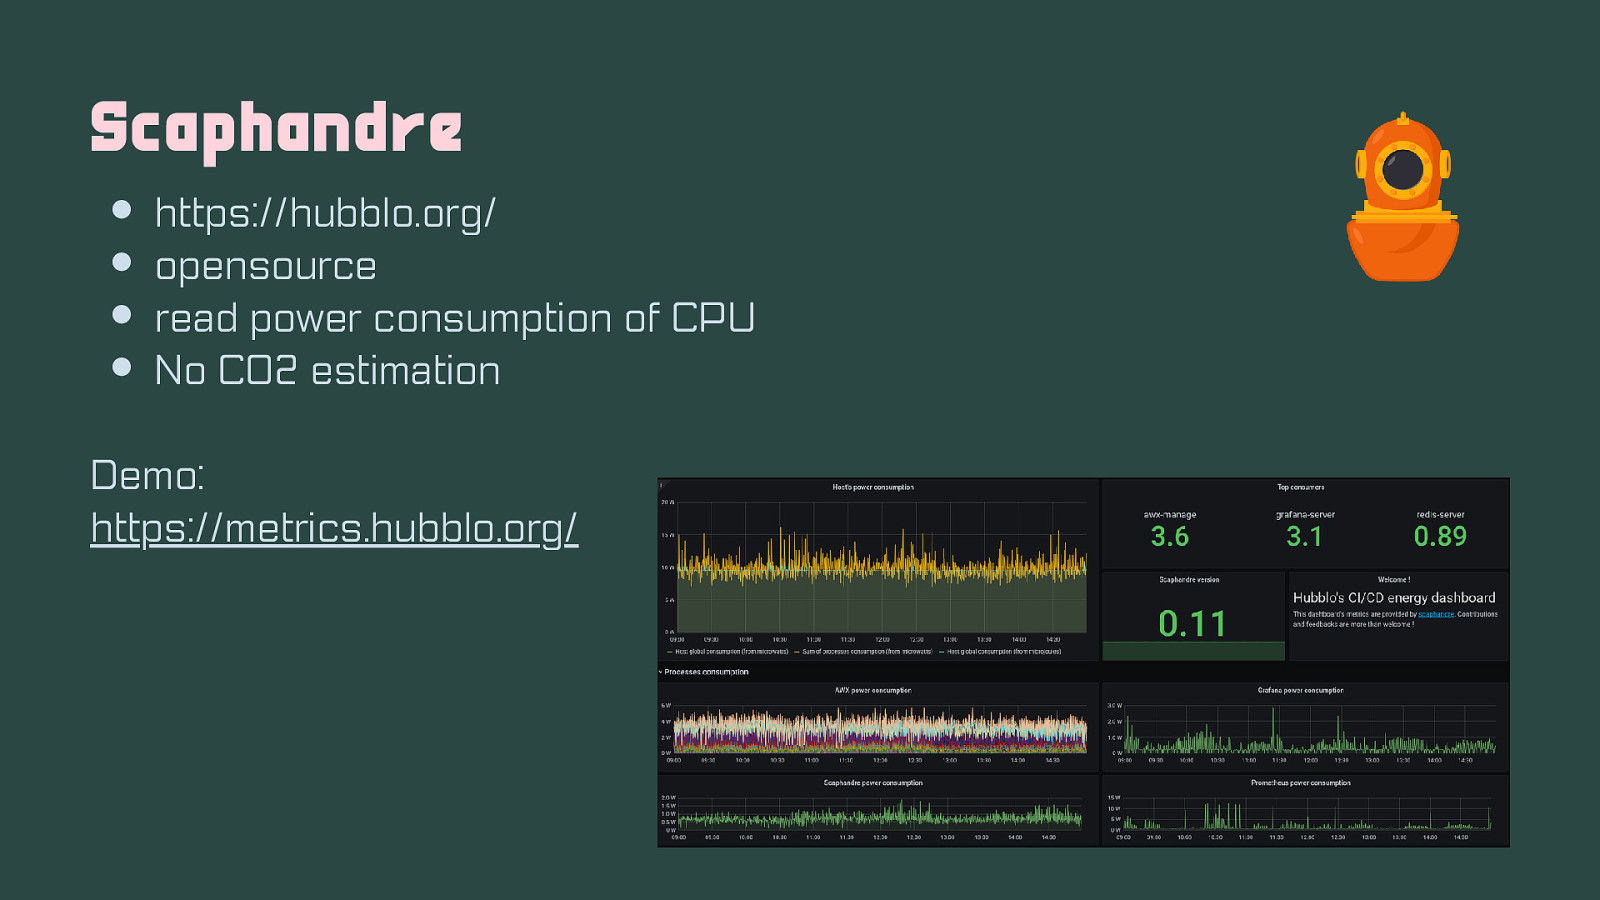
Scaphandre https://hubblo.org/ opensource read power consumption of CPU No CO2 estimation Demo: https://metrics.hubblo.org/
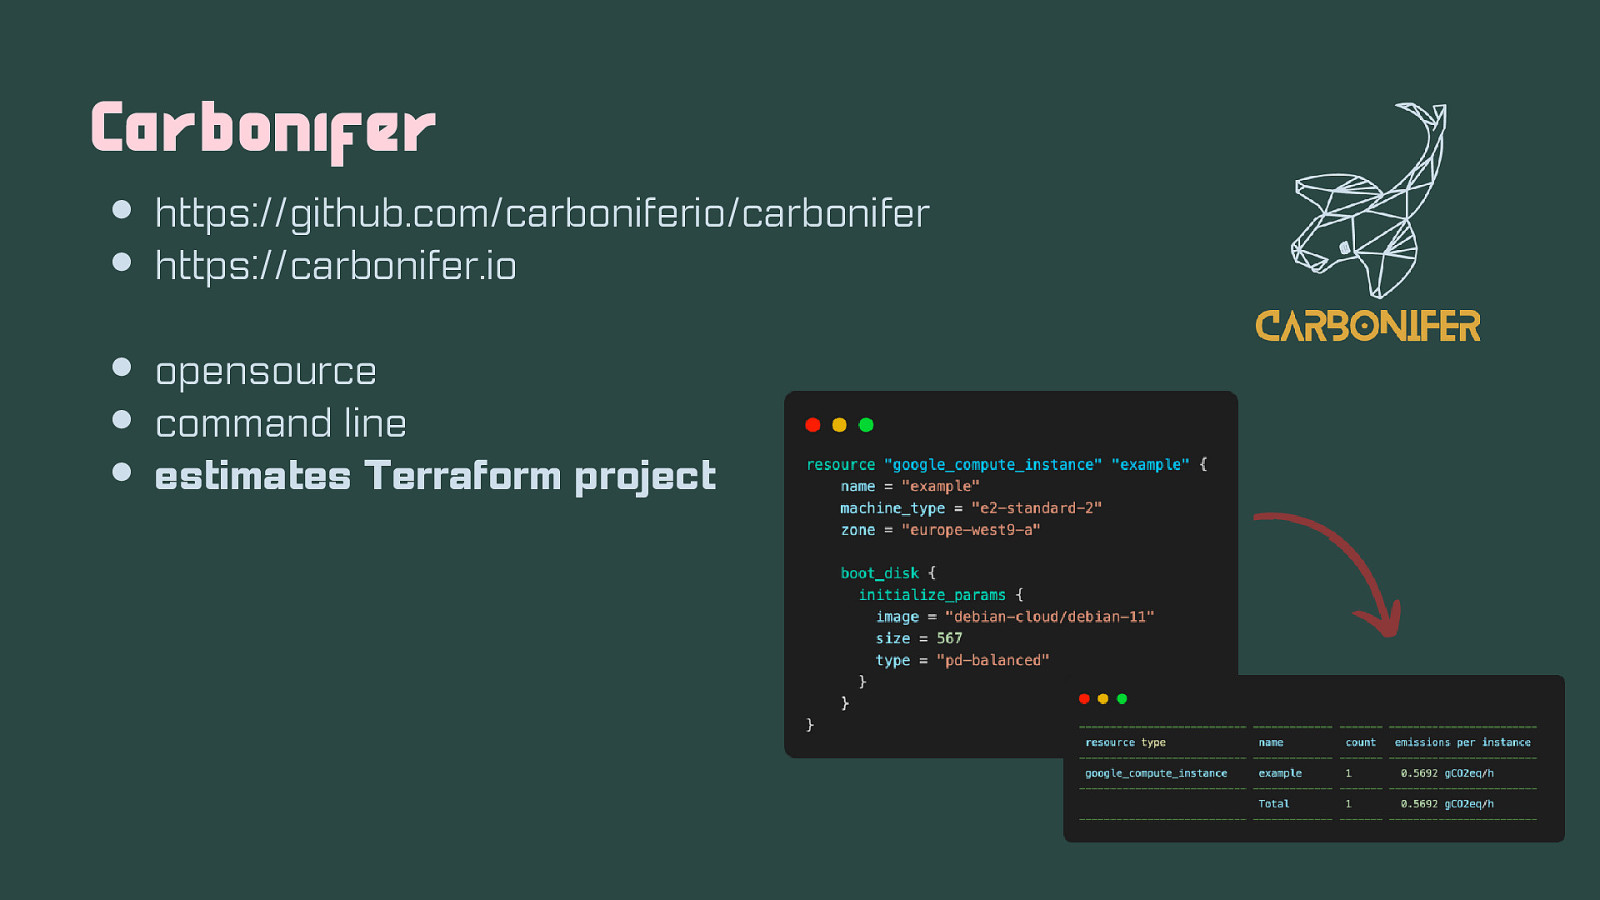
Carbonifer https://github.com/carboniferio/carbonifer https://carbonifer.io opensource command line estimates Terraform project
Reduction
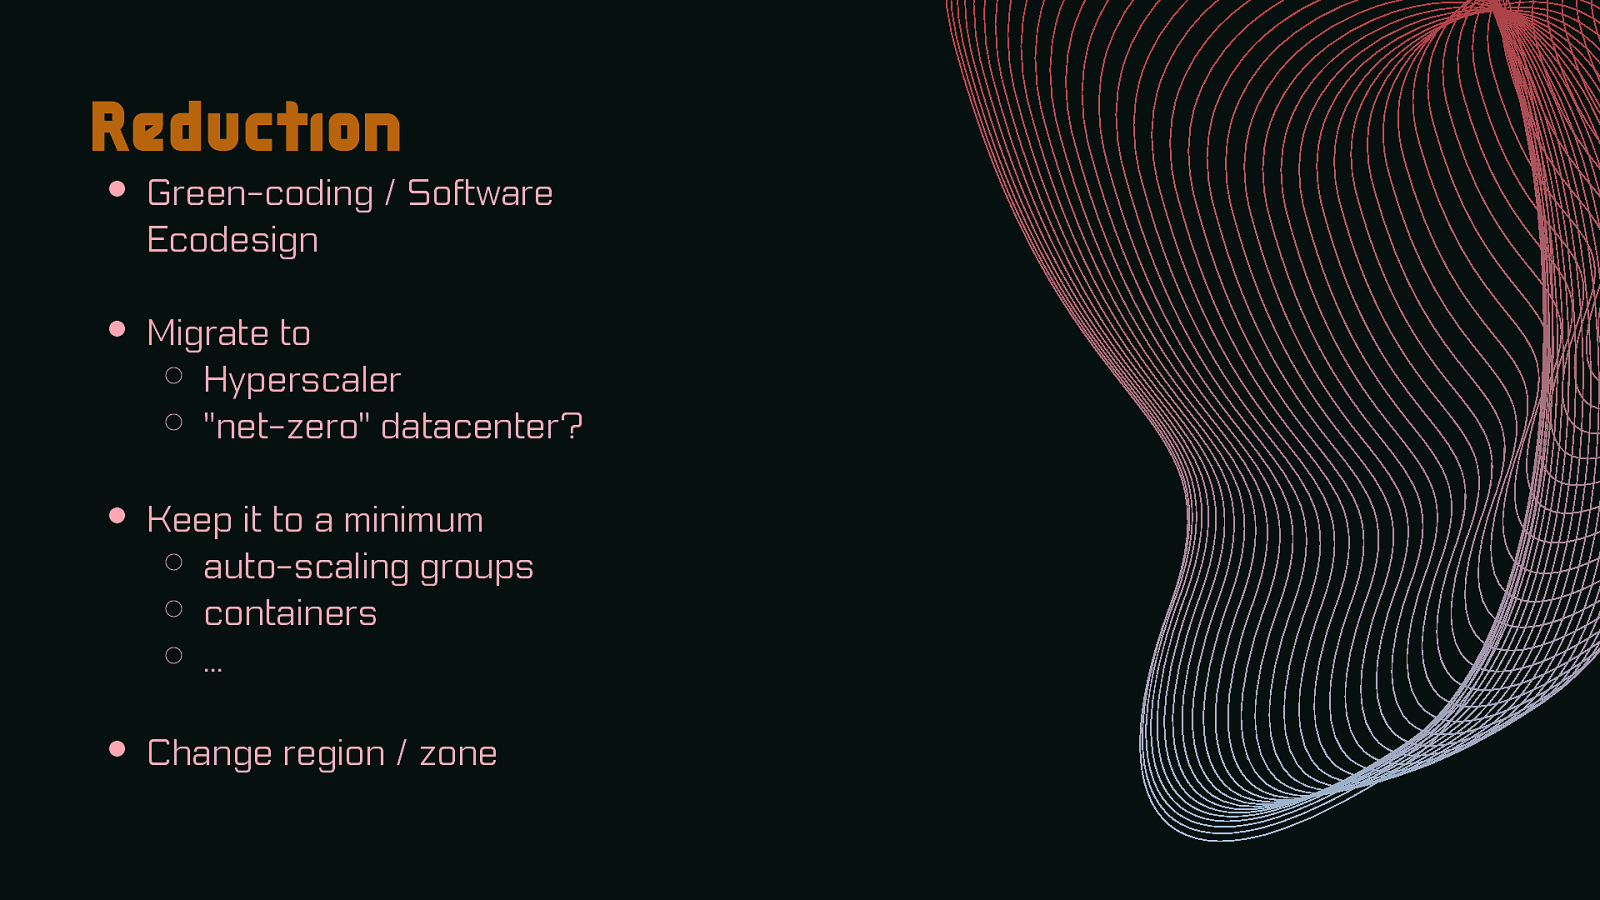
Reduction Green-coding / Software Ecodesign Migrate to Hyperscaler “net-zero” datacenter? Keep it to a minimum auto-scaling groups containers … Change region / zone
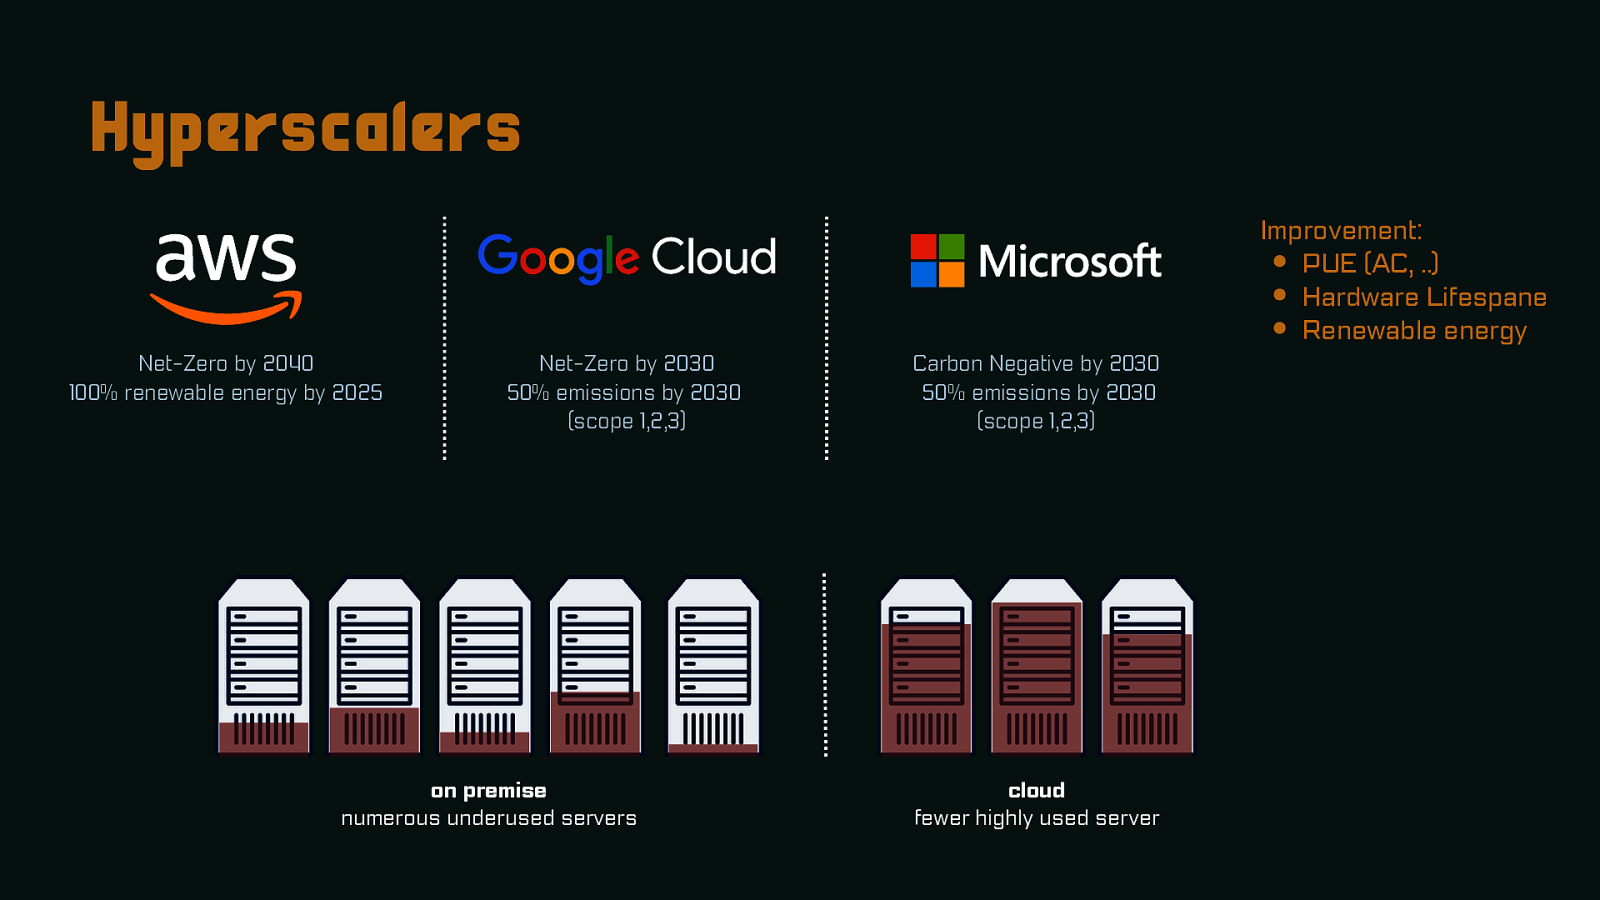
Hyperscalers Net-Zero by 2040 100% renewable energy by 2025 Net-Zero by 2030 50% emissions by 2030 (scope 1,2,3) on premise numerous underused servers Carbon Negative by 2030 50% emissions by 2030 (scope 1,2,3) cloud fewer highly used server Improvement: PUE (AC, ..) Hardware Lifespane Renewable energy
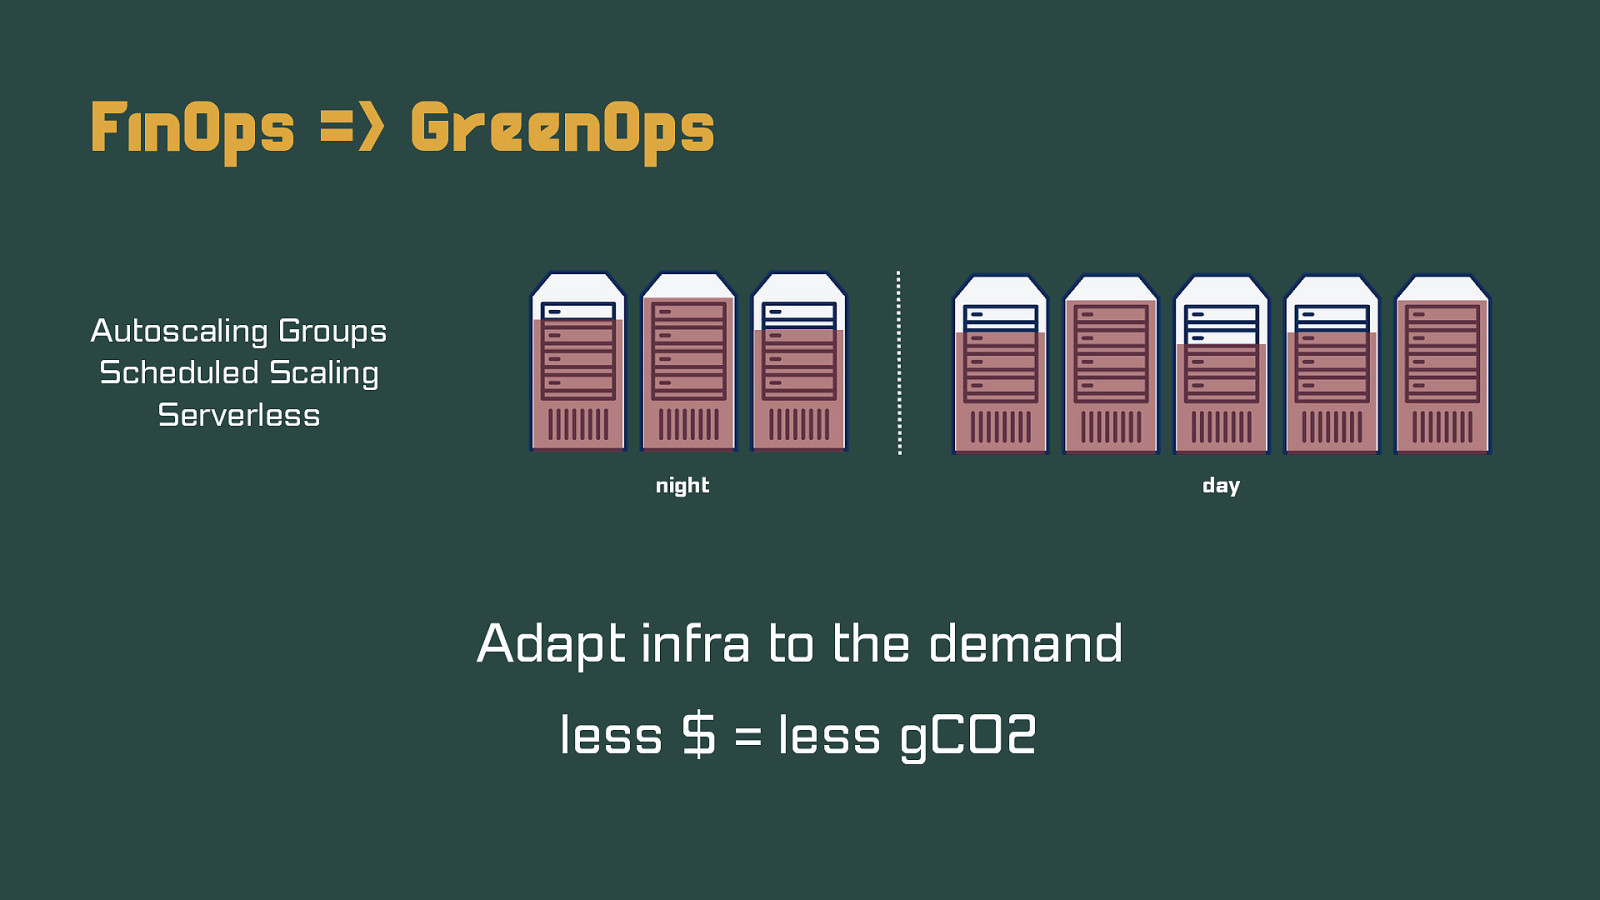
FinOps => GreenOps Autoscaling Groups Scheduled Scaling Serverless night Adapt infra to the demand less $ = less gCO2 day
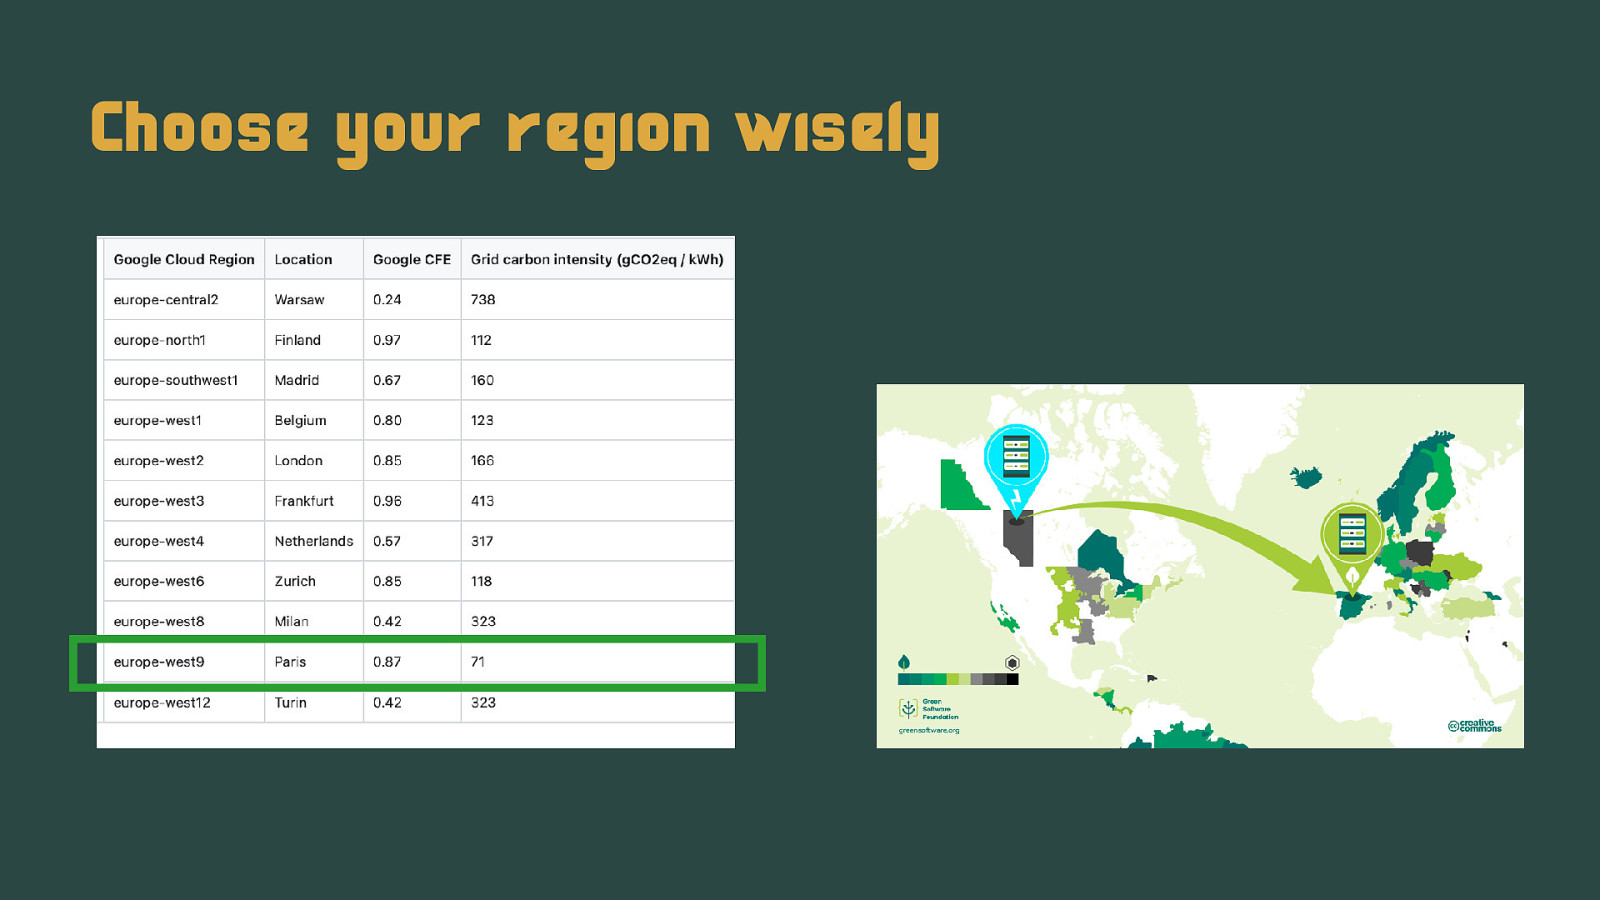
Choose your region wisely
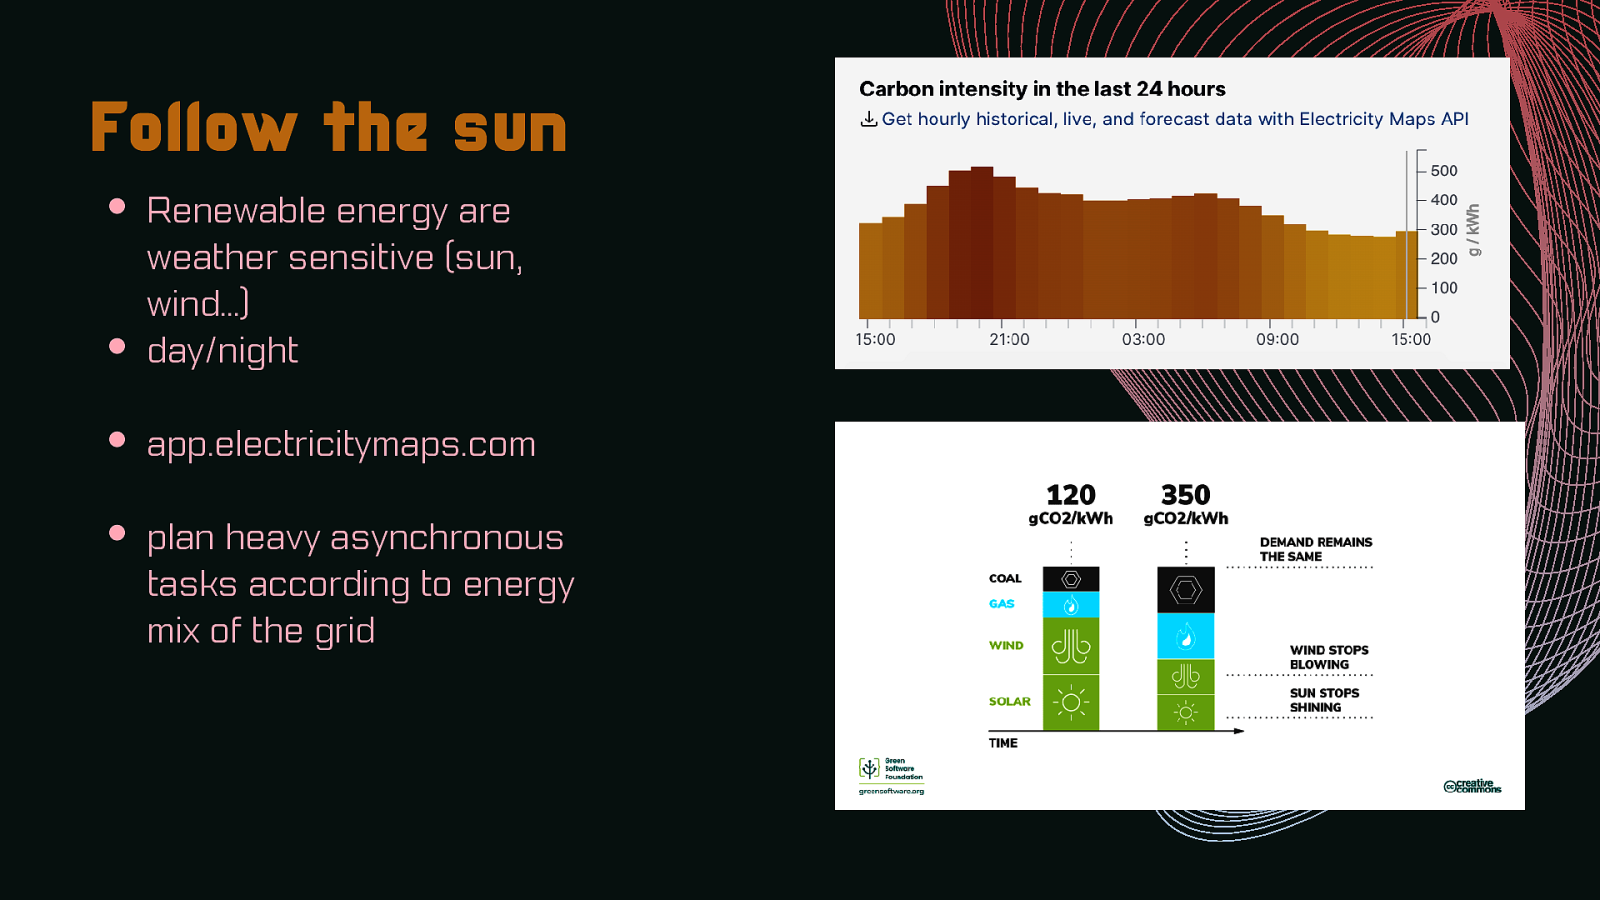
Follow the sun Renewable energy are weather sensitive (sun, wind…) day/night app.electricitymaps.com plan heavy asynchronous tasks according to energy mix of the grid
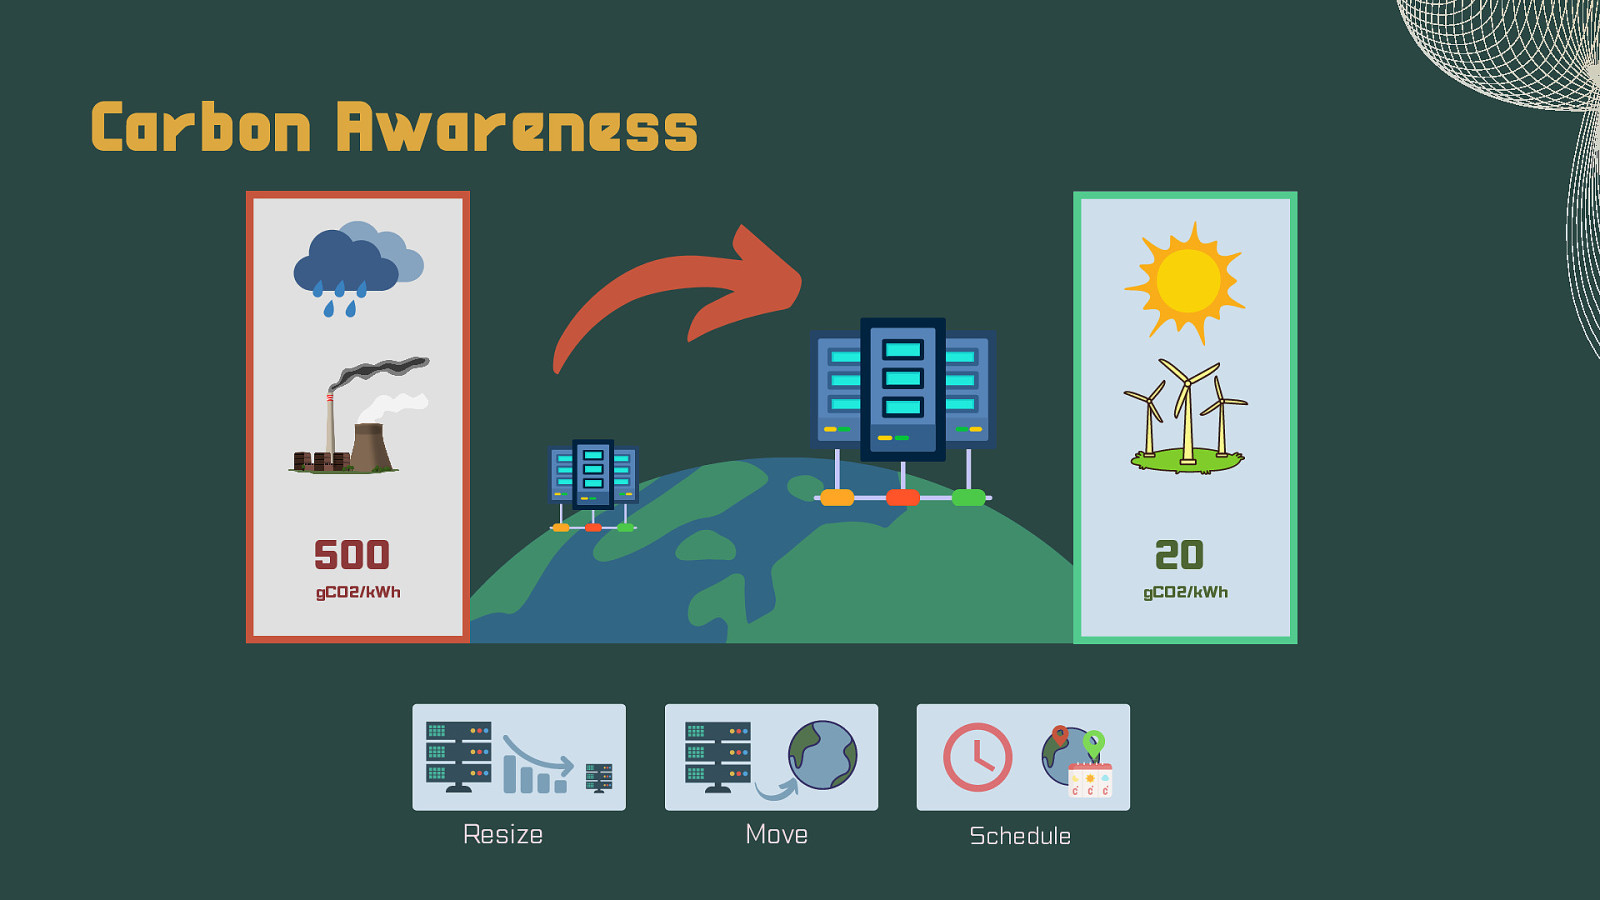
Carbon Awareness 500 20 gCO2/kWh gCO2/kWh Resize Move Schedule
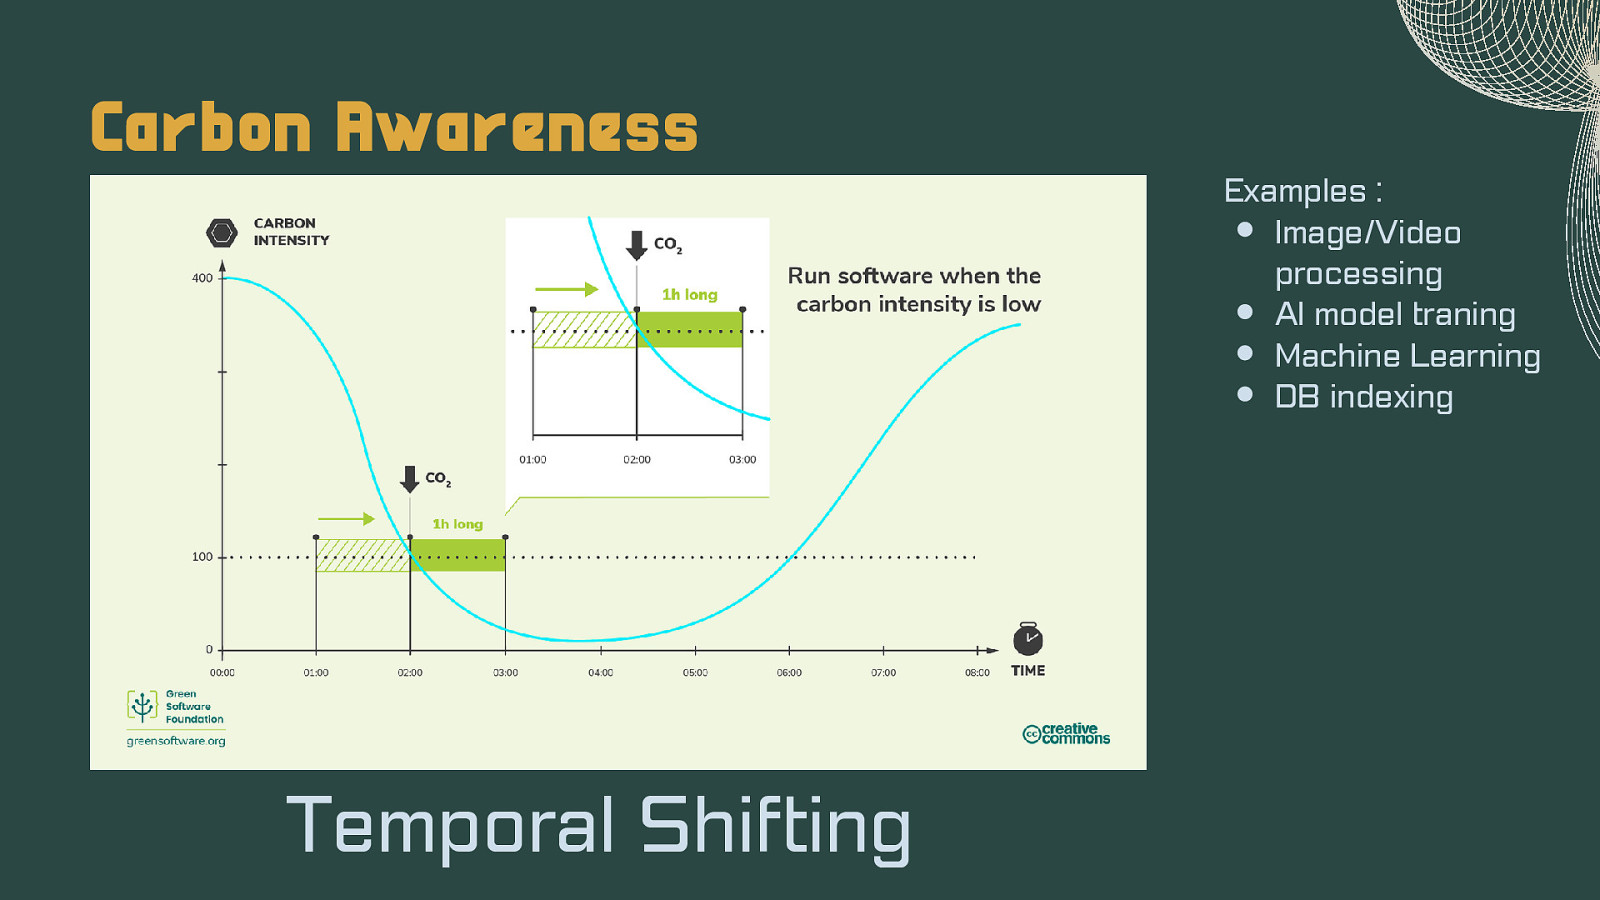
Carbon Awareness Temporal Shifting Examples : Image/Video processing AI model traning Machine Learning DB indexing
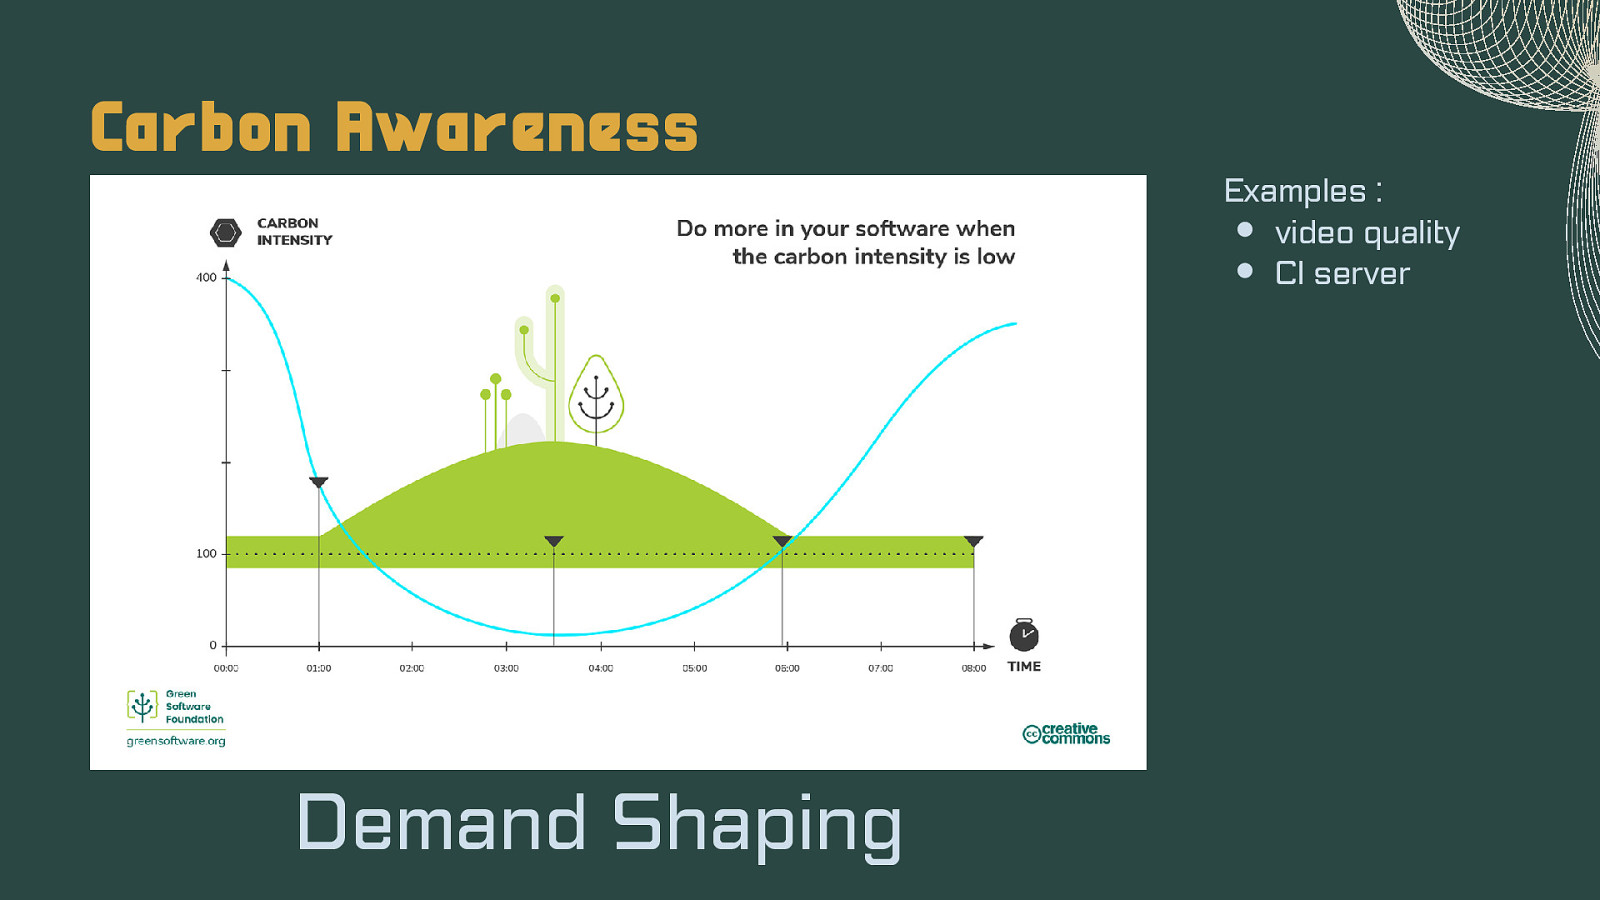
Carbon Awareness Demand Shaping Examples : video quality CI server
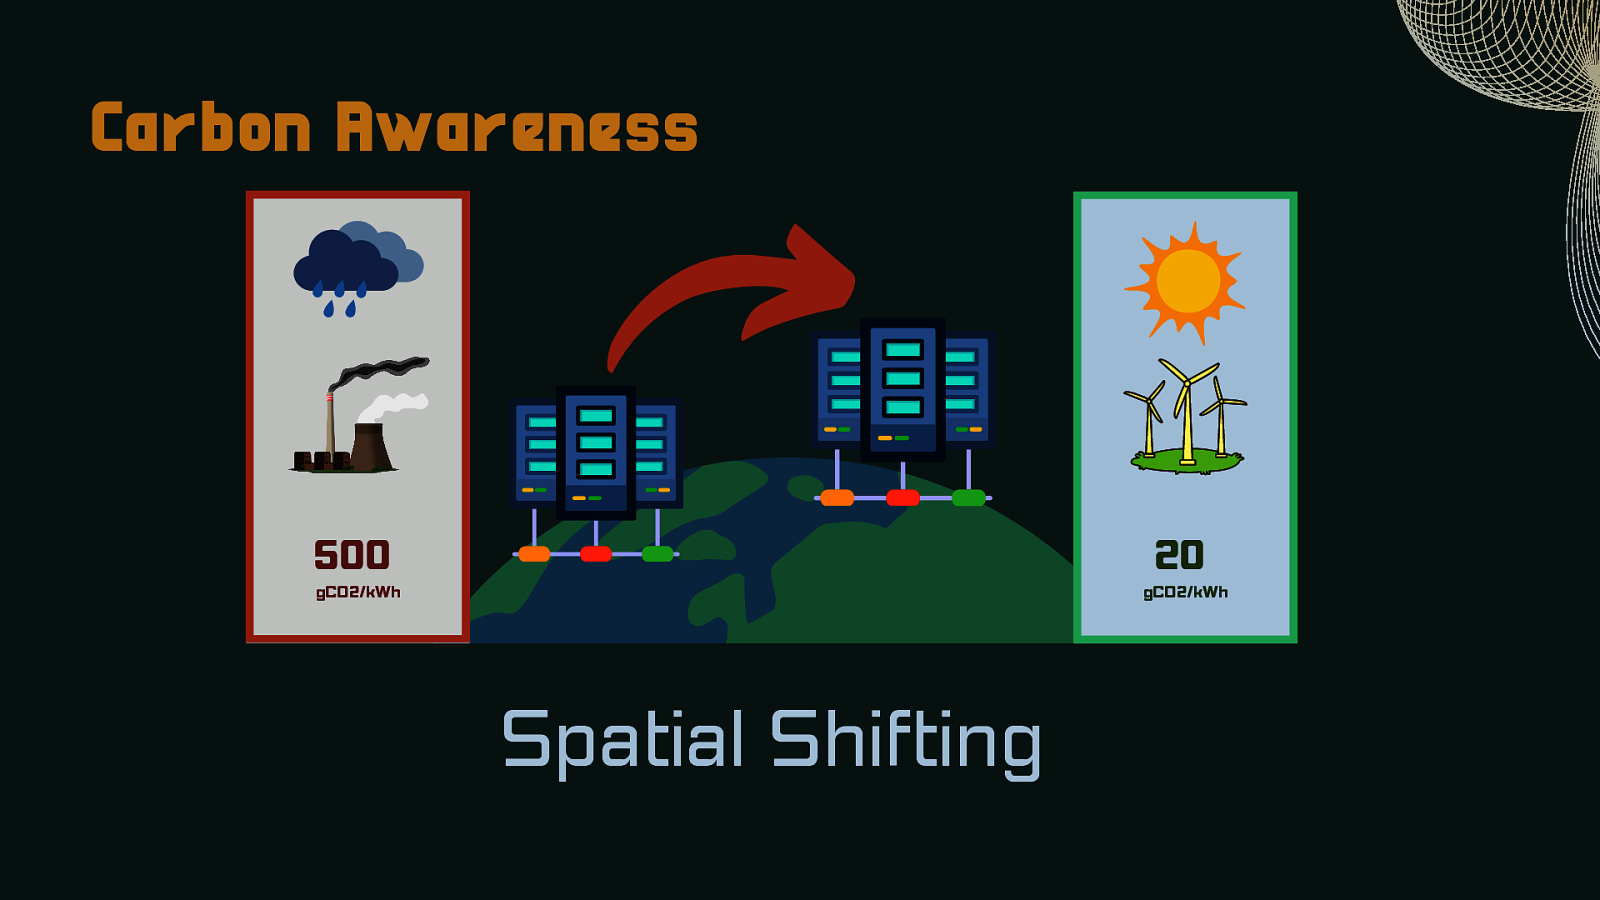
Carbon Awareness 500 20 gCO2/kWh gCO2/kWh Spatial Shifting

Demo
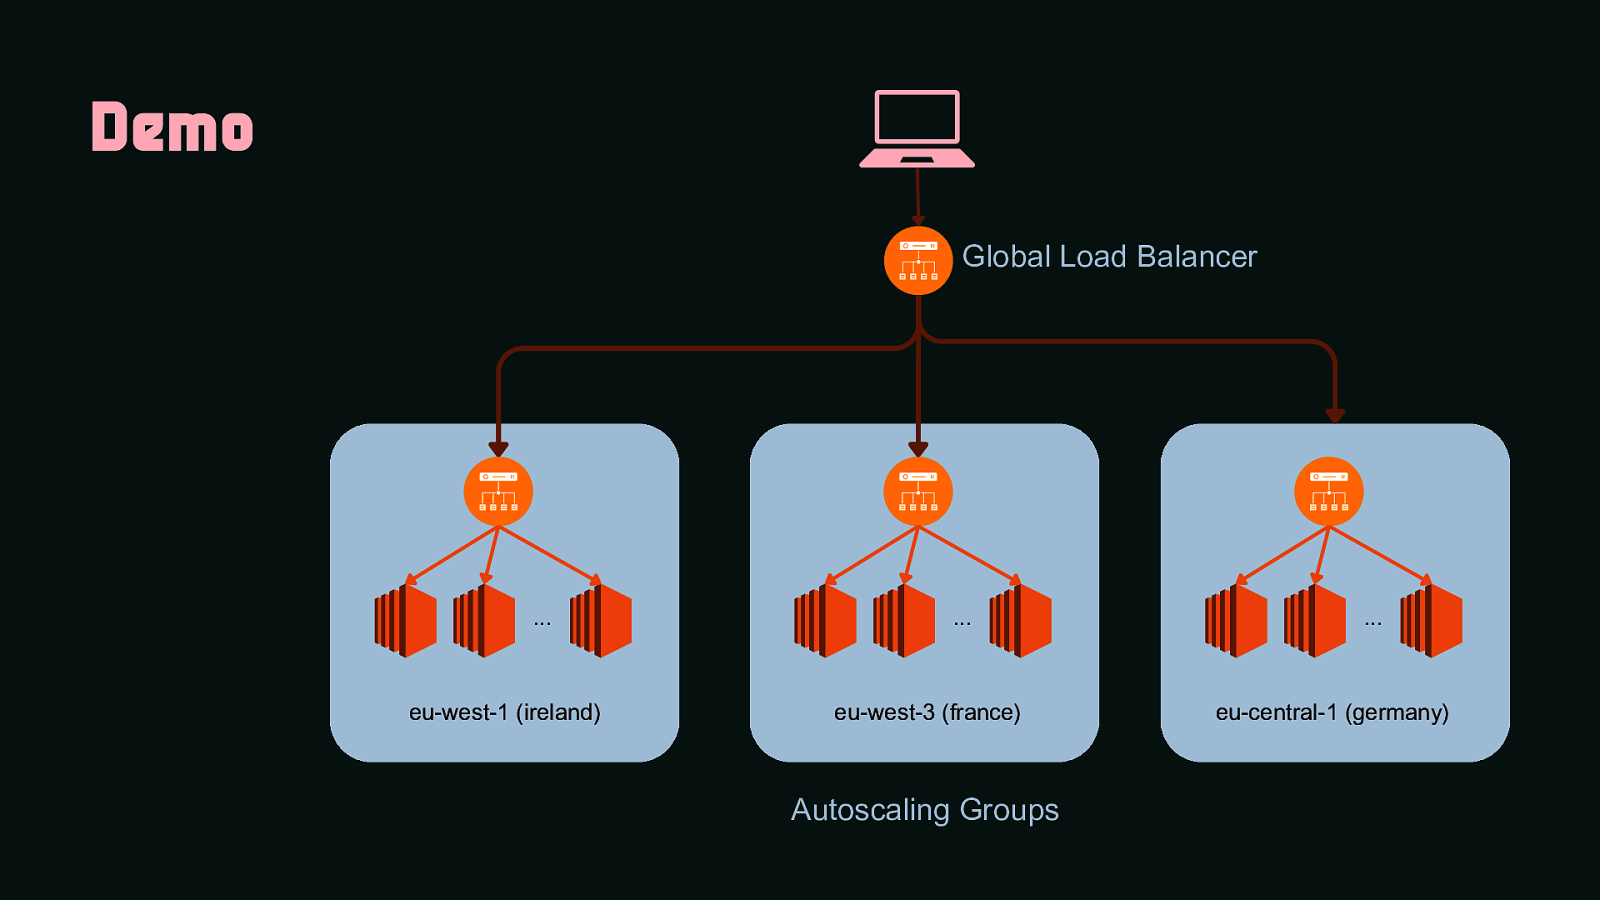
Demo Global Load Balancer … eu-west-1 (ireland) … eu-west-3 (france) Autoscaling Groups … eu-central-1 (germany)
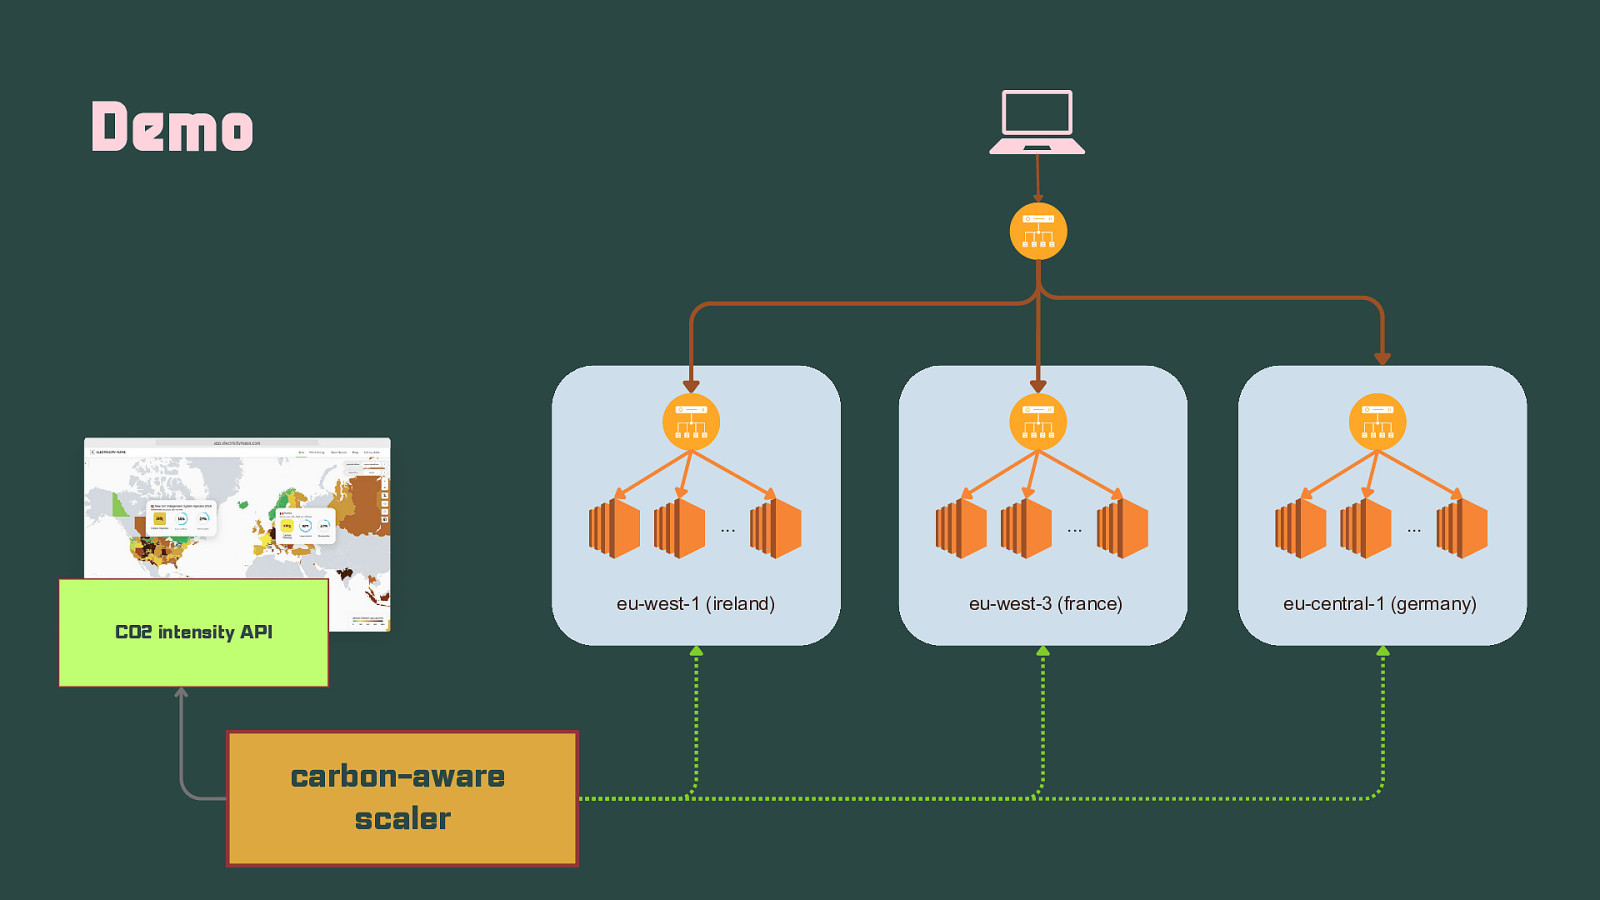
Demo … eu-west-1 (ireland) CO2 intensity API carbon-aware scaler … eu-west-3 (france) … eu-central-1 (germany)
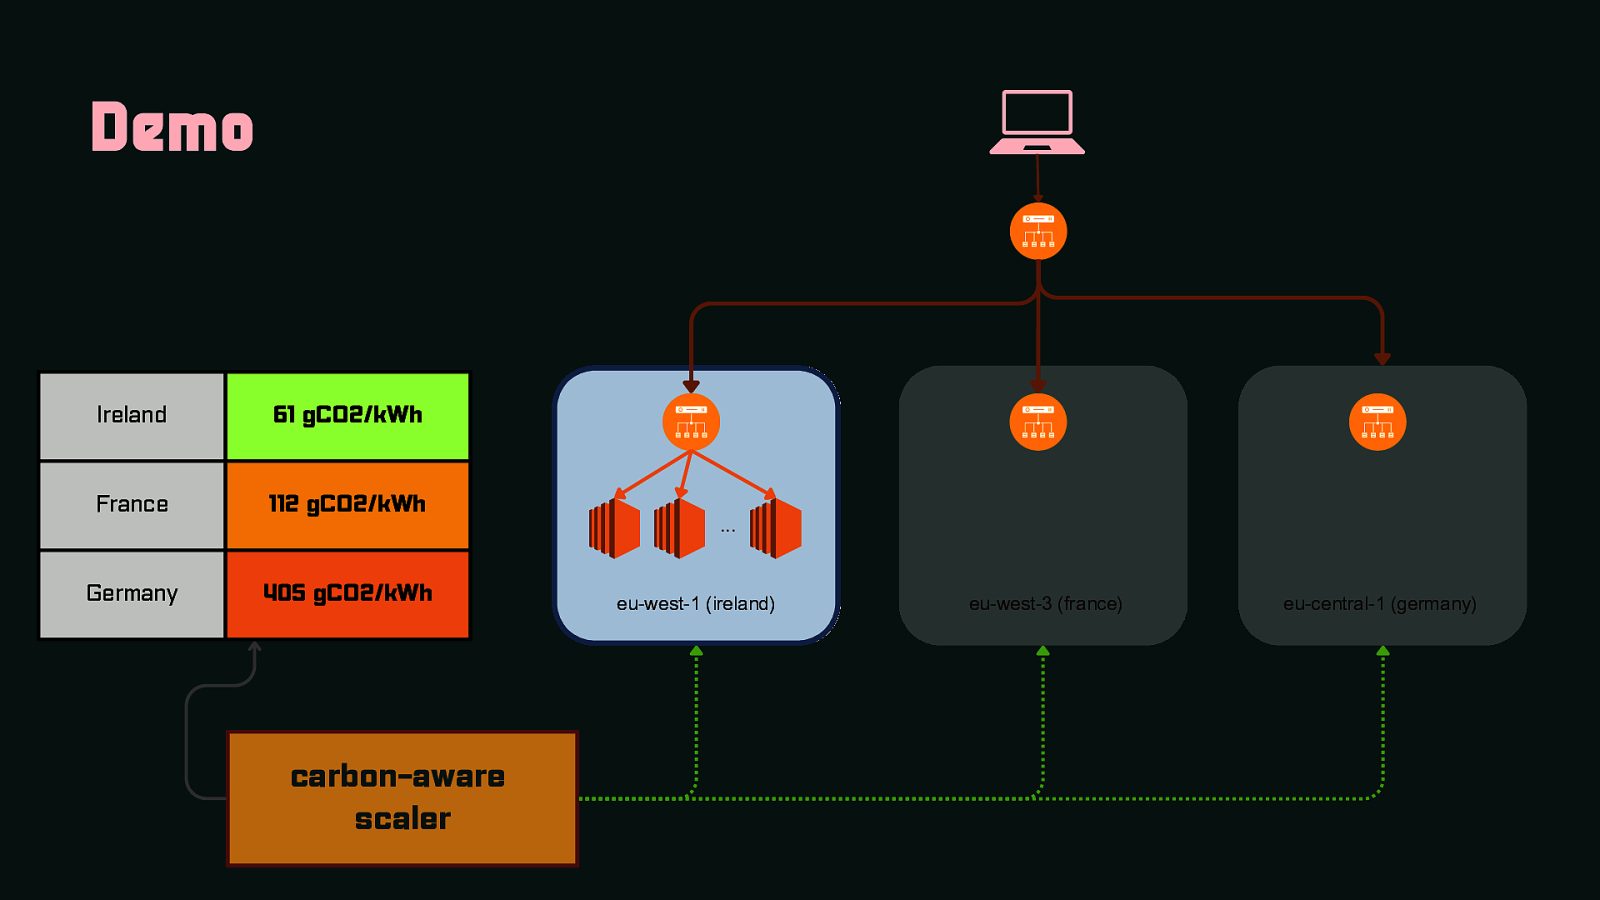
Demo Ireland 61 gCO2/kWh France 112 gCO2/kWh Germany 405 gCO2/kWh carbon-aware scaler … eu-west-1 (ireland) eu-west-3 (france) eu-central-1 (germany)
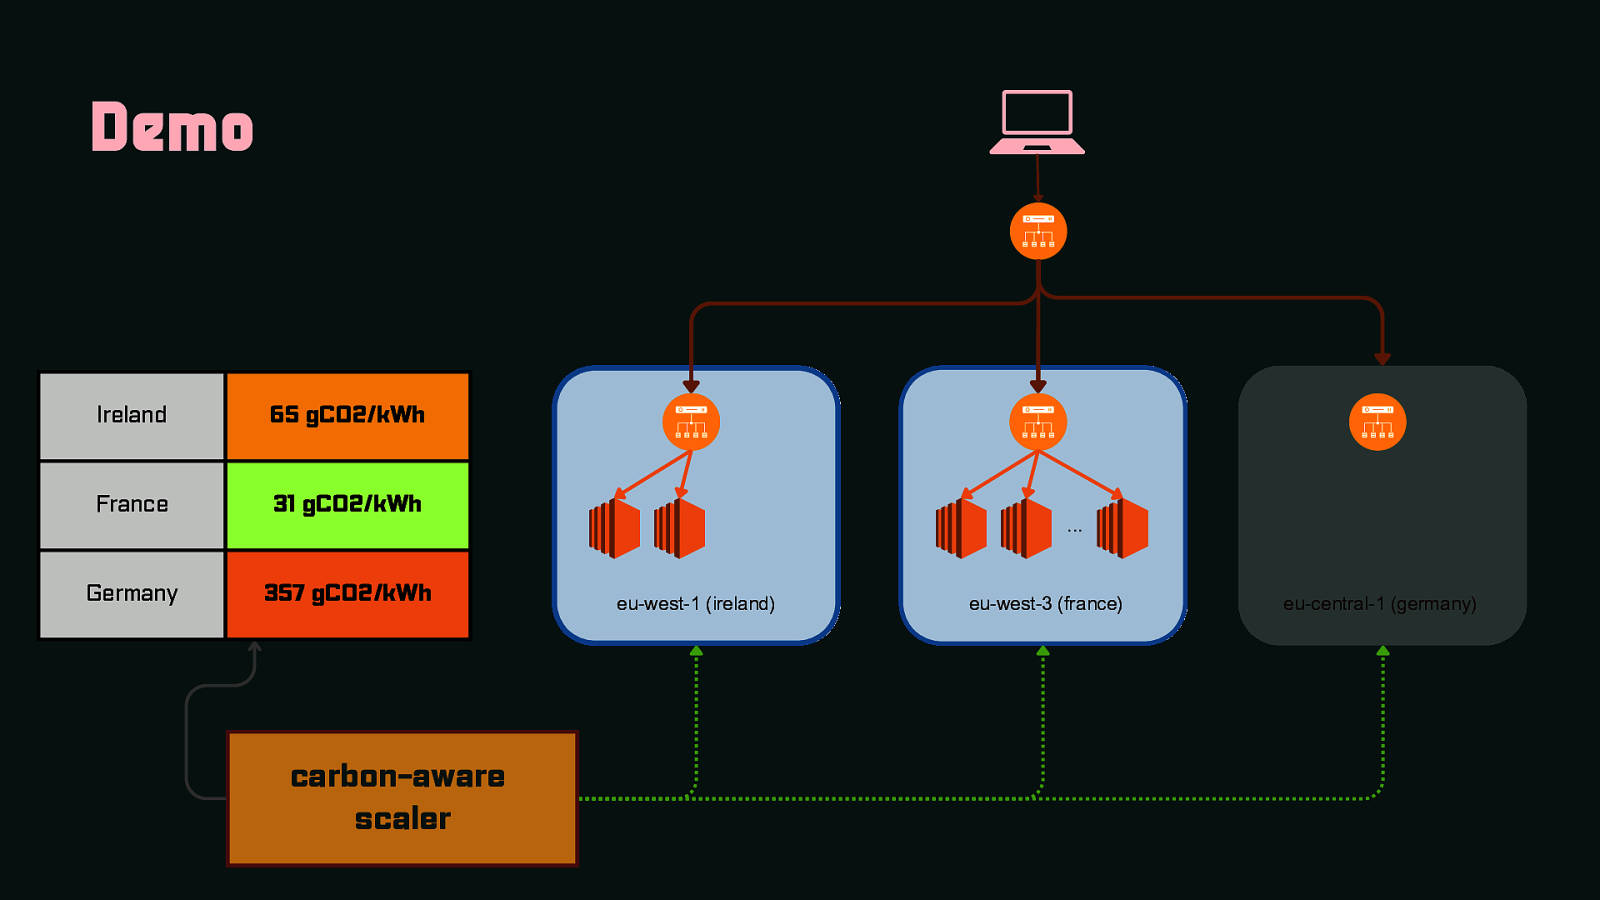
Demo Ireland 65 gCO2/kWh France 31 gCO2/kWh Germany 357 gCO2/kWh carbon-aware scaler … eu-west-1 (ireland) eu-west-3 (france) eu-central-1 (germany)
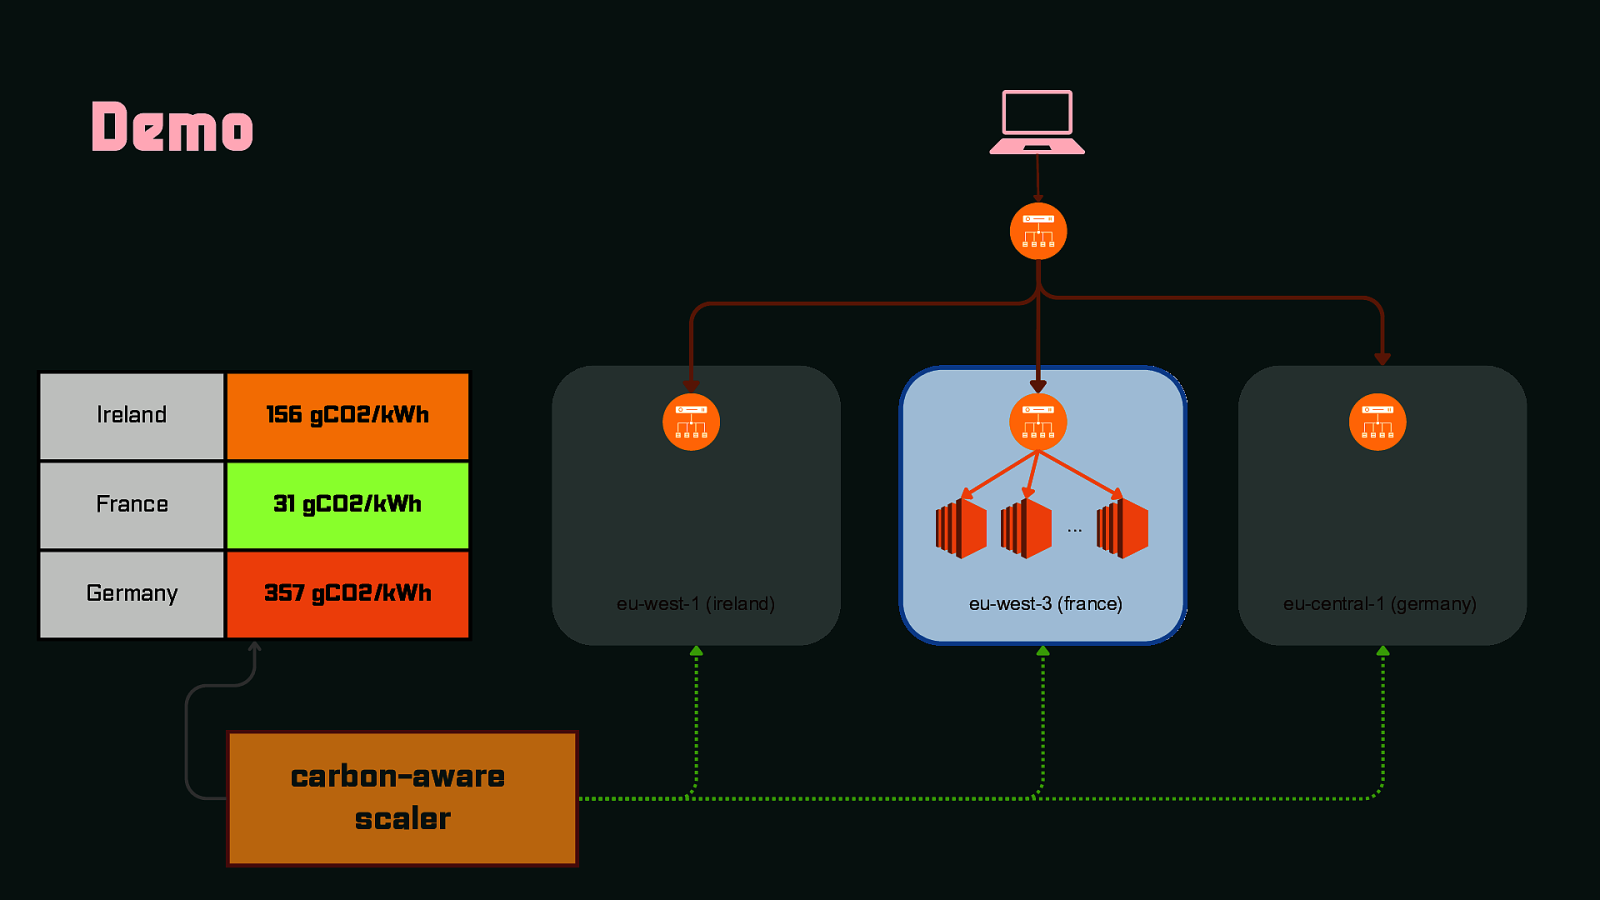
Demo Ireland 156 gCO2/kWh France 31 gCO2/kWh Germany 357 gCO2/kWh carbon-aware scaler … eu-west-1 (ireland) eu-west-3 (france) eu-central-1 (germany)
Demo
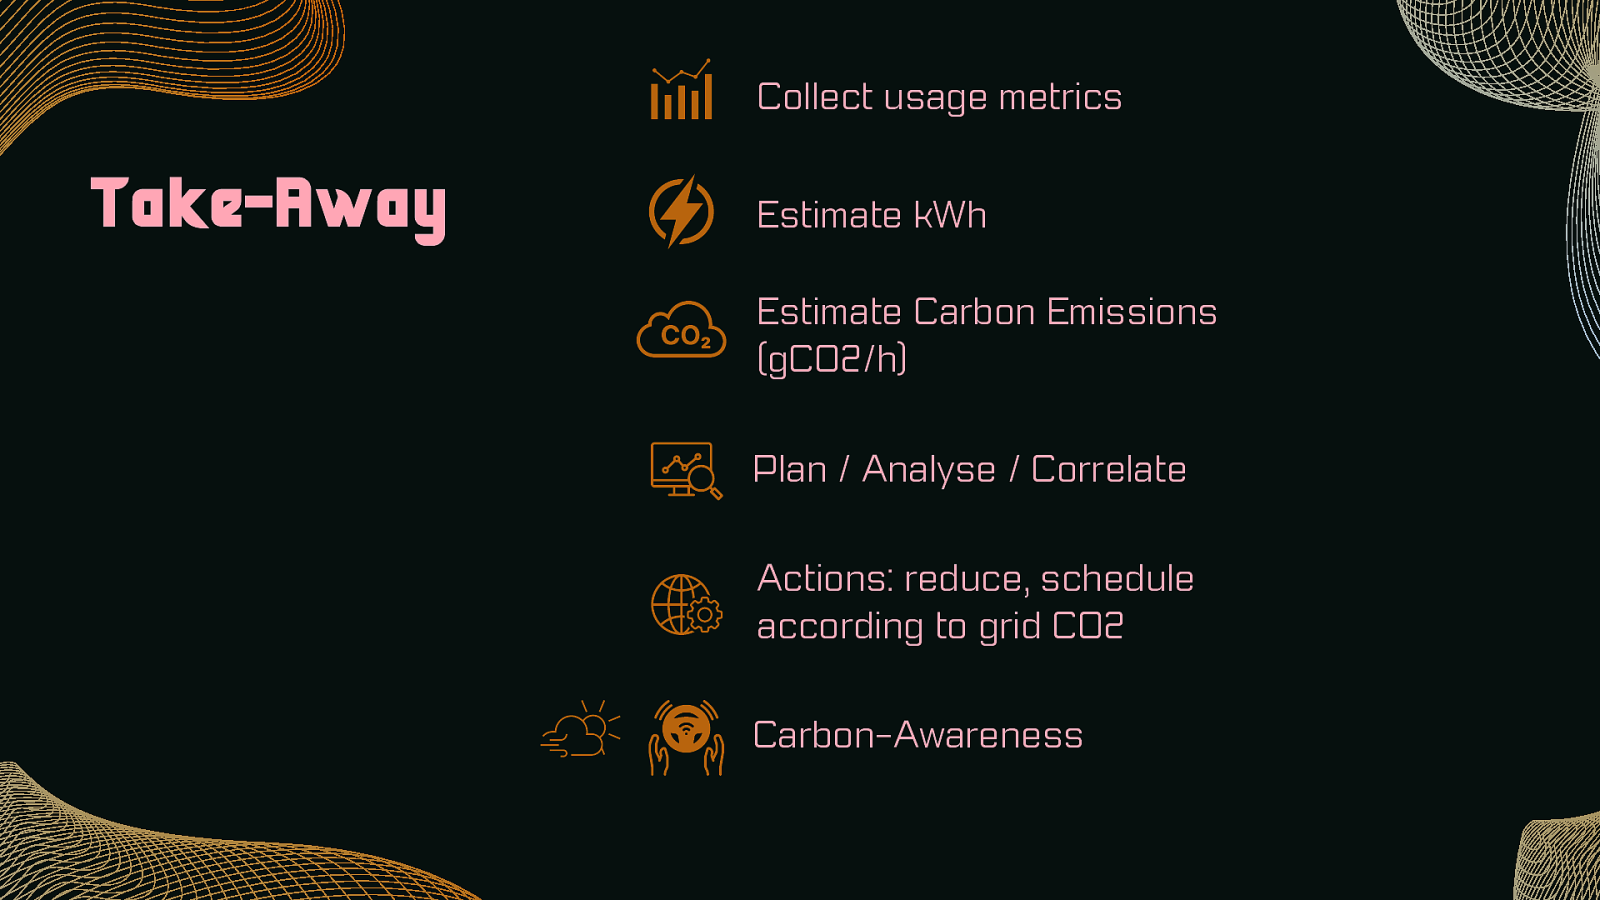
Collect usage metrics Take-Away Estimate kWh Estimate Carbon Emissions (gCO2/h) Plan / Analyse / Correlate Actions: reduce, schedule according to grid CO2 Carbon-Awareness
Thank you Green Software Foundation Carbon Aware Cloud olivier@carbonifer.io @obierlaire Environment Variables