Style Recalculation Secrets They Don’t Want You To Know Patrick Brosset – CSS Day – June 2023 1

A presentation at CSS Day in June 2023 in Amsterdam, Netherlands by Patrick Brosset
Style Recalculation Secrets They Don’t Want You To Know Patrick Brosset – CSS Day – June 2023 1

Chapter 1 CSS Selector performance doesn’t matter Chapter 1. This is a talk about CSS selector performance. But to start, let’s immediately say that CSS selector perf doesn’t matter … Next slide … 2
Chapter 1 CSS Selector performance doesn’t matter … in most cases anyway In most cases anyway 3
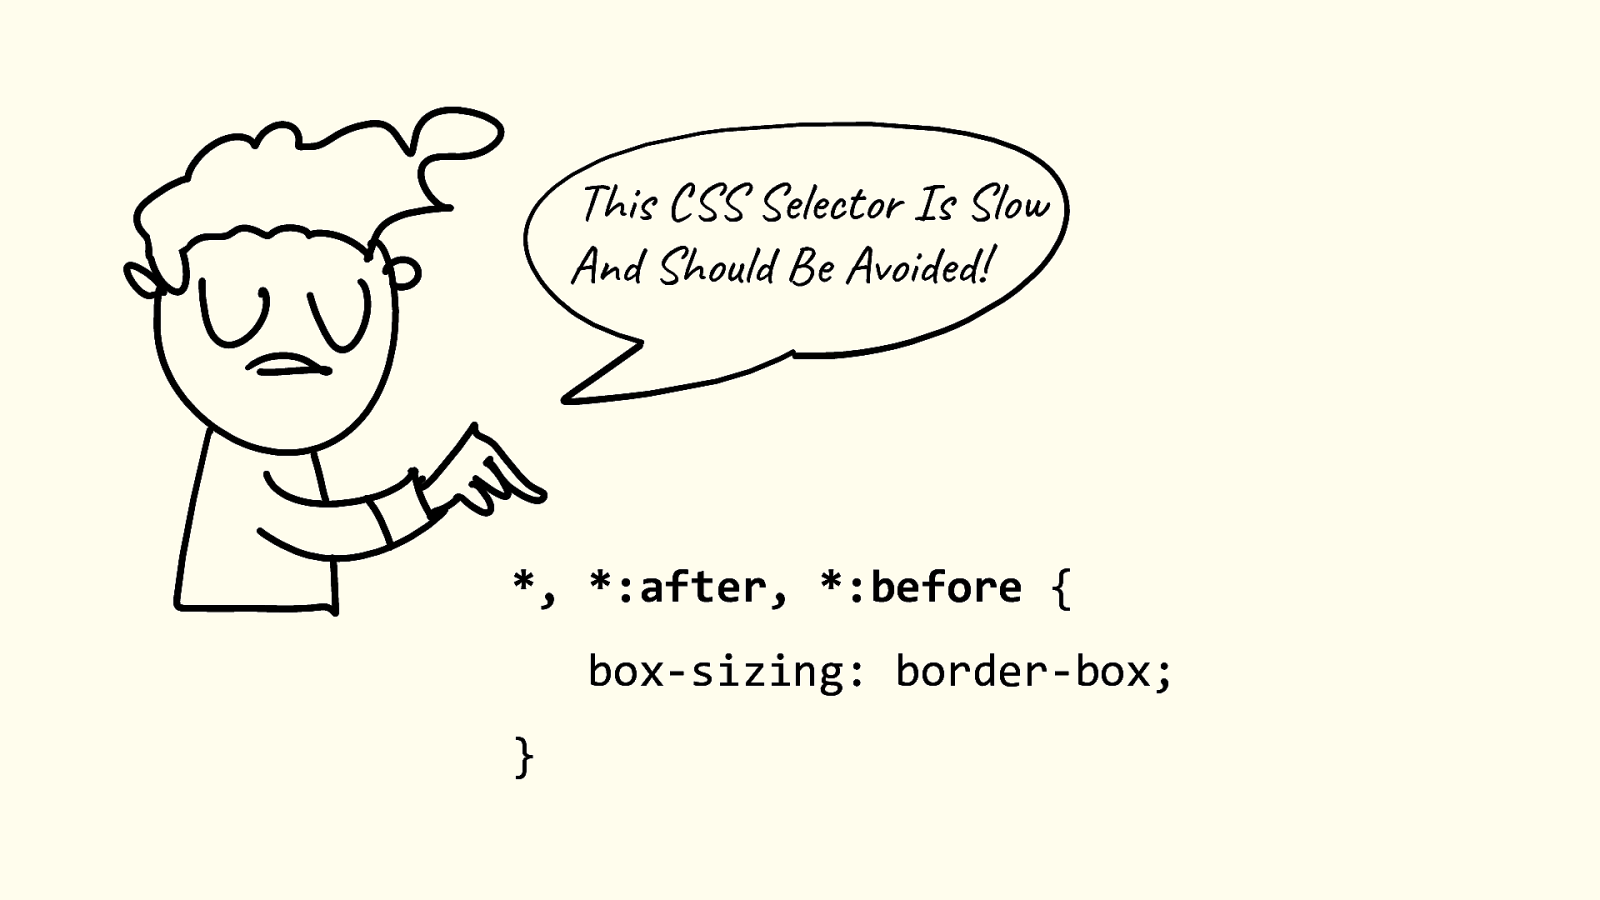
This CSS Selector Is Slow And Should Be Avoided! *, *:after, *:before { box-sizing: border-box; } *, *:after, *:before { box-sizing:border-box; } The * Selector Is Slow And Should Be Avoided Have you heard this? 4
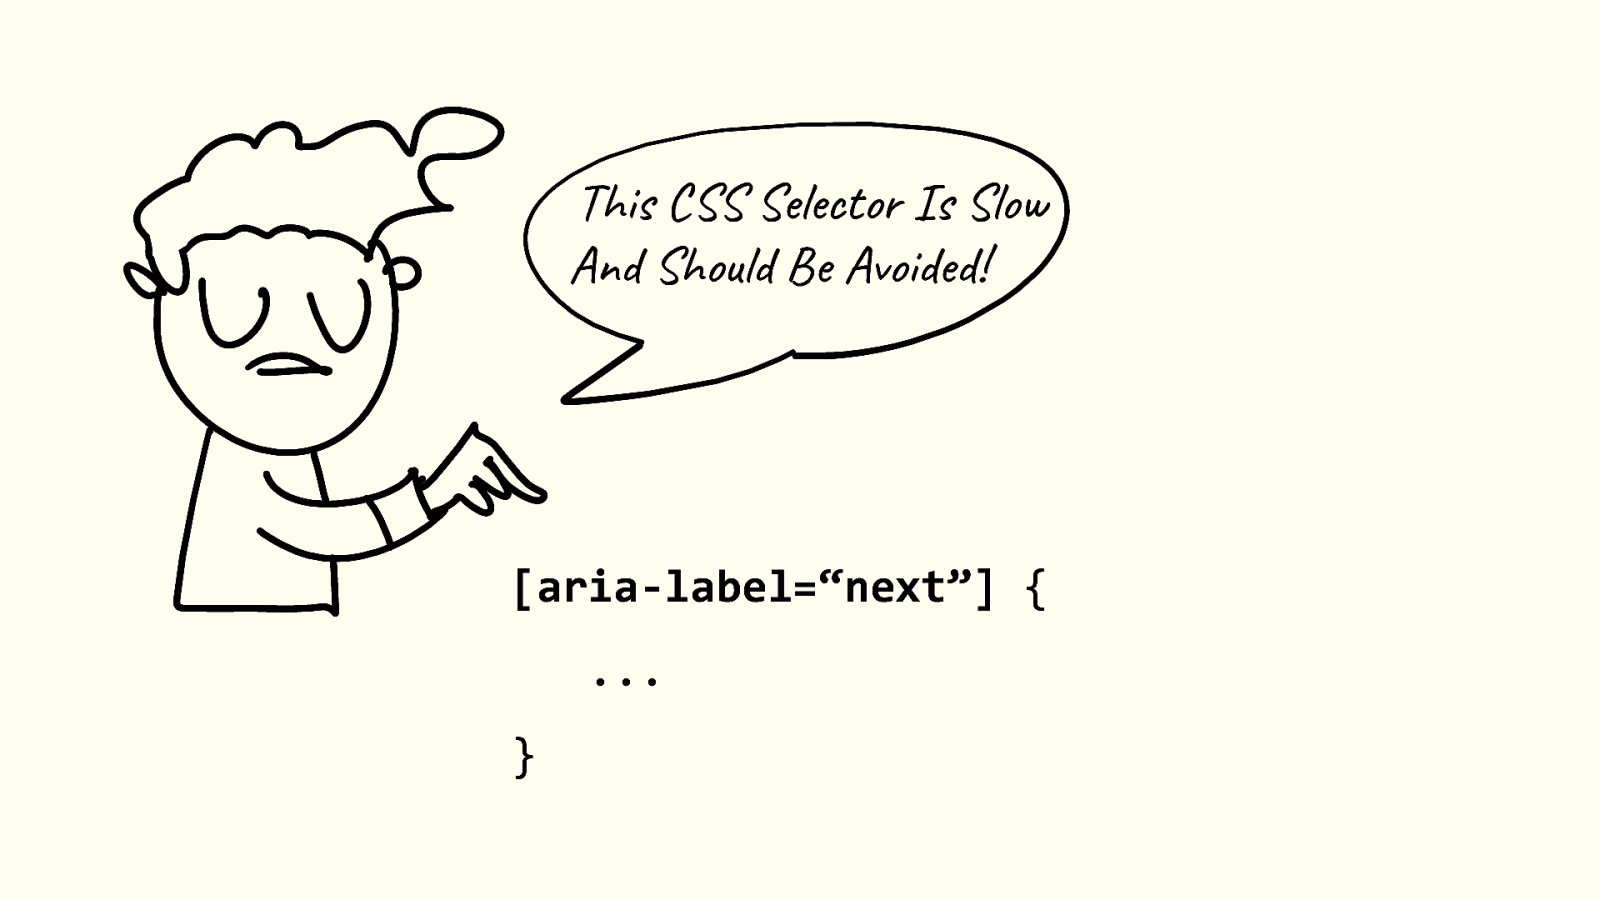
This CSS Selector Is Slow And Should Be Avoided! [aria-label=“next”] { … } Maybe you’ve heard this? That the attribute selector does not perform as well as class selectors. 5
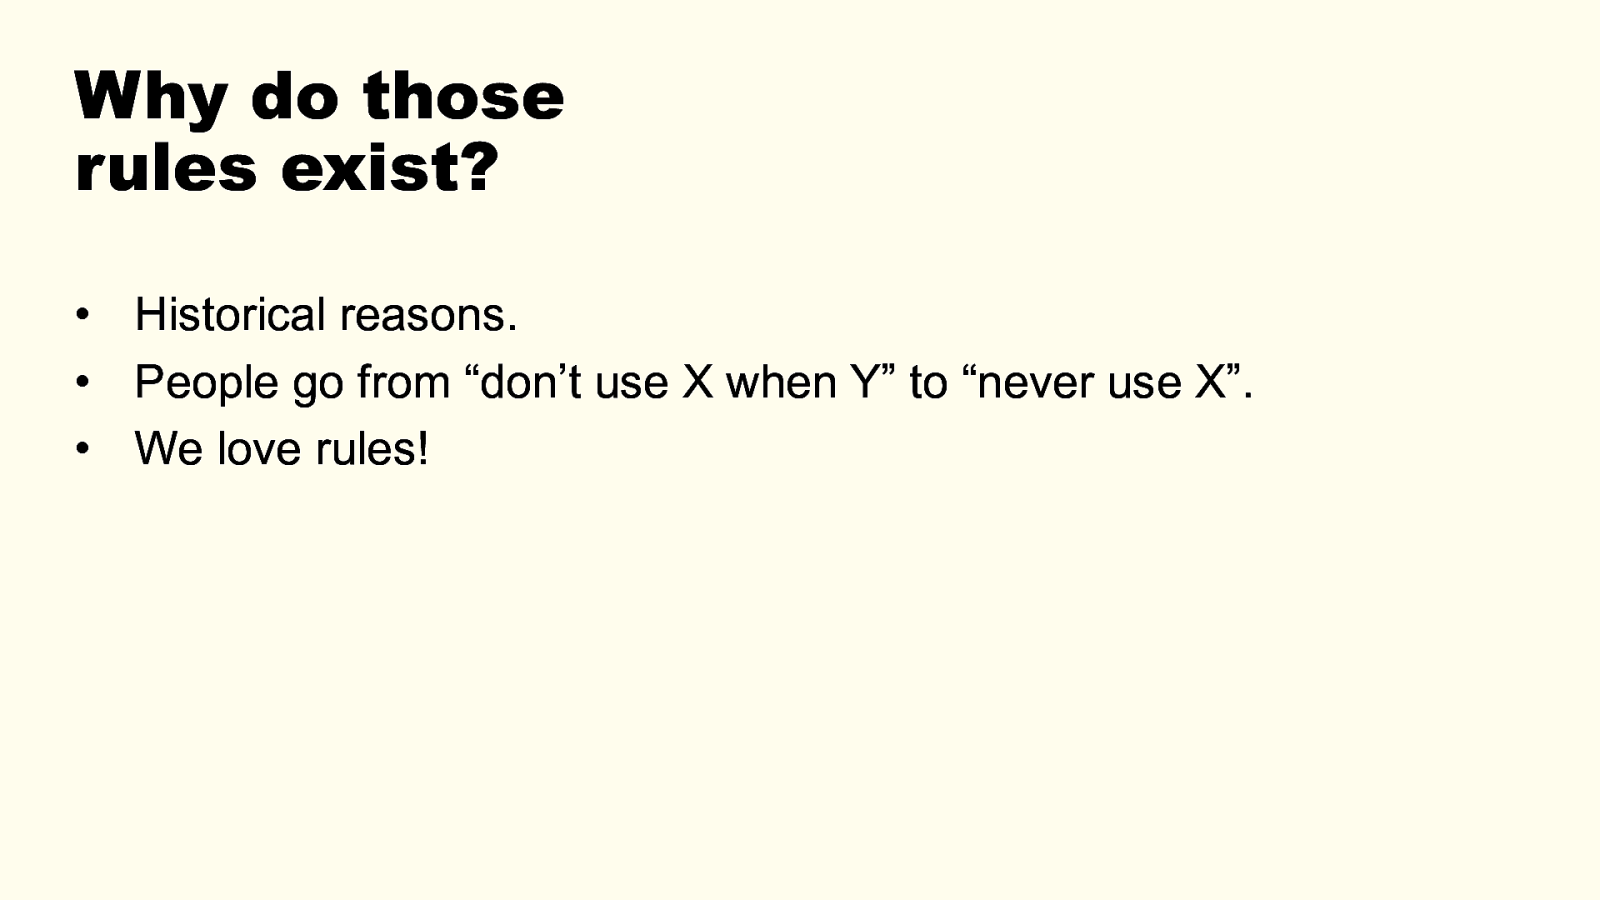
Why do those rules exist? • Historical reasons. • People go from “don’t use X when Y” to “never use X”. • We love rules! Some reasons why these sort of rules have - They might have been true in earlier implementations of browser engines. - People tend to go from “don’t do X in case of Y” to “never do X”. - We tend to love rules, they make working on a codebase easier. 6
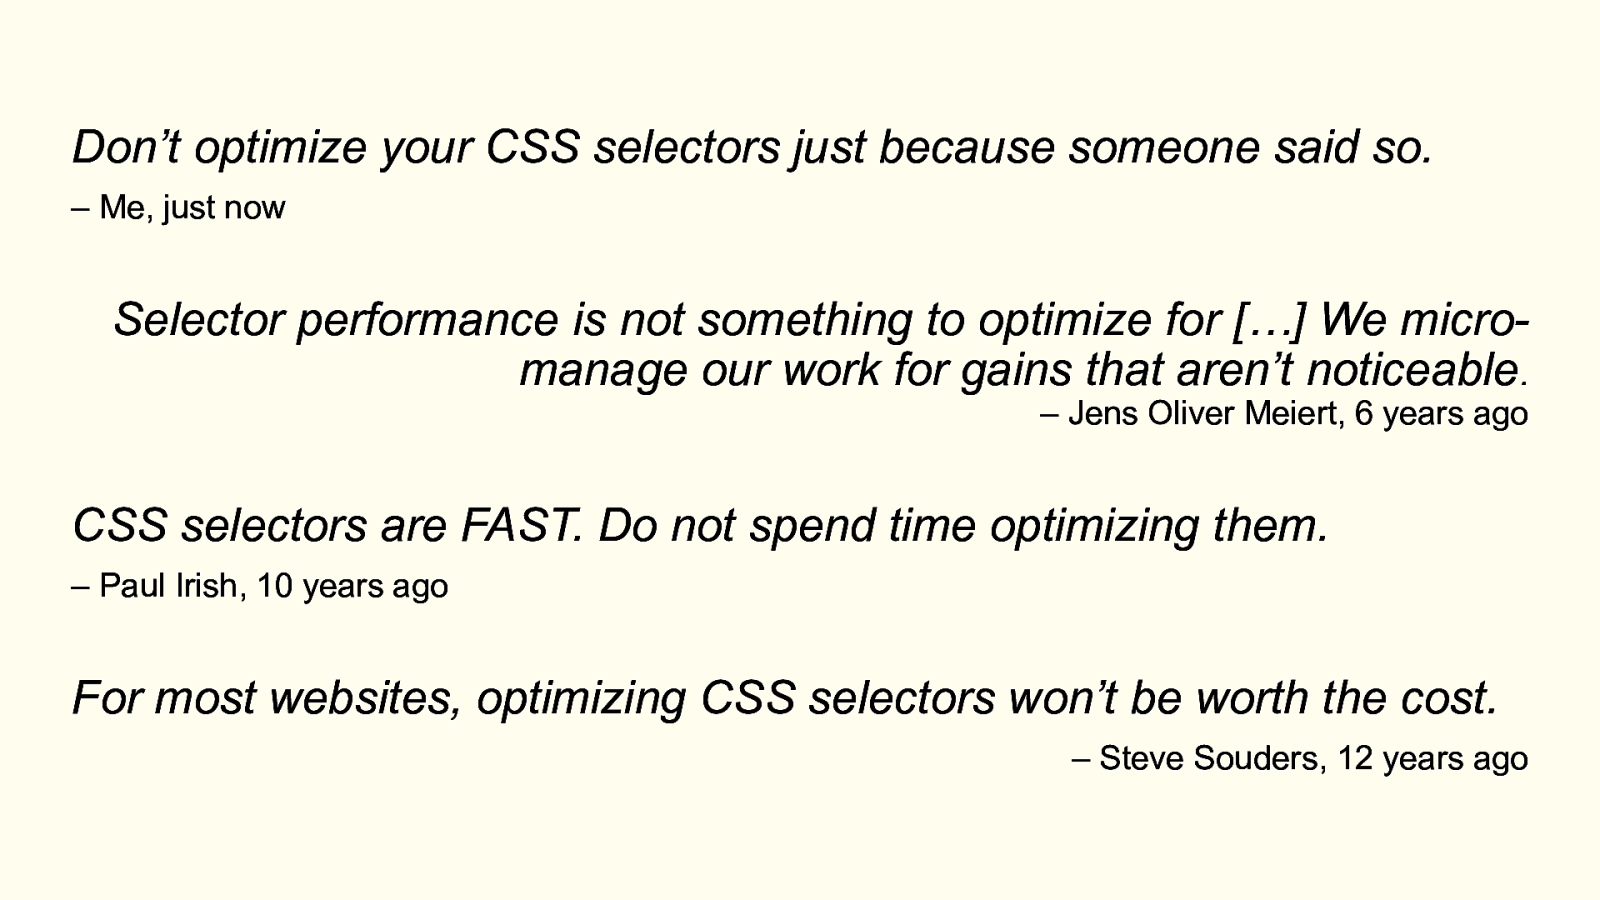
Don’t optimize your CSS selectors just because someone said so. – Me, just now Selector performance is not something to optimize for […] We micromanage our work for gains that aren’t noticeable. – Jens Oliver Meiert, 6 years ago CSS selectors are FAST. Do not spend time optimizing them. – Paul Irish, 10 years ago For most websites, optimizing CSS selectors won’t be worth the cost. – Steve Souders, 12 years ago If you’ve heard this and still believe it, let me offer some quotes from some famous people: Steve Souders, Paul Irish, Jens Oliver Meiert, … If you’re in the business of optimizing your app or site, it’s almost guaranteed that there are better things for you to focus on than css selectors. Things that would lead to much bigger gains. So, an important thing to take away from this talk: don’t optimize your css selectors just because someone, somewhere, said that selector X was slow. 7
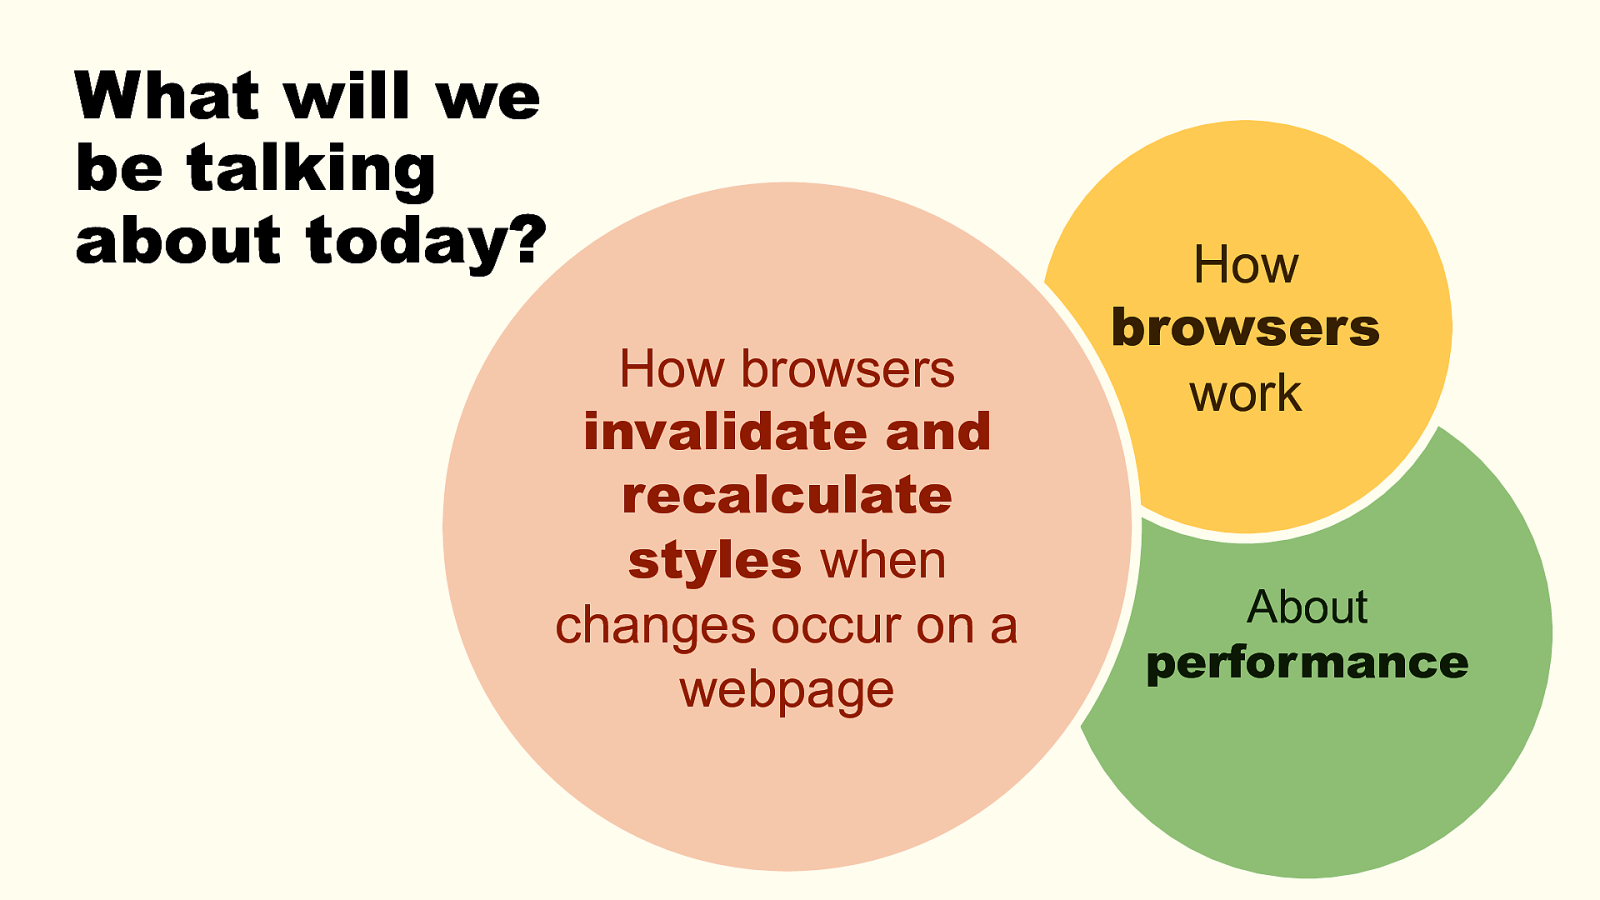
What will we be talking about today? How browsers invalidate and recalculate styles when changes occur on a webpage How browsers work About performance Invalidation and Recalculation of styles when changes occur on a webpage. I’ll go into a lot of details about how this works in browsers today. I’ll also tell you a story about a performance problem we faced, at work, related to this. And finally, I’ll share a way to think about this and attack similar problems if you ever face them. If you work on complicated web apps or sites where a lot DOM, CSS, and JS work together to create the final UI, or if you work on a design system that comes with a big CSS library that’s reused over and over again, there are some things in this talk you’ll want to keep in mind. So, with that, let’s get started! 8

Chapter 2 Information overload Q: how many of you have looked into how browsers react to changes on a page and display these changes? Raise your hand. Few hands: Ok, well, I’m not surprised. I’ve worked in browsers teams for years, but had never looked myself until late last year. Many hands: Ok, well, I’m impressed. This is a very technical crowd. I’ll try to keep it interesting for you. There are many many things a browser does, but in this talk we’ll only look at a specific scenario. 9
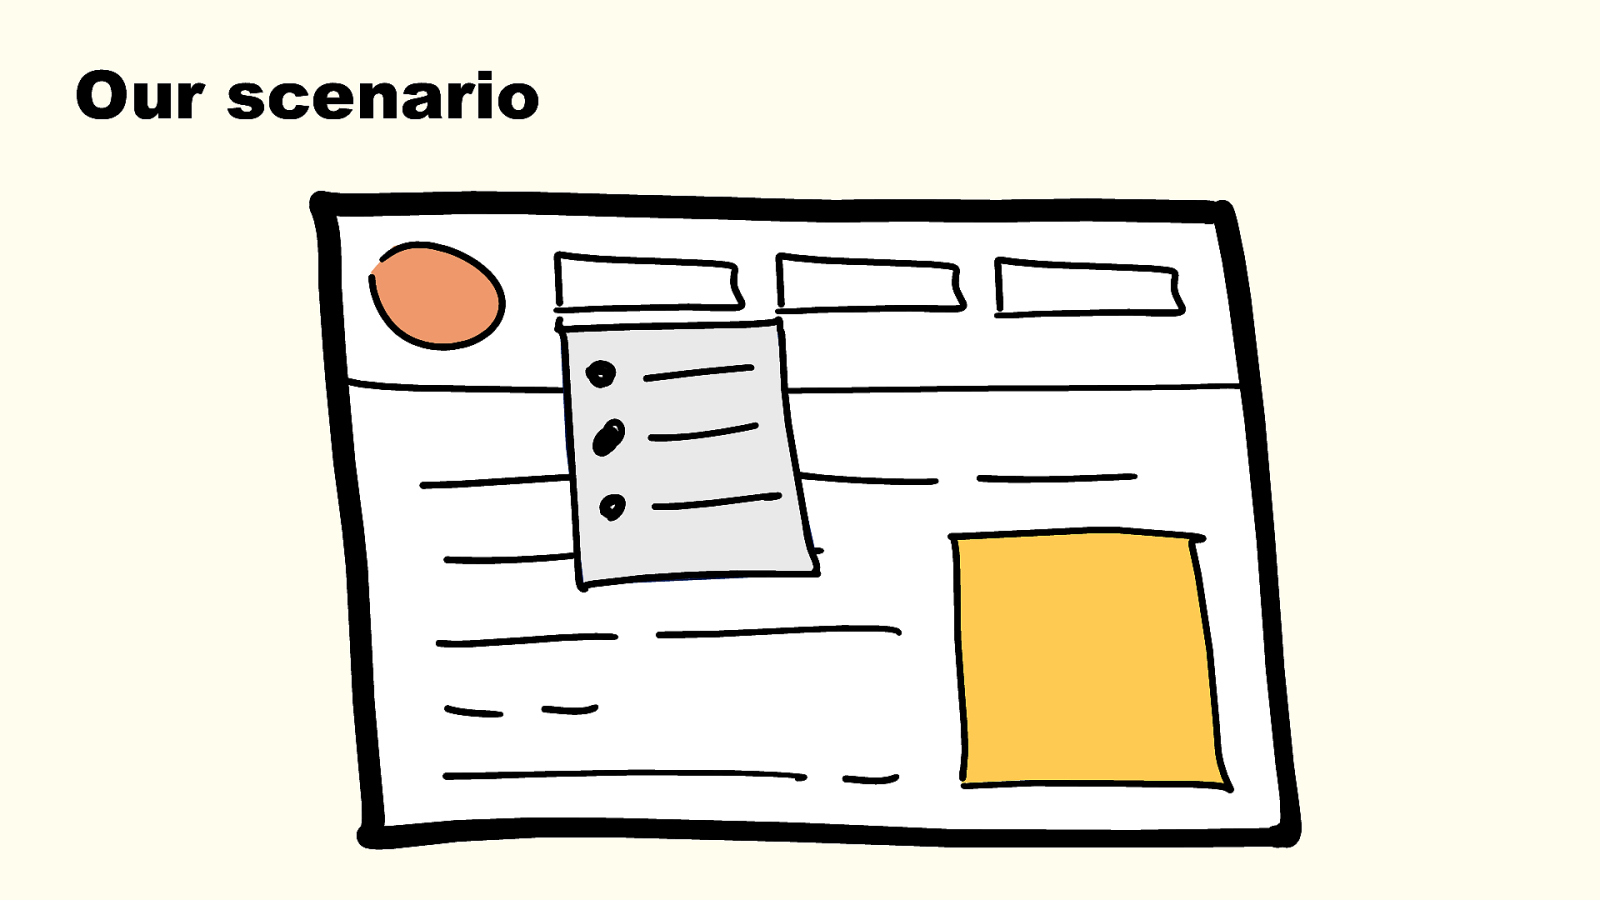
Our scenario Page is loaded JS comes in and a DOM mutation occurs. Page displays the change. Not interested in what happens before when the page loads. Focusing specifically on this change. 10
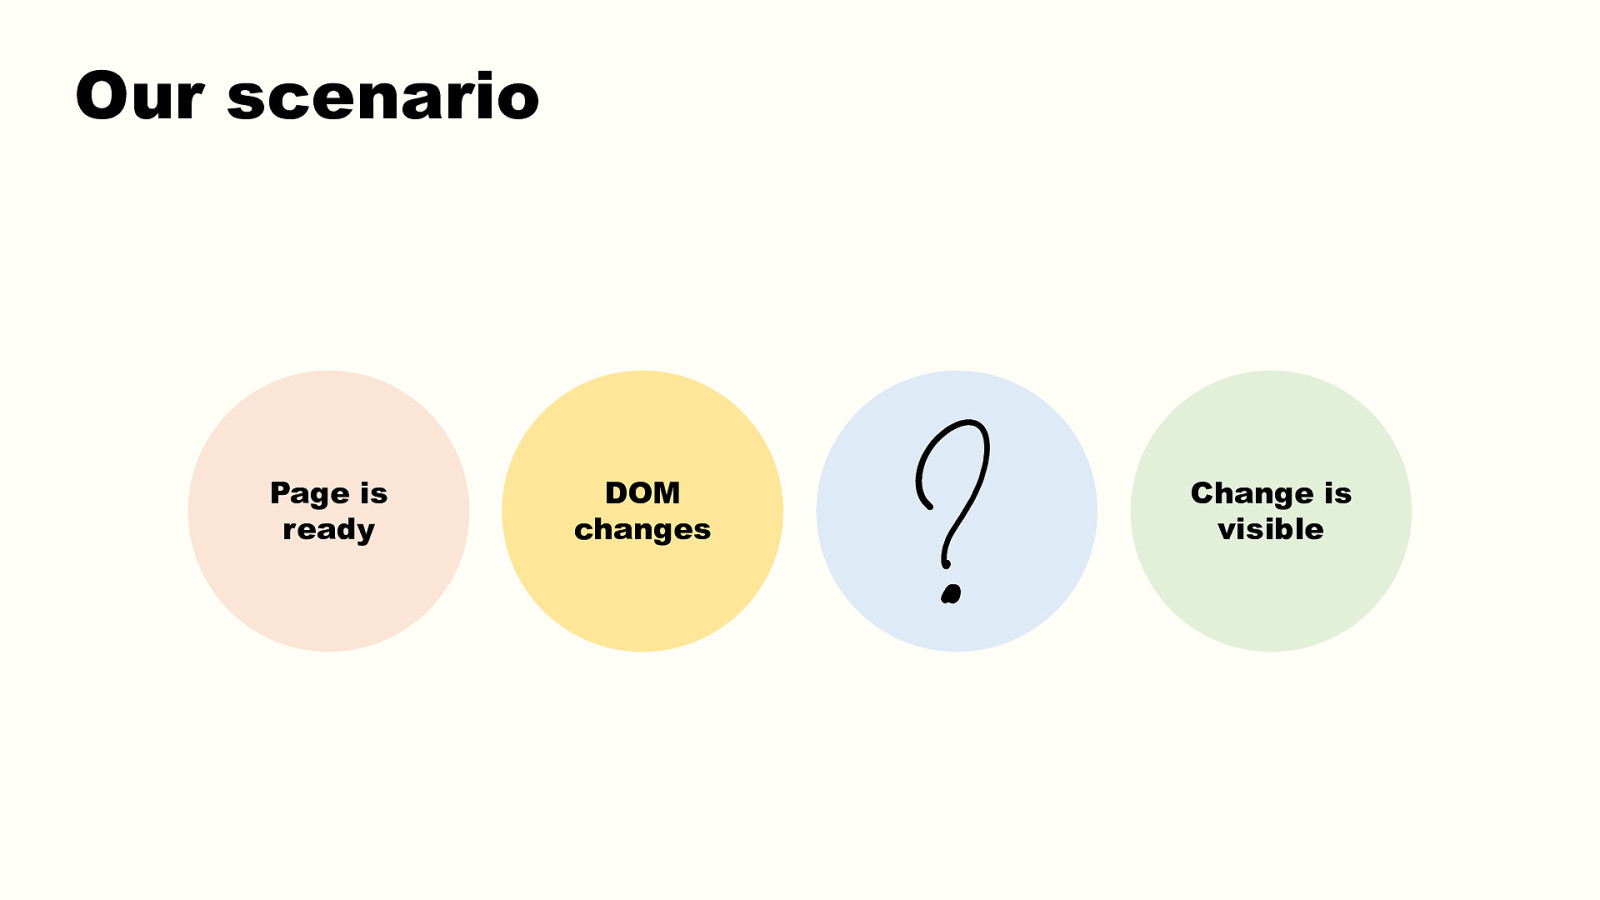
Our scenario Page is ready DOM changes Change is visible Page ready —> Dom mutates —> ??? —> Page has changed What happens in this middle box? Well, a lot of things happen. 11
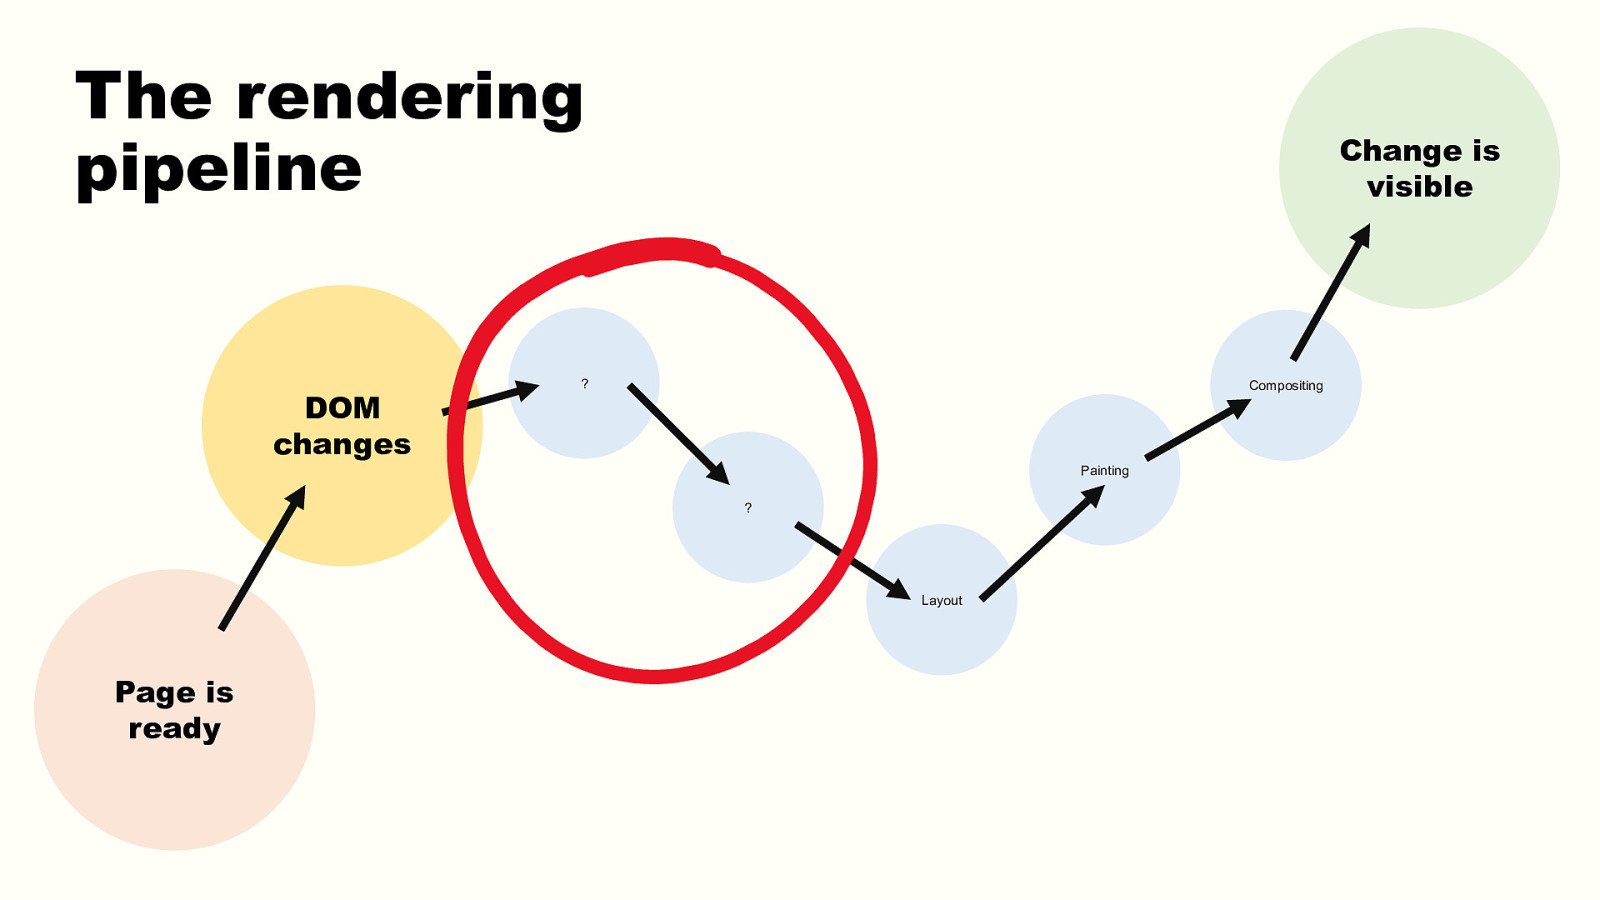
The rendering pipeline DOM changes Change is visible ? Compositing Painting ? Layout Page is ready Well, we know that at some point the new layout will need to be calculated. That’s when the browser engine figures out exactly where and how big everything is. And after that the browser graphics engine needs to paint everything to the screen. This usually happens in 2 steps, painting = translating the layout and style into pixels, and compositing, for when the page is split into multiple independent layers that can get re-painted separately. But what needs to happen before is what we’ll be talking about in this talk. 12
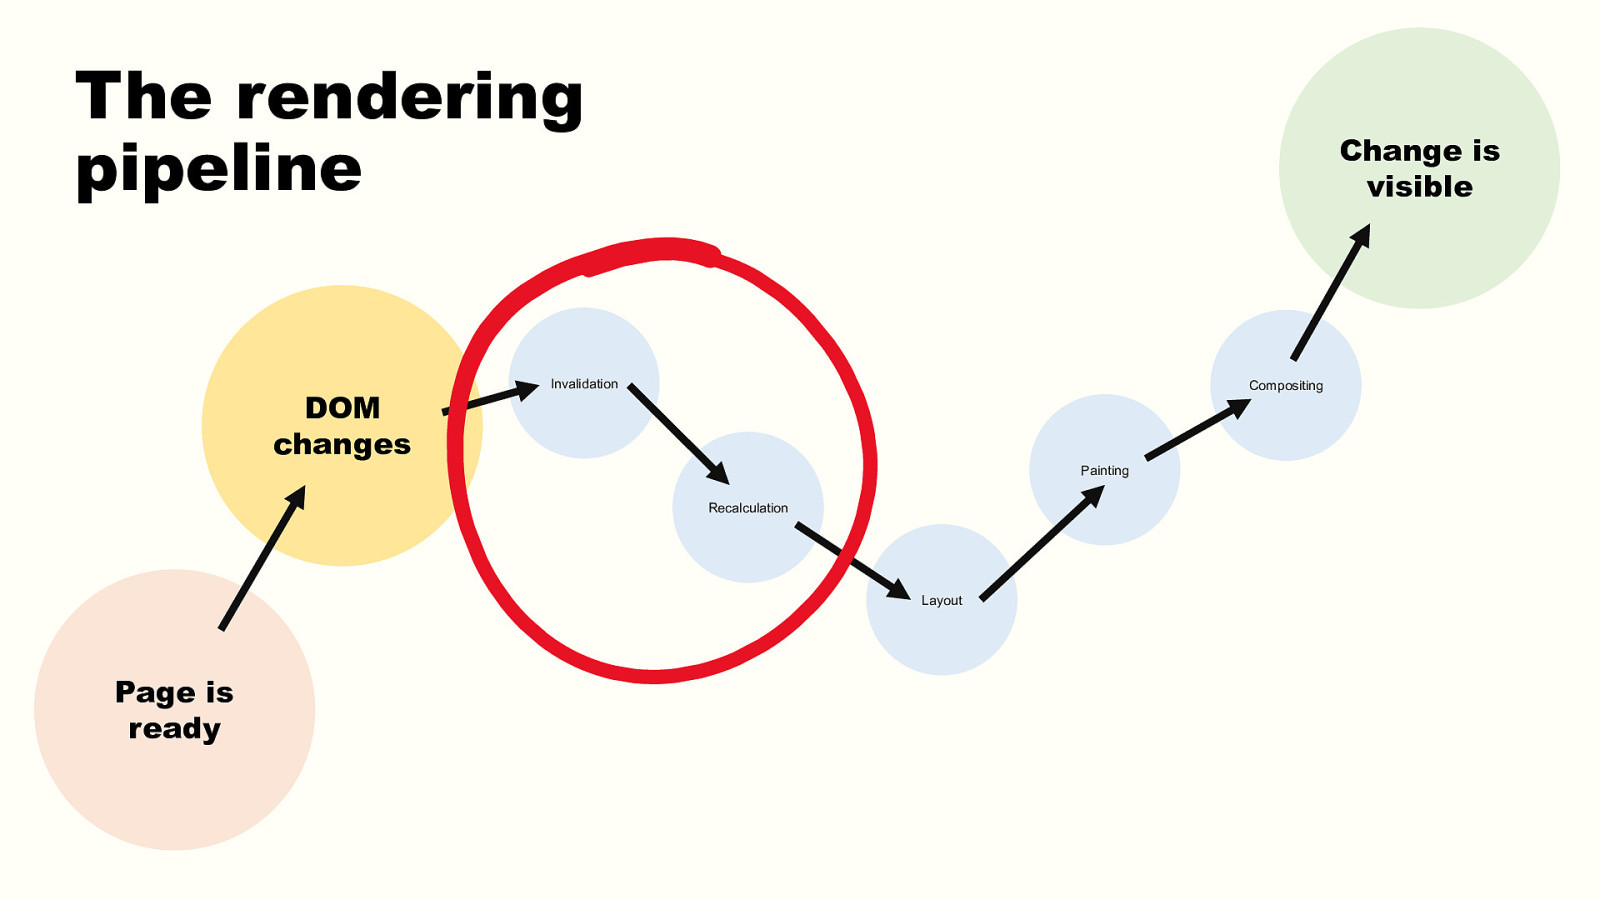
The rendering pipeline DOM changes Change is visible Invalidation Compositing Painting Recalculation Layout Page is ready Input: the DOM and CSSOM trees and a DOM mutation. -> invalidation Output: list of DOM nodes that are now invalid -> recalculation Output: A new render tree. Data structure representing the final computed styles for elements that should be visible. -> layout output: A new layout tree, with information about where everything goes, and how big everything is. -> Painting Output: pixels, possibly in several layers -> Compositing Output: final pixels on the screen But today, we’re only looking at the invalidation and recalculation steps of the process. 13
Invalidation?
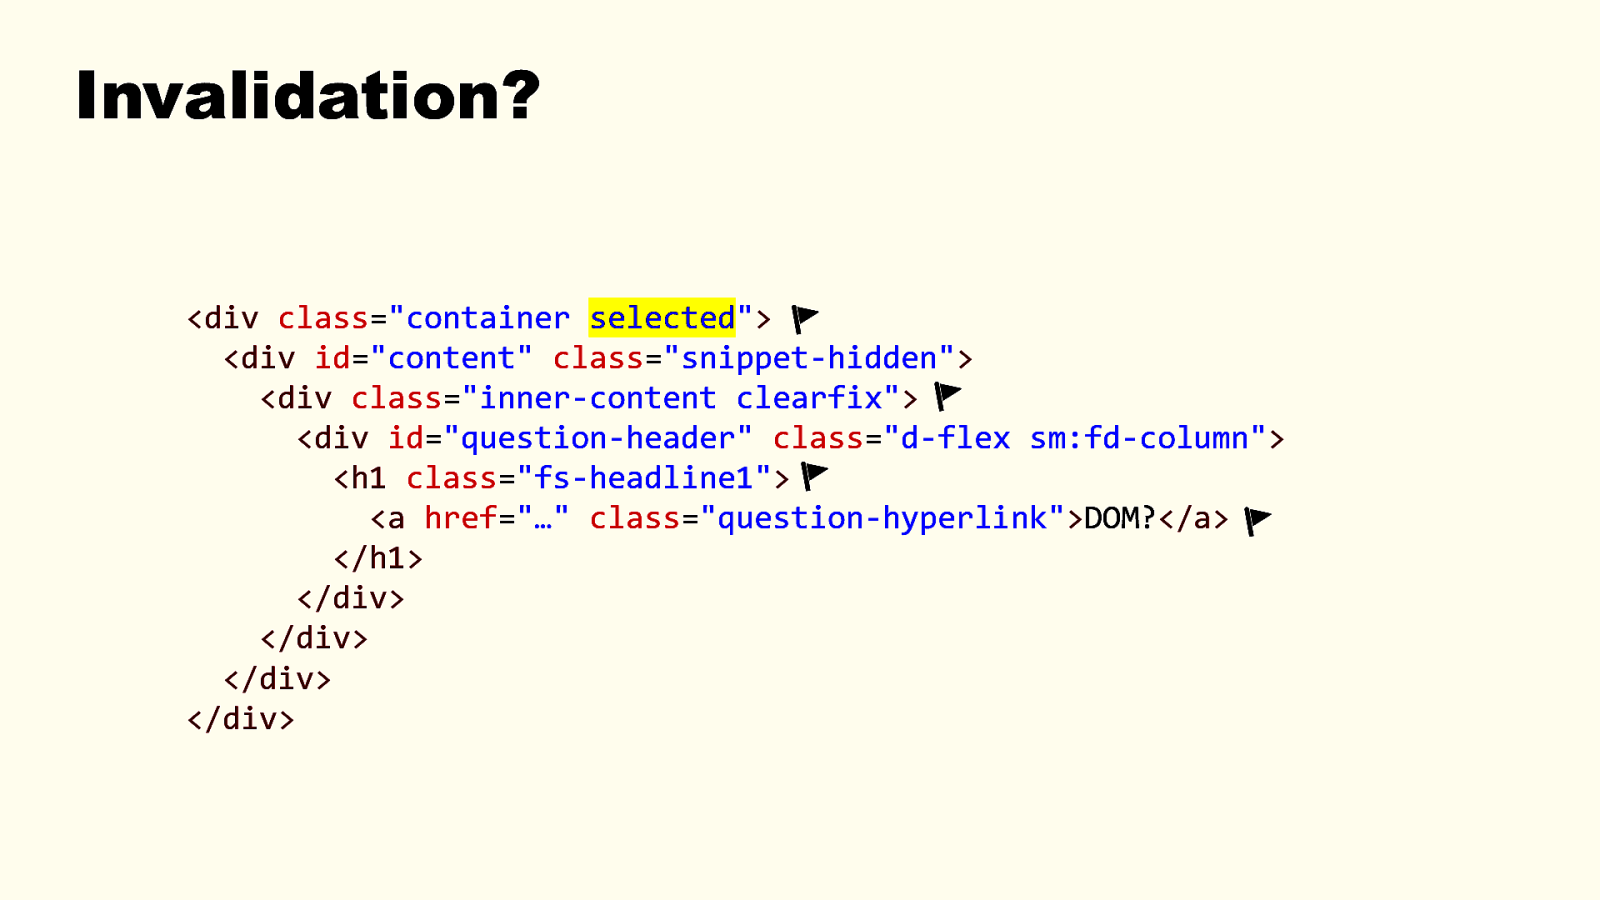
<div class=”container selected”> class=”container”> <div id=”content” class=”snippet-hidden”> <div class=”inner-content clearfix”> <div id=”question-header” class=”d-flex sm:fd-column”> <h1 class=”fs-headline1”> <a href=”…” class=”question-hyperlink”>DOM?</a> </h1> </div> </div> </div> </div> So what does invalidation mean? The process of setting flags on elements to signal that their styles are now invalid. Why invalid then? Well, a DOM mutation occurred, for example: a class was added on an element, or an element was added. That means CSS may now apply differently to the page. What applied to some elements before may now apply to other elements. 14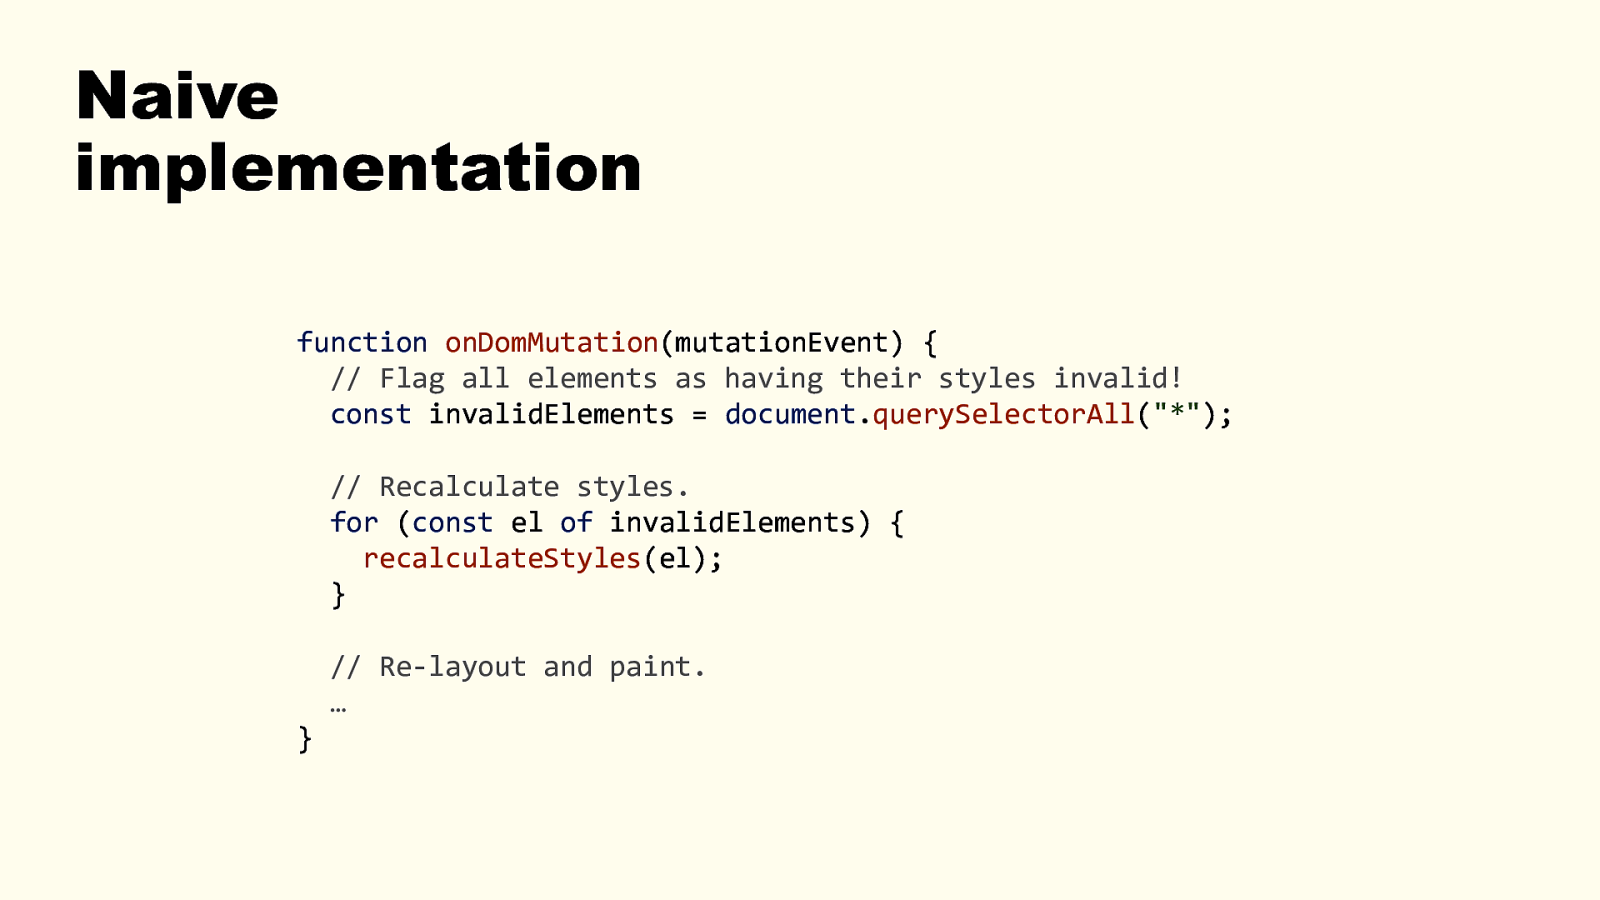
Naive implementation function onDomMutation(mutationEvent) { // Flag all elements as having their styles invalid! const invalidElements = document.querySelectorAll(“*”); // Recalculate styles. for (const el of invalidElements) { recalculateStyles(el); } // Re-layout and paint. … } What would a super naive way to recalculate styles be? - DOM mutation occurs - Consider all DOM elements as needing to be restyled. Simple, no need for anything complex. - And then, for each and every element, throw away everything we had from before, look for the css rules that apply to it, including inherited styles, etc. and resolve the computed styles. brute force approach is to recalculate all elements, worst-case scenario. That requires no knowledge about the CSS selectors that apply in a given document. This would work, and not long ago this essentially how browsers worked. 15
But we can already see that, with today’s web, this would perform poorly: - Time needed to loop over all nodes. - Time needed to recalculate all styles. Today’s apps are big and complex and tend to change often. 15
Real implementation In the real world, in blink only (but all browser engines have optimizations in place for this) (even if we’ll go into technical details that only apply to Blink, goal of this talk isn’t to remember them, but that they exist, and as we’ll see later, that’s important when it comes to performance considerations) So, in real world, the browser does a lot of work to limit the number of element which styles it recalculates. Even if that’s a lot of work, and a lot of complex code, it’s orders of magnitude faster than recalc’ing everything. Browser engine are very optimized to try to render webpages at 60fps, that means repainting a frame every 16ms. When there’s a lot of JS to execute, and a lot of styles to recalc, that’s not a lot of time. Might as well do as little work as possible. 16
Let’s look at how things actually occur, in Blink. The rendering engine in Chromium. Things don’t happen the same way in other browsers, but they’re likely similar. And, anyway, this stuff keeps changing. First step in Blink creating invalidation sets. This happens on page load, or when stylesheets change. 16
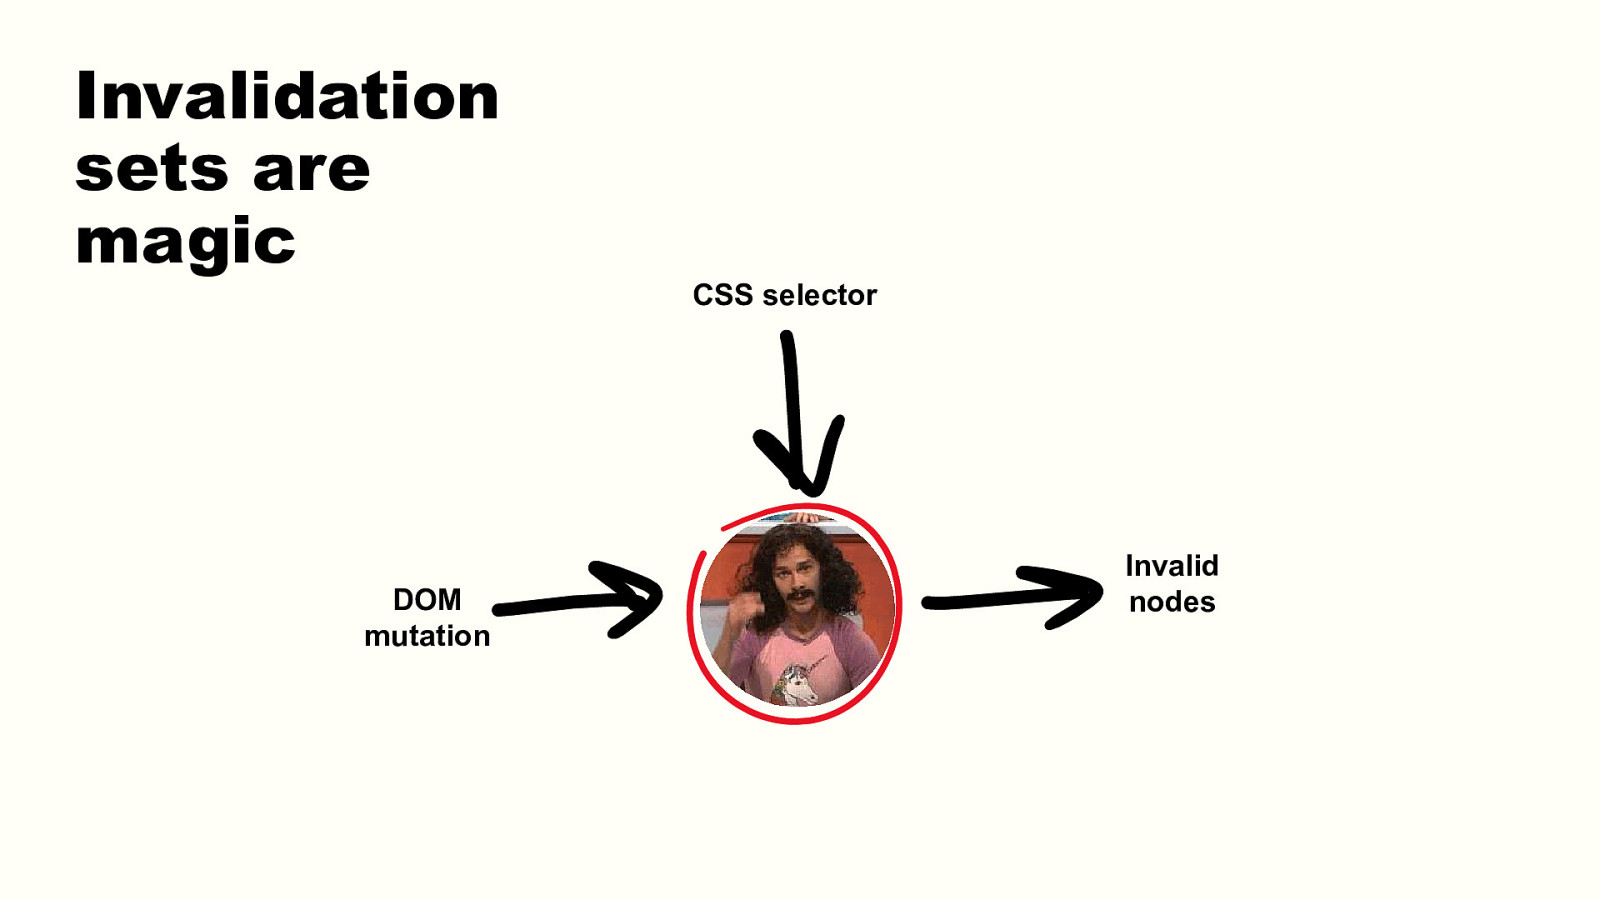
Invalidation sets are magic CSS selector DOM mutation Invalid nodes
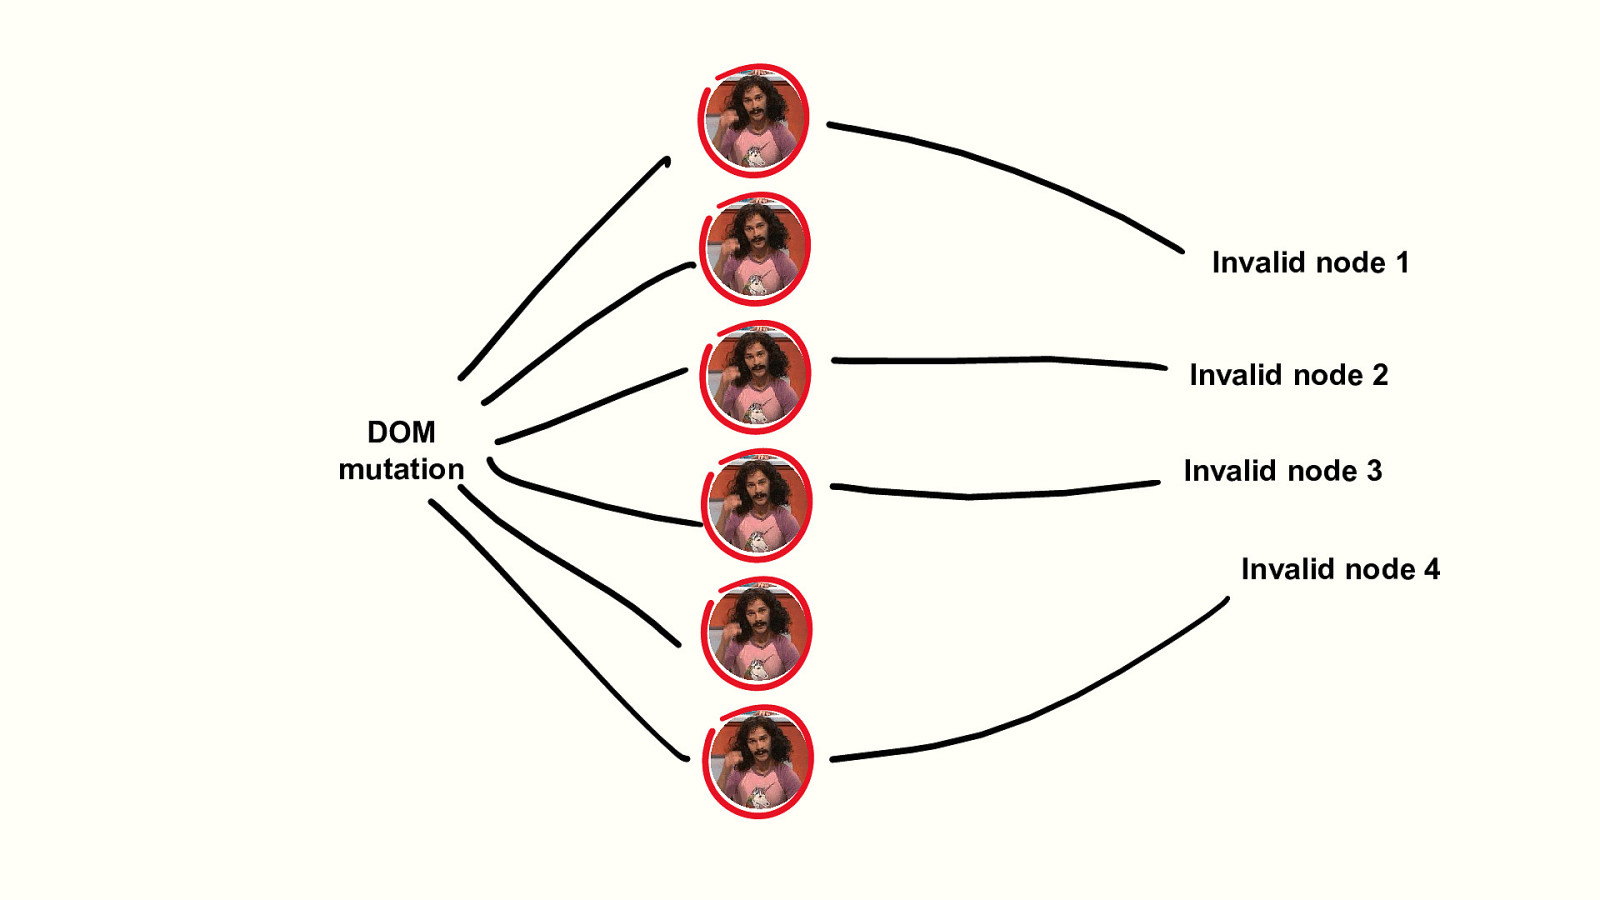
Invalid node 1 Invalid node 2 DOM mutation Invalid node 3 Invalid node 4 So, in the rendering engine, we have many of these sets per page, depending on the CSS rules. Now, their jobs is to be fast and conservative. They’re not meant to always be correct. If they invalidate too many nodes, that’s not a problem. What we don’t want to happen, is to forget to recalculate the style of some elements on the page. But recalculating too many elements is never going to lead to bad results, other than a slower rendering. Even if invalidation sets still give you false positives today, they reduce the number of elements affected drastically. They make the style recalculation step much much faster. 18
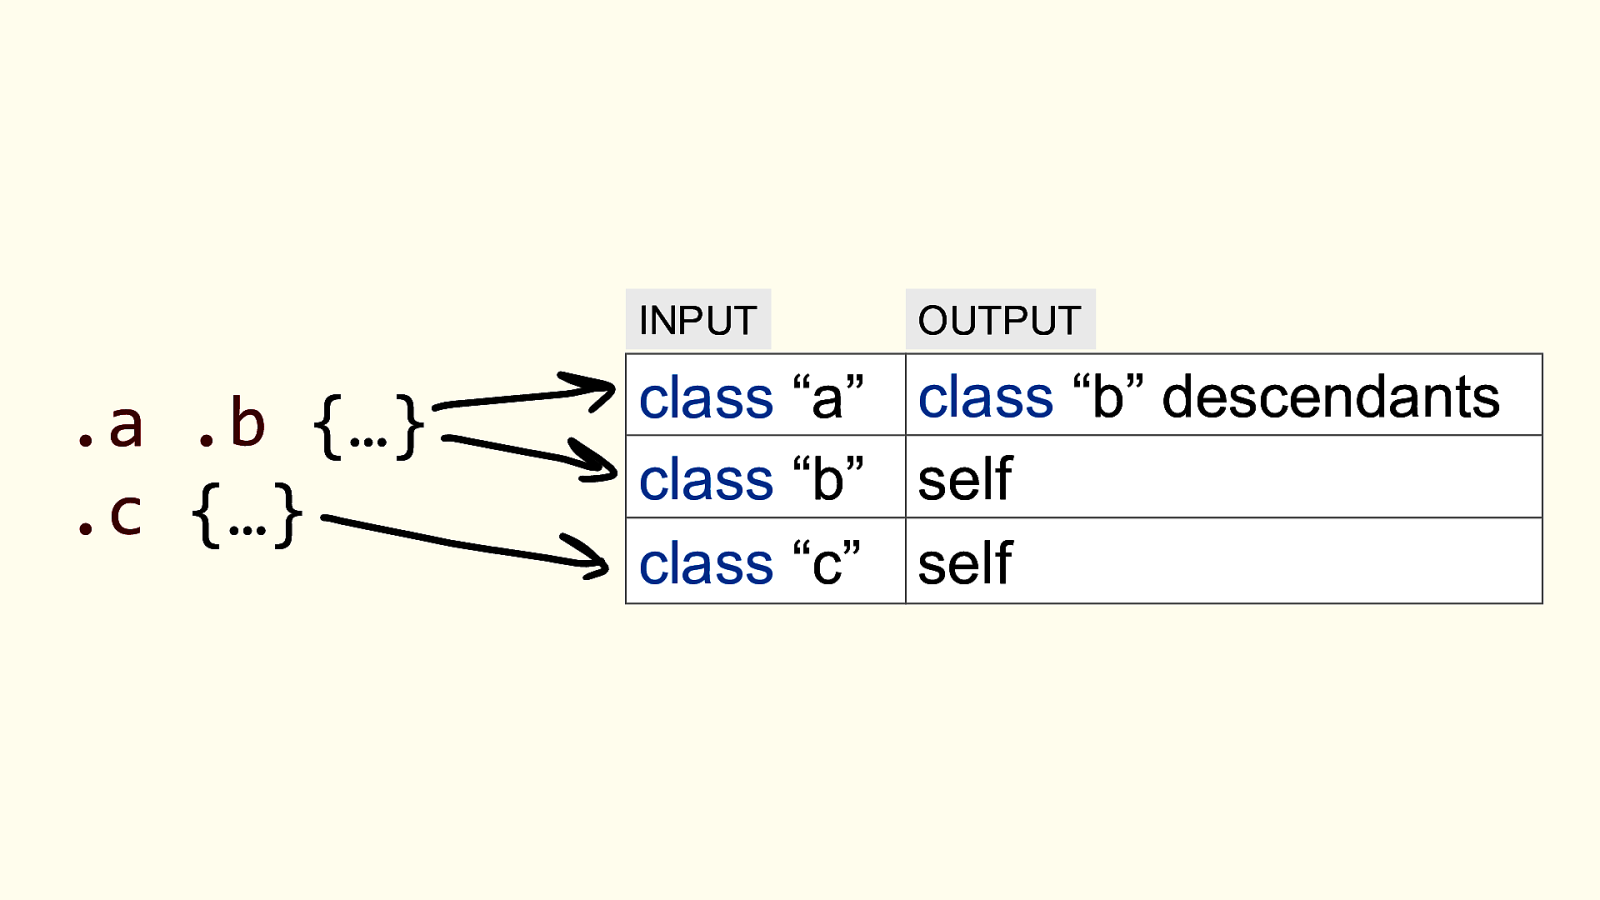
INPUT .a .b {…} .c {…} OUTPUT class “a” class “b” descendants class “b” self class “c” self <click to show sets and explain> 19

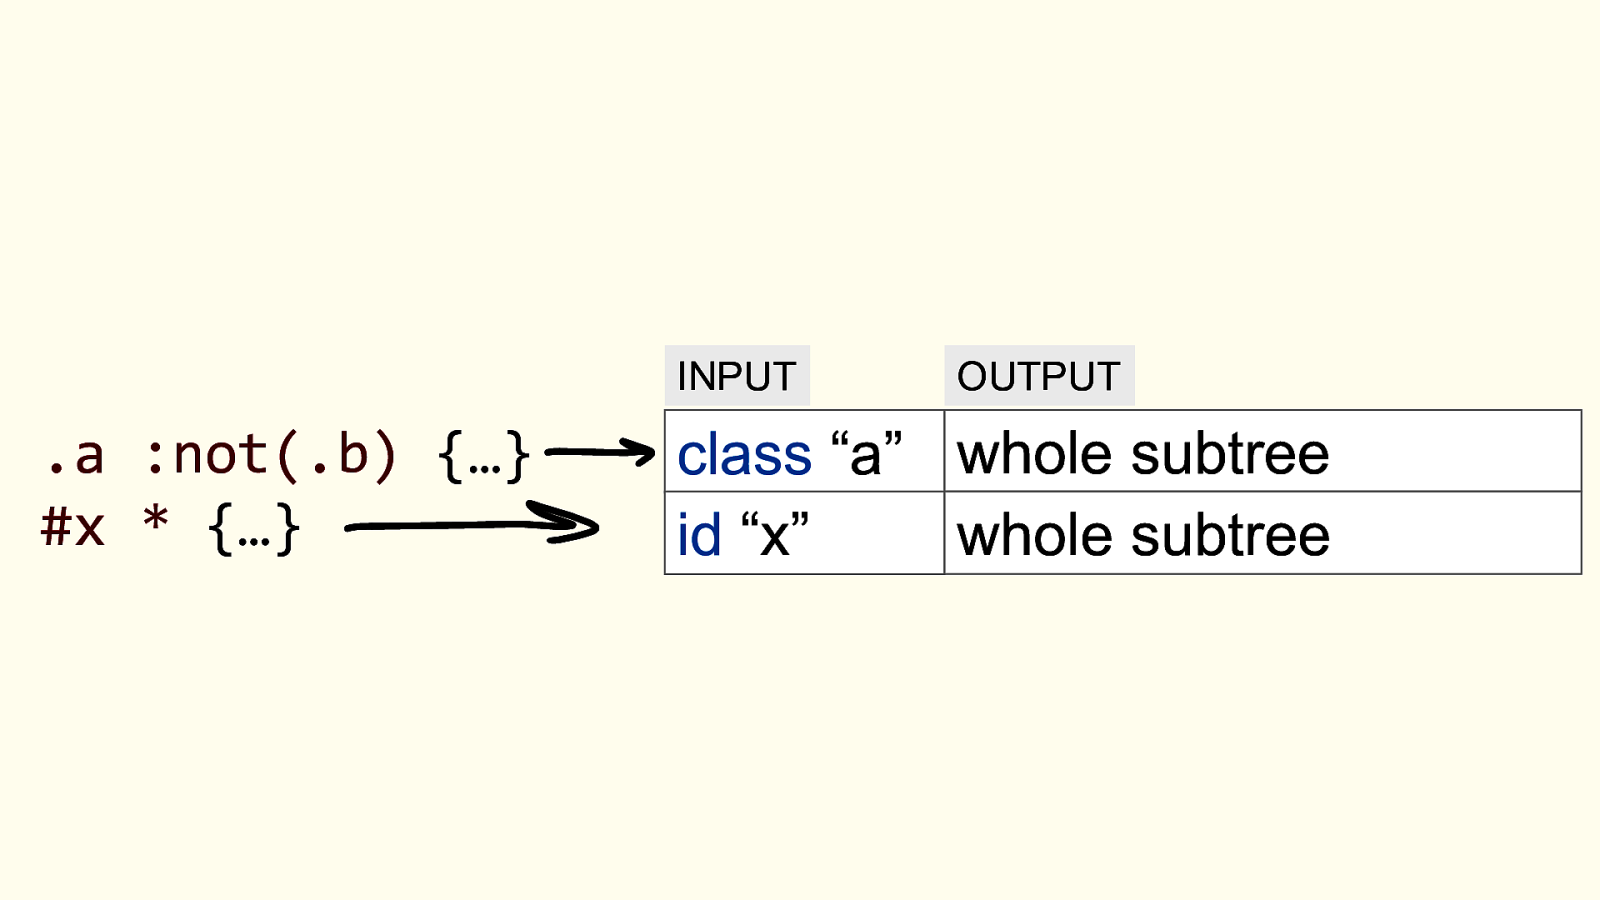
INPUT .a :not(.b) {…} #x * {…} OUTPUT class “a” whole subtree id “x” whole subtree <click to show sets and explain> 20
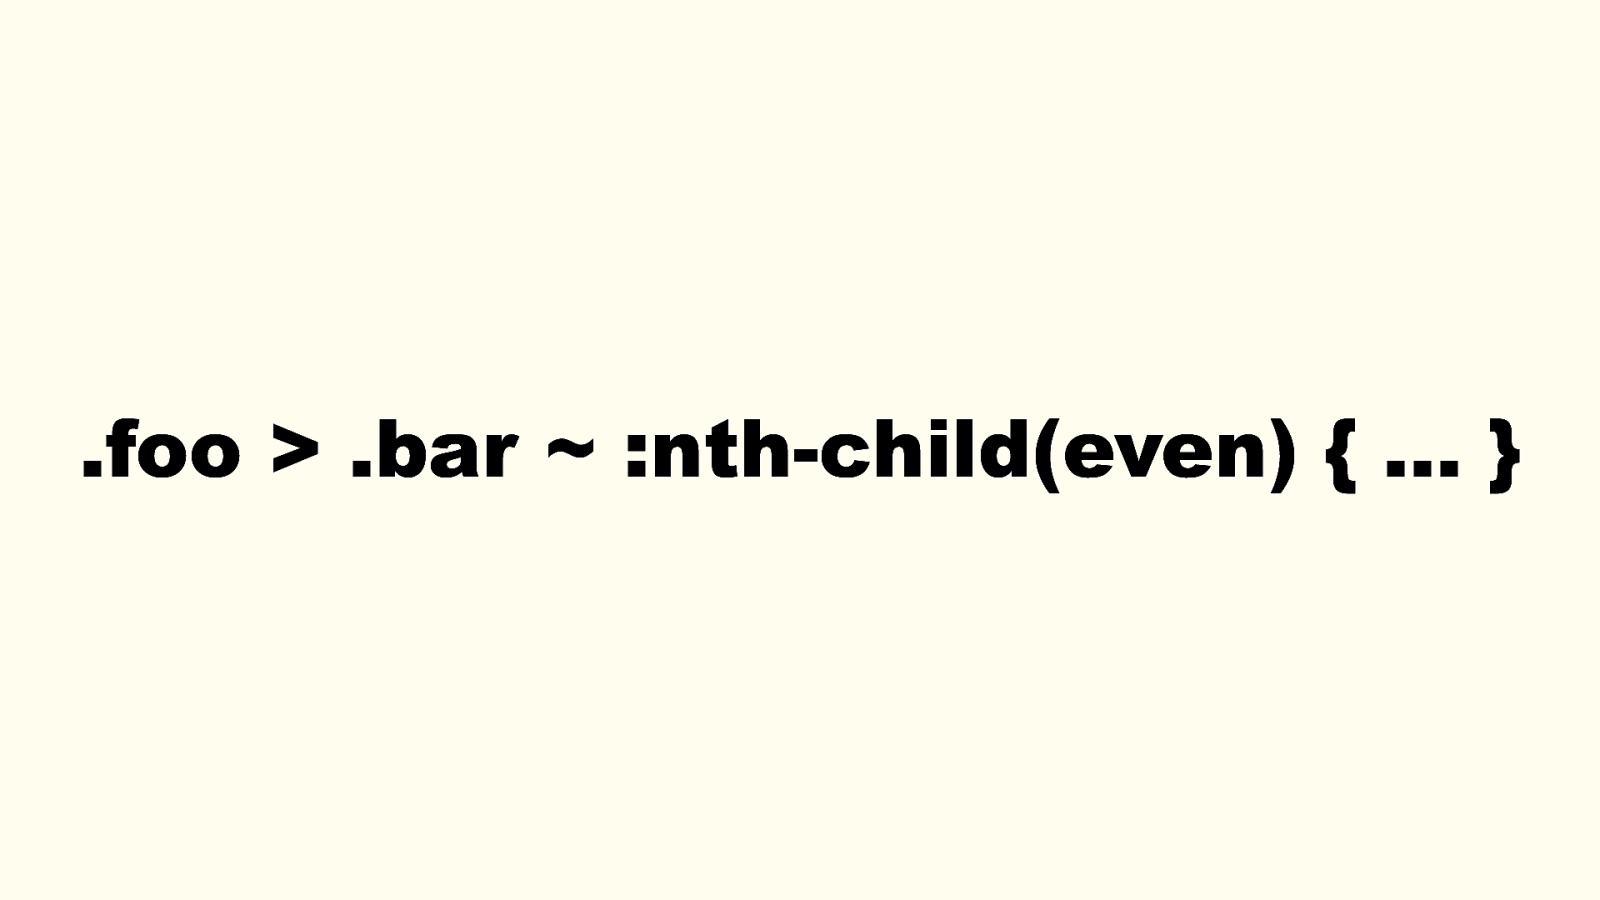
.foo > .bar ~ :nth-child(even) { … } How about this one? What invalidation sets would be created out of this selector? I don’t know. Probably a whole subtree invalidation. Here is my point though: 1. Selectors can be quite complex at times, and in those cases, it’s usually faster to recalculate the style of the entire subtree of an element rather than to optimize upfront. 2. That a seemingly simple DOM change, like adding class “foo” on an element, can have effects on many other elements elsewhere in the DOM. 21

Suddenly, a DOM mutation occurs 2. DOM mutation occurs That’s the start of our scenario. Something happens on the webpage that causes the DOM to change. 22

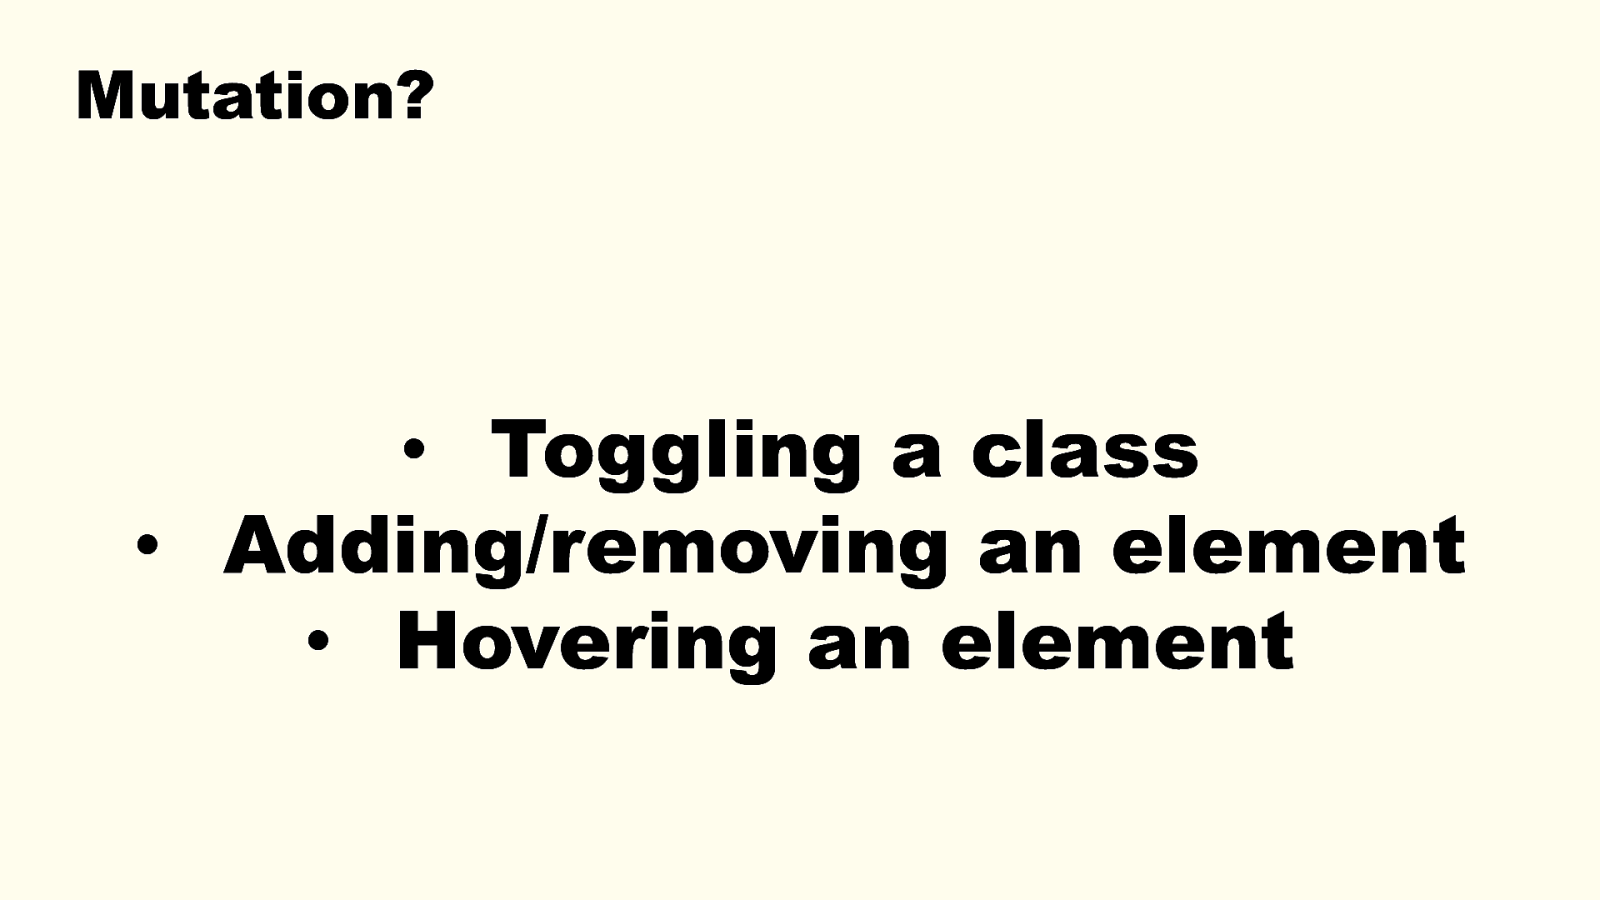
Mutation? • Toggling a class • Adding/removing an element • Hovering an element Likely a user event that gets handled by JS code and results in a change, or multiple changes, in the DOM of the page. It can often be class that’s toggled on the element. It can also be adding an element, deleting an element. But it can also be a mouse movement. 23
:hover { … } Yes, mouse movement can do it. It’s not a mutation in the DOM, but it does require to recalculate styles too. Mouse movement on a page can affect what elements a :hover CSS rule matches. 24
Style invalidation starts 3. Style invalidation starts Process of finding which elements need their styles recalculated in responses to changes. So flagging these elements, based on the invalidation sets. 25
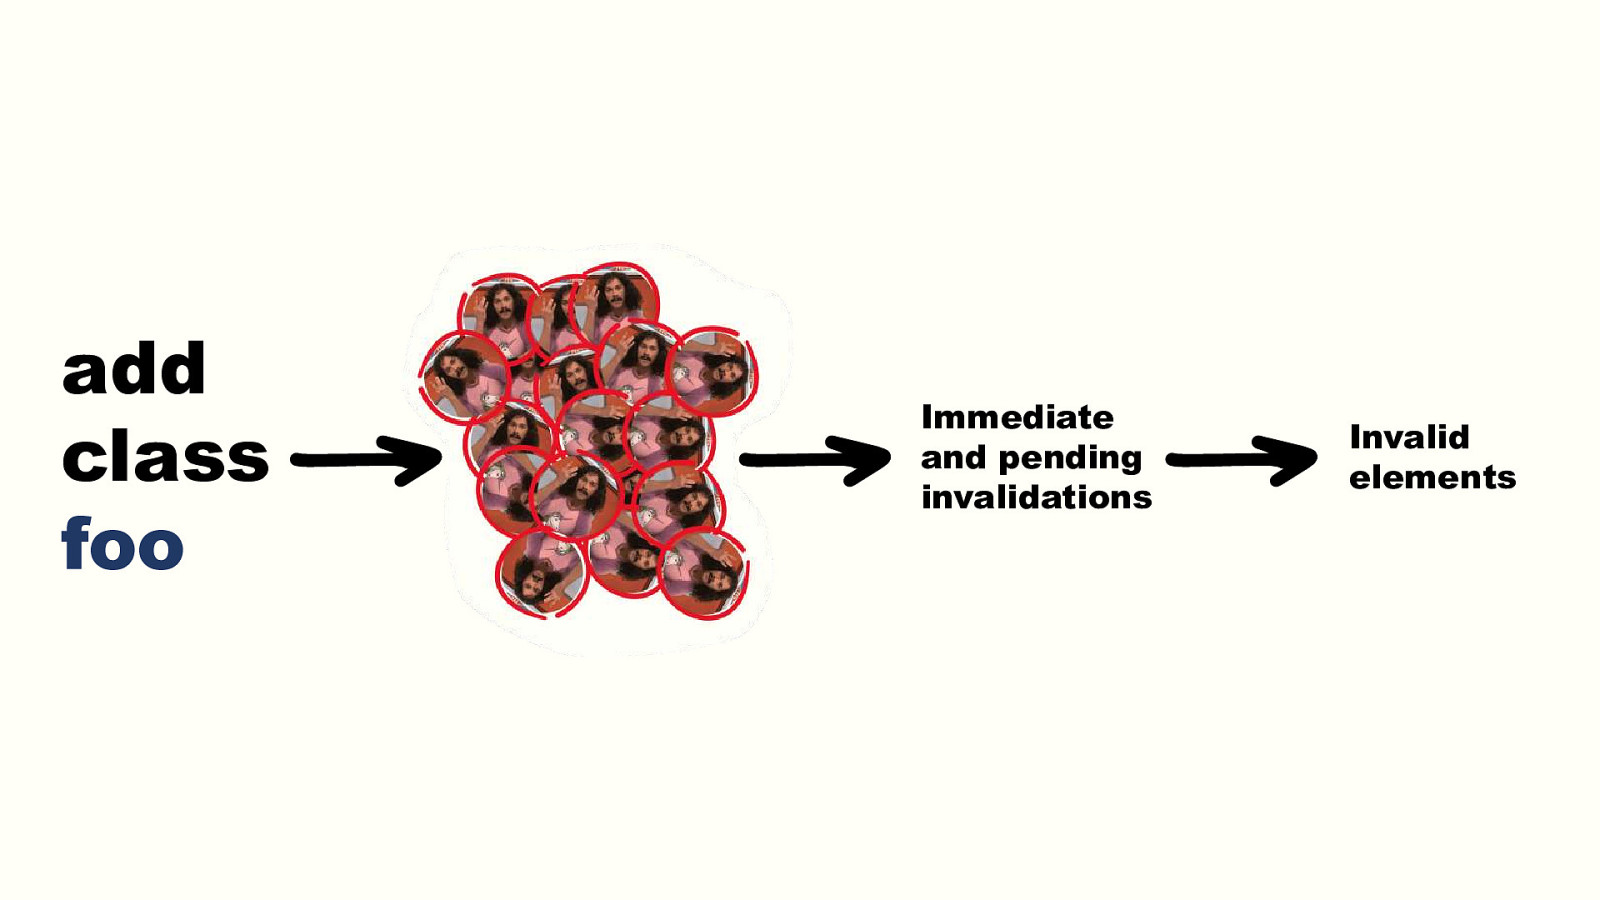
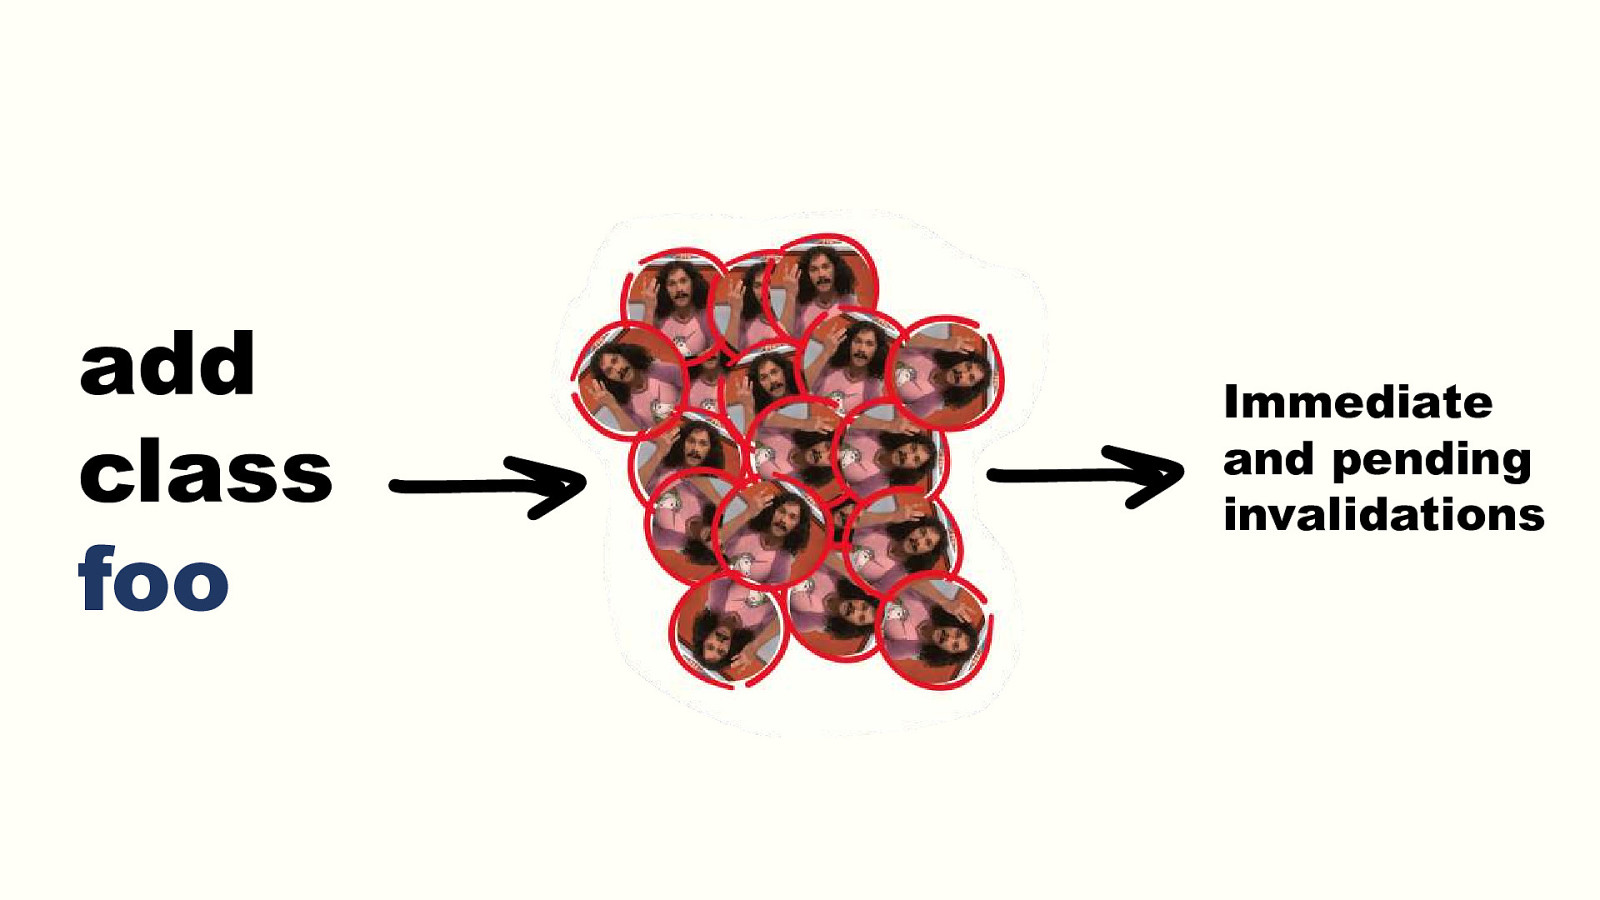
add class foo Immediate and pending invalidations Blink goes through invalidation sets to flag invalidated elements. Given a thing that changed on an element, the sets tell us the which elements to invalidate. Given a change that happened on an element, the sets tell us whether and how to descend into the element’s subtree to flag other elements. Some nodes are marked with an immediate invalidation set, others with pending invalidation sets. 26
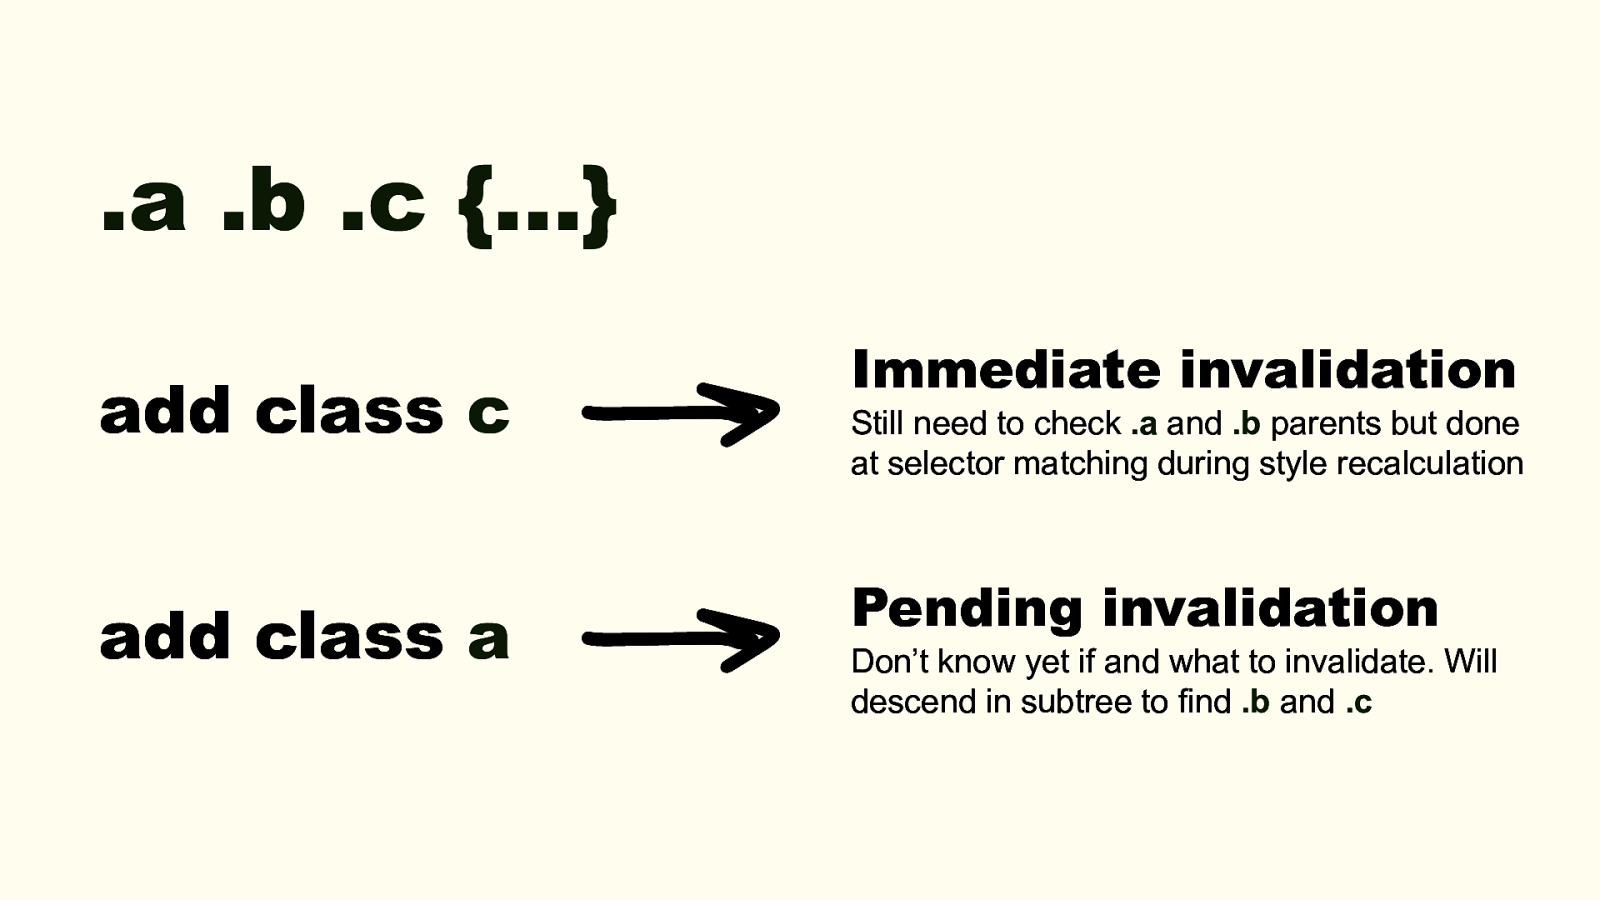
.a .b .c {…} add class c add class a Immediate invalidation Still need to check .a and .b parents but done at selector matching during style recalculation Pending invalidation Don’t know yet if and what to invalidate. Will descend in subtree to find .b and .c For example if we have rule .a .b .c {} - If class “c” is added to an element: immediate invalidation. We still need to check if it’s inside “b” and “a”, but this is done later, during style recalc, when we do selector matching, not during invalidation. No need to do that work now, we’ll do it anyway later during selector matching. - If class “a” is added to an element: pending invalidation. Once we’re done going through all sets, we’ll go and check b and c in descendants, and if we find elements, we’ll flag them. 27
add class foo Immediate and pending invalidations Invalid elements And then, once all sets have been used, apply all pending invalidations. Actually navigate the DOM where needed to resolve all pending invalidation. Eventually end up with a final list of invalidated elements. 28
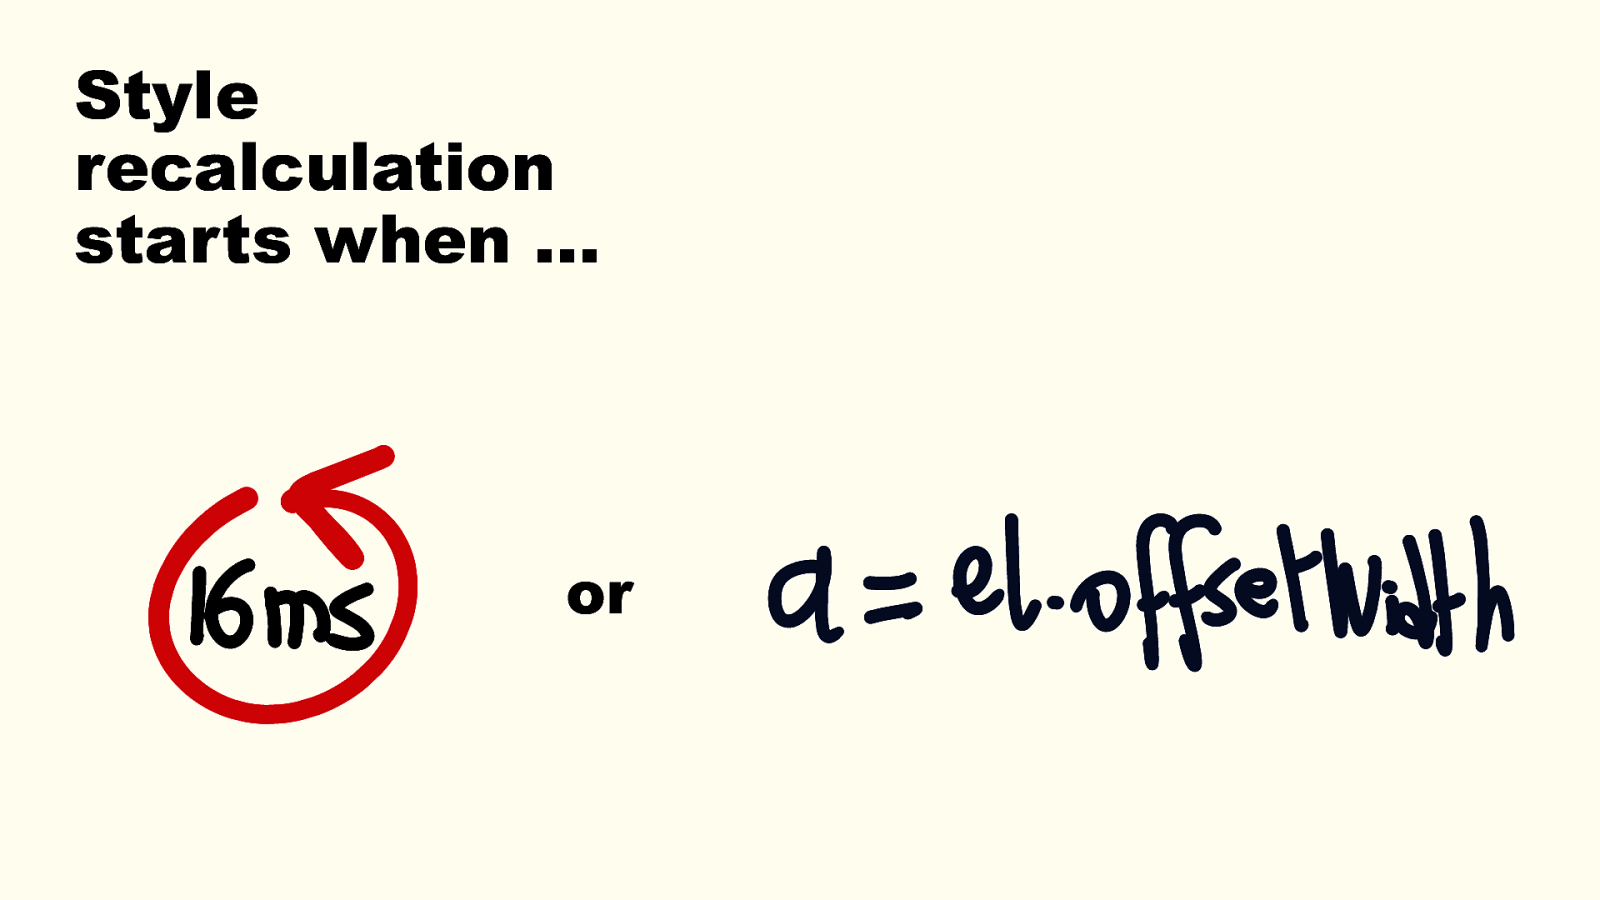
Style recalculation starts when … or 4. Style recalculation starts So far, Blink has only been figuring out what to do. It’s not done anything yet. Process of recalculating the styles for all the nodes that need it. This is triggered when a new frame is needed (or if there’s a forced reflow). Talk about 60fps and 16ms frame budget. The previous step was done when a DOM mutation occurred. But there may be many DOM changes that happen in a sequence before the next frame is needed. Style recalc doesn’t occur right after a DOM mutation. Only when needed. Which is, when the browser wants to repaint a new frame on the screen, to achieve a smooth 60fps framerate. 29
Or when some JS code needs to access the size or position of an element (i.e. offsetWidth), which requires the engine to do the entire work right now. Forced reflow. So at this point, style recalc occurs. Browser iterates over the invalidated DOM nodes to calculate their final computed styles. 29
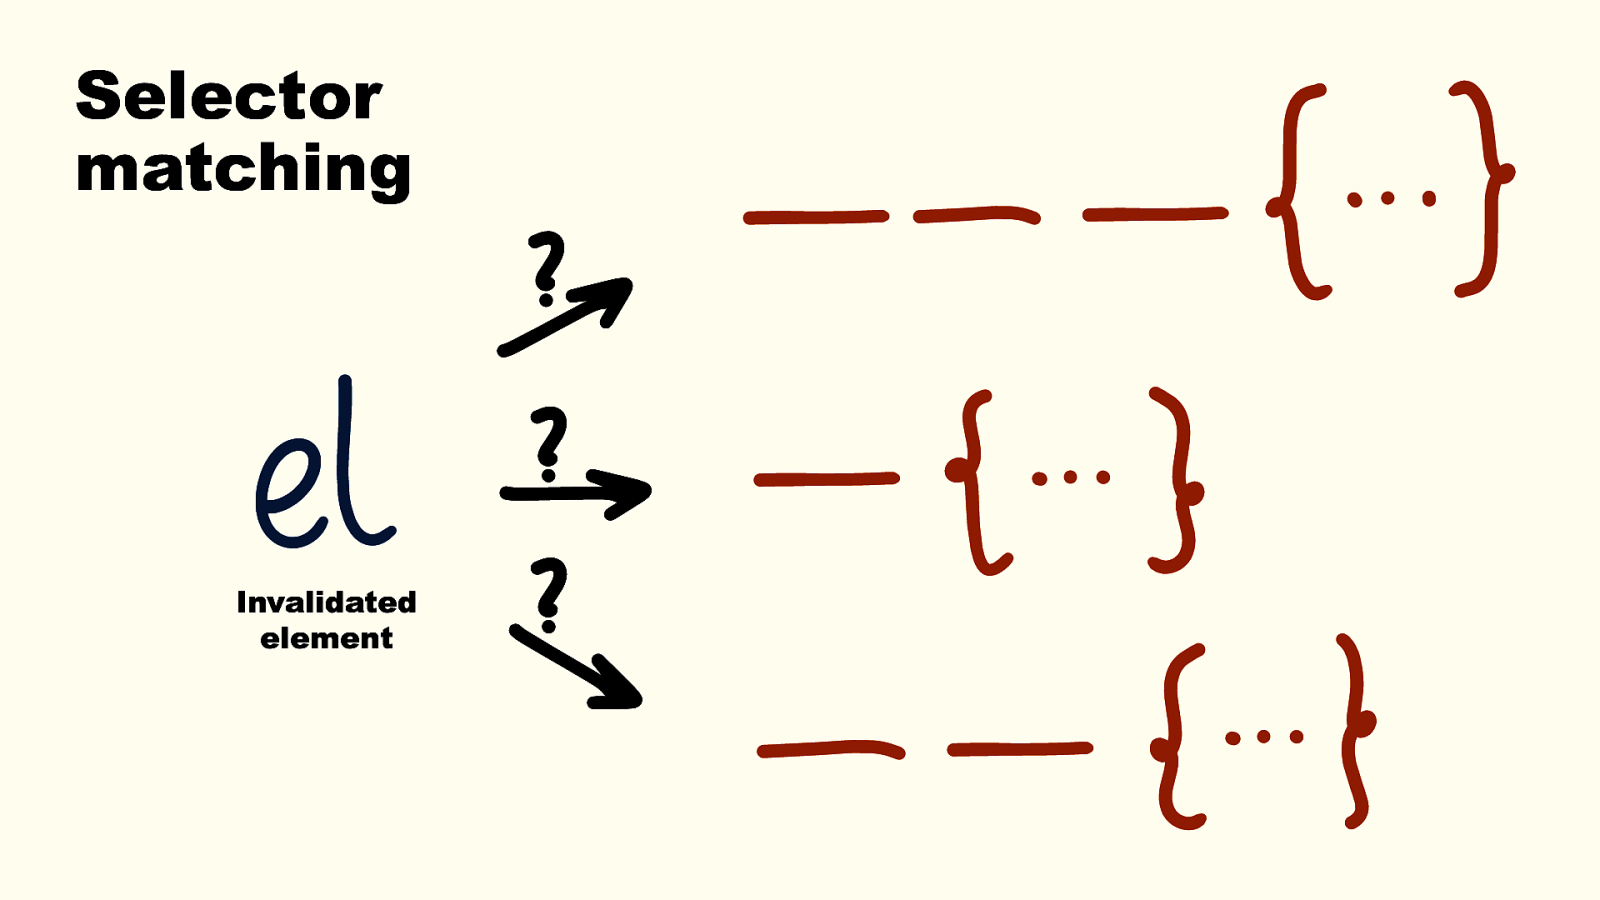
Selector matching Invalidated element This is when selector matching occurs. Starting from one of the invalid nodes and finding all the rules that apply to it, from the entire set of rules that exist on the page. Browsers do this from right to left as this is more efficient. 1. This way engine can quickly filter out selectors that don’t match the element, based on the id, class, attribute. 2. There are also generally fewer ancestors than descendants, it’s faster walking up than down. They also have all sorts of optimizations in place. For example, the styles previously computed for the DOM elements that didn’t need to have their styles recalculated are cached. Blink can re-construct the final DOM content and computed styles for the entire tree at this point. 30
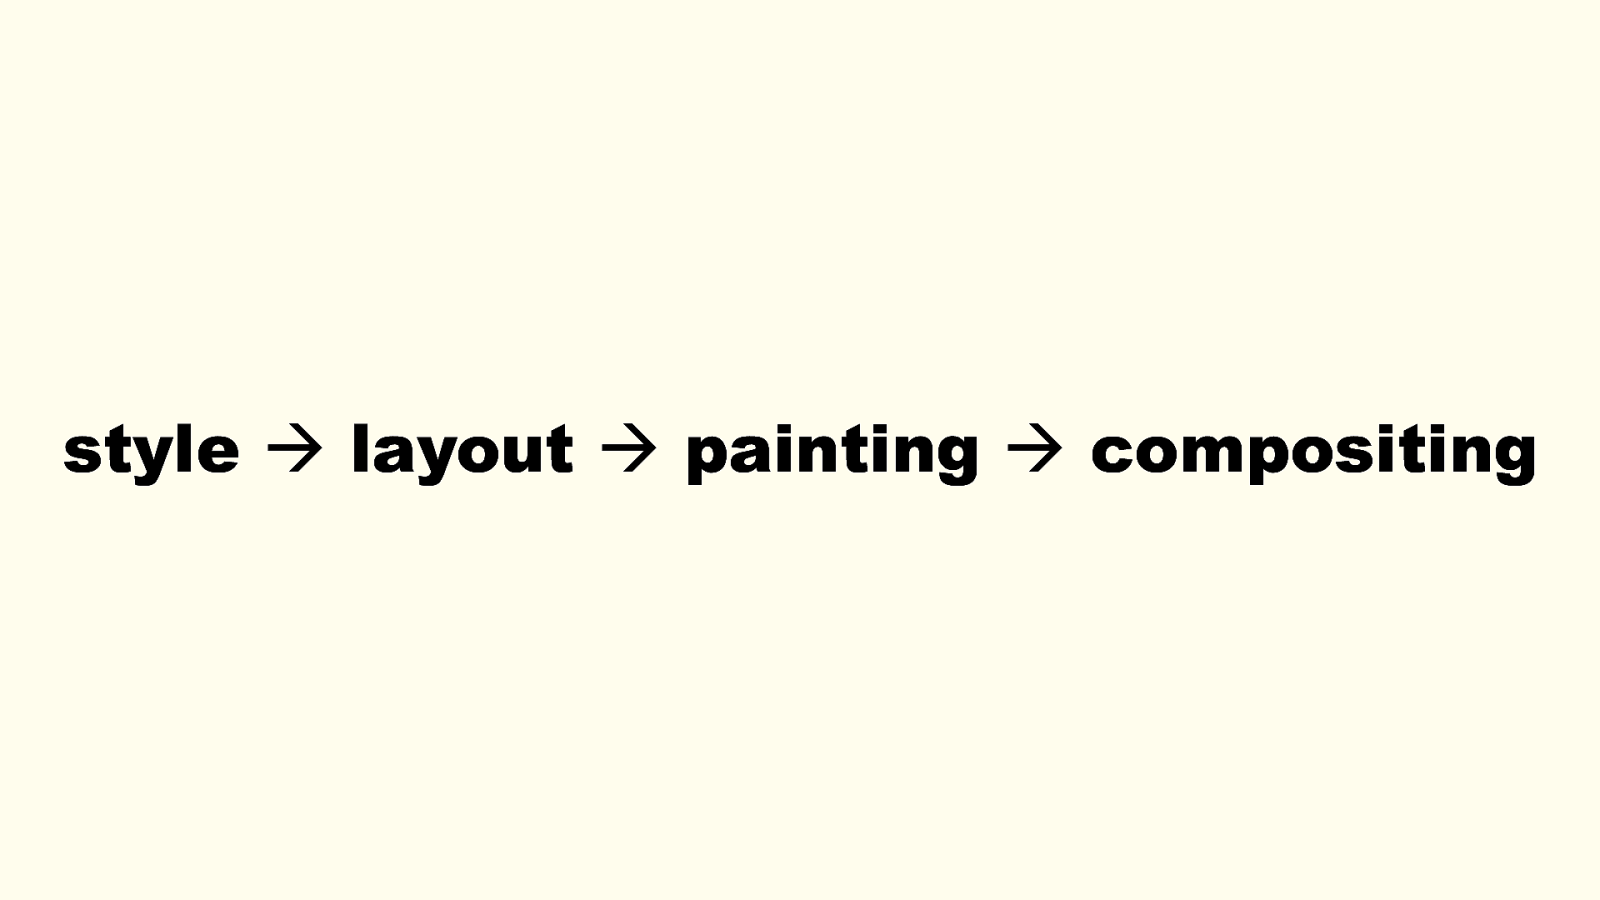
style → layout → painting → compositing Won’t get into details of actually computing the style. But once style is ready, it serves as an input to layout The goal is to figure out where everything is, how big everything is, and what’s in front of what. And this, in turns, serves as an input to painting. Process of actually painting pixels to the screen. Also involves compositing, if the webpage is composed of several layers. 31

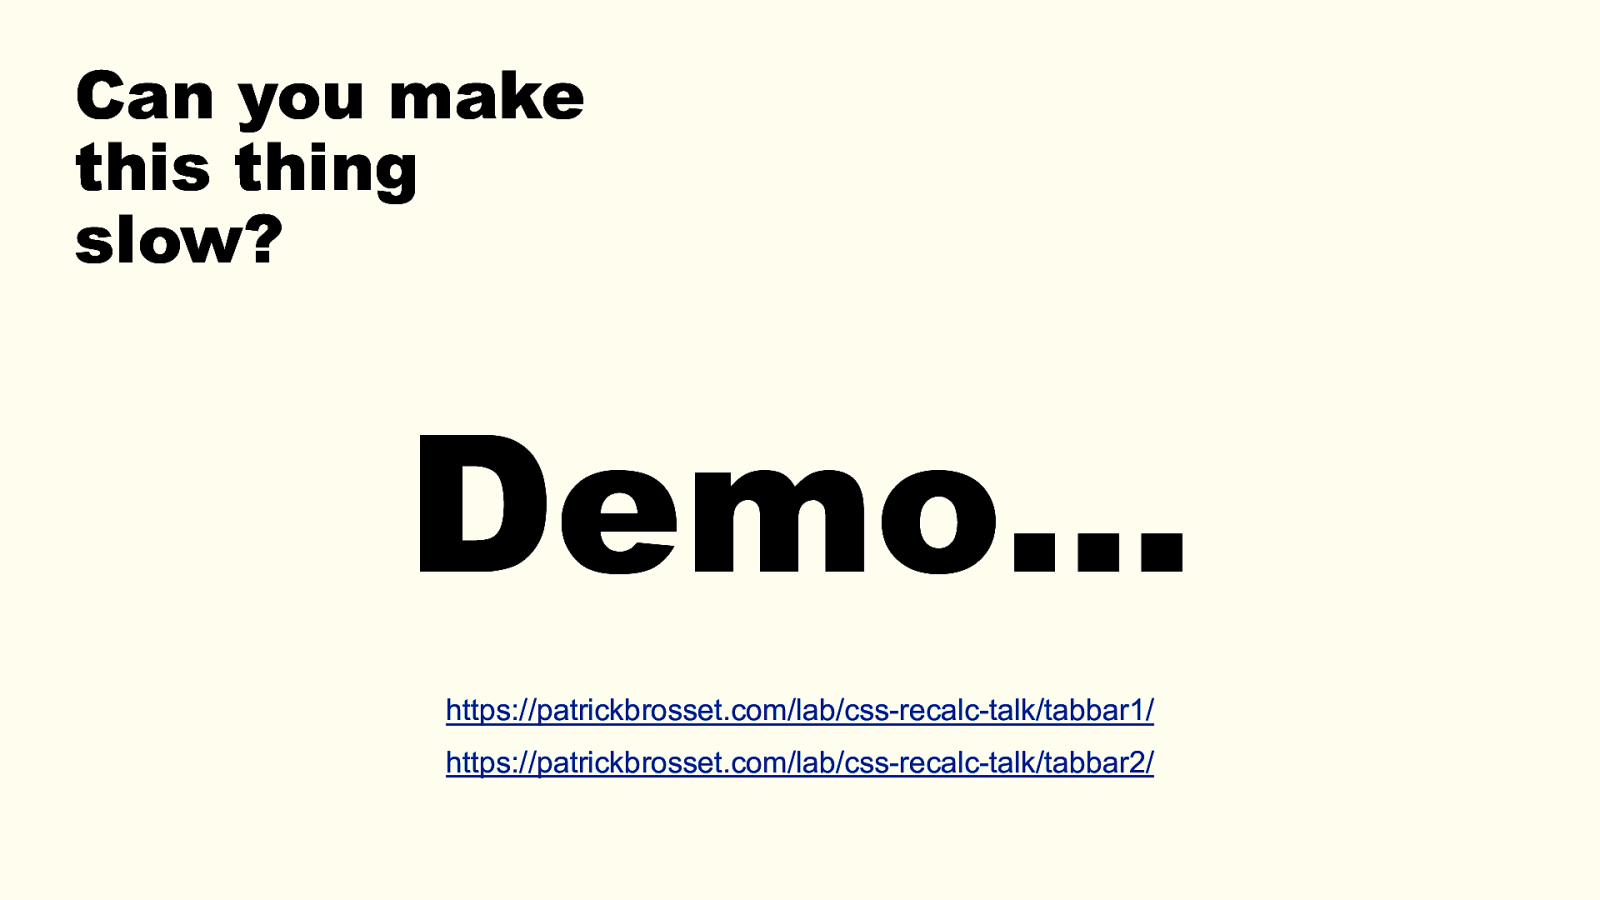
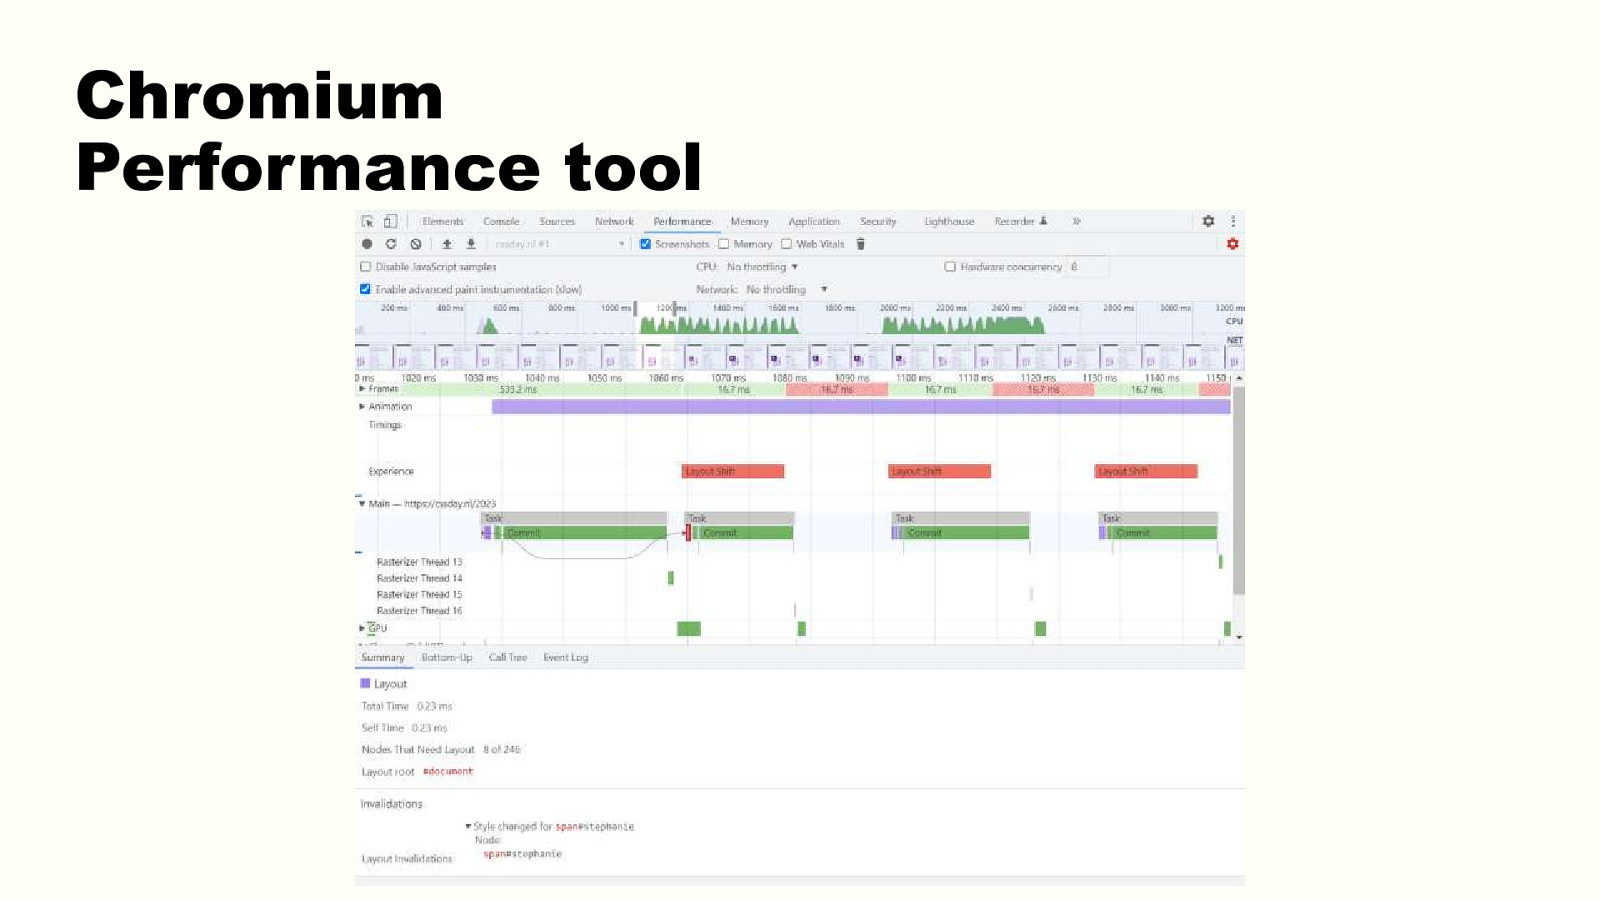
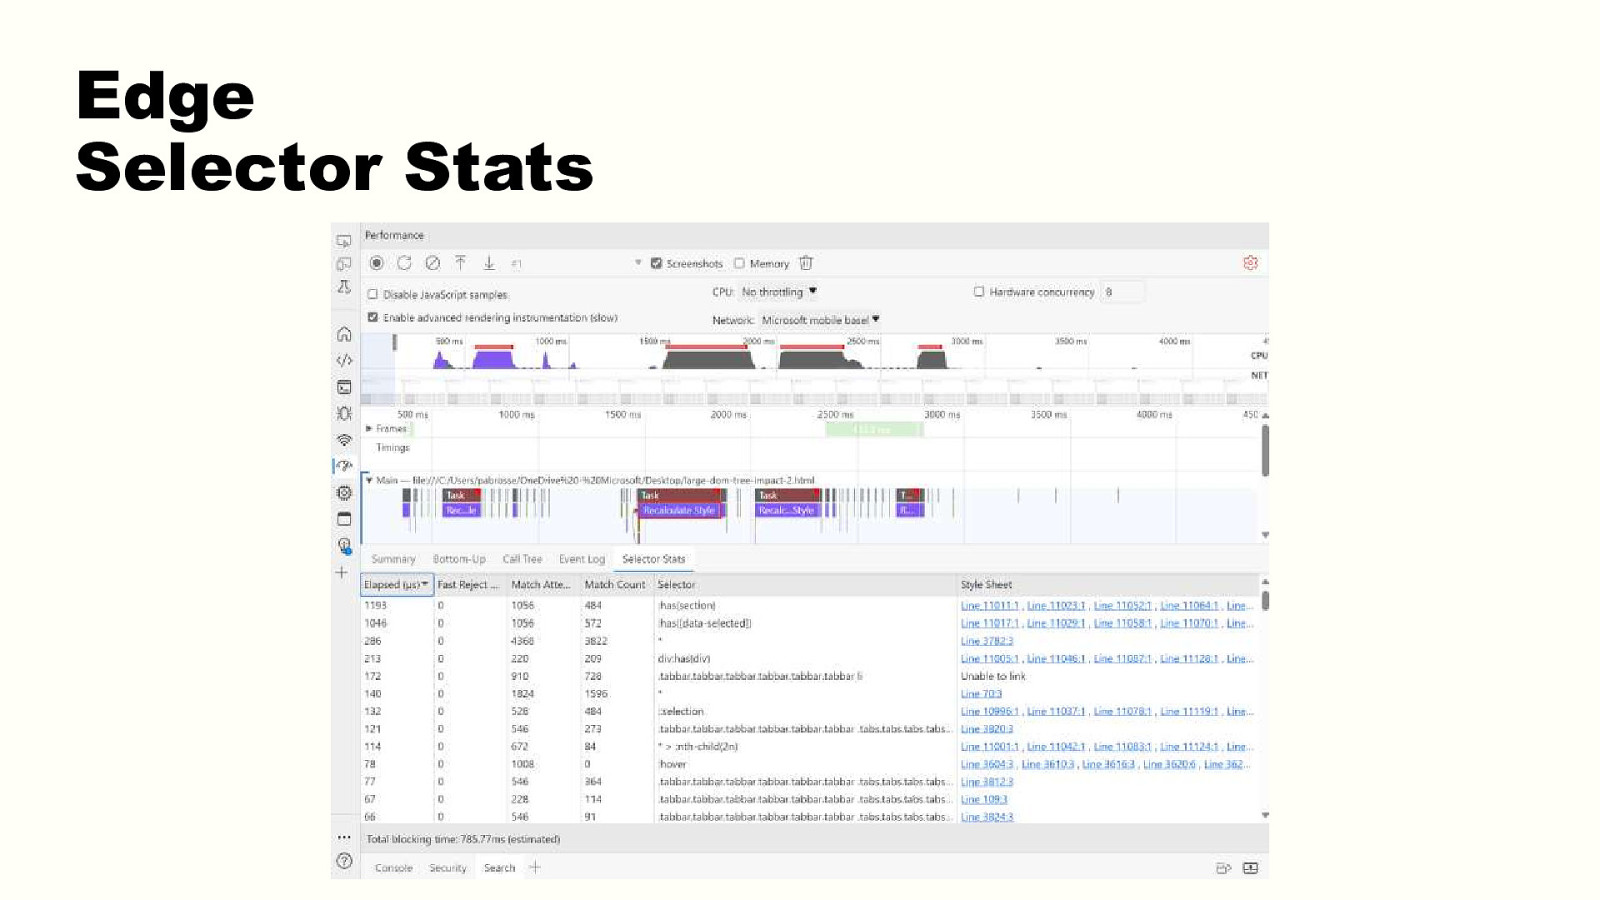
Can you make this thing slow? Demo… https://patrickbrosset.com/lab/css-recalc-talk/tabbar1/ https://patrickbrosset.com/lab/css-recalc-talk/tabbar2/ Browser rendering engines are super complex and optimized machines. It’s hard to make them be slow. Sure, you can write slow code, but can you make the rendering pipeline slow too? Specifically, the style recalculation steps we just saw. <demo the 2 tabbar demos. With 4x slow down perf recording. One fast, almost no activities, one slow, with almost only recalc style purple event> <1: https://patrickbrosset.com/lab/css-recalc-talk/tabbar1/> <2: https://patrickbrosset.com/lab/css-recalc-talk/tabbar2/> 32
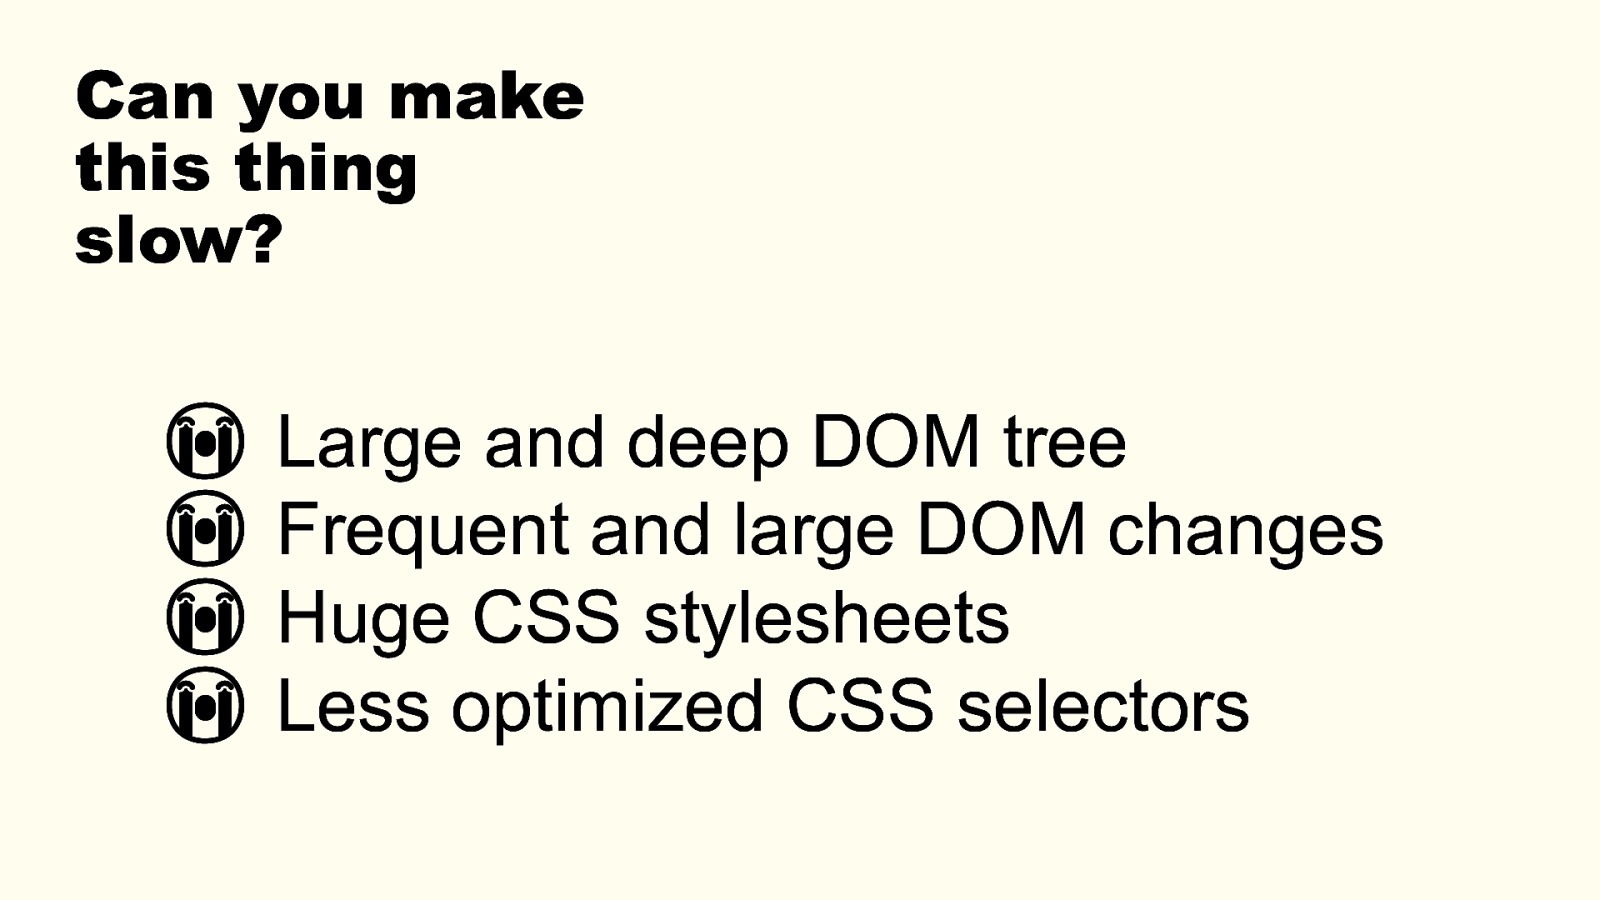
Can you make this thing slow? 😭 Large and deep DOM tree 😭 Frequent and large DOM changes 😭 Huge CSS stylesheets 😭 Less optimized CSS selectors Here are some things that make the style recalculation slow in the previous demo: Large and deep DOM tree -> More work to navigate the DOM to know what needs to be invalidated. Frequent and large DOM changes -> Many elements to invalidate and recalculate, on a frequent basis. Huge CSS stylesheets -> Many invalidation sets to create and use. More work to match selectors to DOM nodes. Complicated CSS selectors -> Longer selector matching. We’ll see this in more details later. So, there are ways to make a webpage slow, even on powerful devices. You can push a browser engine to its limits. 33
So it’s not always a problem with your JS code (although, JS probably caused it originally, please don’t use so much JS, why would you use so much JS!?) JS is often the part most people are used to optimize when using the Perf tool in DevTools. You see long yellow blocks, and you go and look at the code. It makes sense, it’s a lot easier to do. These yellow blocks show your function names. But here, the purple block is much bigger. But it’s kind of a mystery to most people. 2 caveats: 1. This was an extreme example. 2. Browsers optimize things frequently. What was slow yesterday may be fast tomorrow. 34
So in reality, you probably won’t see big purple blocks like these very often. But … 34
Chapter 3 Based on a true story This happened to us. About a year ago, some of my colleagues on the Edge team were working with other Microsoft engineers who work on an app. Not going to say which app, but it’s got something to do with emails. One of the interactions was really slow, and kept getting slower and slower. So we worked together with them on this, and I want to share some of the process we went through. 35
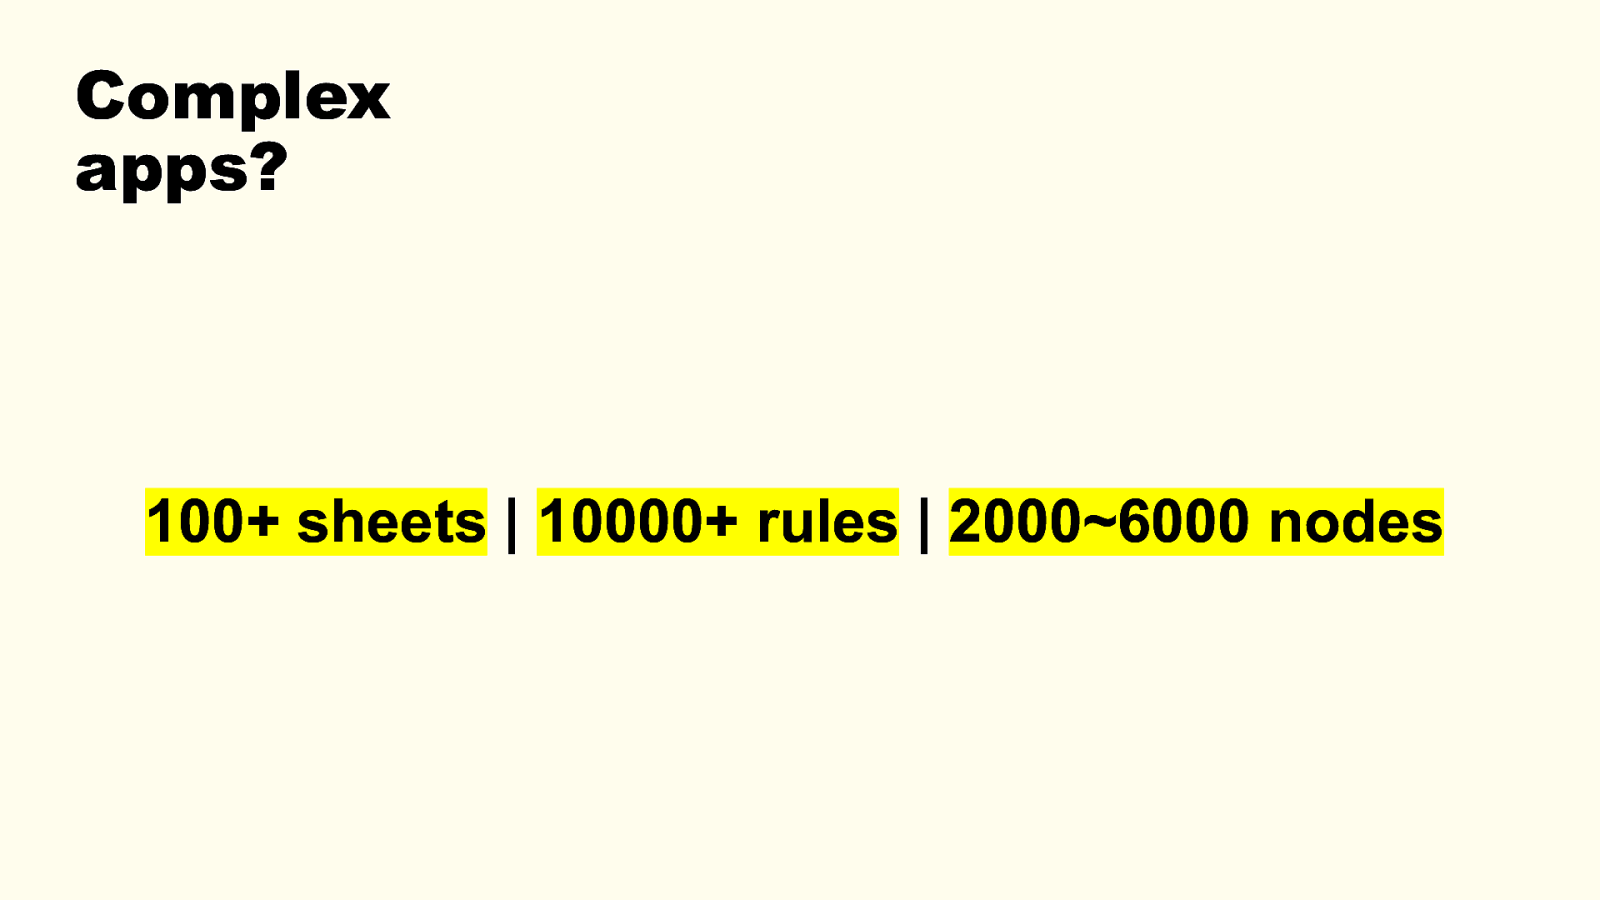
Complex apps? 100+ sheets | 10000+ rules | 2000~6000 nodes Caveat: most probably not going to be a problem for your on typical sites or apps. But we build some pretty complex apps. And we’re not the only ones. Obviously, this can vary, different ways to measure, but some examples: Teams: 64 stylesheets with 28k rules total. 6k DOM nodes. Hundreds of requests, quickly going to 10MB+ of transferred data. Word: 131 stylesheets with 10k rules total. 4k DOM nodes. Hundreds of requests, quickly going to 10MB+ of transferred data. Outlook: 222 stylesheets with 16k rules total. 2.5k nodes. Hundreds of requests, quickly going to 10MB+ of transferred data. Doesn’t mean all this is required on load. These apps load with just a subset of the above, but then lazily download more stuff and create more UI/DOM/CSS. 36
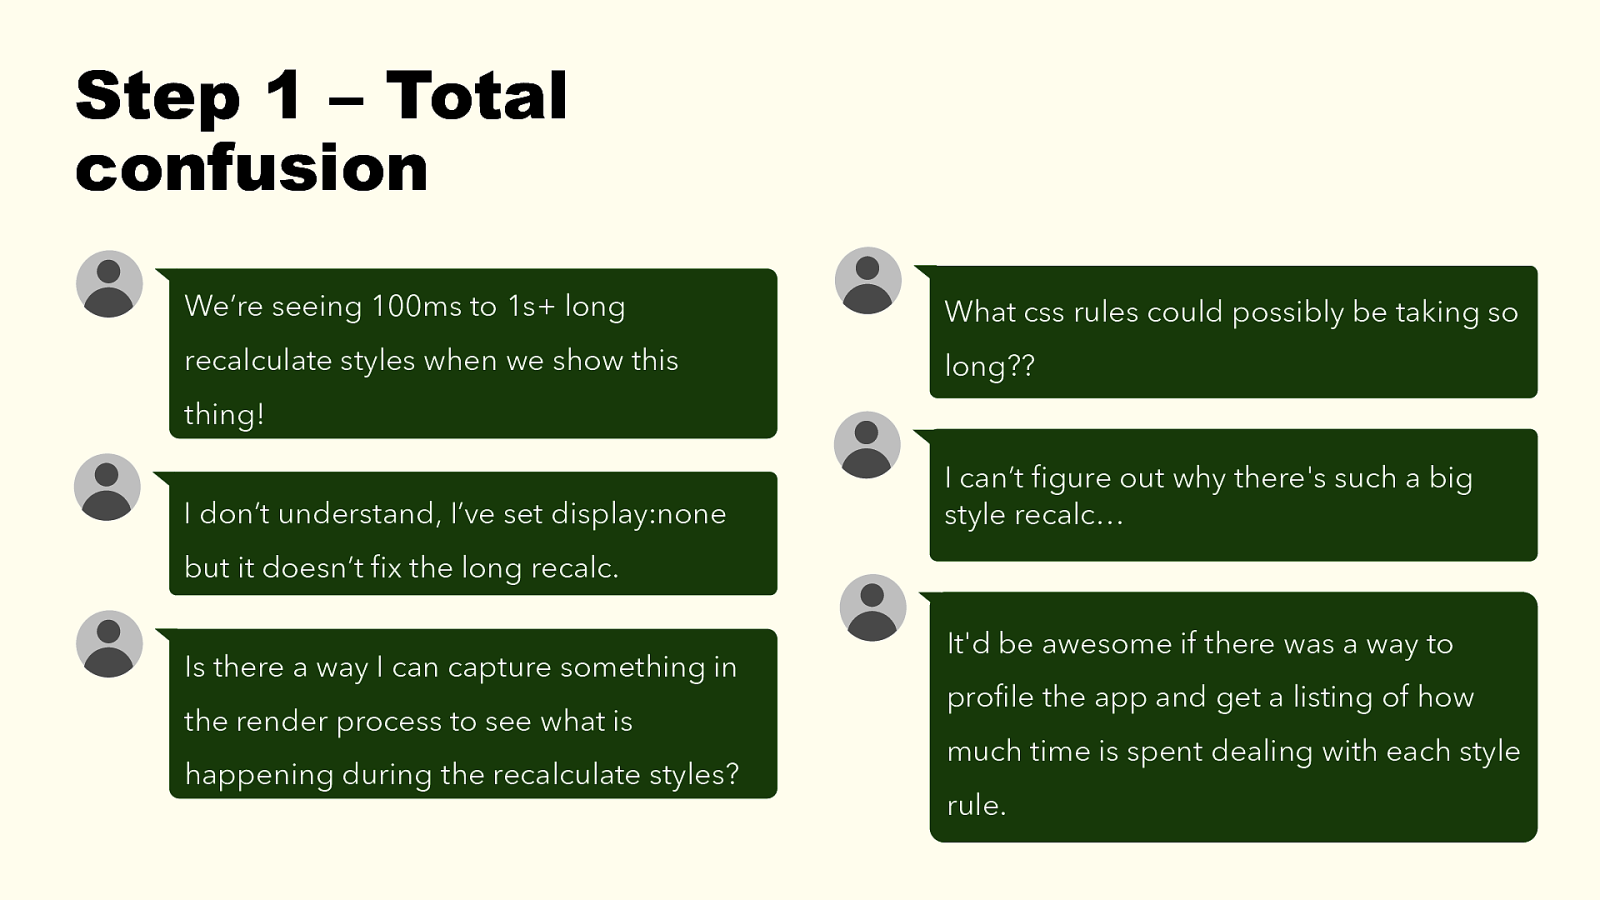
Step 1 – Total confusion We’re seeing 100ms to 1s+ long What css rules could possibly be taking so recalculate styles when we show this long?? thing! I don’t understand, I’ve set display:none I can’t figure out why there’s such a big style recalc… but it doesn’t fix the long recalc. Is there a way I can capture something in the render process to see what is happening during the recalculate styles? It’d be awesome if there was a way to profile the app and get a listing of how much time is spent dealing with each style rule.
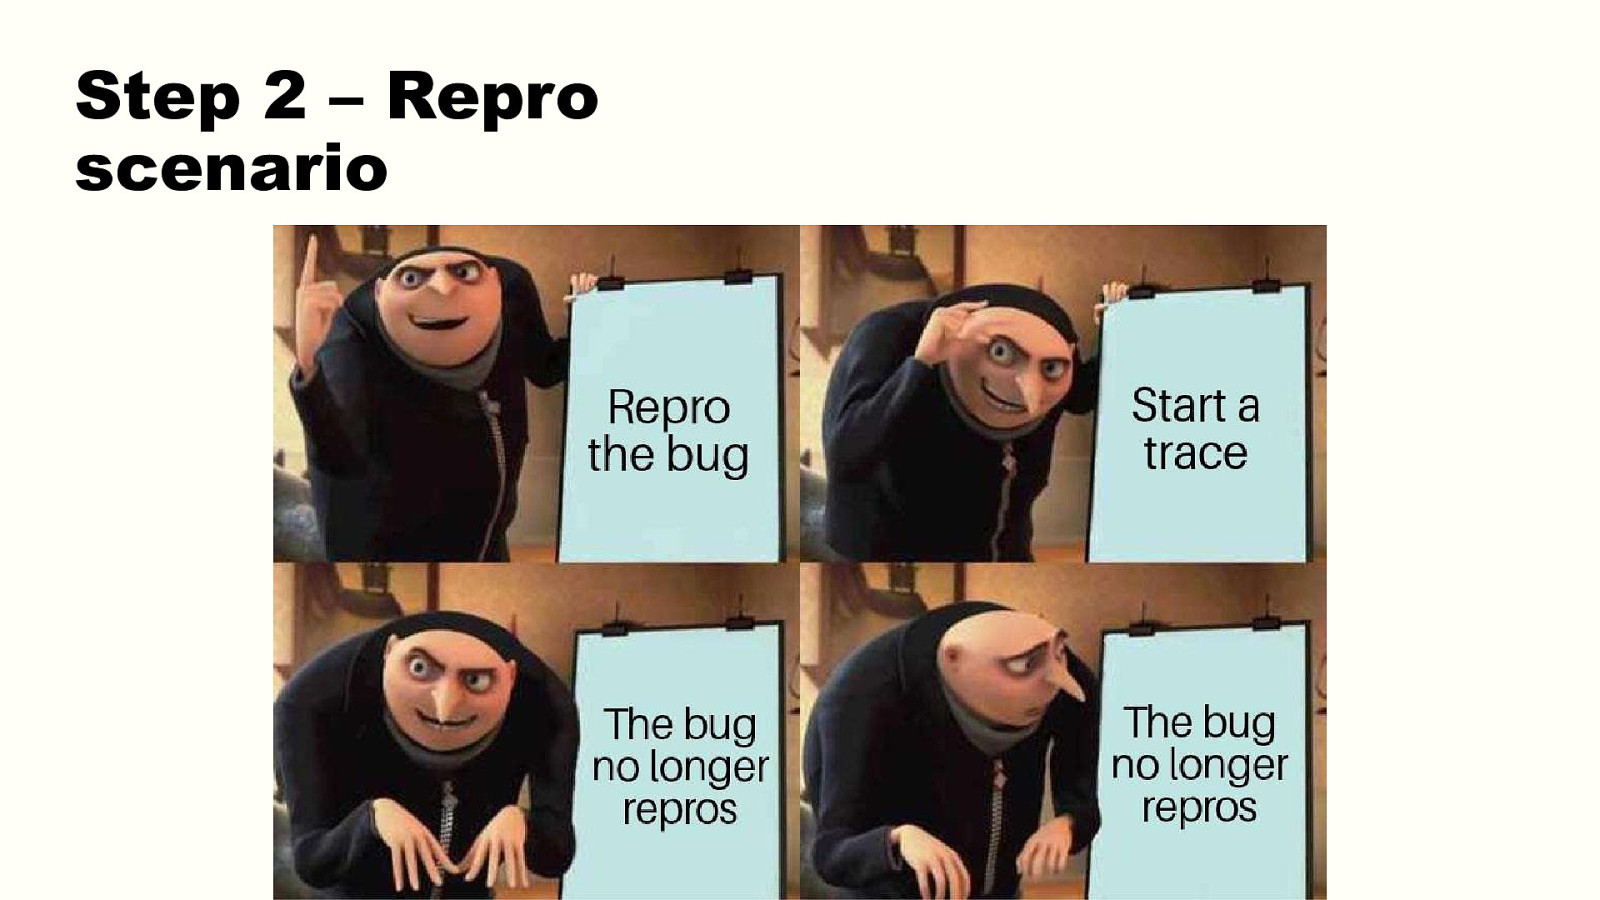
Step 2 – Repro scenario 2. Repro scenario Honestly one of the really hard parts here was even finding a stable scenario to repro. It wasn’t clear when the app would get into this state. After days, we tracked it down to a tooltip hover effect. We were using a library that was appending elements into the DOM, moving them around, and recreating them. But at this point we still had no understanding of why it was making things slow, but at least we had an entry point into our rabbit hole. 38
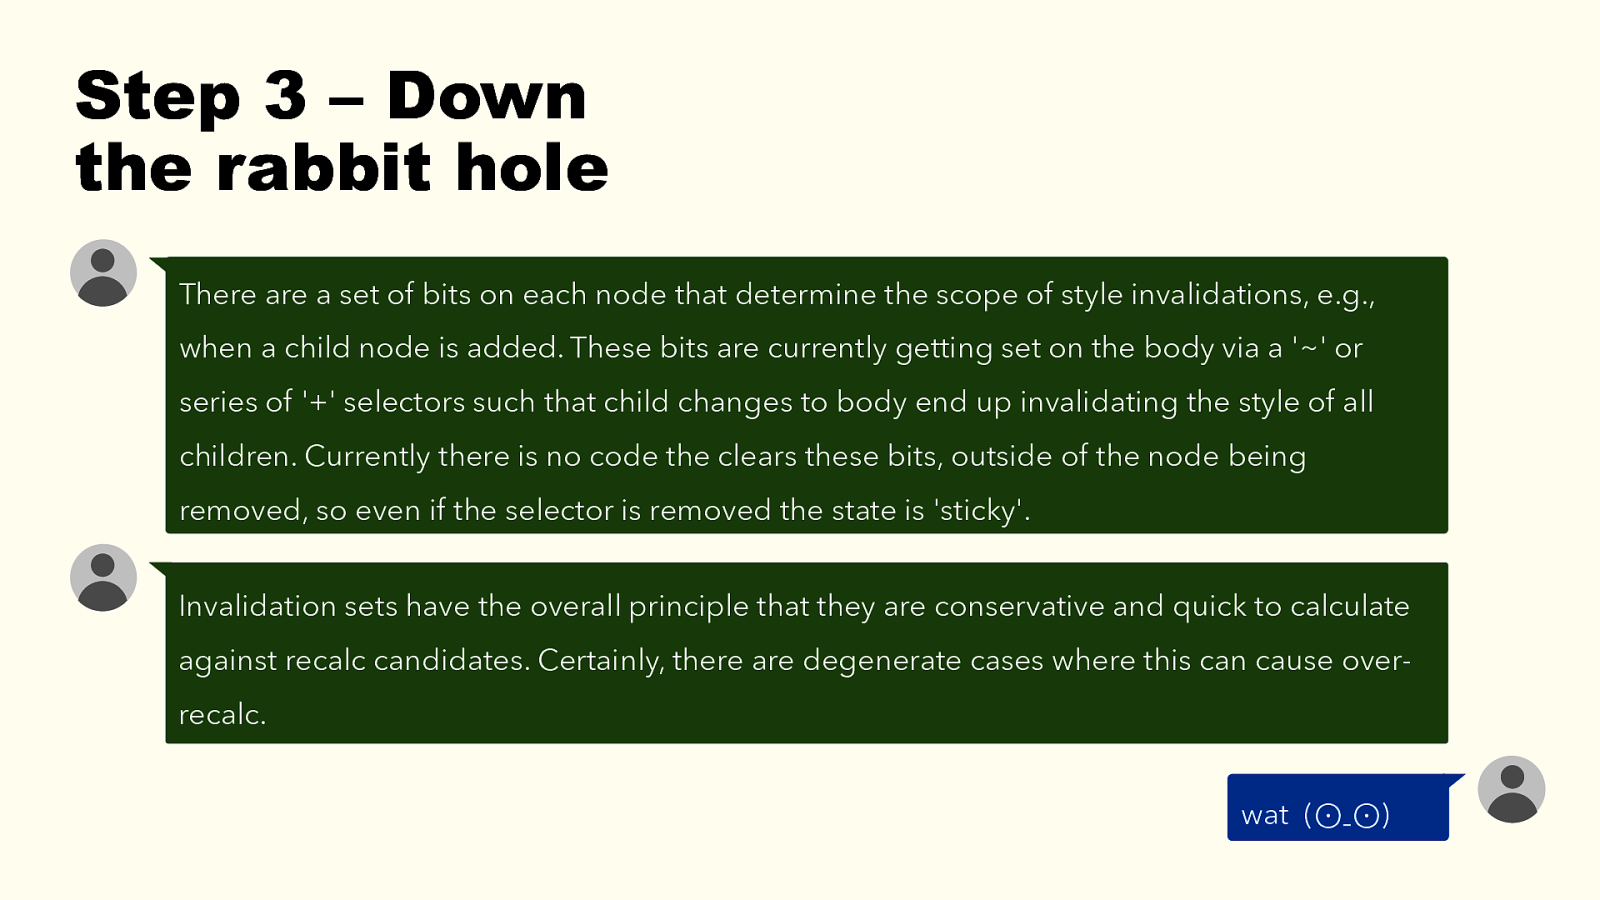
Step 3 – Down the rabbit hole There are a set of bits on each node that determine the scope of style invalidations, e.g., when a child node is added. These bits are currently getting set on the body via a ‘~’ or series of ‘+’ selectors such that child changes to body end up invalidating the style of all children. Currently there is no code the clears these bits, outside of the node being removed, so even if the selector is removed the state is ‘sticky’. Invalidation sets have the overall principle that they are conservative and quick to calculate against recalc candidates. Certainly, there are degenerate cases where this can cause overrecalc. wat (⊙ˍ⊙) 3. Down the rabbit hole Investigating rendering issues is hard. Understanding where the problem even is tough, let alone finding the root cause. We’re very fortunate that we have our own browser. We were able to include browser engineers in our little perf task team. They were able to track what happened directly within the browser rendering code! They could get more debugging info than what’s normally available to web devs. 39

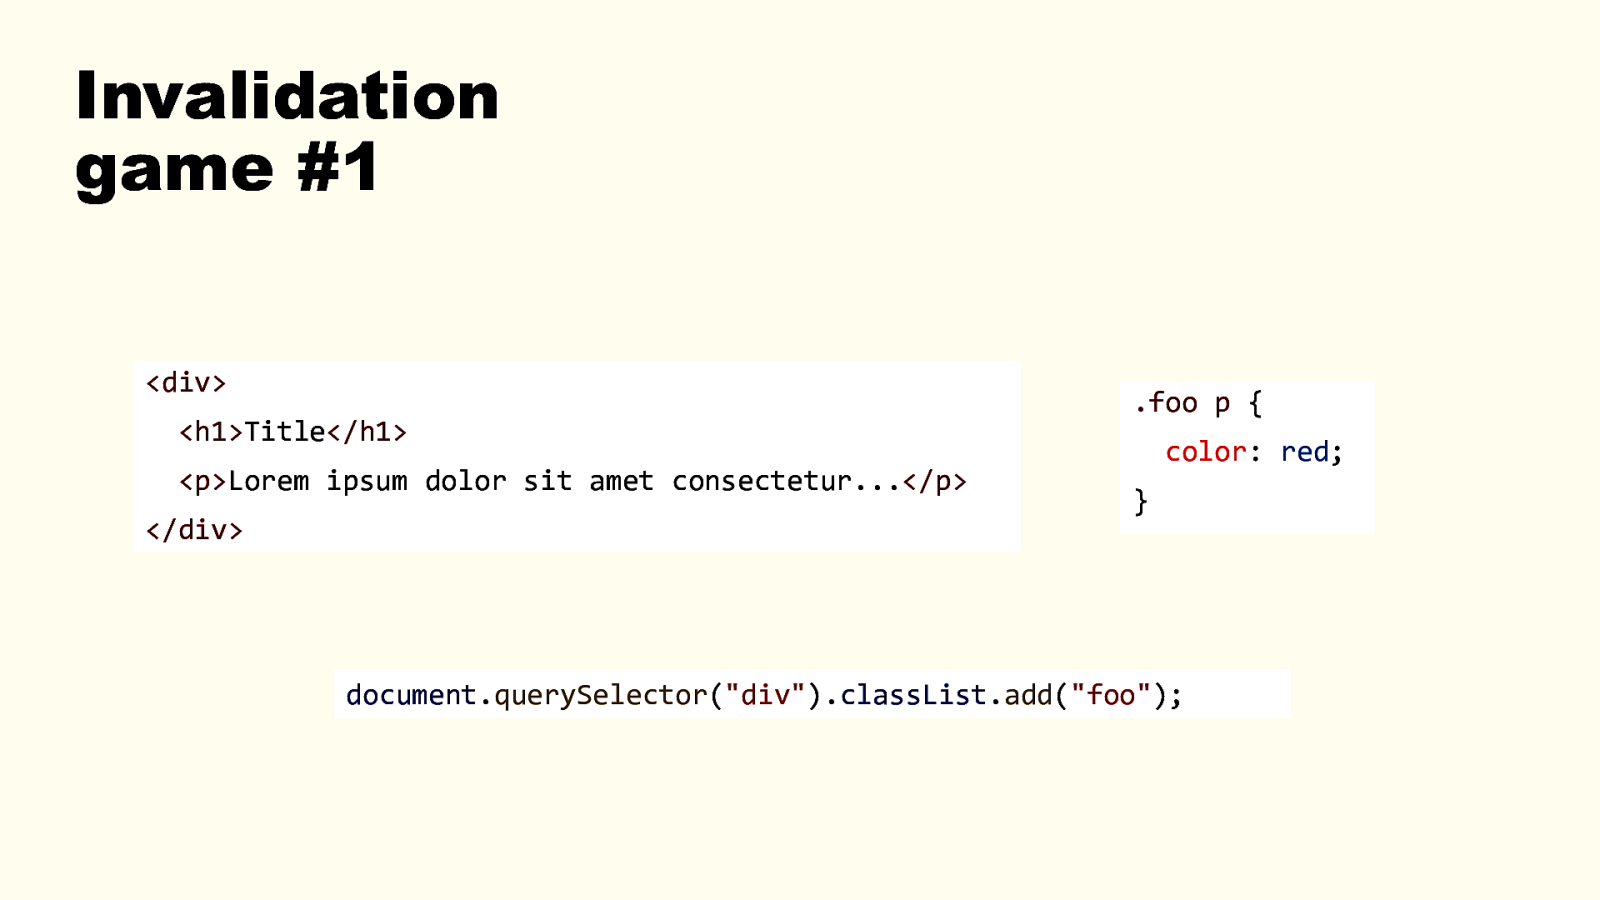
Invalidation game #1 <div> <h1>Title</h1> <p>Lorem ipsum dolor sit amet consectetur…</p> </div> .foo p { color: red; } document.querySelector(“div”).classList.add(“foo”); Now, let’s play a little bit of a game. For that problem we went through, we had to spend an awful lot of time to find the actual culprit. The actual rule that was causing that much invalidation. And as we’ll see, it’s not always obvious. How many elements do you think need to have their styles invalidated when the JS code runs? 1 How many elements do you think actually get invalidated in Blink? 1 40

Invalidation game #2 <div> .foo span {
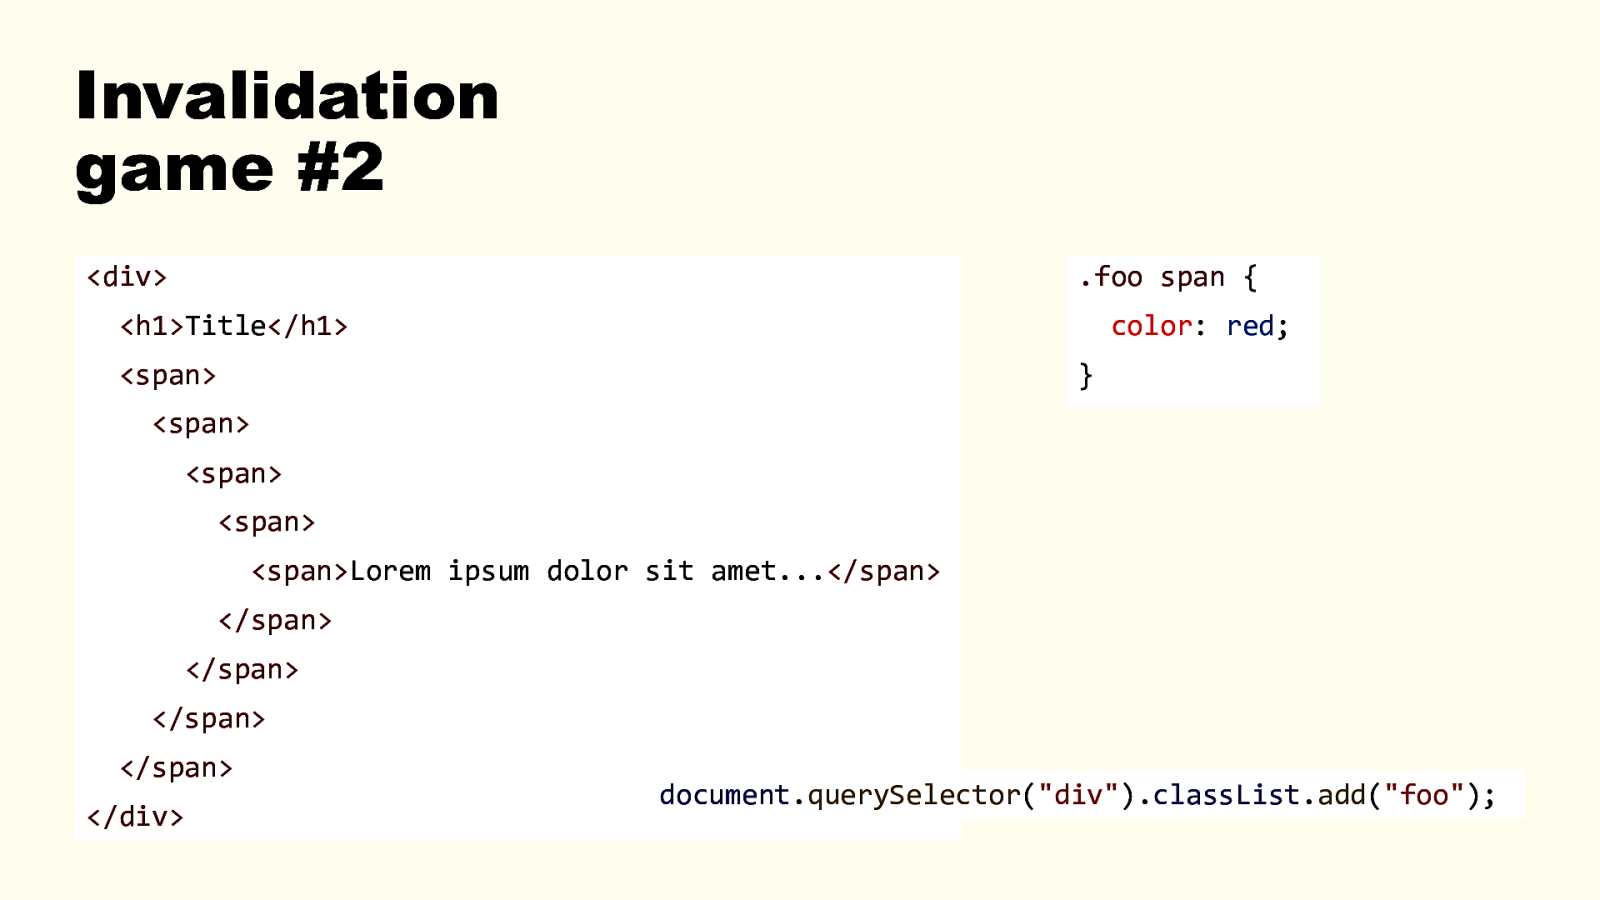
<h1>Title</h1> color: red; <span> } <span> <span> <span> <span>Lorem ipsum dolor sit amet…</span> </span> </span> </span> </span> </div> document.querySelector(“div”).classList.add(“foo”); How many elements do you think need to have their styles invalidated when the JS code runs? 5 How many elements do you think actually get invalidated in Blink? 5 41
Invalidation game #3 <div class=“first”> .first h1 + p + p {
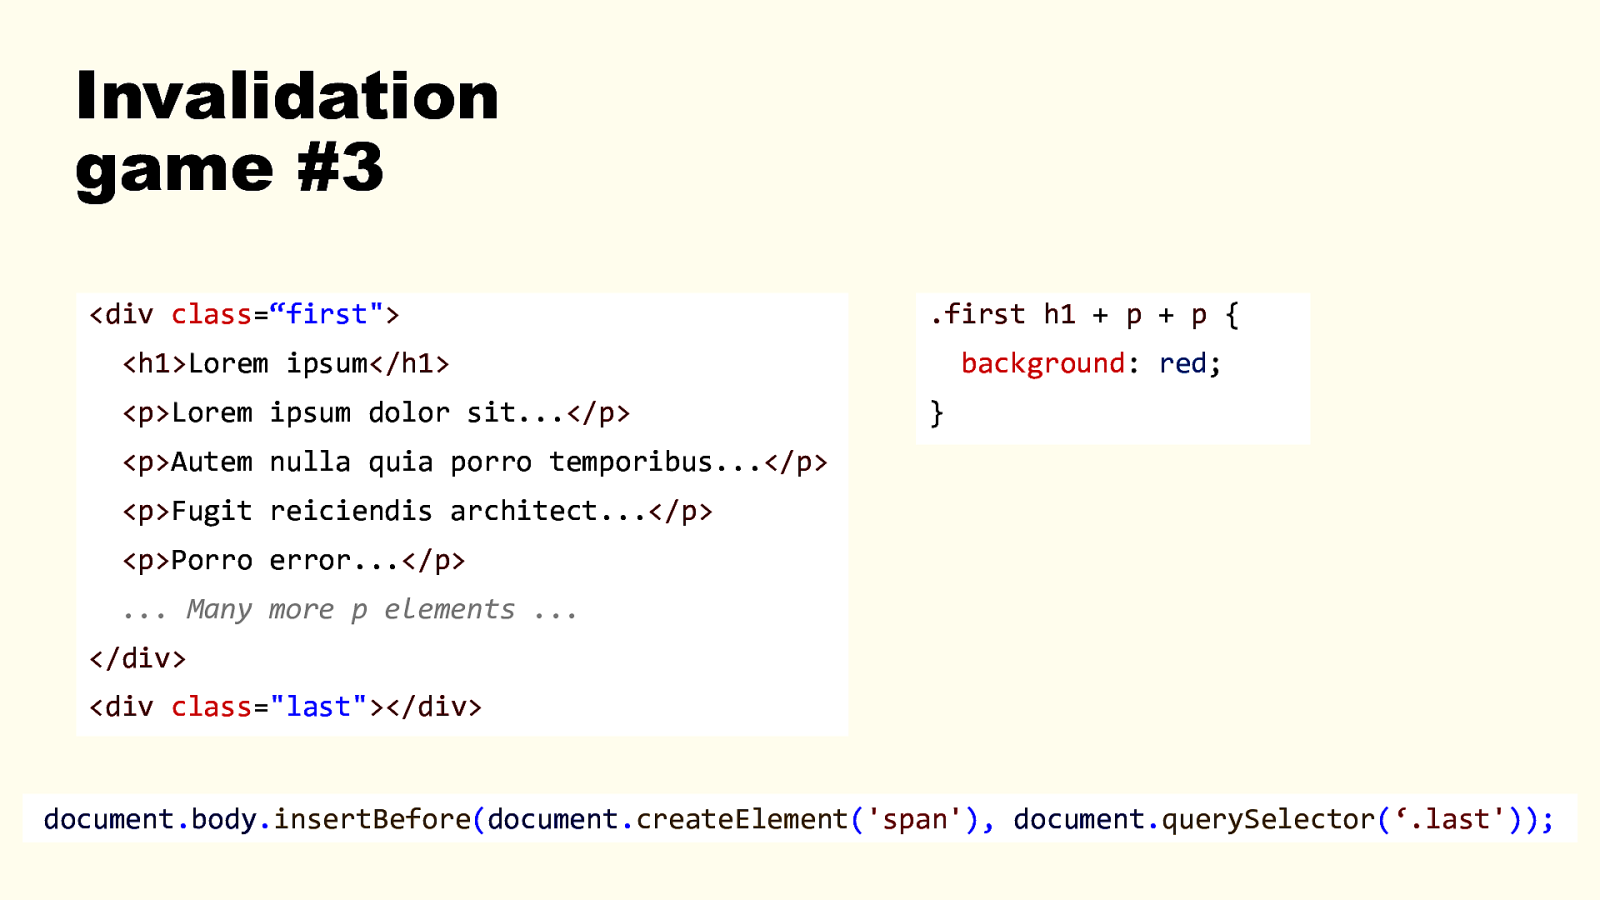
<h1>Lorem ipsum</h1> <p>Lorem ipsum dolor sit…</p> background: red; } <p>Autem nulla quia porro temporibus…</p> <p>Fugit reiciendis architect…</p> <p>Porro error…</p> … Many more p elements … </div> <div class=”last”></div> document.body.insertBefore(document.createElement(‘span’), document.querySelector(‘.last’)); How many elements do you think need to have their styles invalidated when the JS code runs? 0 or 1. 0, as in, nothing really changes, we’re just adding an empty span. 1, because the span’s user agent styles need to at least be computed. How many elements do you think actually get invalidated in Blink? All the <p> elements. If there are 1000 of them, they will all be invalidated, and therefore recalculated. Weird, if I insert a span elsewhere in the DOM, the `.things h1+p+p` rule should not need to be re-applied to anything. Even if browsers are super optimized, invalidation sets are always on the safe side. This particular selector, currently, creates a “universal” invalidation set. It flags all p as having invalid styles whatever happens in the DOM. 42
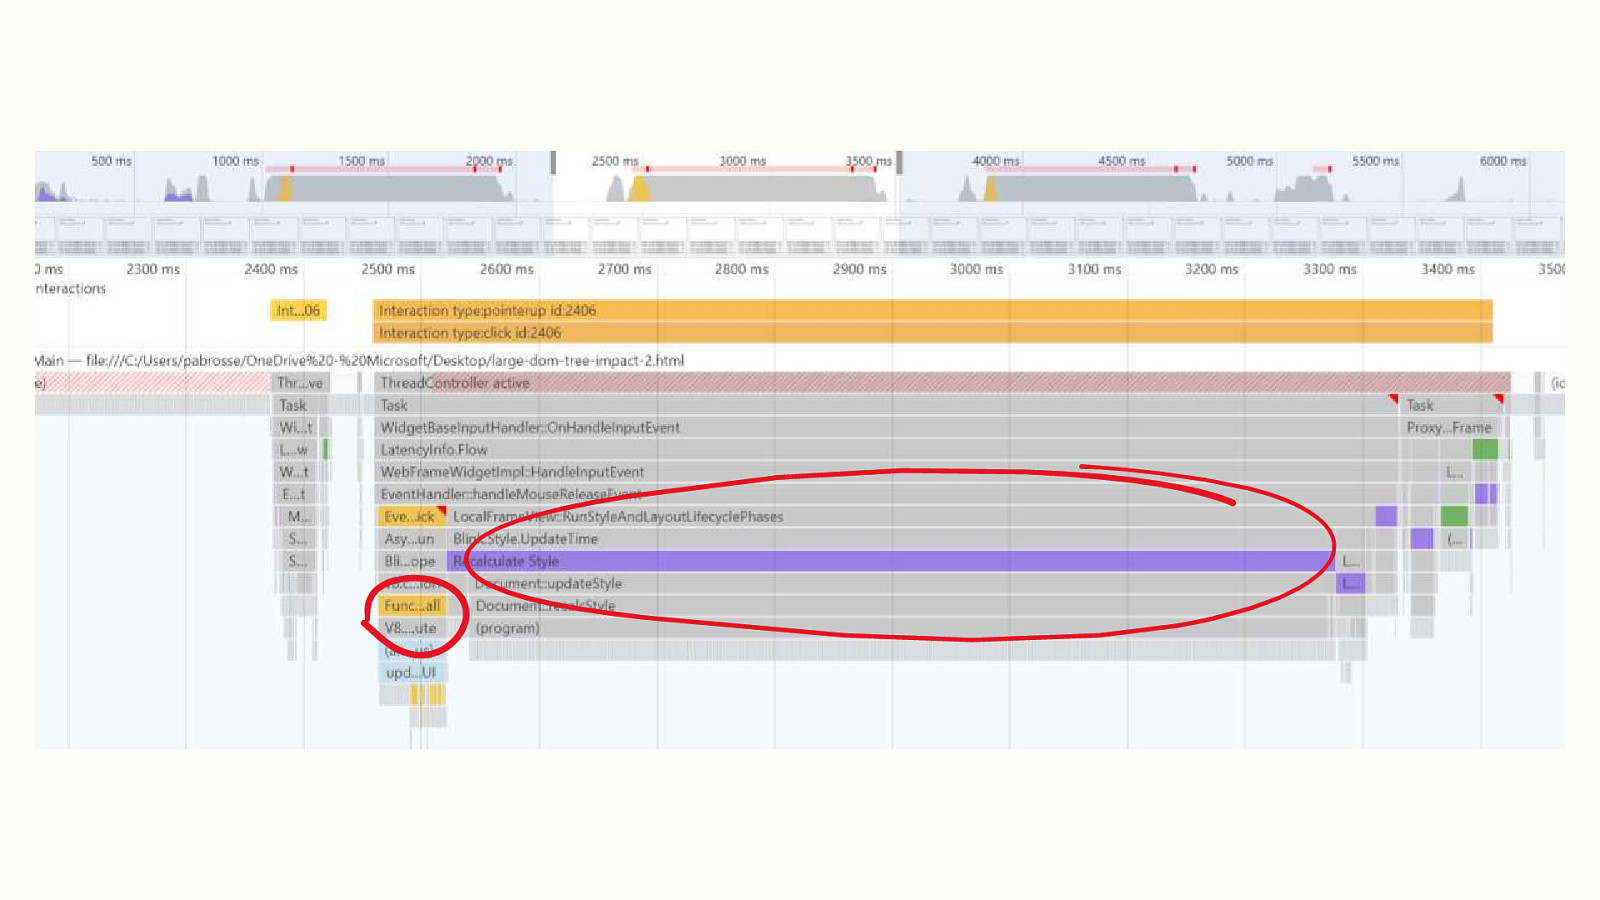
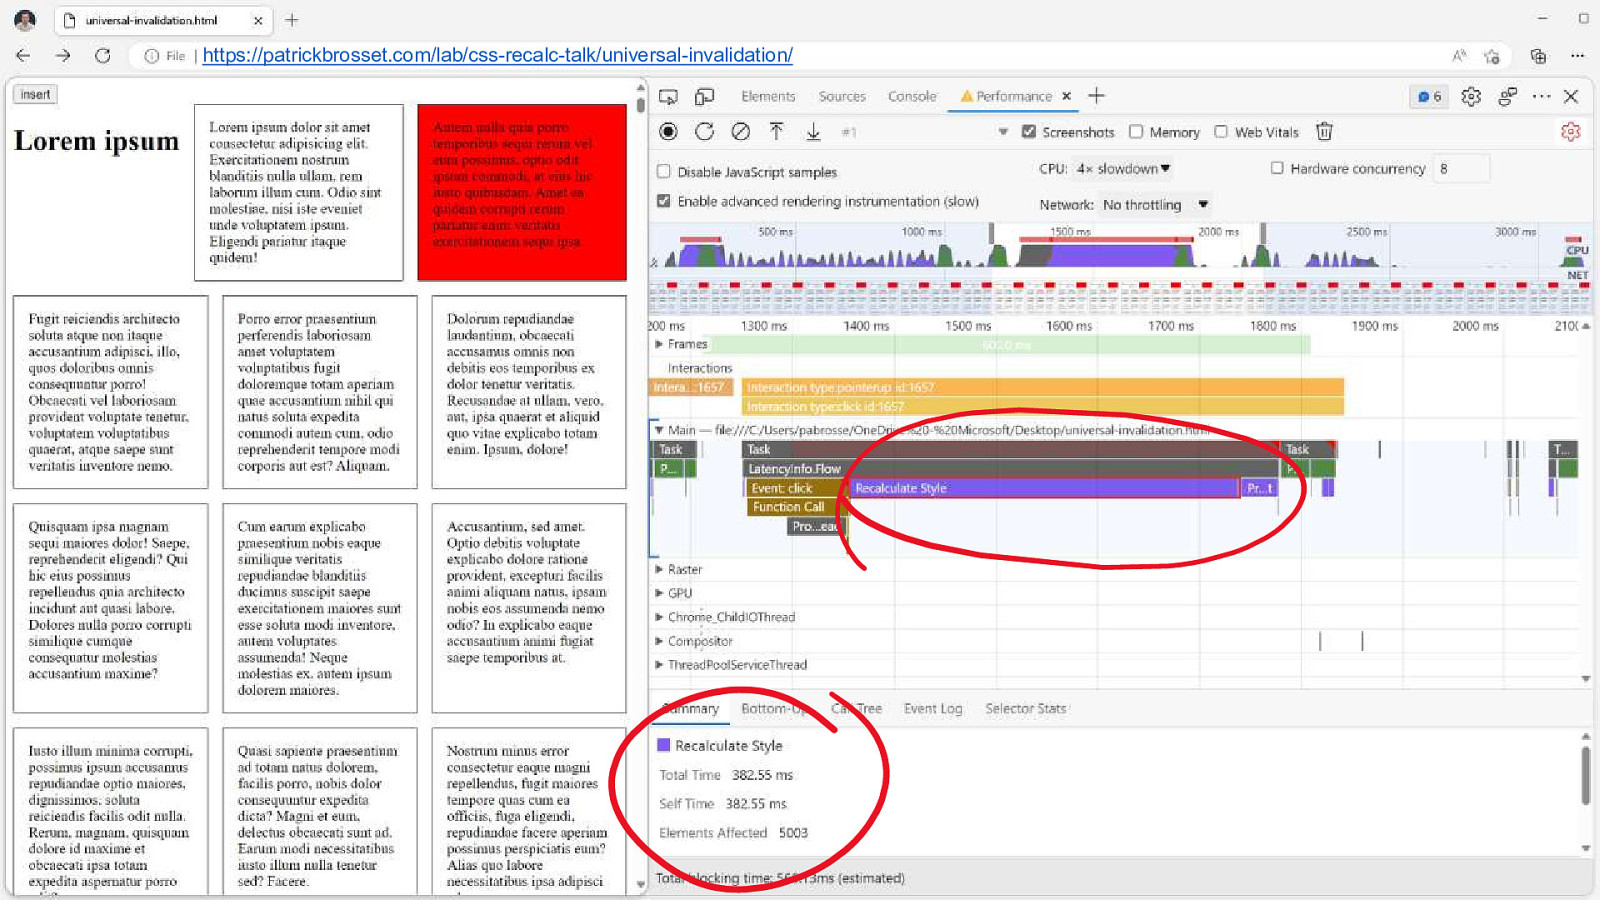
https://patrickbrosset.com/lab/css-recalc-talk/universal-invalidation/ Here is a performance trace of the scenario. Really long recalc style event. Almost 400ms long. Affecting 5000 elements. DEMO: http://patrickbrosset.com/lab/css-recalc-talk/universal-invalidation/ 43
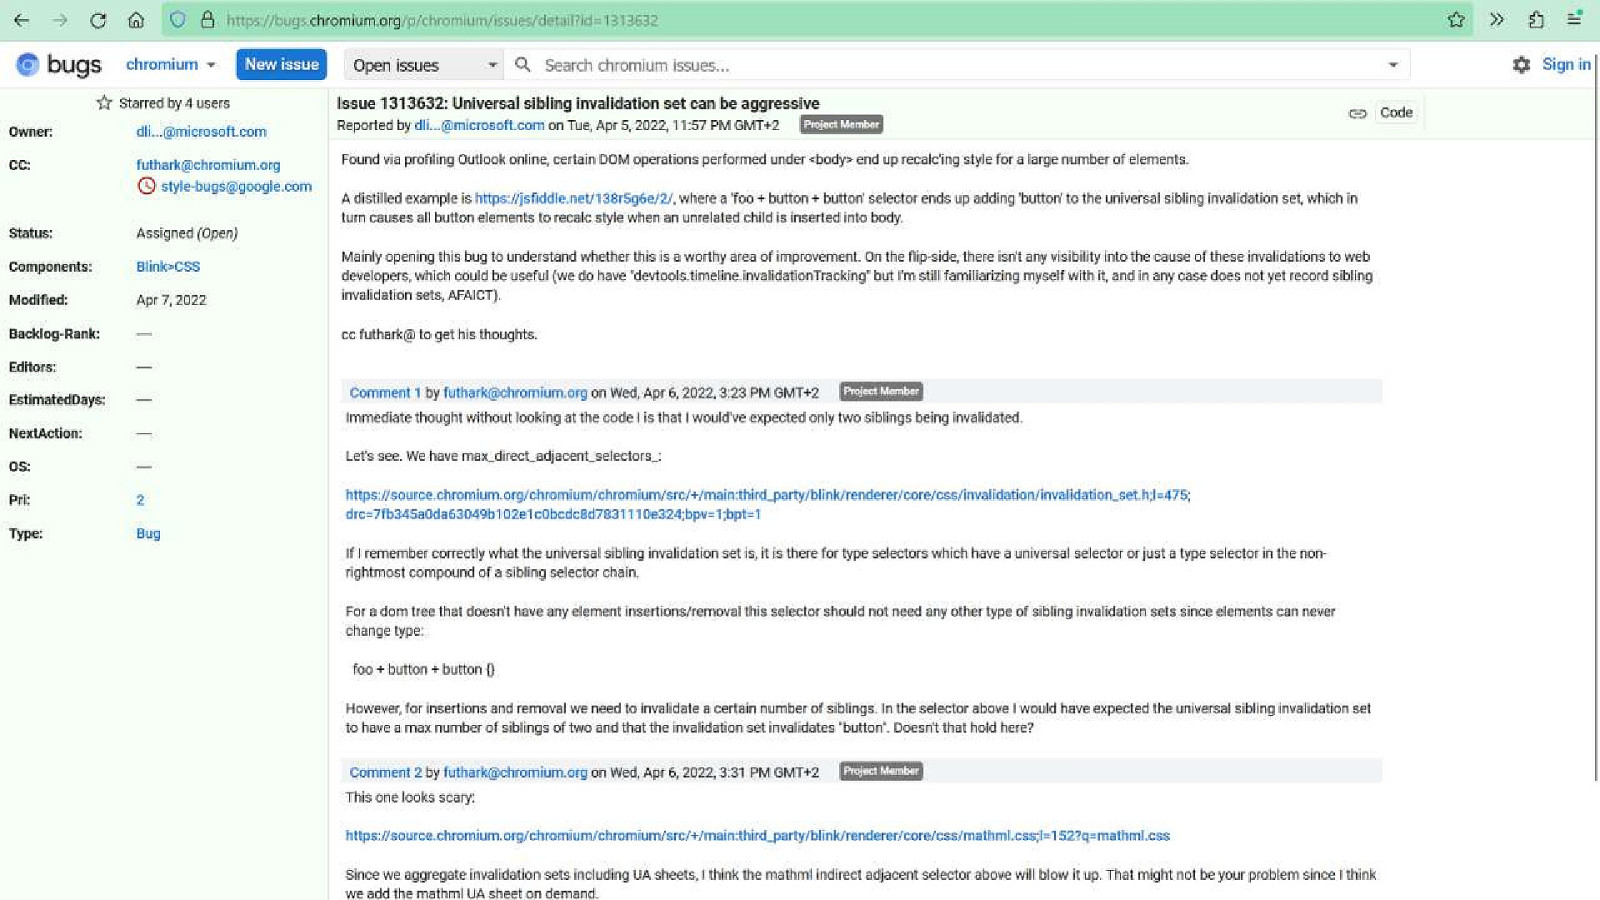
There’s a bug in chromium about this https://bugs.chromium.org/p/chromium/issues/detail?id=1313632 Still opened. Could be fixed tomorrow. These things change all the time. And this is what was happening to us. We were using a tooltip library that was inserting elements into the DOM, directly under <body> And because we had this + + selector, every time the tooltip appeared, all children of <body> were invalidated and had their styles recalculated! 44
Chapter 4 The ignorant compliant Now all of this is quite complex, and most of us choose to deal with it in one of two ways: 45

Solution #1 Ignore the problem Ignoring that this even exists. Many people go happily through their lives not knowing much about how rendering happens in browsers and investigating rendering issues. And that’s fine. We’ve all done it. or… 46
Solution #2 Comply with arbitrary rules

Let me make a parallel… 47

Remember JS micro benchmarks? Remember JS micro benchmarks? 48
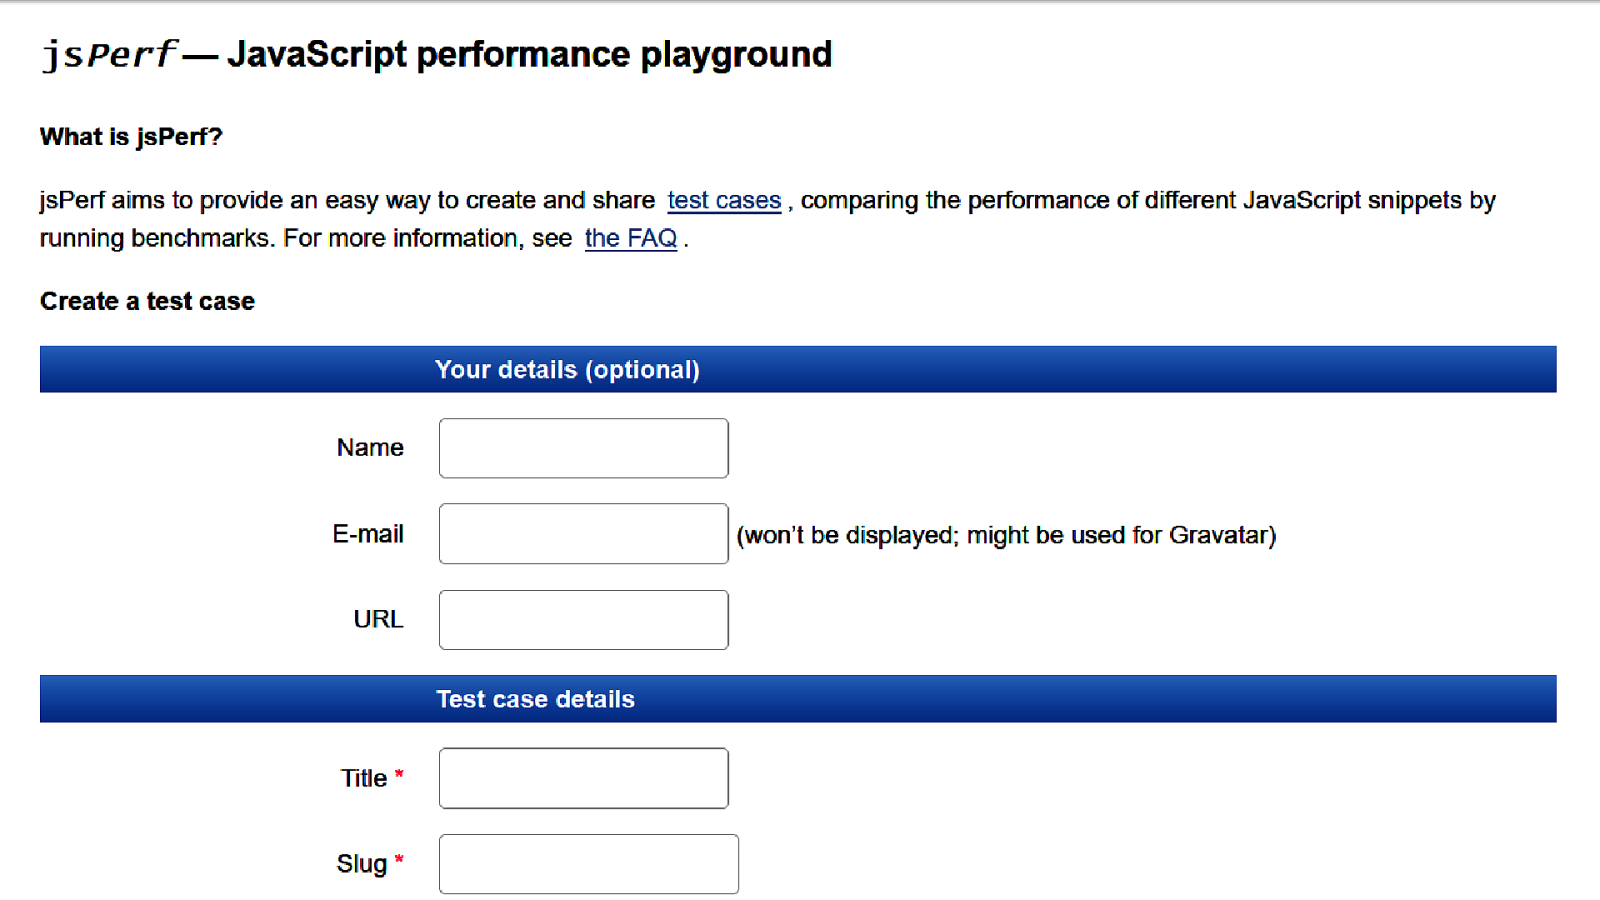
Remember jsperf.com? 49
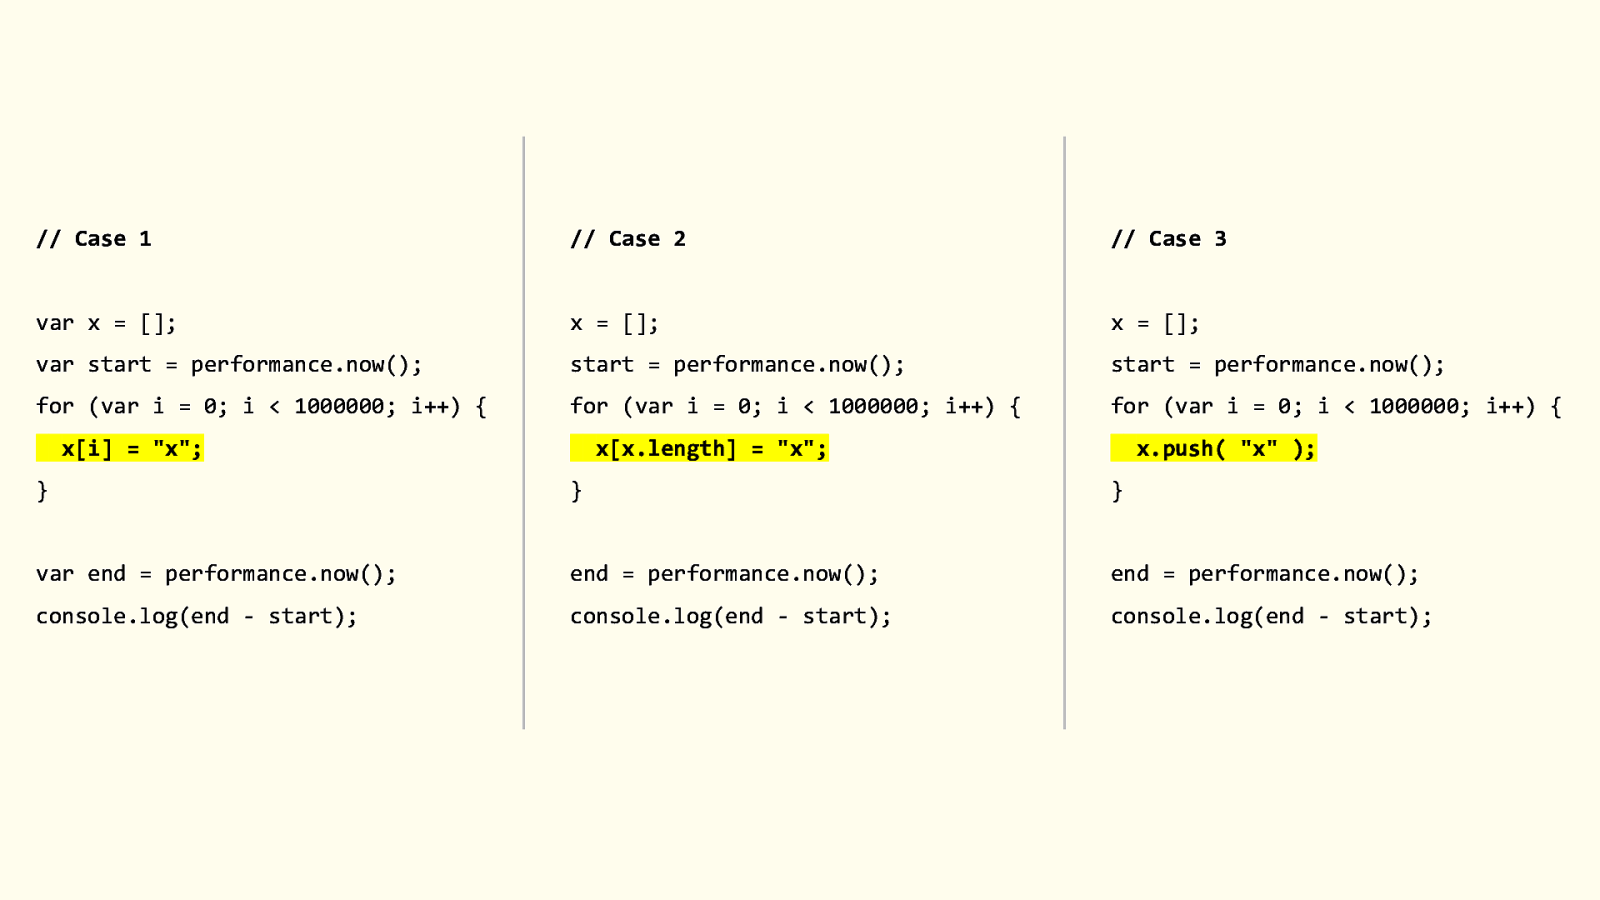
// Case 1 // Case 2 // Case 3 var x = []; x = []; x = []; var start = performance.now(); start = performance.now(); start = performance.now(); for (var i = 0; i < 1000000; i++) { for (var i = 0; i < 1000000; i++) { for (var i = 0; i < 1000000; i++) { x[i] = “x”; x[x.length] = “x”; x.push( “x” ); } } } var end = performance.now(); end = performance.now(); end = performance.now(); console.log(end - start); console.log(end - start); console.log(end - start); jsperf allowed us to super easily set up tests like this and compare which approach was faster. And, sure, if you’re doing this millions of times in a row, there might be a difference. Imagine case 2 is the fastest. Does that mean you should create a rule for always using this way of adding to arrays, and enforce it in code reviews, or with automated tools? Most likely not. Code readability will suffer. It will be weird for new people to understand your code base. And people won’t like you anymore. But the thing is, when we don’t know and don’t have the time or interest to know, we tend to blindly follow these rules. Look, a lot of people are just trying to make a living here. 50
And maybe this rule makes sense when you’re looping over millions of items, but in most cases it won’t matter. 50
The same existed for a while with CSS. I think, as a community, we’ve outgrown this, but there was a time when we told ourselves stories about which CSS selectors were the fastest. And which ones to avoid. For example, we’ve said that the * universal selector was slower than using a class, or that attribute selectors are the slowest of them all. Does this even matter? Browser implementations change all the time. What was slow yesterday may have been fixed tomorrow in a browser. But more importantly, on your website, does this selector actually make things slow? Did you measure? Wasn’t there something else to improve first? 51
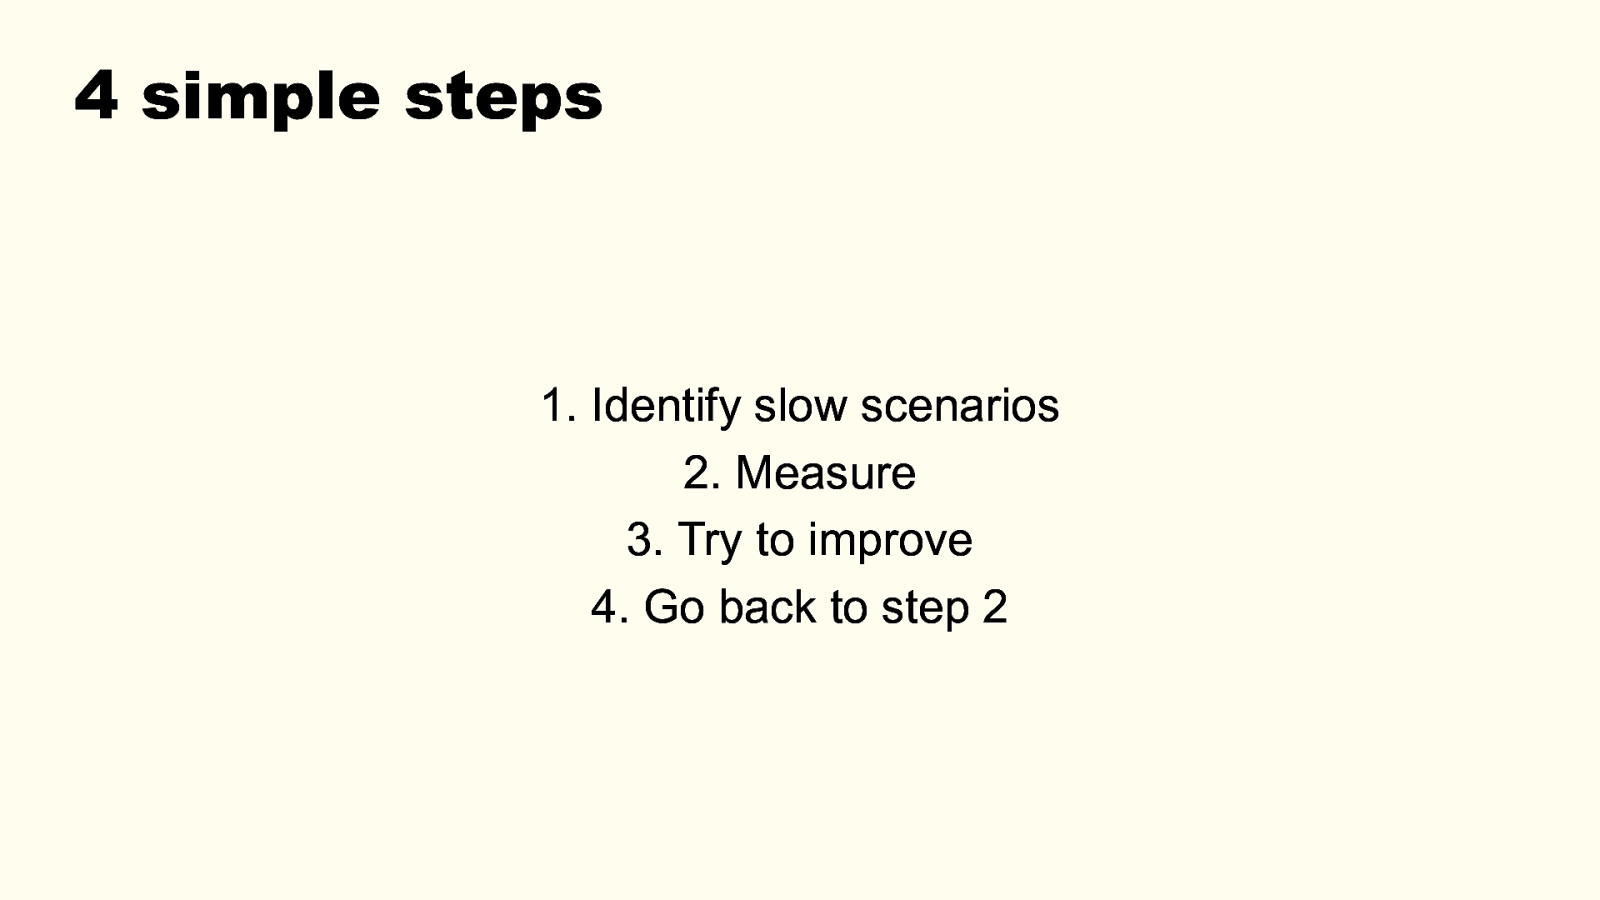
4 simple steps

Chapter 5 DevTools
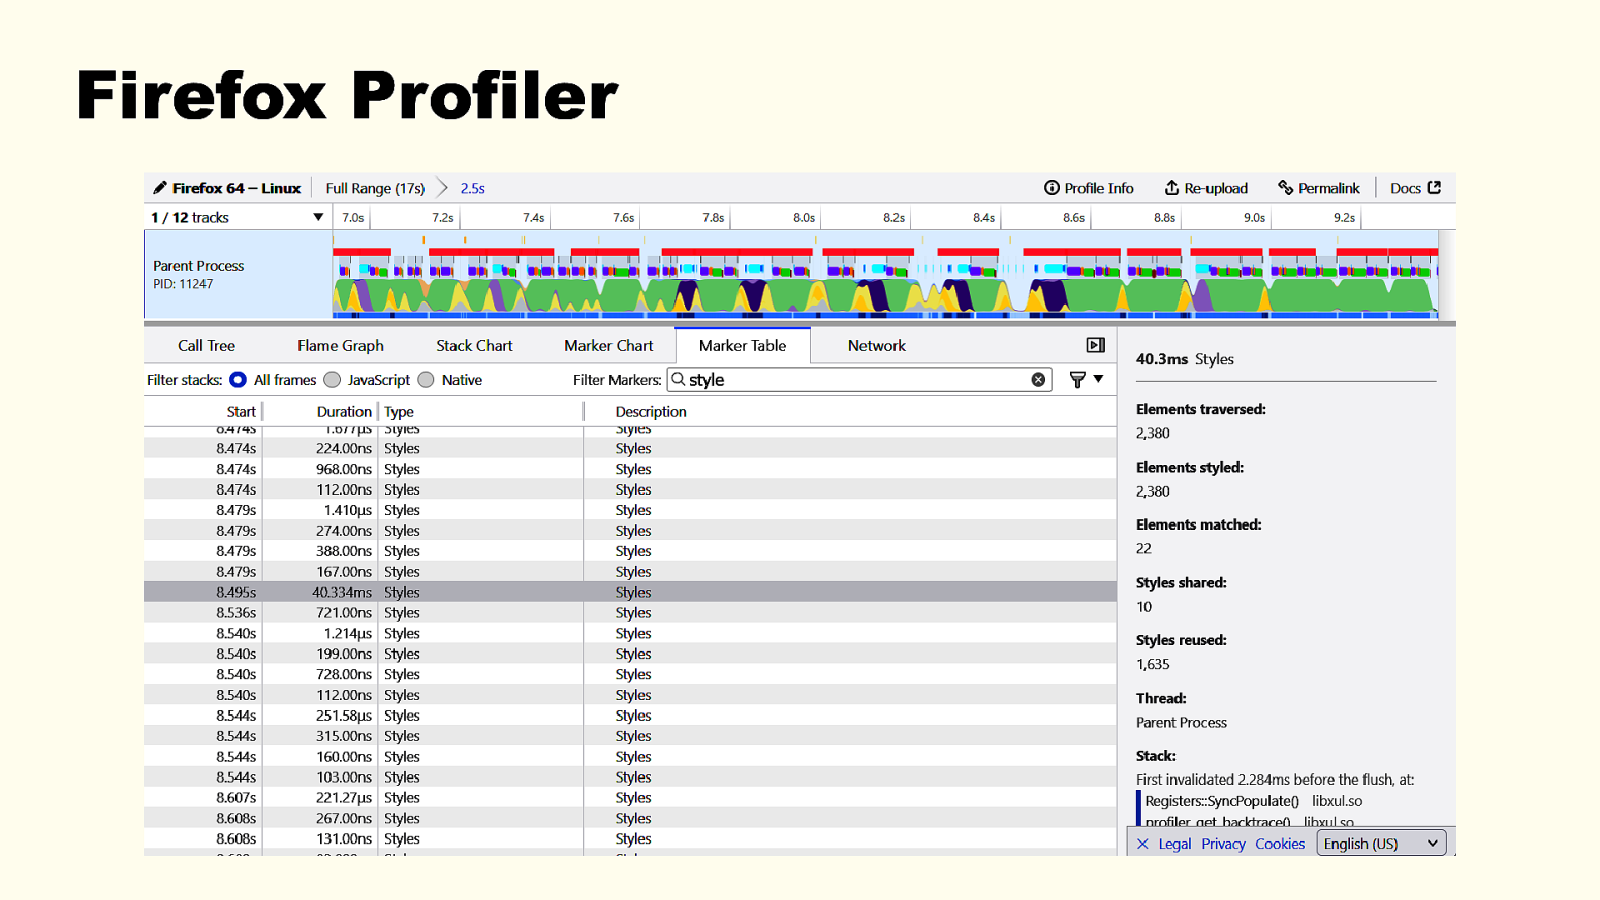
It’s like trying to debug/inspect your site without the Elements or Console panels. How many of you have been long enough in web dev to remember the early days without any tools? Even before Firebug, or the IE tools? I have! And we only had alert() at the time. When it comes to style perf debugging, 53