Better Reliability With SLOs Daniel Maher Developer Relations
Slide 1
Slide 2

Better Reliability With SLOs Daniel “phrawzty” Maher Developer Relations
Slide 3
What we’ll cover today – SLIs, SLOs, and SLAs – Defining quality targets – Error budgets – Practical examples @phrawzty
Slide 4
SLIs, SLOs, & SLAs @phrawzty
Slide 5
A Service Level Indicator is a quantitative measurement that expresses an aspect of the service (commonly a metric). SLIs @phrawzty Image credit: Indicator by Nhor from the Noun Project
Slide 6
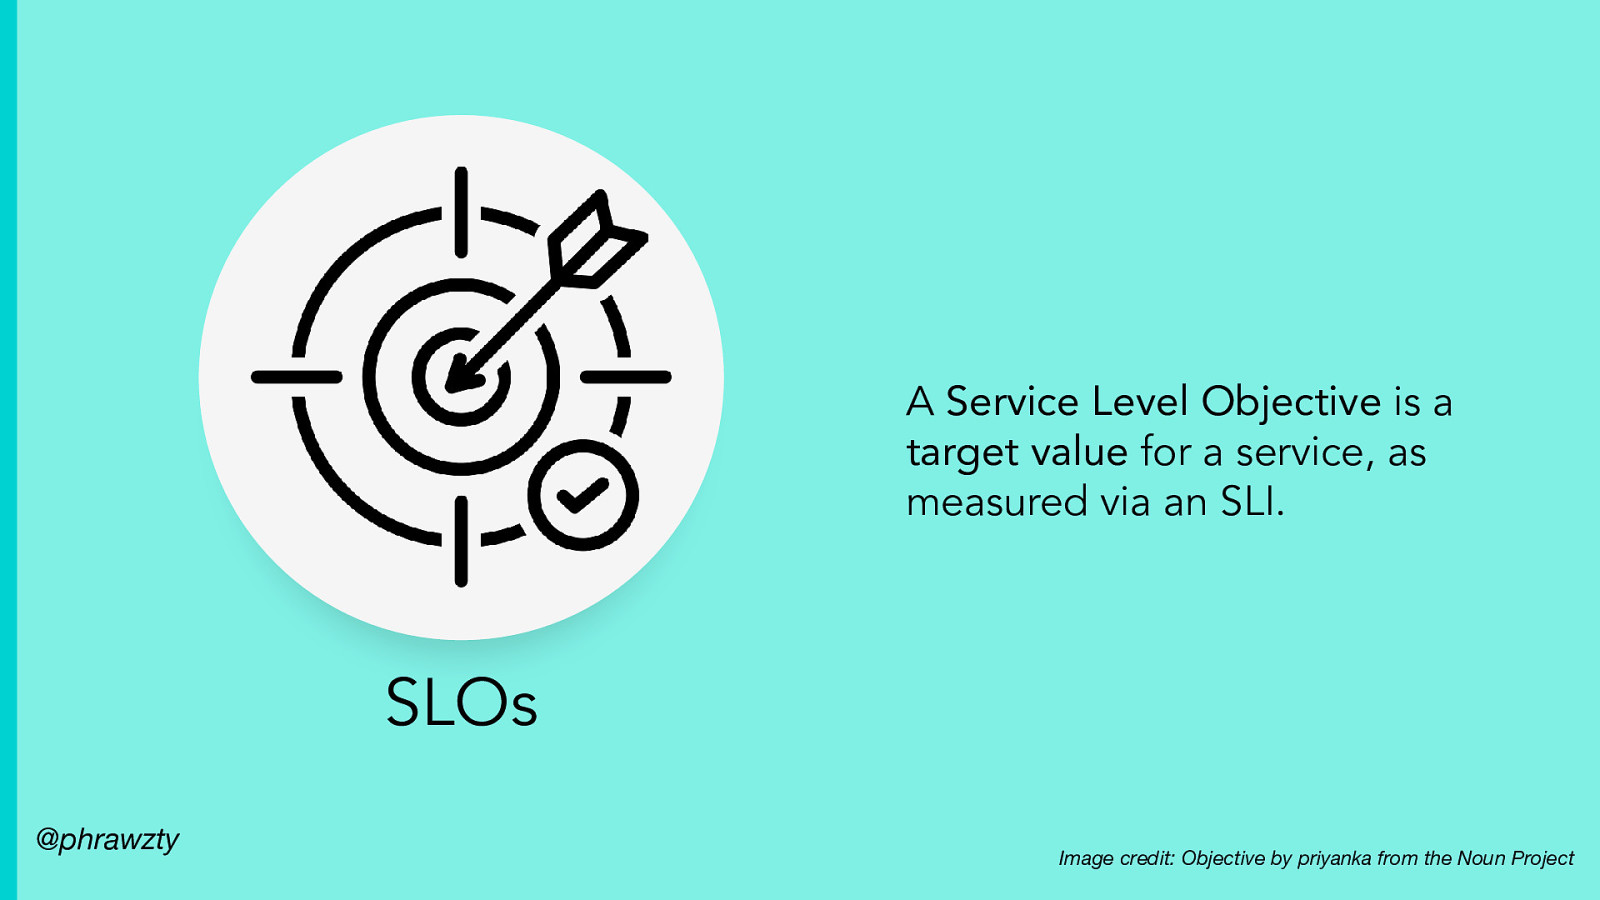
A Service Level Objective is a target value for a service, as measured via an SLI. SLOs @phrawzty Image credit: Objective by priyanka from the Noun Project
Slide 7
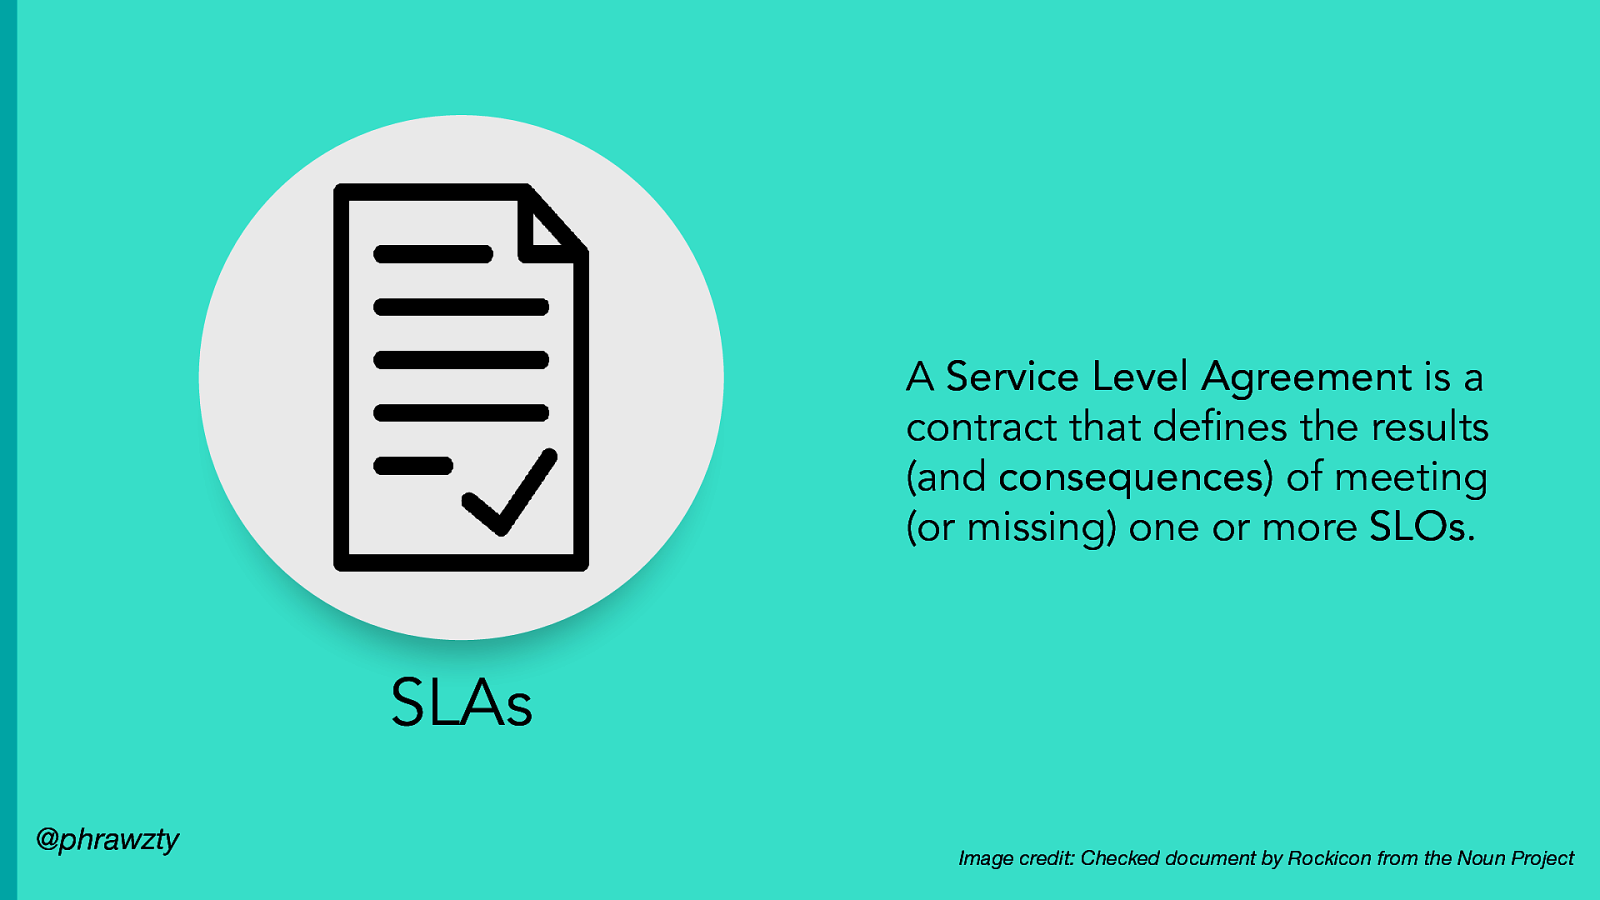
A Service Level Agreement is a contract that defines the results (and consequences) of meeting (or missing) one or more SLOs. SLAs @phrawzty Image credit: Checked document by Rockicon from the Noun Project
Slide 8
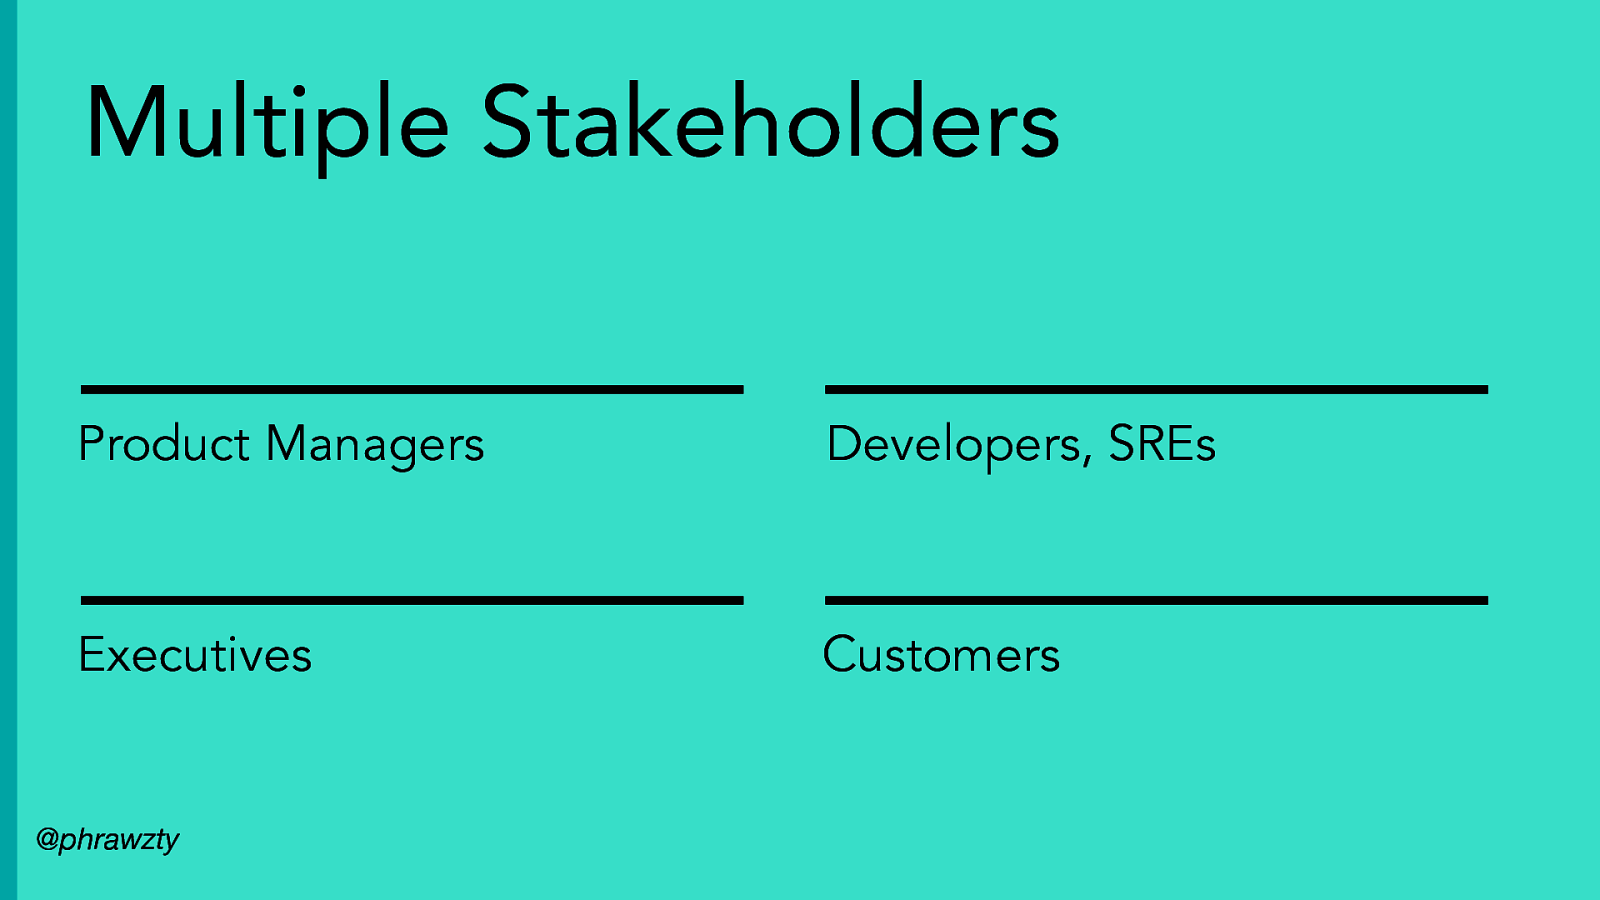
Multiple Stakeholders Product Managers Developers, SREs Executives Customers @phrawzty
Slide 9
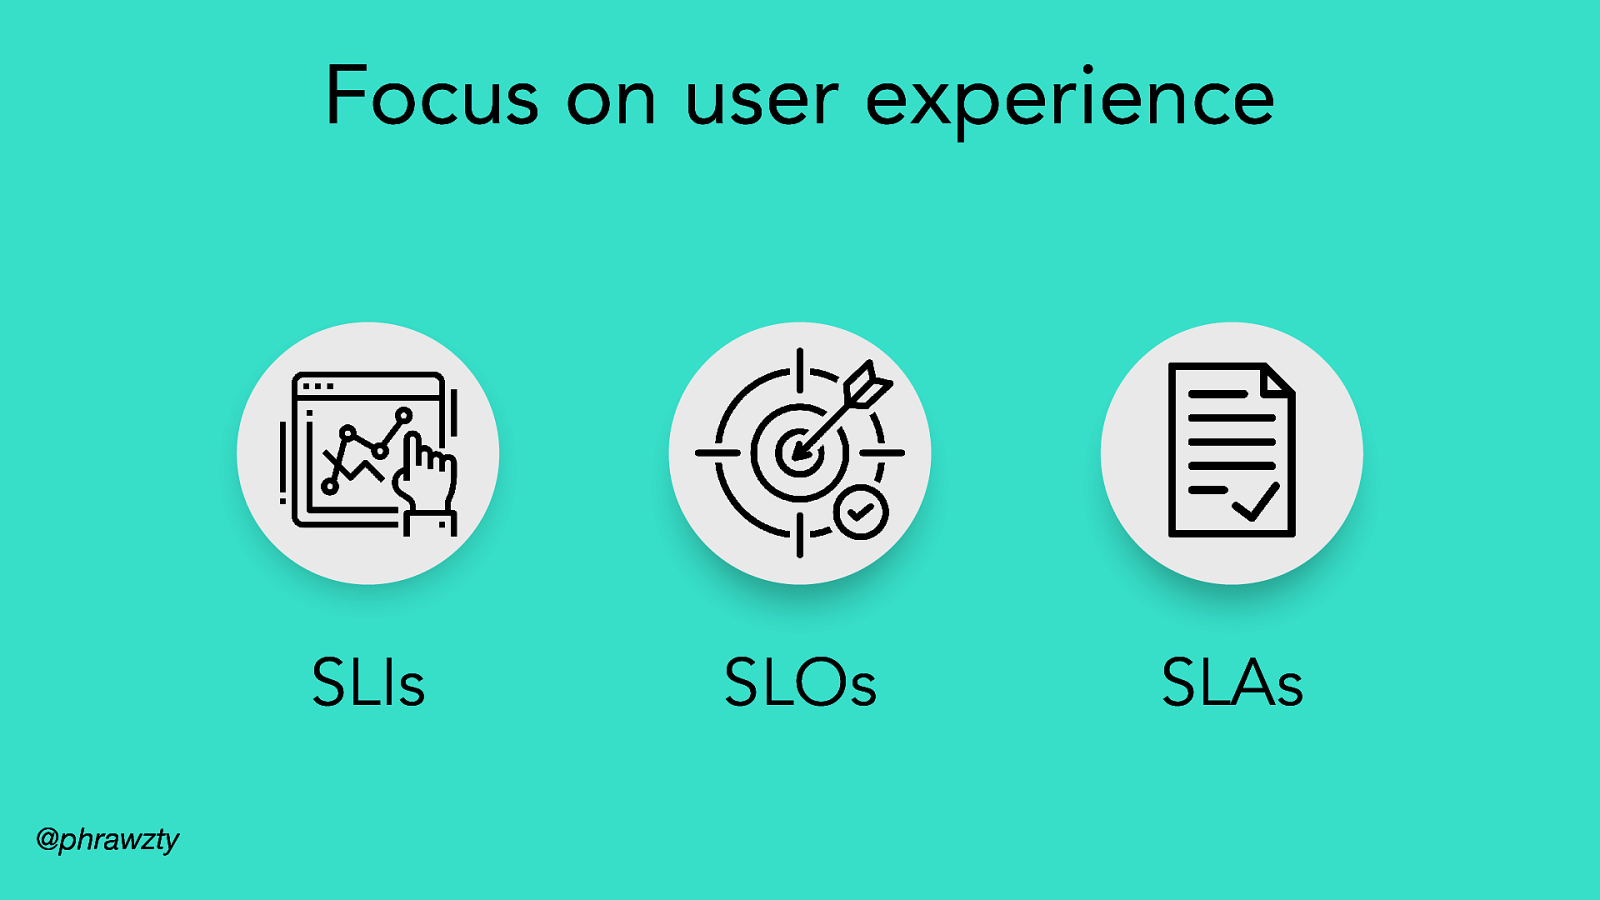
Focus on user experience SLIs @phrawzty SLOs SLAs
Slide 10
Defining quality targets
Slide 11
User experience is everything ● How are they interacting with your product? @phrawzty
Slide 12
User experience is everything ● How are they interacting with your product? ● What is their workflow? @phrawzty
Slide 13
User experience is everything ● How are they interacting with your product? ● What is their workflow? ● What services do they interact with? @phrawzty
Slide 14
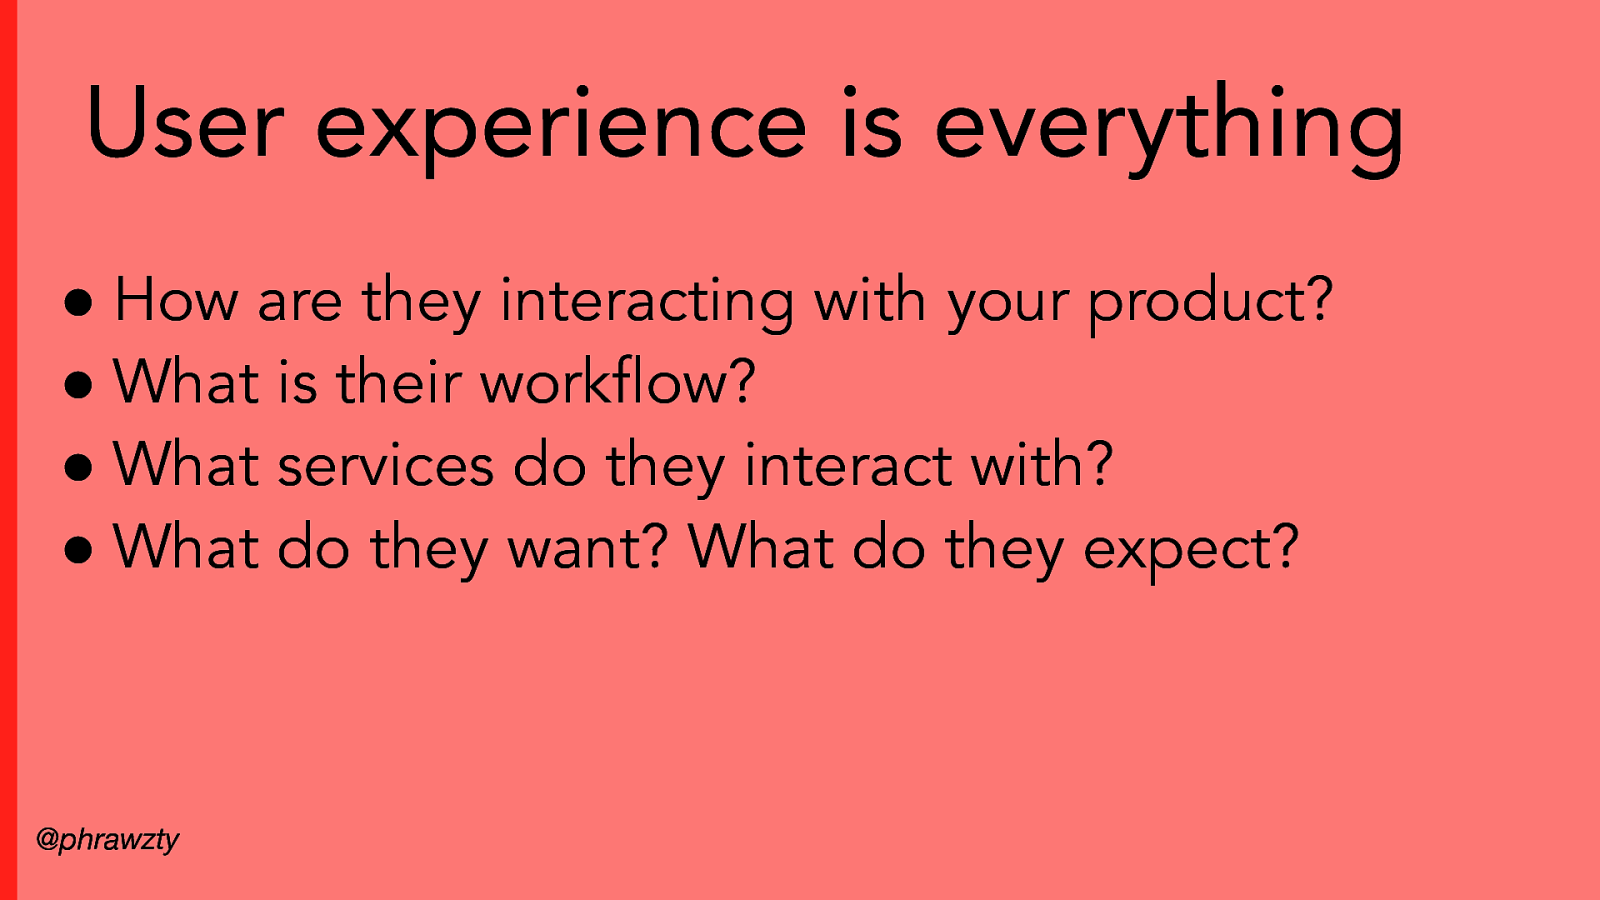
User experience is everything ● How are they interacting with your product? ● What is their workflow? ● What services do they interact with? ● What do they want? What do they expect? @phrawzty
Slide 15
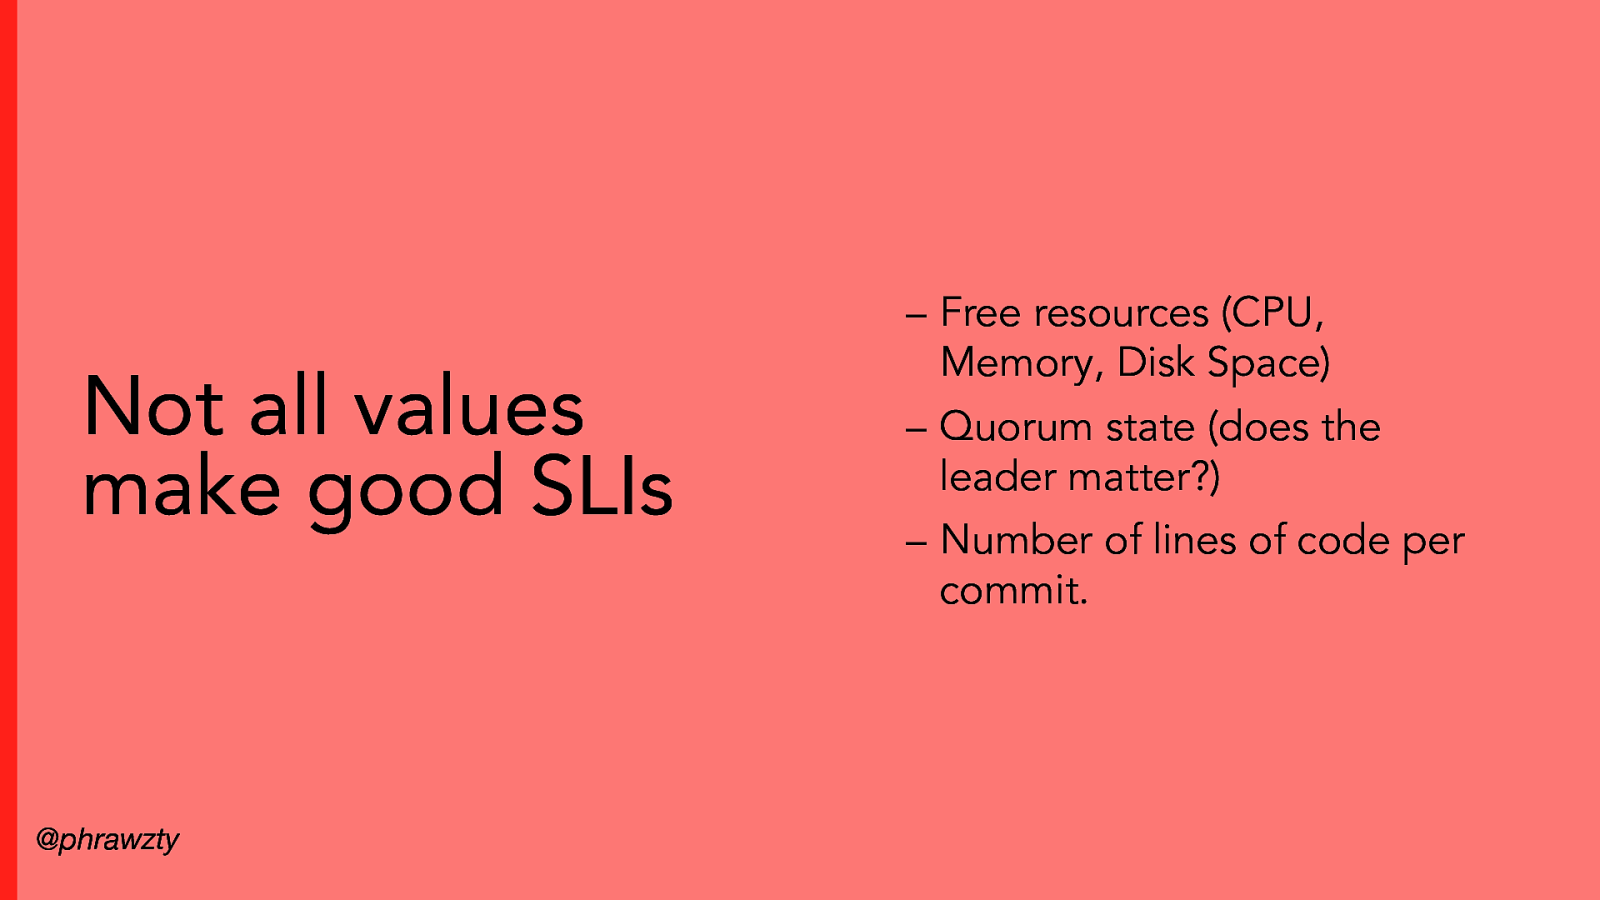
Not all values make good SLIs @phrawzty – Free resources (CPU, Memory, Disk Space) – Quorum state (does the leader matter?) – Number of lines of code per commit.
Slide 16
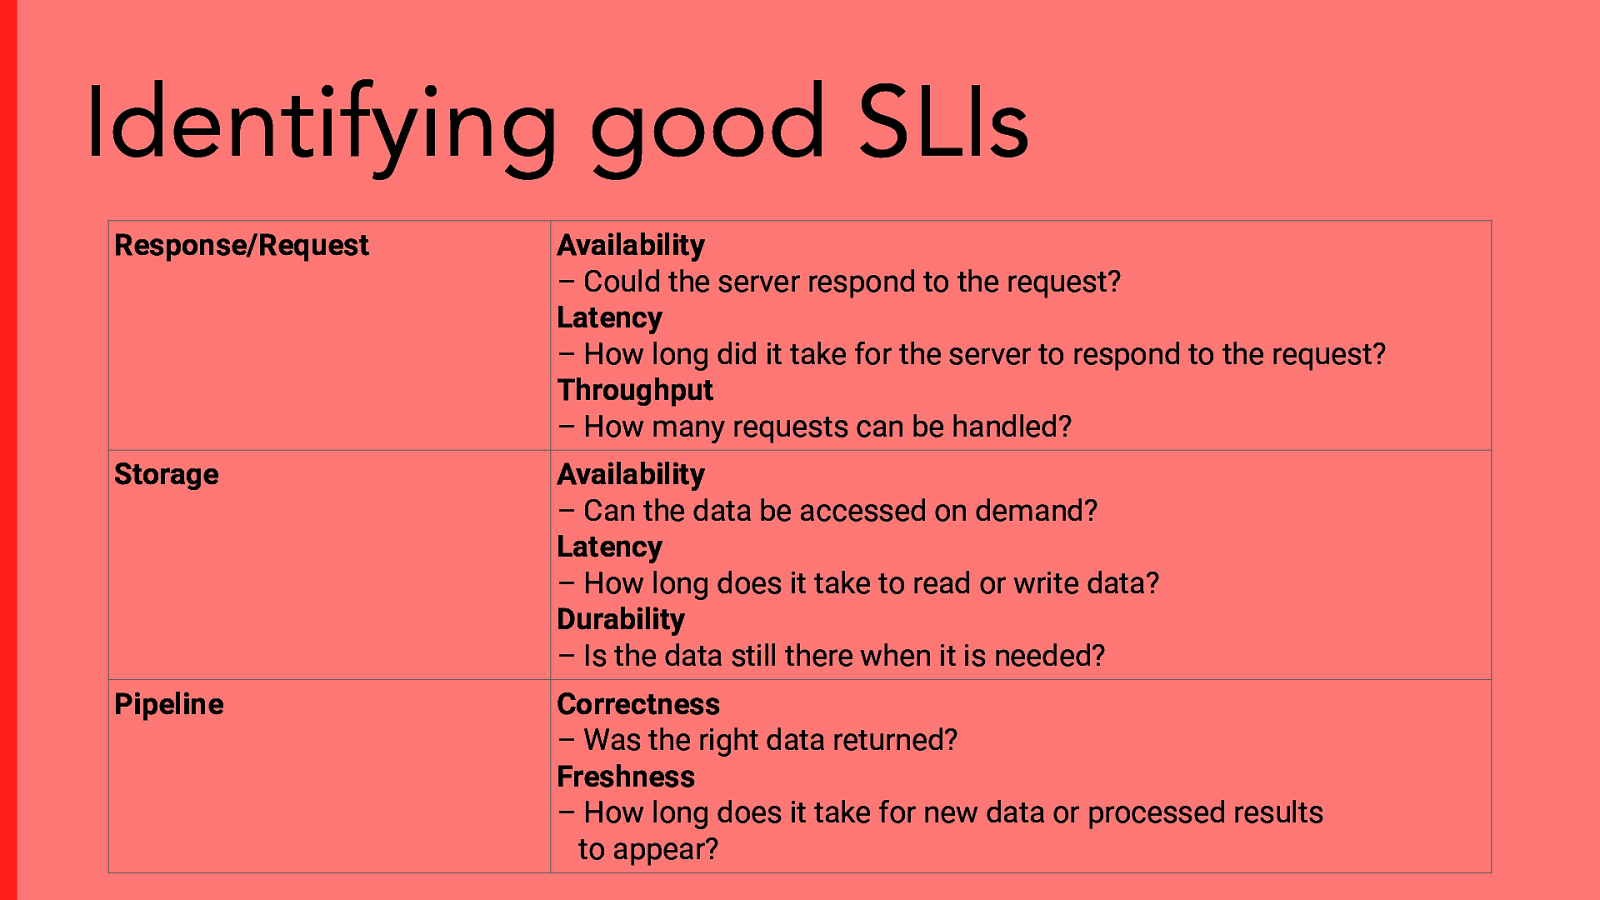
Identifying good SLIs Response/Request Availability – Could the server respond to the request? Latency – How long did it take for the server to respond to the request? Throughput – How many requests can be handled? Storage Availability – Can the data be accessed on demand? Latency – How long does it take to read or write data? Durability – Is the data still there when it is needed? Pipeline Correctness – Was the right data returned? Freshness – How long does it take for new data or processed results to appear?
Slide 17
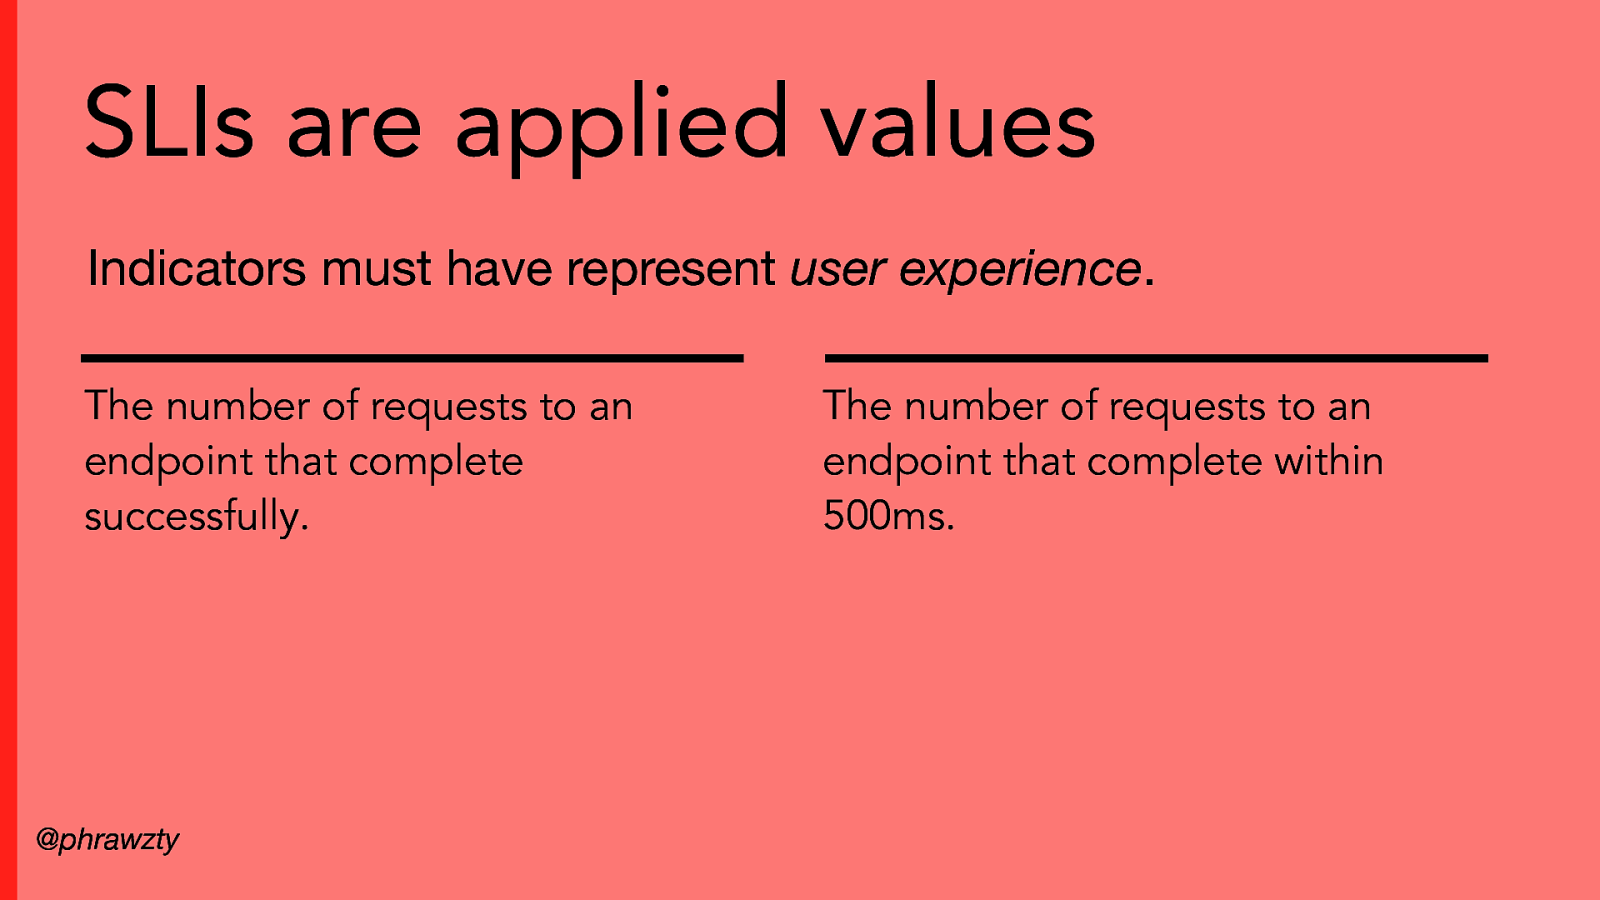
SLIs are applied values Indicators must have represent user experience. The number of requests to an endpoint that complete successfully. @phrawzty The number of requests to an endpoint that complete within 500ms.
Slide 18
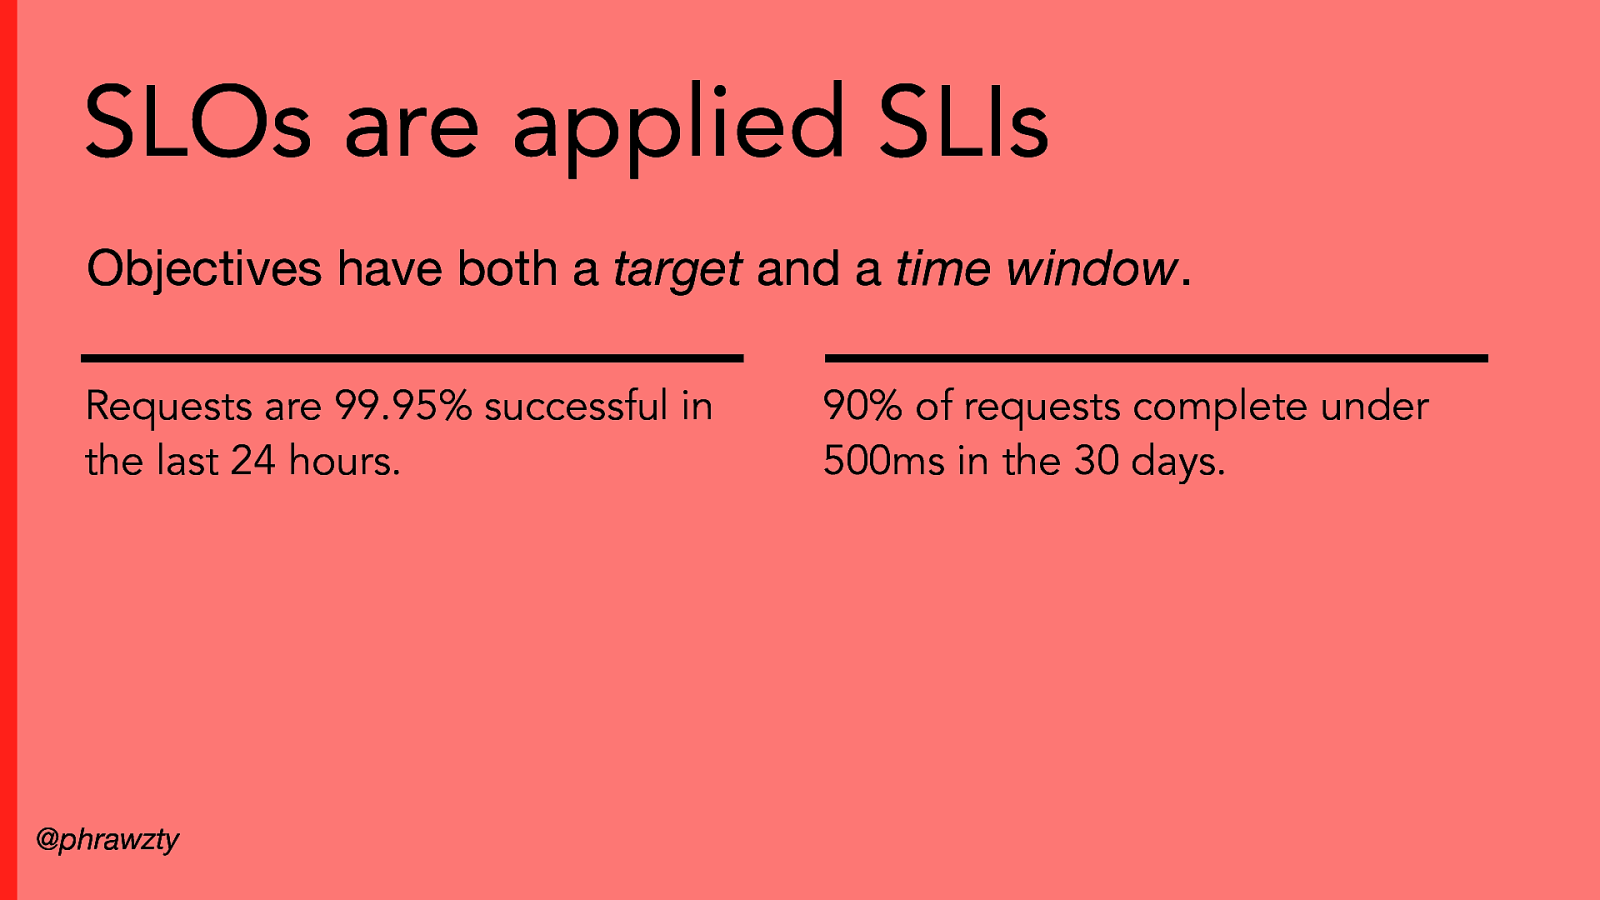
SLOs are applied SLIs Objectives have both a target and a time window. Requests are 99.95% successful in the last 24 hours. @phrawzty 90% of requests complete under 500ms in the 30 days.
Slide 19
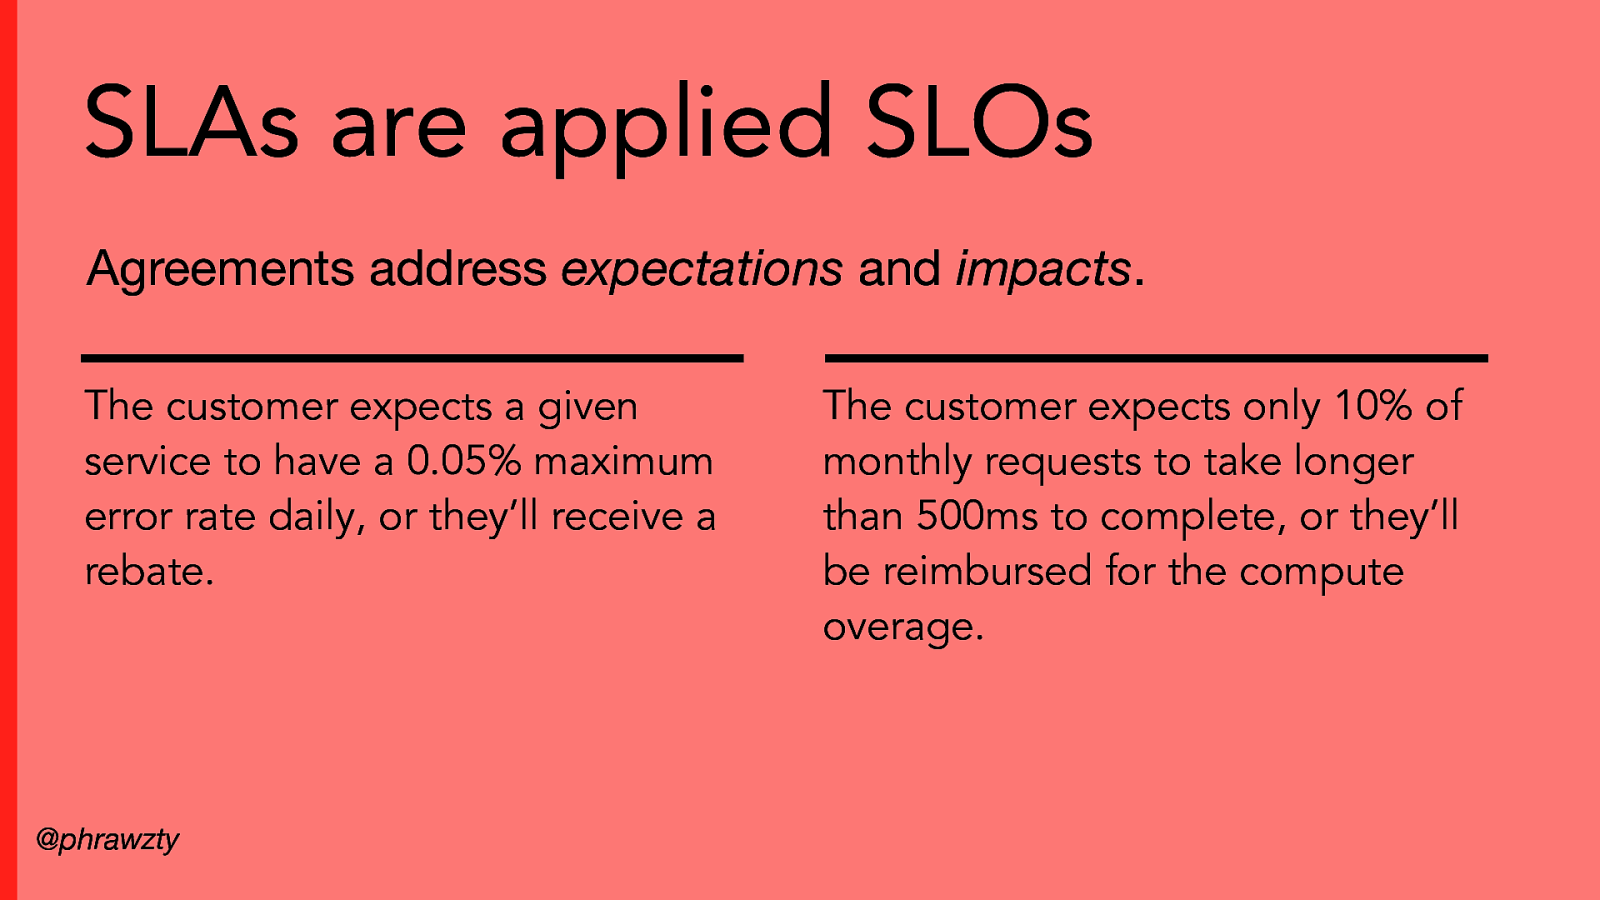
SLAs are applied SLOs Agreements address expectations and impacts. The customer expects a given service to have a 0.05% maximum error rate daily, or they’ll receive a rebate. @phrawzty The customer expects only 10% of monthly requests to take longer than 500ms to complete, or they’ll be reimbursed for the compute overage.
Slide 20
Error Budgets
Slide 21
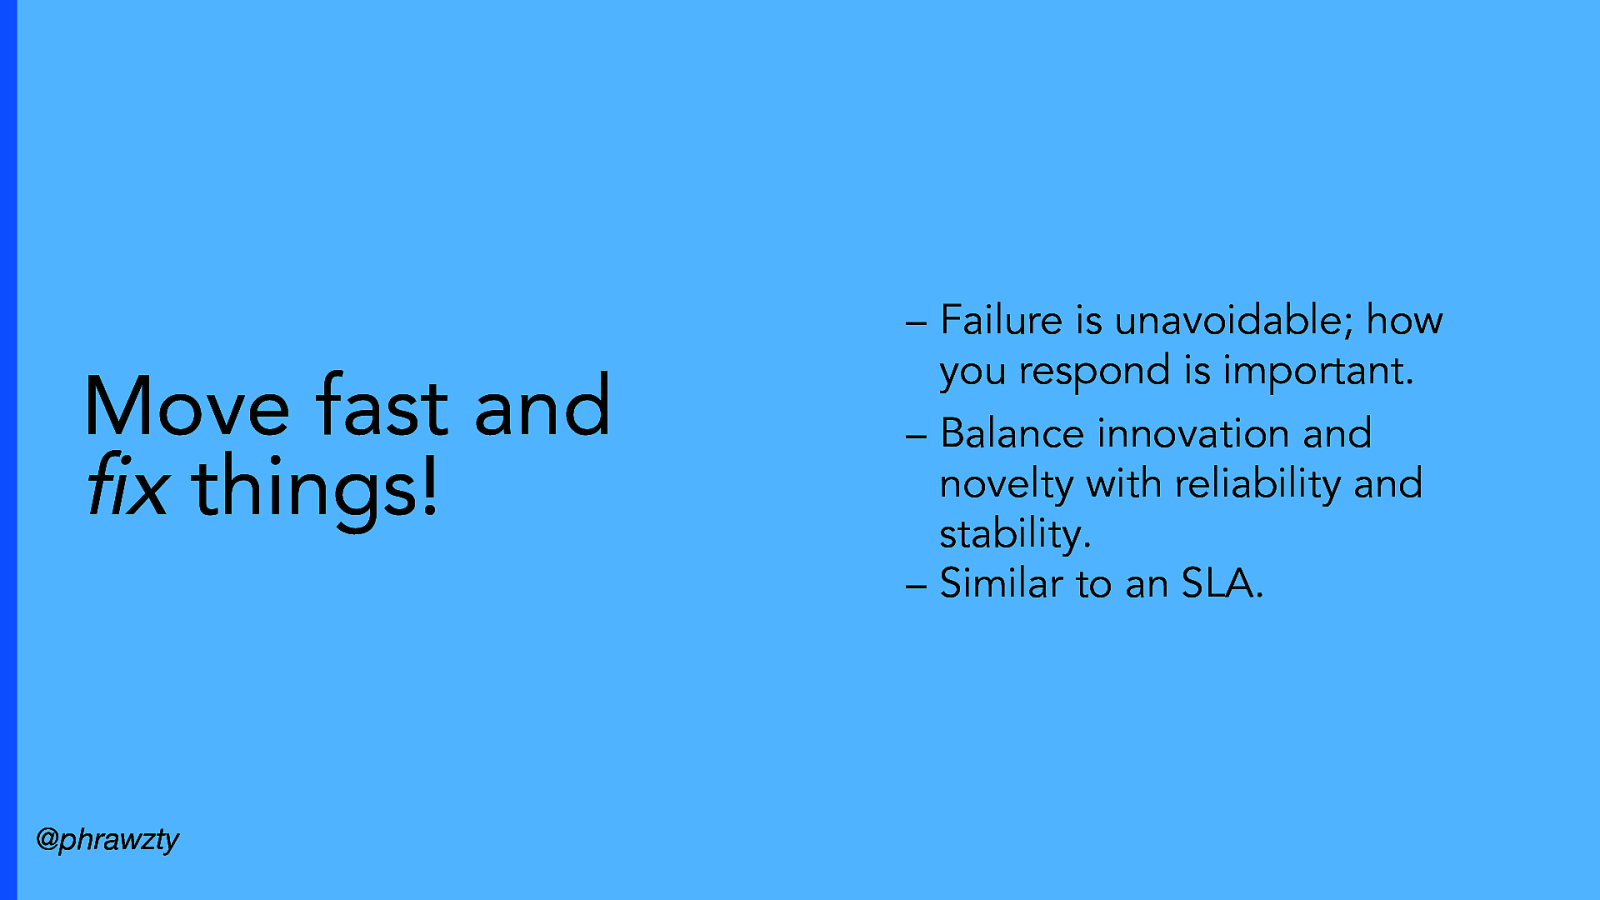
Move fast and fix things! @phrawzty – Failure is unavoidable; how you respond is important. – Balance innovation and novelty with reliability and stability. – Similar to an SLA.
Slide 22
Building an Error Budget ● An SLO is identified by the product owner. @phrawzty
Slide 23
Building an Error Budget ● An SLO is identified by the product owner. ● The actual objective is measured by a neutral party (hint: a monitoring system). @phrawzty
Slide 24
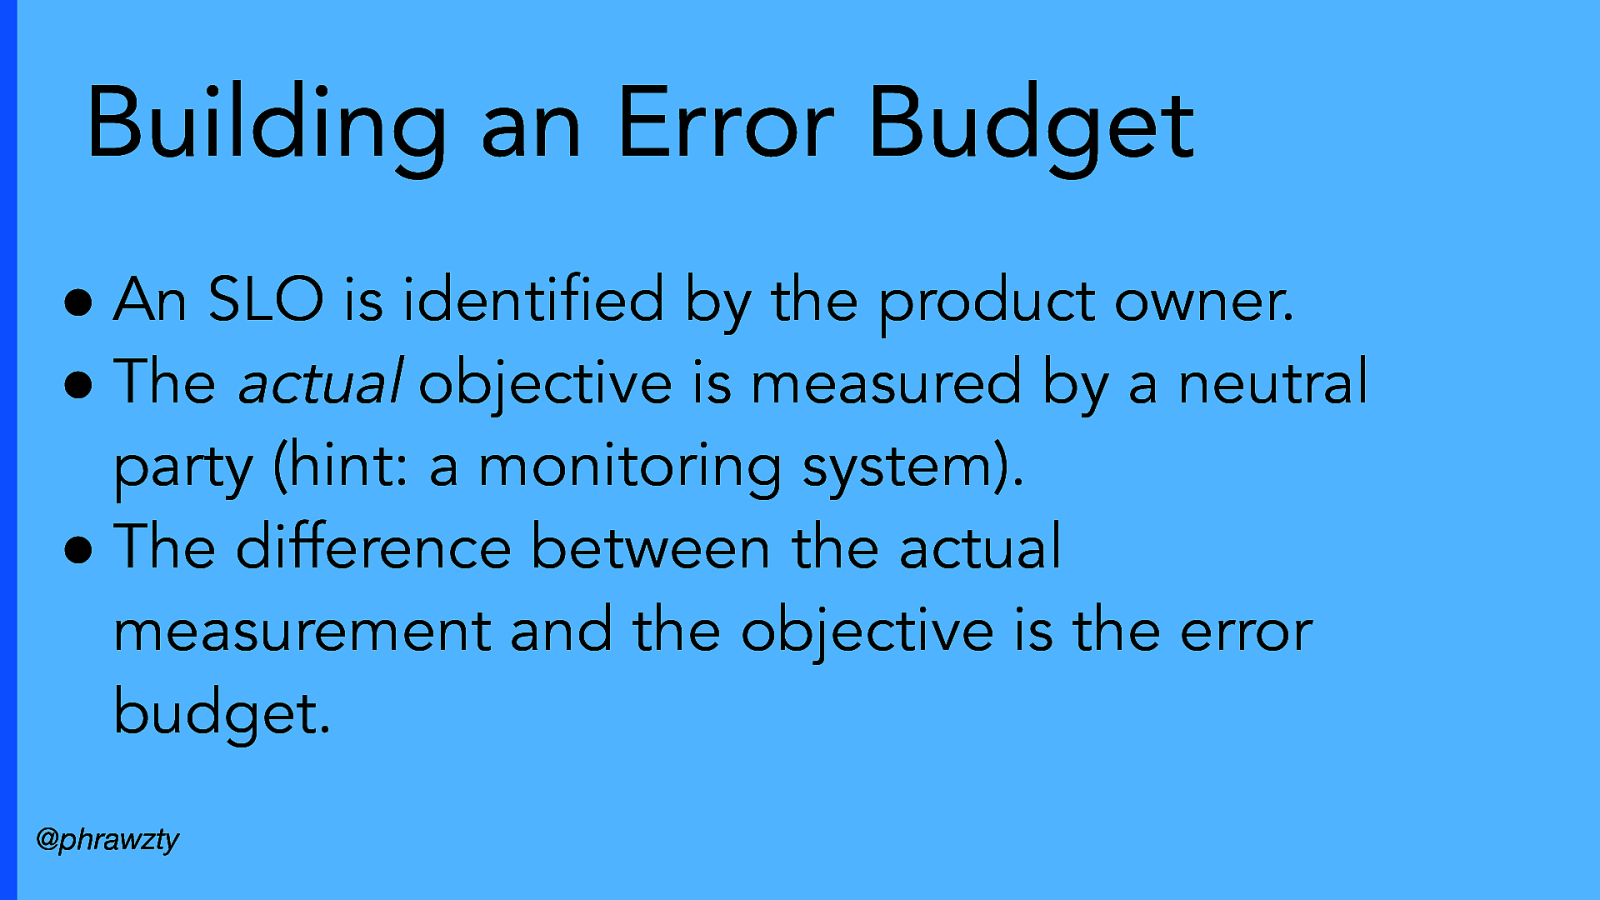
Building an Error Budget ● An SLO is identified by the product owner. ● The actual objective is measured by a neutral party (hint: a monitoring system). ● The difference between the actual measurement and the objective is the error budget. @phrawzty
Slide 25
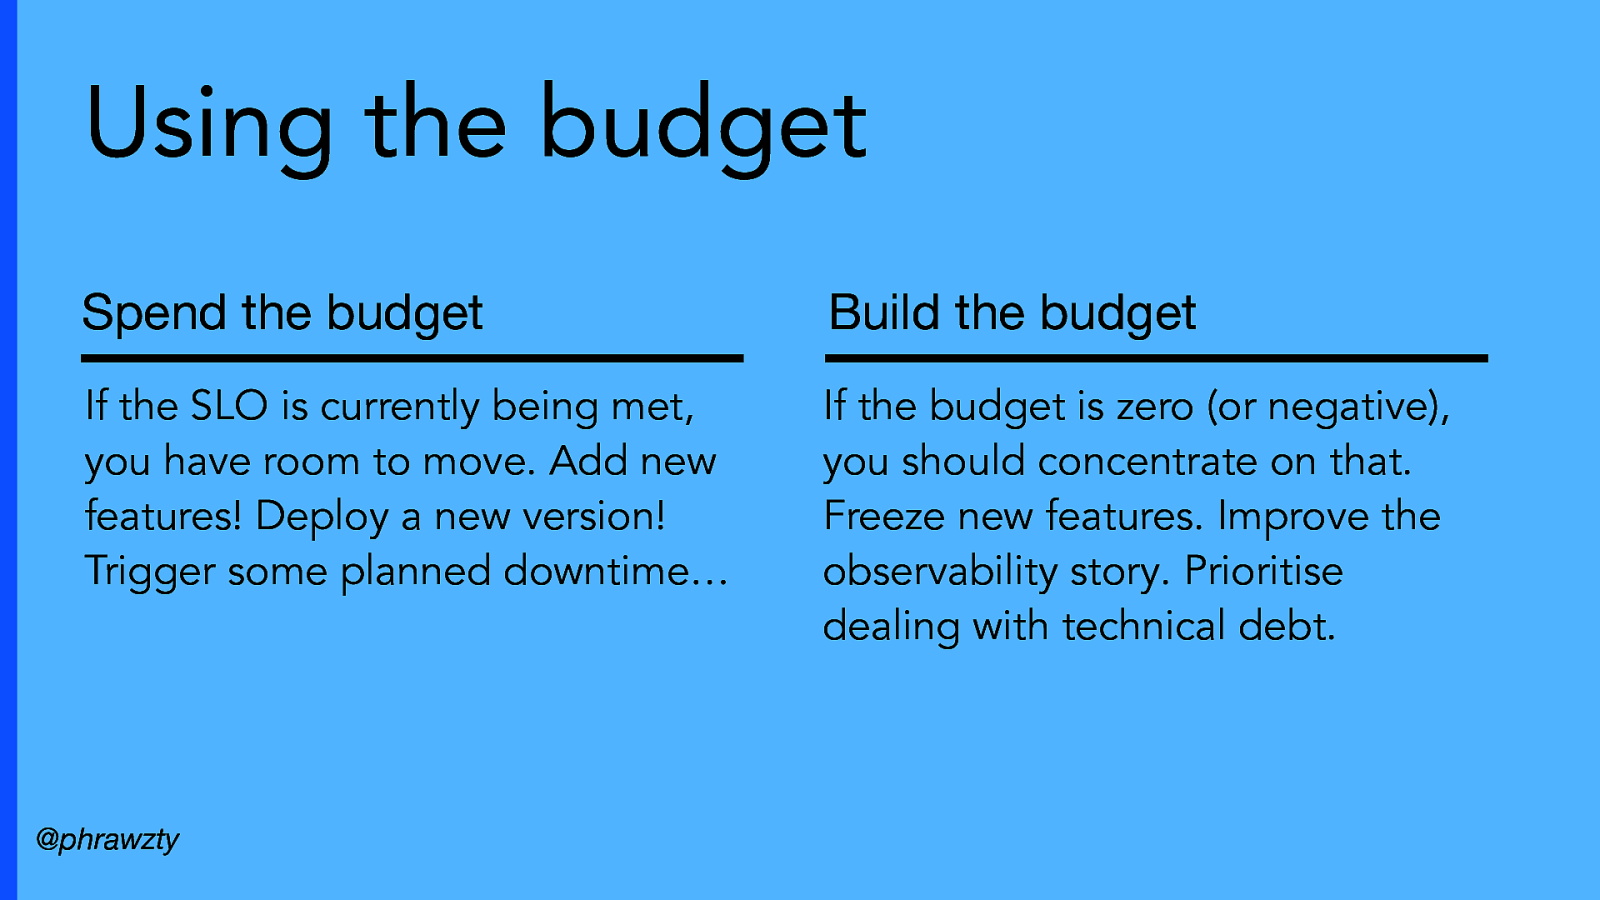
Using the budget Spend the budget Build the budget If the SLO is currently being met, you have room to move. Add new features! Deploy a new version! Trigger some planned downtime… If the budget is zero (or negative), you should concentrate on that. Freeze new features. Improve the observability story. Prioritise dealing with technical debt. @phrawzty
Slide 26
Practical examples
Slide 27

fotosite.neð (not real) – A fun site for uploading, sharing, and viewing photos. – Make friends! Build communities! – Buy print-quality photos. @phrawzty
Slide 28
Consider the user experience ● How are they interacting with your product? ○ Clicking, viewing photos, doing searches. @phrawzty
Slide 29
Consider the user experience ● How are they interacting with your product? ○ Clicking, viewing photos, doing searches. ● What is their workflow? ○ Log in, search photos, view, download. @phrawzty
Slide 30
Consider the user experience ● How are they interacting with your product? ○ Clicking, viewing photos, doing searches. ● What is their workflow? ○ Log in, search photos, view, download. ● What services do they interact with? ○ Accounts backend, upload service @phrawzty
Slide 31
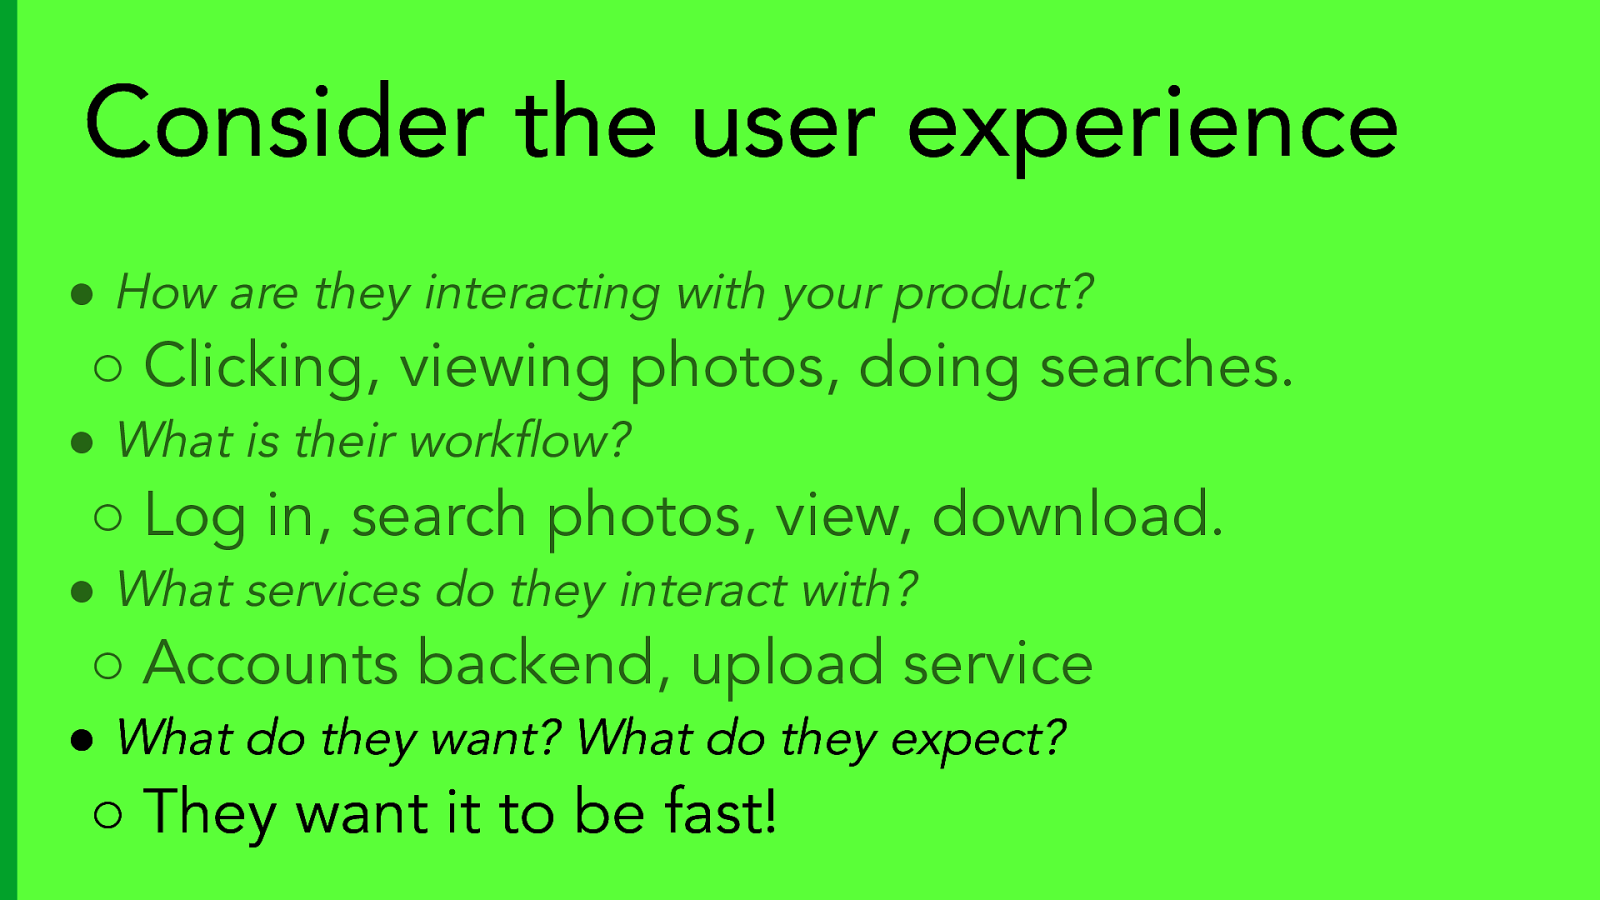
Consider the user experience ● How are they interacting with your product? ○ Clicking, viewing photos, doing searches. ● What is their workflow? ○ Log in, search photos, view, download. ● What services do they interact with? ○ Accounts backend, upload service ● What do they want? What do they expect? ○ They want it to be fast!
Slide 32
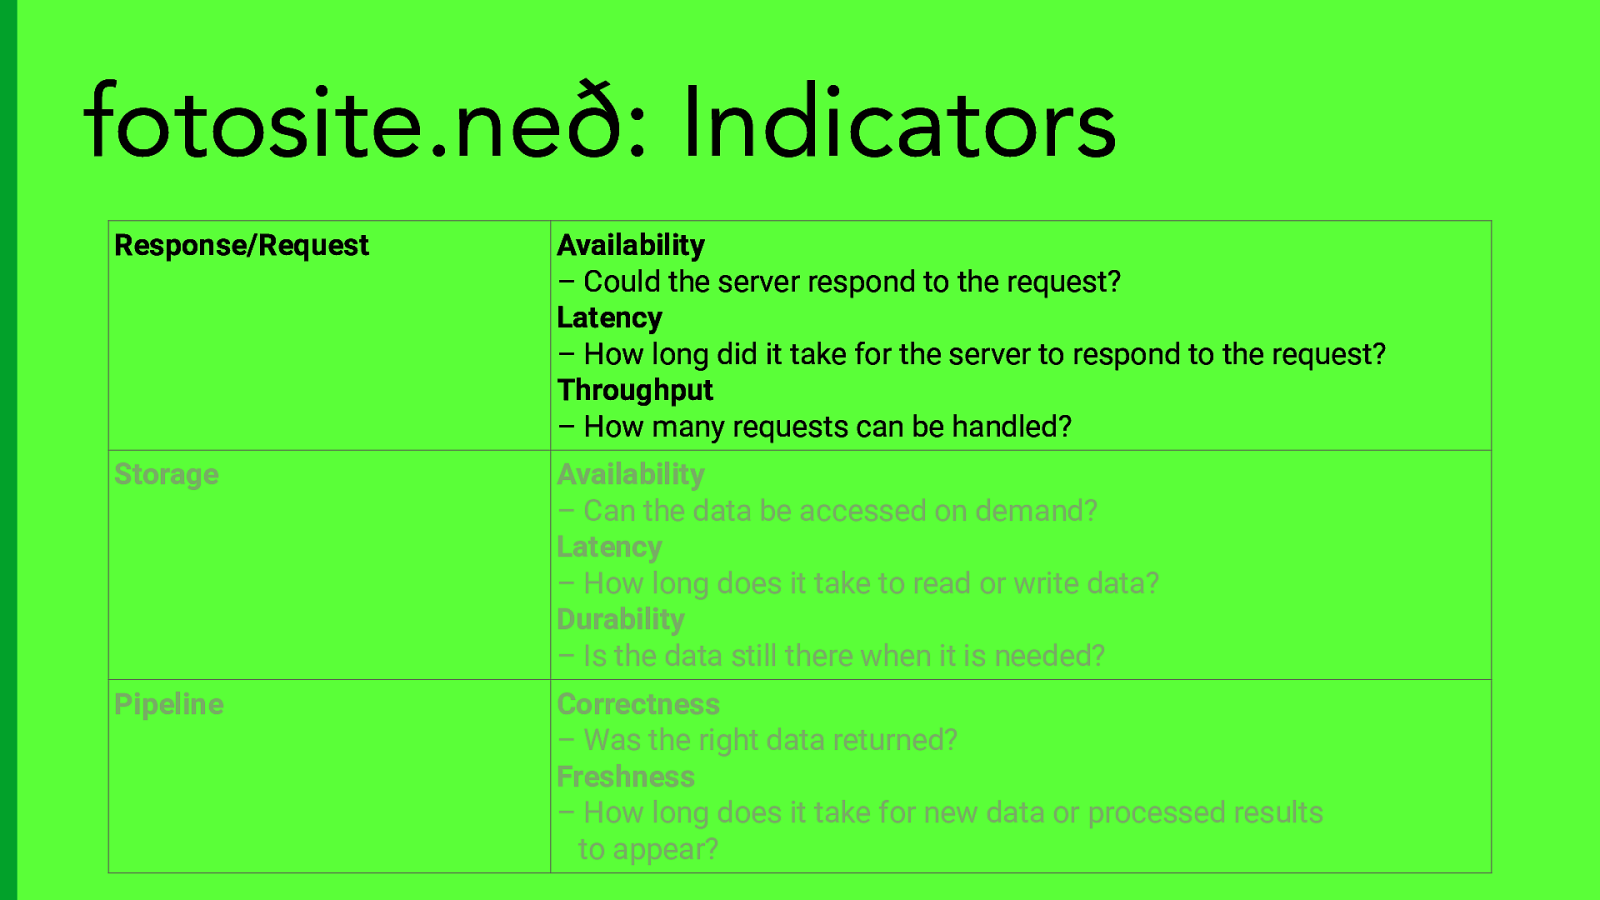
fotosite.neð: Indicators Response/Request Availability – Could the server respond to the request? Latency – How long did it take for the server to respond to the request? Throughput – How many requests can be handled? Storage Availability – Can the data be accessed on demand? Latency – How long does it take to read or write data? Durability – Is the data still there when it is needed? Pipeline Correctness – Was the right data returned? Freshness – How long does it take for new data or processed results to appear?
Slide 33
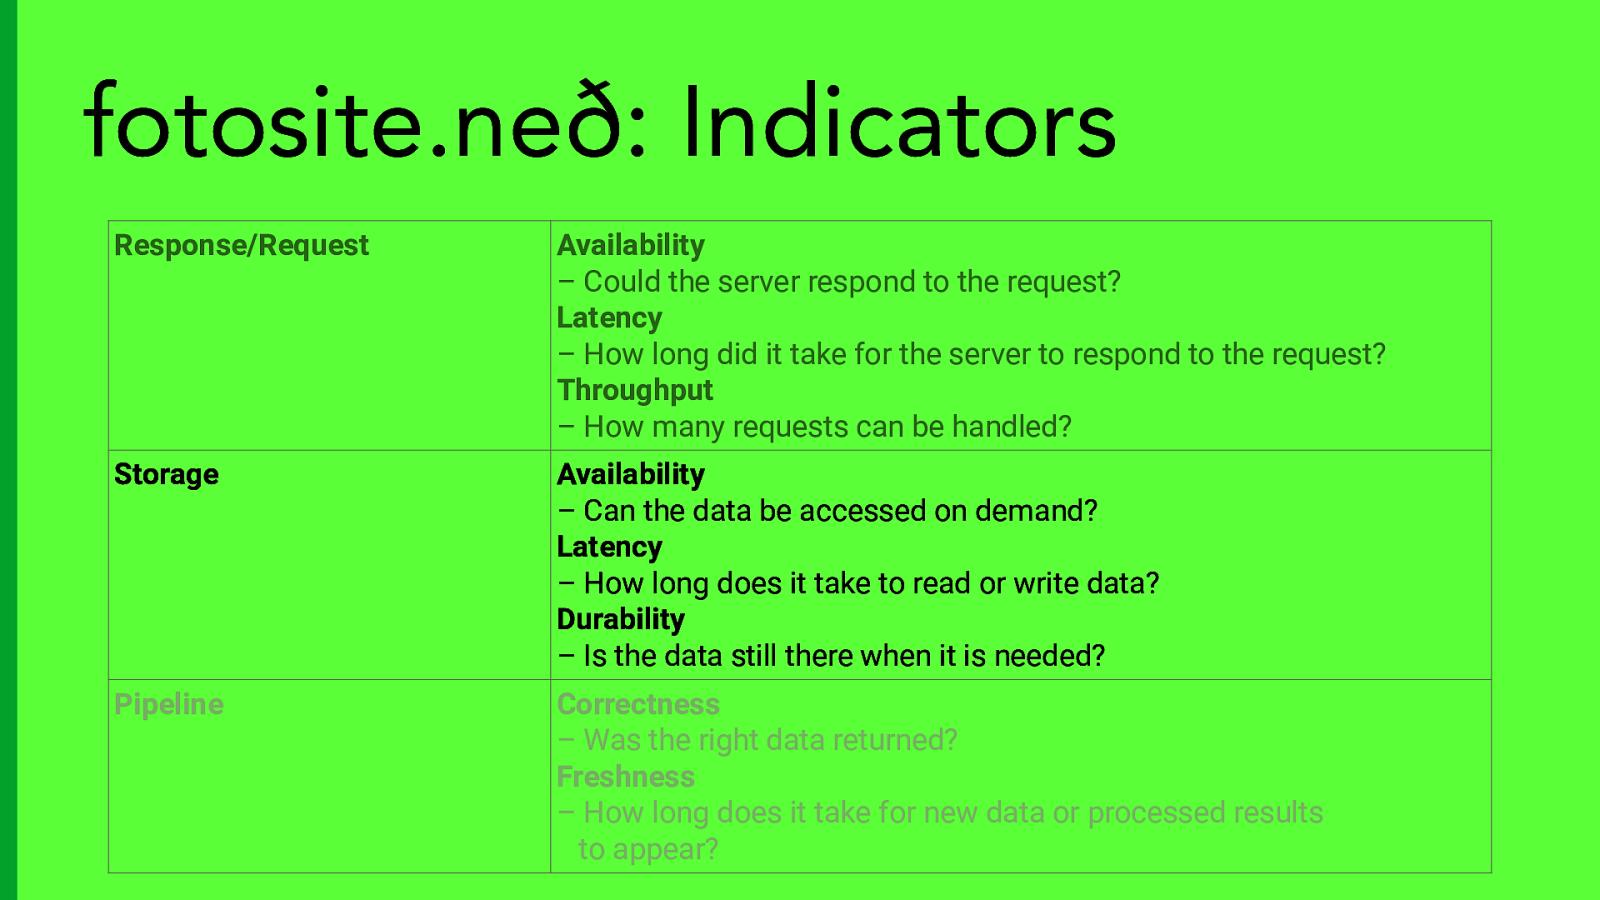
fotosite.neð: Indicators Response/Request Availability – Could the server respond to the request? Latency – How long did it take for the server to respond to the request? Throughput – How many requests can be handled? Storage Availability – Can the data be accessed on demand? Latency – How long does it take to read or write data? Durability – Is the data still there when it is needed? Pipeline Correctness – Was the right data returned? Freshness – How long does it take for new data or processed results to appear?
Slide 34
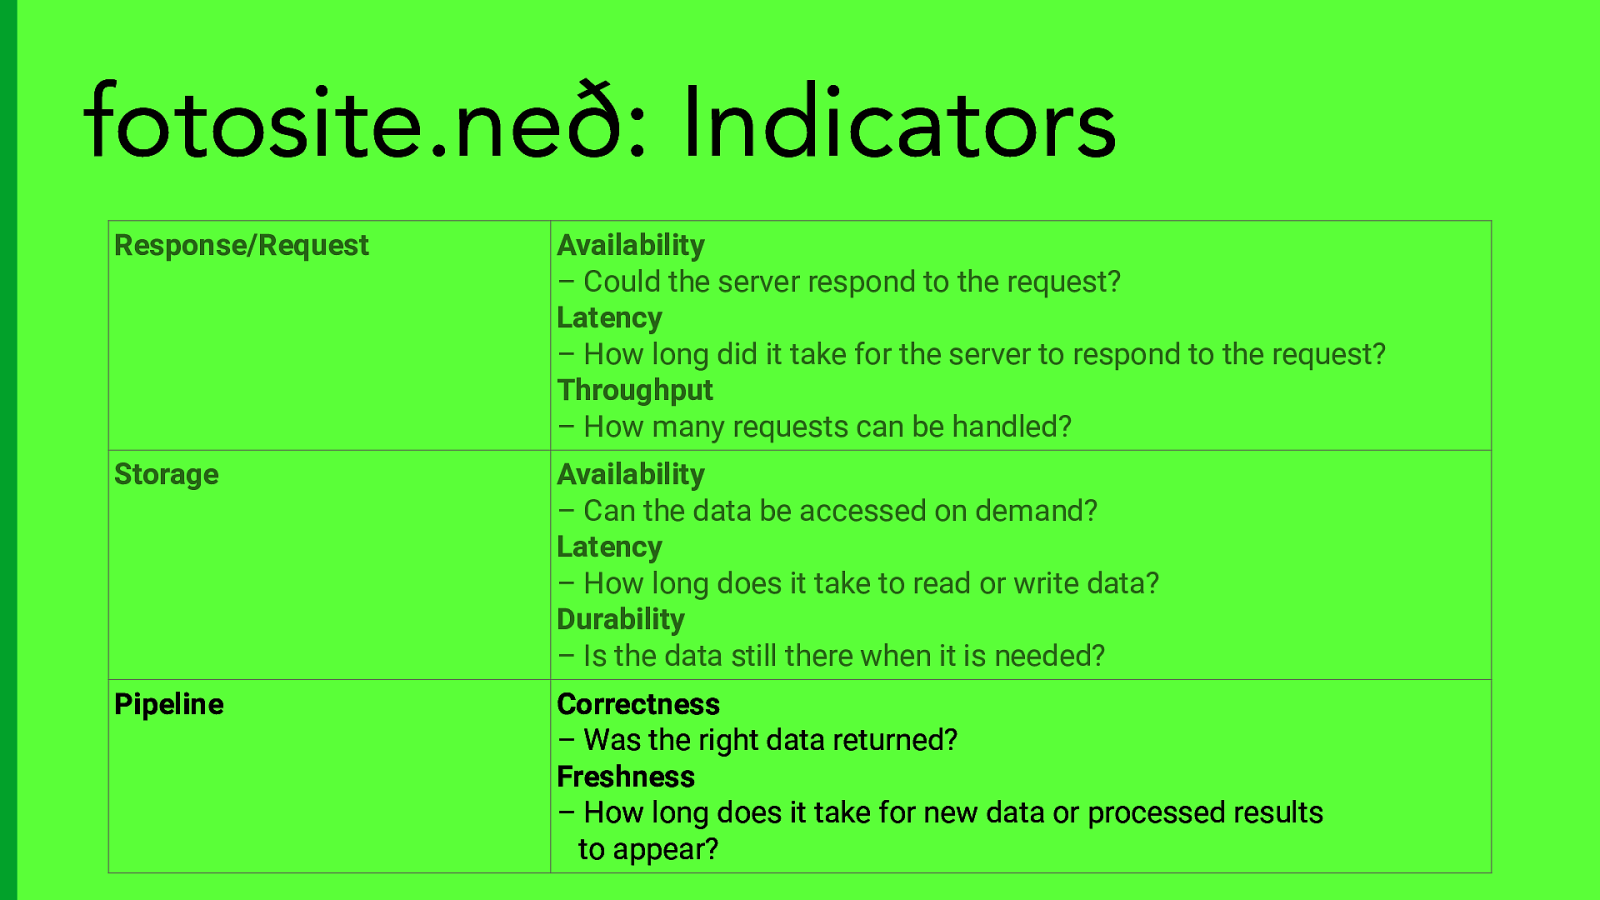
fotosite.neð: Indicators Response/Request Availability – Could the server respond to the request? Latency – How long did it take for the server to respond to the request? Throughput – How many requests can be handled? Storage Availability – Can the data be accessed on demand? Latency – How long does it take to read or write data? Durability – Is the data still there when it is needed? Pipeline Correctness – Was the right data returned? Freshness – How long does it take for new data or processed results to appear?
Slide 35

Bonus: More tips!
Slide 36
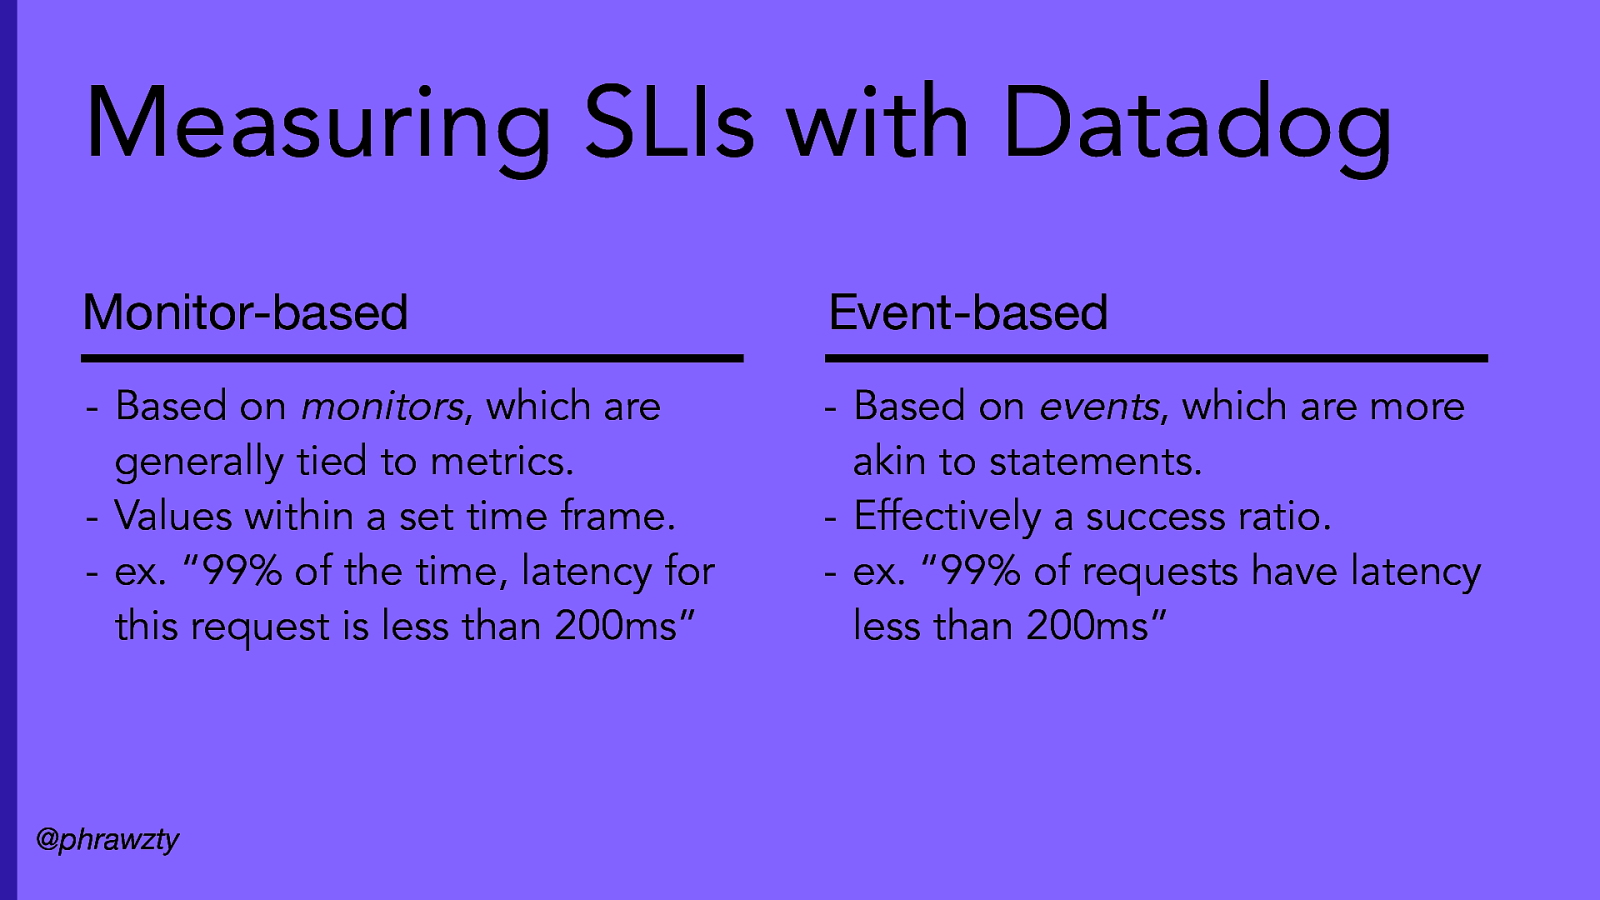
Measuring SLIs with Datadog Monitor-based Event-based
- Based on monitors, which are generally tied to metrics. - Values within a set time frame. - ex. “99% of the time, latency for this request is less than 200ms”
- Based on events, which are more akin to statements. - Effectively a success ratio. - ex. “99% of requests have latency less than 200ms” @phrawzty
Slide 37
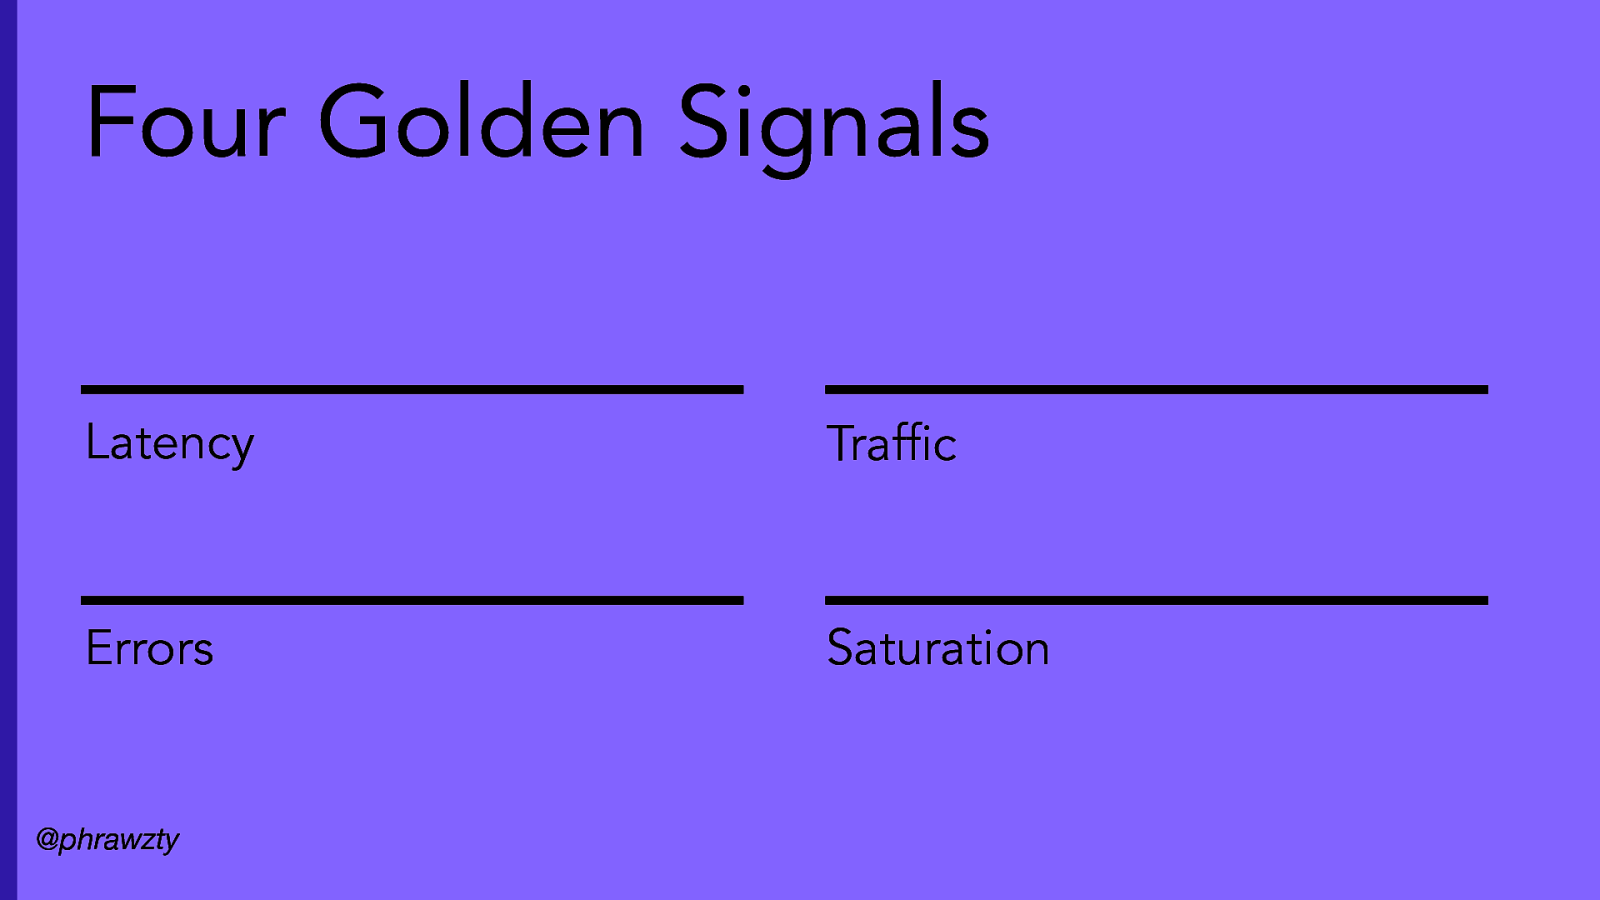
Four Golden Signals Latency Traffic Errors Saturation @phrawzty
Slide 38
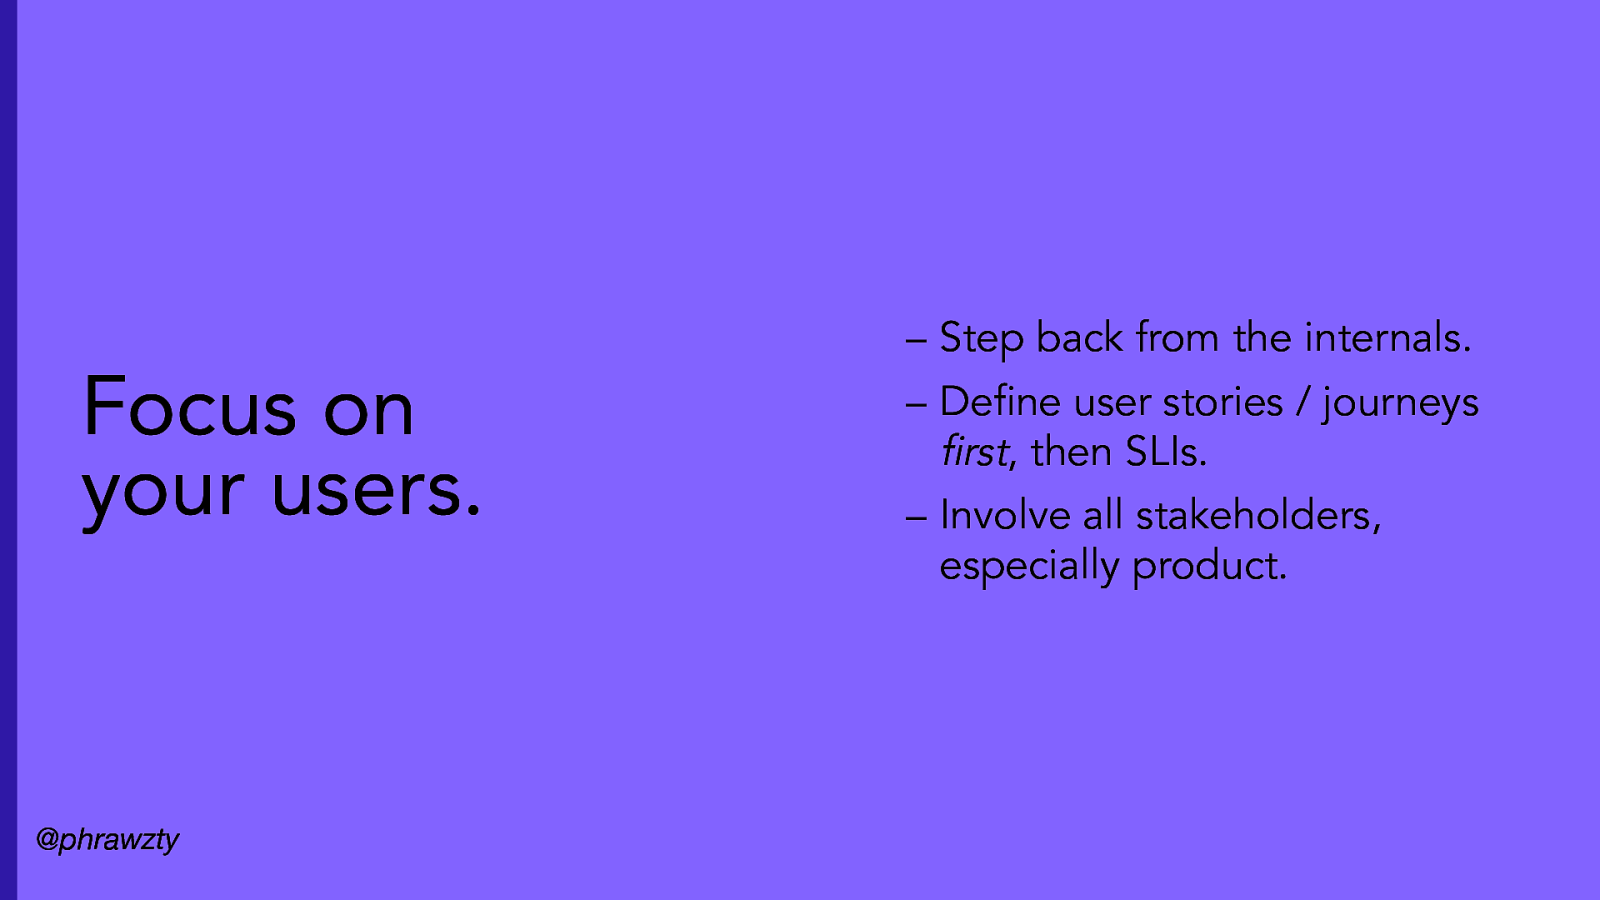
– Step back from the internals. Focus on your users. @phrawzty – Define user stories / journeys first, then SLIs. – Involve all stakeholders, especially product.
Slide 39
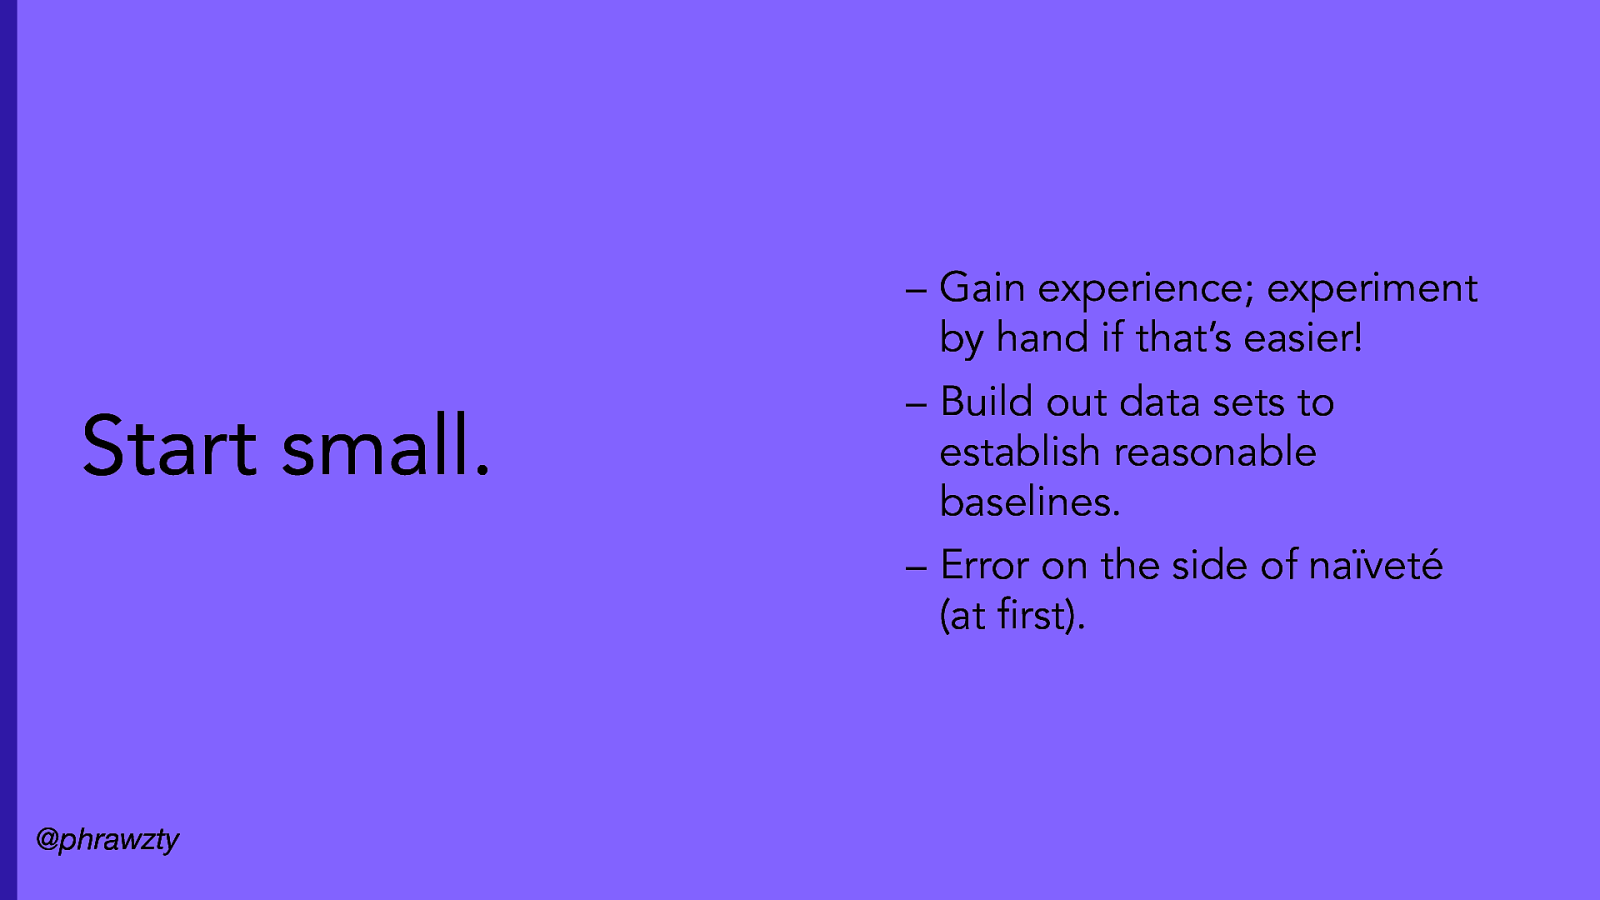
– Gain experience; experiment by hand if that’s easier! Start small. – Build out data sets to establish reasonable baselines. – Error on the side of naïveté (at first). @phrawzty
Slide 40
SLOs change. @phrawzty – Re-evaluate your SLIs and SLOs as your environment evolves. – SLAs must have the capacity to evolve, too!
Slide 41
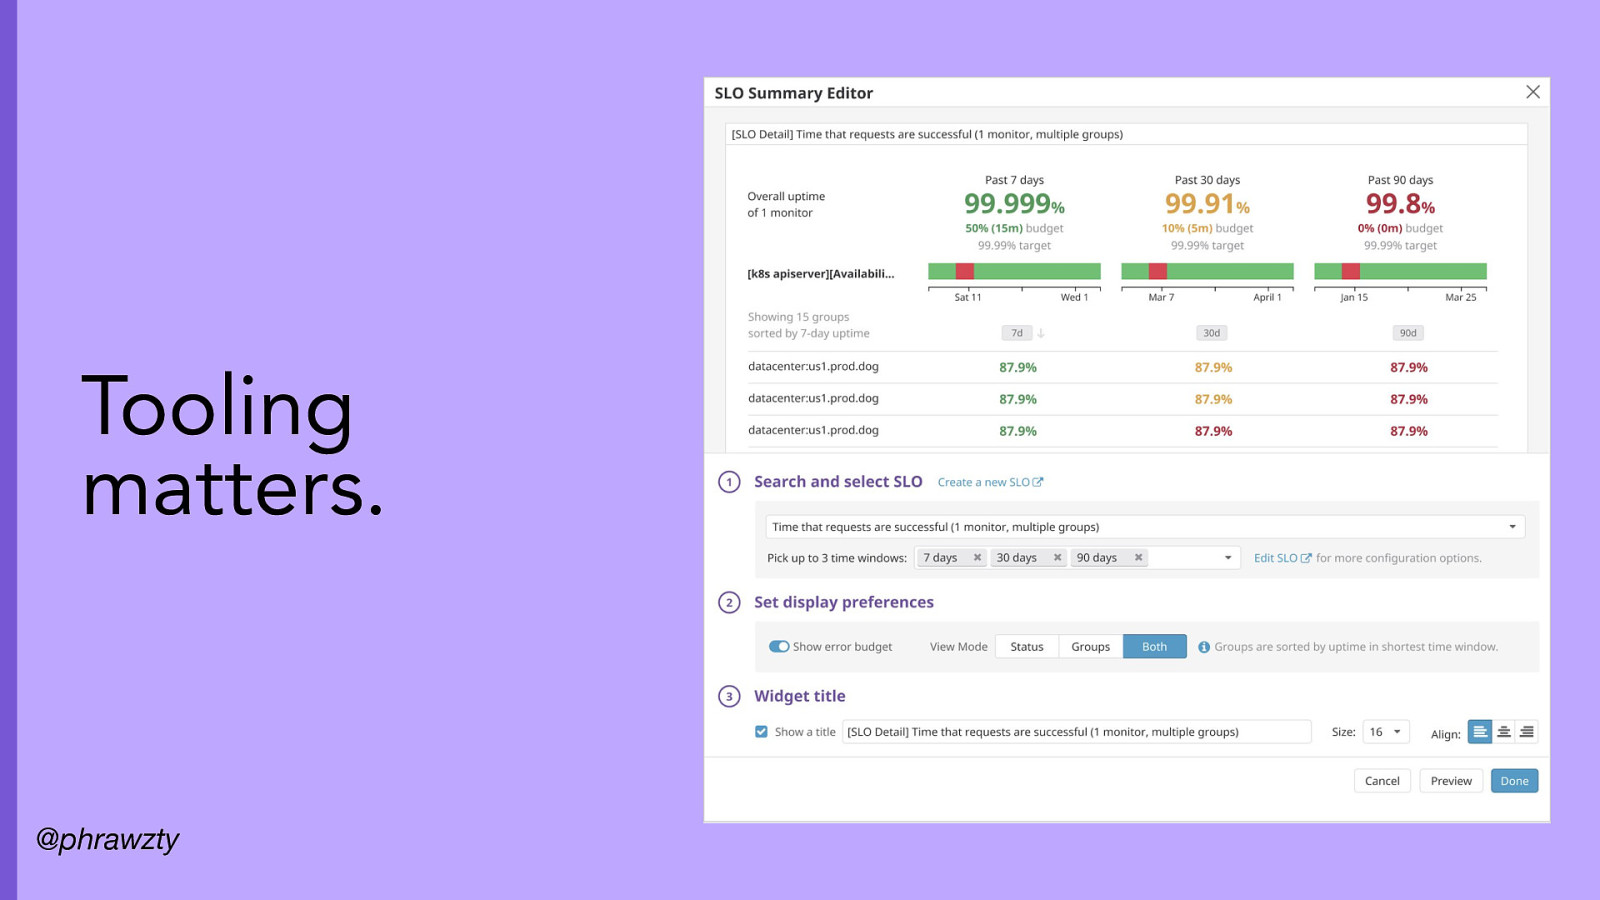
Tooling matters. @phrawzty
Slide 42

Obrigado!