Experiment-Driven Product Development Paul Rissen Senior Product Manager Springer Nature @r4isstatic

A presentation at Boye & Company, Product Management Peer Group Call in July 2020 in by Paul Rissen
Experiment-Driven Product Development Paul Rissen Senior Product Manager Springer Nature @r4isstatic

How do you know if you’re building the right thing? You don’t. Until much later. @r4isstatic

How do you avoid making the wrong decisions? You can’t. @r4isstatic

How do you minimise the time and effort spent on the wrong things? Experiment-Driven Product Development (XDPD). @r4isstatic

What is Experiment-Driven Product Development?

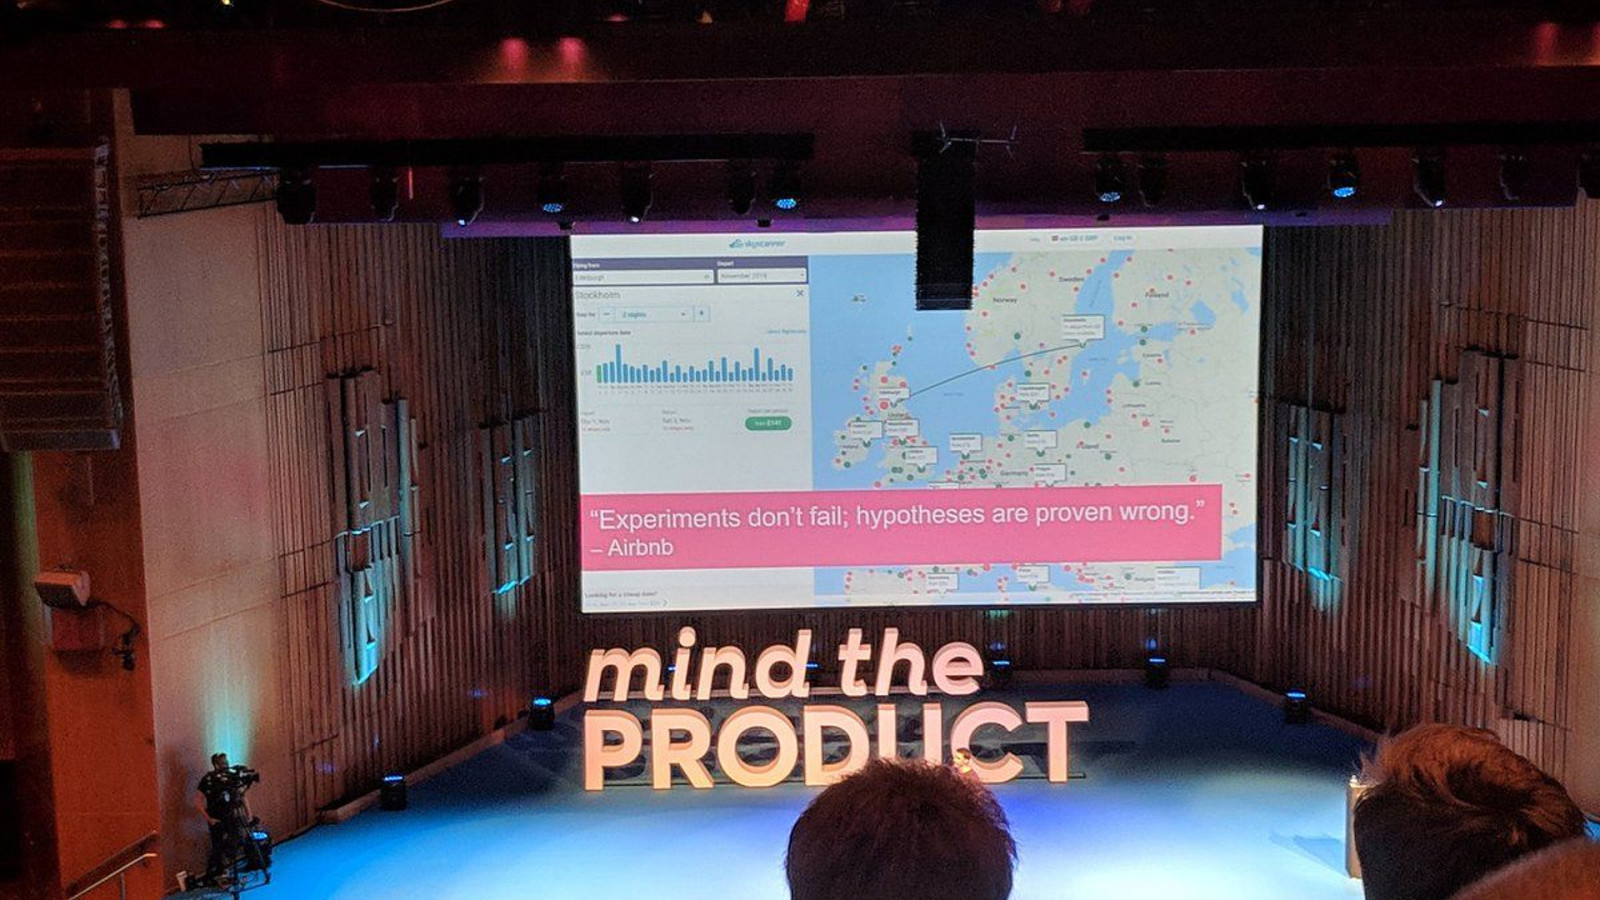
An evolution of agile/lean product development that places the emphasis on questions rather than solutions. @r4isstatic
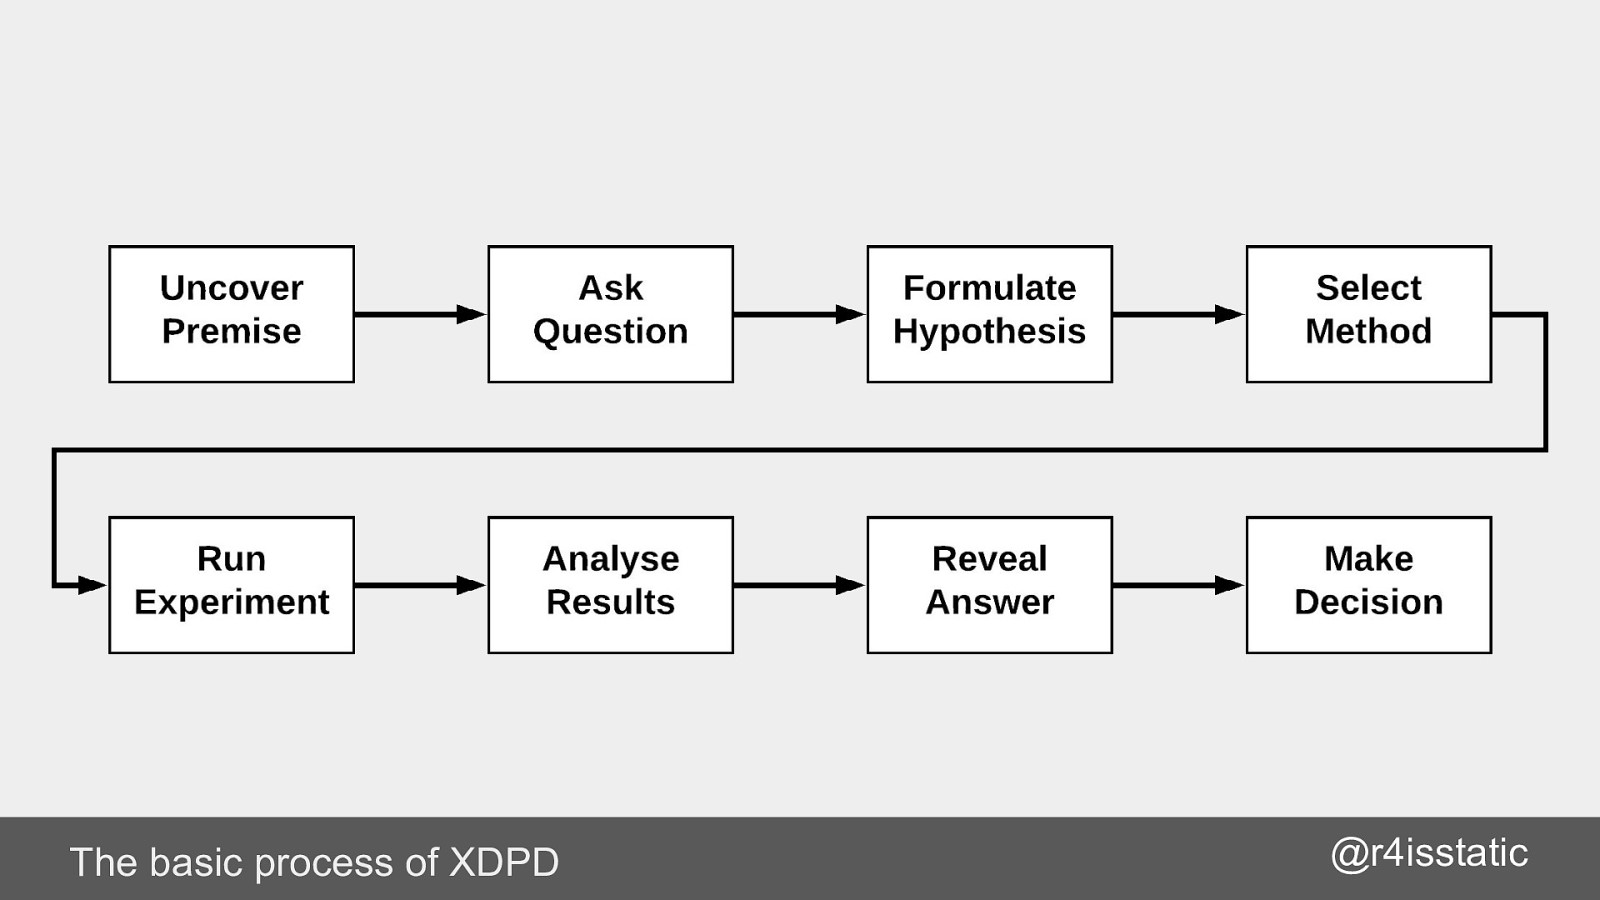
The basic process of XDPD @r4isstatic

What do I mean by an experiment?

Experiment != A/B test @r4isstatic

Experiments are not just for R&D ‘innovation’ teams @r4isstatic

Experiments are a structured way of asking questions. @r4isstatic

● ● ● ● ● ● ● What are we trying to discover? Why is it important for us to find this out? What are we going to do? What change or difference are we expecting to see? How will we measure the result? How precise do we need the result to be? How certain do we need to be? @r4isstatic

This is not easy. @r4isstatic

Detailed roadmaps Guaranteed successes No wasted effort @r4isstatic

Detailed roadmaps Guaranteed successes No wasted effort @r4isstatic

So why on Earth should I use this approach?

Focus on results. @r4isstatic

Stop obsessing over pet solutions. @r4isstatic

Listen to your users - at scale. @r4isstatic

Data* as a stakeholder. * specifically ‘user activity’ data @r4isstatic

Challenge your assumptions. @r4isstatic

Reduces the cost of failure. @r4isstatic

Evidence over opinions. @r4isstatic

We are scientists for product development. @r4isstatic

Observe. Hypothesise. Experiment. Analyse. (repeat to fade)

Principles of XDPD

Involve the whole team, not just data scientists. @r4isstatic

Data informed, not data driven. @r4isstatic

Simplest Useful Thing @r4isstatic

Simplest Useful Thing Product/User POV: - Simple = easy to use - Useful = fulfils a need @r4isstatic

Simplest Useful Thing Developer’s POV: - What can we do with what we have available to us, now? - What’s the simplest thing we could build in order to test our hypothesis/answer our question? @r4isstatic

Simplest Useful Thing Experiment POV: - What’s the simplest method we could use, in order to learn? - What’s the lowest cost way to learn, that would still ensure reliable evidence? @r4isstatic

Experiment-driven product development in practice
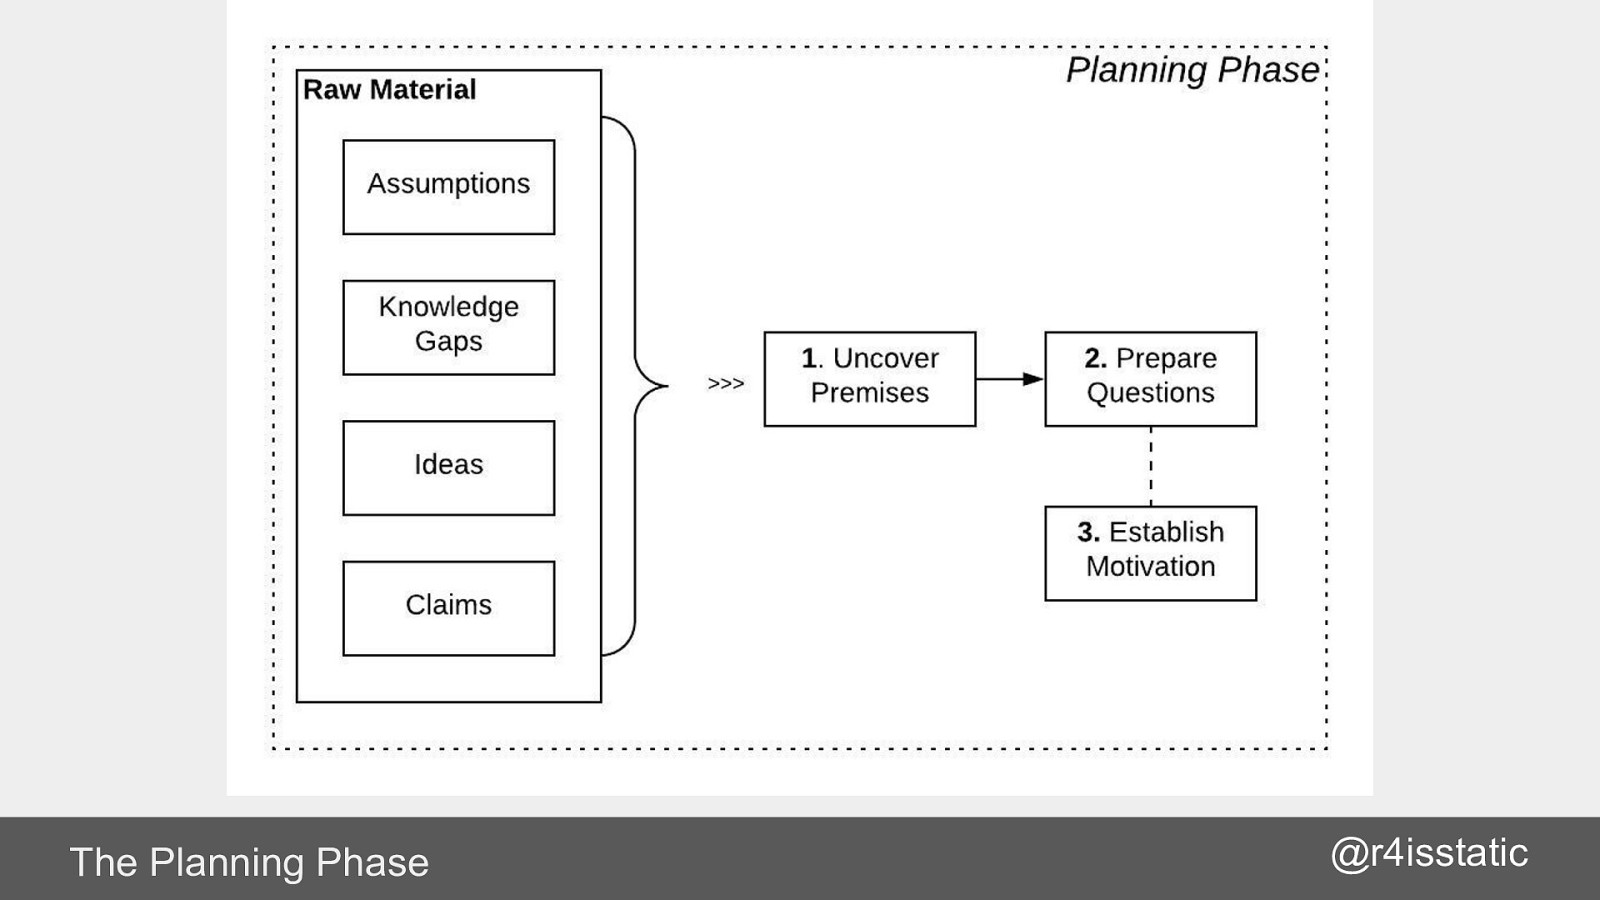
The Planning Phase @r4isstatic
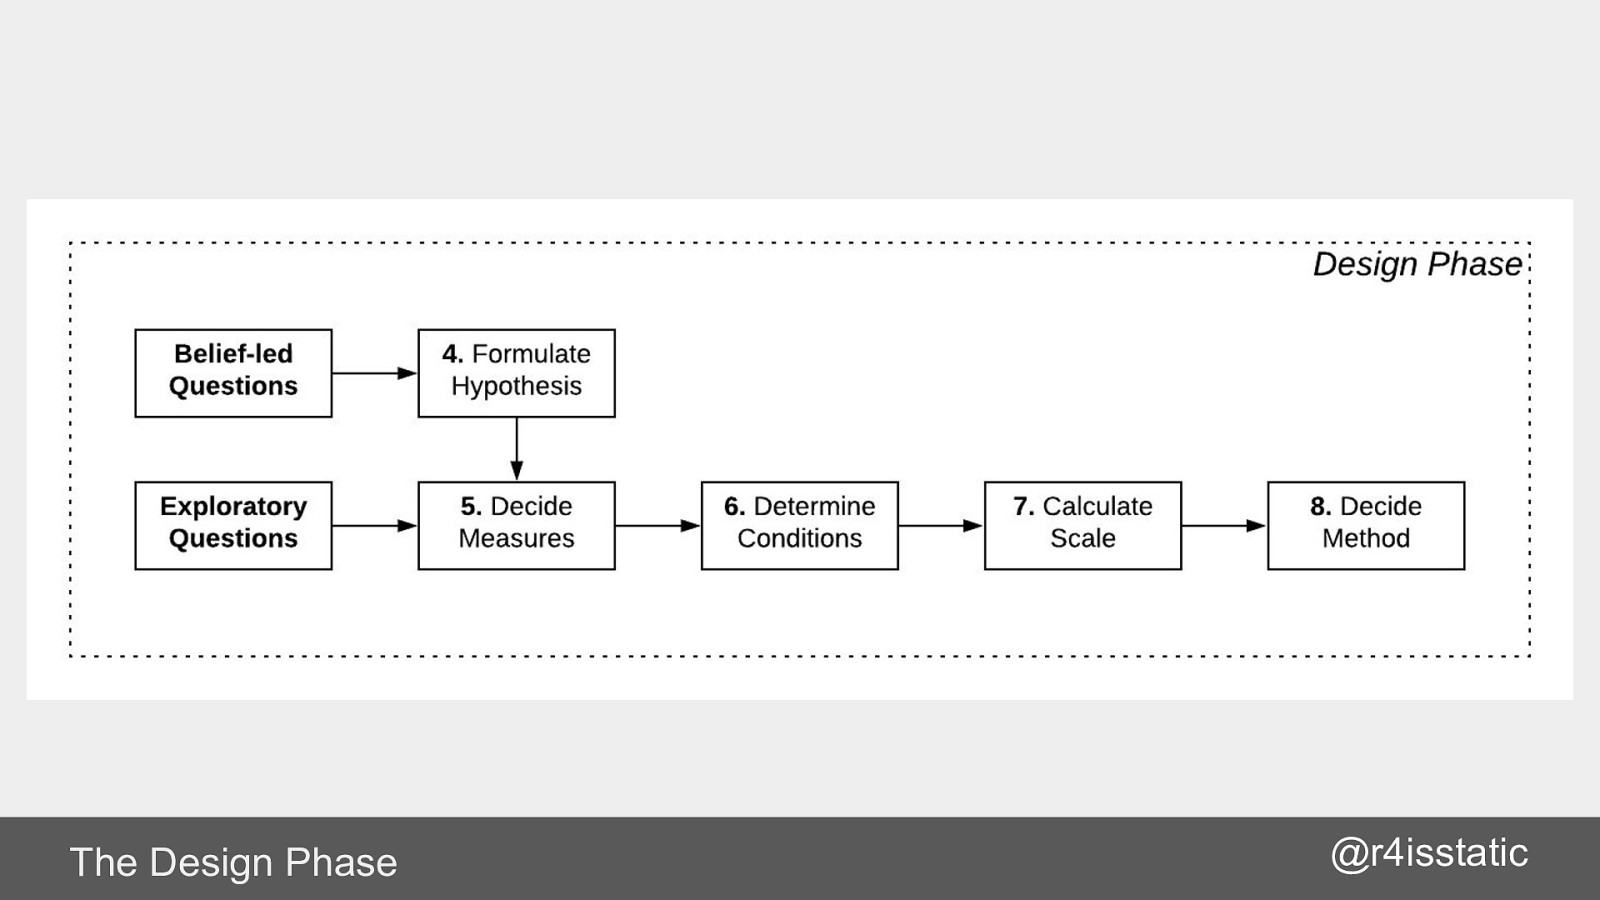
The Design Phase @r4isstatic
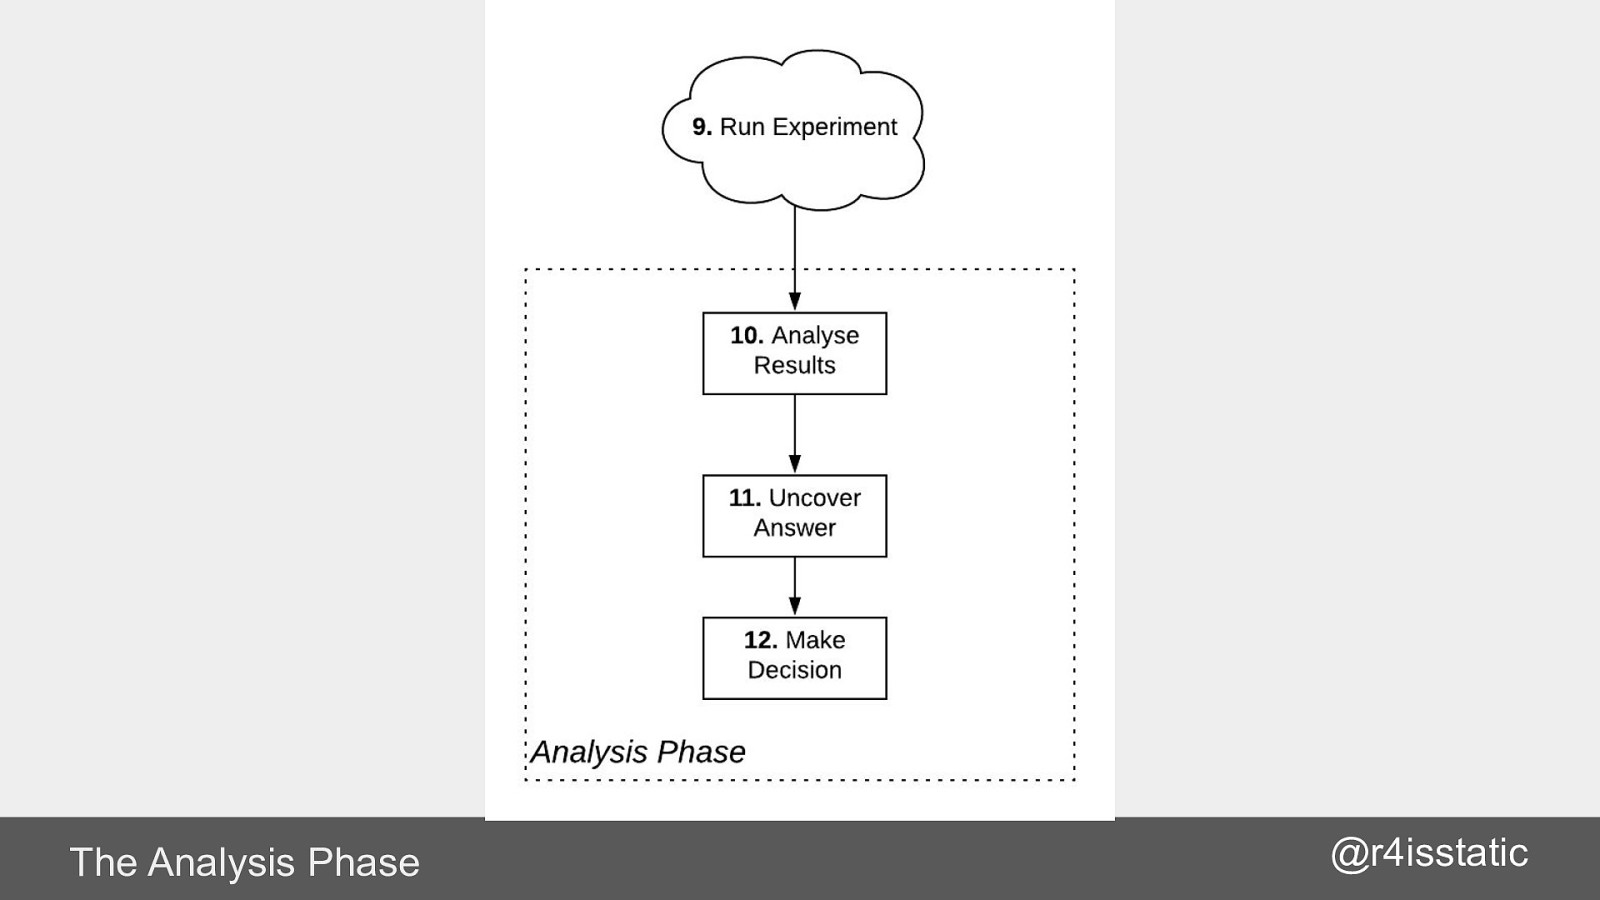
The Analysis Phase @r4isstatic

Don’t validate ideas. Test hypotheses. @r4isstatic

Design the experiment scale and conditions before choosing a method. How certain & how precise do you need to be? @r4isstatic

NO PEEKING! @r4isstatic
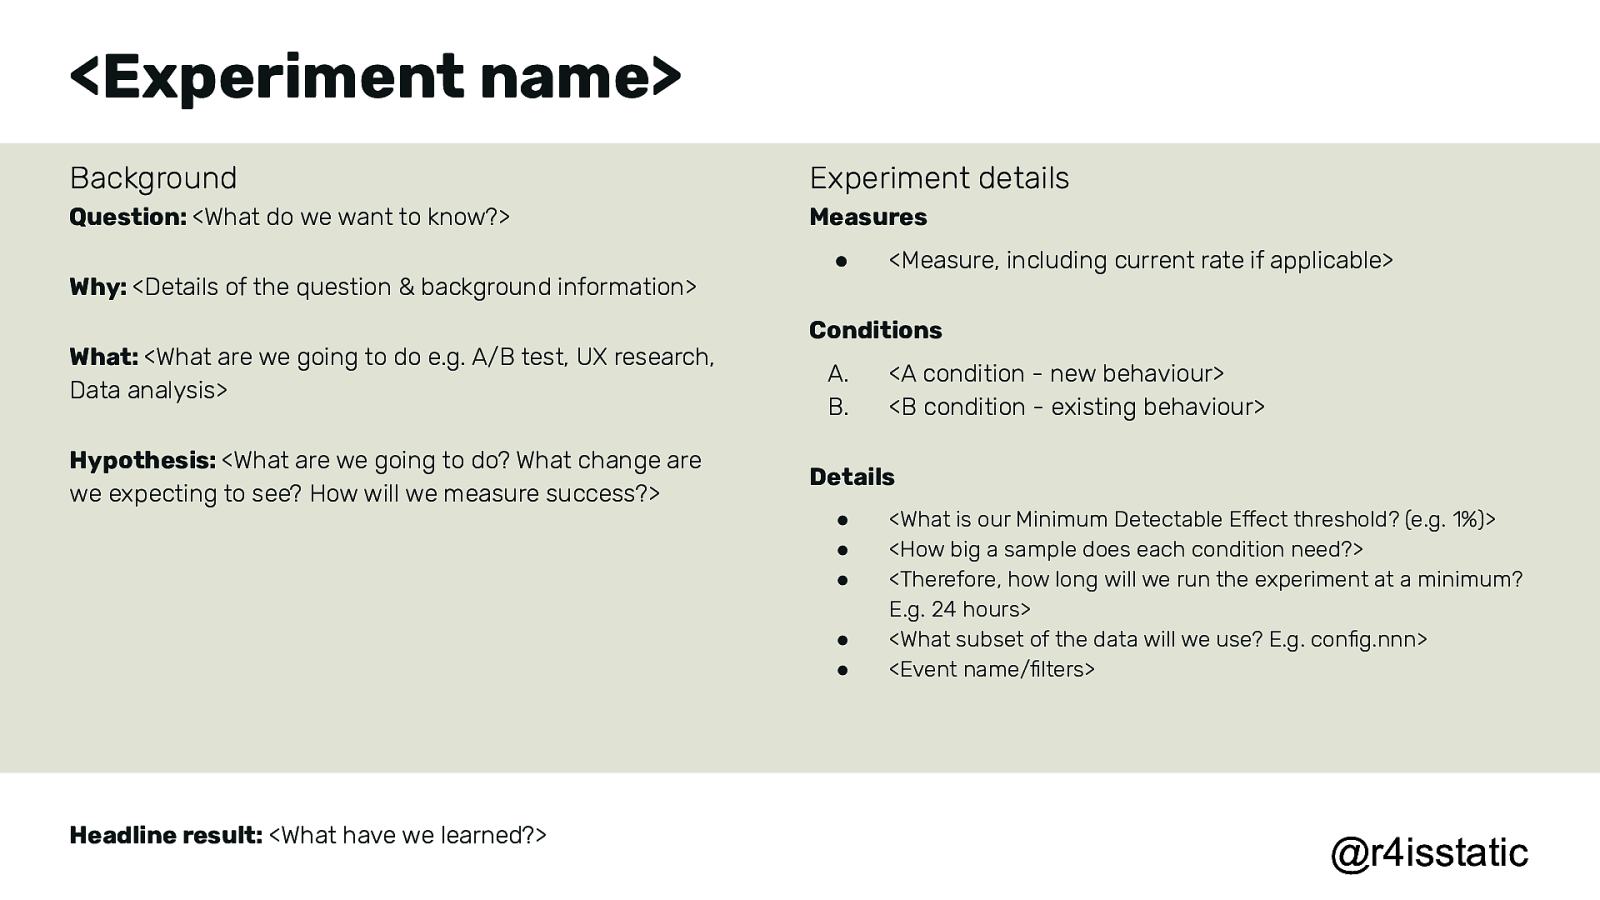
<Experiment name> Background Experiment details Question: <What do we want to know?> Measures Why: <Details of the question & background information> What: <What are we going to do e.g. A/B test, UX research, Data analysis> Hypothesis: <What are we going to do? What change are we expecting to see? How will we measure success?> ● Conditions A. B. <A condition - new behaviour> <B condition - existing behaviour> Details ● ● ● ● ● Headline result: <What have we learned?> <Measure, including current rate if applicable> <What is our Minimum Detectable Effect threshold? (e.g. 1%)> <How big a sample does each condition need?> <Therefore, how long will we run the experiment at a minimum? E.g. 24 hours> <What subset of the data will we use? E.g. config.nnn> <Event name/filters> @r4isstatic
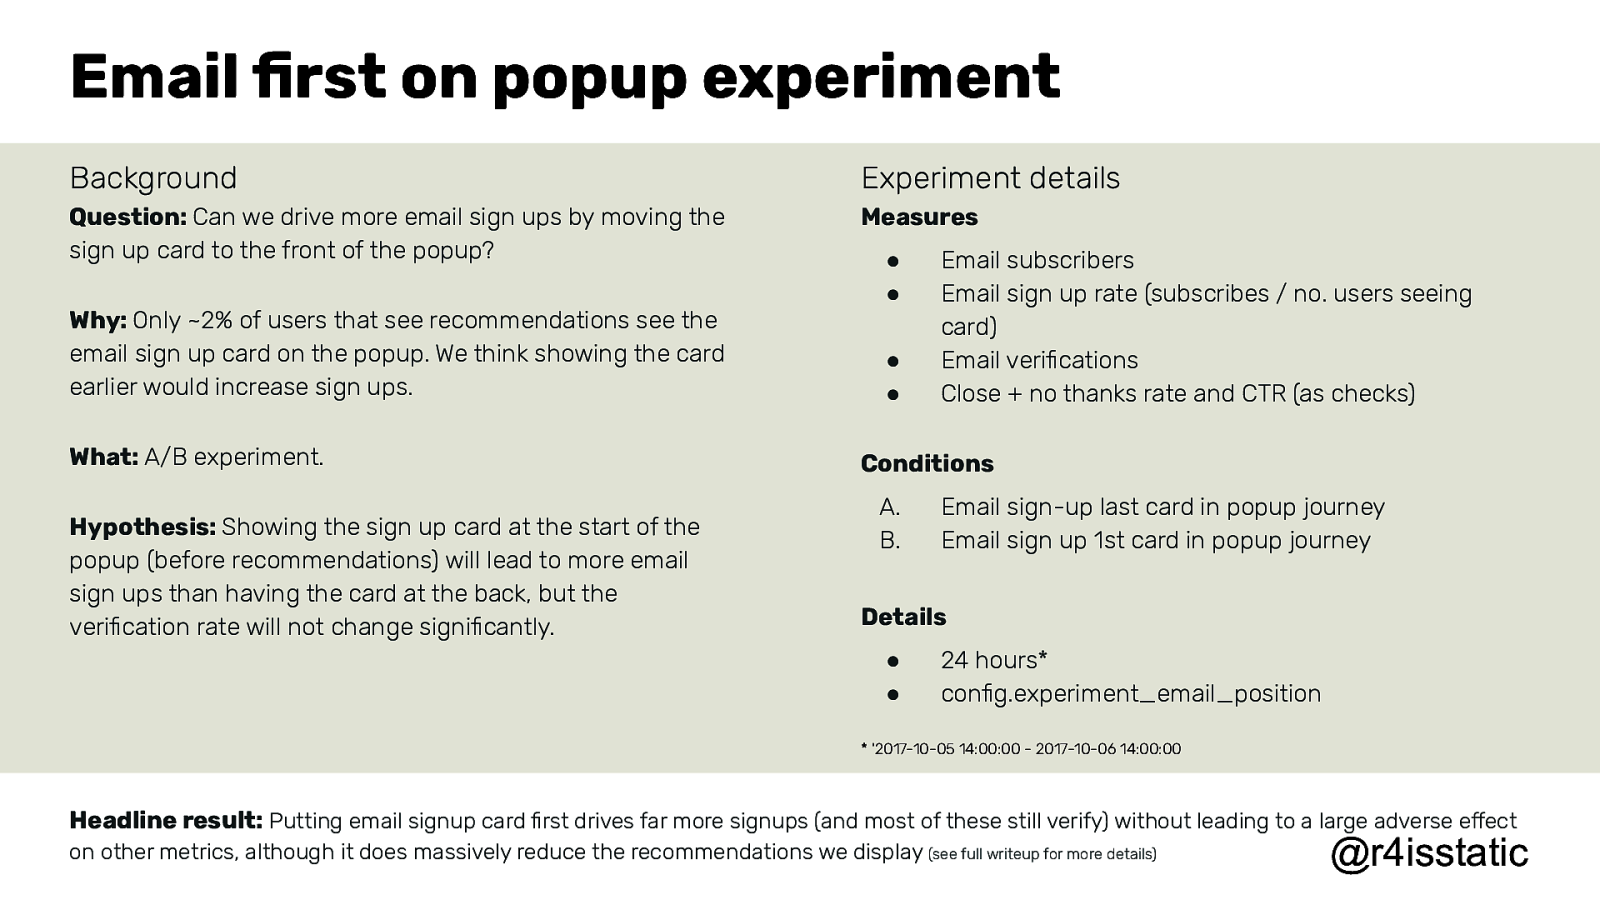
Email first on popup experiment Background Experiment details Question: Can we drive more email sign ups by moving the sign up card to the front of the popup? Measures Why: Only ~2% of users that see recommendations see the email sign up card on the popup. We think showing the card earlier would increase sign ups. What: A/B experiment. Hypothesis: Showing the sign up card at the start of the popup (before recommendations) will lead to more email sign ups than having the card at the back, but the verification rate will not change significantly. ● ● ● ● Email subscribers Email sign up rate (subscribes / no. users seeing card) Email verifications Close + no thanks rate and CTR (as checks) Conditions A. B. Email sign-up last card in popup journey Email sign up 1st card in popup journey Details ● ● 24 hours* config.experiment_email_position
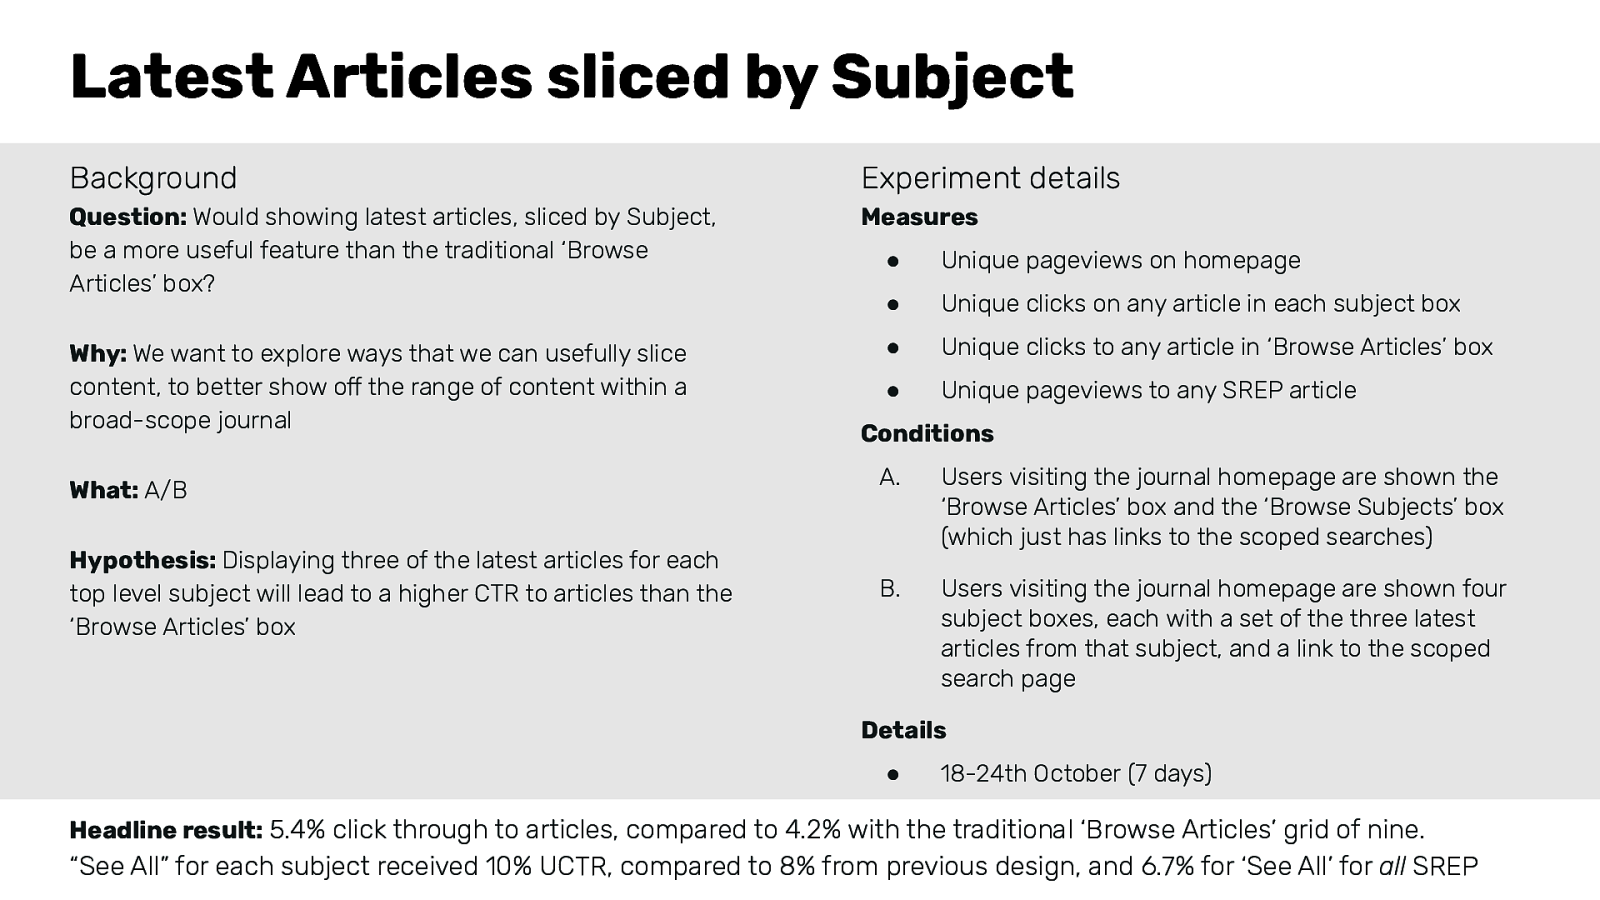
Latest Articles sliced by Subject Background Experiment details Question: Would showing latest articles, sliced by Subject, be a more useful feature than the traditional ‘Browse Articles’ box? Measures Why: We want to explore ways that we can usefully slice content, to better show off the range of content within a broad-scope journal What: A/B Hypothesis: Displaying three of the latest articles for each top level subject will lead to a higher CTR to articles than the ‘Browse Articles’ box ● Unique pageviews on homepage ● Unique clicks on any article in each subject box ● Unique clicks to any article in ‘Browse Articles’ box ● Unique pageviews to any SREP article Conditions A. Users visiting the journal homepage are shown the ‘Browse Articles’ box and the ‘Browse Subjects’ box (which just has links to the scoped searches) B. Users visiting the journal homepage are shown four subject boxes, each with a set of the three latest articles from that subject, and a link to the scoped search page Details ● 18-24th October (7 days) Headline result: 5.4% click through to articles, compared to 4.2% with the traditional ‘Browse Articles’ grid of nine. “See All” for each subject received 10% UCTR, compared to 8% from previous design, and 6.7% for ‘See All’ for all SREP

What have we learnt? - what are the raw numbers? - what happened to the other ‘health check’ metrics? - what was the significance and p value? - what does this tell us? - what does this mean/imply in relation to our hypothesis/question? - what have we learned? What would we do differently? - how does this affect our backlog of questions? @r4isstatic

Summary In summary…


eBook now available via Apress & Amazon https://www.amazon.co.uk/dp/1484255275 https://www.apress.com/gb/book/9781484255278 Also available on SpringerLink https://link.springer.com/book/10.1007/978-1-4842-5528-5 Preface & Intro available for free download! @r4isstatic

Thank you. https://www.paulrissen.com https://www.linkedin.com/in/r4isstatic/ Twitter: @r4isstatic