
A presentation at WordCamp Norway 2015 in February 2015 in Oslo, Norway by Andrey Savchenko
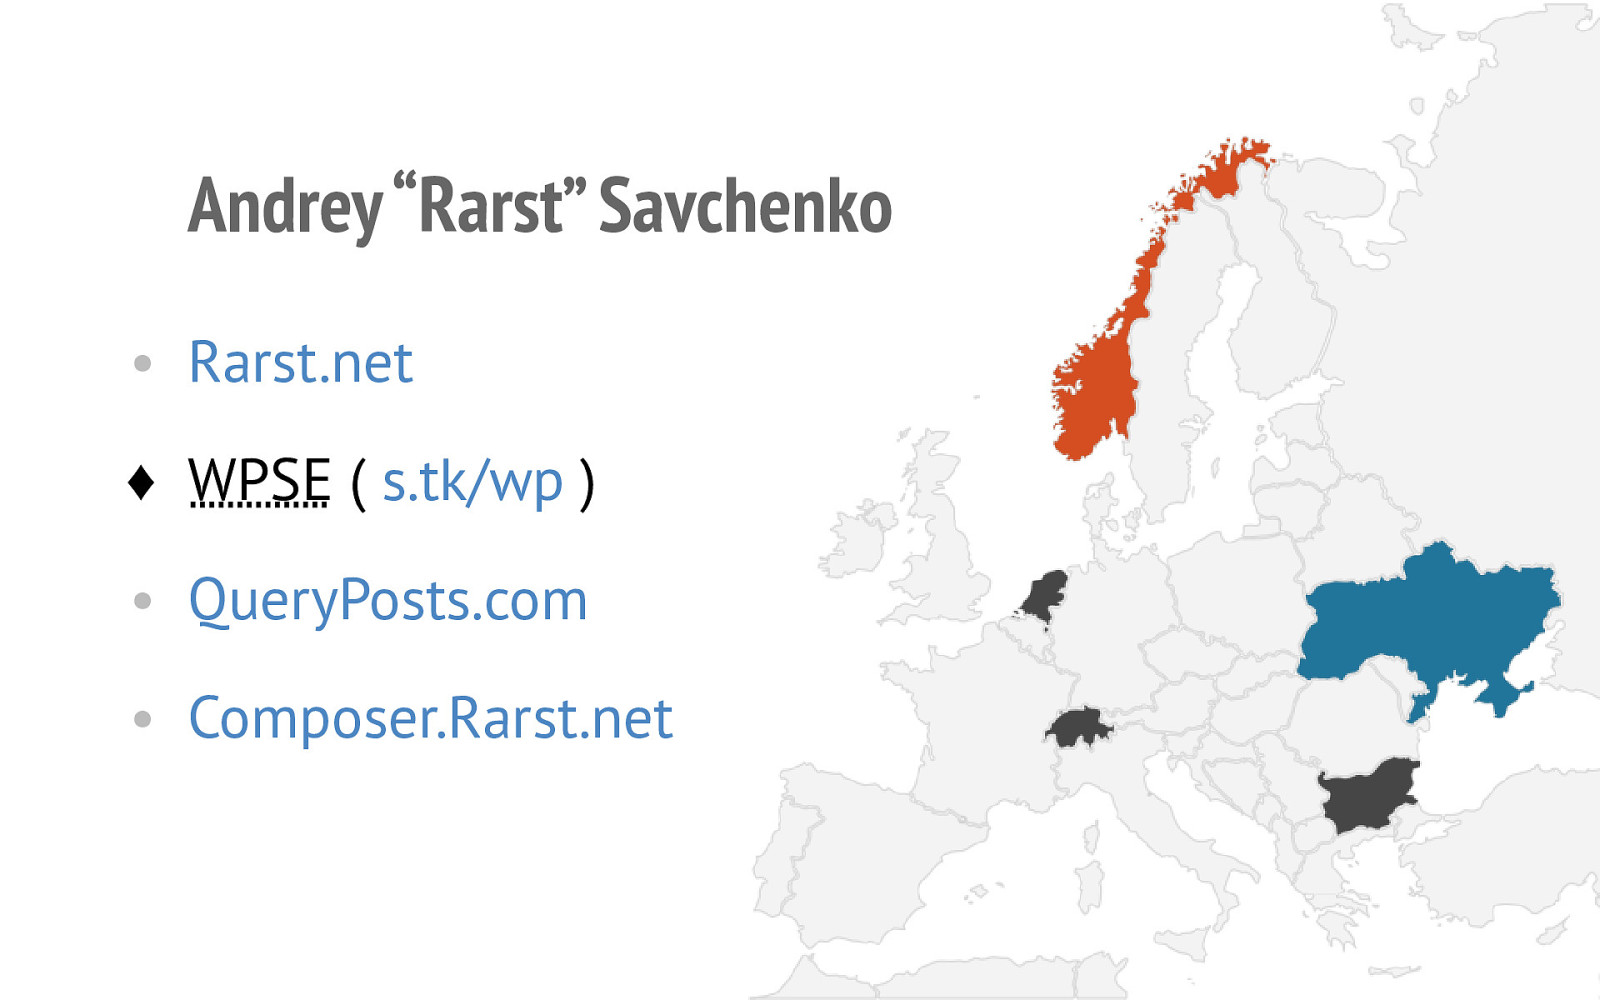
2 Andrey “Rarst” Savchenko • Rarst.net ♦ WPSE ( s.tk/wp ) • QueryPosts.com • Composer.Rarst.net
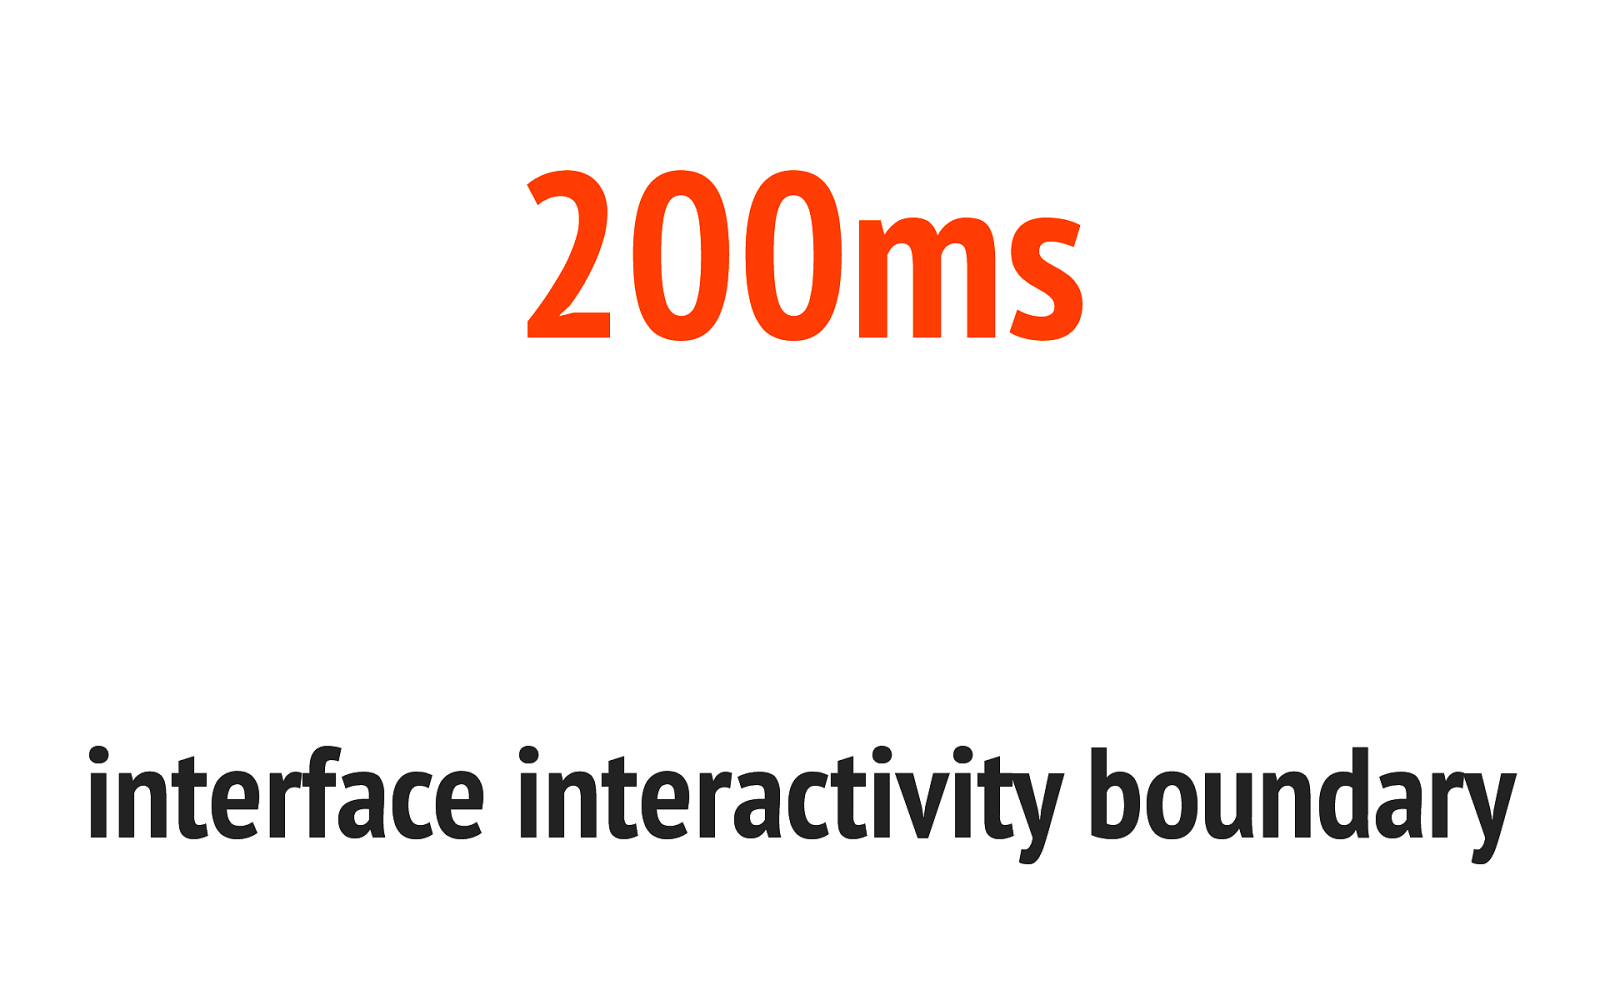
200ms interface interactivity boundary
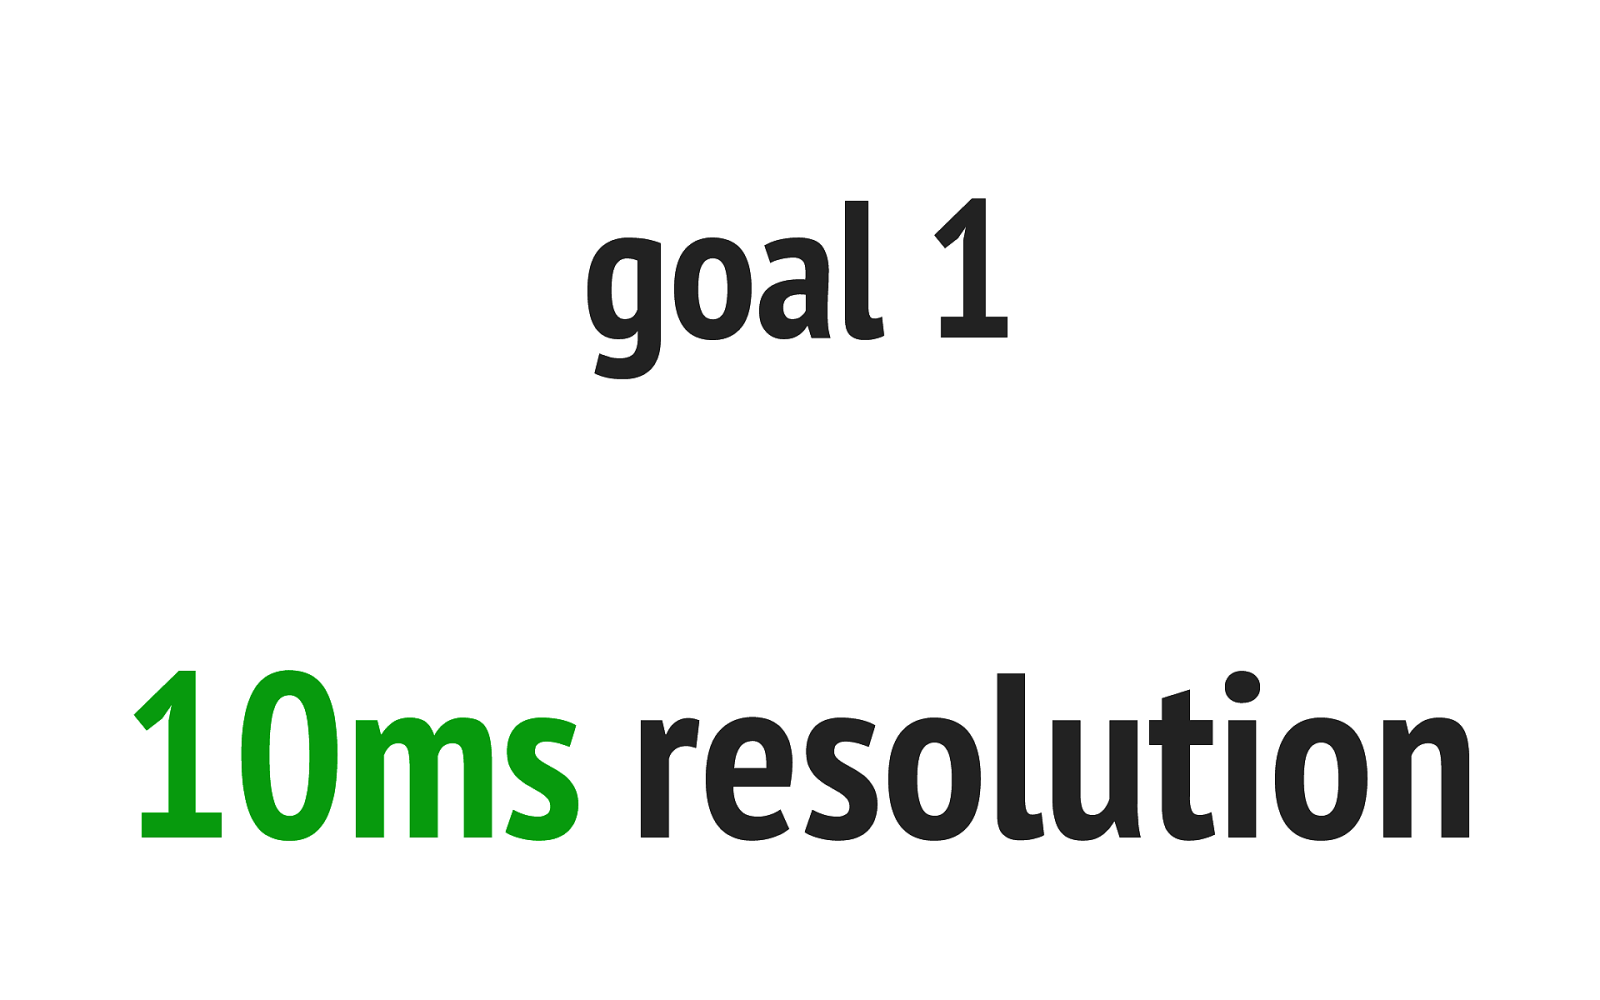
goal 1 10ms resolution

5 Internet is lying to you 1. Enable profiler extension… 2. Load the page to profile… 3. Find the resulting profile file… 4. Launch the profile viewer application… 5. Load the profile file in viewer application… Bullshit.
goal 2 0..2 clicks
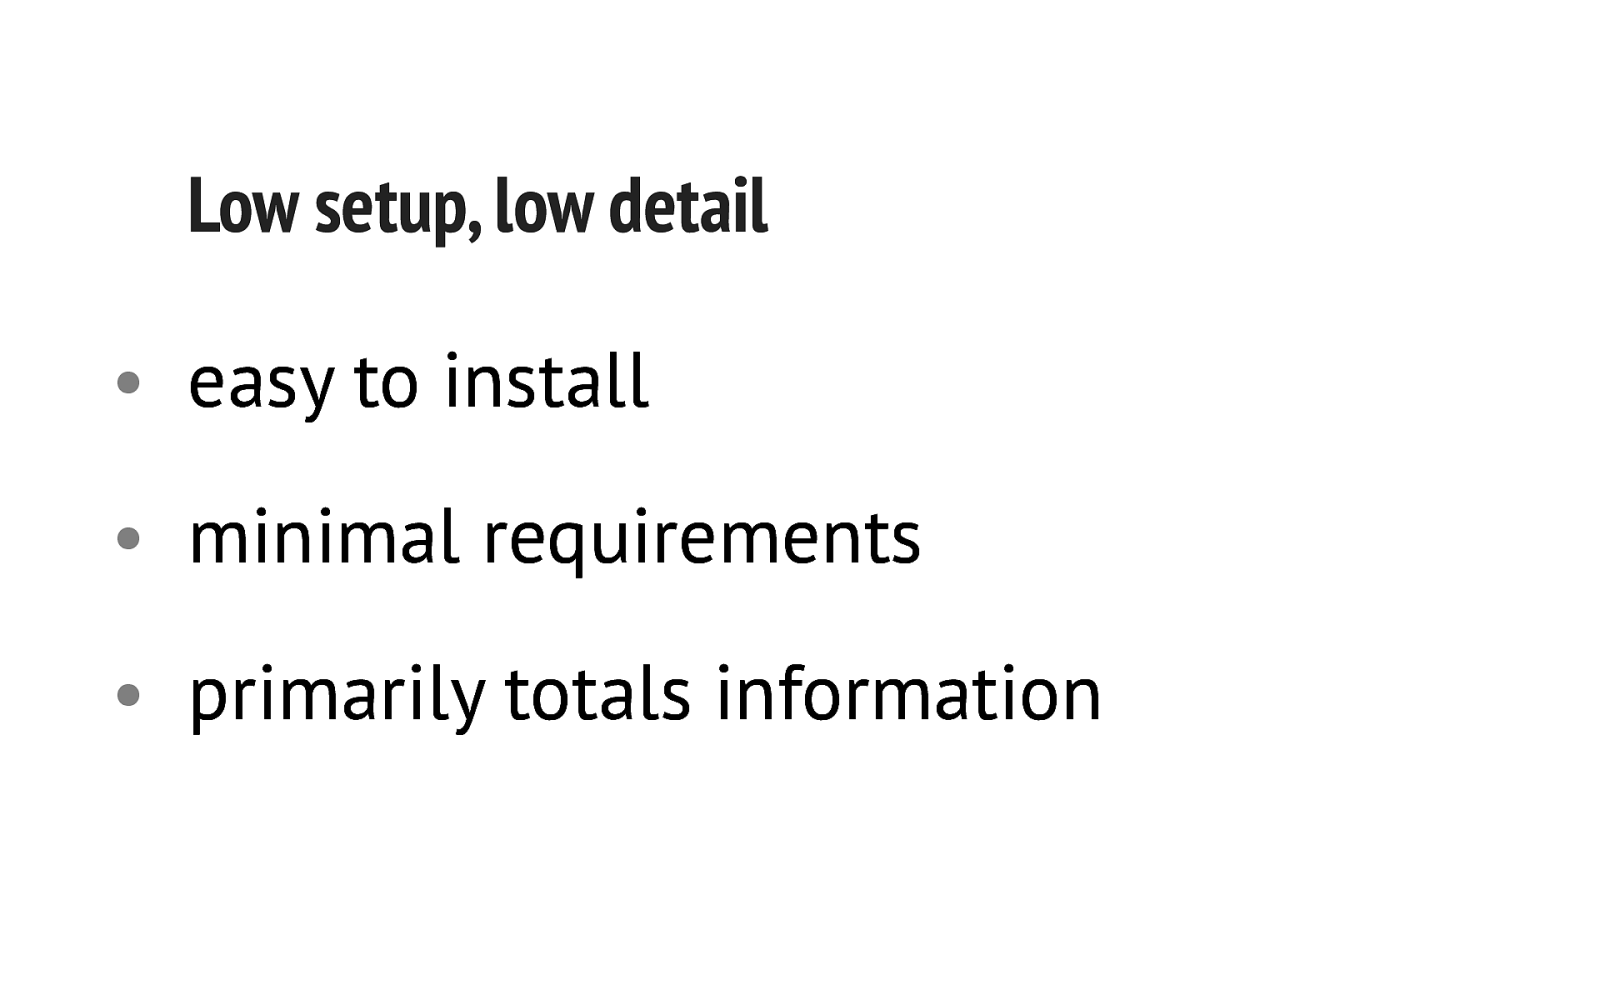
7 Low setup, low detail • easy to install • minimal requirements • primarily totals information
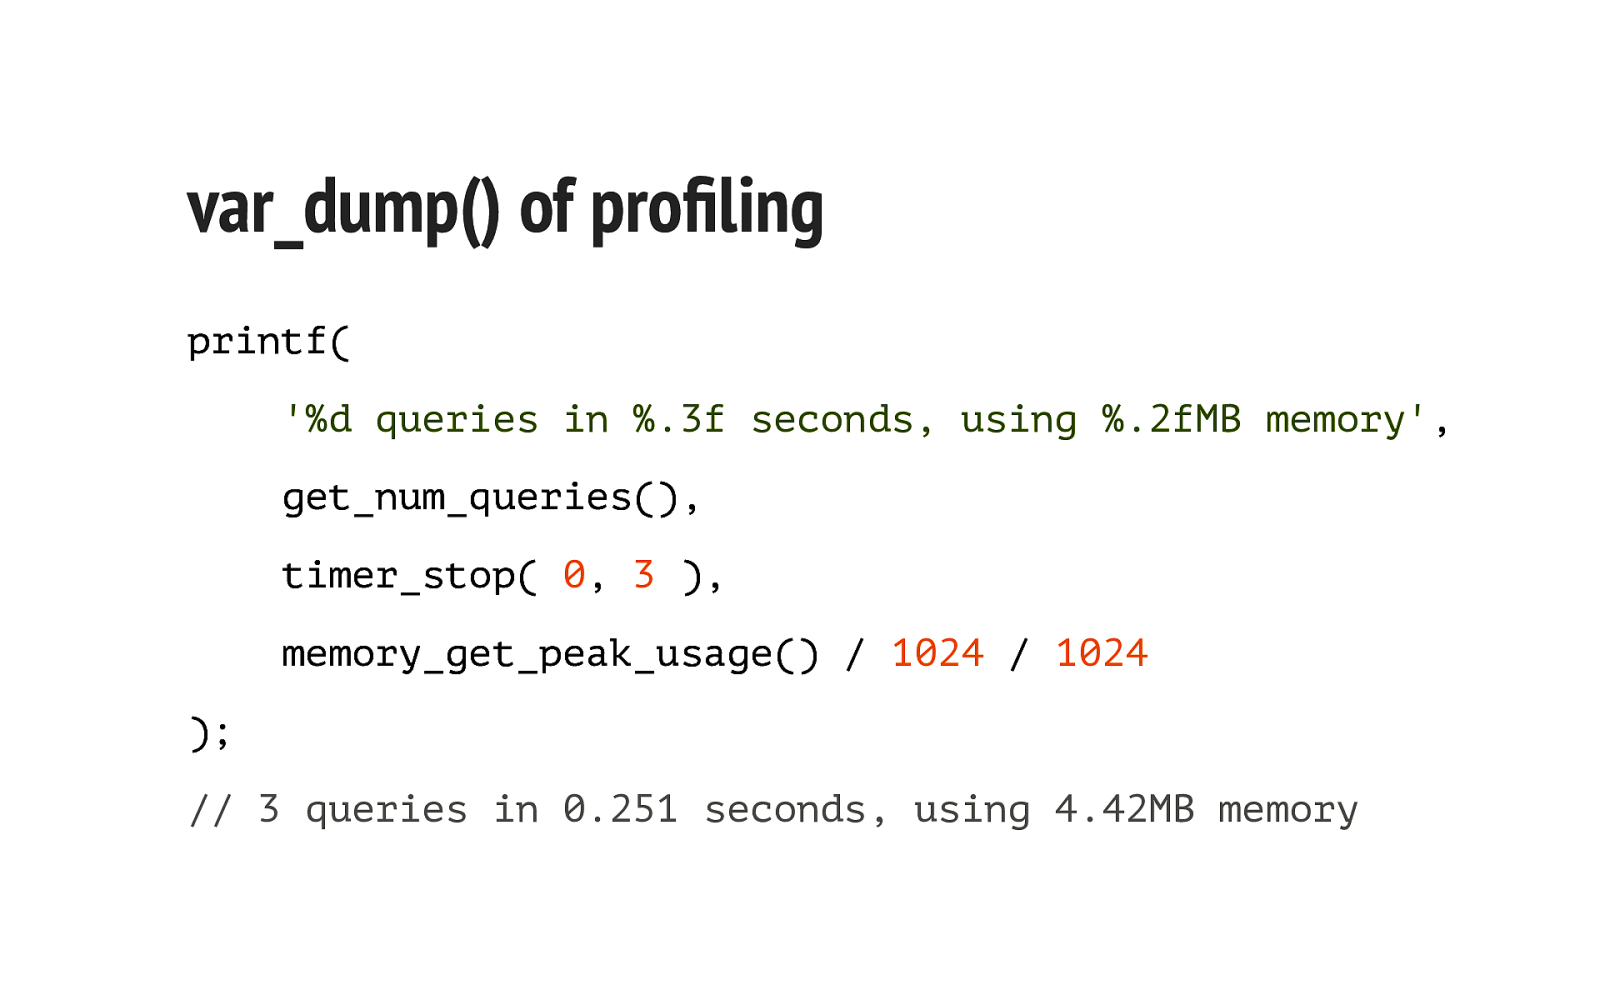
8 var_dump() of profiling printf( '%d queries in %.3f seconds, using %.2fMB memory', get_num_queries(), timer_stop( 0, 3 ), memory_get_peak_usage() / 1024 / 1024 ); // 3 queries in 0.251 seconds, using 4.42MB memory
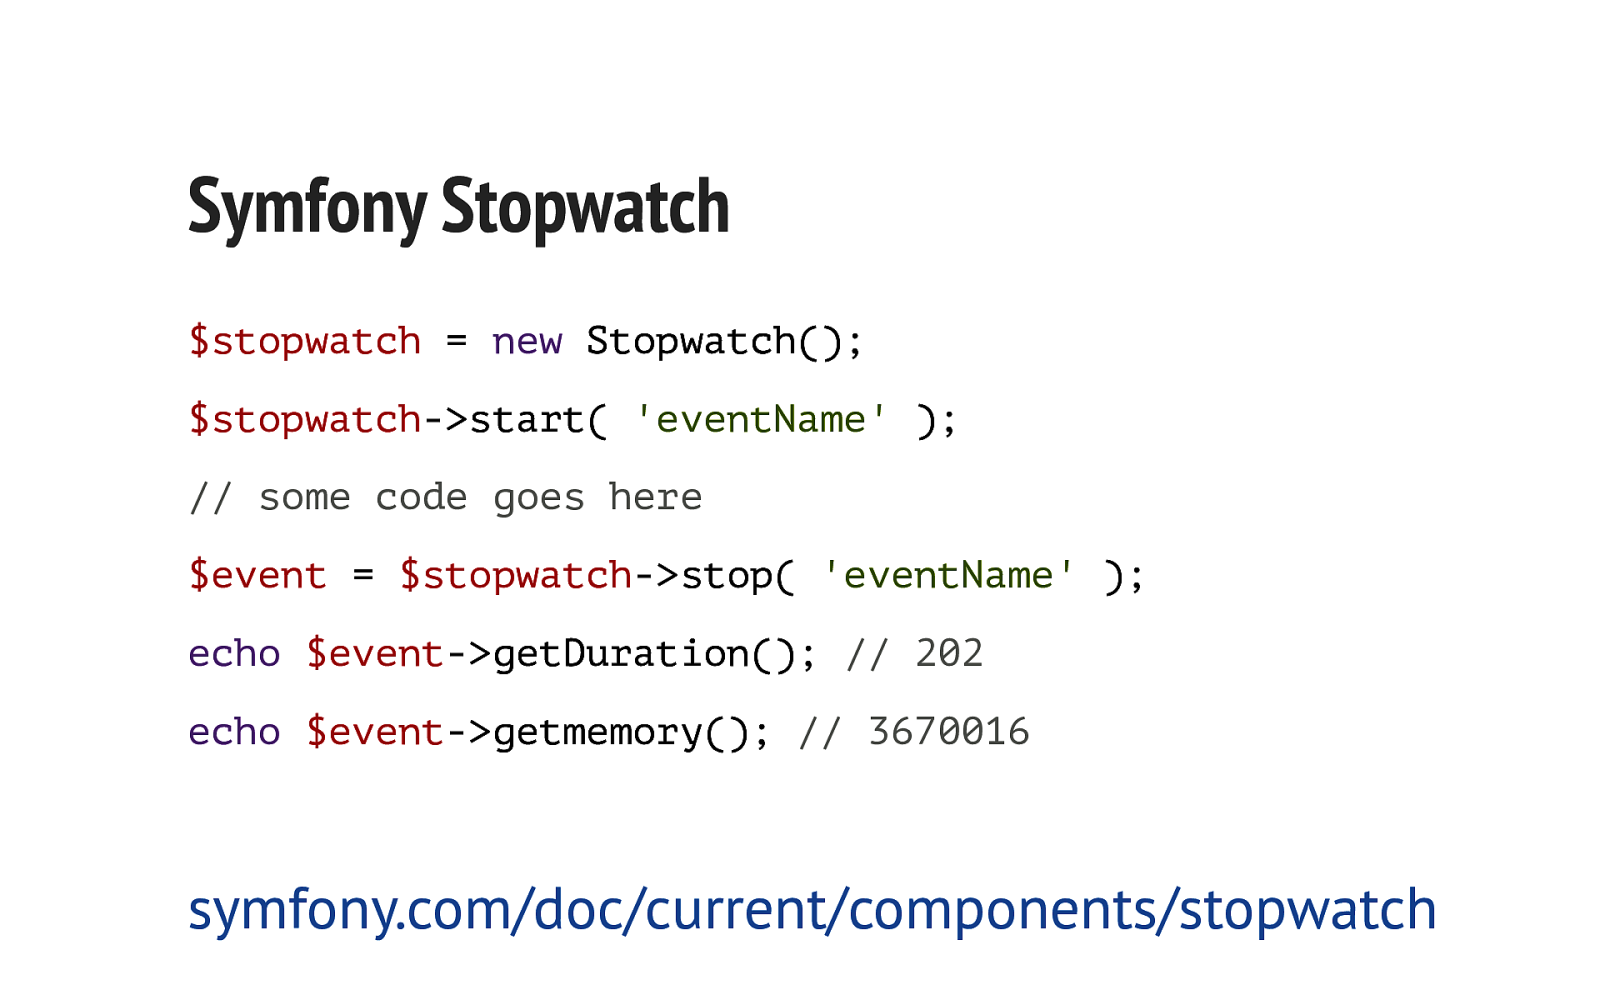
9 Symfony Stopwatch $stopwatch = new Stopwatch(); $stopwatch->start( 'eventName' ); // some code goes here $event = $stopwatch->stop( 'eventName' ); echo $event->getDuration(); // 202 echo $event->getmemory(); // 3670016 symfony.com/doc/current/components/stopwatch
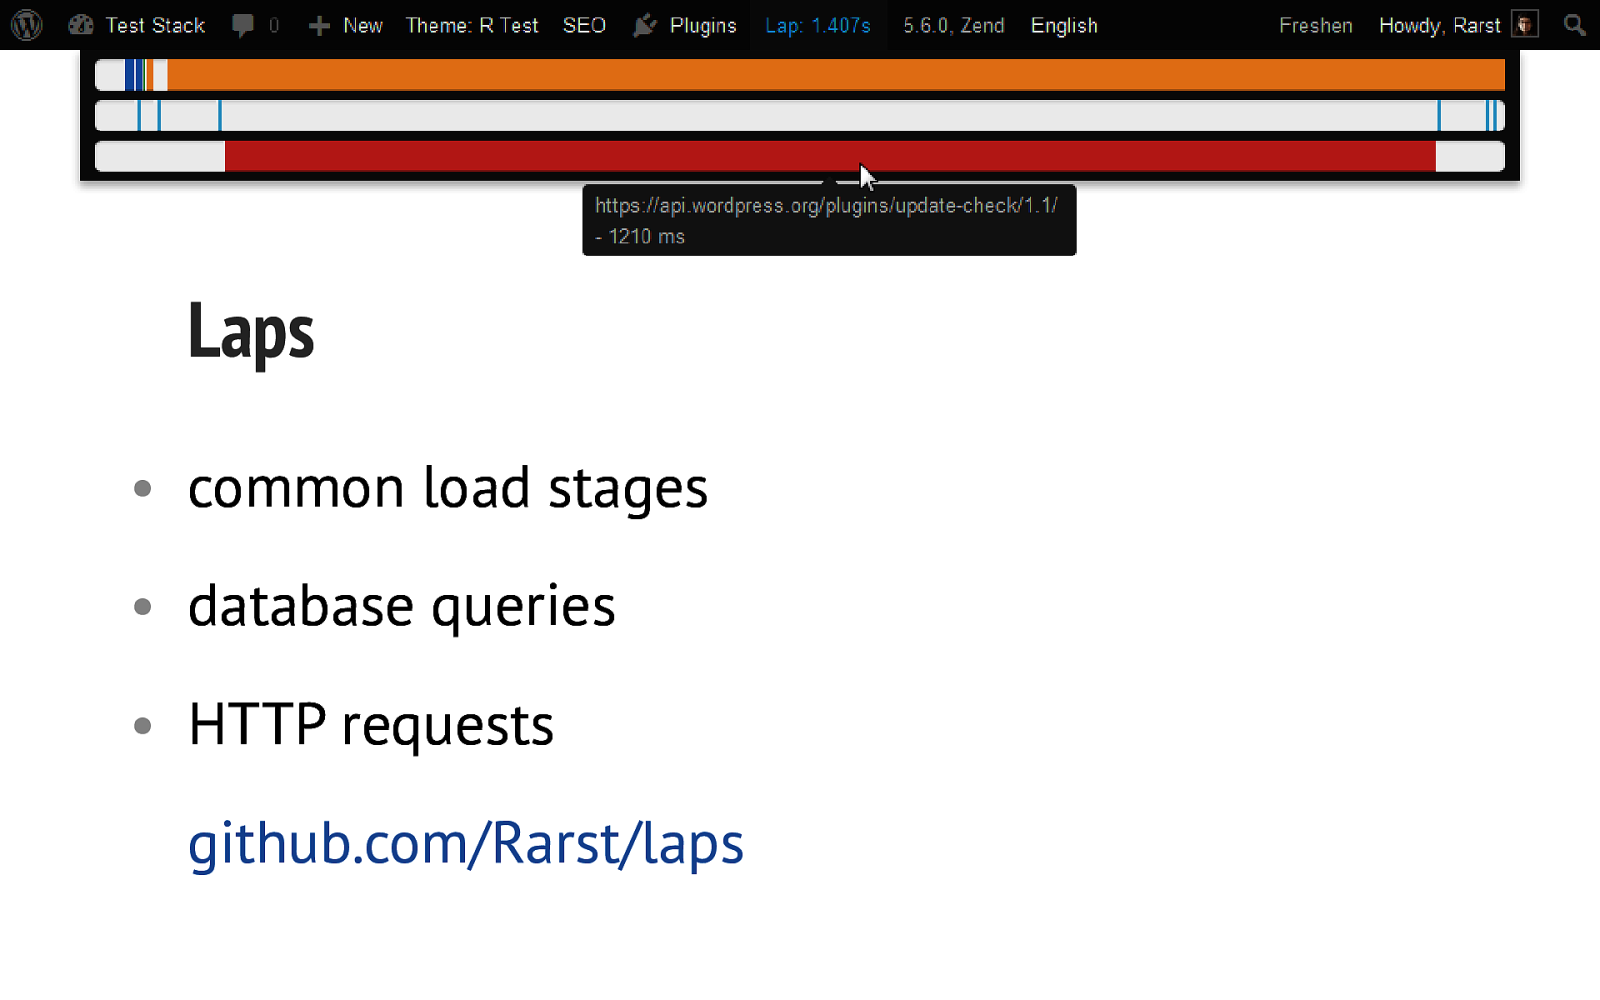
Laps • common load stages • database queries • HTTP requests github.com/Rarst/laps
11 High setup, high detail • (relatively) hard to install • require PHP binary extension • highly detailed information
12 XHProf / uprofiler • open source • lightweight • lingua franca format github.com/FriendsOfPHP/uprofiler
13 Blackfire • in beta • hosted service • nice user interface blackfire.io
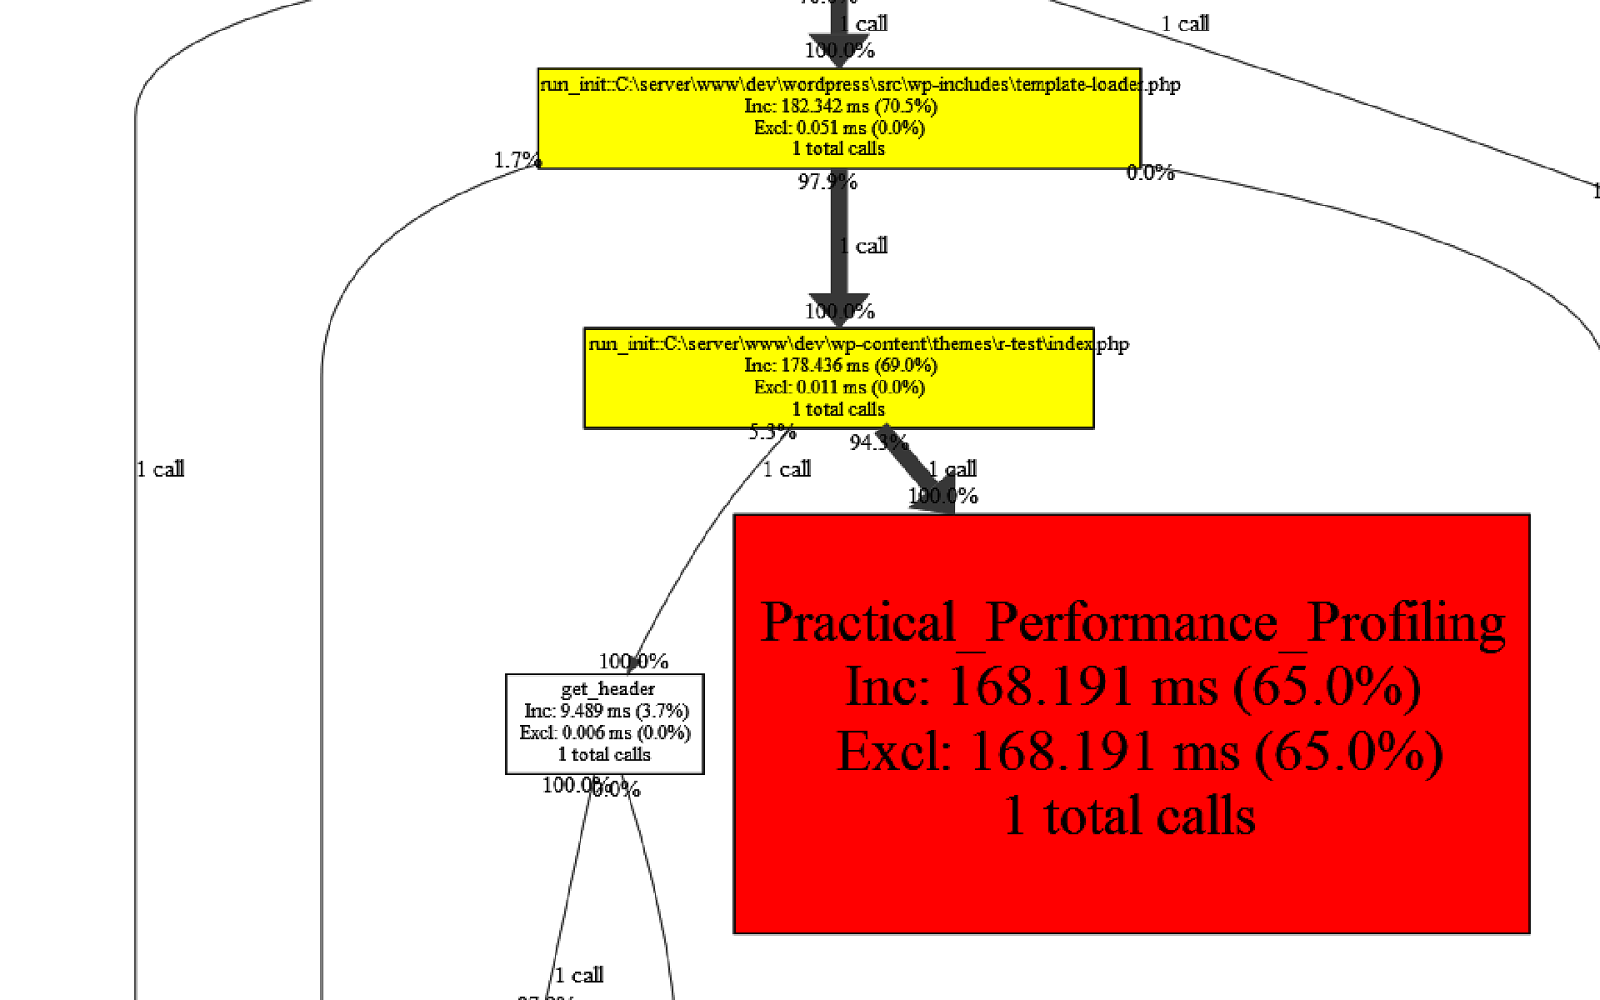
15 Practical performance profiling • bookmarklet trigger • web viewer Complete in–browser workflow.
16 Hands off, always on • automated data collection • looking for anomalies • in multiple contexts
17 New Relic • involved server setup • collects from many technologies • dumbs it down magnificently newrelic.com
18 WP Performance Profiler • WordPress plugin • pure PHP ( no extension ) • contexts ( front/admin/cron/ajax ) wpperformanceprofiler.interconnectit.com

next monday install Laps

a while later question results
21 Thank you for listening! Questions? @Rarst Rarst.net/slides/profiling Rarst.net/slides/profiling/code