Application Metrics with Prometheus Rafael Dohms
@rdohms !

A presentation at Dutch PHP Conference in June 2018 in Amsterdam, Netherlands by Rafael Dohms

Application Metrics with Prometheus Rafael Dohms
@rdohms !

How do you do metrics?

“The Prometheus Scientist Method”

I hope not.

jobs.usabilla.com Rafael Dohms Staff Engineer rdohms doh.ms ! !

jobs.usabilla.com
Rafael Dohms
Staff Engineer
rdohms
doh.ms
!
!
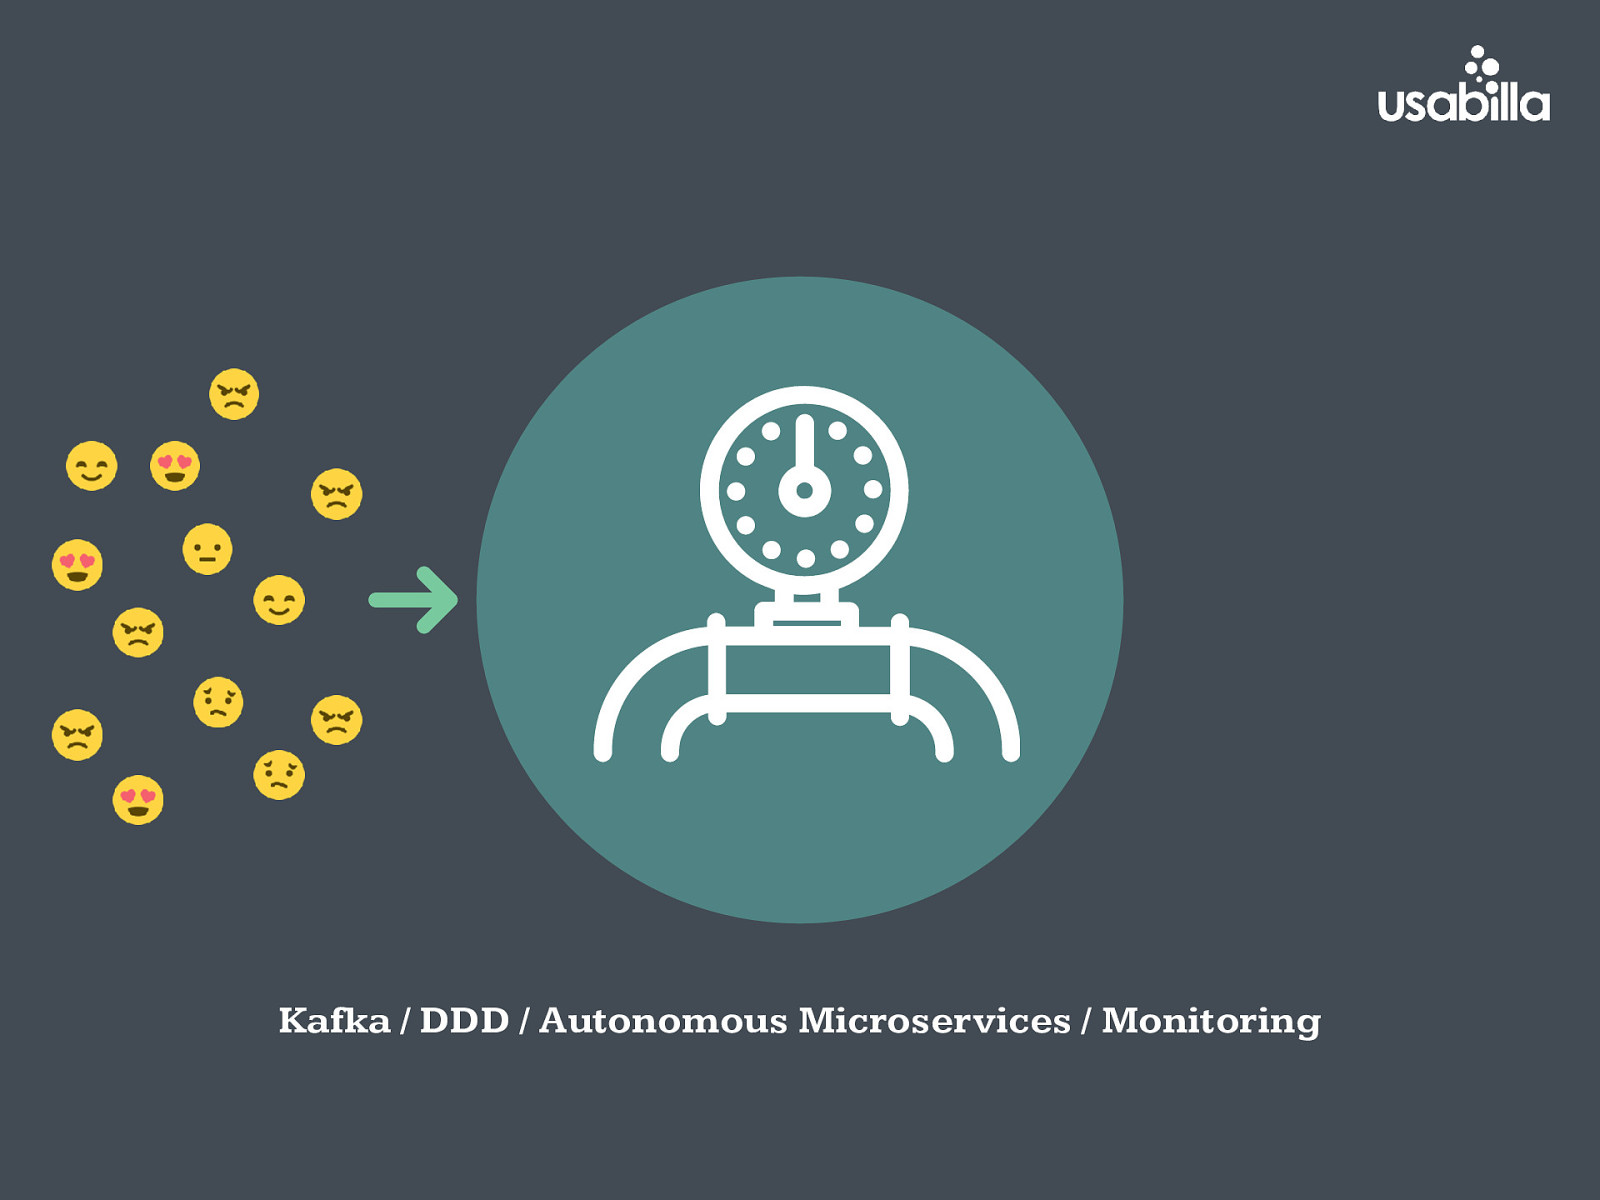
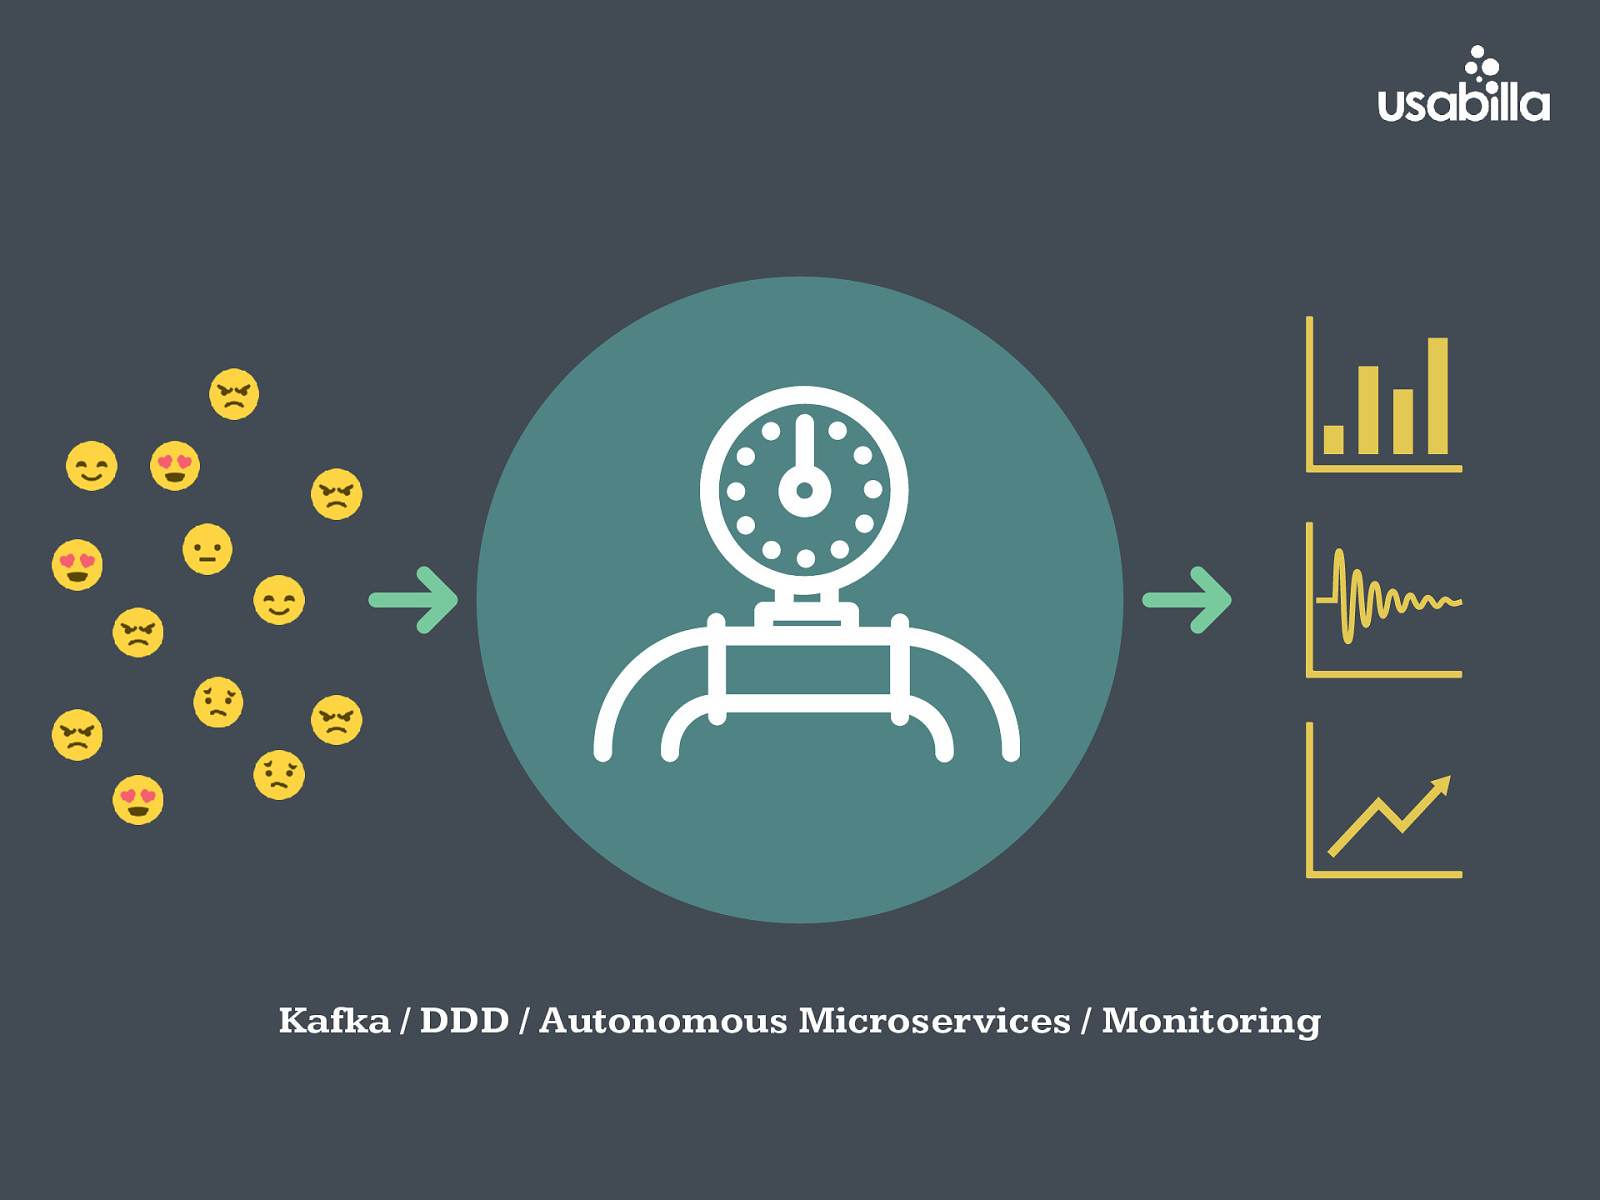
Feedback
Feedback

Kafka / DDD / Autonomous Microservices / Monitoring
Kafka / DDD / Autonomous Microservices / Monitoring
Kafka / DDD / Autonomous Microservices / Monitoring

Metrics are insights into the current state of your application.

Metrics tell you if your service is healthy.

Canary Deploys Oksana Latysheva

Metrics tell you what is wrong.

Metrics tell you what is right.

Metrics tell you what will soon be wrong.

Metrics tell you where to start looking.

Site Reliability Engineering
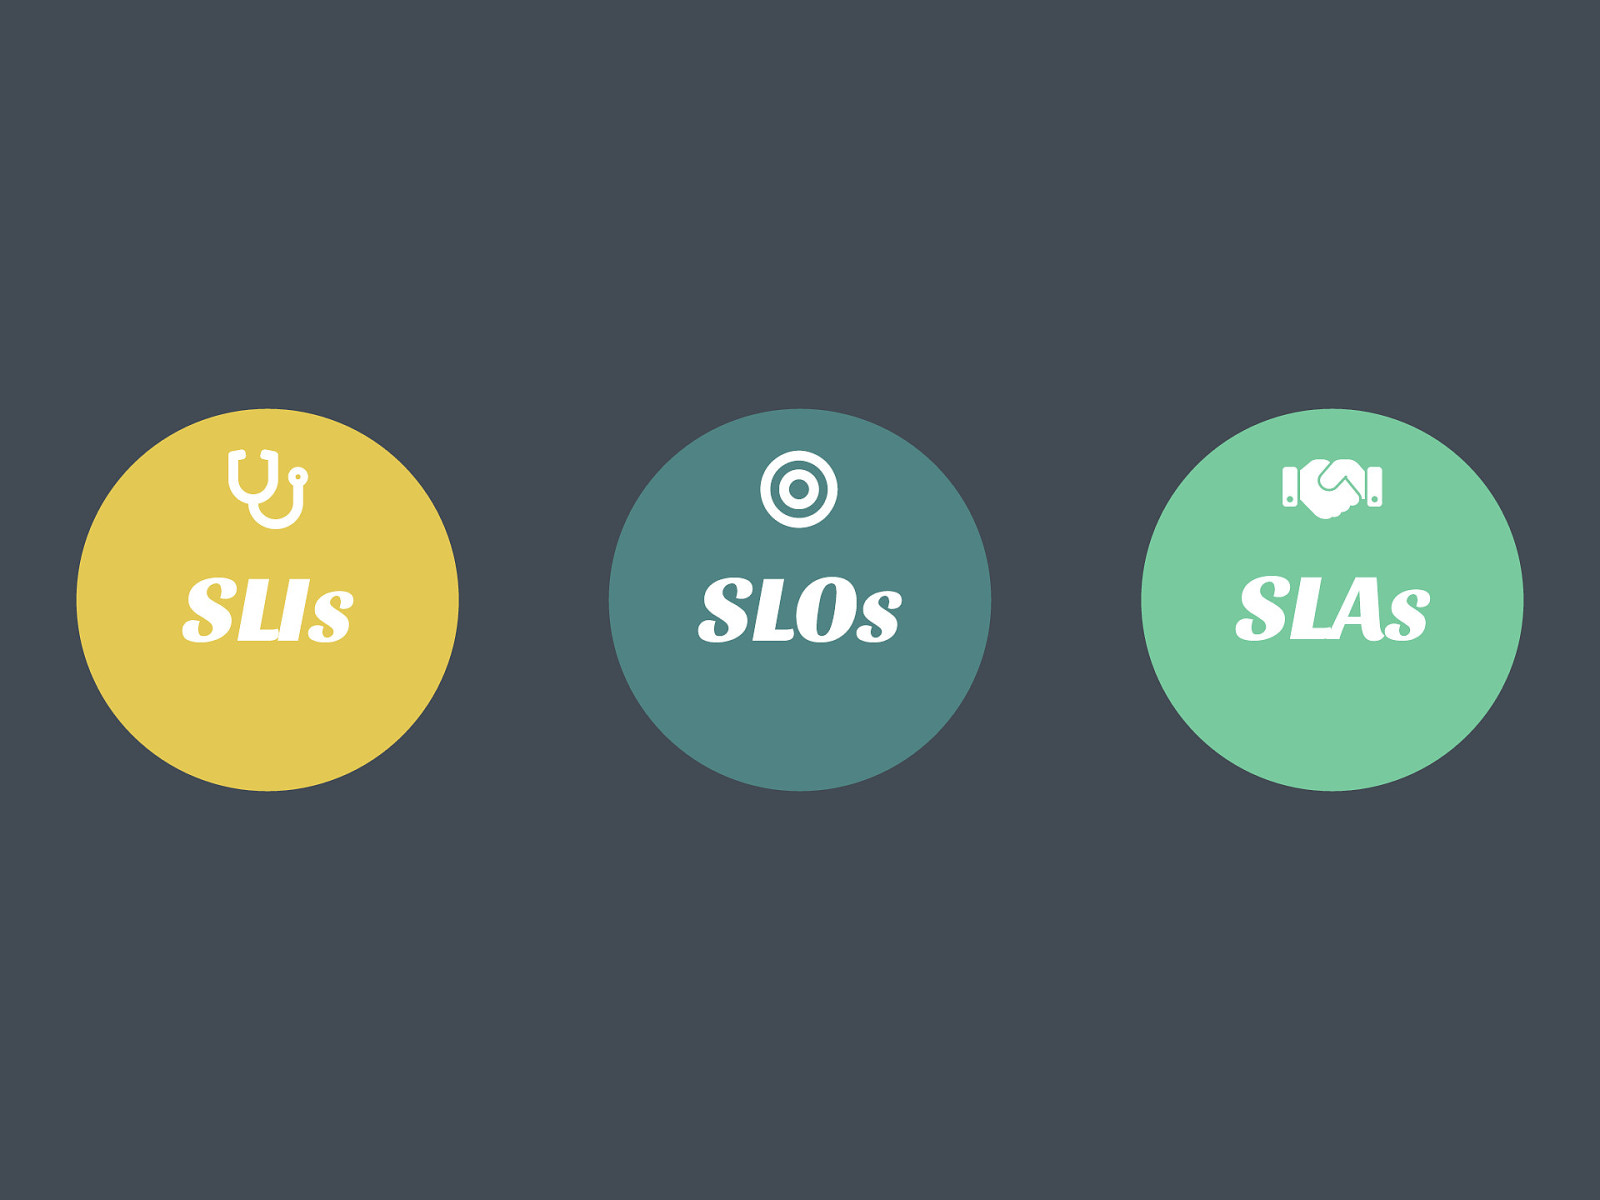
SLIs " SLOs ◎ SLAs $
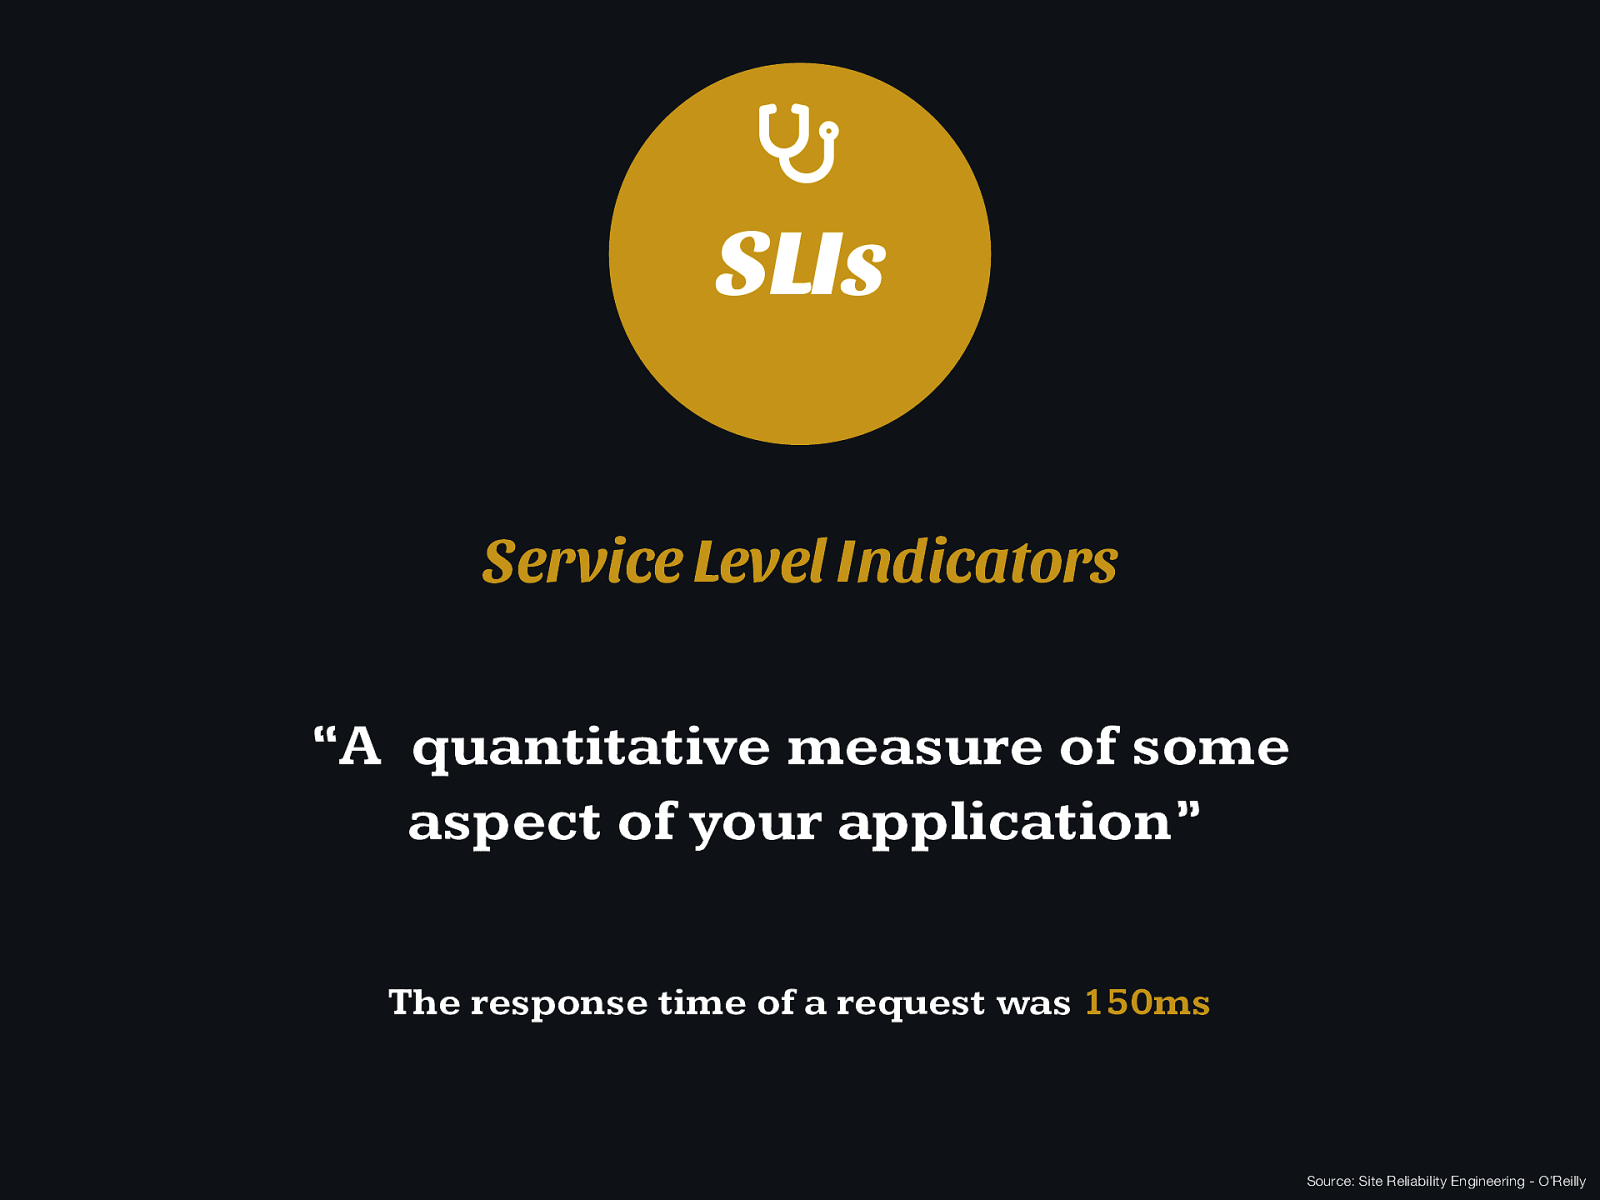
SLIs " Service Level Indicators “A quantitative measure of some aspect of your application” The response time of a request was 150ms Source: Site Reliability Engineering - O’Reilly

SLOs ◎ Service Level Objectives “A target value or a range of values for something measured by an SLI” Request response times should be below 200ms Source: Site Reliability Engineering - O’Reilly
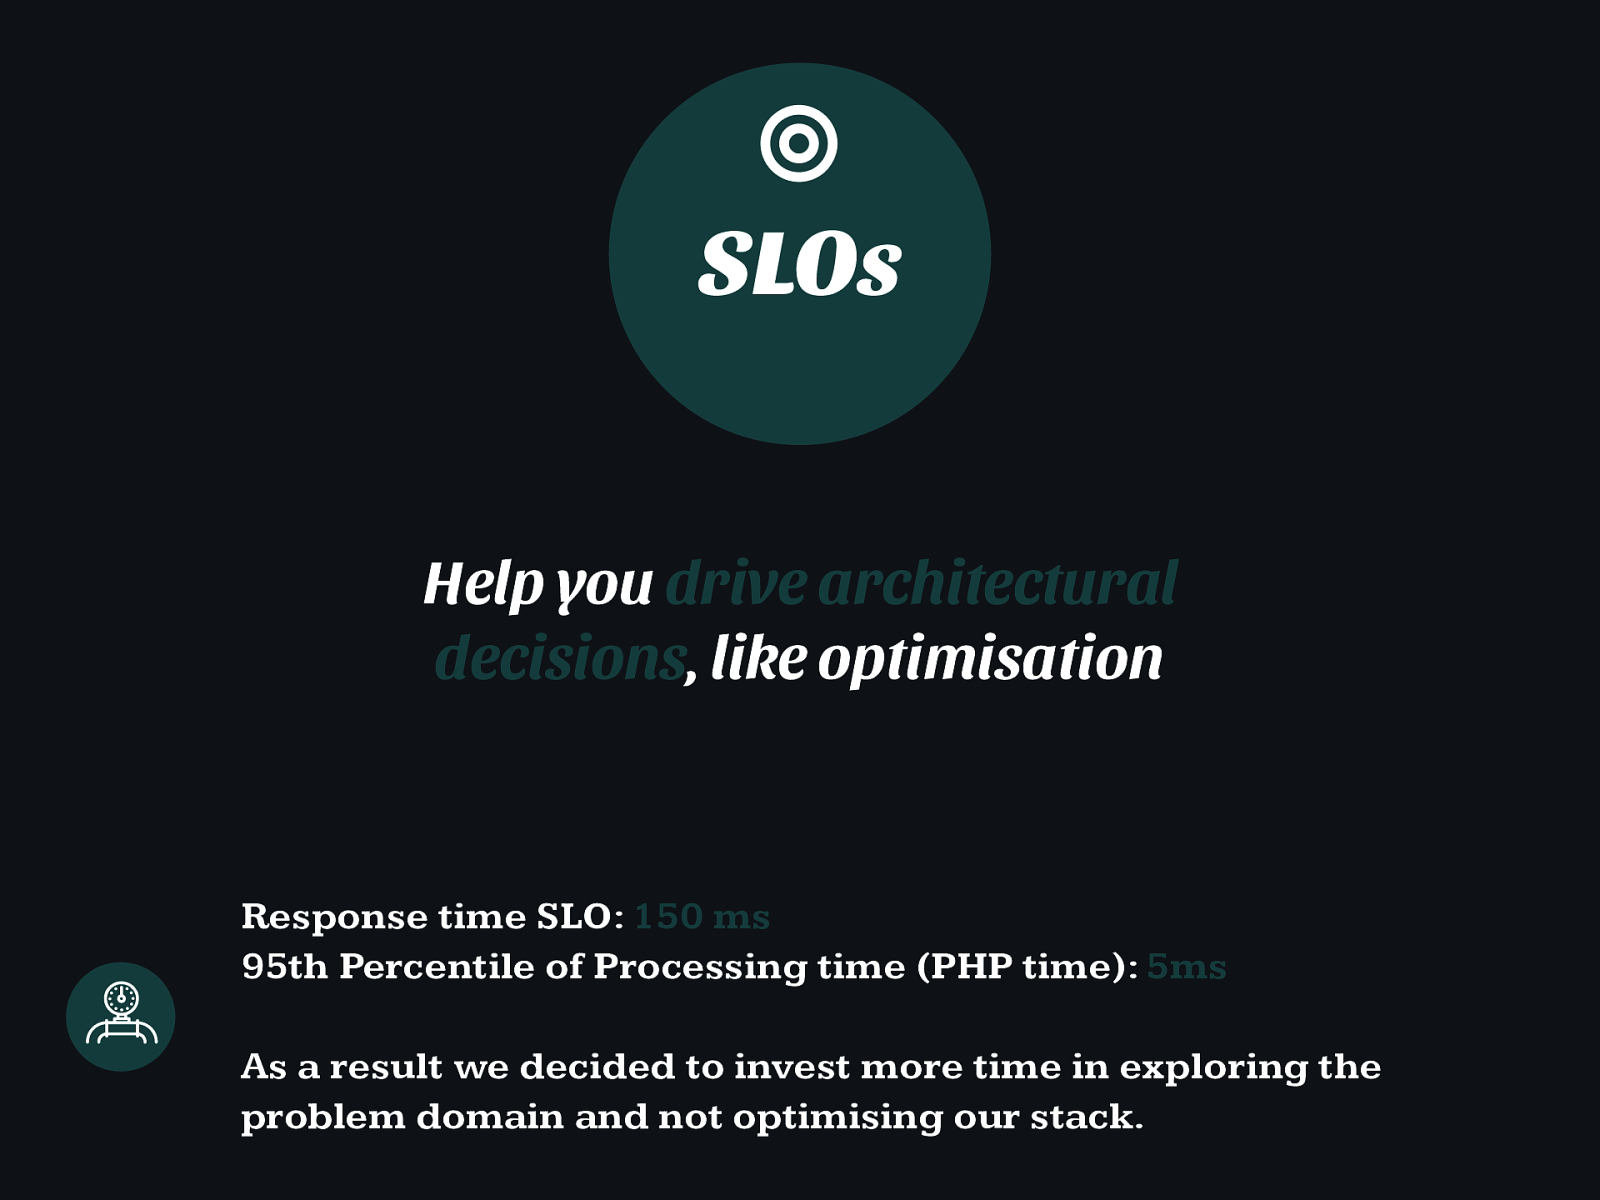
Help you drive architectural decisions , like optimisation SLOs ◎ Response time SLO: 150 ms 95th Percentile of Processing time (PHP time): 5ms As a result we decided to invest more time in exploring the problem domain and not optimising our stack.
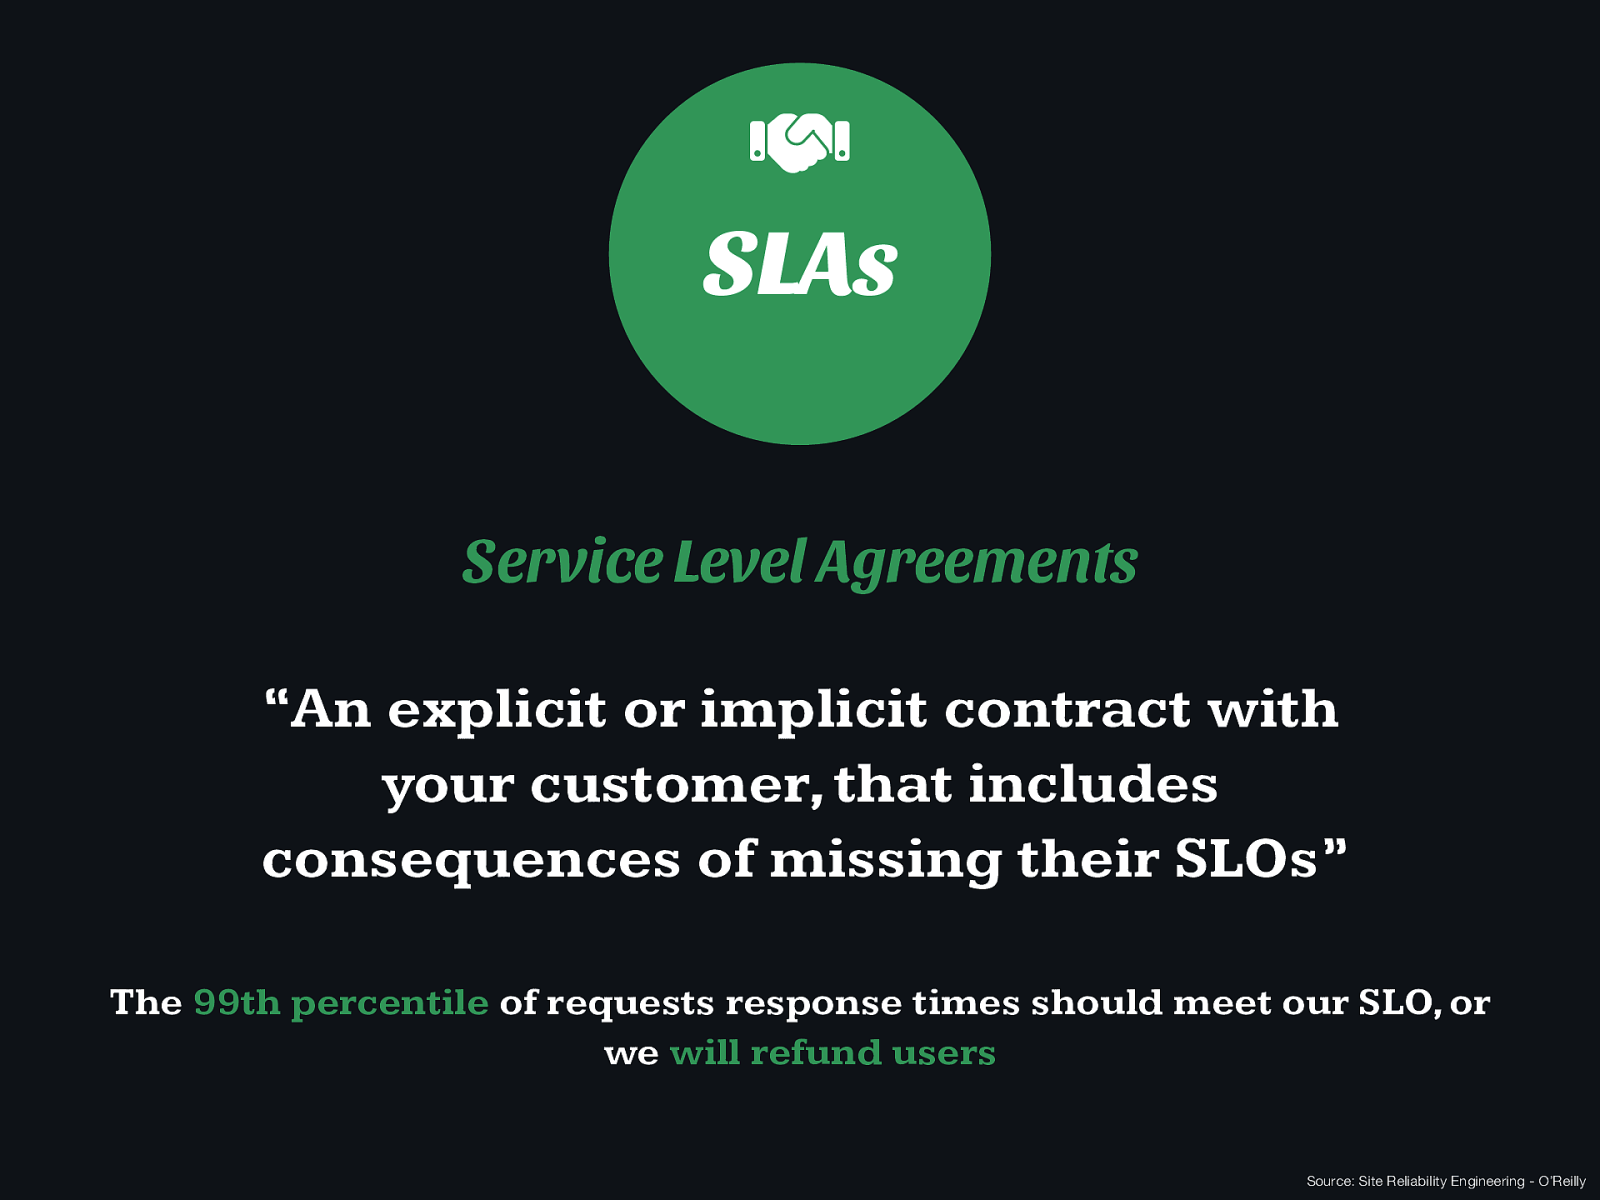
SLAs $ Service Level Agreements “An explicit or implicit contract with your customer, that includes consequences of missing their SLOs” The 99th percentile of requests response times should meet our SLO, or we will refund users Source: Site Reliability Engineering - O’Reilly

Measuring

–Etsy Engineering “If it moves, we track it.” https://codeascraft.com/2011/02/15/measure-anything-measure-everything/
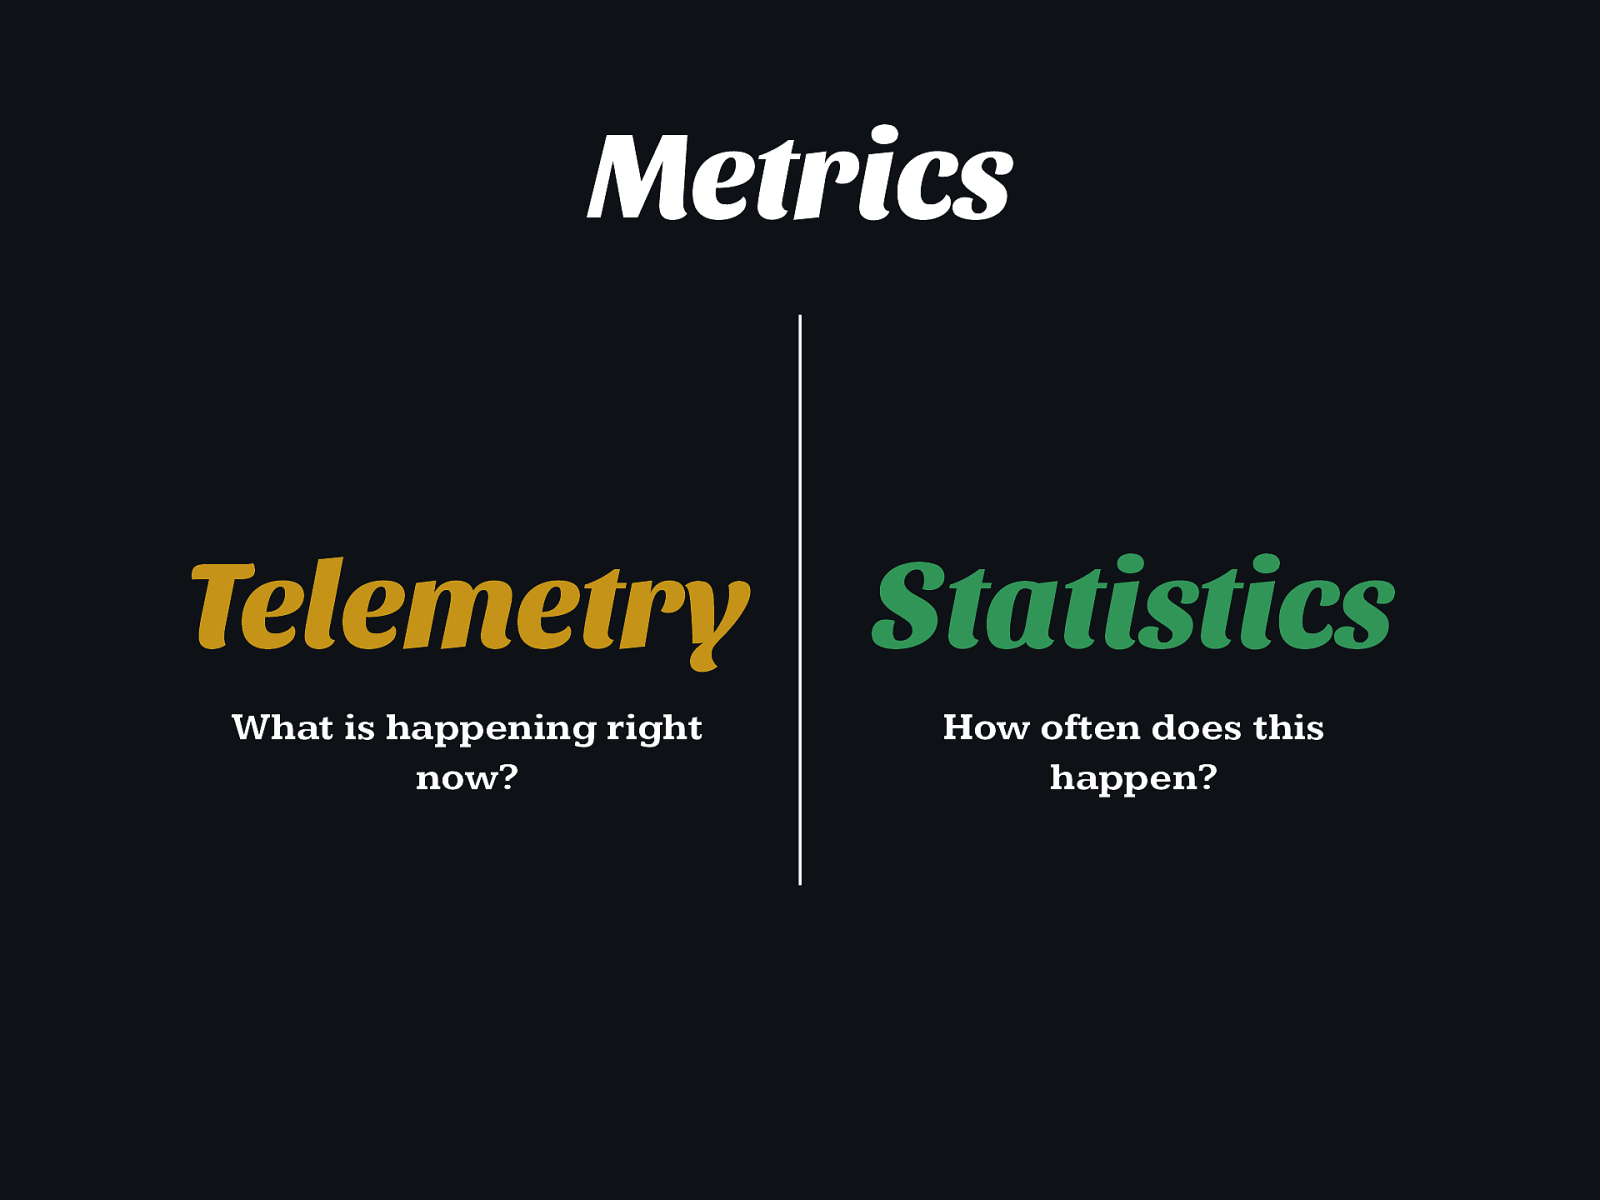
Metrics Statistics What is happening right now? How often does this happen? Telemetry
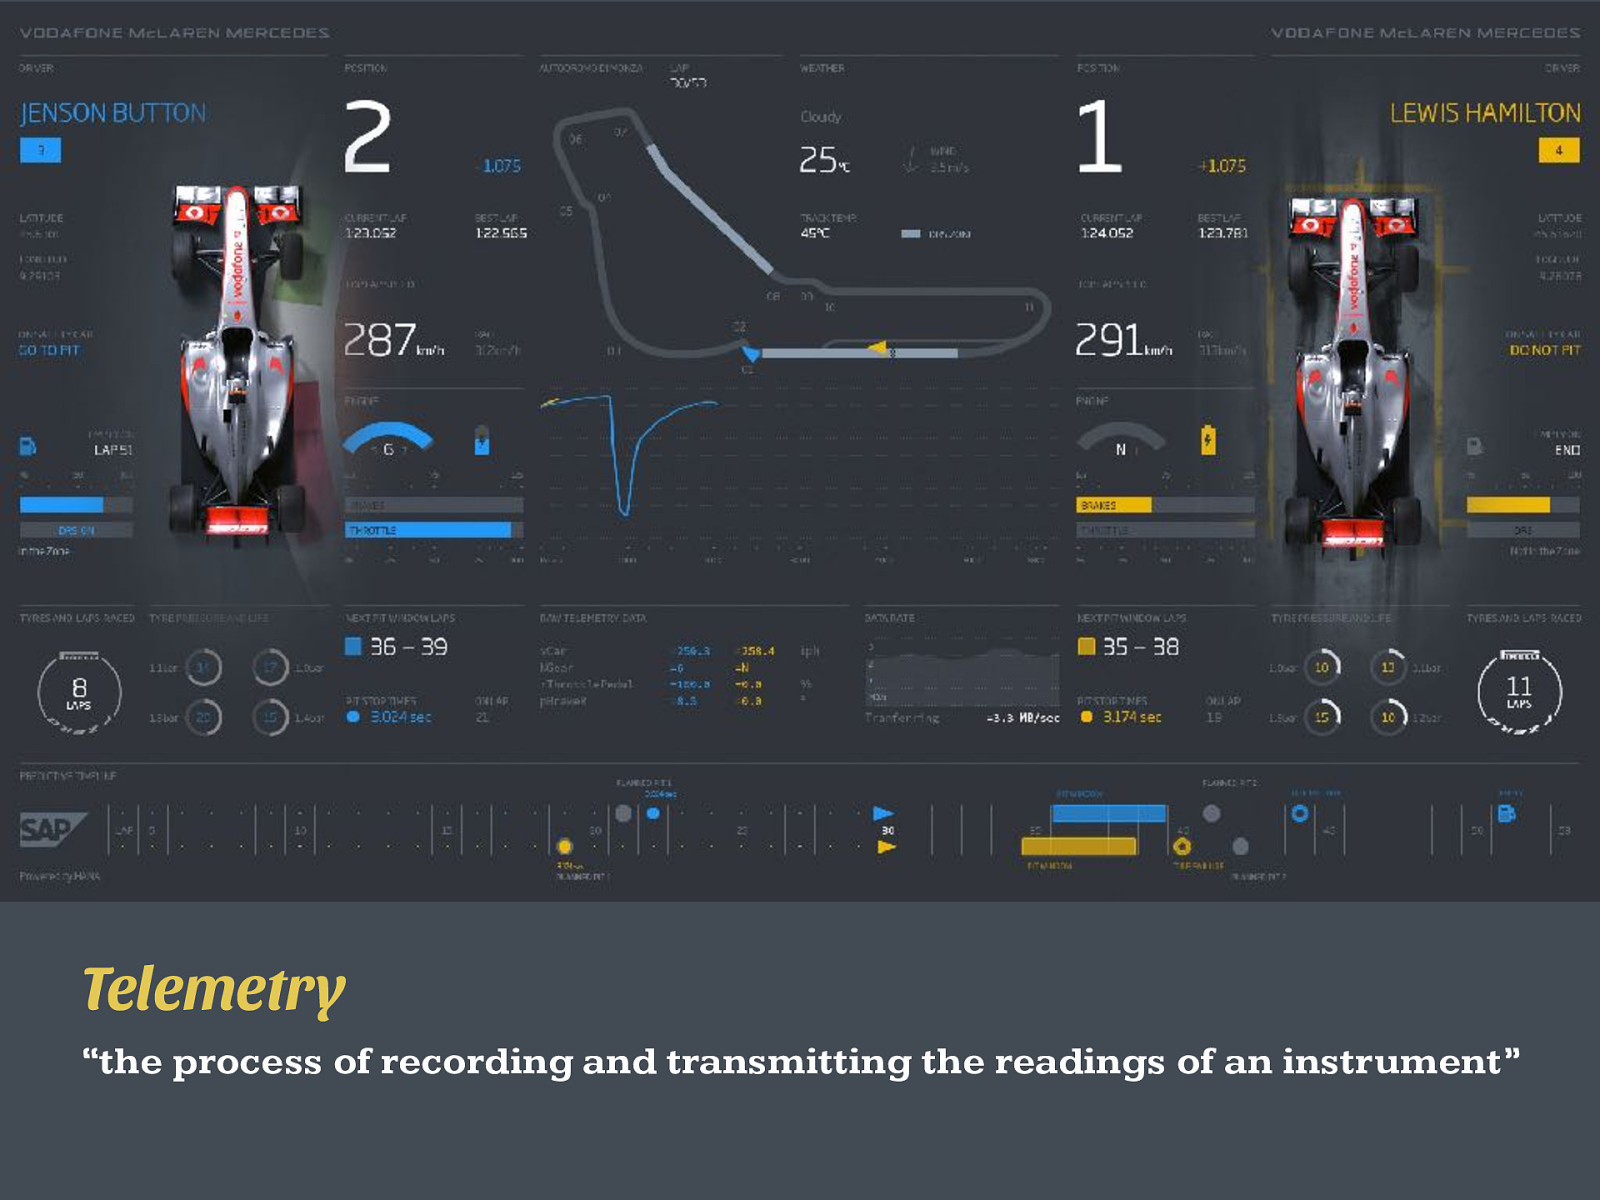
Telemetry “the process of recording and transmitting the readings of an instrument”
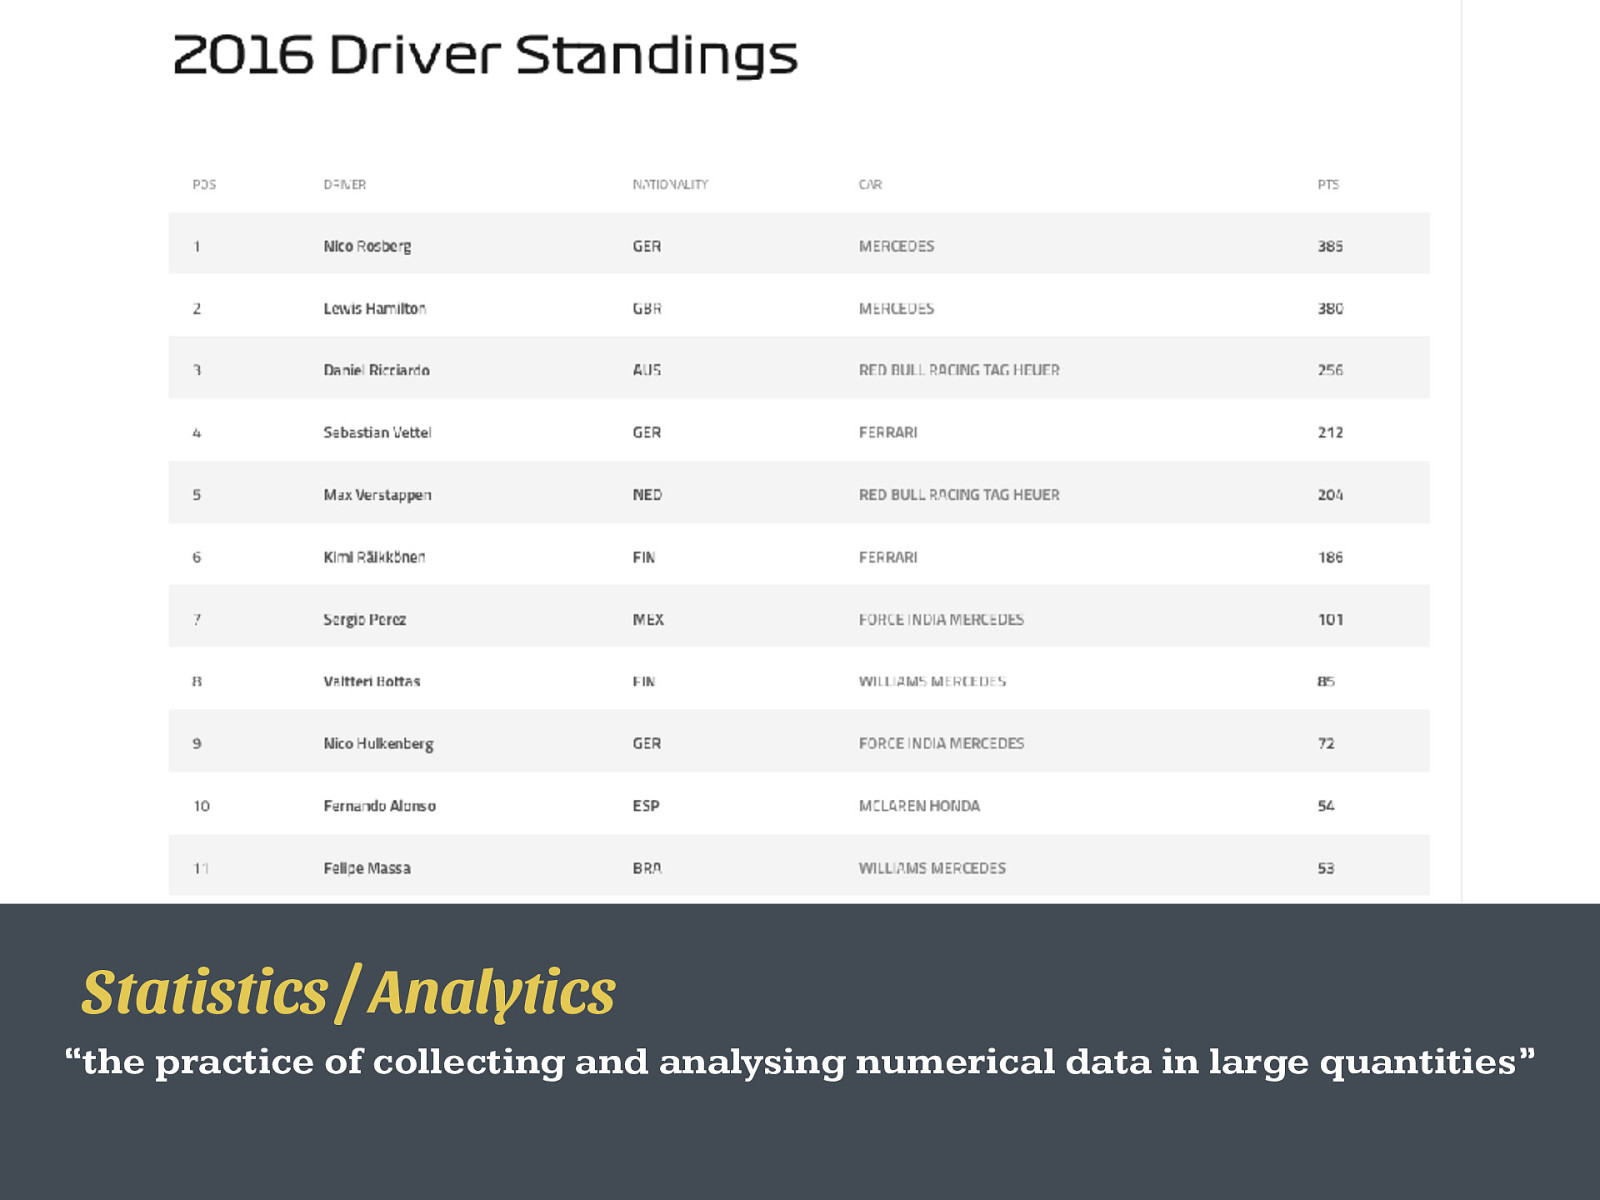
Statistics / Analytics “the practice of collecting and analysing numerical data in large quantities”
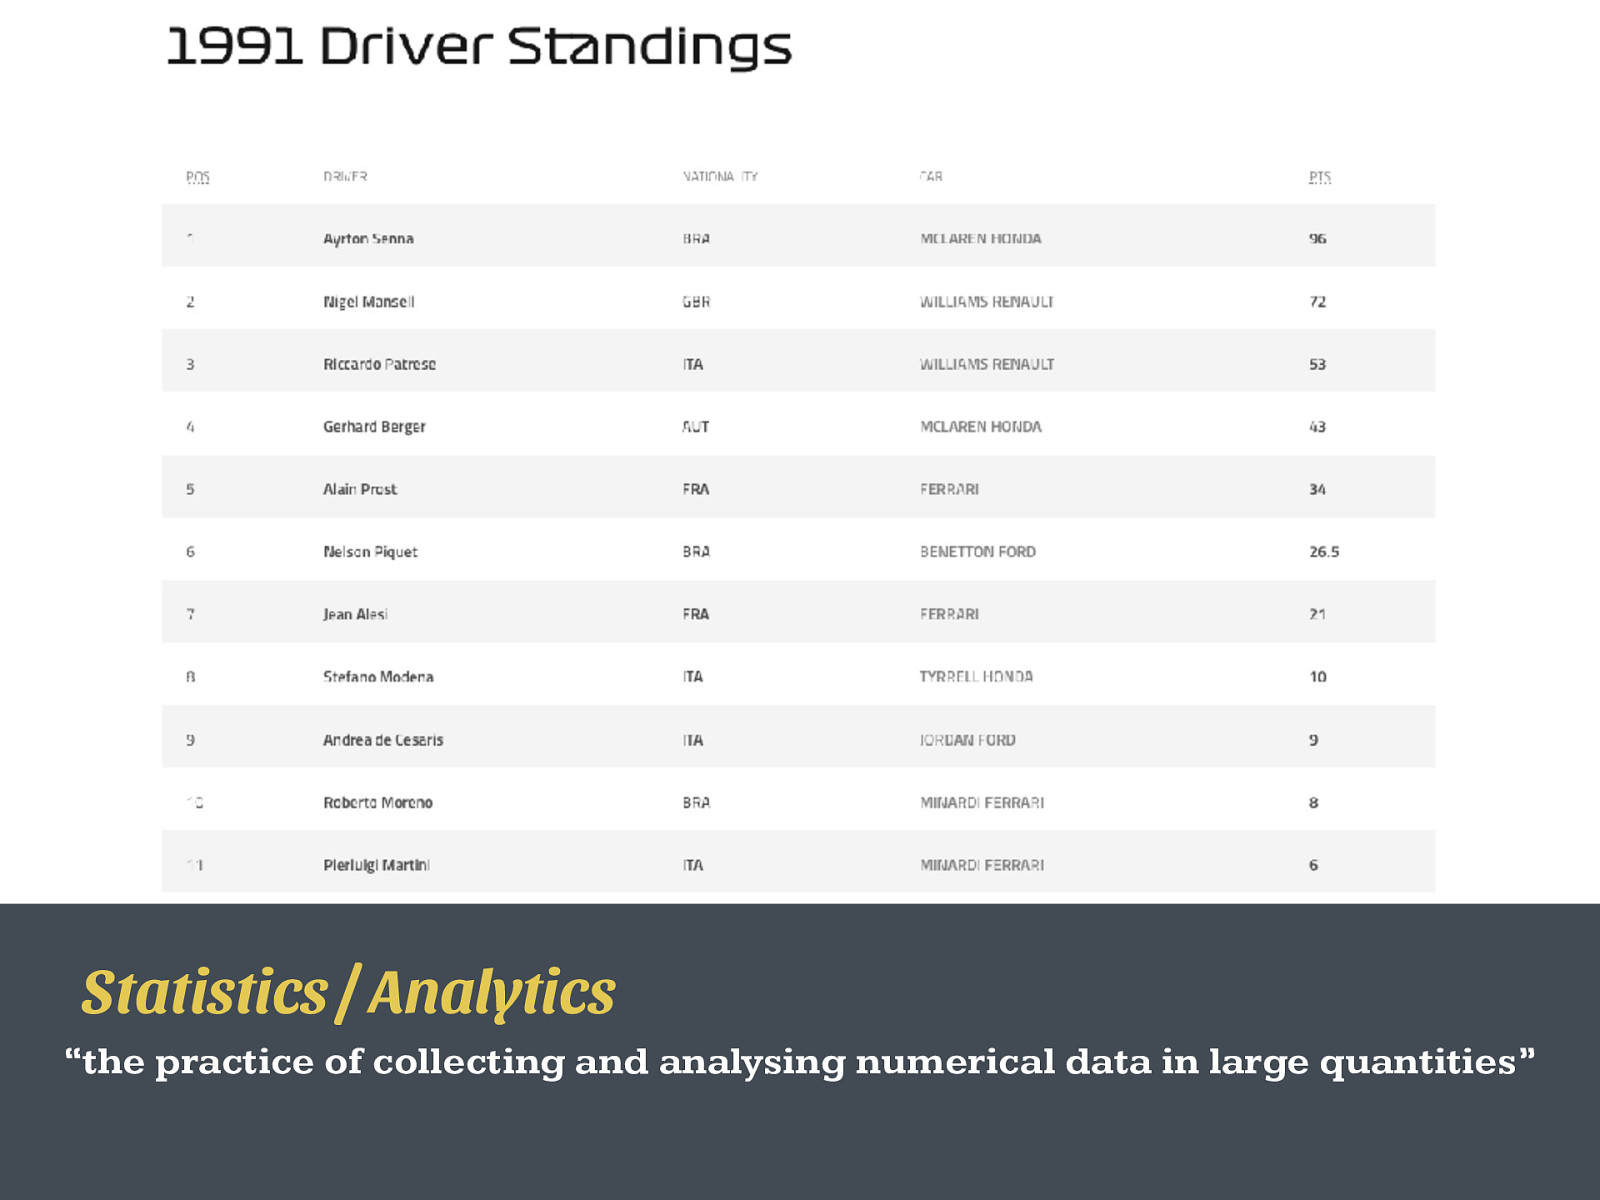
Statistics / Analytics “the practice of collecting and analysing numerical data in large quantities”
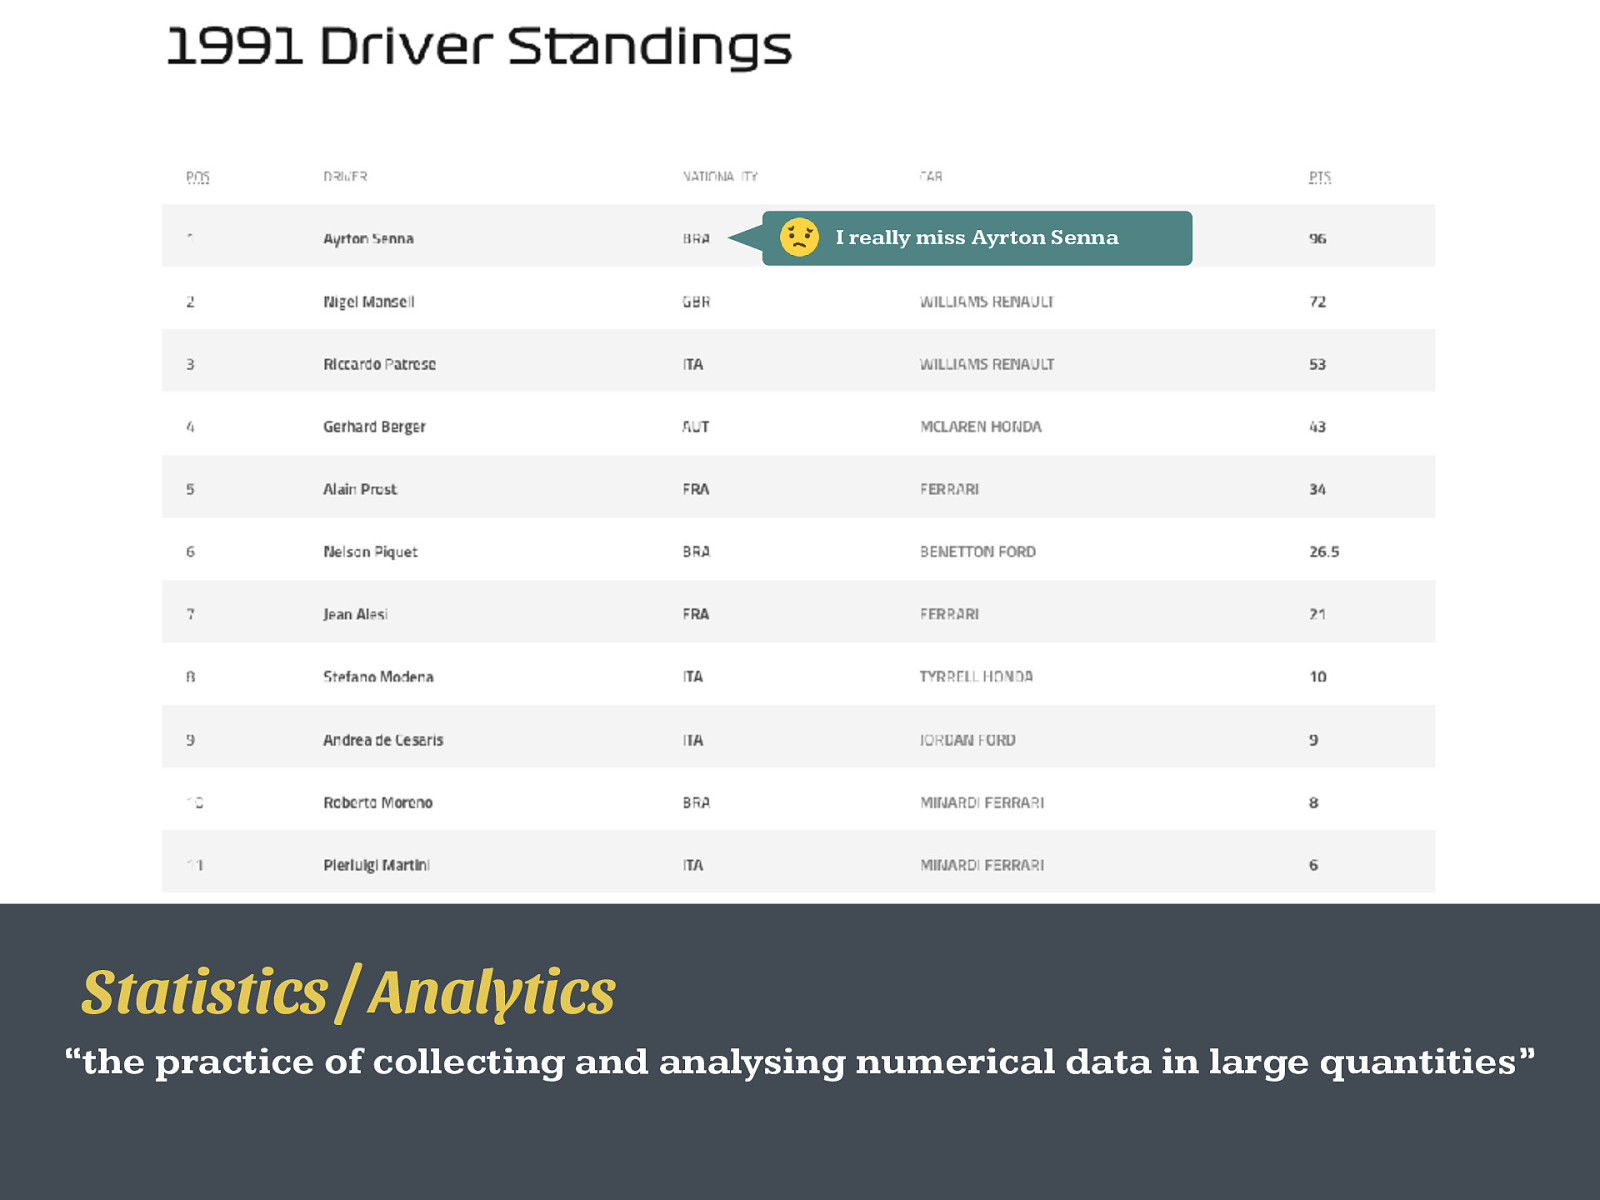
I really miss Ayrton Senna Statistics / Analytics “the practice of collecting and analysing numerical data in large quantities”
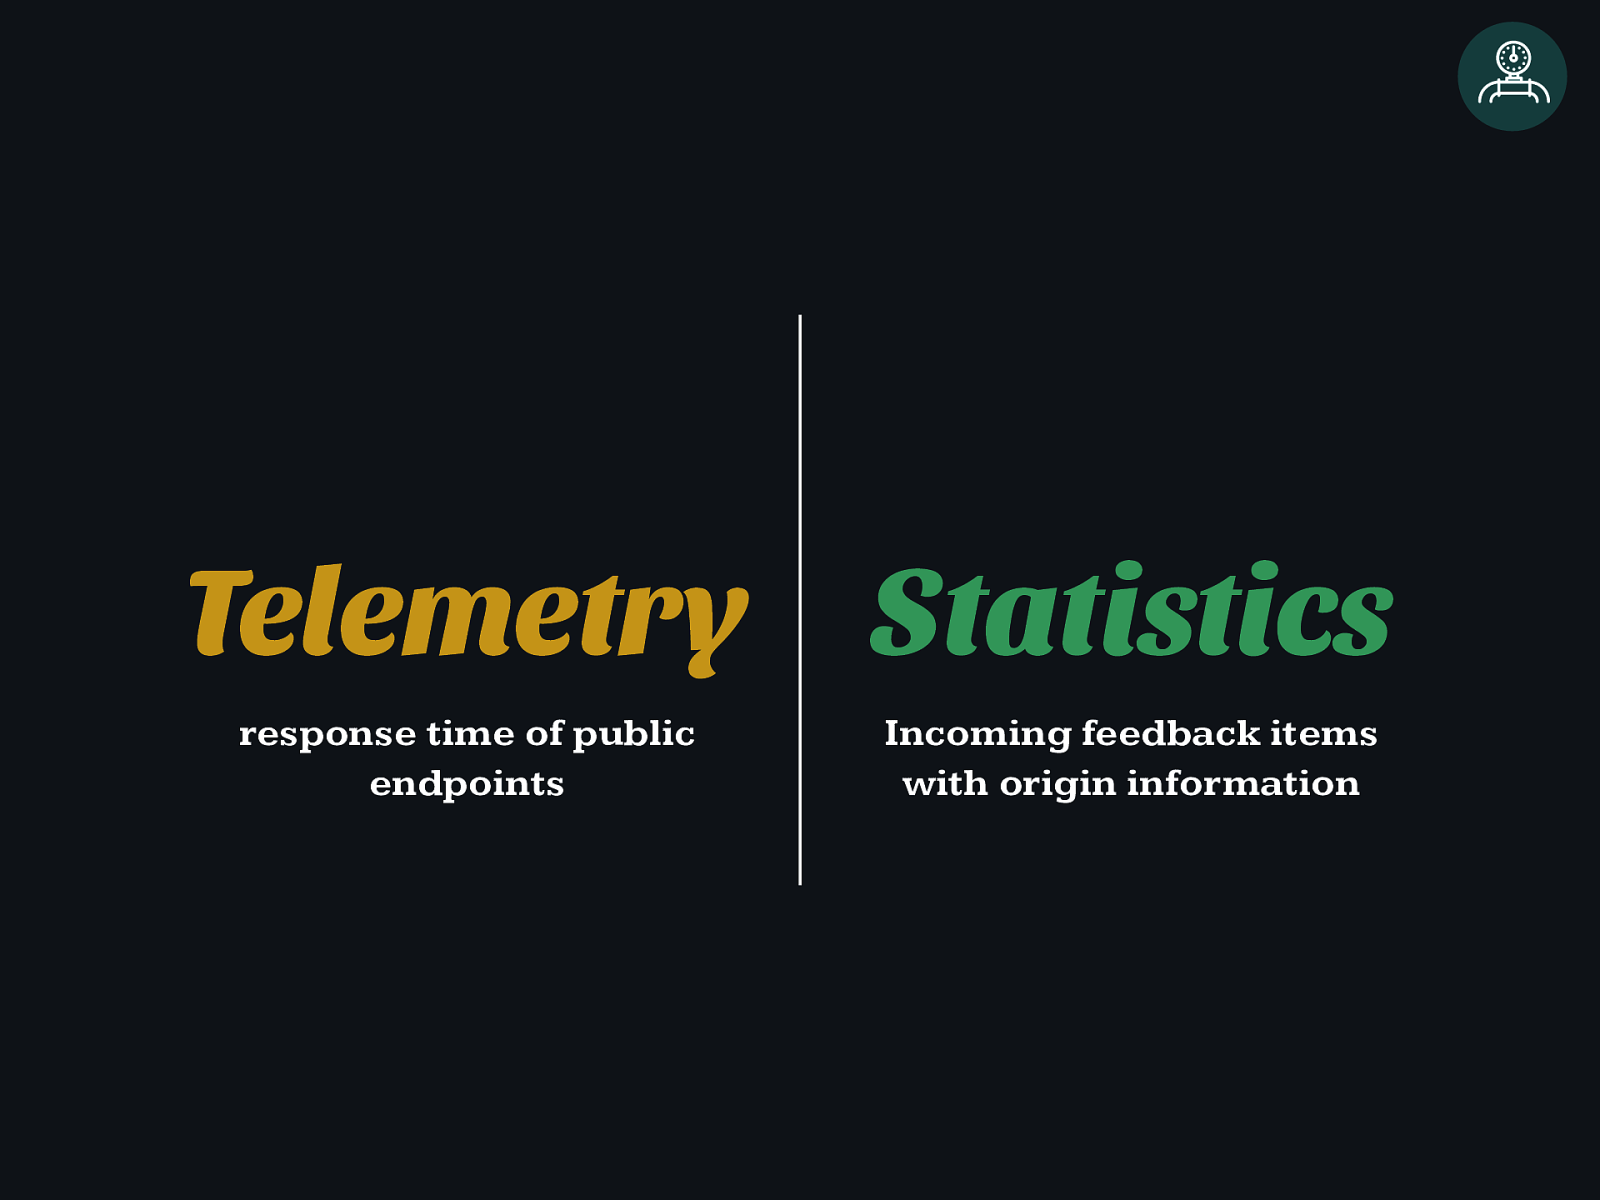
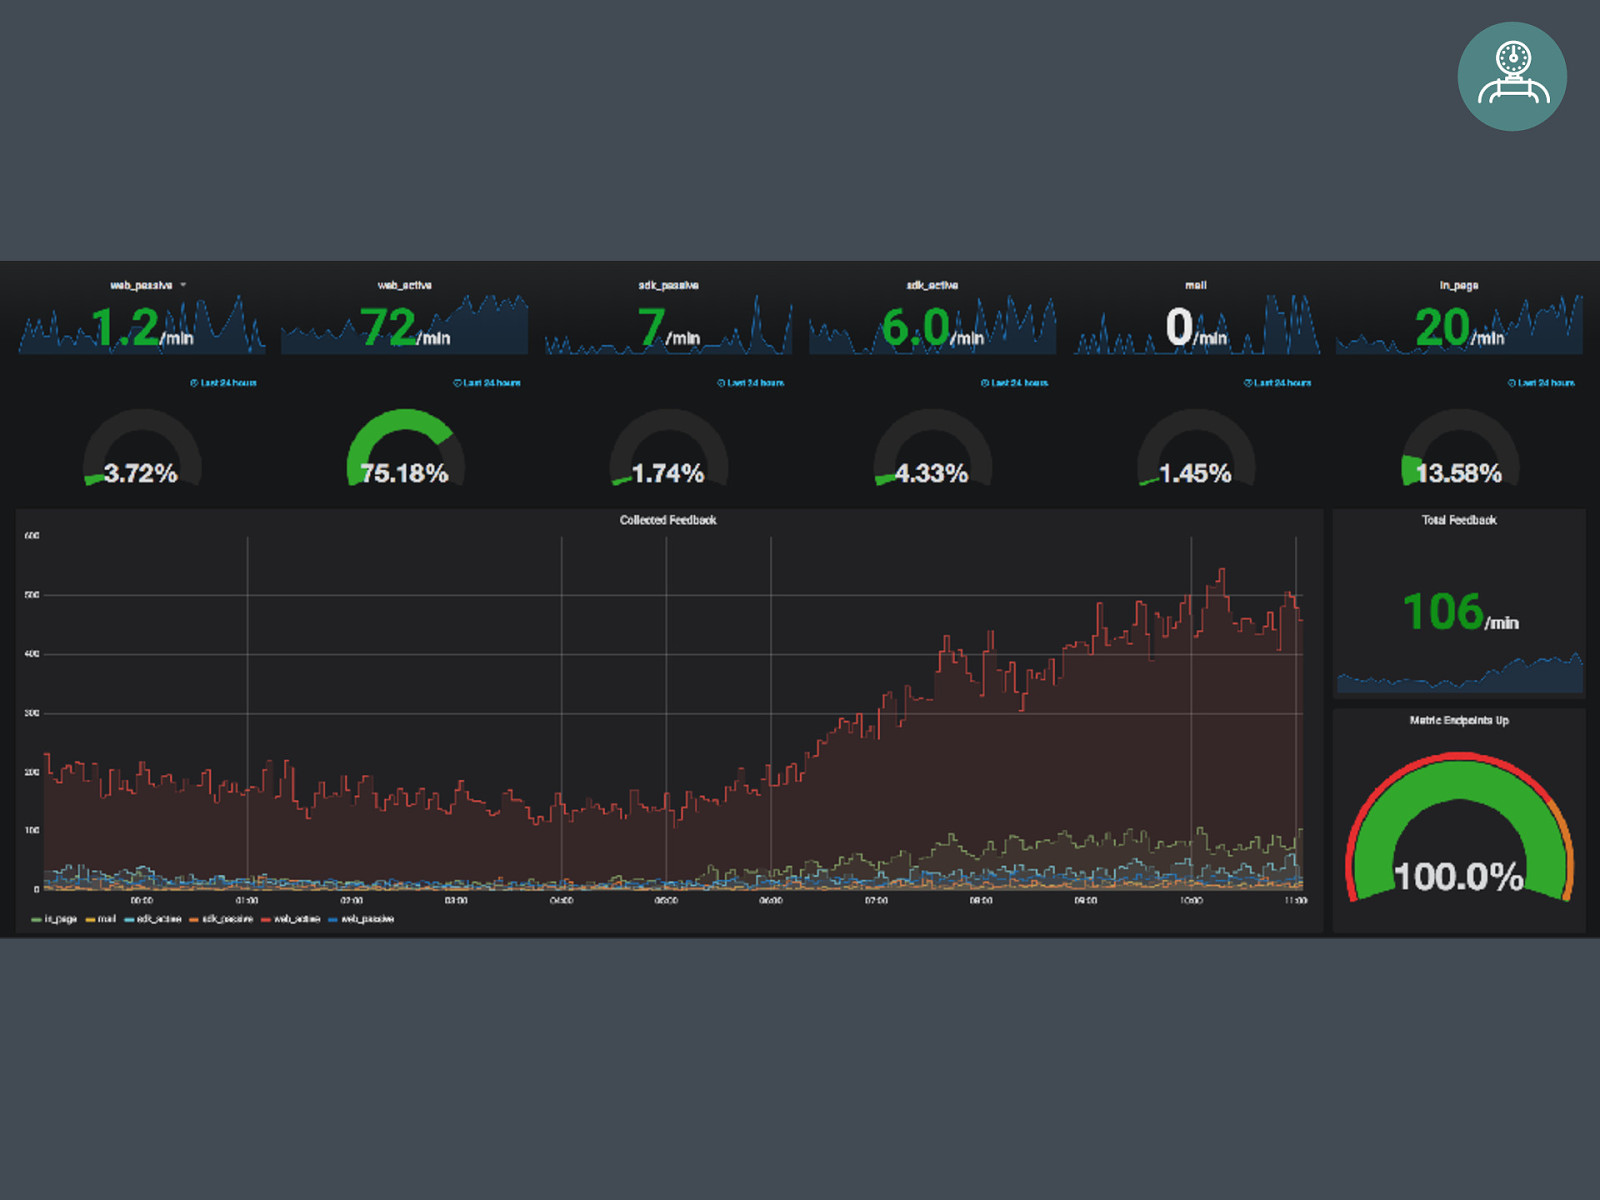
Statistics Incoming feedback items with origin information Telemetry response time of public endpoints

“If it moves, we track it.”
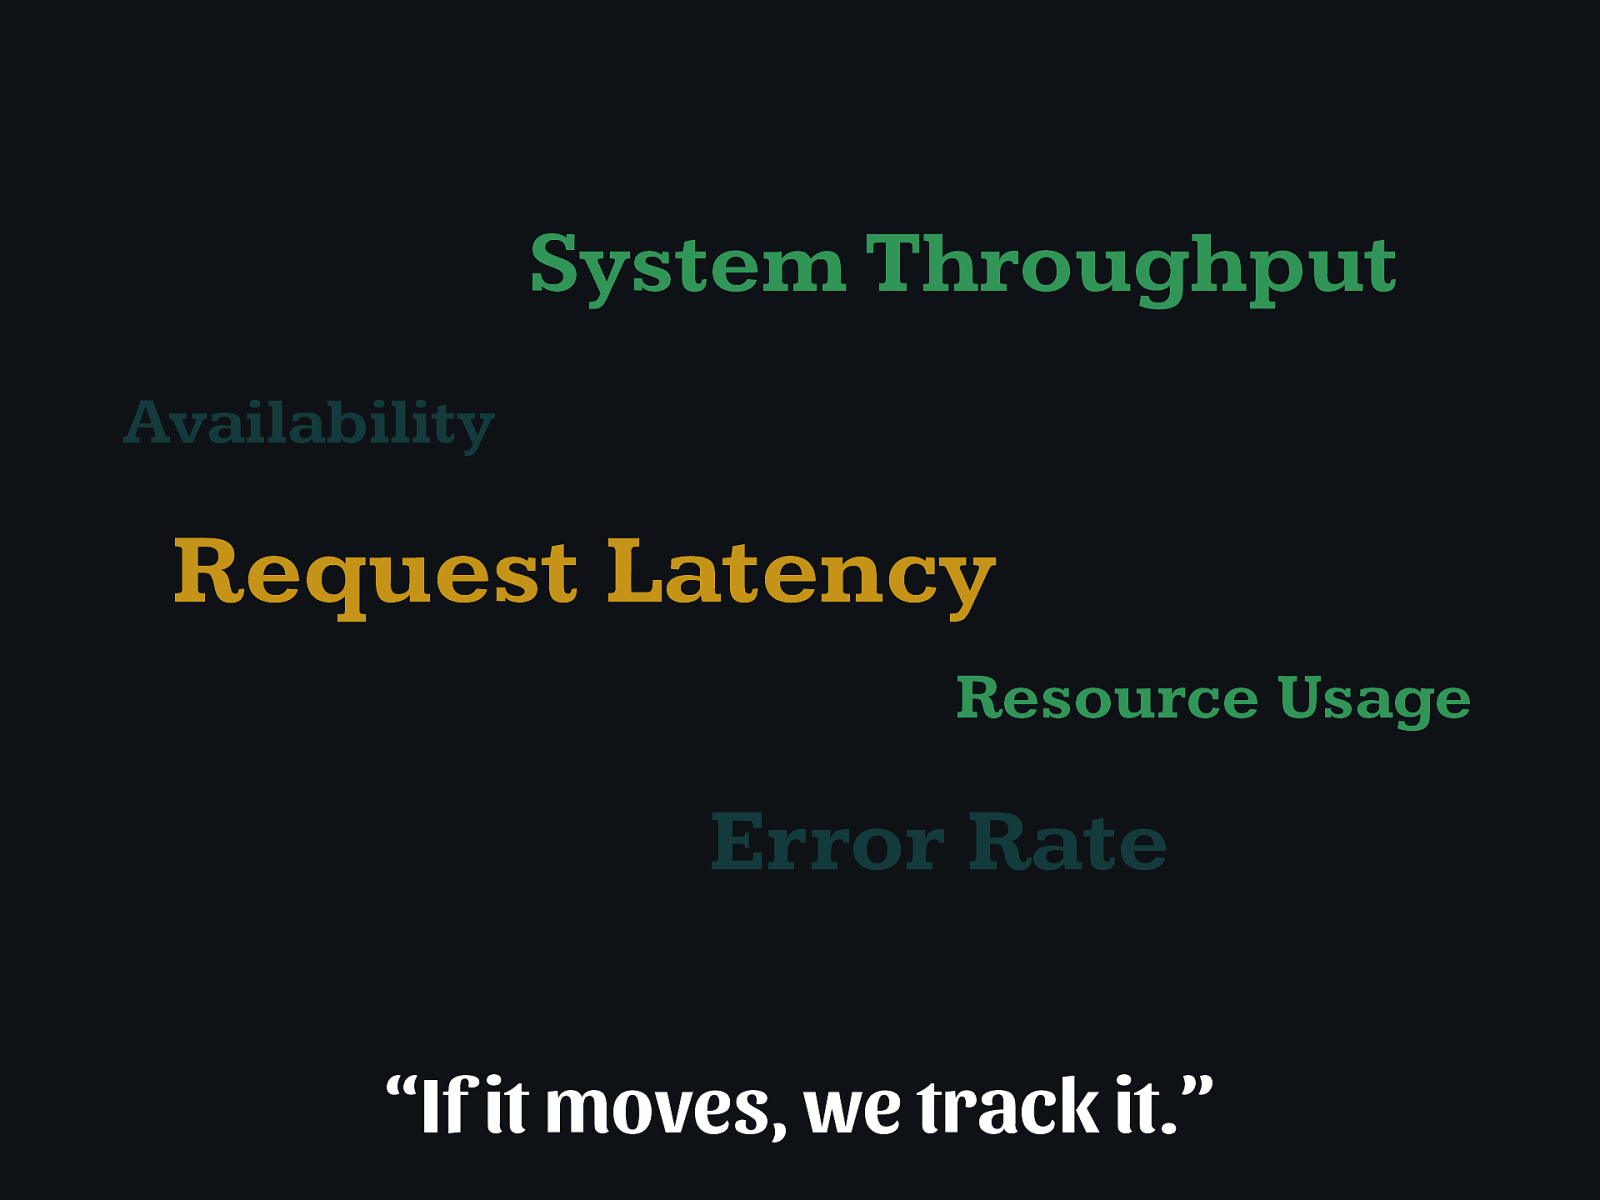
Request Latency System Throughput Error Rate Availability Resource Usage “If it moves, we track it.”
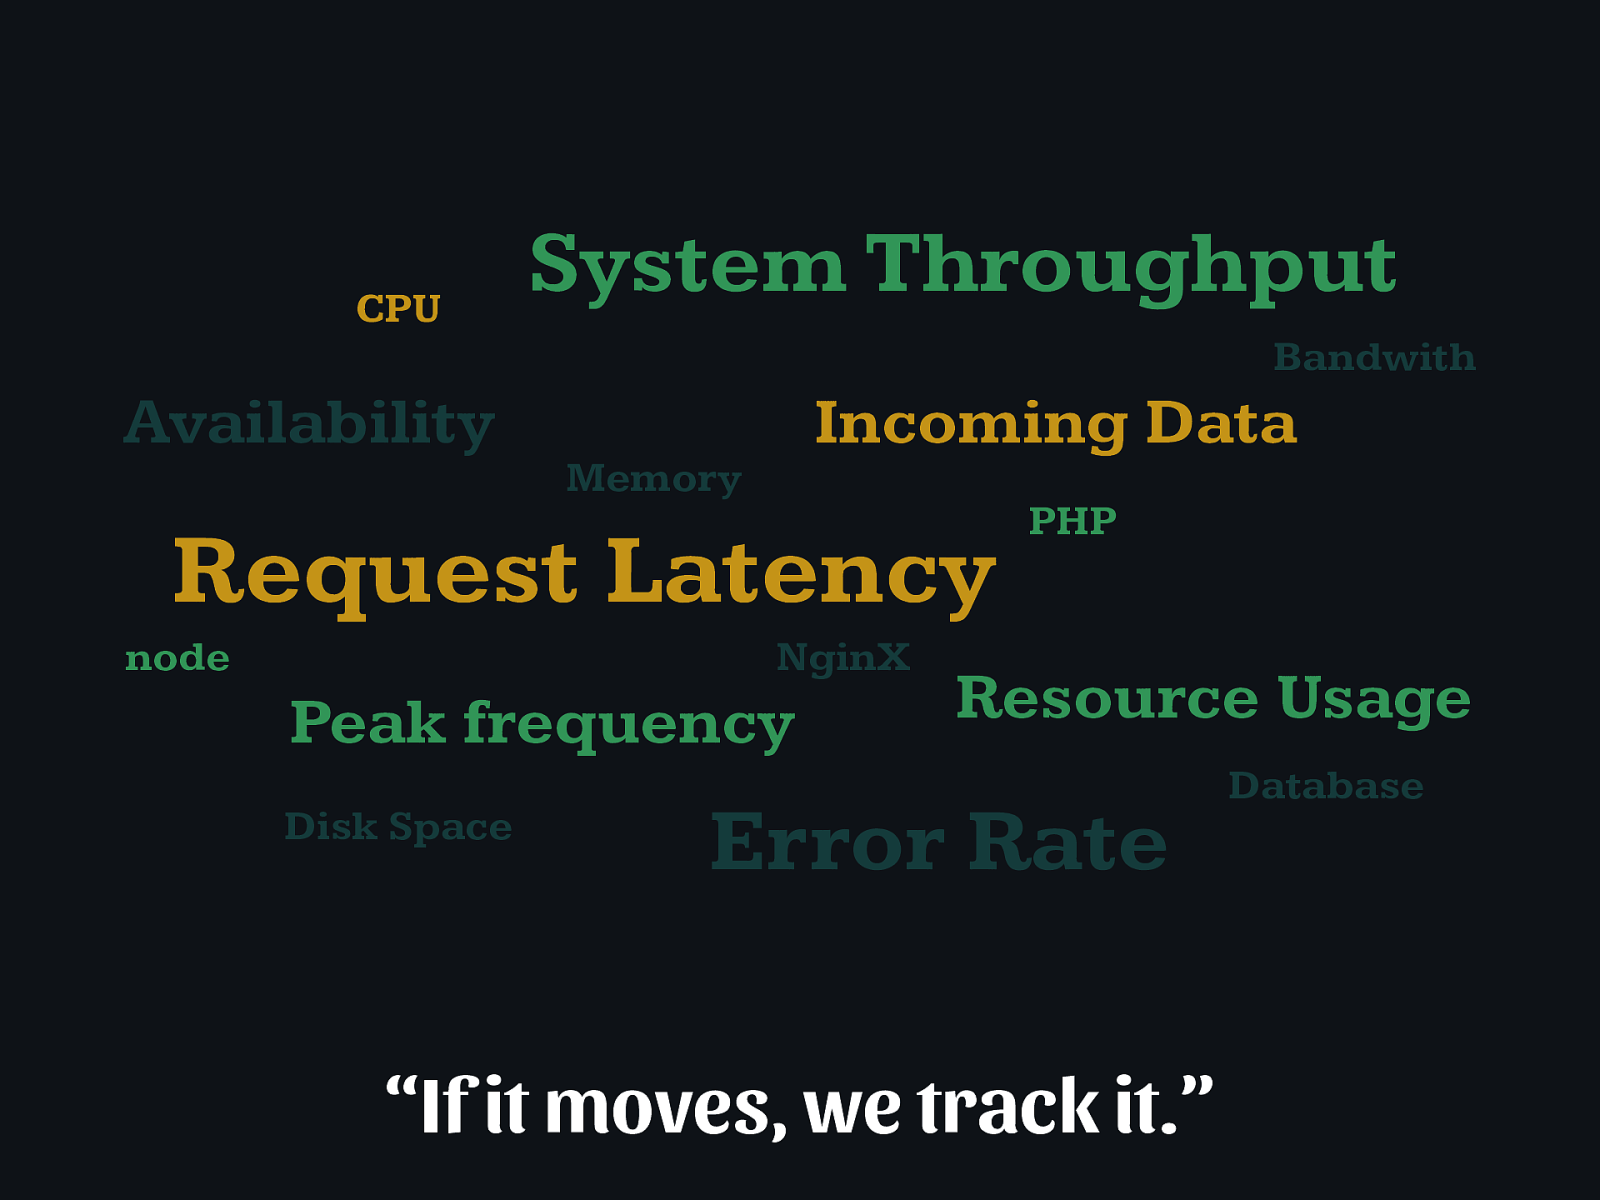
Request Latency System Throughput Error Rate Availability Resource Usage “If it moves, we track it.” Incoming Data Peak frequency CPU Memory Disk Space Bandwith node PHP NginX Database
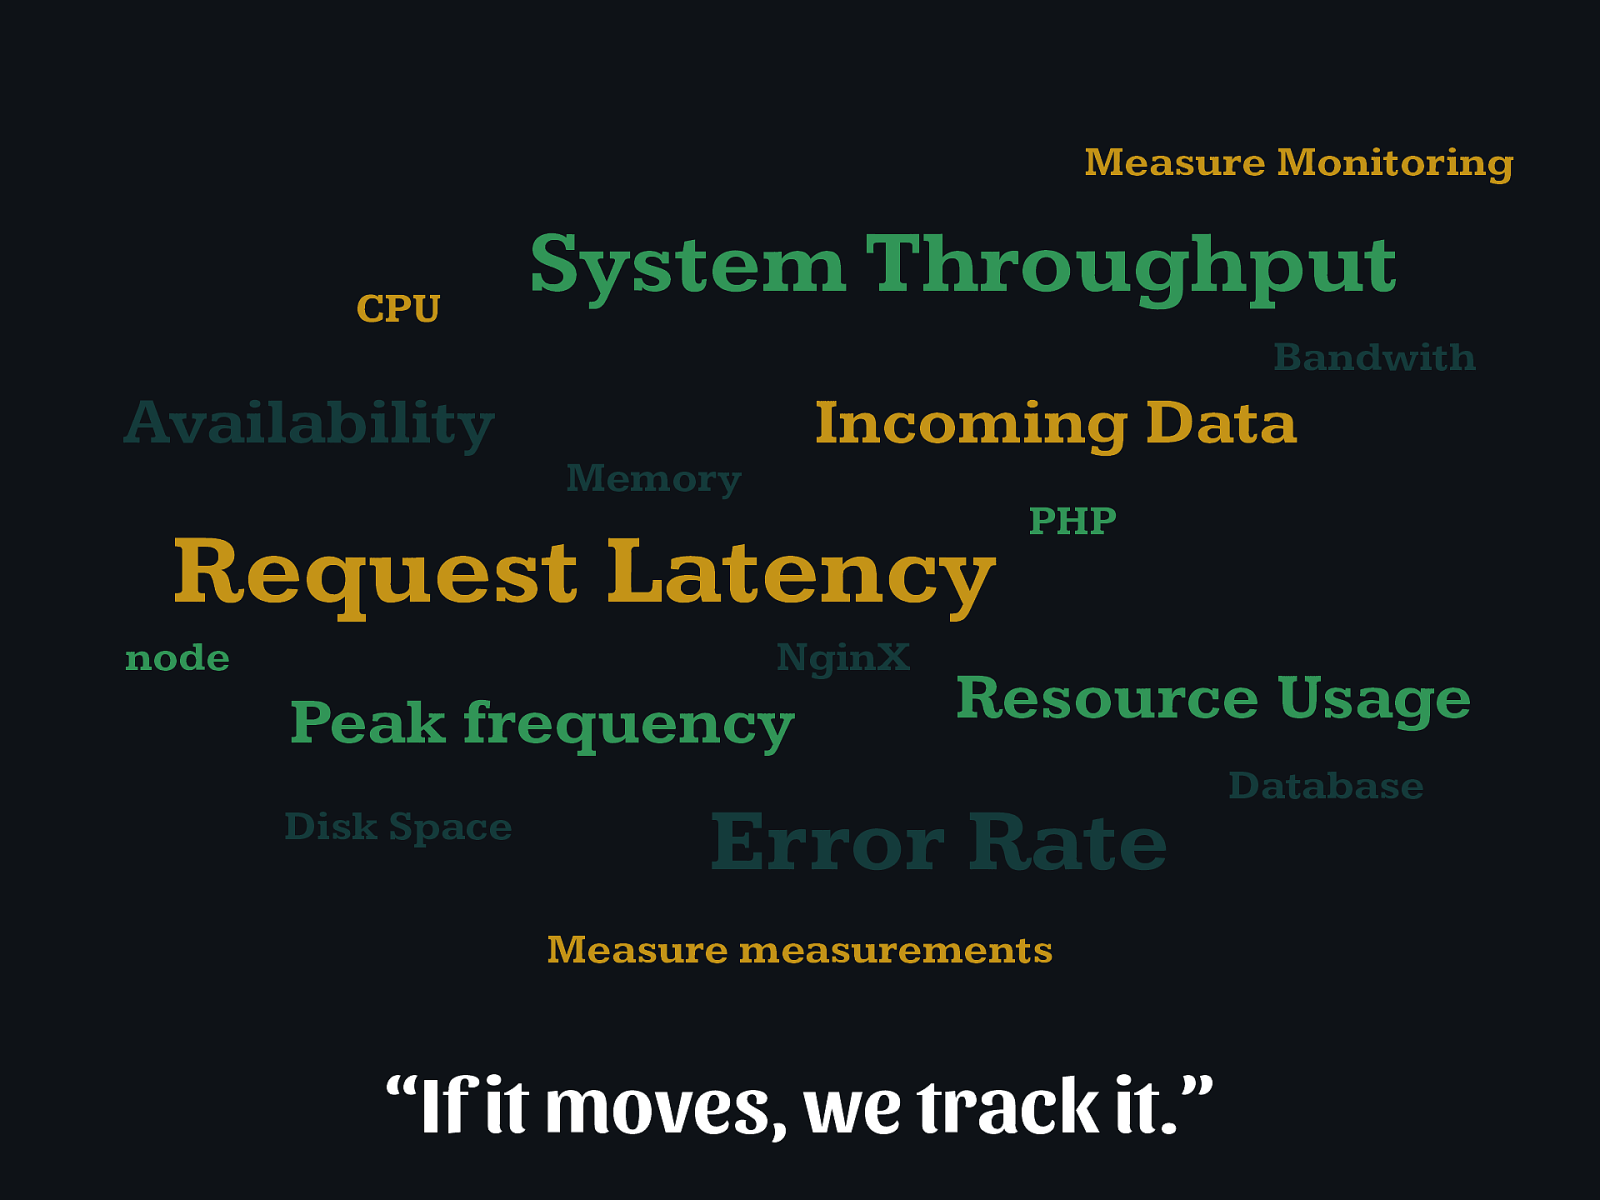
Request Latency System Throughput Error Rate Availability Resource Usage “If it moves, we track it.” Incoming Data Peak frequency CPU Memory Disk Space Bandwith node PHP NginX Database Measure Monitoring Measure measurements

Metrics, Everywhere.

% % % % % % % & & & % % &

SLIs % % % % % % % & & & % % &

Picking good SLIs

SLIs may change according to who is looking at the data.

Understanding the nature of your system

User-Facing serving system? availability, throughput, latency

Storage System? availability, durability, latency

Big Data Systems? throughput, end-to-end latency

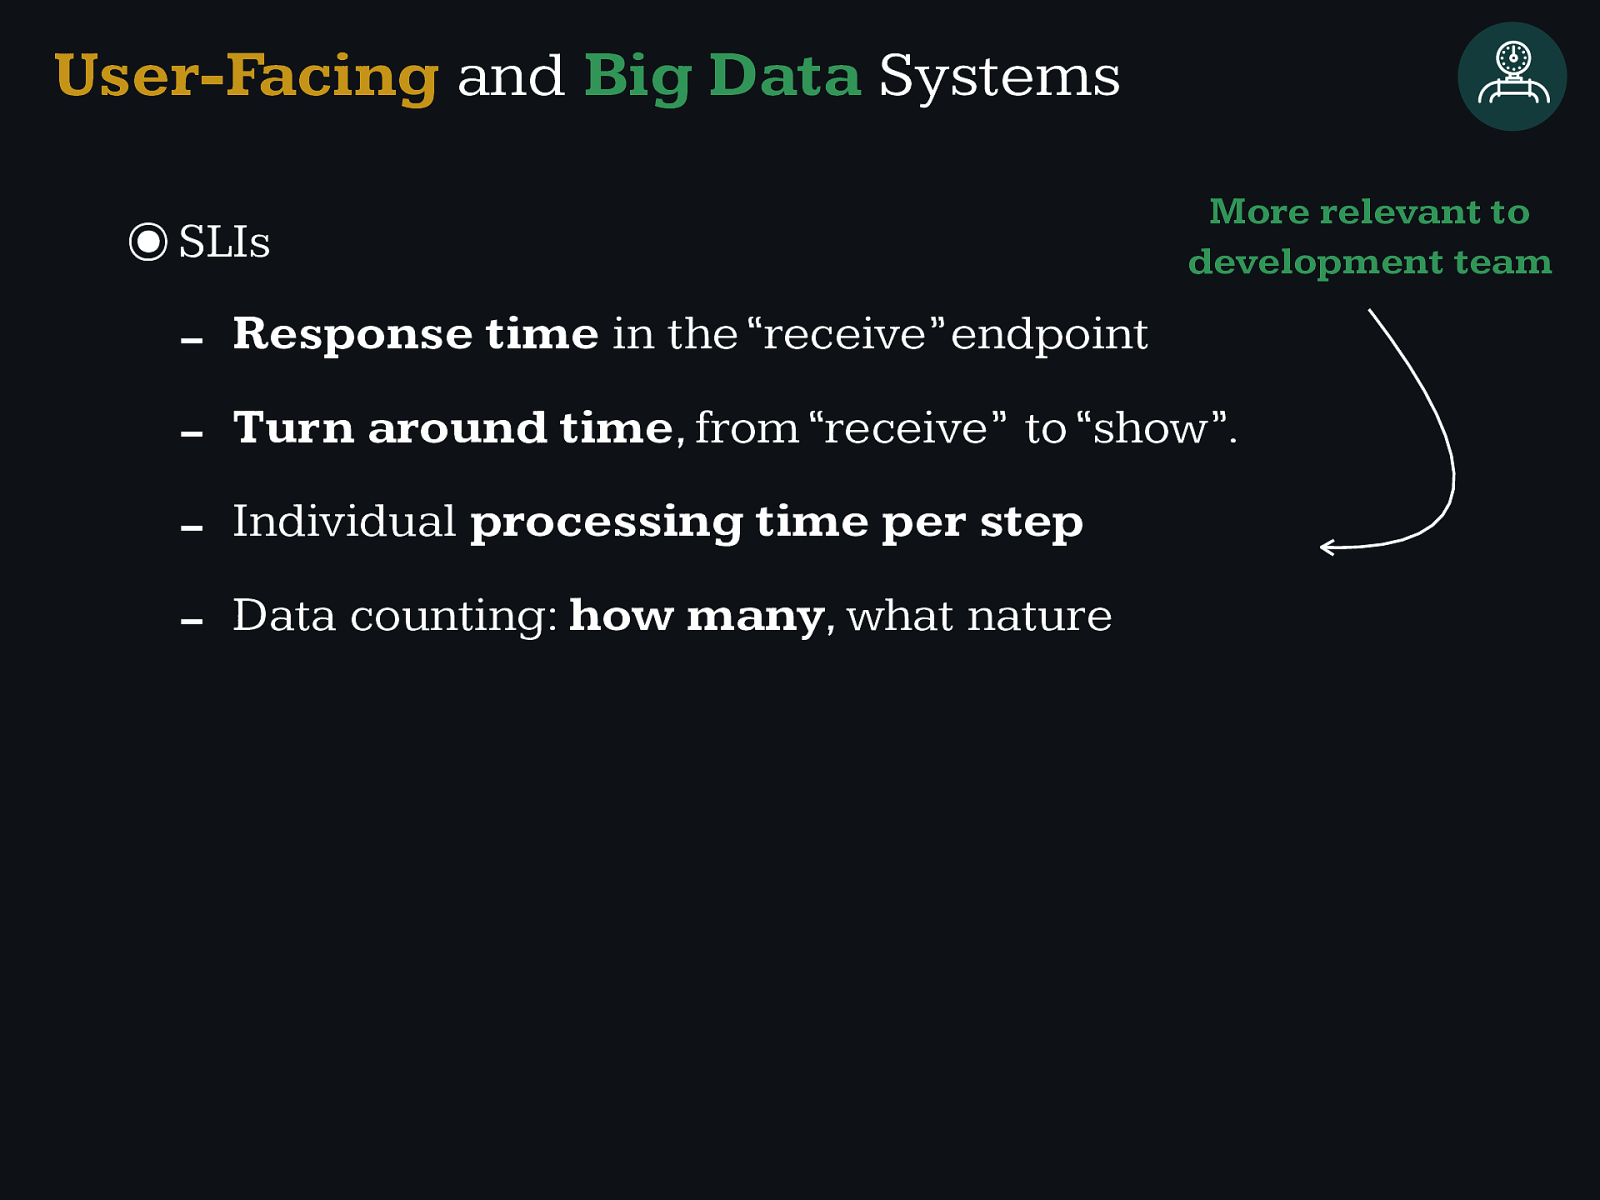
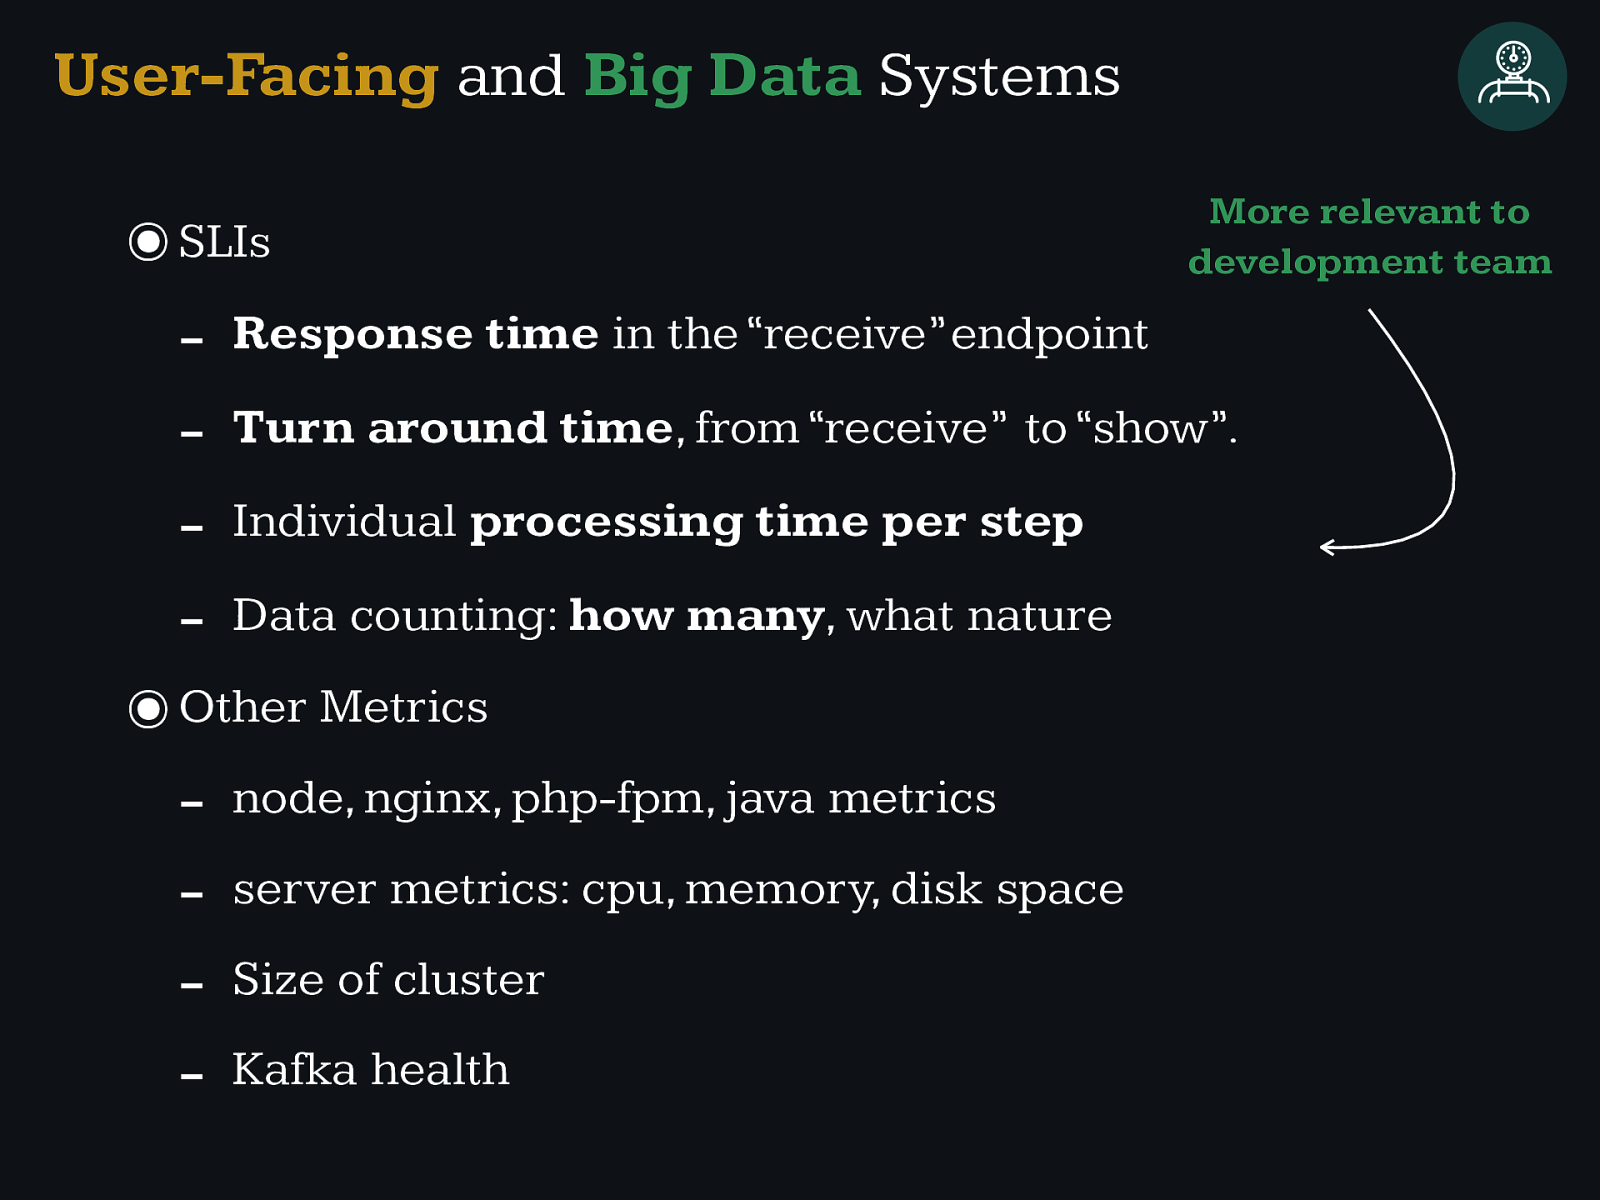
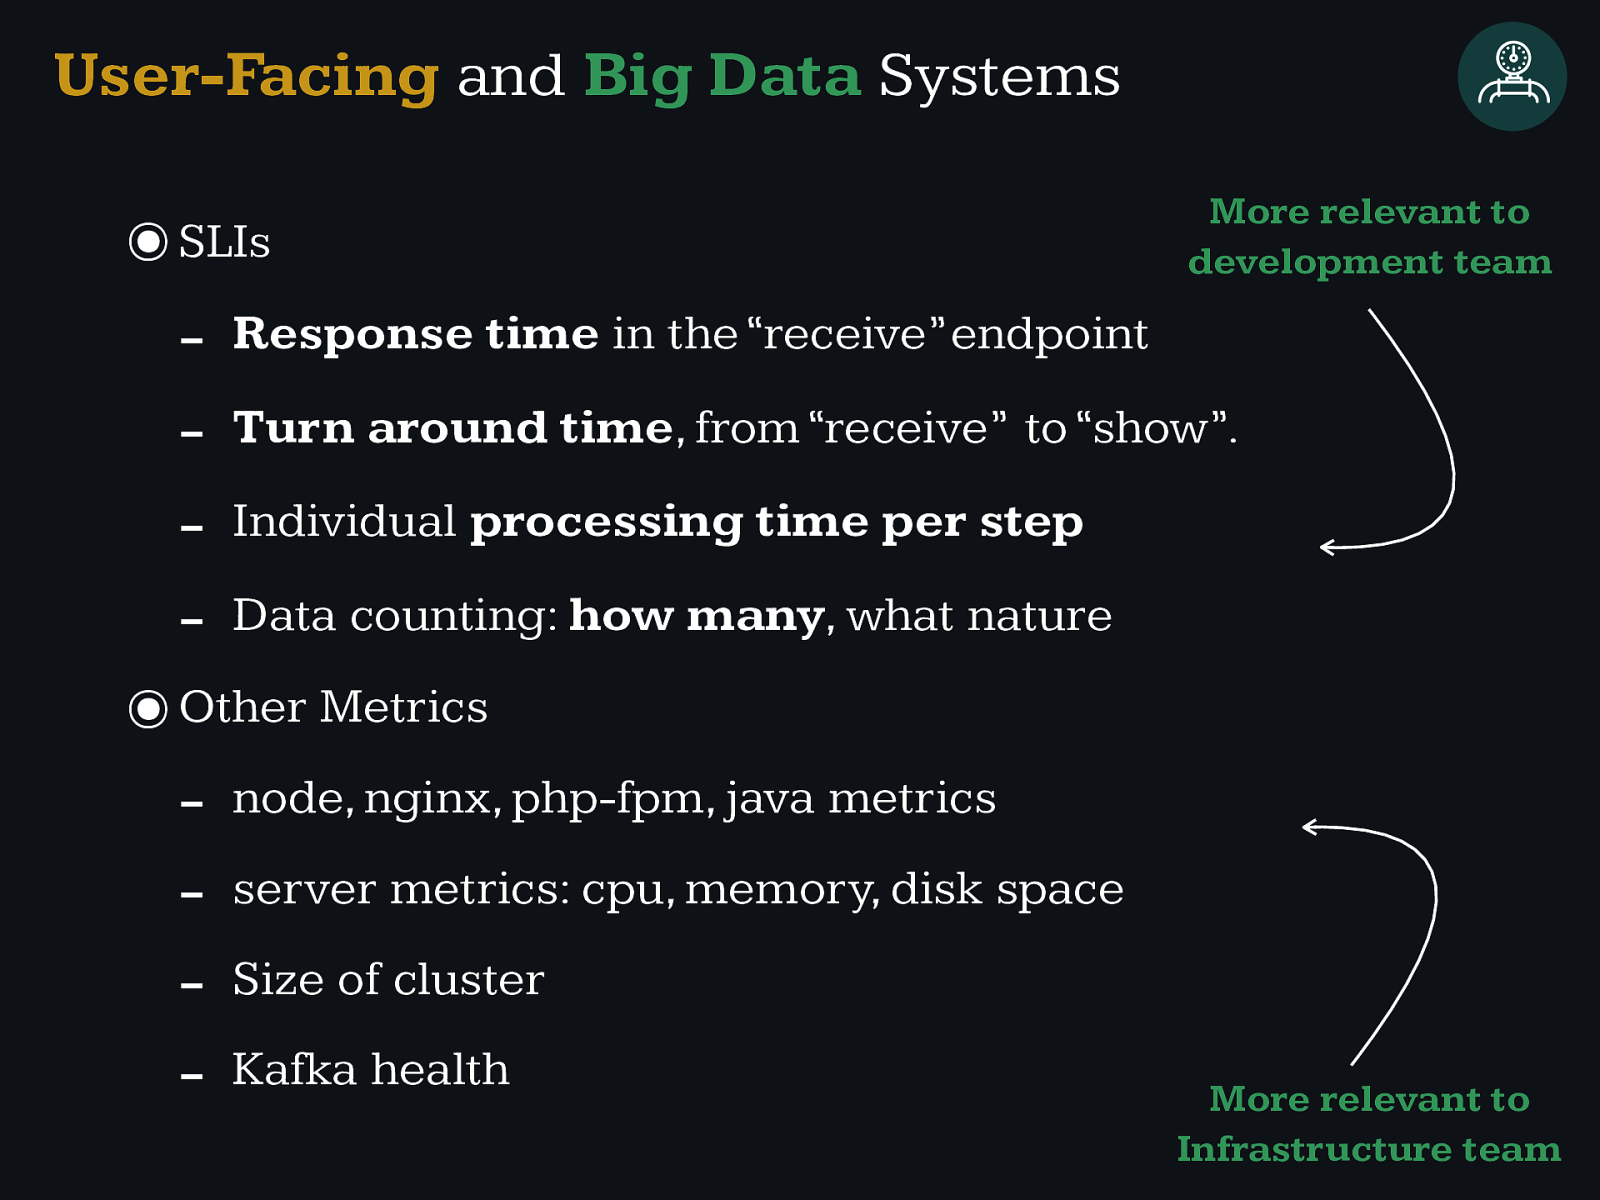
User-Facing and Big Data Systems
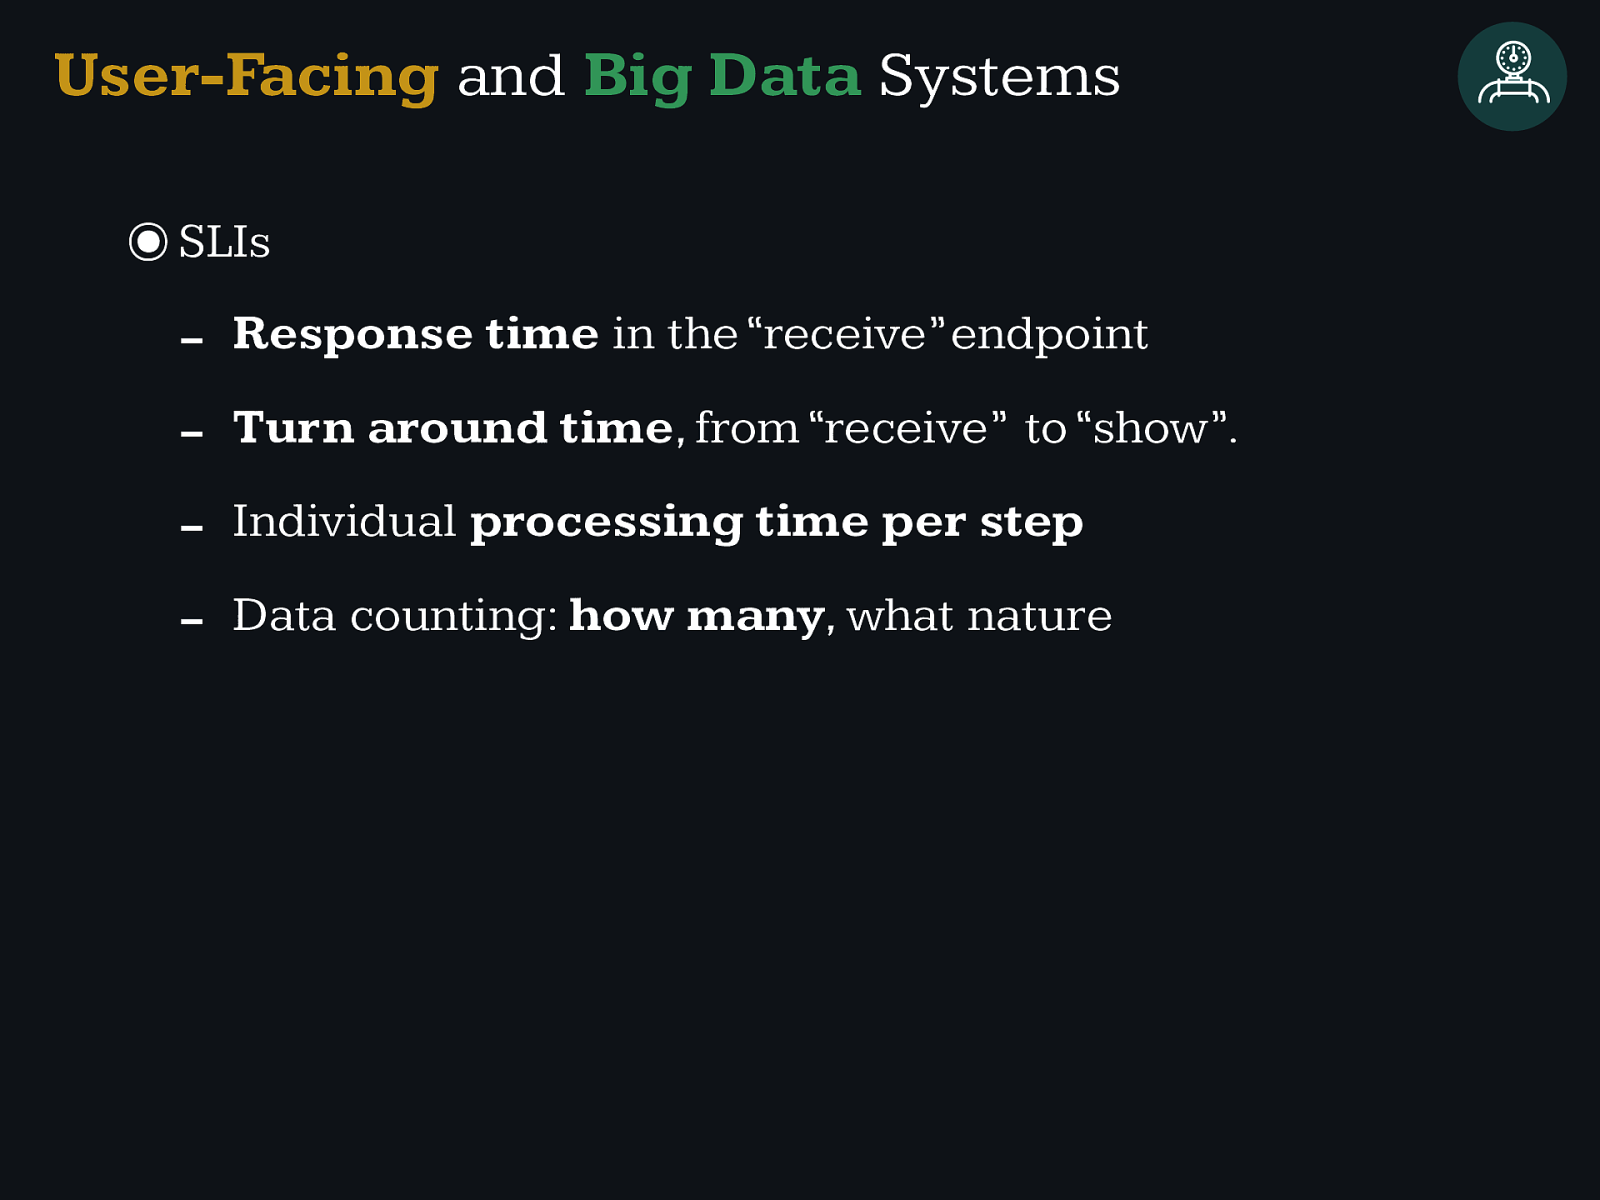
Individual processing time per step
Data counting: how many , w h a t n a t u r e User-Facing and Big Data Systems
Individual processing time per step
Data counting: how many , w h a t n a t u r e User-Facing and Big Data Systems More relevant to development team
Individual processing time per step
Kafka health User-Facing and Big Data Systems More relevant to development team
Individual processing time per step
Kafka health User-Facing and Big Data Systems More relevant to development team More relevant to Infrastructure team

Picking Targets
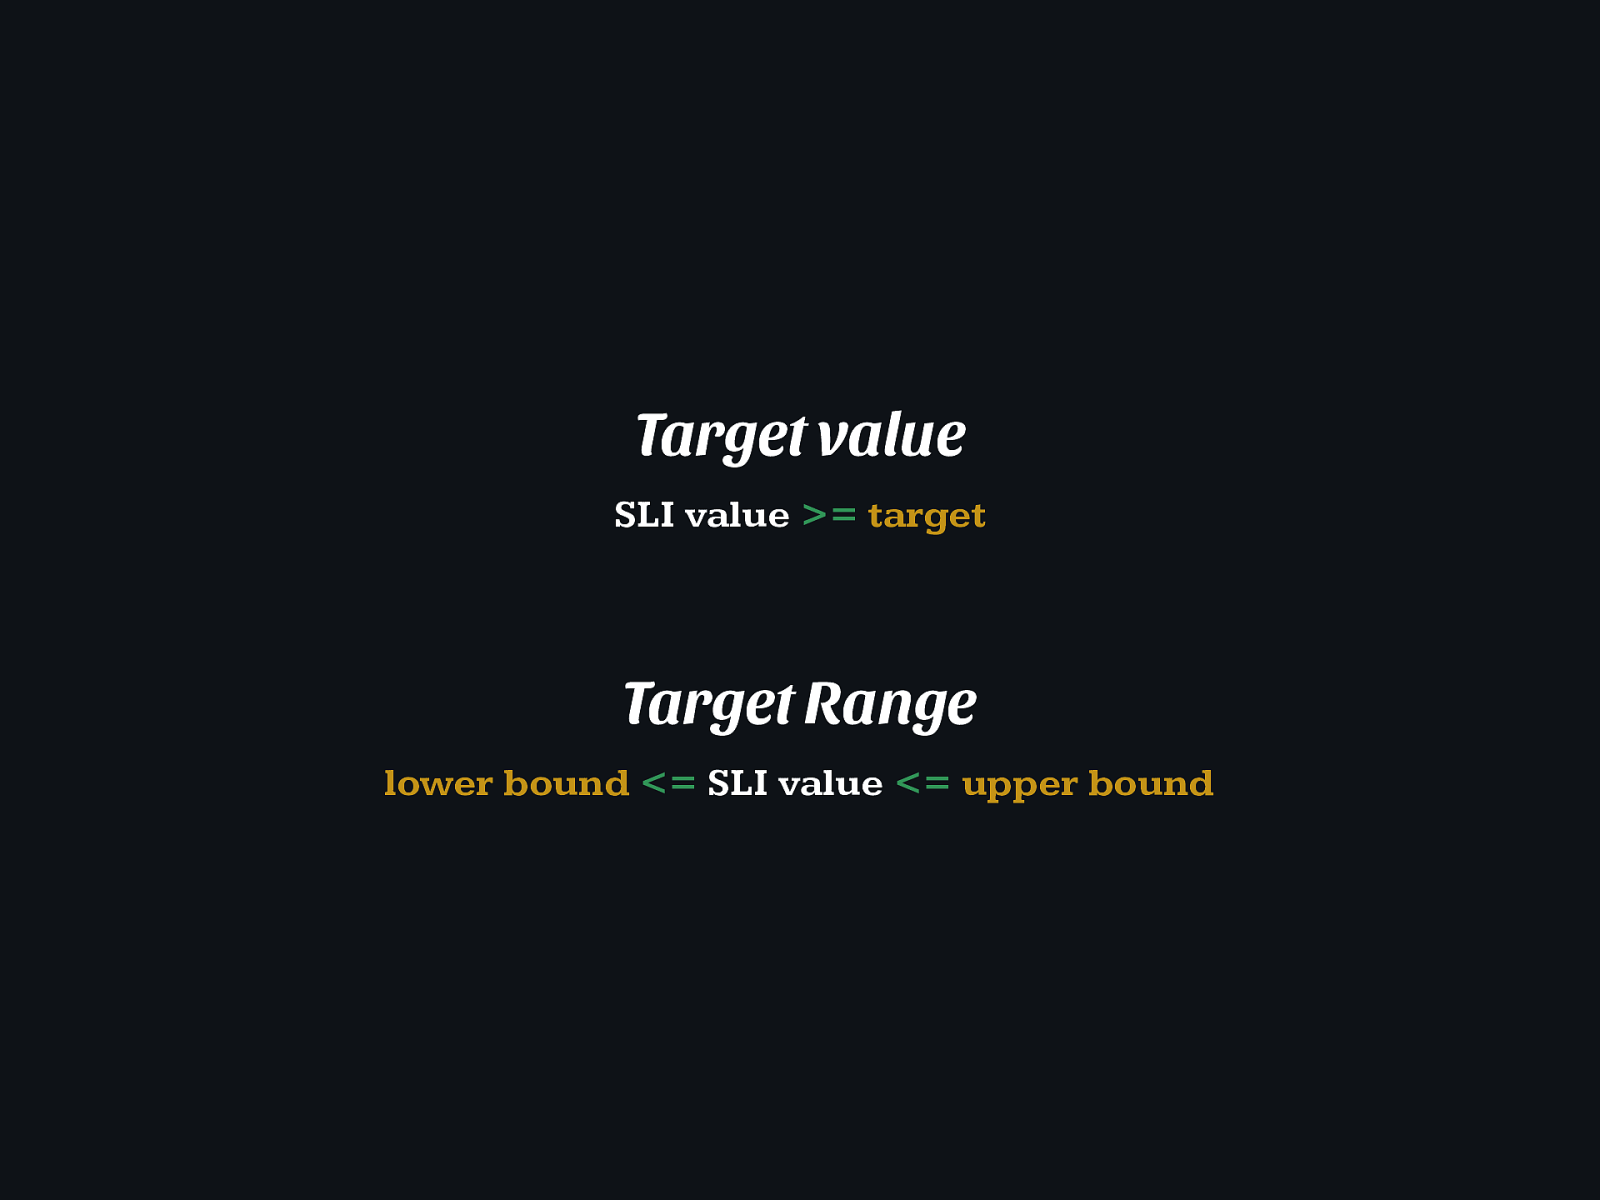
Target value SLI value
=
target Target Range lower bound
<= SLI value <=
upper bound
Don’t pick a target based on current performance What is the business need? What are users trying to achieve? How much impact does it have on the user experience?

How long can it take between the user clicking submit and a confirmation that our servers received the data?
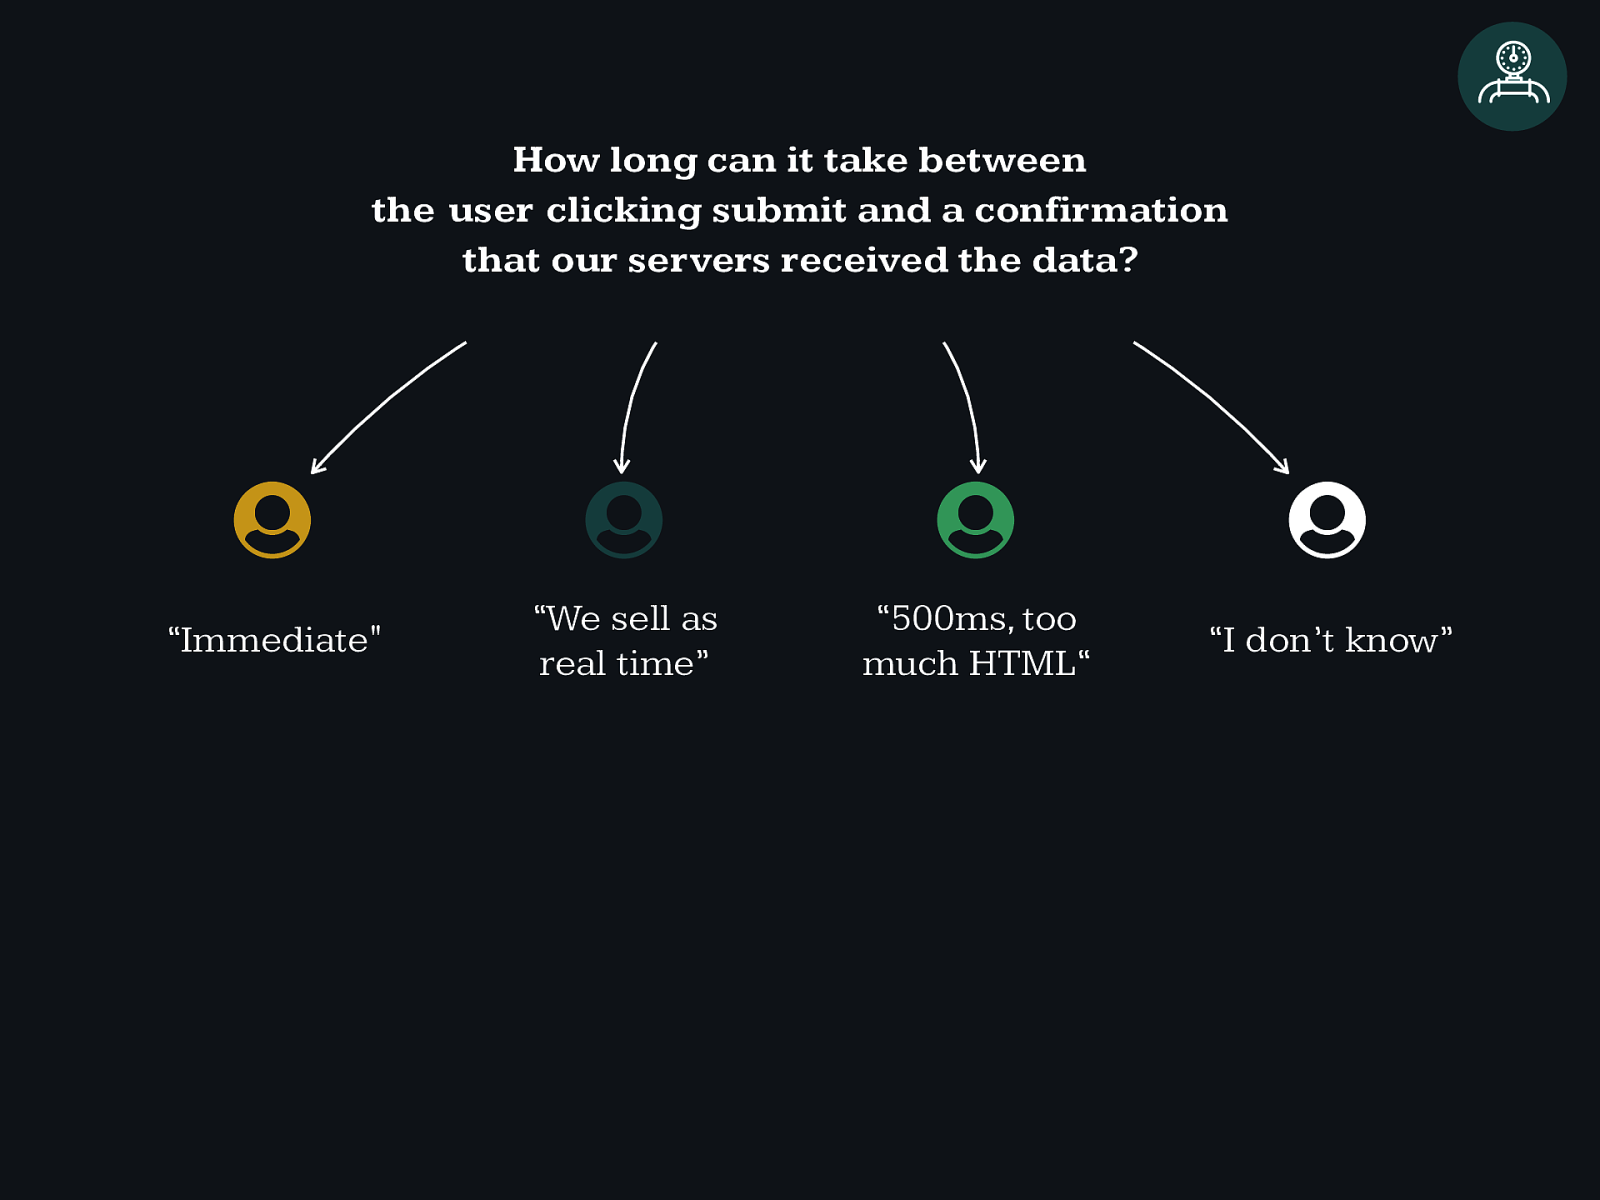
How long can it take between the user clicking submit and a confirmation that our servers received the data? ' ' ' ' “Immediate" “We sell as real time” “500ms, too much HTML“ “I don’t know”
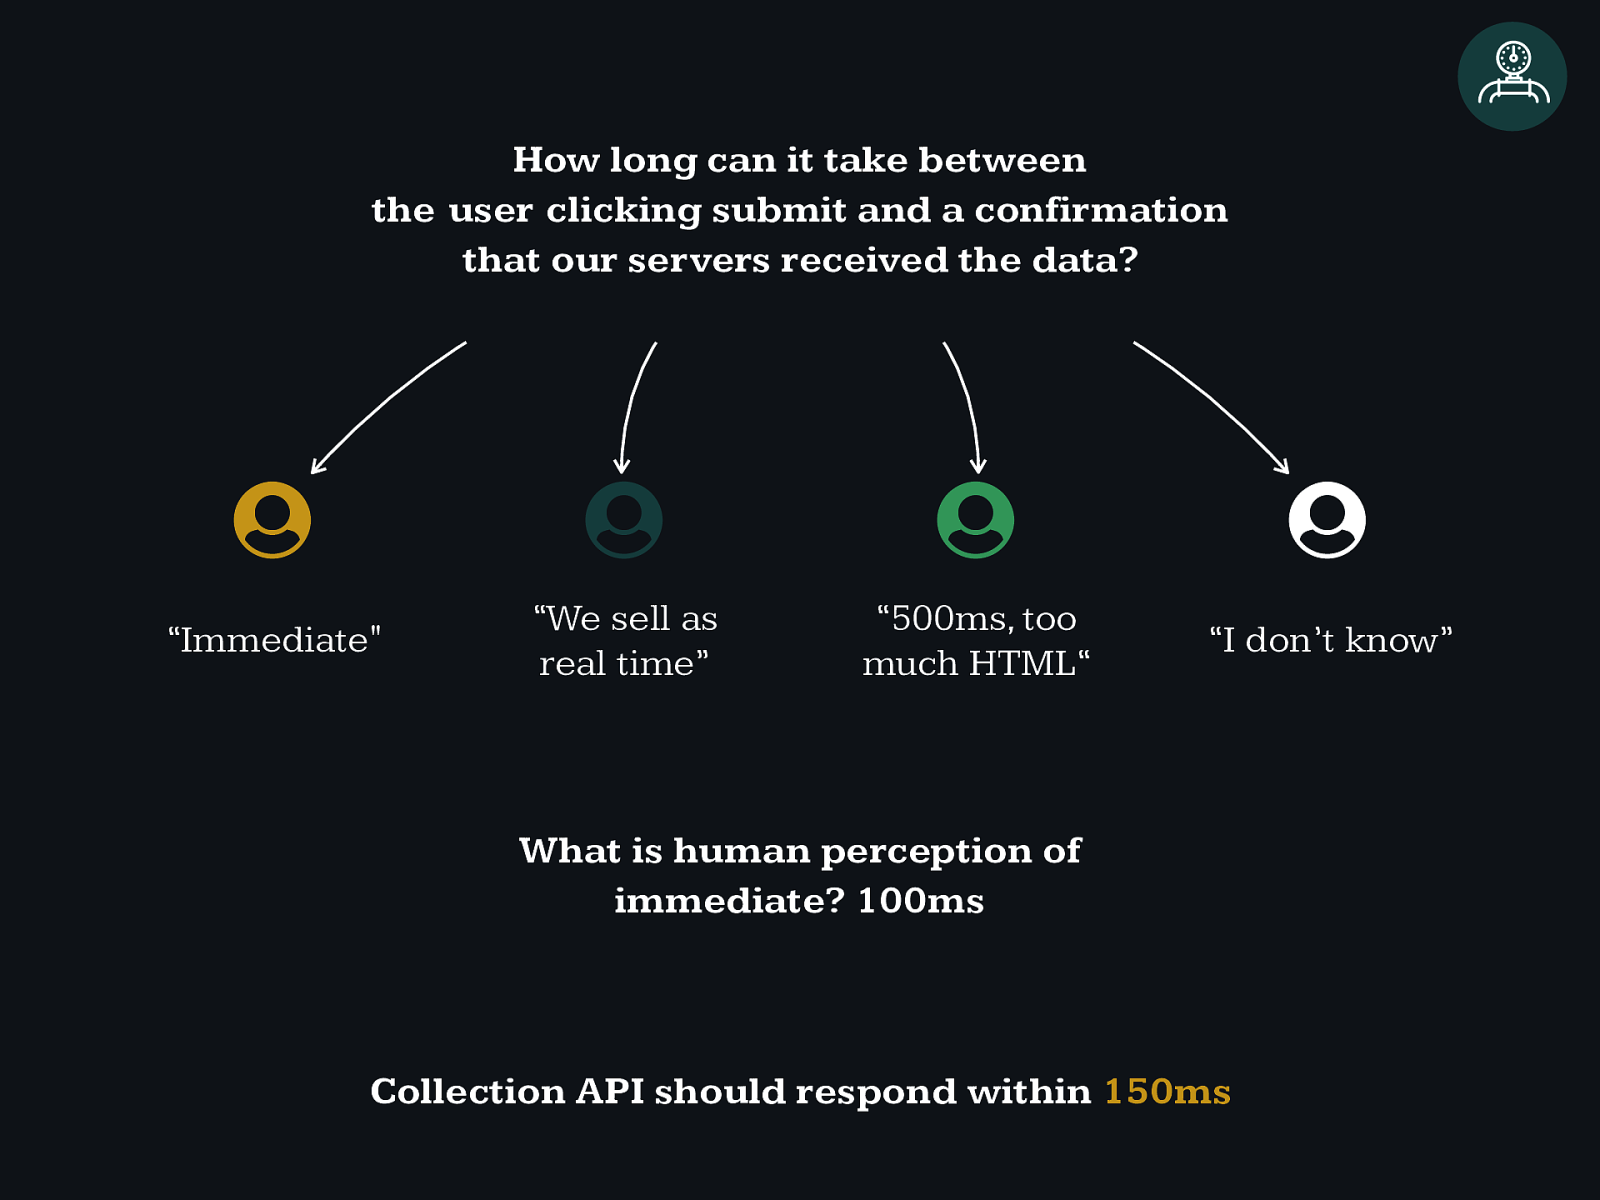
How long can it take between the user clicking submit and a confirmation that our servers received the data? ' ' ' ' “Immediate" “We sell as real time” “500ms, too much HTML“ “I don’t know” What is human perception of immediate? 100ms Collection API should respond within 150ms

Some, but not too many. can you settle an argument or priority based on it?

Don’t over achieve. The Chubby example.
Adapt.
Evolve. re-define SLO’s as your product evolves.

Meeting Expectations.

Attach consequences to your Objectives .

The night is dark and
full of
loopholes
.
take a friend from legal with you.

Safety Margins. like setting the alarm 5 minutes before the meeting.

Metrics in Practice.

prometheus.io
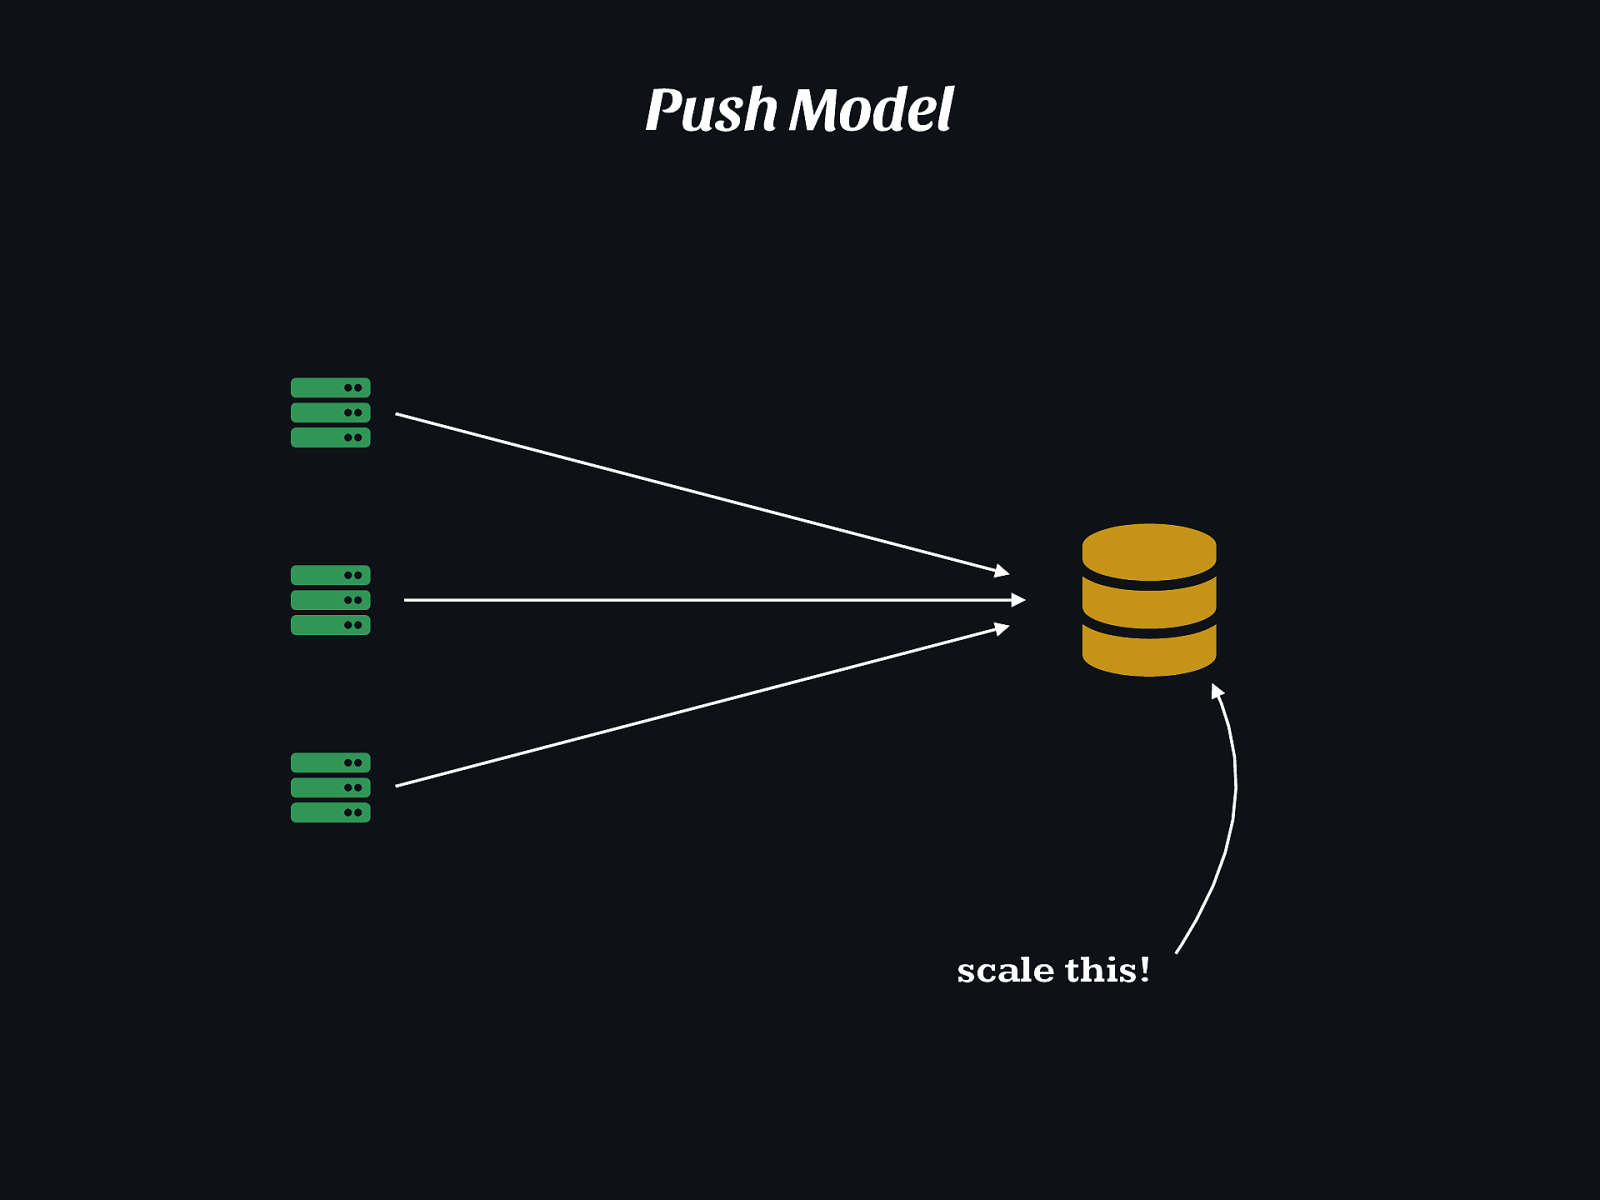
( ) ( ( Push Model scale this!
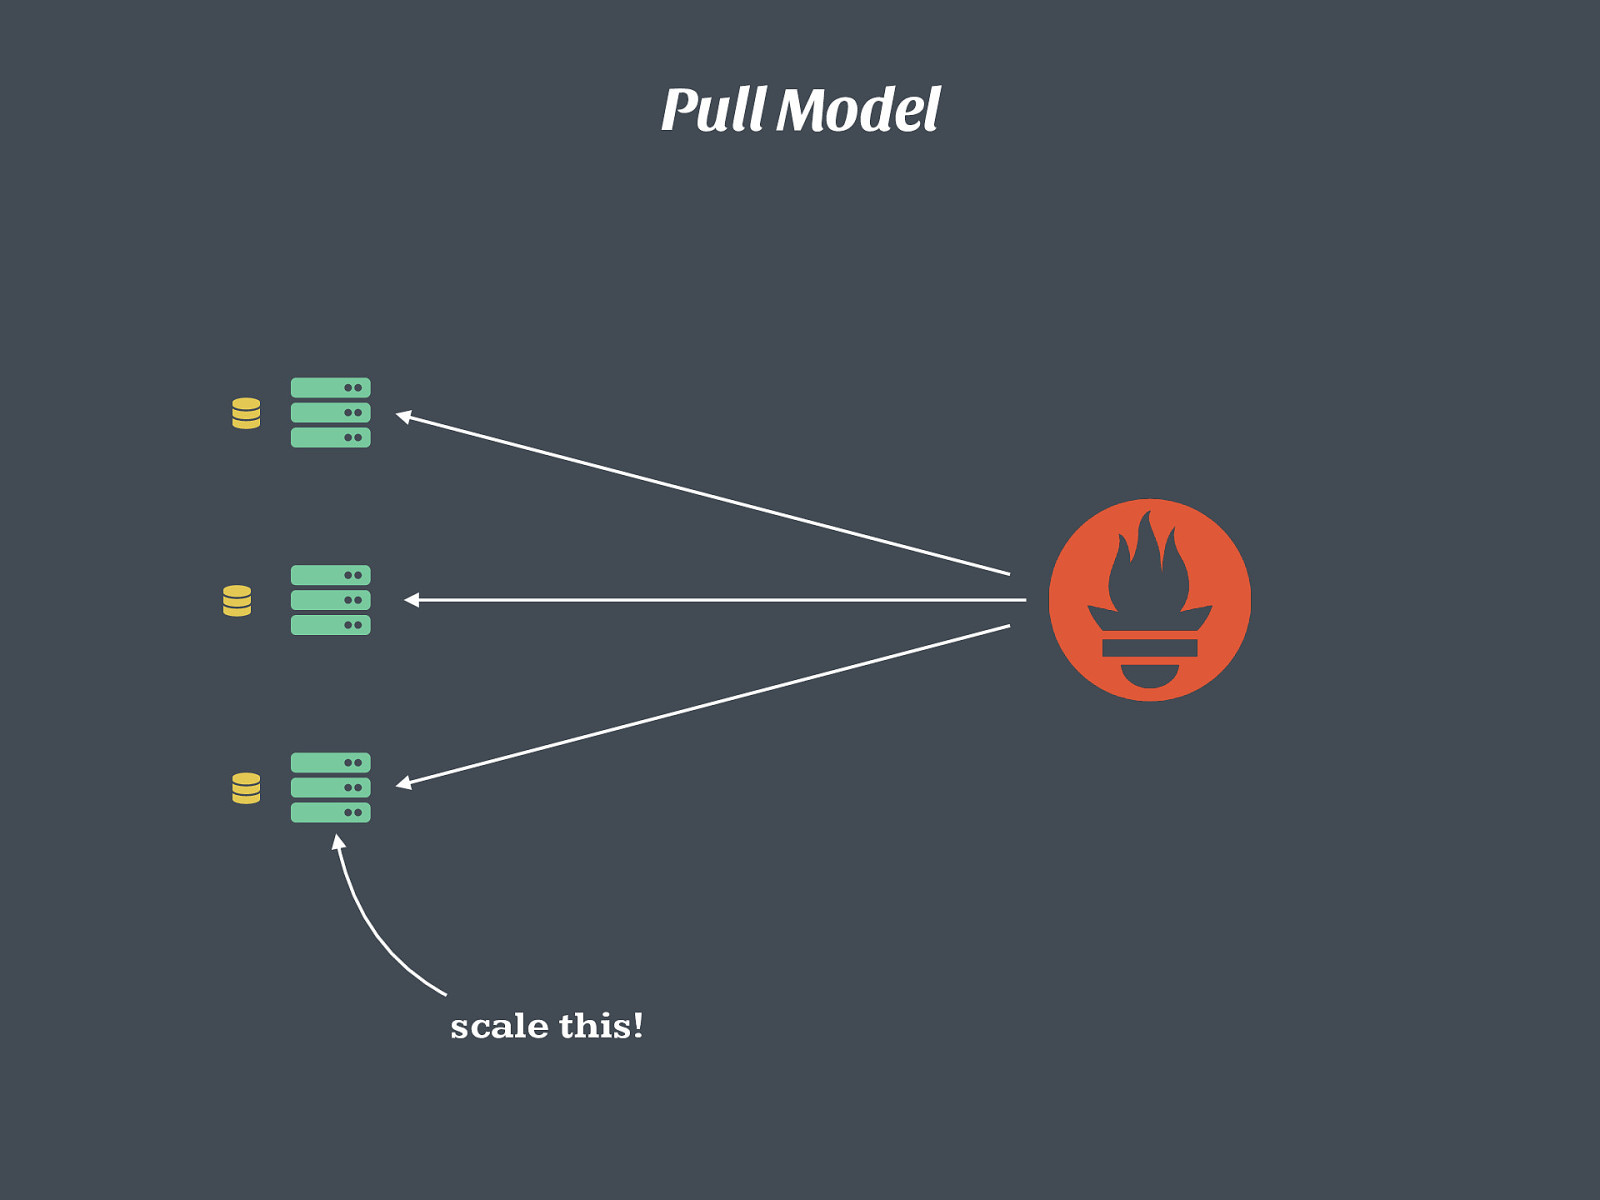
( ( ( ) ) ) Pull Model scale this!
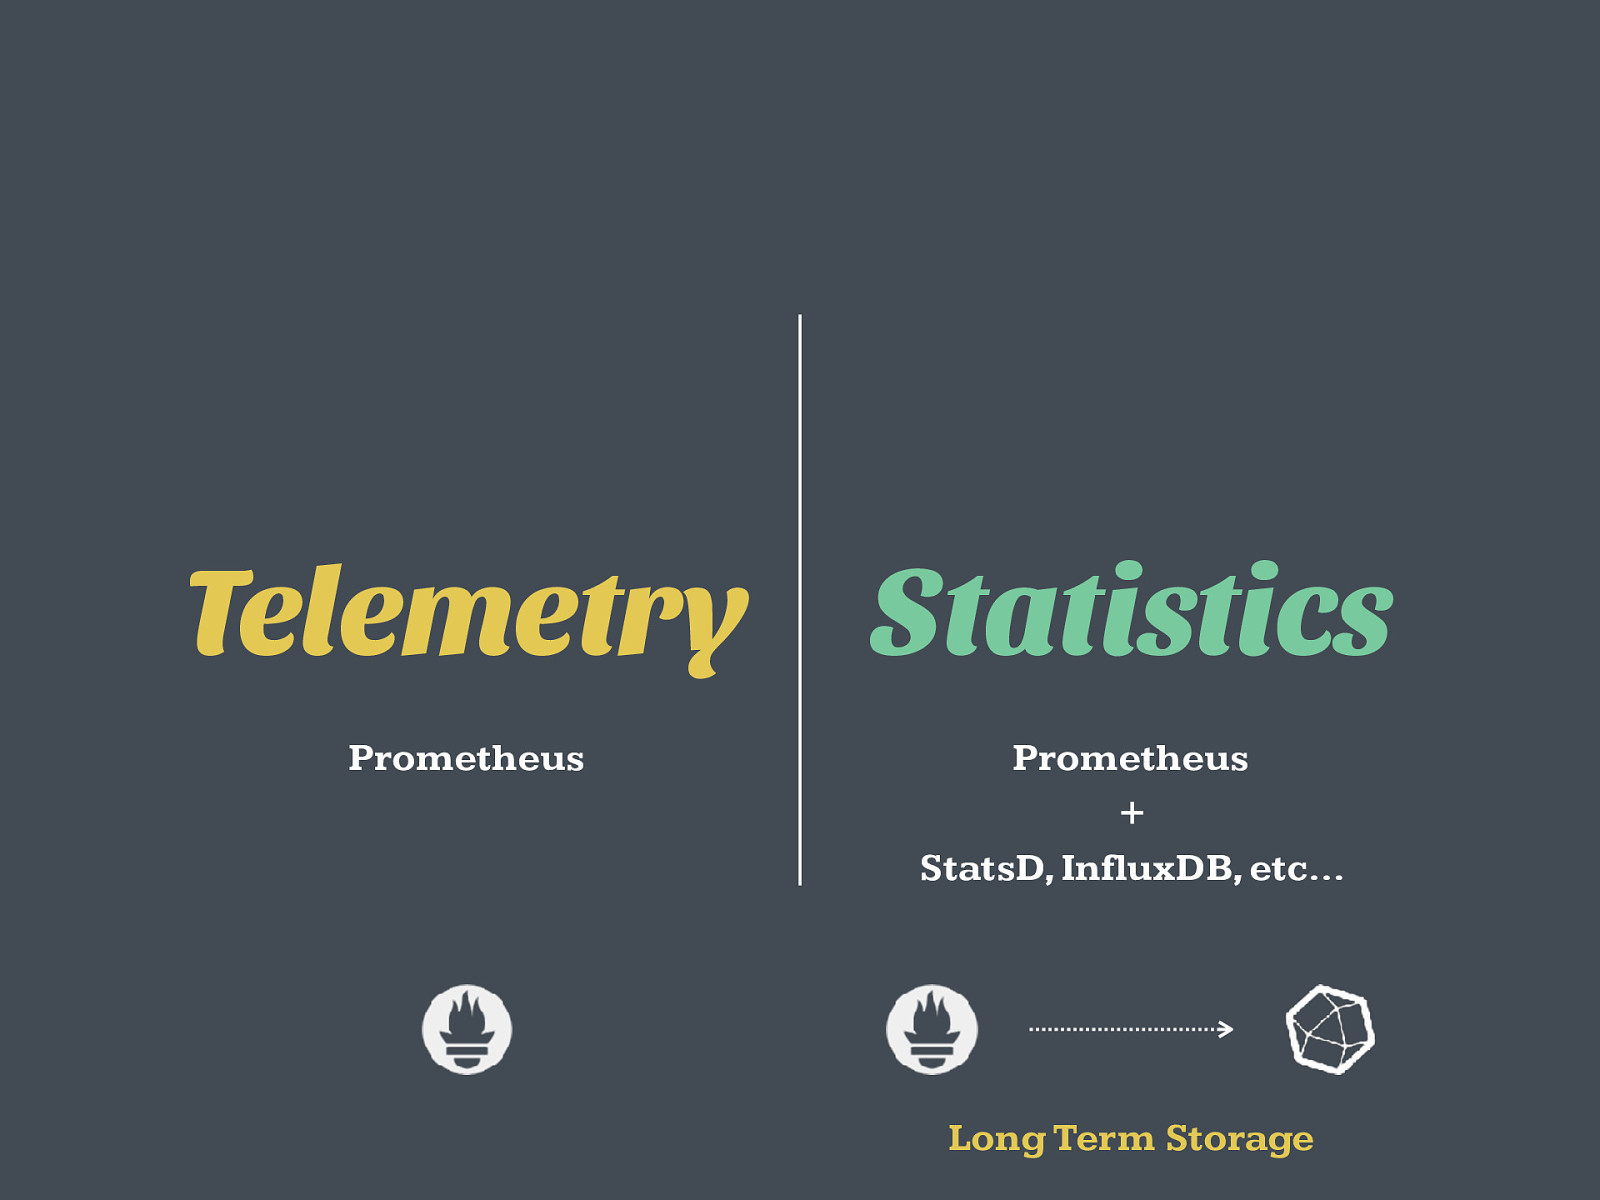
Prometheus Telemetry Statistics Prometheus StatsD, InfluxDB, etc… + Long Term Storage
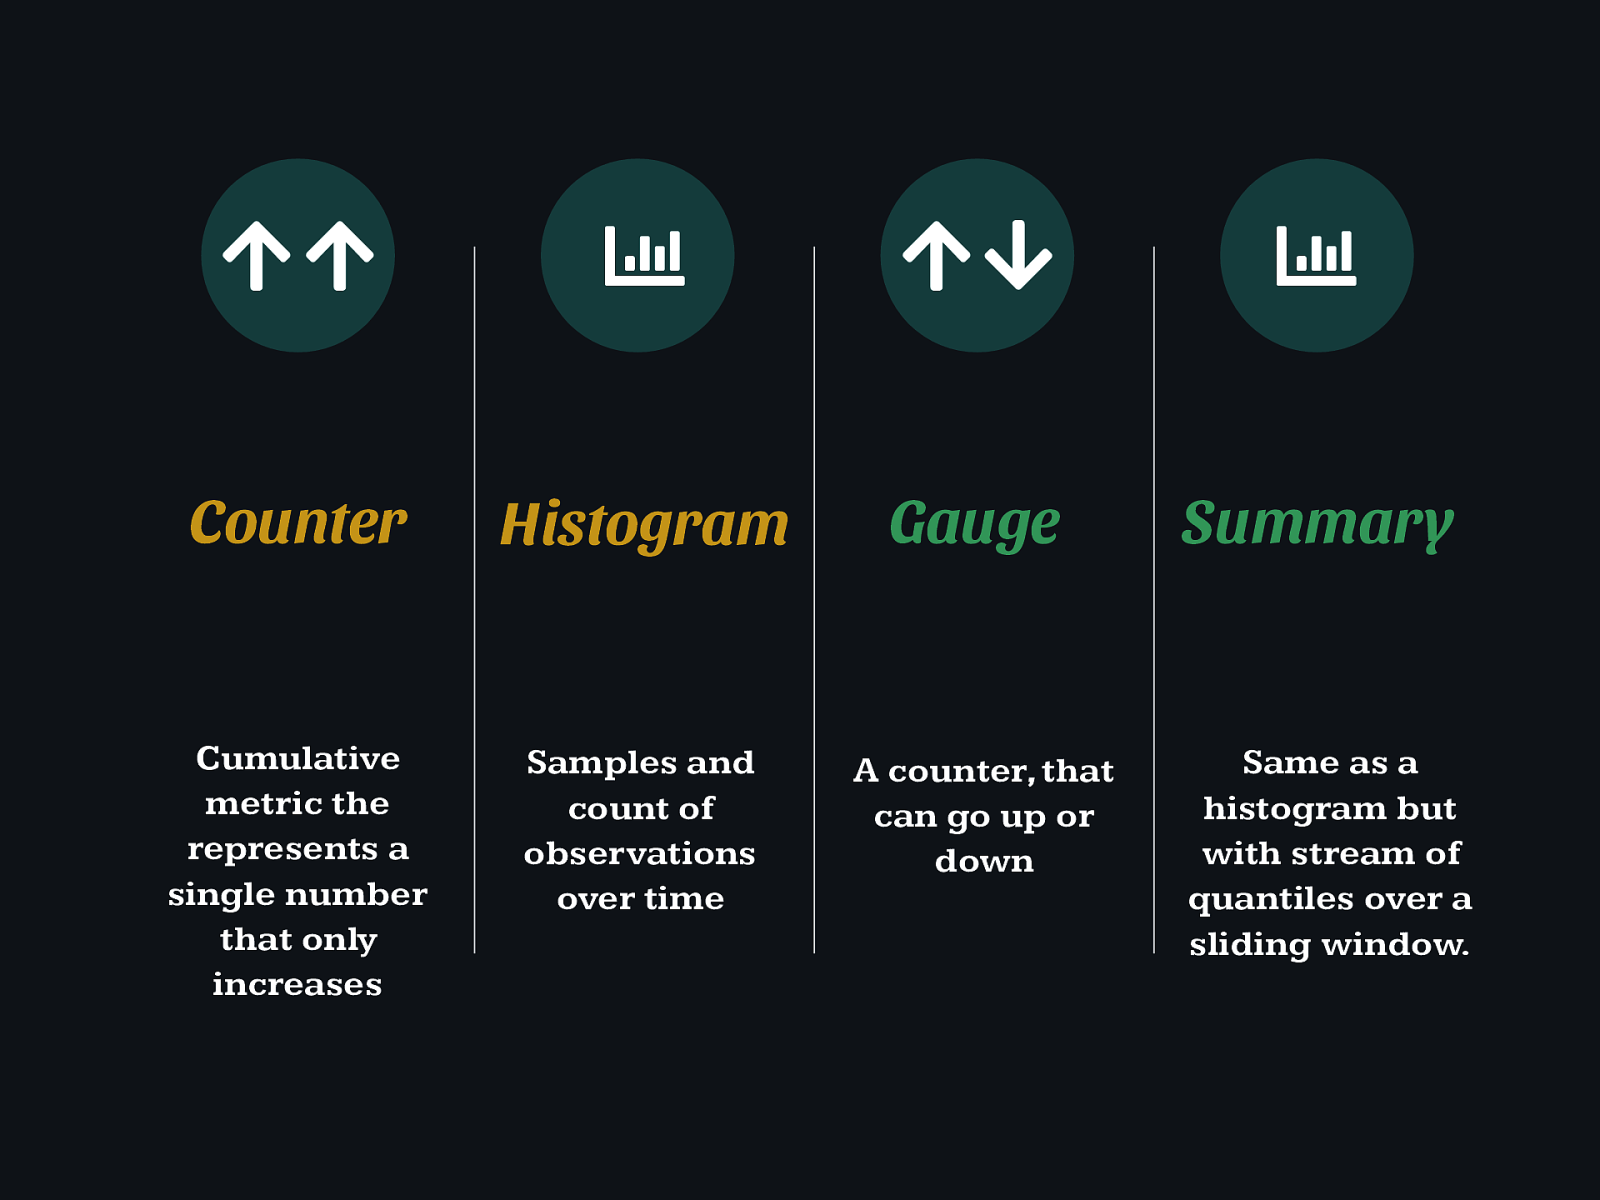
Gauge Histogram Counter Summary Cumulative metric the represents a single number that only increases Samples and count of observations over time A counter, that can go up or down Same as a histogram but with stream of quantiles over a sliding window. * * * * + +

jimdo/ prometheus_client_php
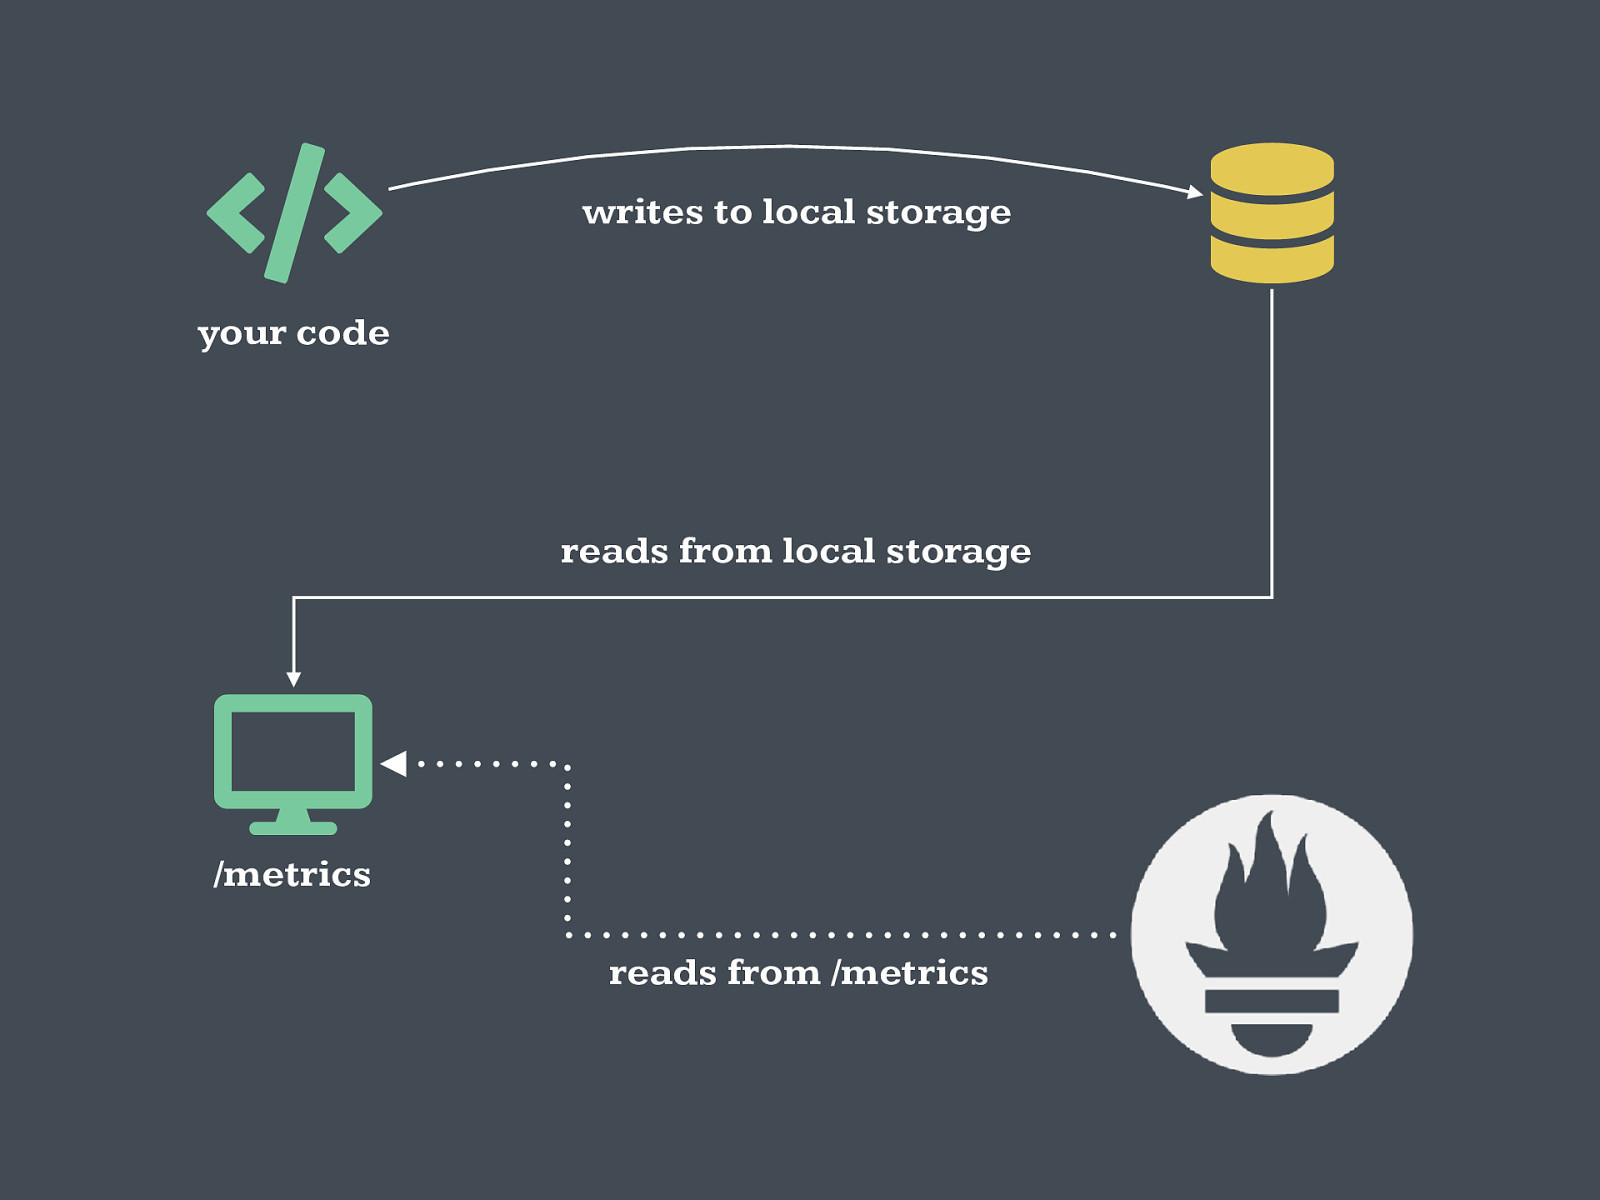
reads from /metrics reads from local storage writes to local storage your code /metrics

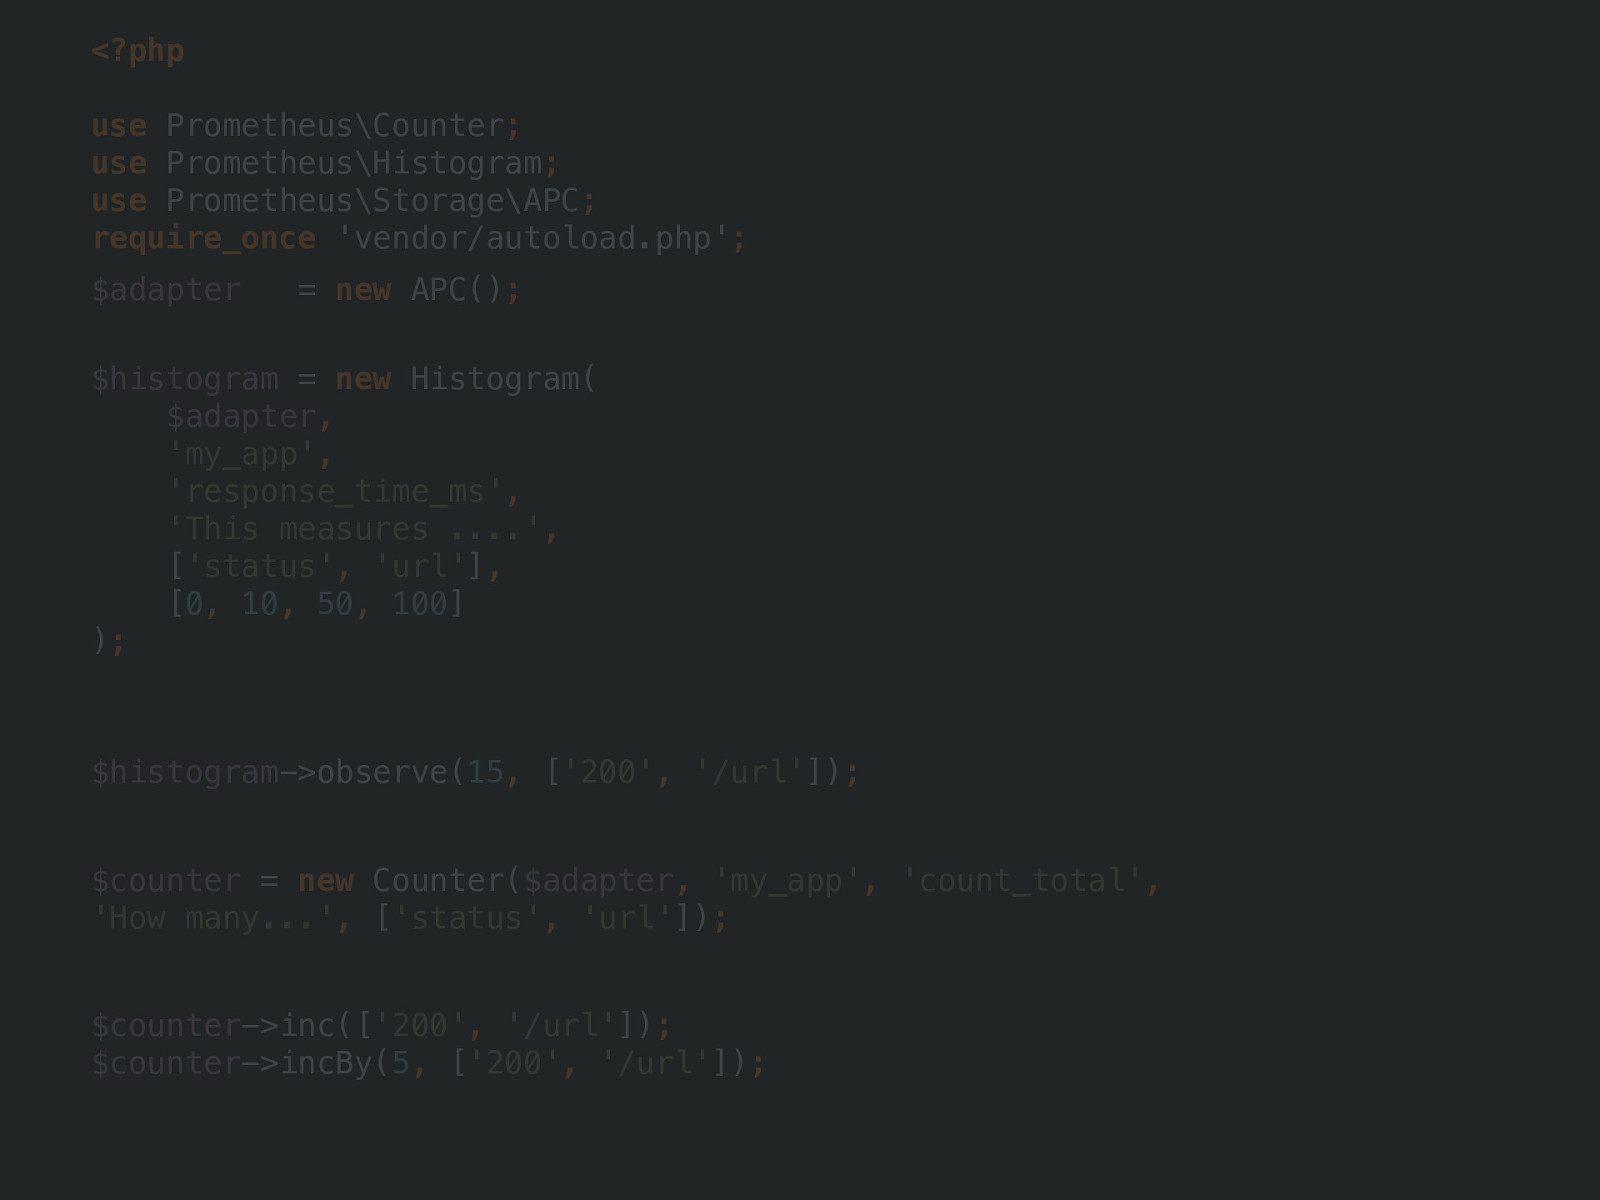
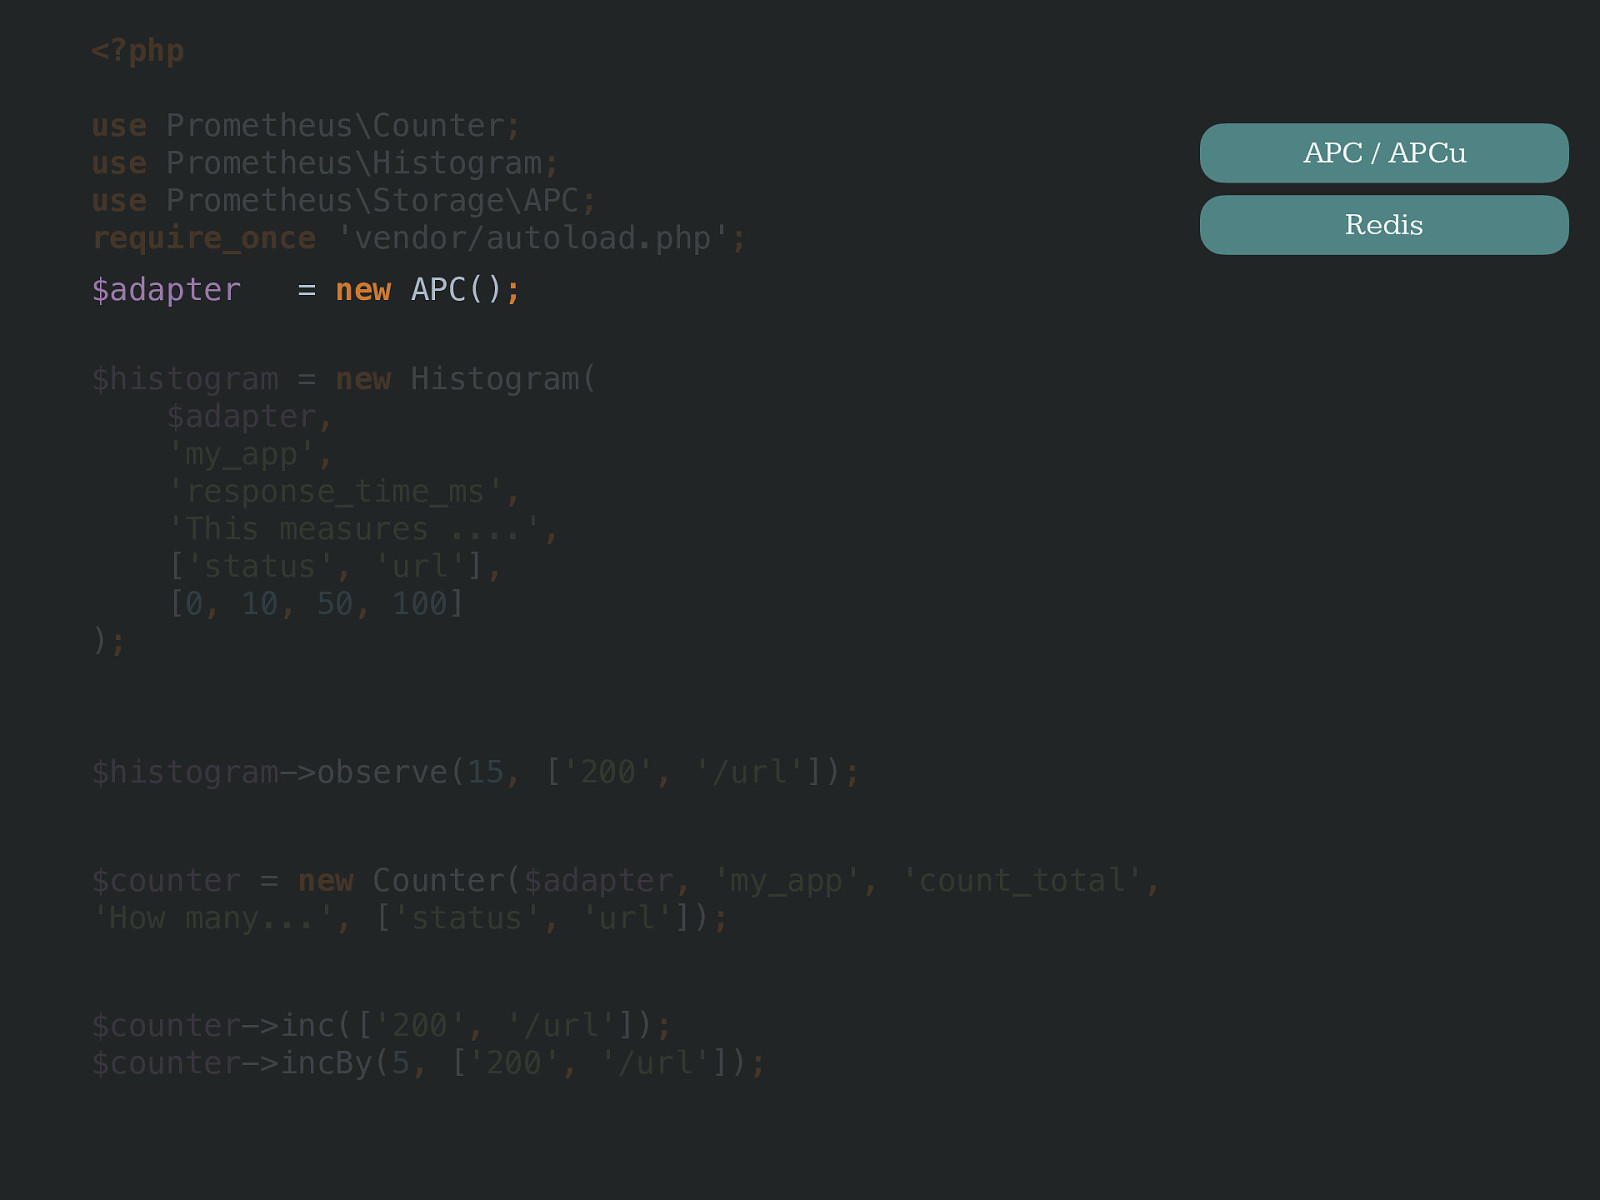
new APC() ; APC / APCu Redis
<?php use Prometheus\Counter ; use Prometheus\Histogram ; use Prometheus\Storage\APC ; require_once 'vendor/autoload.php' ; $histogram = new Histogram( $adapter , 'my_app' , 'response_time_ms' , 'This measures ....' , [ 'status' , 'url' ] , [ 0 , 10 , 50 , 100 ] ) ; $histogram ->observe( 15 , [ '200' , '/url' ]) ; $counter = new Counter( $adapter , 'my_app' , 'count_total' , 'How many...' , [ 'status' , 'url' ]) ; $counter ->inc([ '200' , '/url' ]) ; $counter ->incBy( 5 , [ '200' , '/url' ]) ;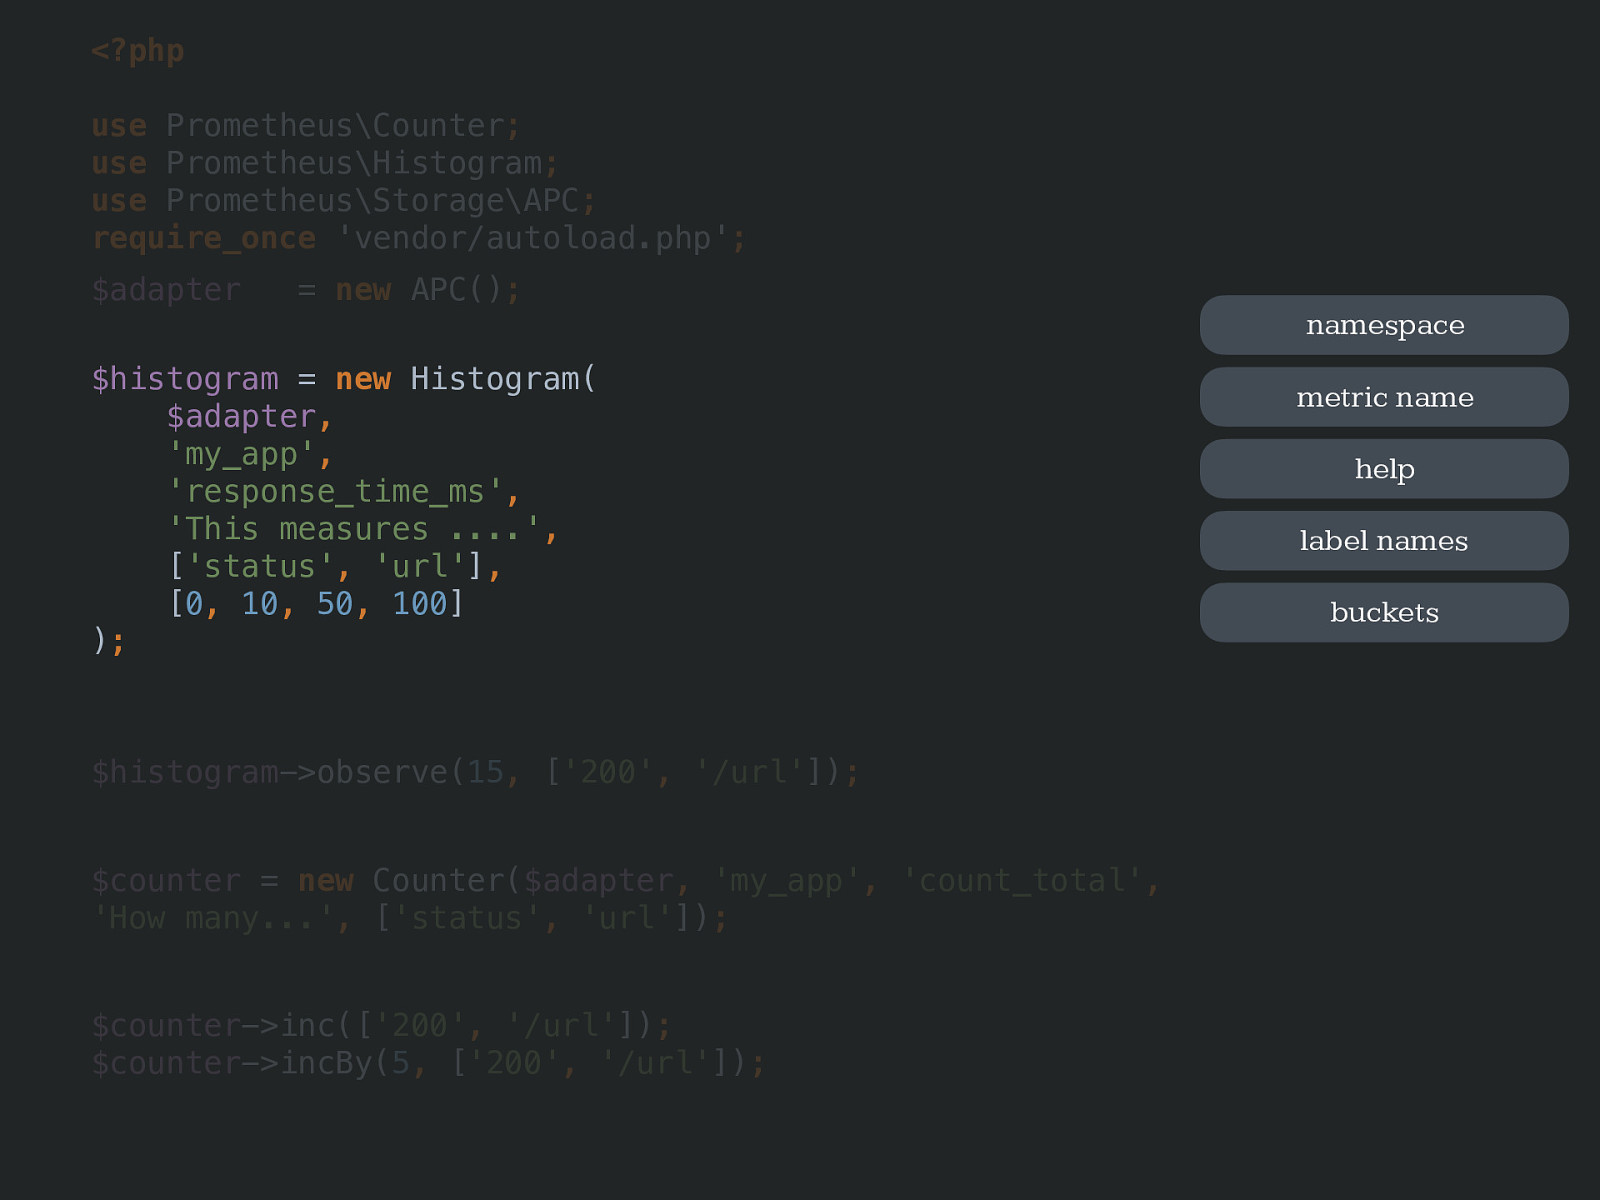
new Histogram(
$adapter ,
'my_app' ,
'response_time_ms' ,
'This measures ....' ,
[ 'status' , 'url' ] ,
[ 0 , 10 , 50 , 100 ] ) ; namespace metric name help label names buckets
<?php use Prometheus\Counter ; use Prometheus\Histogram ; use Prometheus\Storage\APC ; require_once 'vendor/autoload.php' ; $adapter = new APC() ; $histogram ->observe( 15 , [ '200' , '/url' ]) ; $counter = new Counter( $adapter , 'my_app' , 'count_total' , 'How many...' , [ 'status' , 'url' ]) ; $counter ->inc([ '200' , '/url' ]) ; $counter ->incBy( 5 , [ '200' , '/url' ]) ;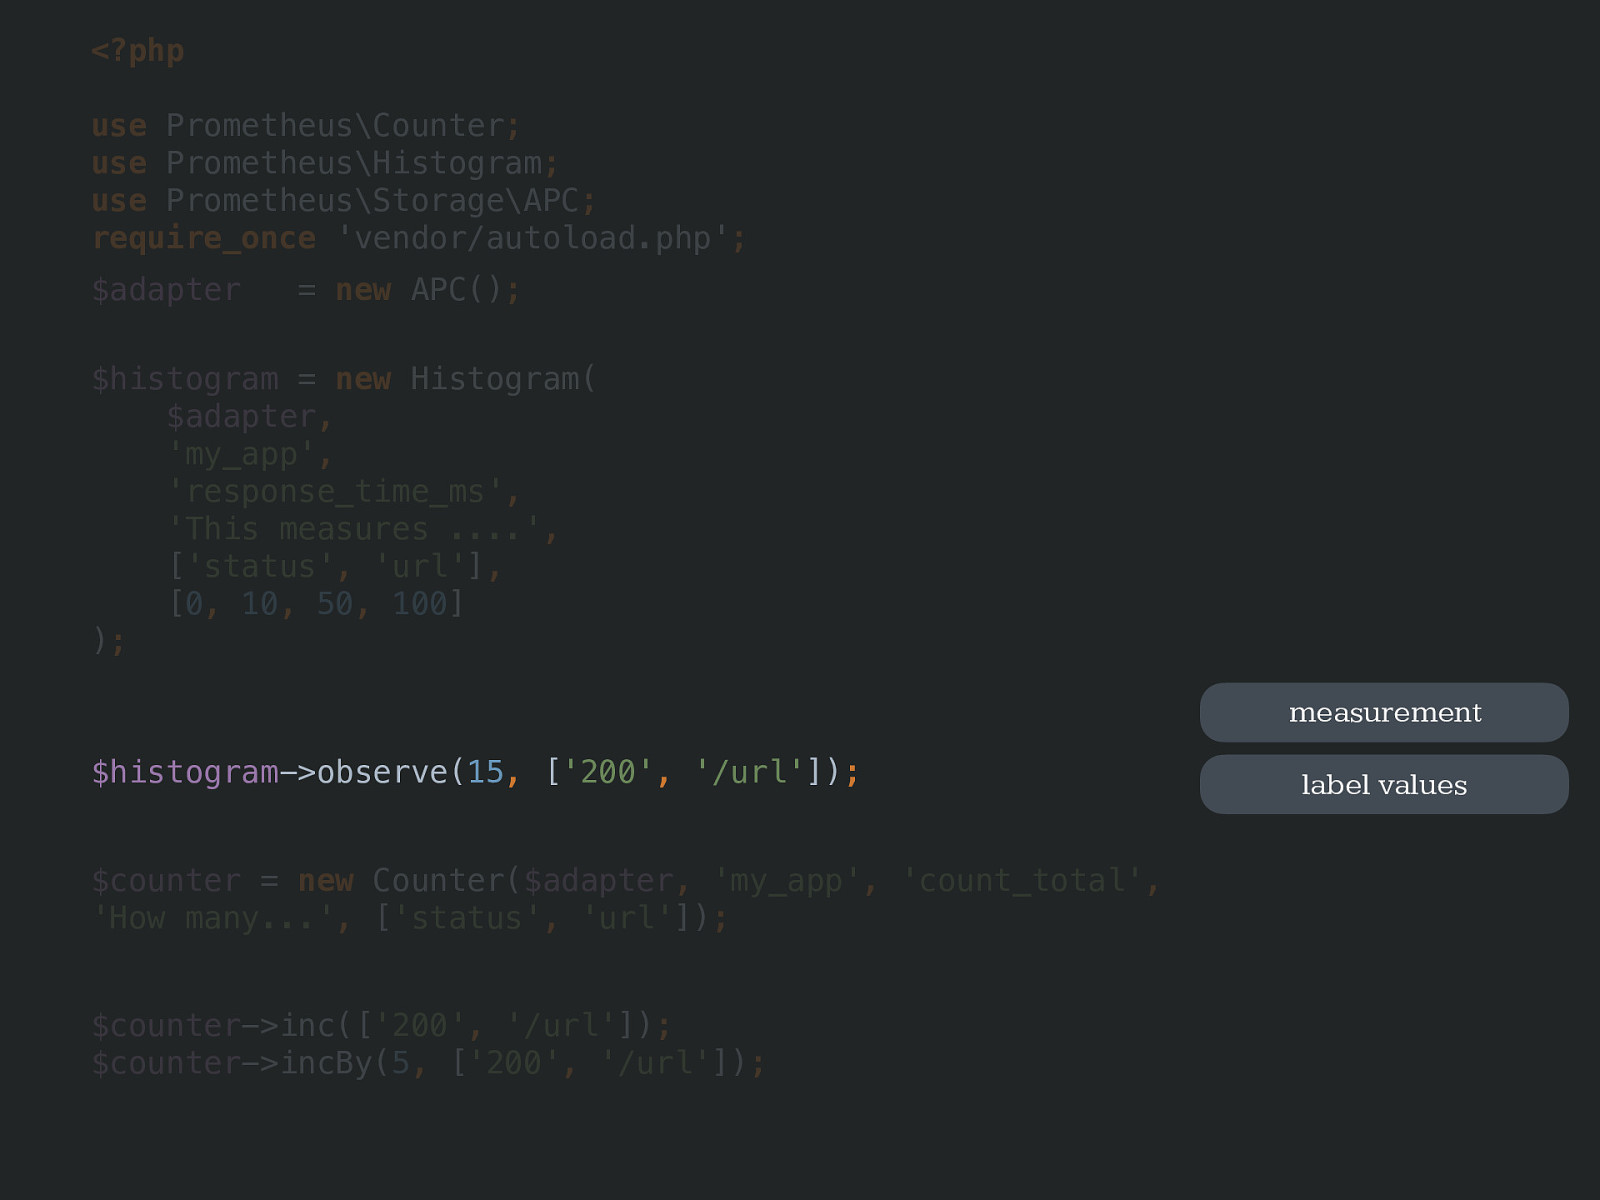
$histogram ->observe( 15 , [ '200' , '/url' ]) ; measurement label values
<?php use Prometheus\Counter ; use Prometheus\Histogram ; use Prometheus\Storage\APC ; require_once 'vendor/autoload.php' ; $adapter = new APC() ; $histogram = new Histogram( $adapter , 'my_app' , 'response_time_ms' , 'This measures ....' , [ 'status' , 'url' ] , [ 0 , 10 , 50 , 100 ] ) ; $counter = new Counter( $adapter , 'my_app' , 'count_total' , 'How many...' , [ 'status' , 'url' ]) ; $counter ->inc([ '200' , '/url' ]) ; $counter ->incBy( 5 , [ '200' , '/url' ]) ;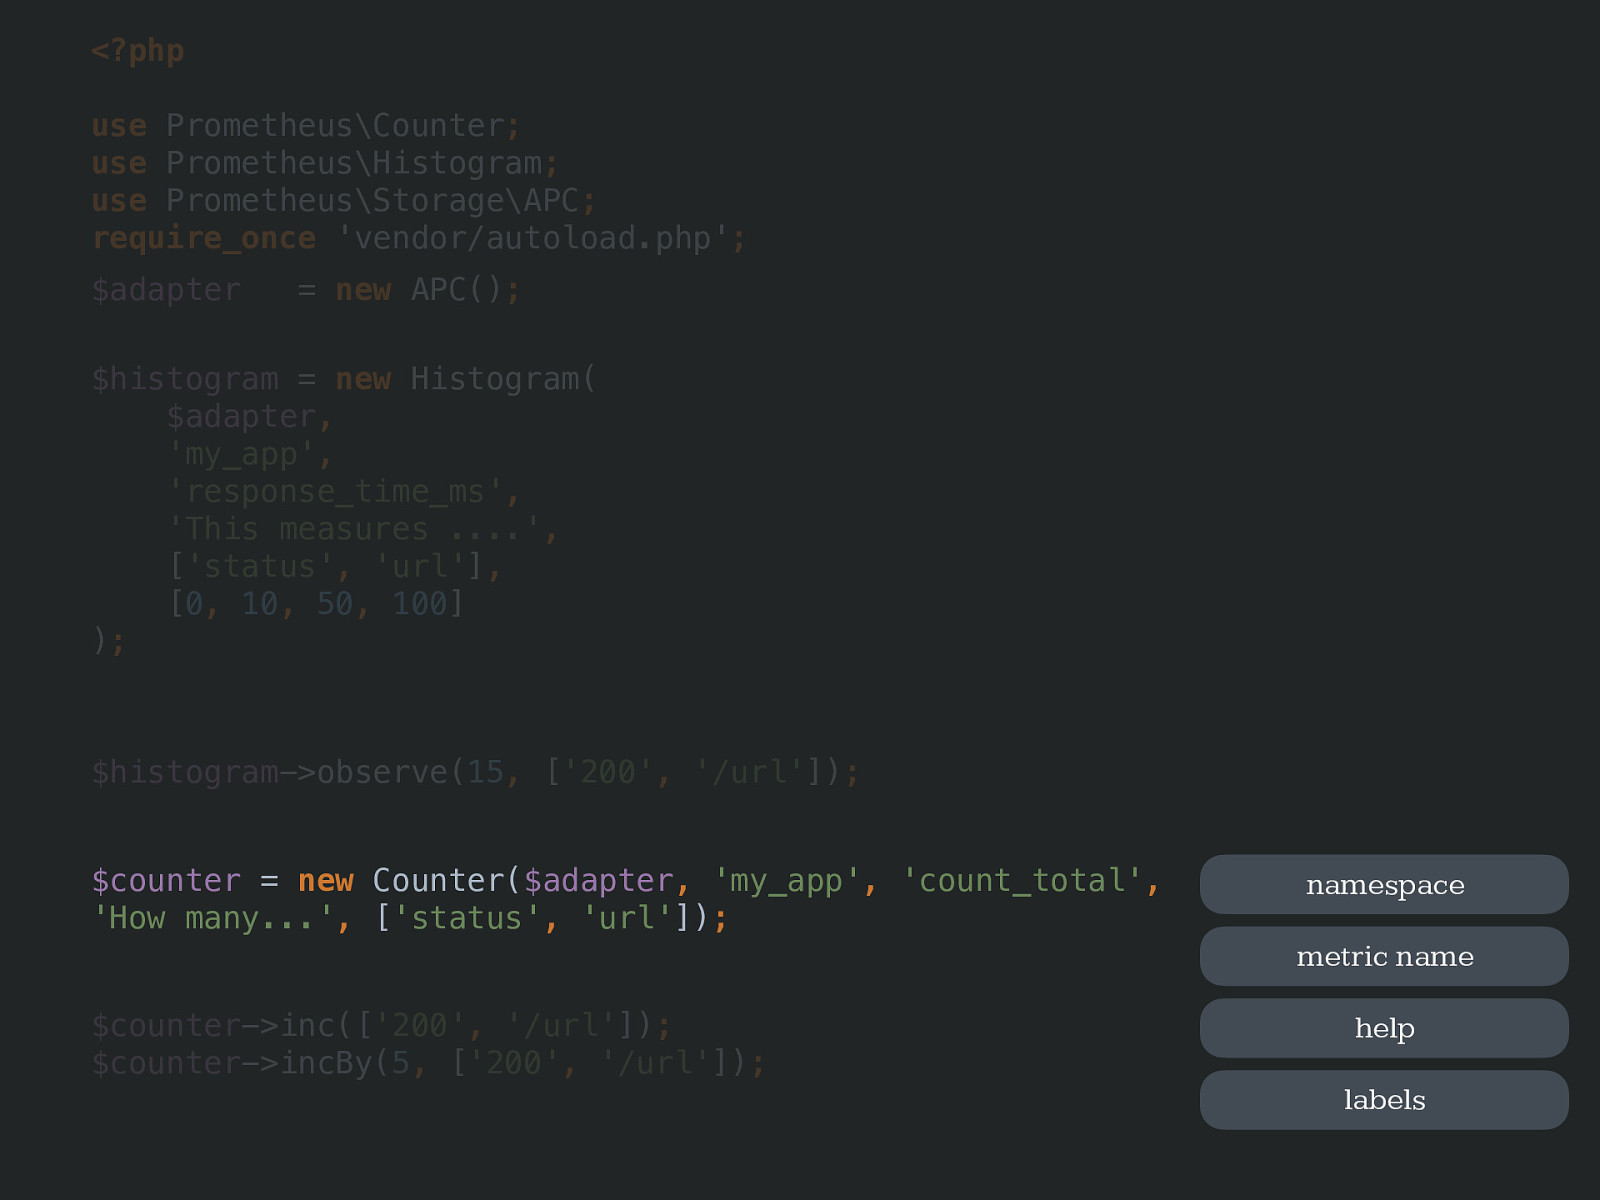
new Counter( $adapter , 'my_app' , 'count_total' , 'How many...' , [ 'status' , 'url' ]) ; namespace metric name help labels
<?php use Prometheus\Counter ; use Prometheus\Histogram ; use Prometheus\Storage\APC ; require_once 'vendor/autoload.php' ; $adapter = new APC() ; $histogram = new Histogram( $adapter , 'my_app' , 'response_time_ms' , 'This measures ....' , [ 'status' , 'url' ] , [ 0 , 10 , 50 , 100 ] ) ; $histogram ->observe( 15 , [ '200' , '/url' ]) ; $counter ->inc([ '200' , '/url' ]) ; $counter ->incBy( 5 , [ '200' , '/url' ]) ;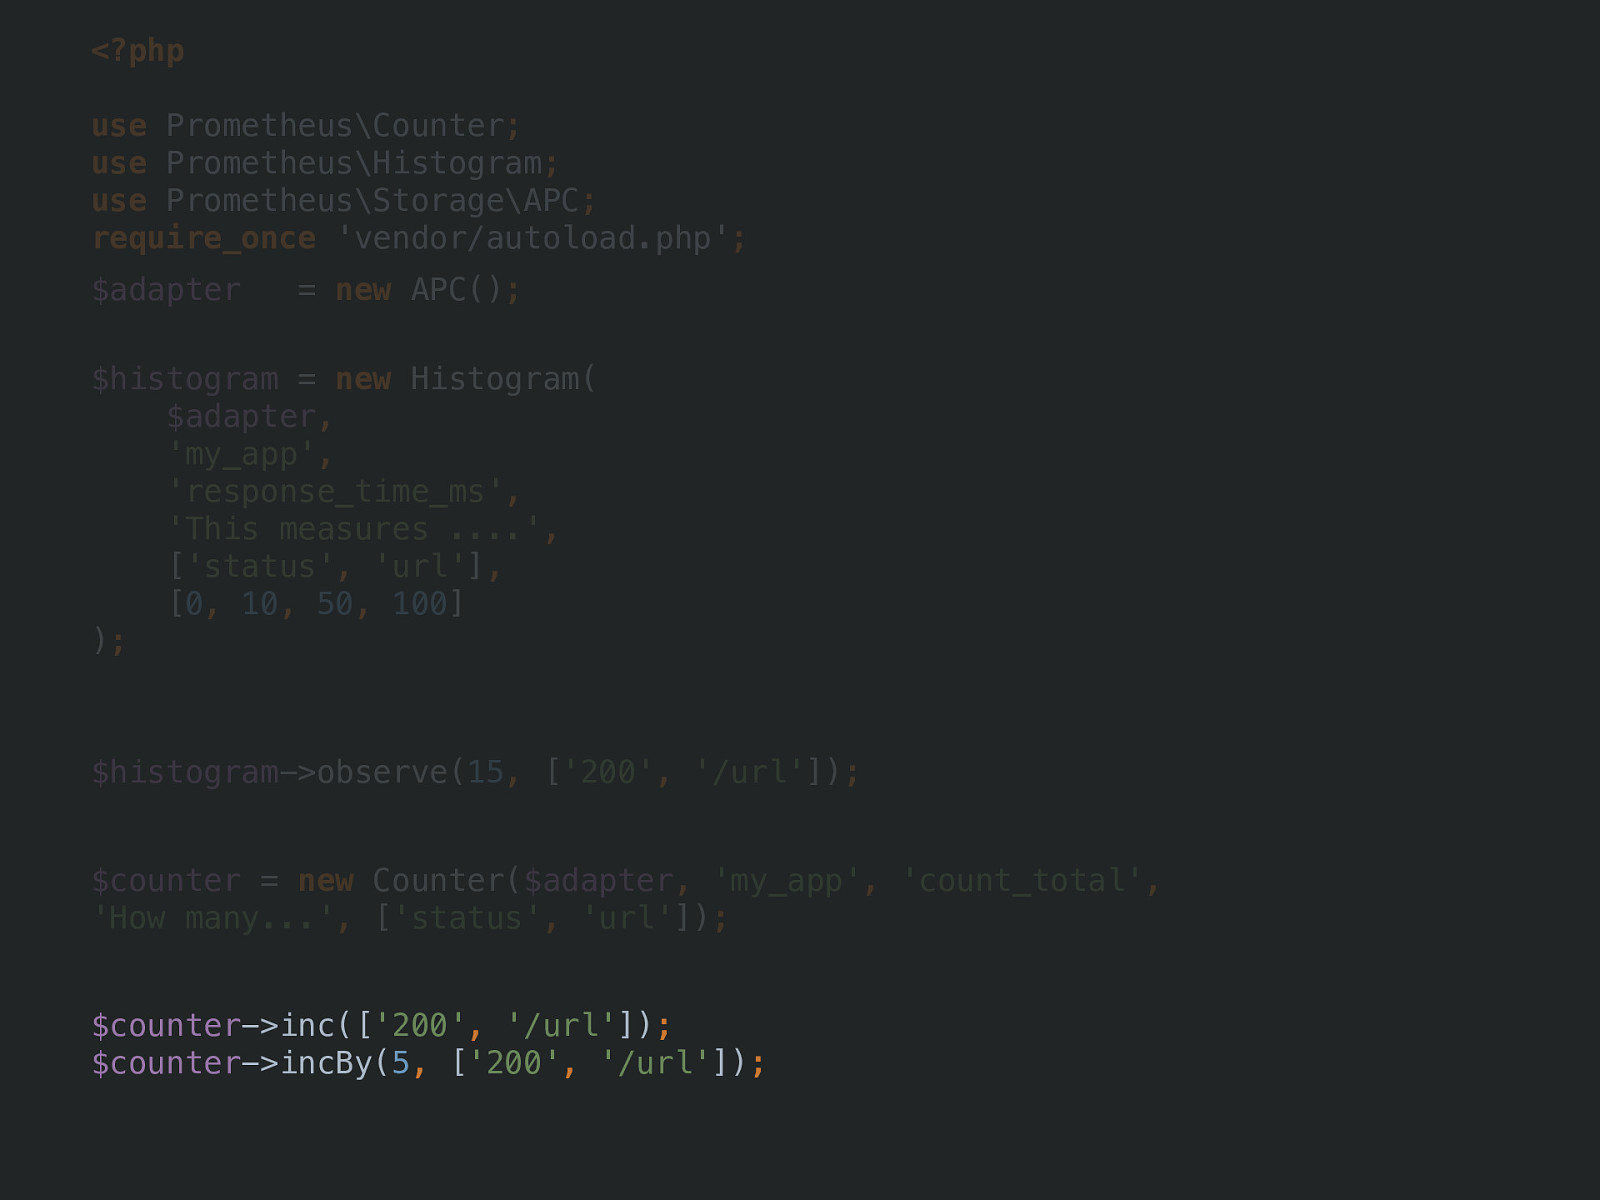
$counter ->inc([ '200' , '/url' ]) ; $counter ->incBy( 5 , [ '200' , '/url' ]) ;
<?php use Prometheus\Counter ; use Prometheus\Histogram ; use Prometheus\Storage\APC ; require_once 'vendor/autoload.php' ; $adapter = new APC() ; $histogram = new Histogram( $adapter , 'my_app' , 'response_time_ms' , 'This measures ....' , [ 'status' , 'url' ] , [ 0 , 10 , 50 , 100 ] ) ; $histogram ->observe( 15 , [ '200' , '/url' ]) ; $counter = new Counter( $adapter , 'my_app' , 'count_total' , 'How many...' , [ 'status' , 'url' ]) ;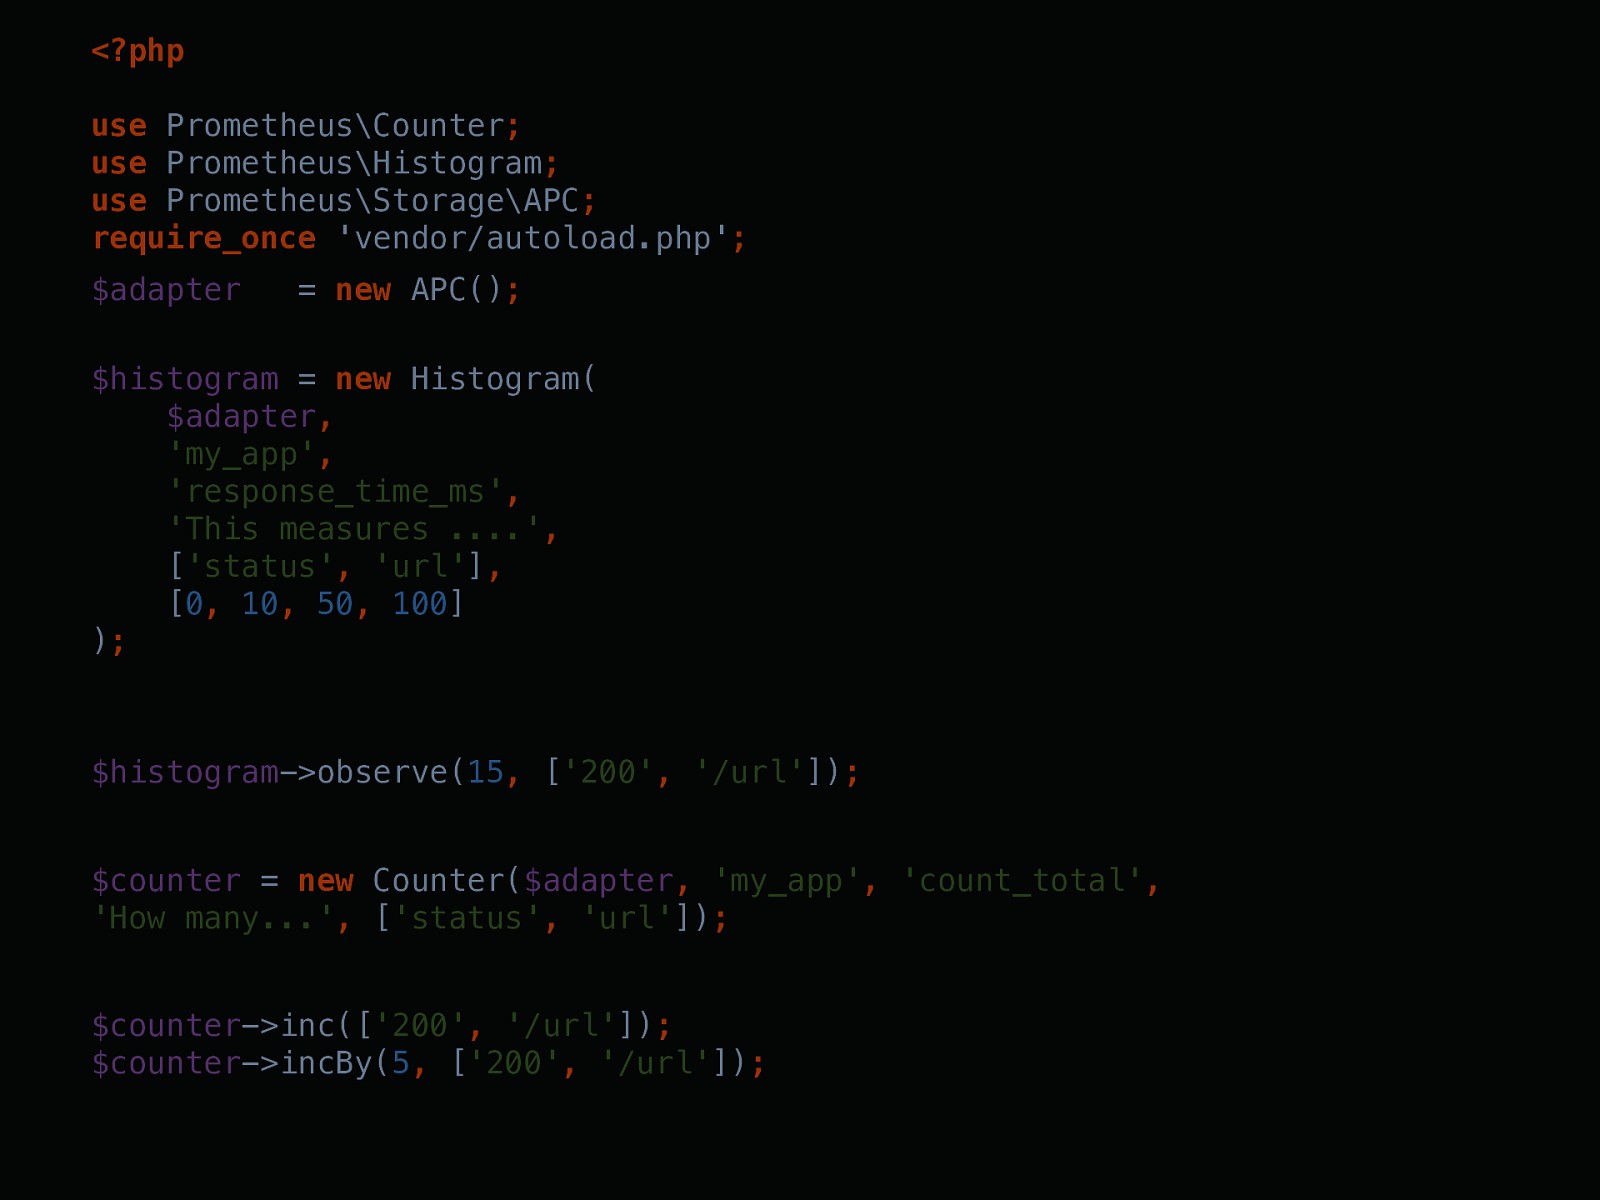
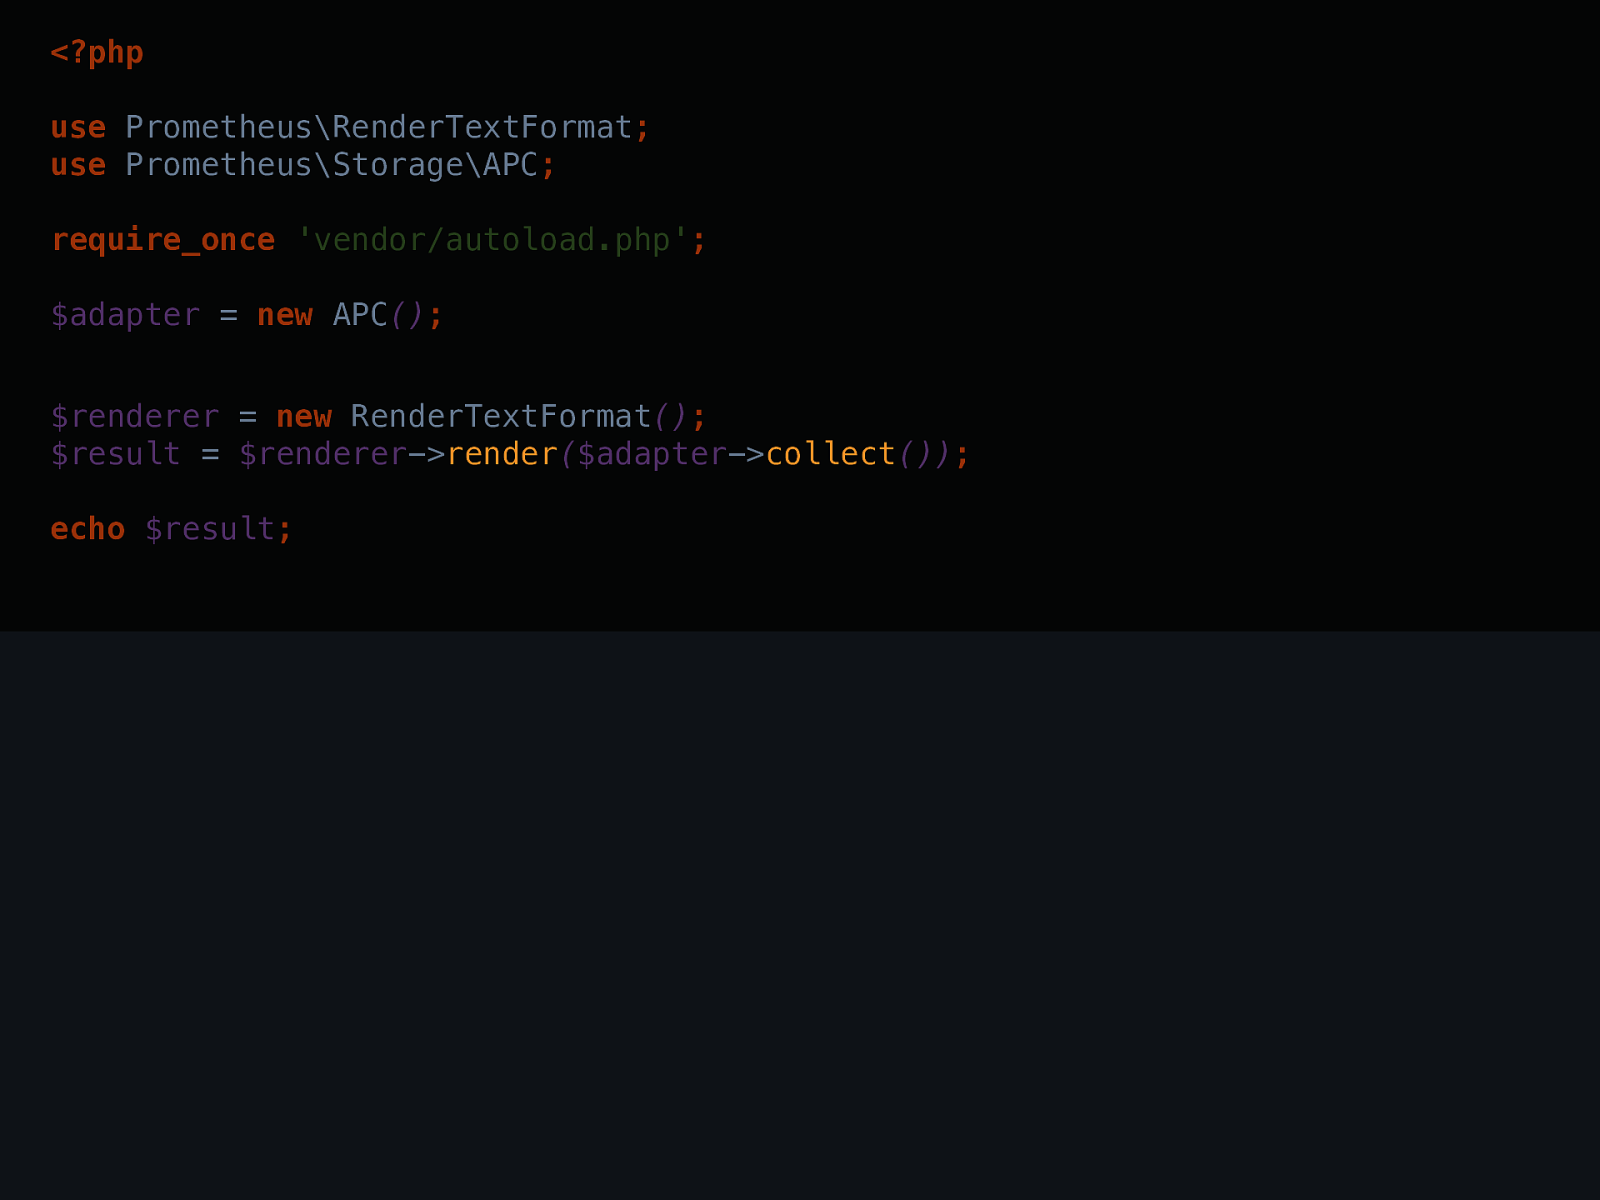
$renderer -> render ( $adapter -> collect ()) ; echo $result ;
<?php use Prometheus\RenderTextFormat ; use Prometheus\Storage\APC ; require_once 'vendor/autoload.php' ; $adapter = new APC () ;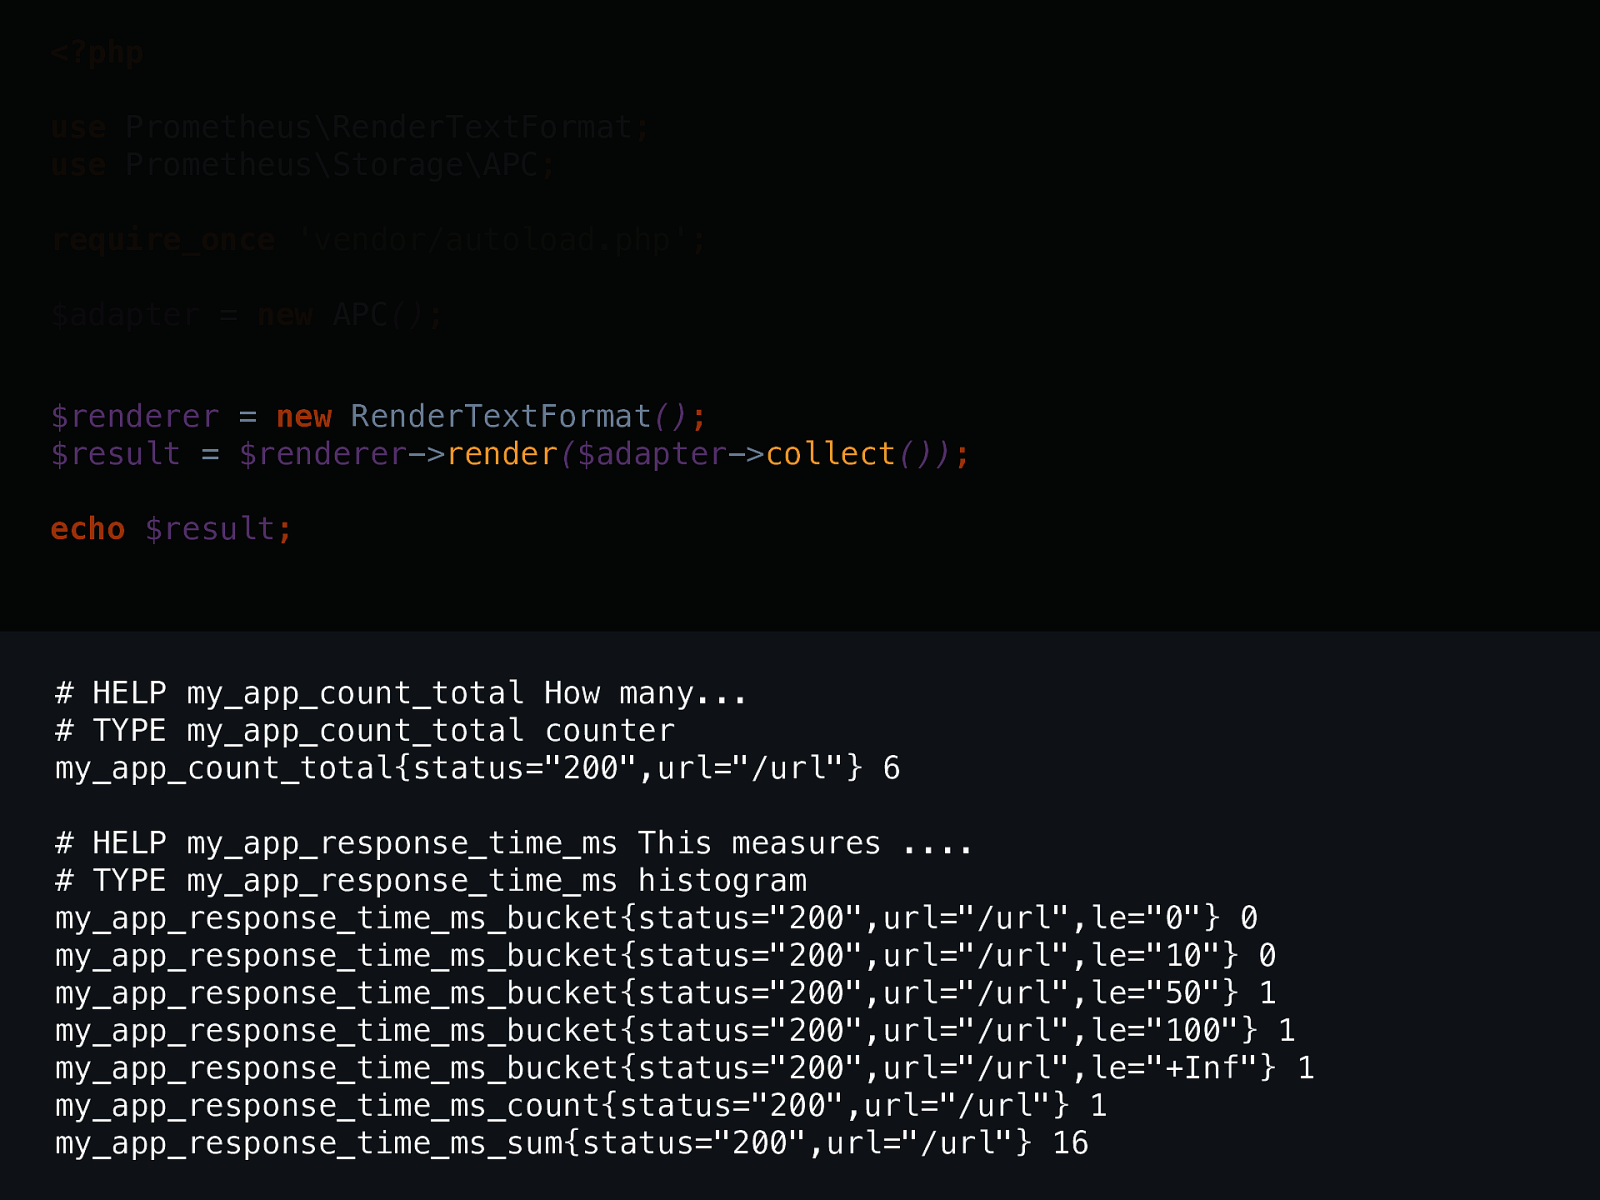
my_app_count_total{status="200",url="/url"} 6
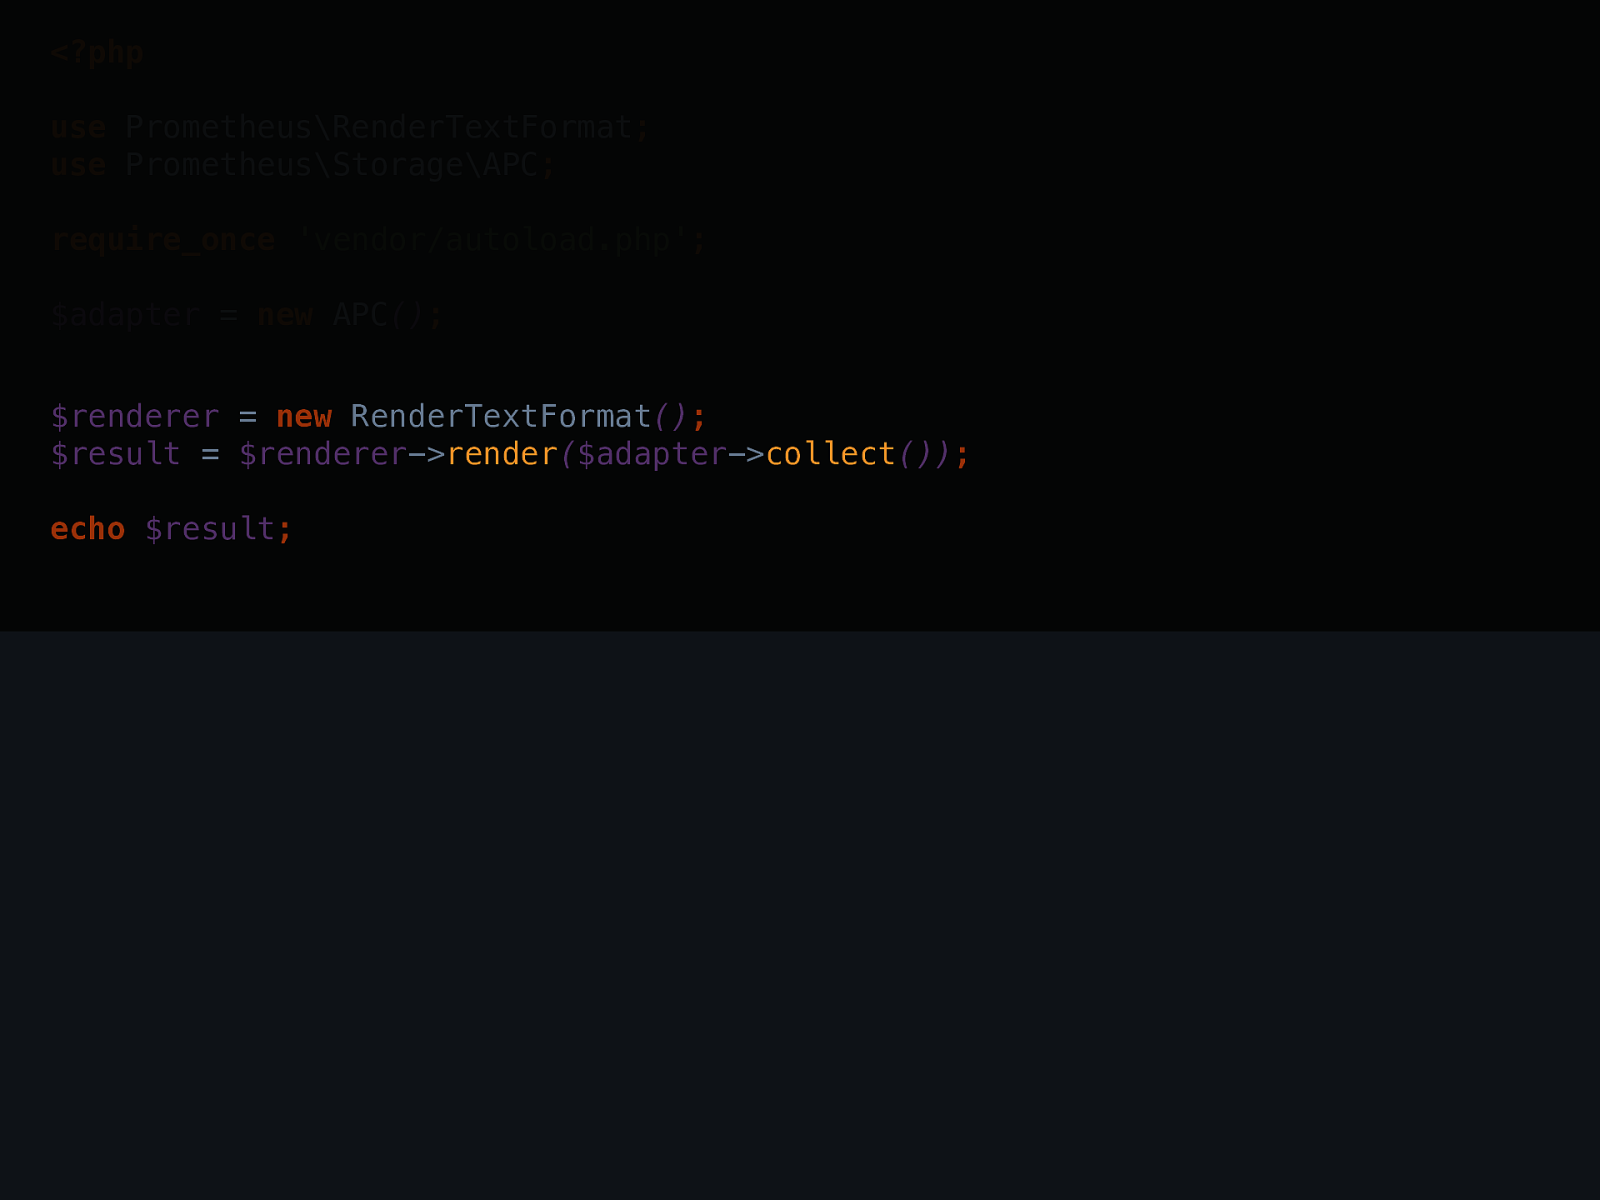
$renderer -> render ( $adapter -> collect ()) ; echo $result ;
<?php use Prometheus\RenderTextFormat ; use Prometheus\Storage\APC ; require_once 'vendor/autoload.php' ; $adapter = new APC () ;
https://github.com/rdohms/talk-app-metrics "

You can’t act on what you can’t see.

Metrics without actionability are just numbers on a screen.

Act as soon as an SLO is threatened .

Thank you. Drop me some feedback at Usabilla and make this talk better. @rdohms http://slides.doh.ms