How to start a logging project with the Elastic Stack Marco De Luca, Principal Solution Architect Köln@ REWE, 8. October 2019 1

A presentation at Elastic Meetup Cologne in October 2019 in by Sebastian Latza
How to start a logging project with the Elastic Stack Marco De Luca, Principal Solution Architect Köln@ REWE, 8. October 2019 1

Please fill out the survey and WIN a Elastic Backpack! Here is a link to the survey: https://go.es.io/2I07X5D Or a QR code: 2 This could be YOURS J
Agenda 3 • A very quick Elastic Stack Overview • Step by step – A suggestion on how to start • The important foundation - a common schema • Index Templates and how to use them • Preparing a cluster for scale • Index Lifecycle Management • Demo • Q&A
Elastic Stack Overview As short as possbile J 4
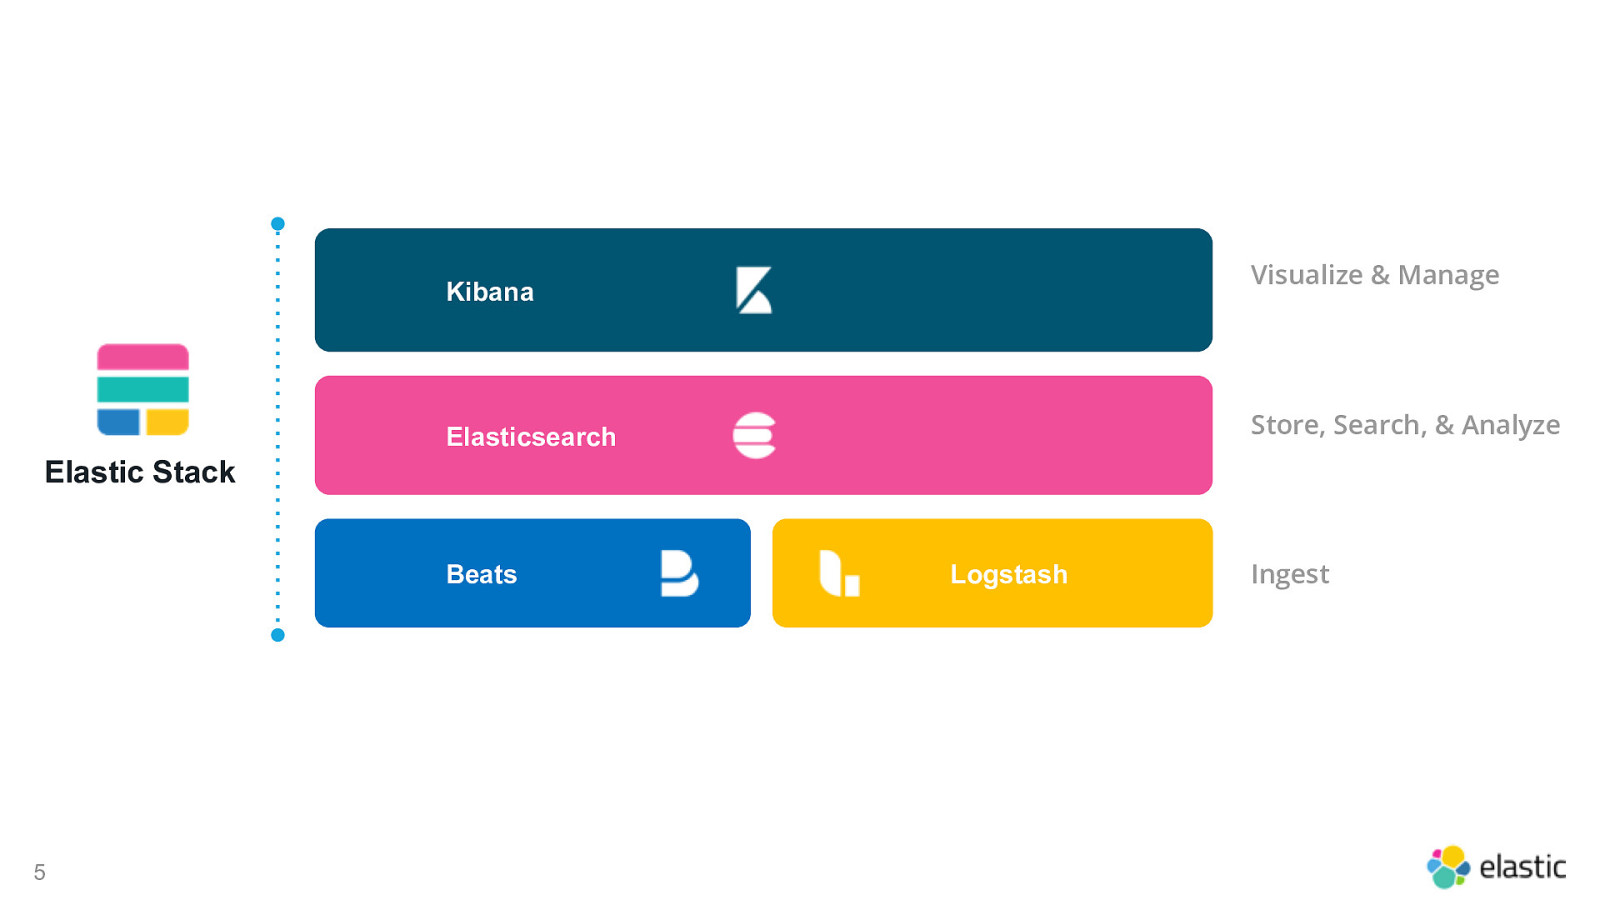
Visualize & Manage Kibana Store, Search, & Analyze Elasticsearch Elastic Stack Beats 5 Logstash Ingest
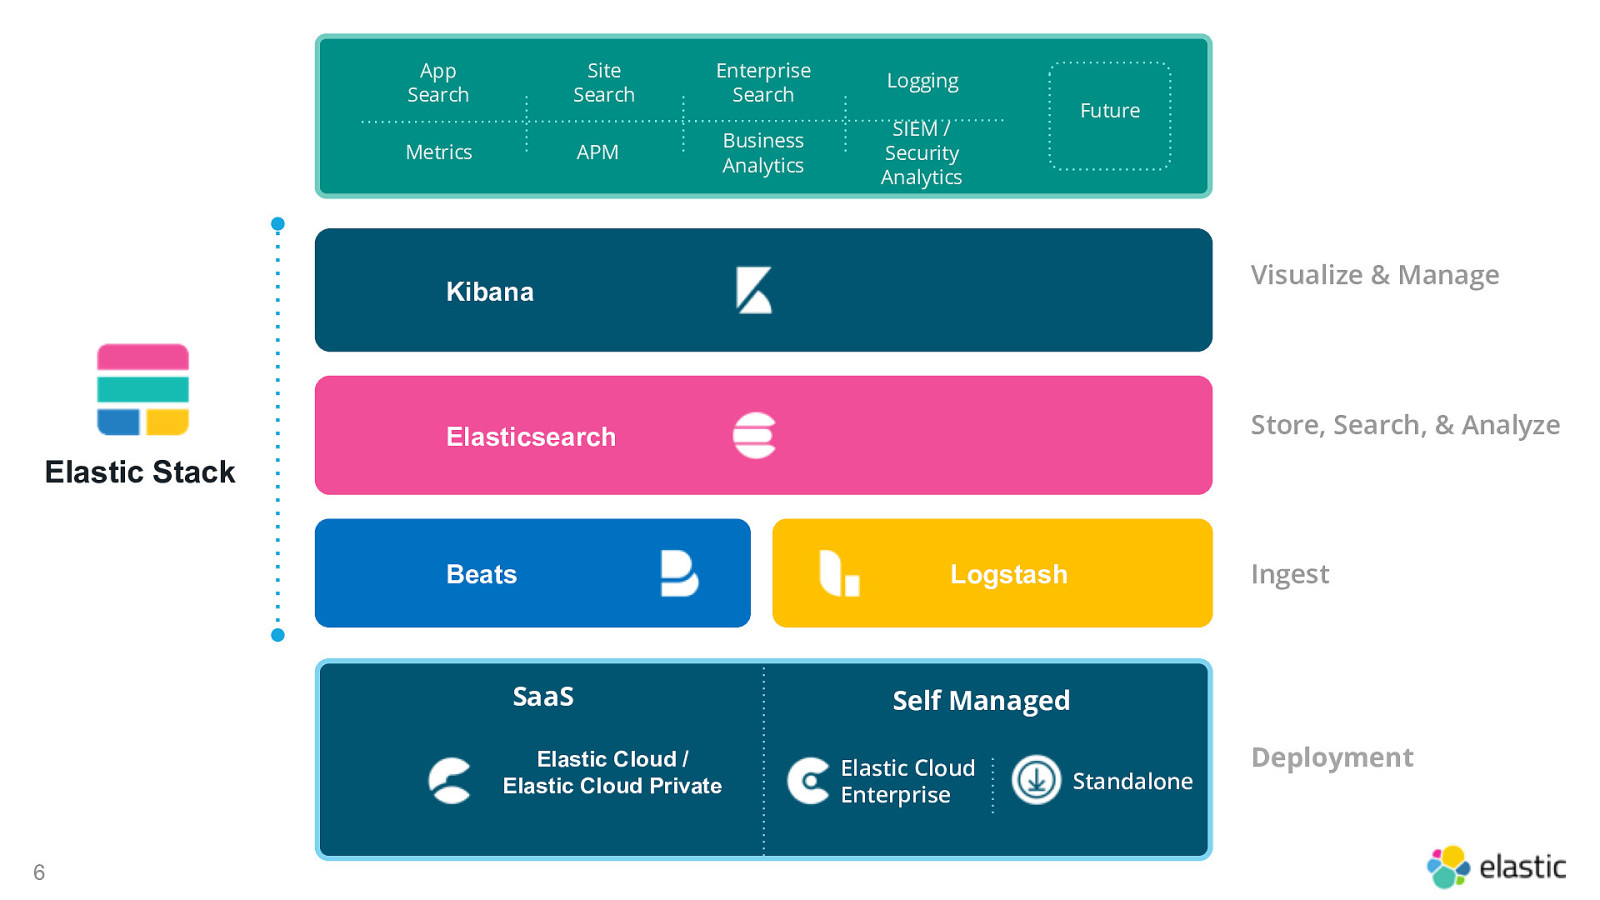
App Search Site Search Metrics APM Enterprise Search Logging Business Analytics SIEM / Security Analytics Future Solutions Visualize & Manage Kibana Store, Search, & Analyze Elasticsearch Elastic Stack Beats SaaS Elastic Cloud / Elastic Cloud Private 6 Ingest Logstash Self Managed Elastic Cloud Enterprise Standalone Deployment
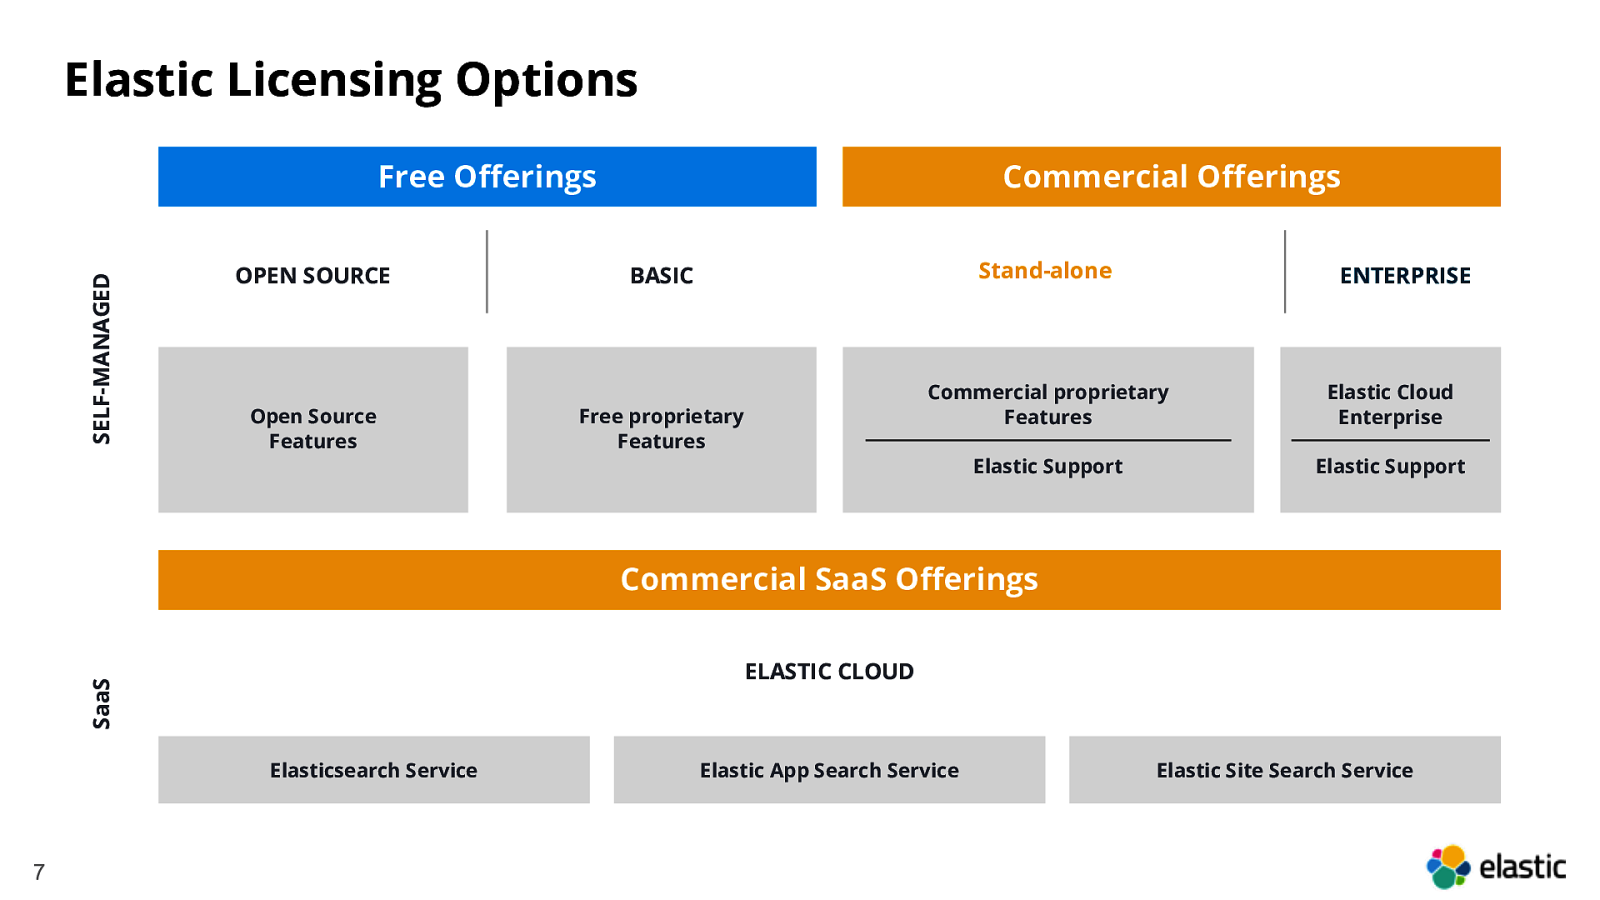
Elastic Licensing Options SELF-MANAGED Free Offerings Commercial Offerings Stand-alone OPEN SOURCE BASIC Open Source Features Free proprietary Features ENTERPRISE Commercial proprietary Features Elastic Cloud Enterprise Elastic Support Elastic Support Commercial SaaS Offerings SaaS ELASTIC CLOUD Elasticsearch Service 7 Elastic App Search Service Elastic Site Search Service
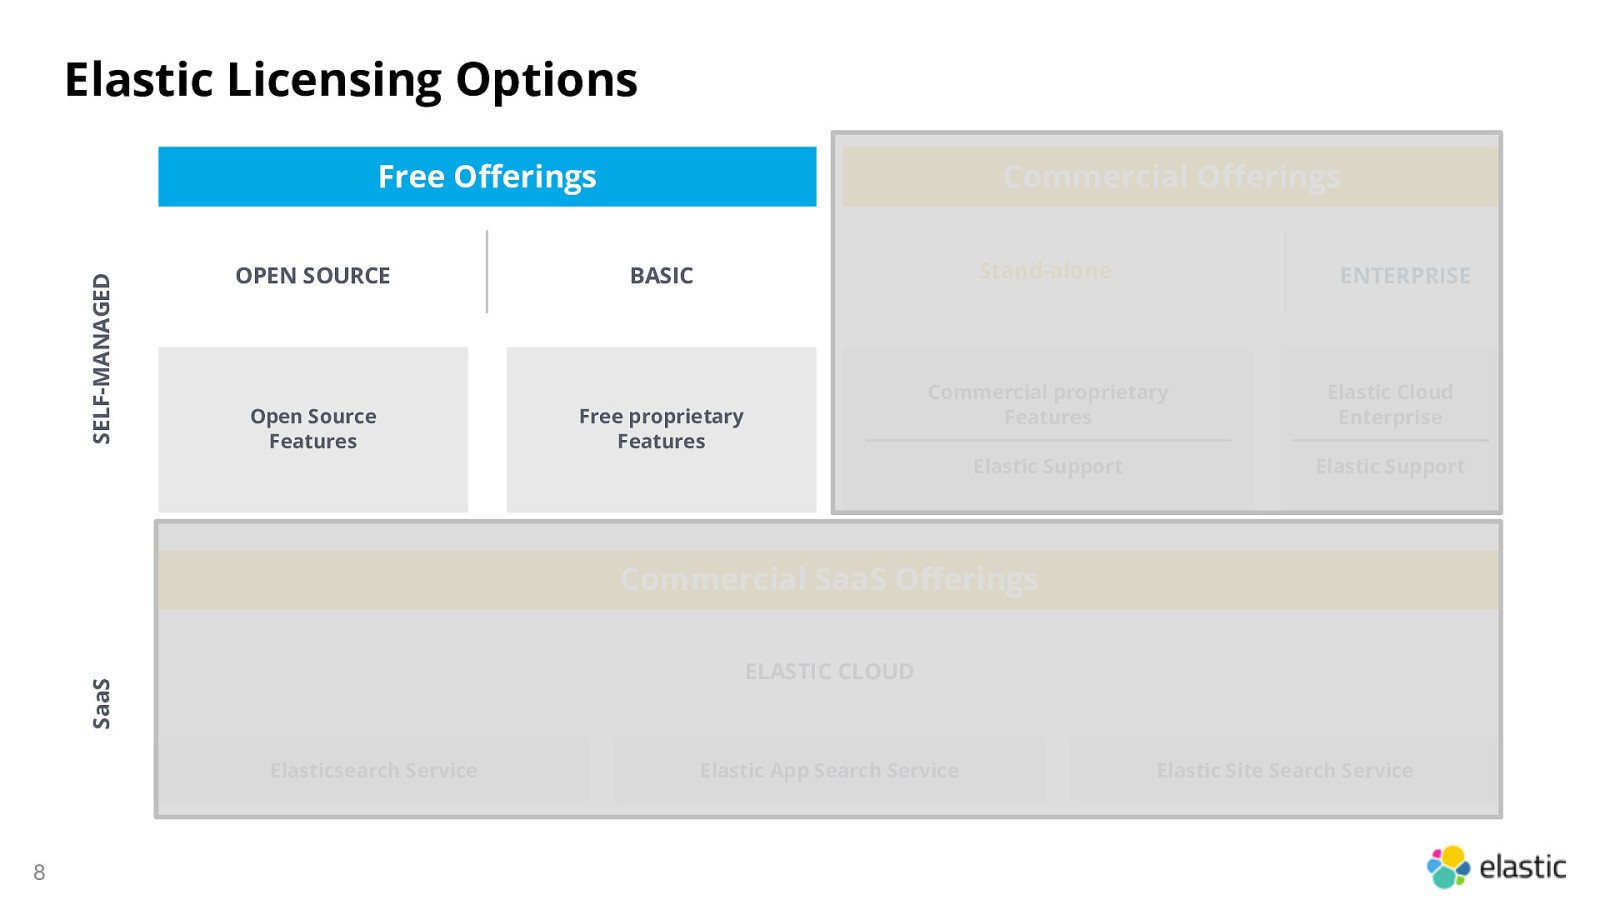
Elastic Licensing Options SELF-MANAGED Free Offerings Commercial Offerings Stand-alone OPEN SOURCE BASIC Open Source Features Free proprietary Features ENTERPRISE Commercial proprietary Features Elastic Cloud Enterprise Elastic Support Elastic Support Commercial SaaS Offerings SaaS ELASTIC CLOUD Elasticsearch Service 8 Elastic App Search Service Elastic Site Search Service
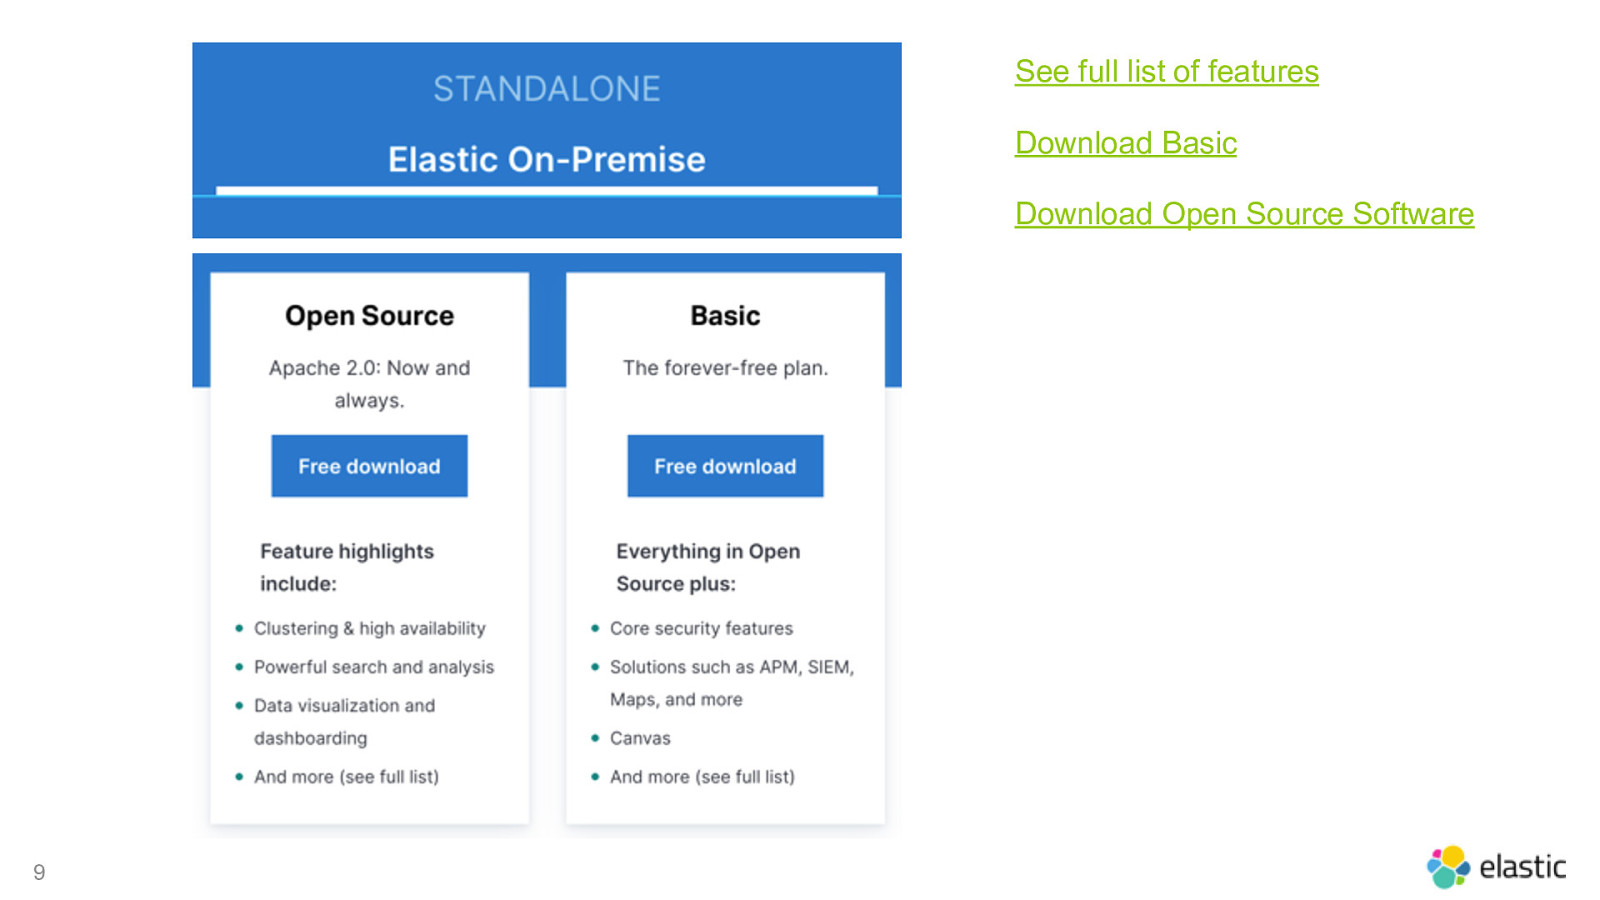
See full list of features Download Basic Download Open Source Software 9
Step by Step High Level approach 10
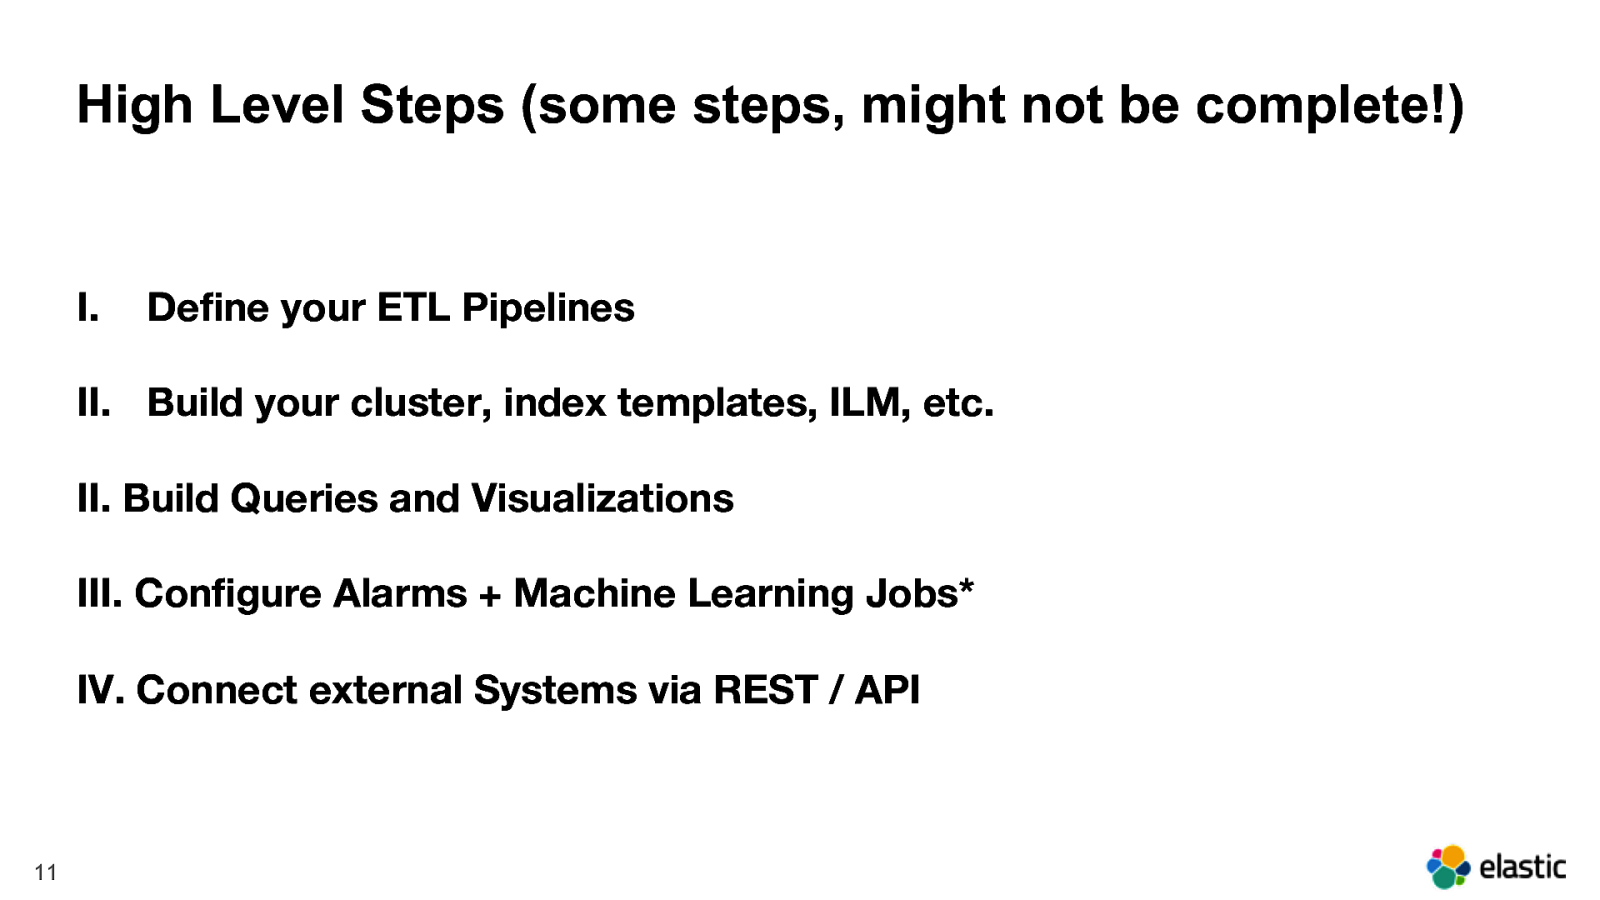
High Level Steps (some steps, might not be complete!) I. Define your ETL Pipelines II. Build your cluster, index templates, ILM, etc. II. Build Queries and Visualizations III. Configure Alarms + Machine Learning Jobs* IV. Connect external Systems via REST / API 11
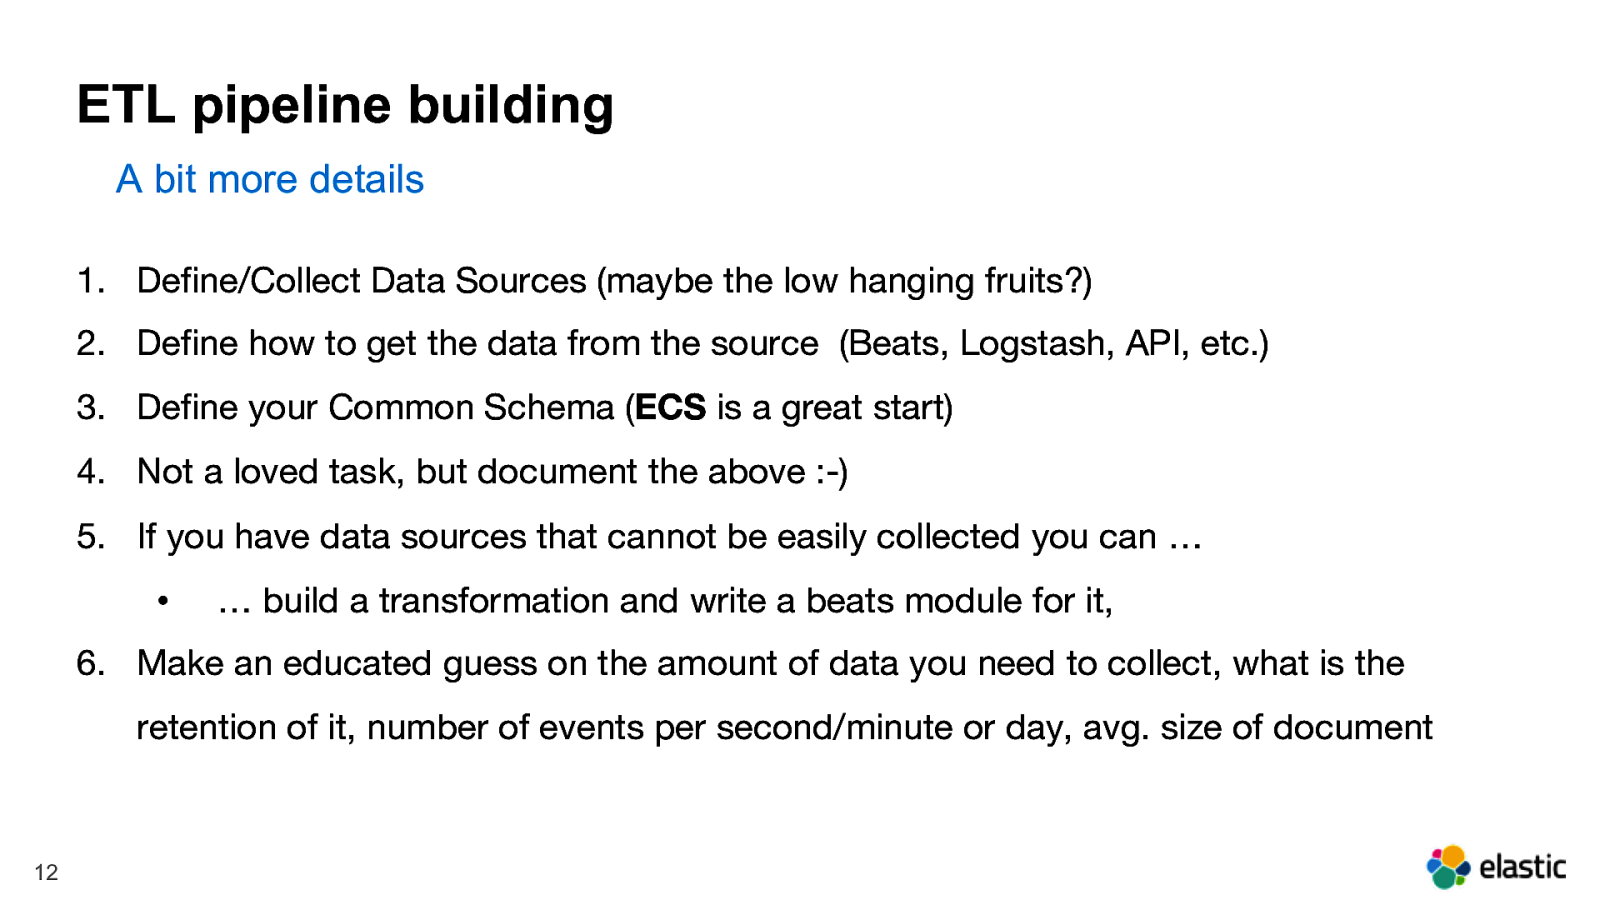
ETL pipeline building A bit more details 1. Define/Collect Data Sources (maybe the low hanging fruits?) 2. Define how to get the data from the source (Beats, Logstash, API, etc.) 3. Define your Common Schema (ECS is a great start) 4. Not a loved task, but document the above :-) 5. If you have data sources that cannot be easily collected you can … • … build a transformation and write a beats module for it, 6. Make an educated guess on the amount of data you need to collect, what is the retention of it, number of events per second/minute or day, avg. size of document 12
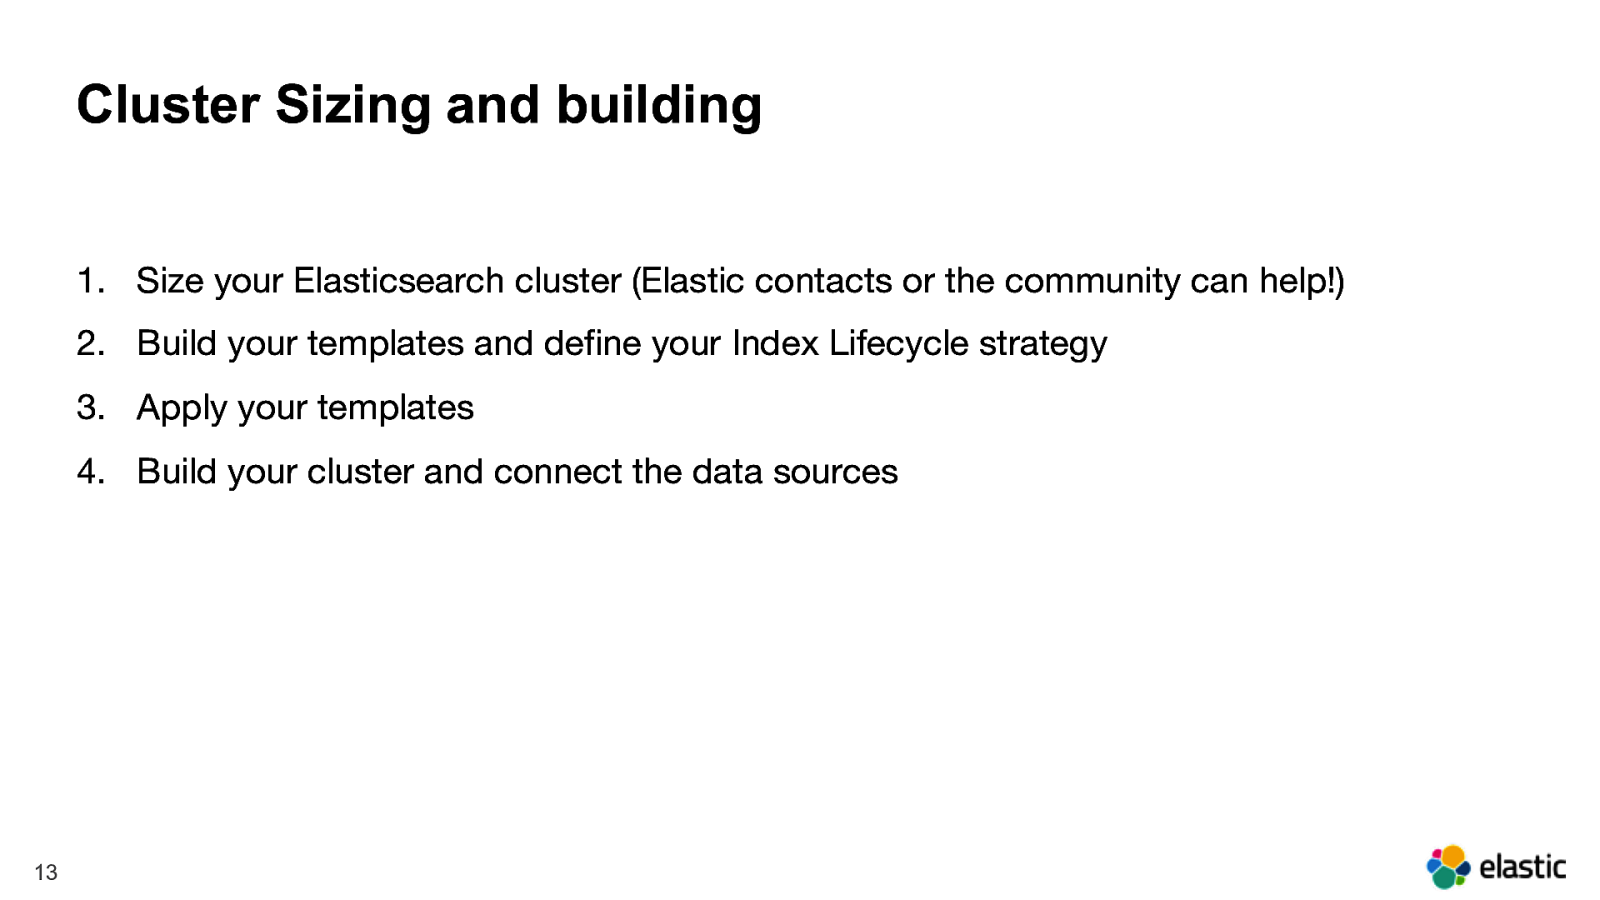
Cluster Sizing and building 1. Size your Elasticsearch cluster (Elastic contacts or the community can help!) 2. Build your templates and define your Index Lifecycle strategy 3. Apply your templates 4. Build your cluster and connect the data sources 13
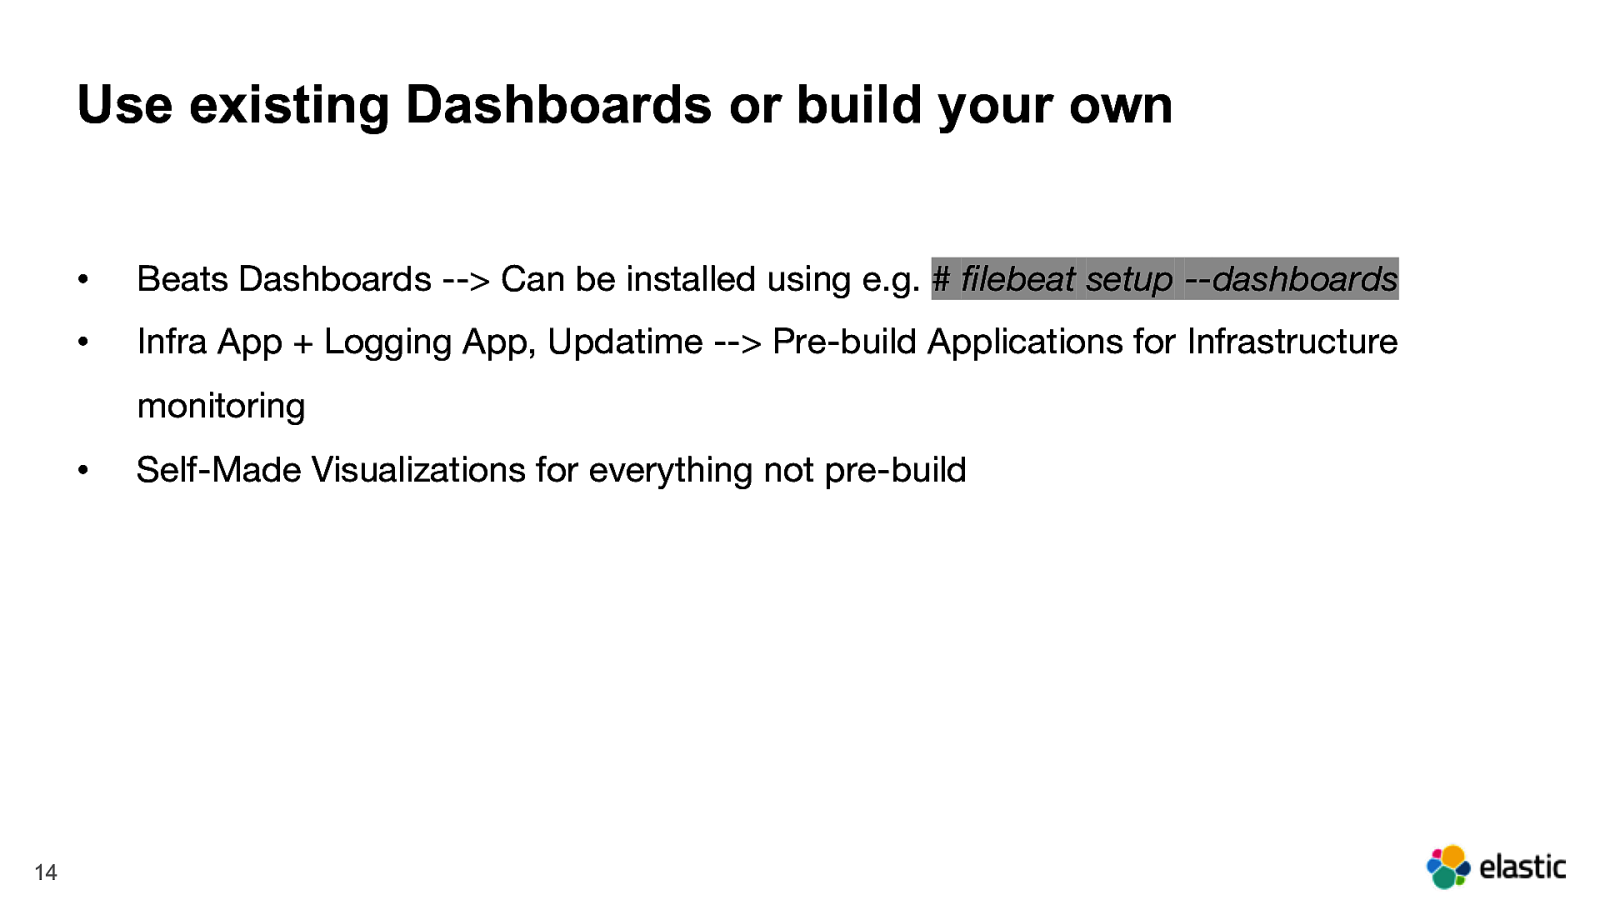
Use existing Dashboards or build your own • Beats Dashboards —> Can be installed using e.g. # filebeat setup —dashboards • Infra App + Logging App, Updatime —> Pre-build Applications for Infrastructure monitoring • 14 Self-Made Visualizations for everything not pre-build
Configure Alarming and Machine Learning Jobs* • Define and document alarms • Define and document ML Jobs • Create Alarms and ML Jobs
Need to connect external Systems Define your interfaces • External System à REST Interface available? • Other interfaces possbile? • Use ES and alarms or Logstash? 16
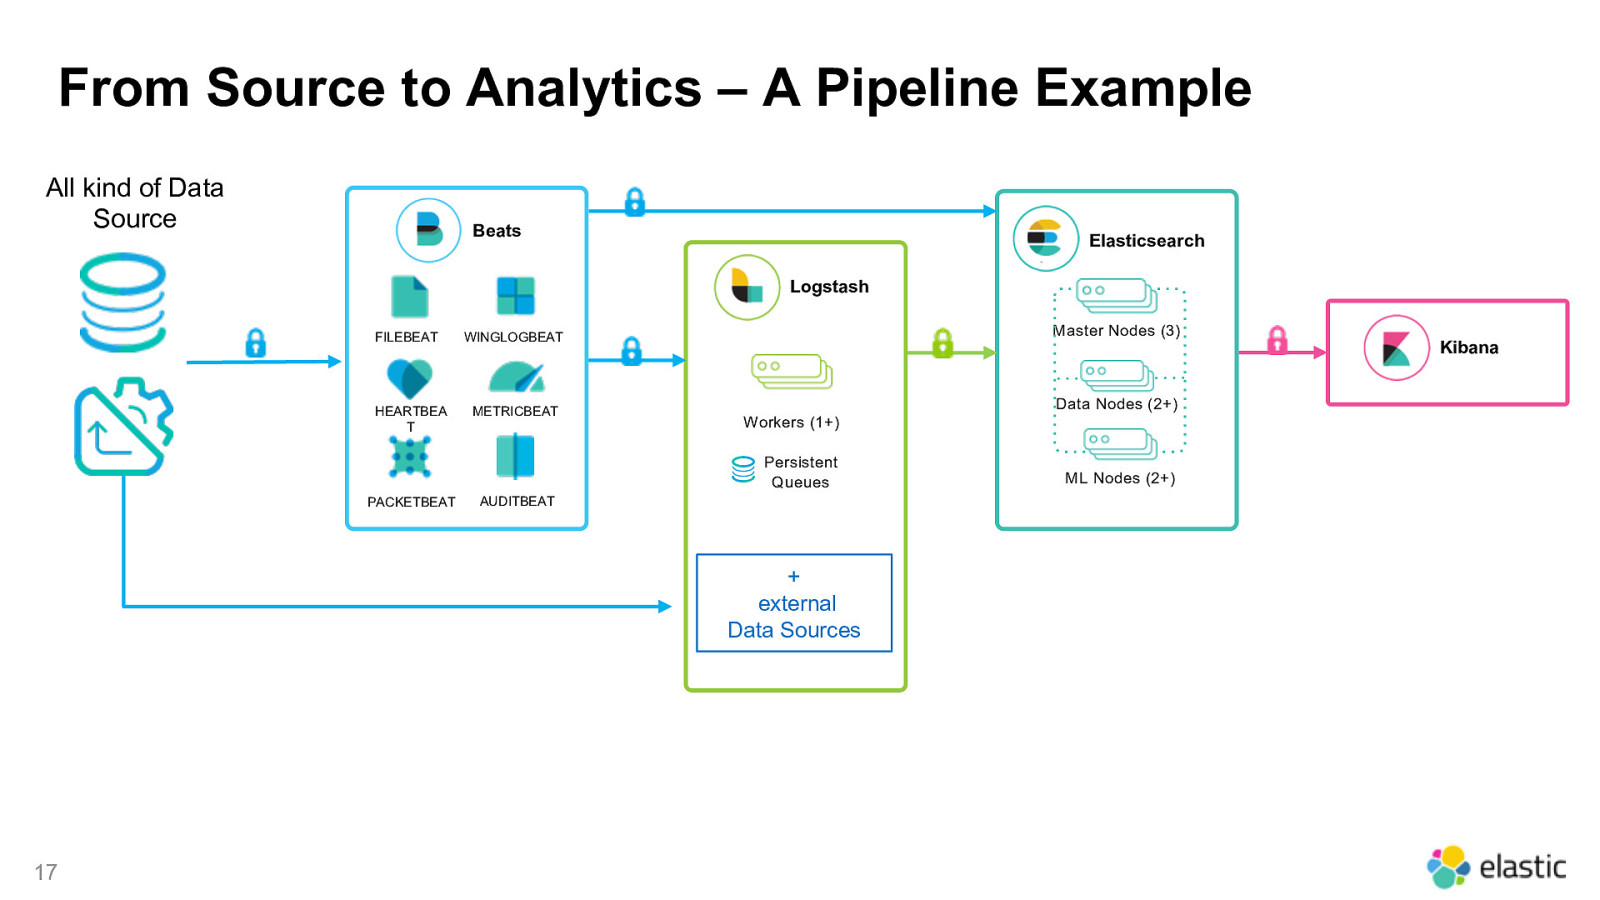
From Source to Analytics – A Pipeline Example All kind of Data Source Beats Elasticsearch Logstash FILEBEAT HEARTBEA T Master Nodes (3) WINGLOGBEAT METRICBEAT Data Nodes (2+) Workers (1+) Persistent Queues PACKETBEAT AUDITBEAT
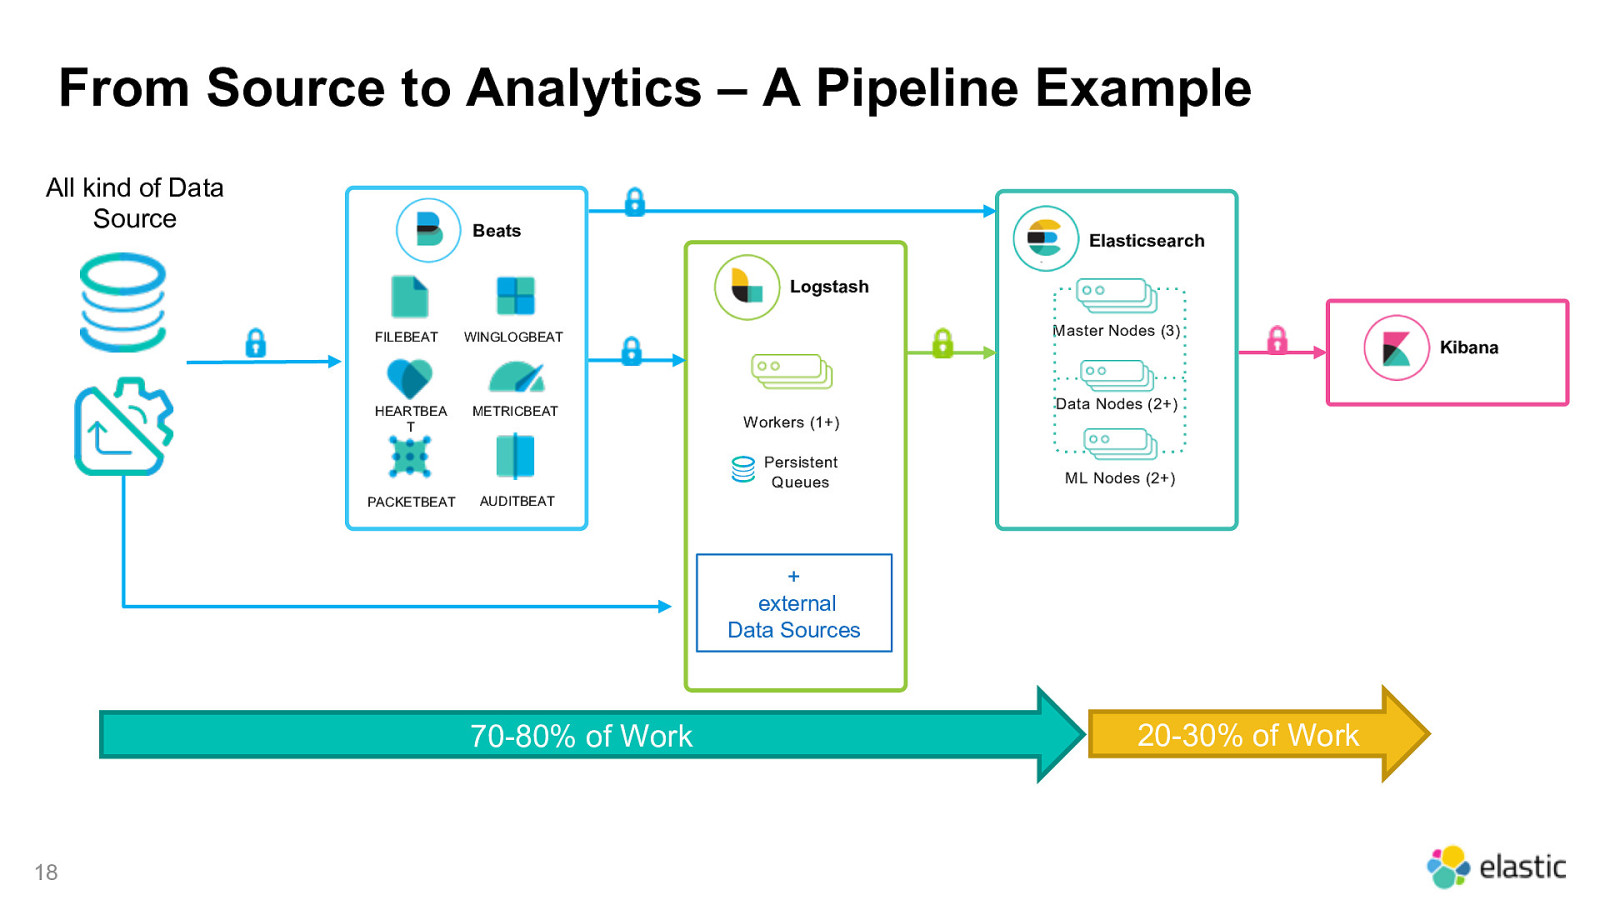
From Source to Analytics – A Pipeline Example All kind of Data Source Beats Elasticsearch Logstash FILEBEAT HEARTBEA T Master Nodes (3) WINGLOGBEAT METRICBEAT Data Nodes (2+) Workers (1+) Persistent Queues PACKETBEAT ML Nodes (2+) AUDITBEAT
The important foundation A “common schema” or “The Elastic Common Schema” 19
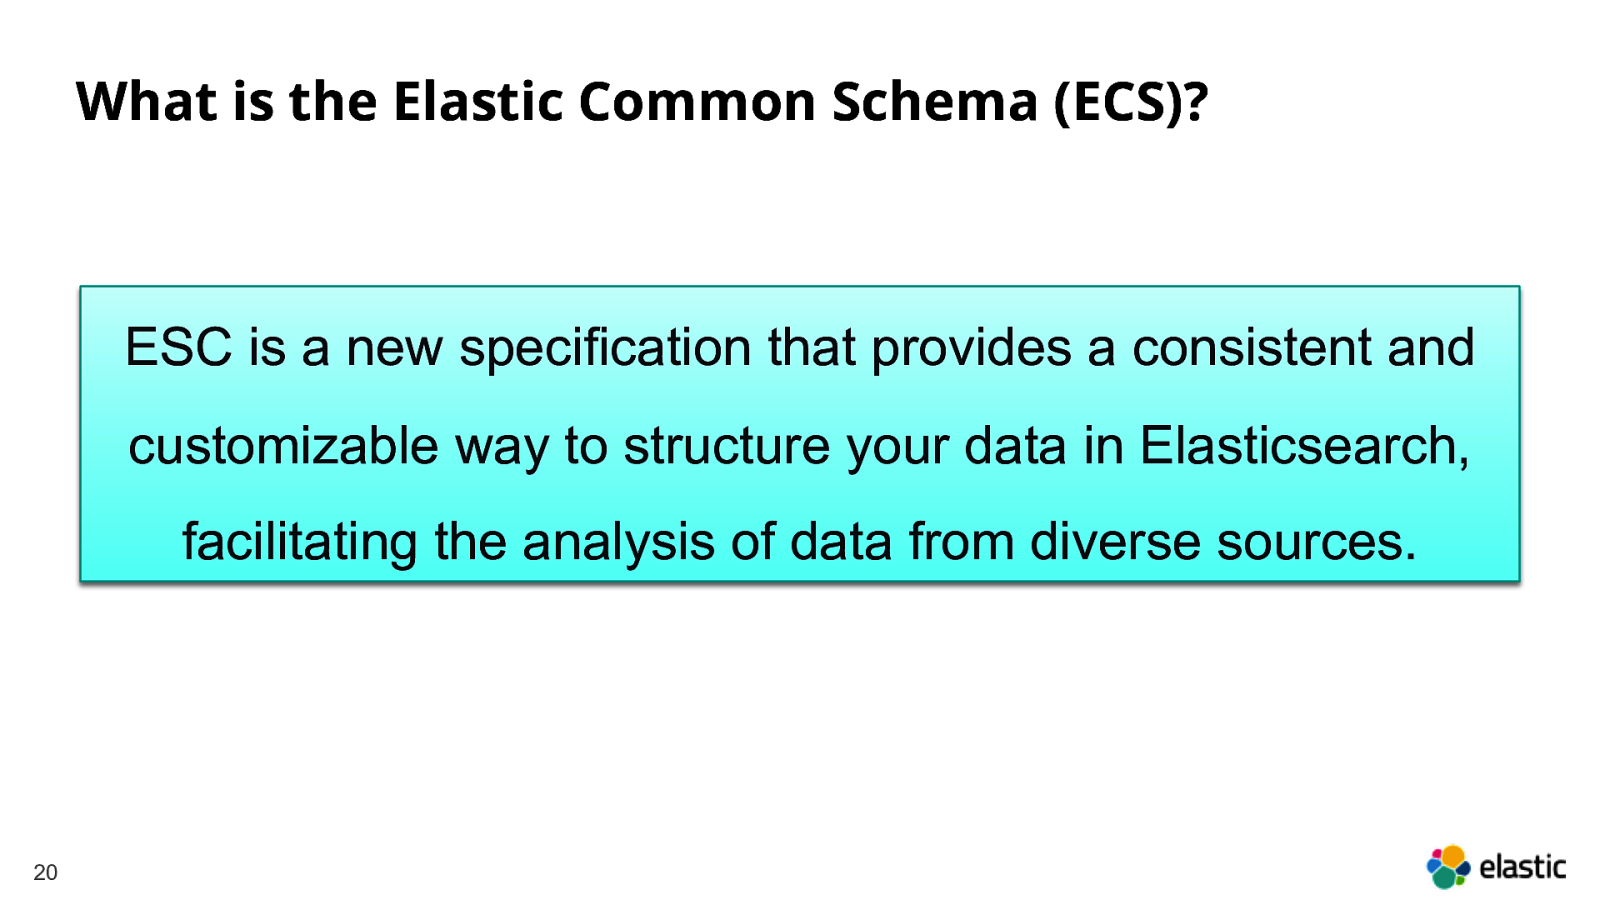
What is the Elastic Common Schema (ECS)? ESC is a new specification that provides a consistent and customizable way to structure your data in Elasticsearch, facilitating the analysis of data from diverse sources. 20
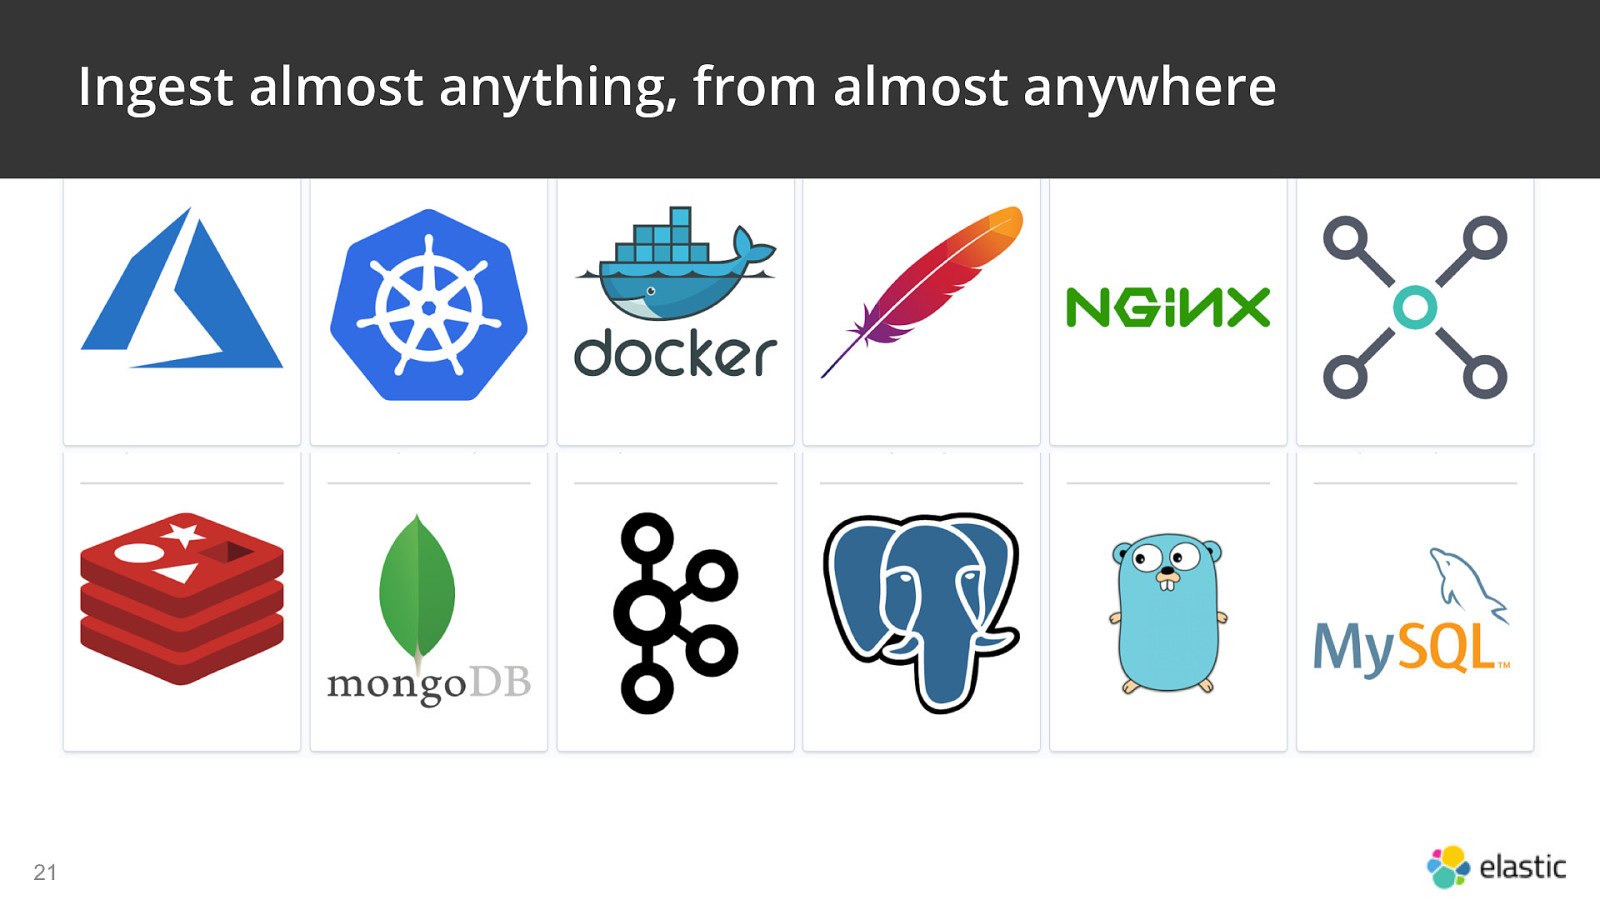
Ingest almost anything, from almost anywhere 21
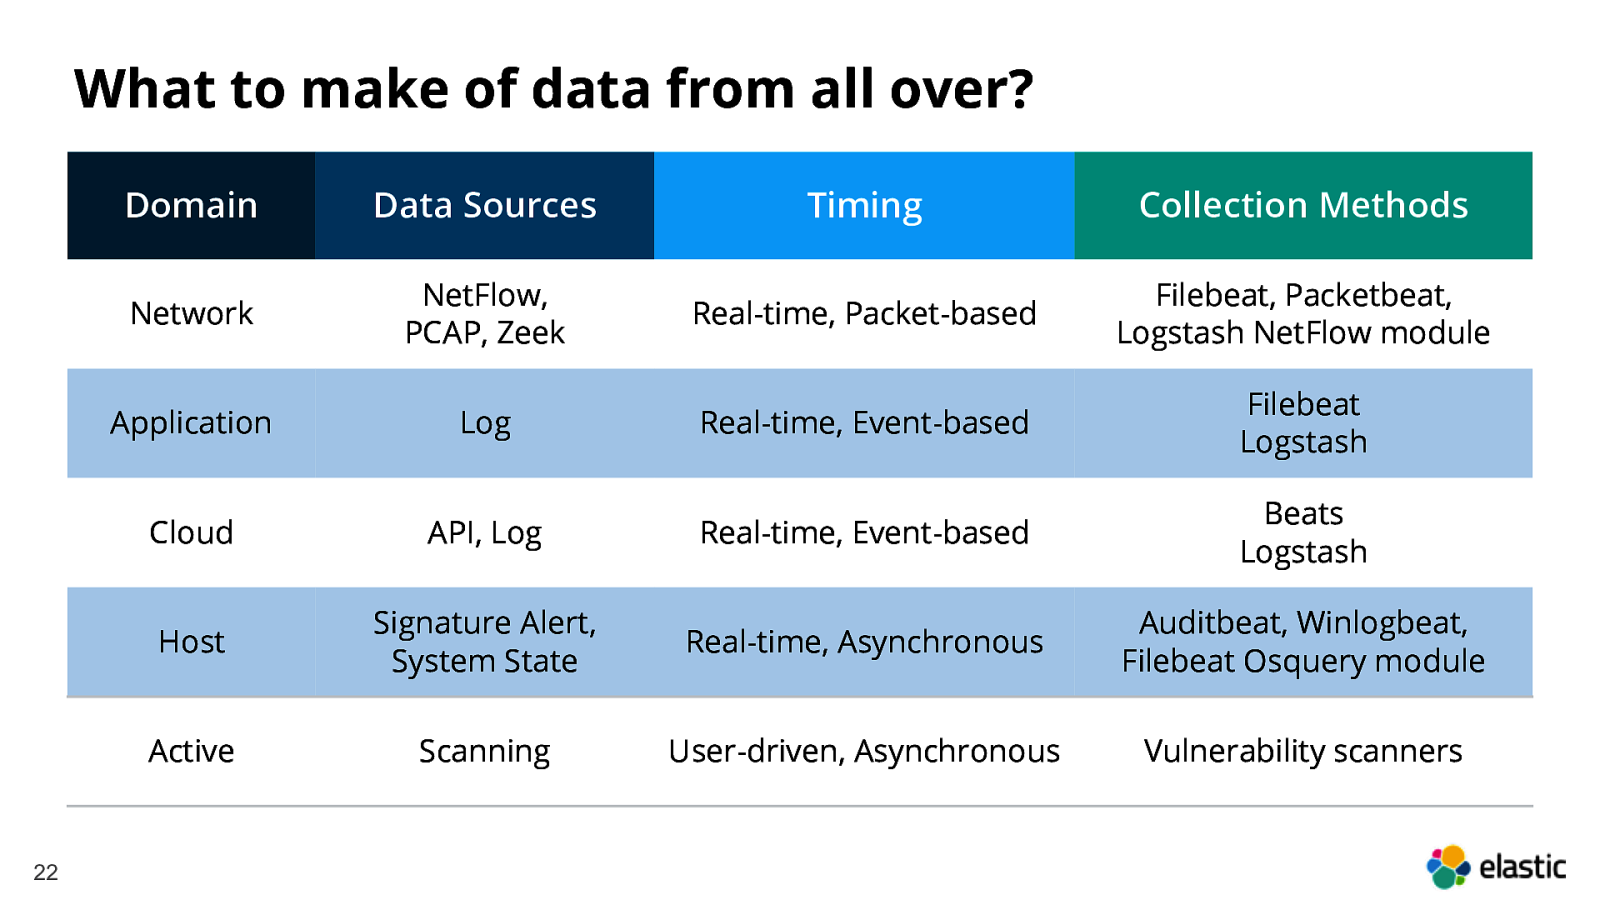
What to make of data from all over? 22 Domain Data Sources Timing Collection Methods Network NetFlow, PCAP, Zeek Real-time, Packet-based Filebeat, Packetbeat, Logstash NetFlow module Application Log Real-time, Event-based Filebeat Logstash Cloud API, Log Real-time, Event-based Beats Logstash Host Signature Alert, System State Real-time, Asynchronous Auditbeat, Winlogbeat, Filebeat Osquery module Active Scanning User-driven, Asynchronous Vulnerability scanners
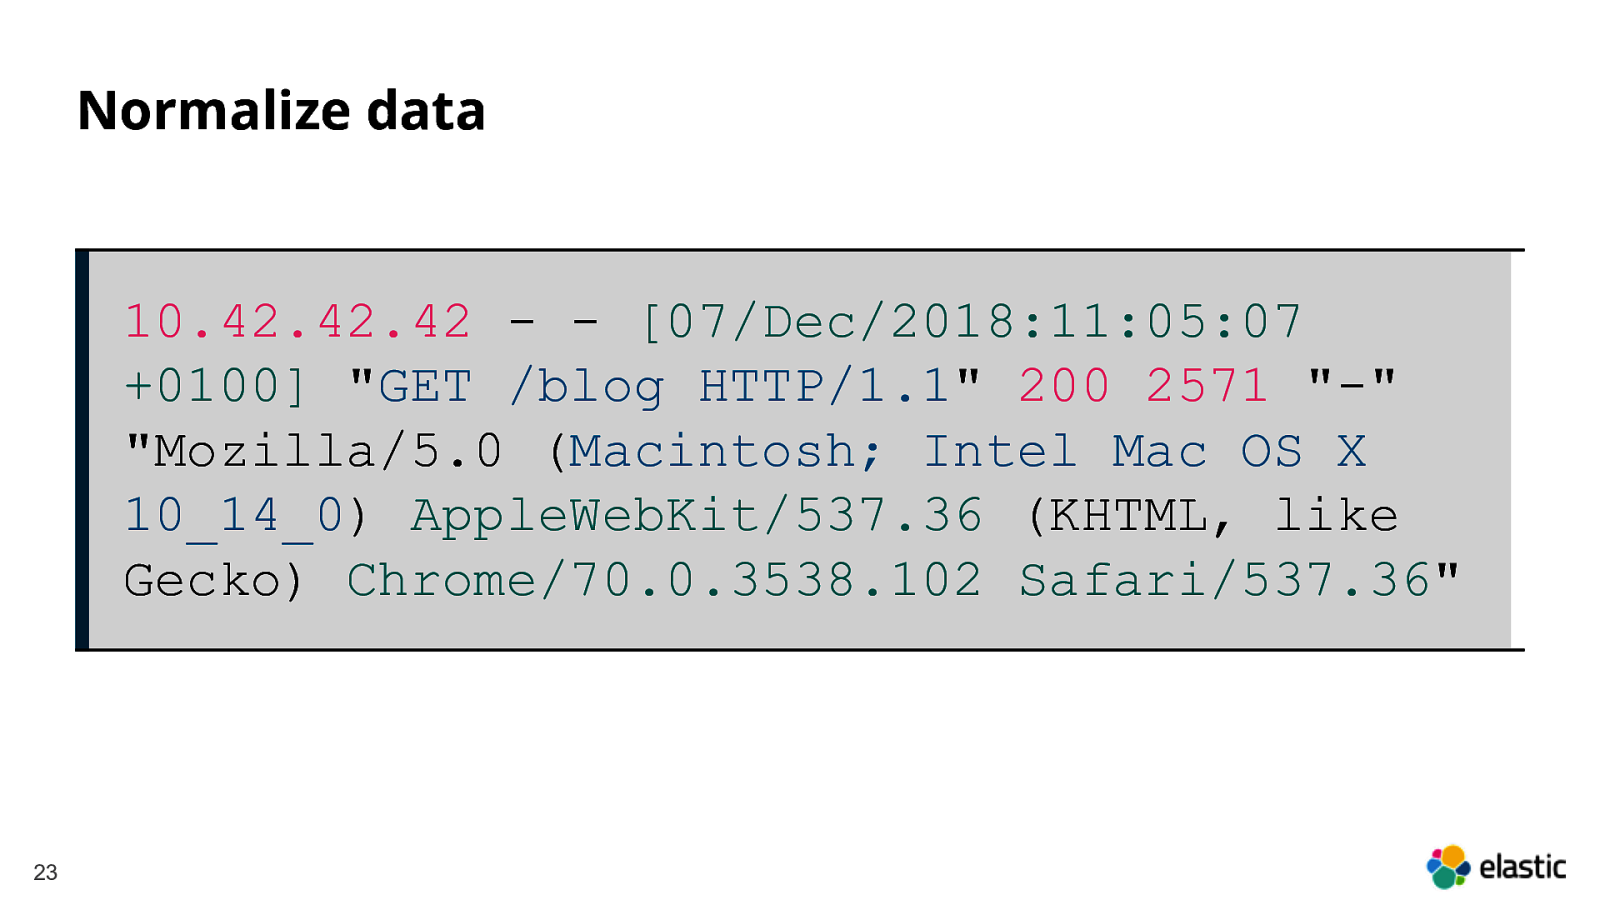
Normalize data 10.42.42.42 - - [07/Dec/2018:11:05:07 +0100] “GET /blog HTTP/1.1” 200 2571 “-” “Mozilla/5.0 (Macintosh; Intel Mac OS X 10_14_0) AppleWebKit/537.36 (KHTML, like Gecko) Chrome/70.0.3538.102 Safari/537.36” 23
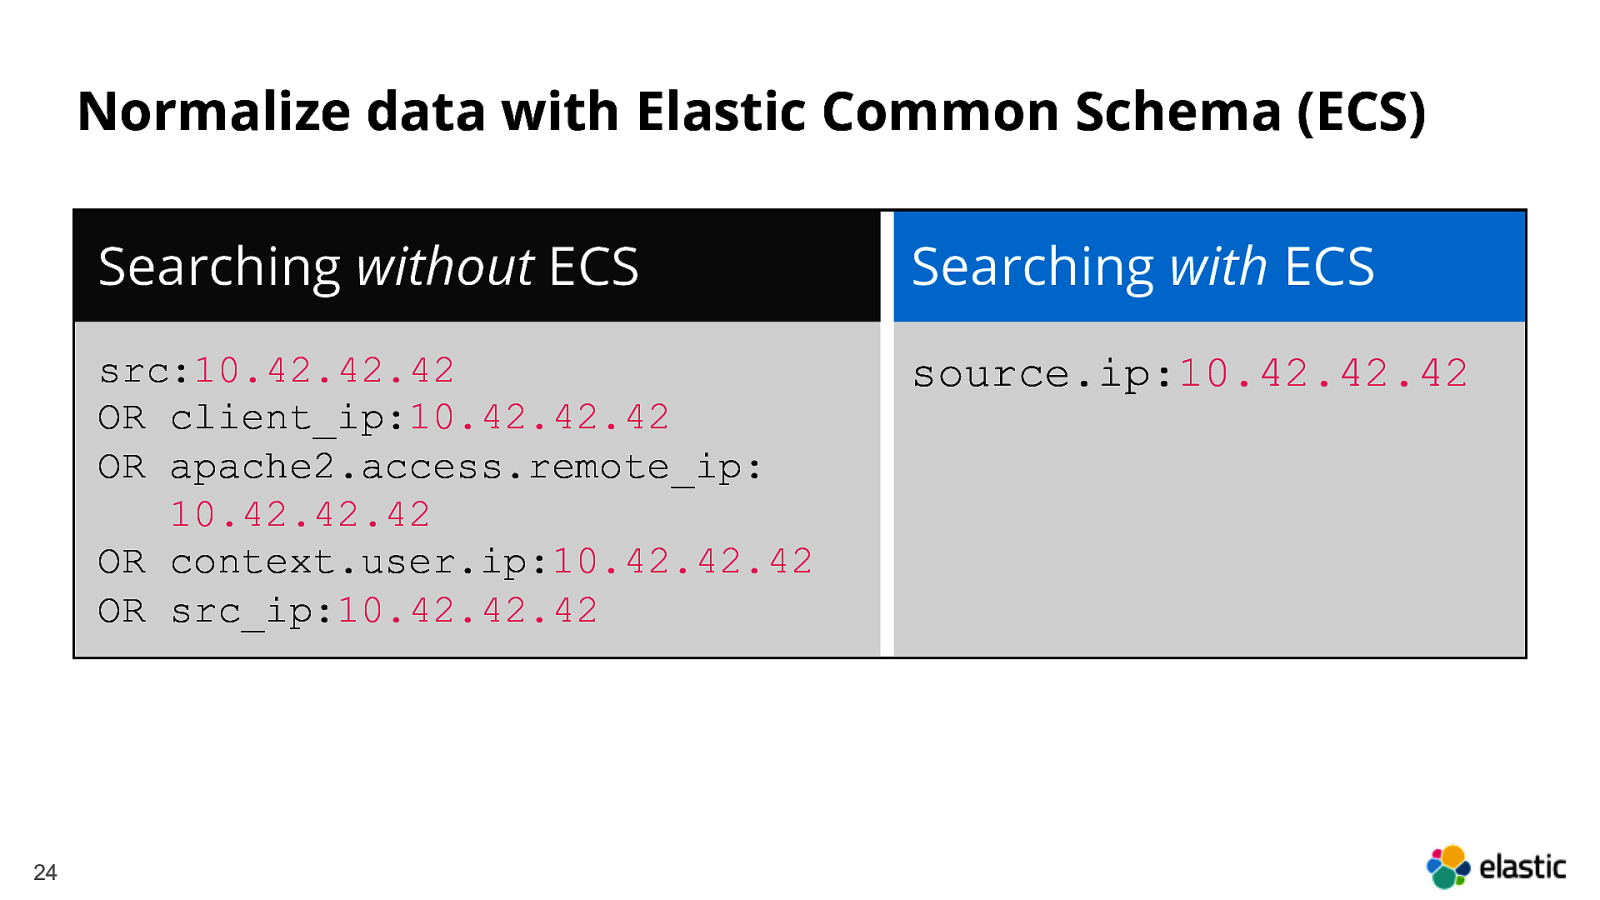
Normalize data with Elastic Common Schema (ECS) 24 Searching without ECS Searching with ECS src:10.42.42.42 OR client_ip:10.42.42.42 OR apache2.access.remote_ip: 10.42.42.42 OR context.user.ip:10.42.42.42 OR src_ip:10.42.42.42 source.ip:10.42.42.42
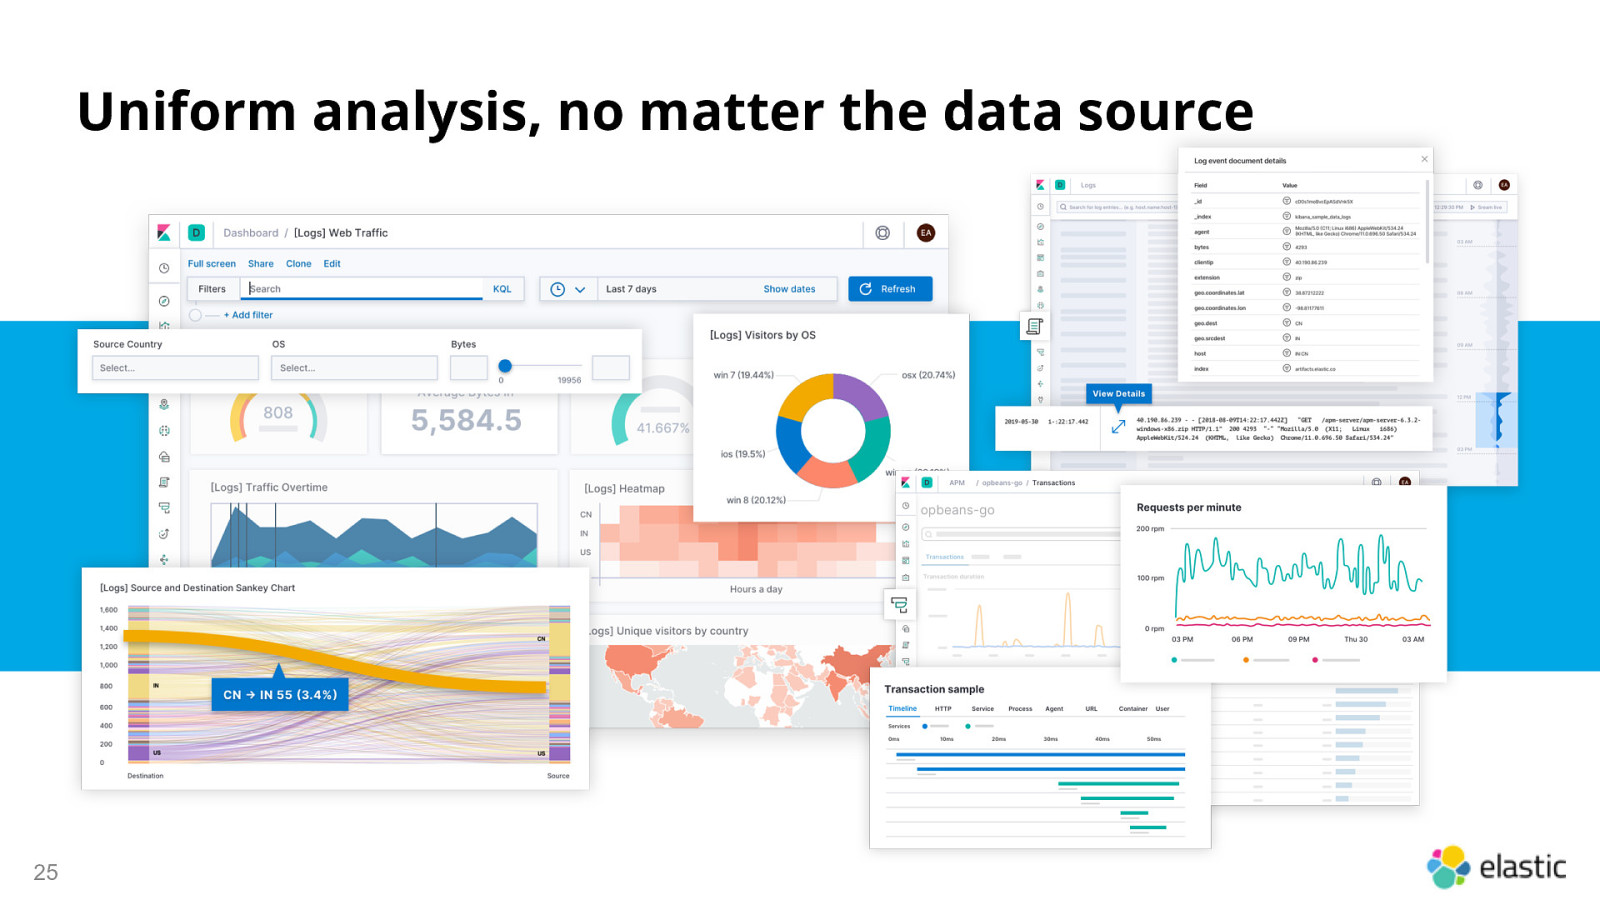
Uniform analysis, no matter the data source 25
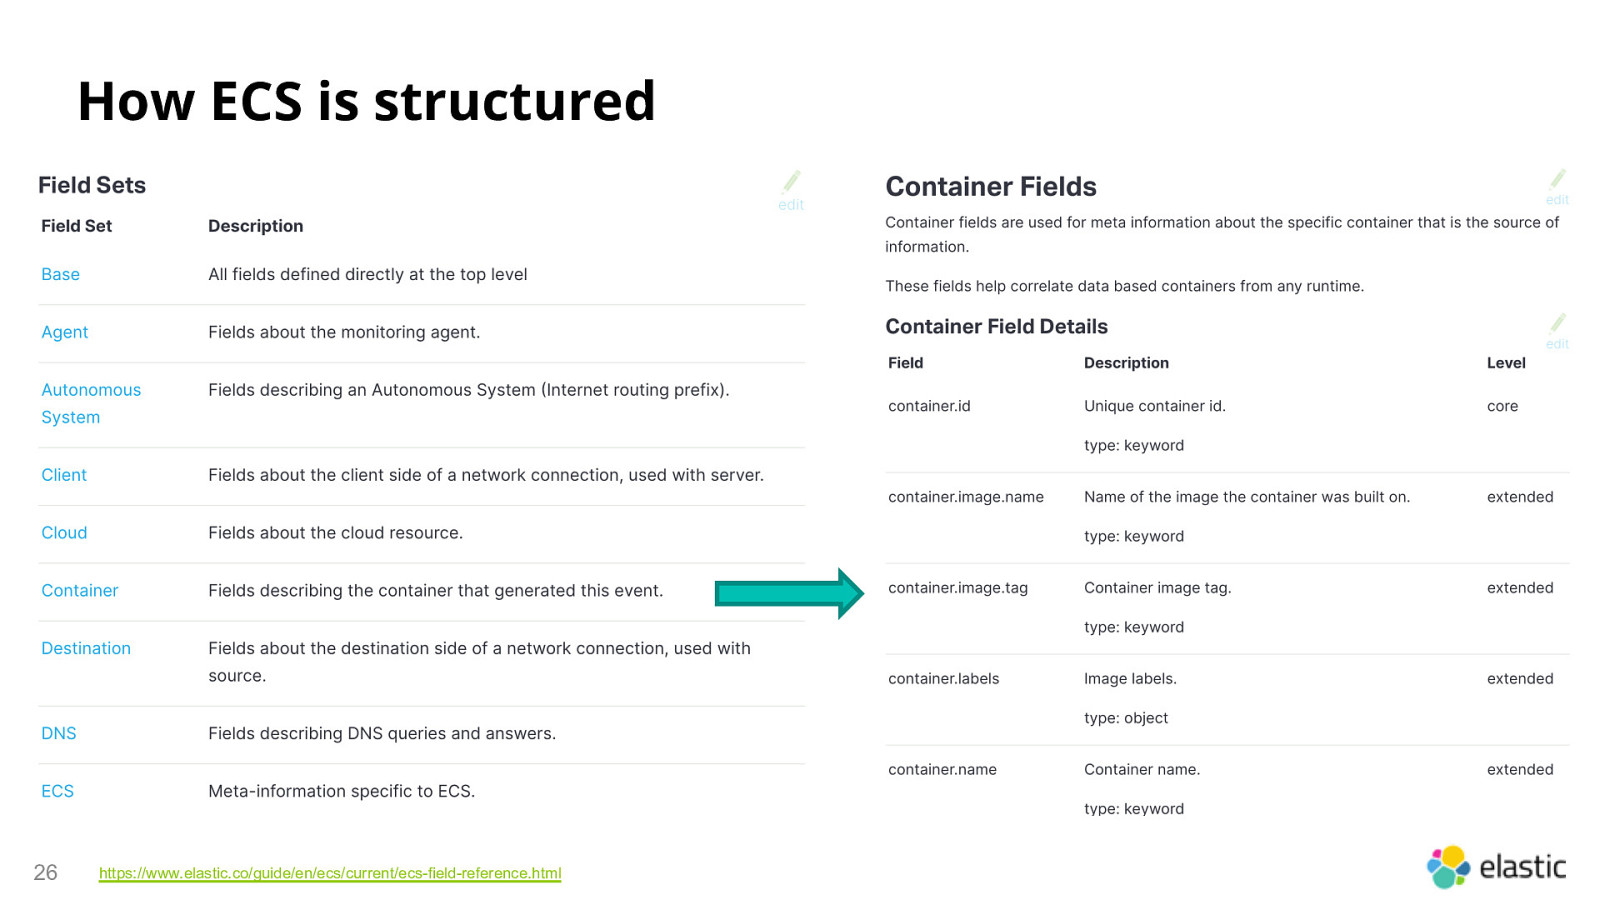
How ECS is structured 26 https://www.elastic.co/guide/en/ecs/current/ecs-field-reference.html
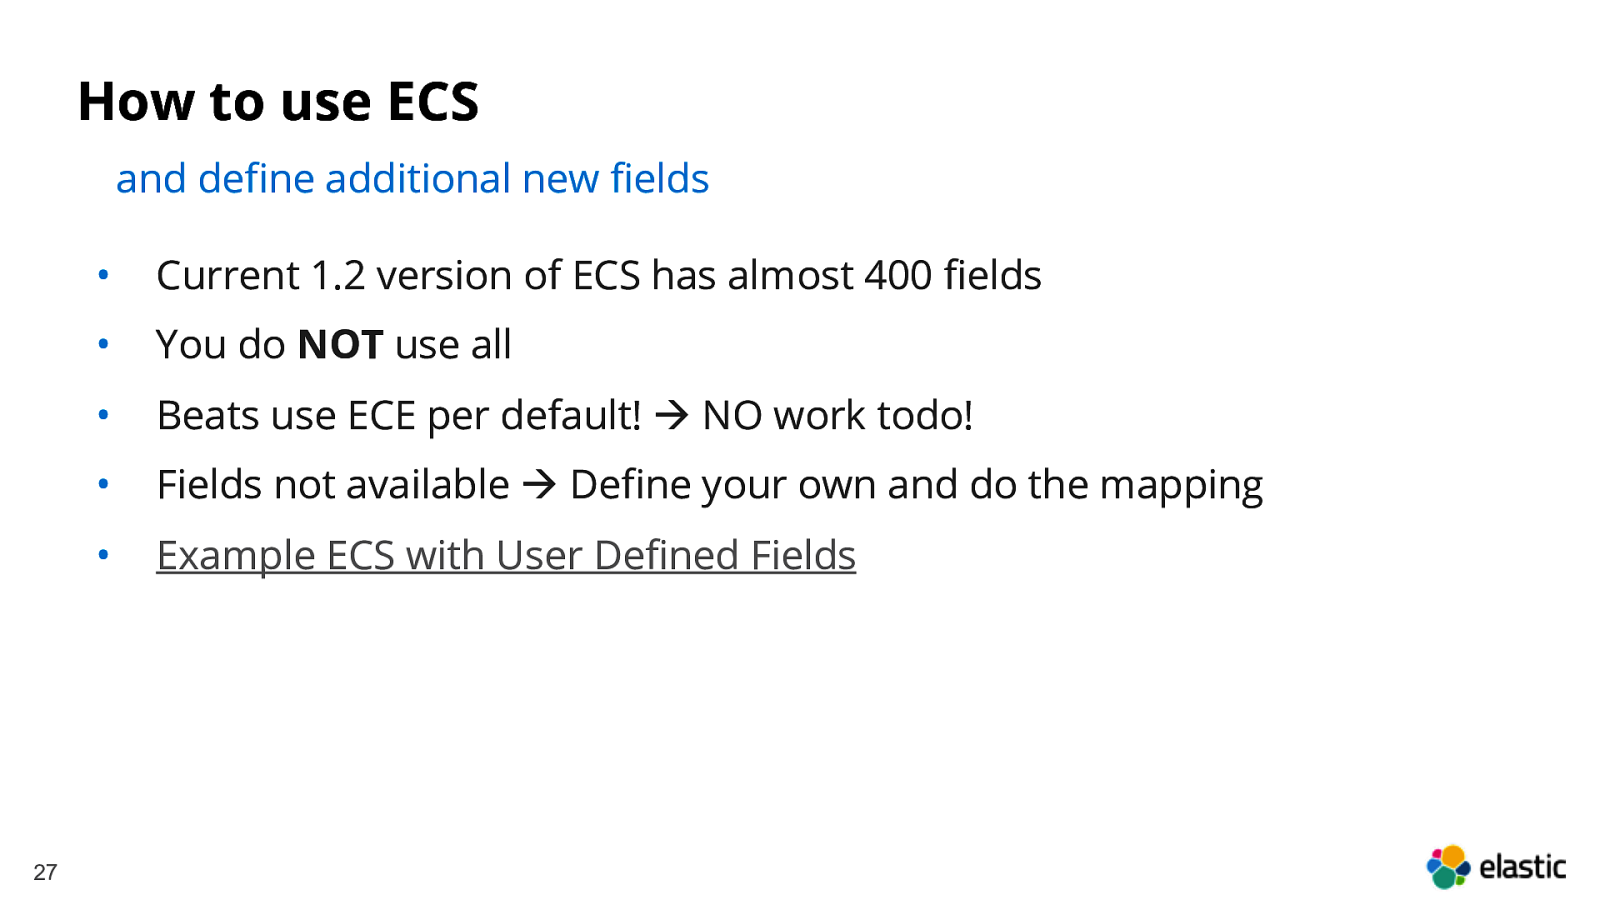
How to use ECS and define additional new fields 27 • Current 1.2 version of ECS has almost 400 fields • You do NOT use all • Beats use ECE per default! à NO work todo! • Fields not available à Define your own and do the mapping • Example ECS with User Defined Fields
Index Templates … and how to use them 28
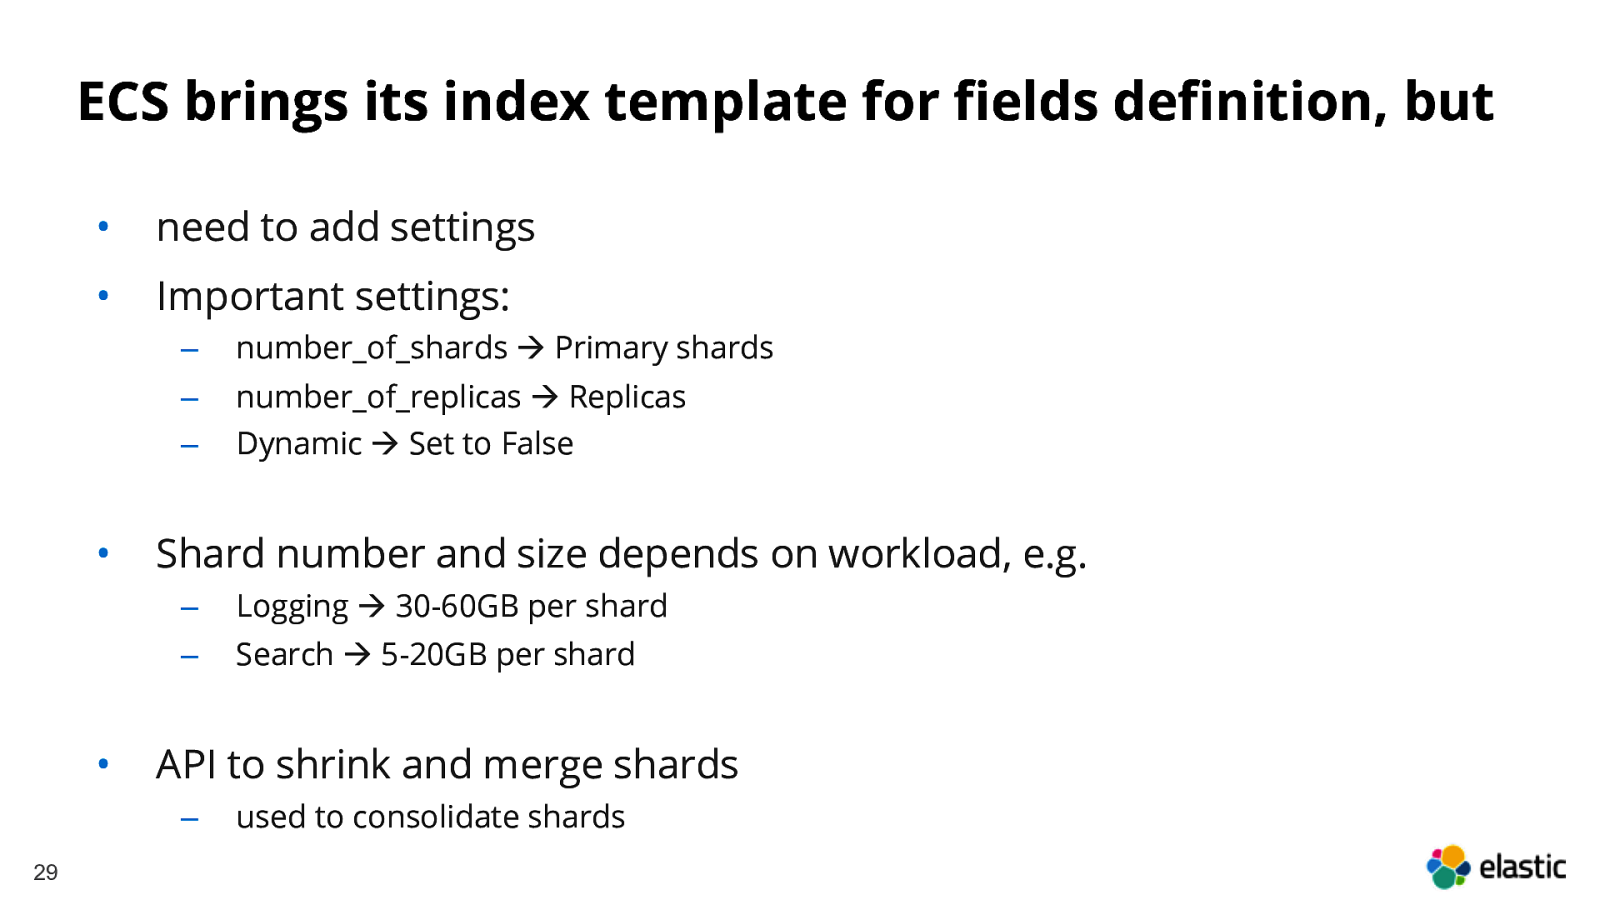
ECS brings its index template for fields definition, but • need to add settings • Important settings: • • ‒ number_of_shards à Primary shards ‒ ‒ number_of_replicas à Replicas Dynamic à Set to False Shard number and size depends on workload, e.g. ‒ Logging à 30-60GB per shard ‒ Search à 5-20GB per shard API to shrink and merge shards ‒ 29 used to consolidate shards
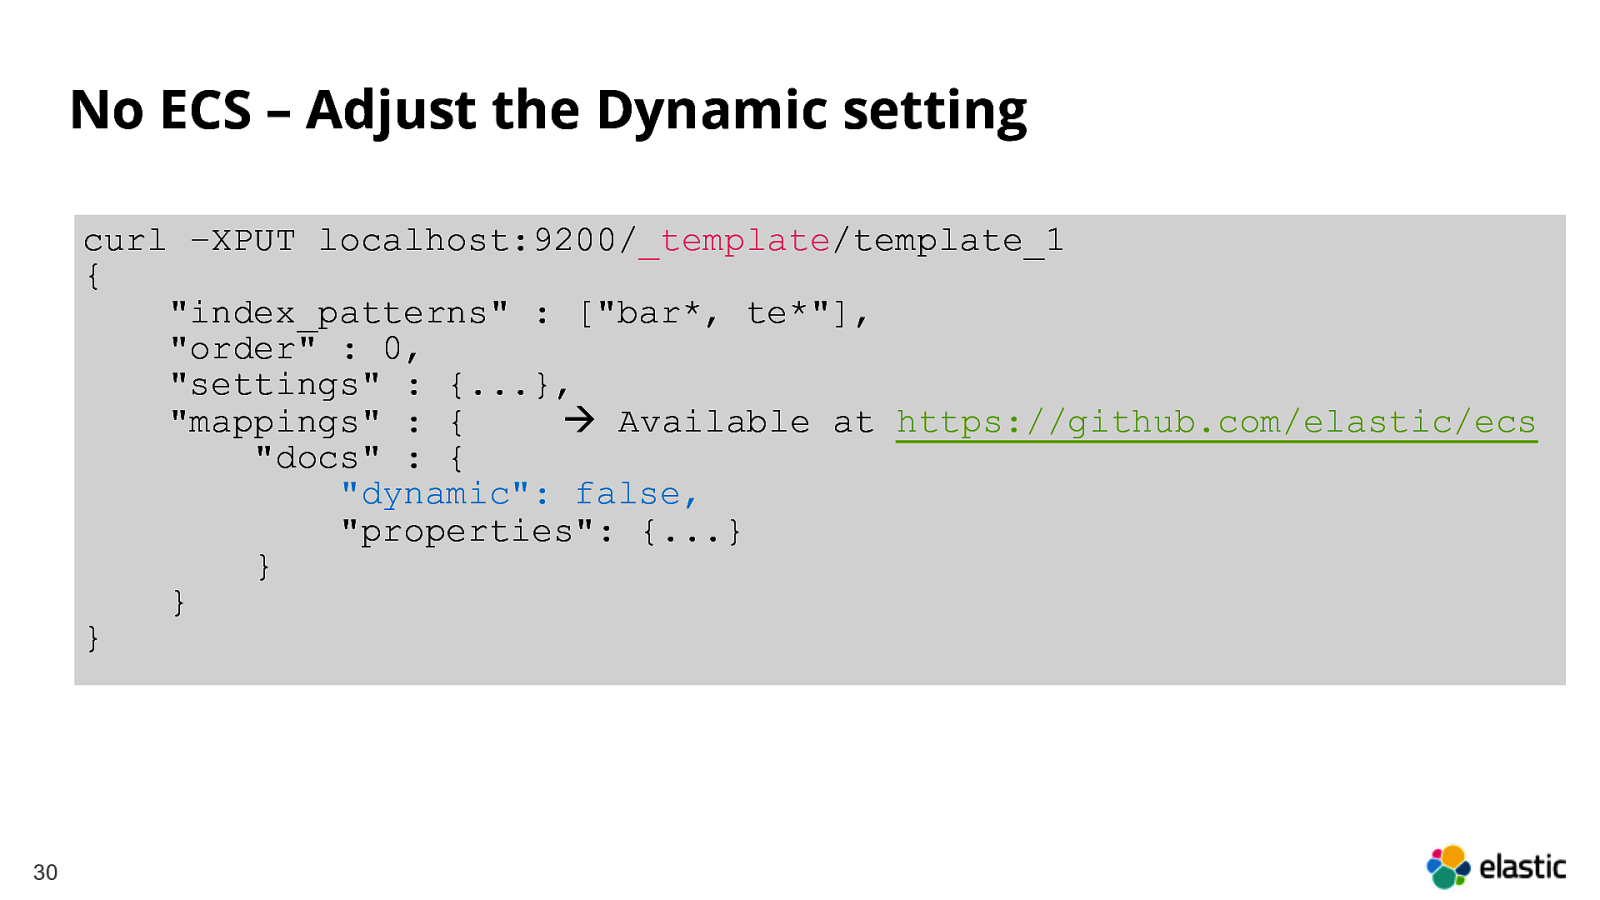
No ECS – Adjust the Dynamic setting curl –XPUT localhost:9200/_template/template_1 { “index_patterns” : [“bar*, te*”], “order” : 0, “settings” : {…}, “mappings” : { à Available at https://github.com/elastic/ecs “docs” : { “dynamic”: false, “properties”: {…} } } } 30
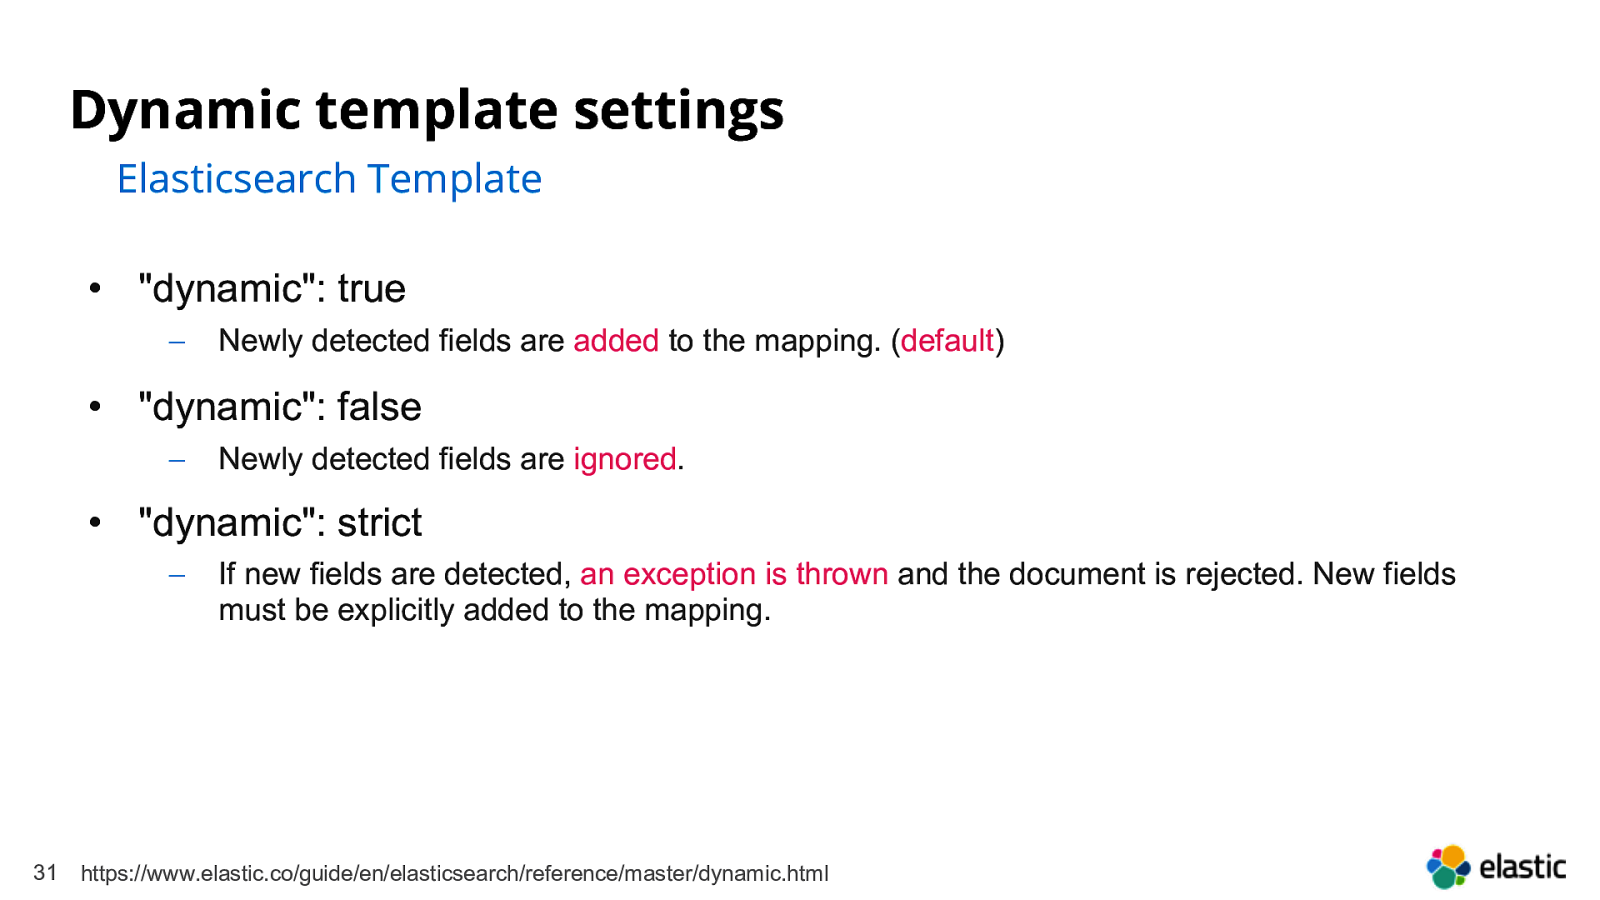
Dynamic template settings Elasticsearch Template • “dynamic”: true - Newly detected fields are added to the mapping. (default) • “dynamic”: false - Newly detected fields are ignored. • “dynamic”: strict - 31 If new fields are detected, an exception is thrown and the document is rejected. New fields must be explicitly added to the mapping. https://www.elastic.co/guide/en/elasticsearch/reference/master/dynamic.html
Preparing a cluster for scale Some important considerations 32
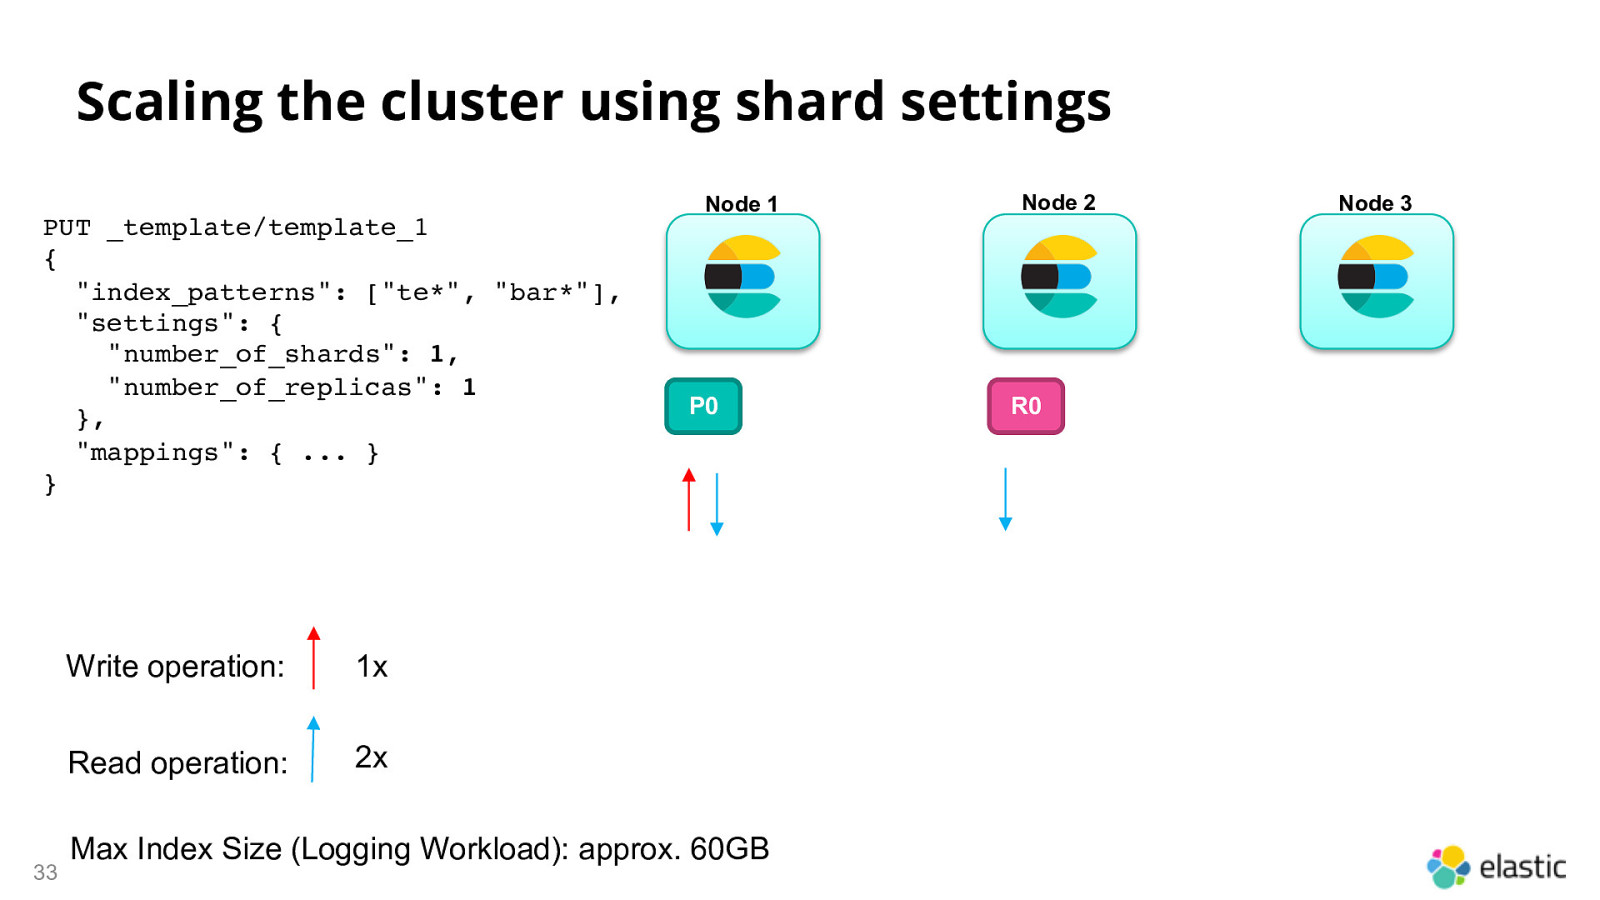
Scaling the cluster using shard settings PUT _template/template_1 { “index_patterns”: [“te*”, “bar*”], “settings”: { “number_of_shards”: 1, “number_of_replicas”: 1 }, “mappings”: { … } } 33 Write operation: 1x Read operation: 2x Node 1 P0 Max Index Size (Logging Workload): approx. 60GB Node 2 R0 Node 3
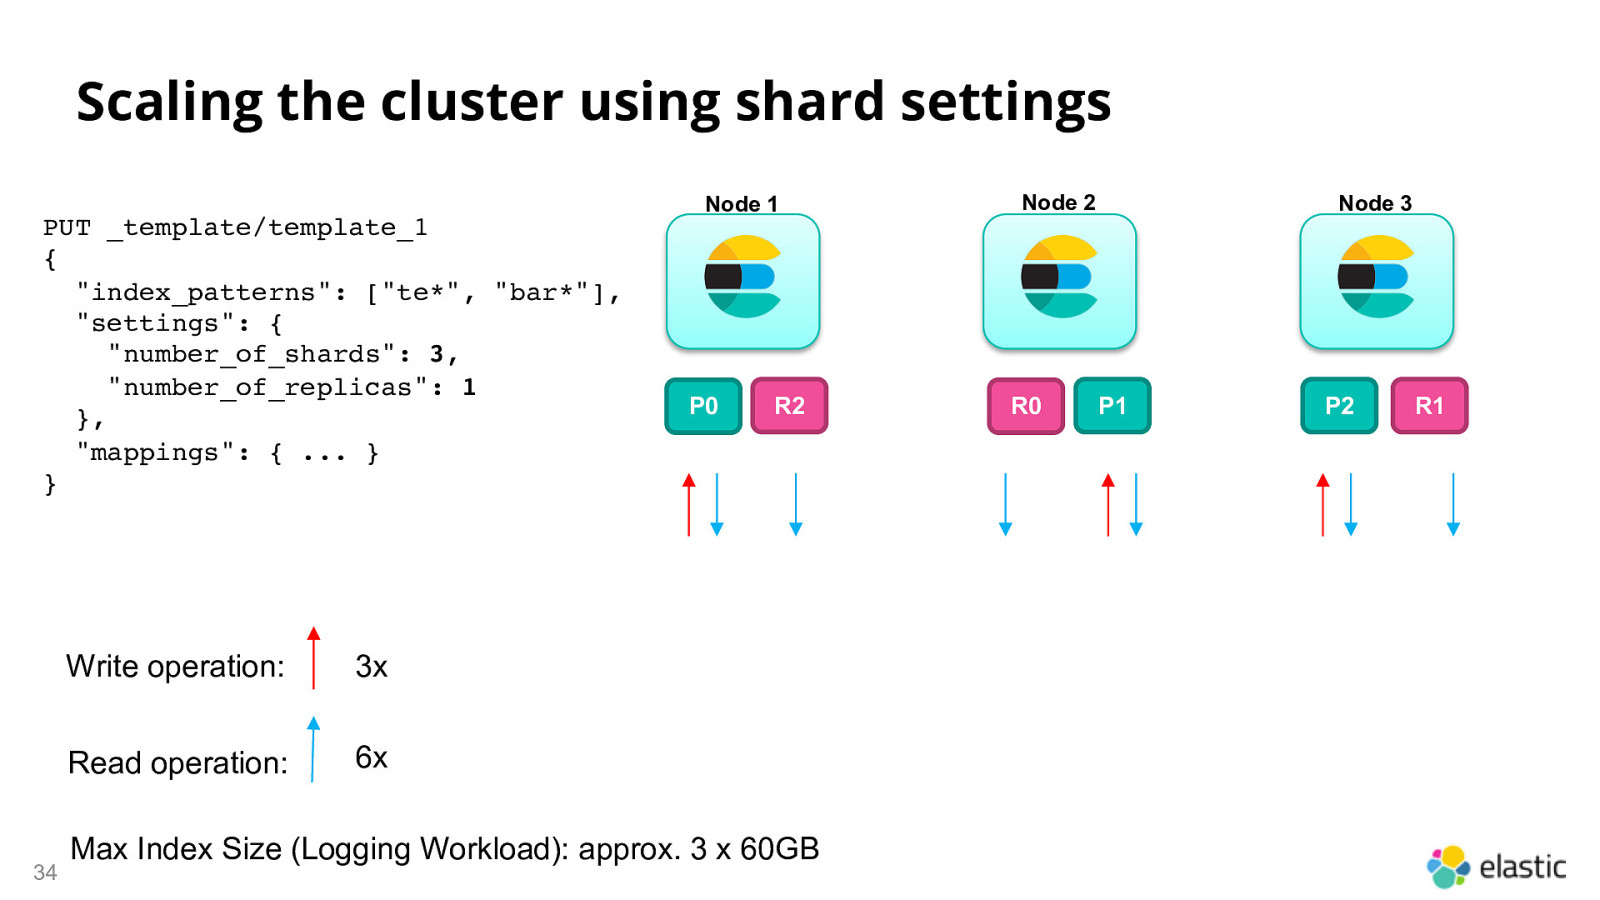
Scaling the cluster using shard settings PUT _template/template_1 { “index_patterns”: [“te*”, “bar*”], “settings”: { “number_of_shards”: 3, “number_of_replicas”: 1 }, “mappings”: { … } } 34 Write operation: 3x Read operation: 6x Node 1 P0 R2 Max Index Size (Logging Workload): approx. 3 x 60GB Node 2 R0 Node 3 P1 P2 R1
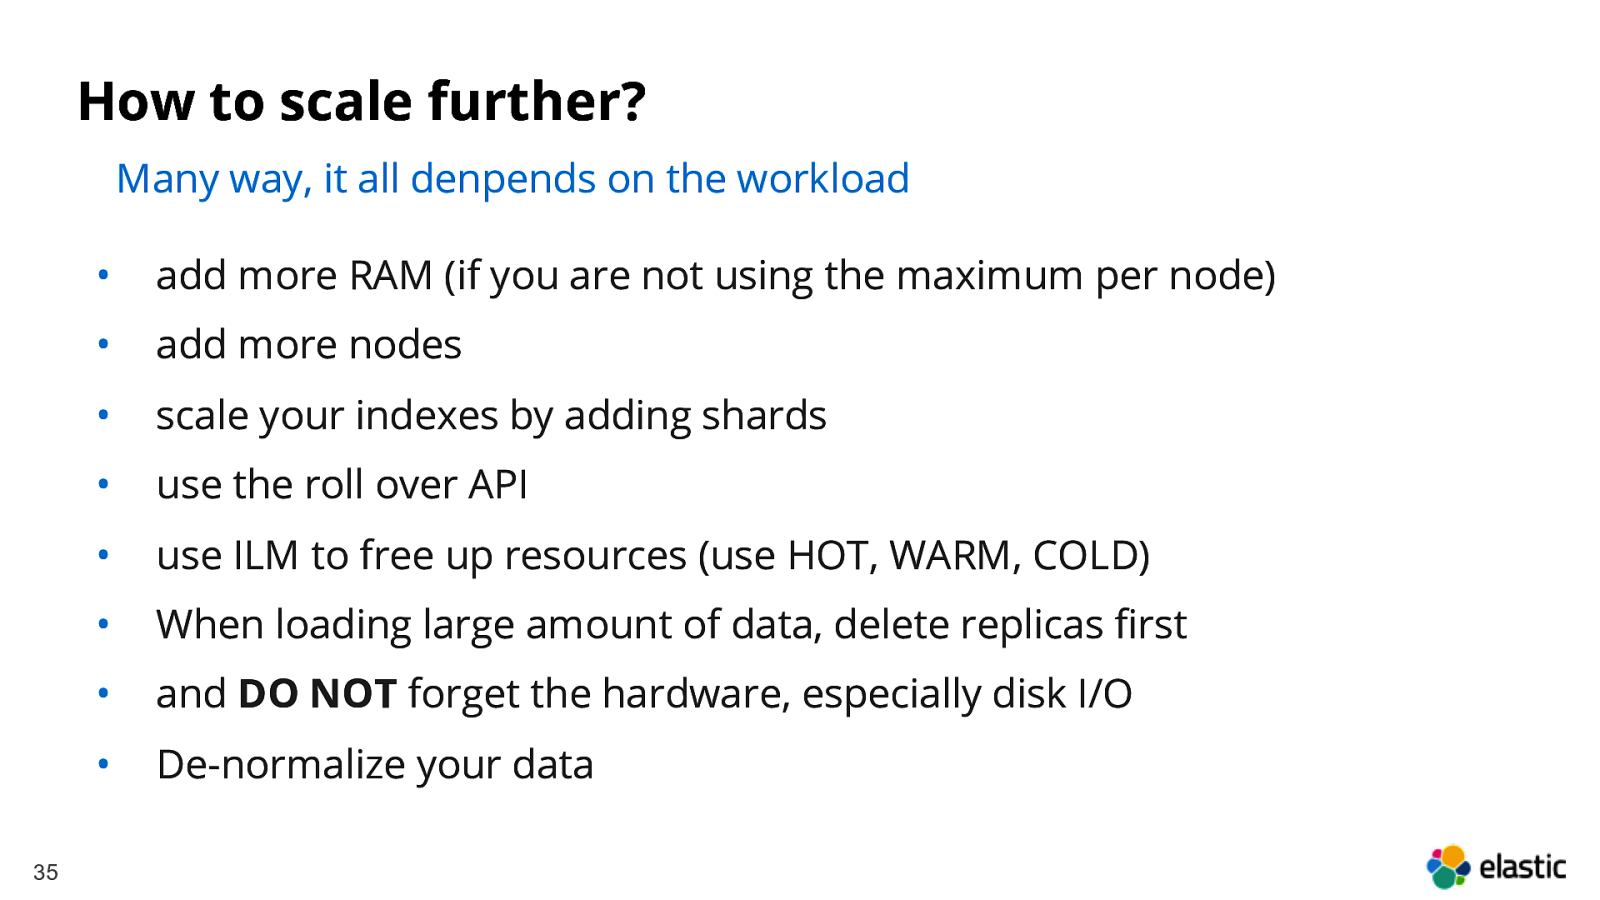
How to scale further? Many way, it all denpends on the workload 35 • add more RAM (if you are not using the maximum per node) • add more nodes • scale your indexes by adding shards • use the roll over API • use ILM to free up resources (use HOT, WARM, COLD) • When loading large amount of data, delete replicas first • and DO NOT forget the hardware, especially disk I/O • De-normalize your data
What to avoid? • 36 TOO many shards and indexes ‒ Often comes from small indexes rolled over every day ‒ If daily ingest is in MB or small GB numbers, roll over every week or month with that index. ‒ Different index, different treat! • Slow I/O • Trying to mimic a SQL database schema –-> De-normalization is key
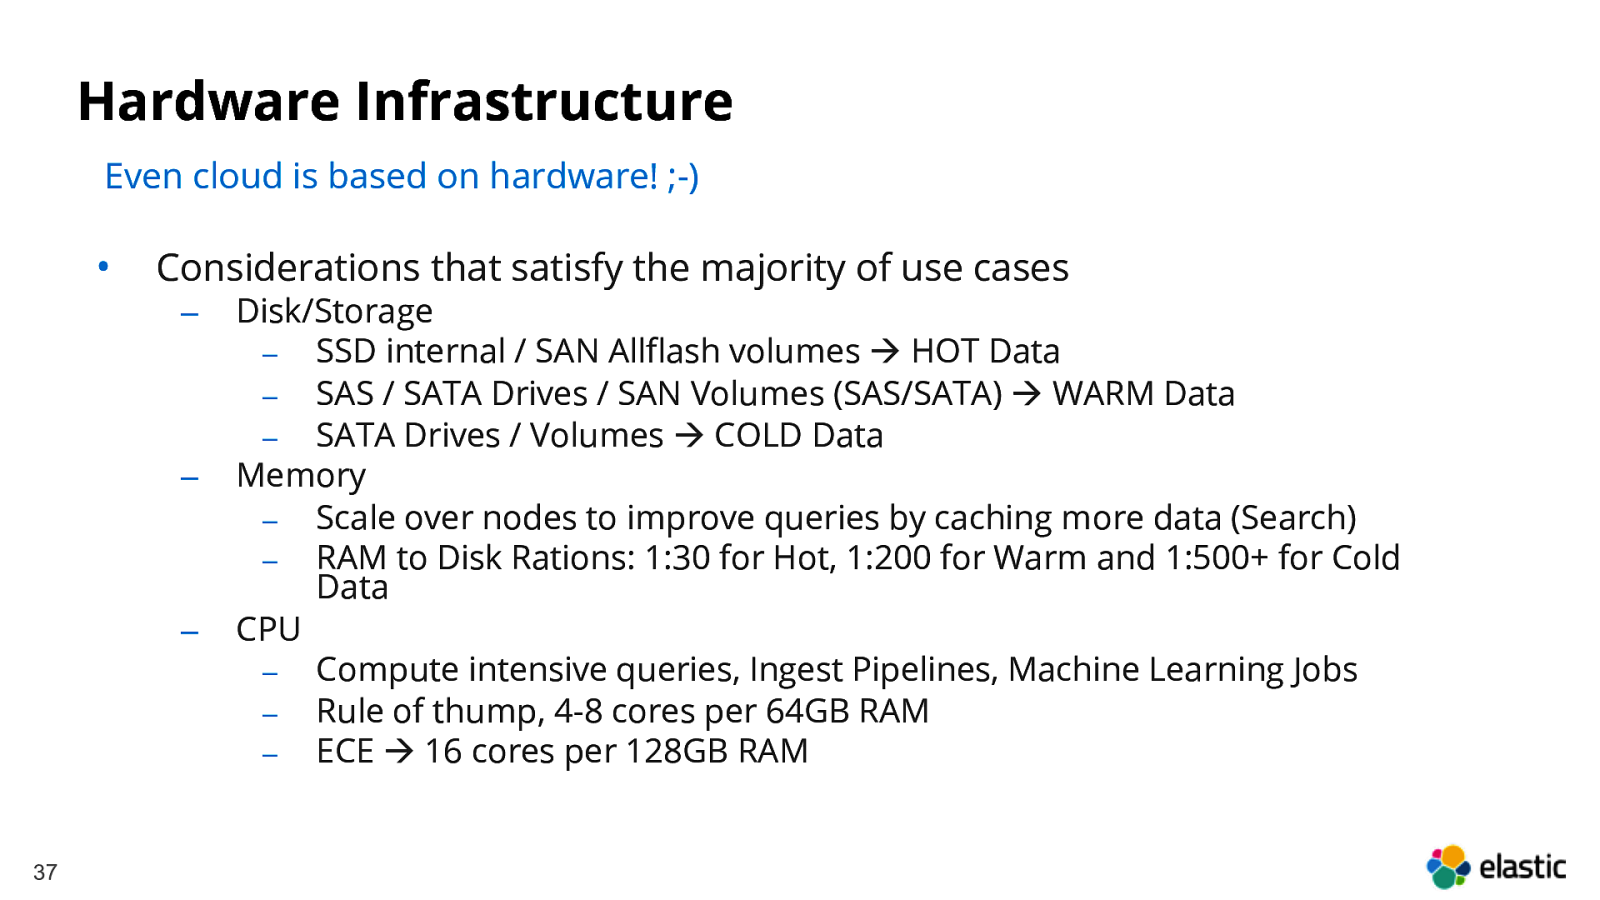
Hardware Infrastructure Even cloud is based on hardware! ;-) • Considerations that satisfy the majority of use cases ‒ ‒ ‒ 37 Disk/Storage ‒ SSD internal / SAN Allflash volumes à HOT Data ‒ SAS / SATA Drives / SAN Volumes (SAS/SATA) à WARM Data ‒ SATA Drives / Volumes à COLD Data Memory ‒ Scale over nodes to improve queries by caching more data (Search) ‒ RAM to Disk Rations: 1:30 for Hot, 1:200 for Warm and 1:500+ for Cold Data CPU ‒ Compute intensive queries, Ingest Pipelines, Machine Learning Jobs ‒ Rule of thump, 4-8 cores per 64GB RAM ‒ ECE à 16 cores per 128GB RAM
Index Lifecycle Management Good by curator – Welcome ILM policy 38
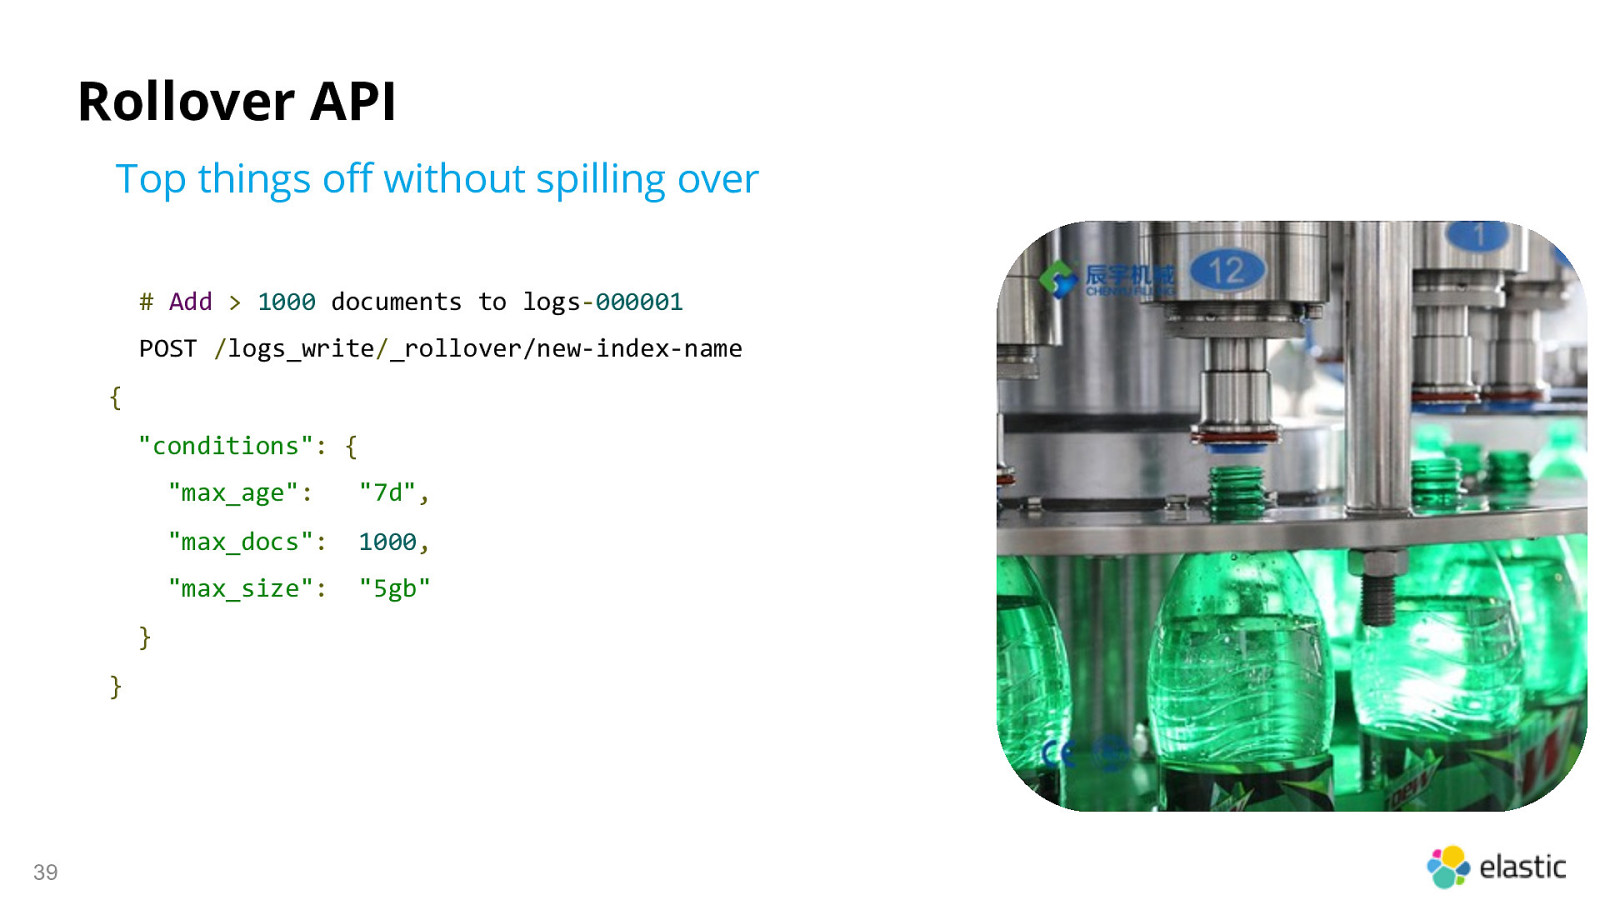
Rollover API Top things off without spilling over # Add > 1000 documents to logs-000001 POST /logs_write/_rollover/new-index-name { “conditions”: { } } 39 “max_age”: “7d”, “max_docs”: 1000, “max_size”: “5gb”
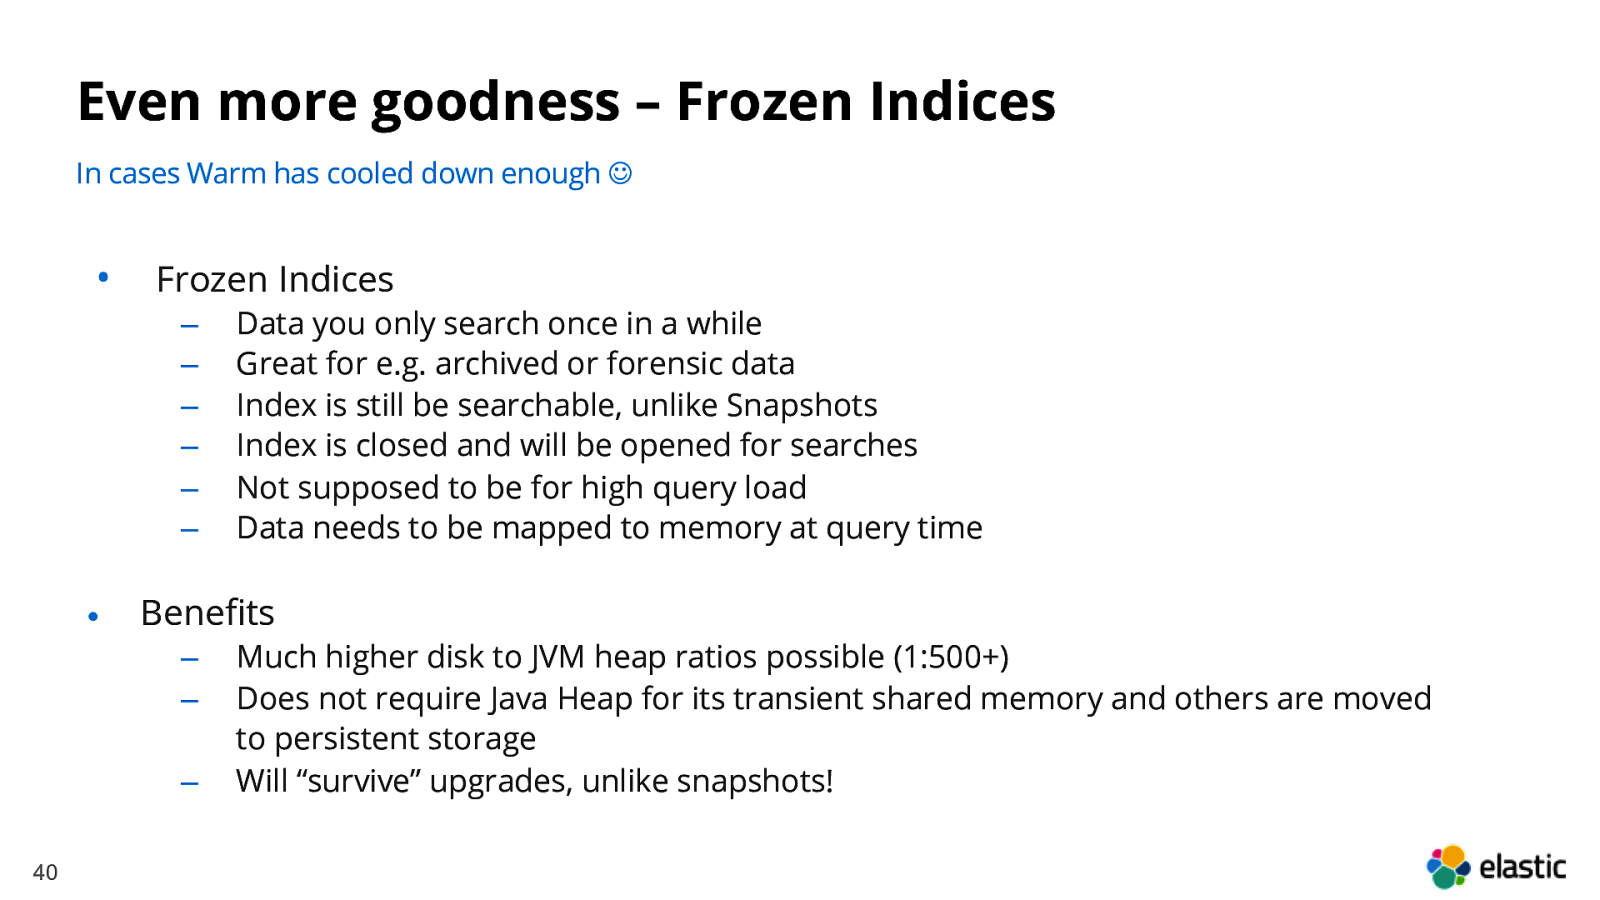
Even more goodness – Frozen Indices In cases Warm has cooled down enough J • Frozen Indices ‒ ‒ ‒ ‒ ‒ ‒ • Benefits ‒ ‒ ‒ 40 Data you only search once in a while Great for e.g. archived or forensic data Index is still be searchable, unlike Snapshots Index is closed and will be opened for searches Not supposed to be for high query load Data needs to be mapped to memory at query time Much higher disk to JVM heap ratios possible (1:500+) Does not require Java Heap for its transient shared memory and others are moved to persistent storage Will “survive” upgrades, unlike snapshots!
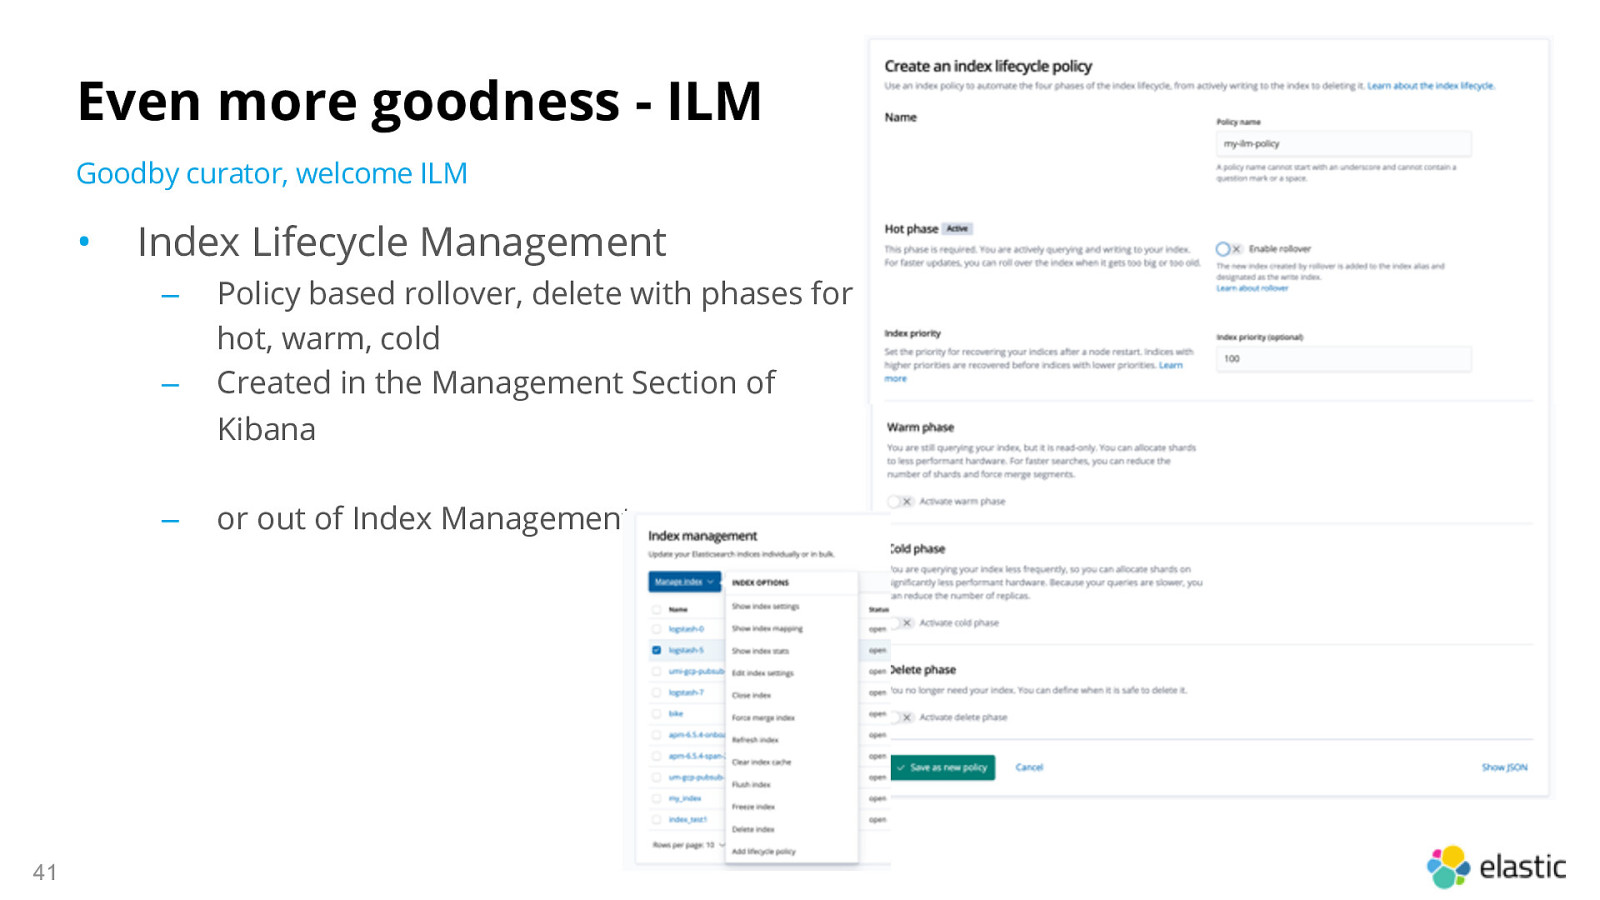
Even more goodness - ILM Goodby curator, welcome ILM • Index Lifecycle Management ‒ ‒ ‒ 41 Policy based rollover, delete with phases for hot, warm, cold Created in the Management Section of Kibana or out of Index Management
Demo What you see is what you get! 42
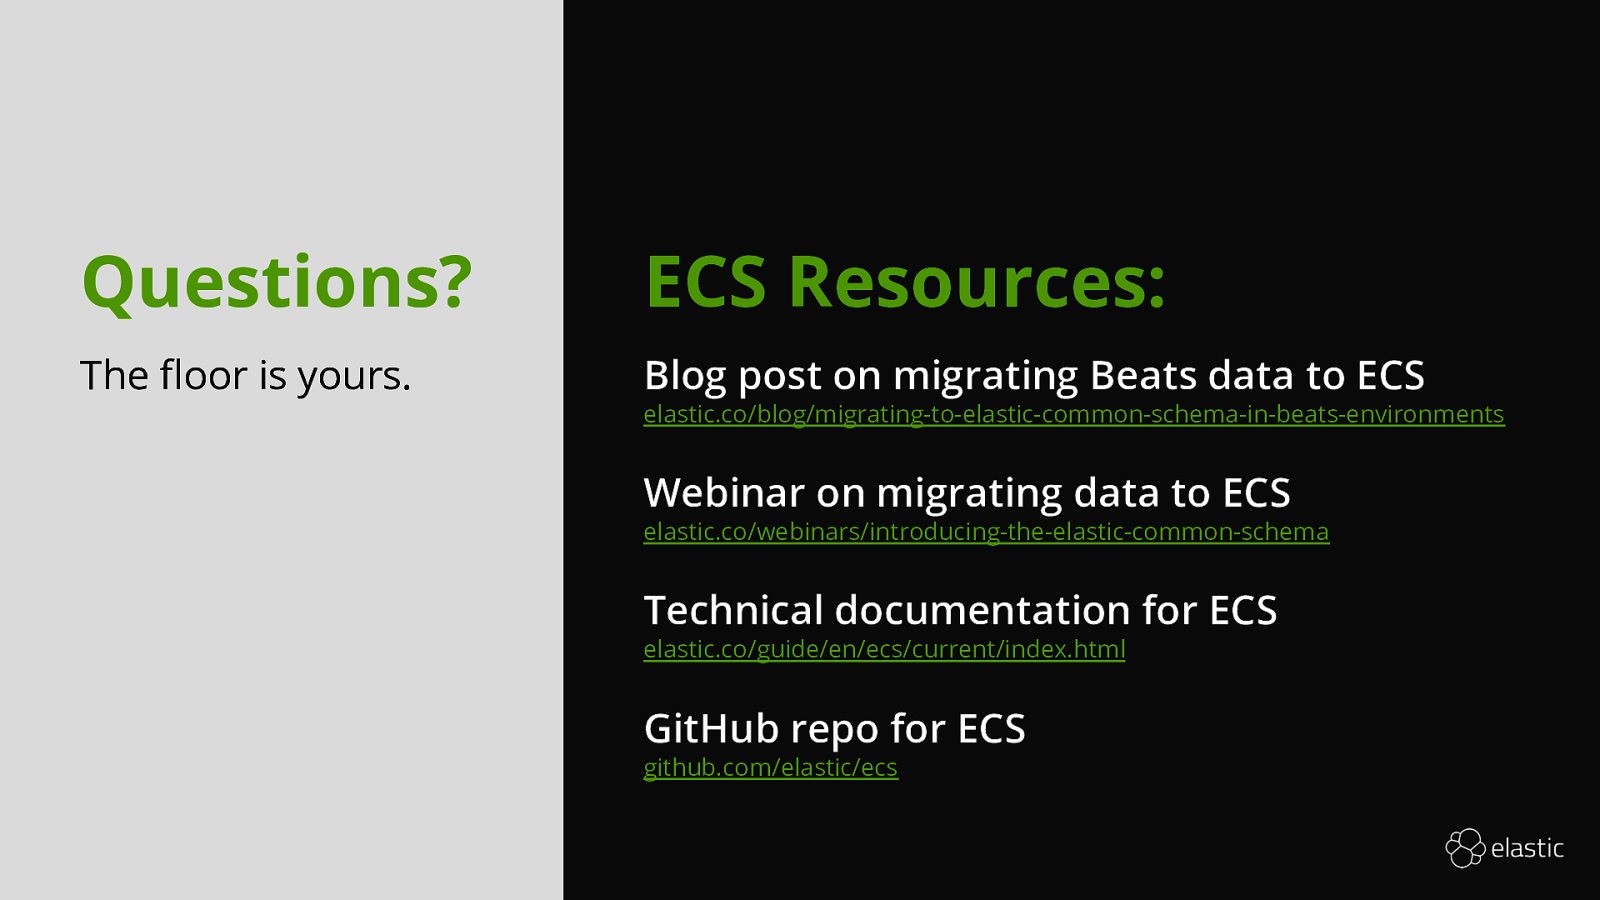
Questions? ECS Resources: The floor is yours. Blog post on migrating Beats data to ECS elastic.co/blog/migrating-to-elastic-common-schema-in-beats-environments Webinar on migrating data to ECS elastic.co/webinars/introducing-the-elastic-common-schema Technical documentation for ECS elastic.co/guide/en/ecs/current/index.html GitHub repo for ECS github.com/elastic/ecs 43

Please fill out the survey and WIN a Elastic Backpack! Here is a link to the survey: https://go.es.io/2I07X5D Or a QR code: 44 This could be YOURS J

Q&A Questions or Feedback? 45
Thanks You!