Putting Design On The Map @shanehudson

A presentation at Async JS in April 2015 in Brighton, UK by Shane Hudson

Putting Design On The Map @shanehudson
“A map does not just chart, it unlocks and formulates meaning; it forms bridges between here and there, between disparate ideas that we did not know were previously connected.” Reif Larsen, The Selected Works of T.S. Spivet
GISPortal • Plymouth Marine Laboratory • Audience: Scientists, Government advisors and general public • Uses OpenLayers 2, but Open Layers 3 is far better! • PML work on multiple forks, with various different target audiences • https://github.com/pmlrsg/GISportal
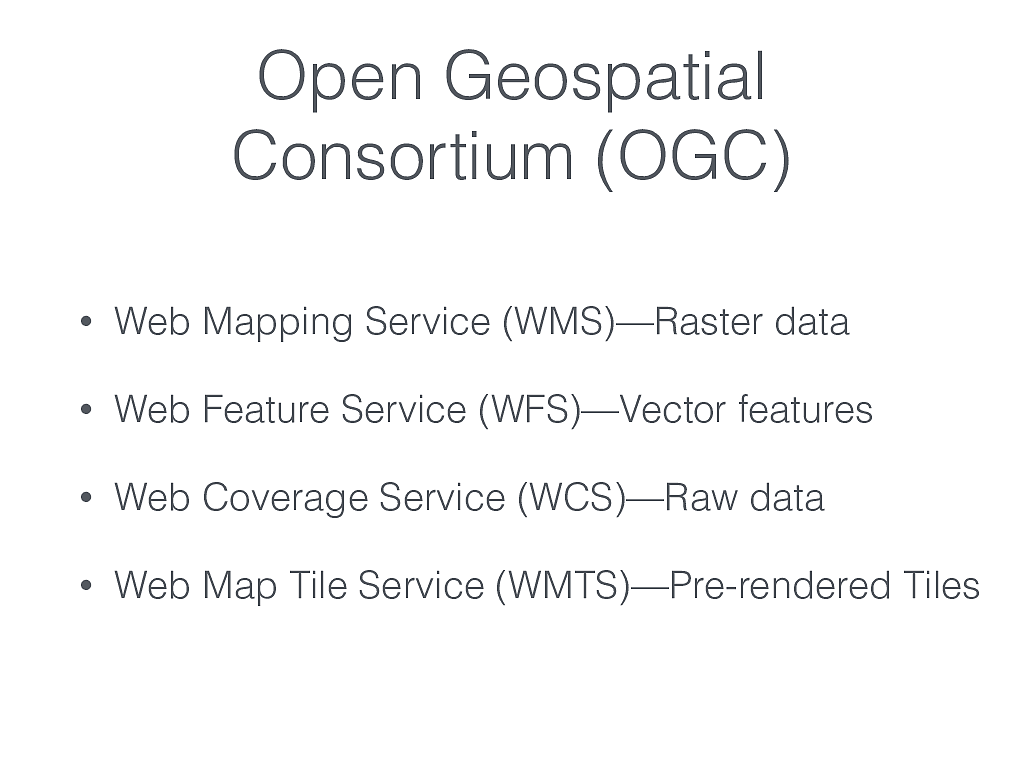
Open Geospatial
Consortium (OGC)
•
Web Mapping Service (WMS)—Raster data
•
Web Feature Service (WFS)—Vector features
•
Web Coverage Service (WCS)—Raw data
•
Web Map Tile Service (WMTS)—Pre-rendered Tiles
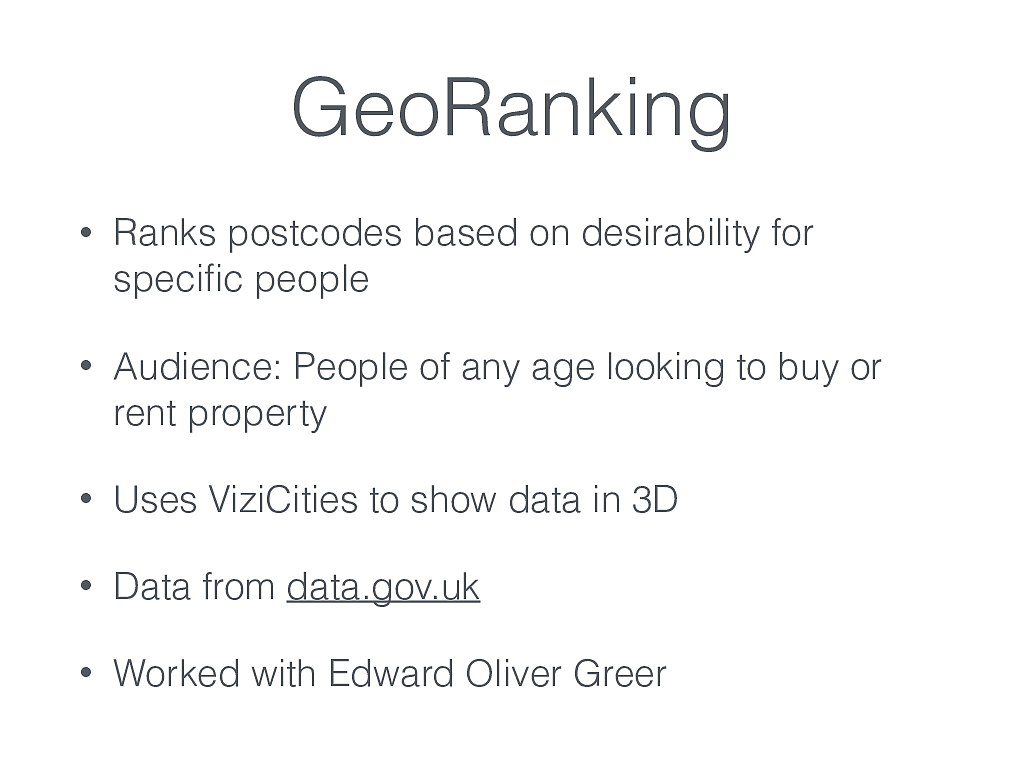
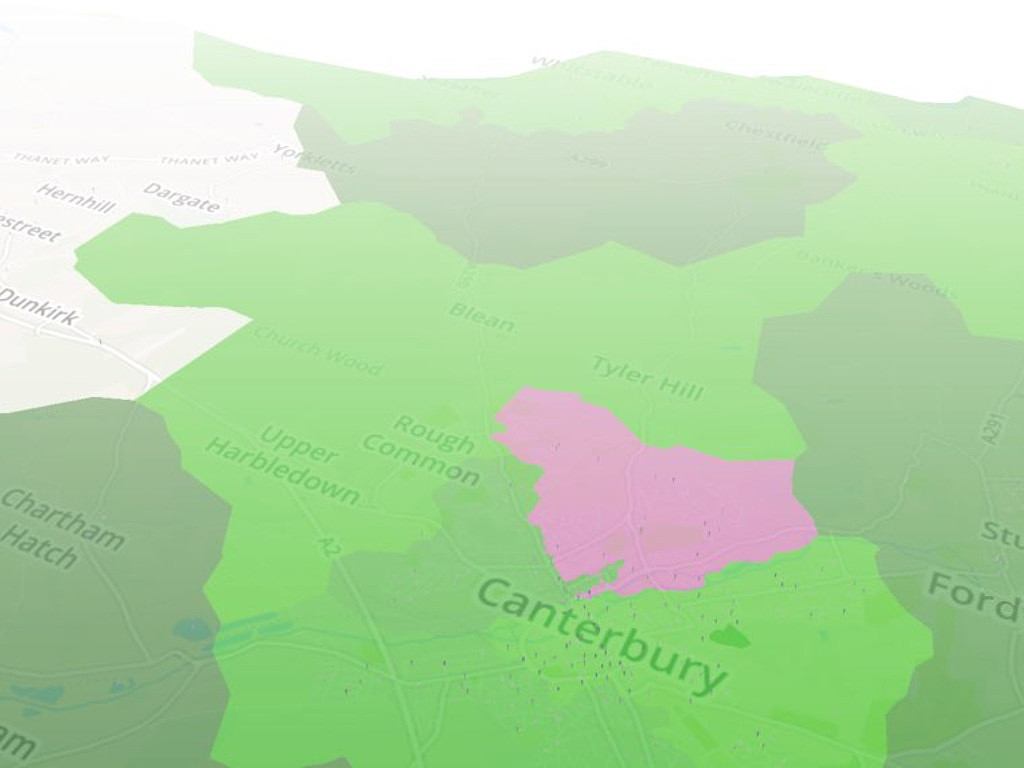
GeoRanking • Ranks postcodes based on desirability for specific people • Audience: People of any age looking to buy or rent property • Uses ViziCities to show data in 3D • Data from data.gov.uk
• Worked with Edward Oliver Greer
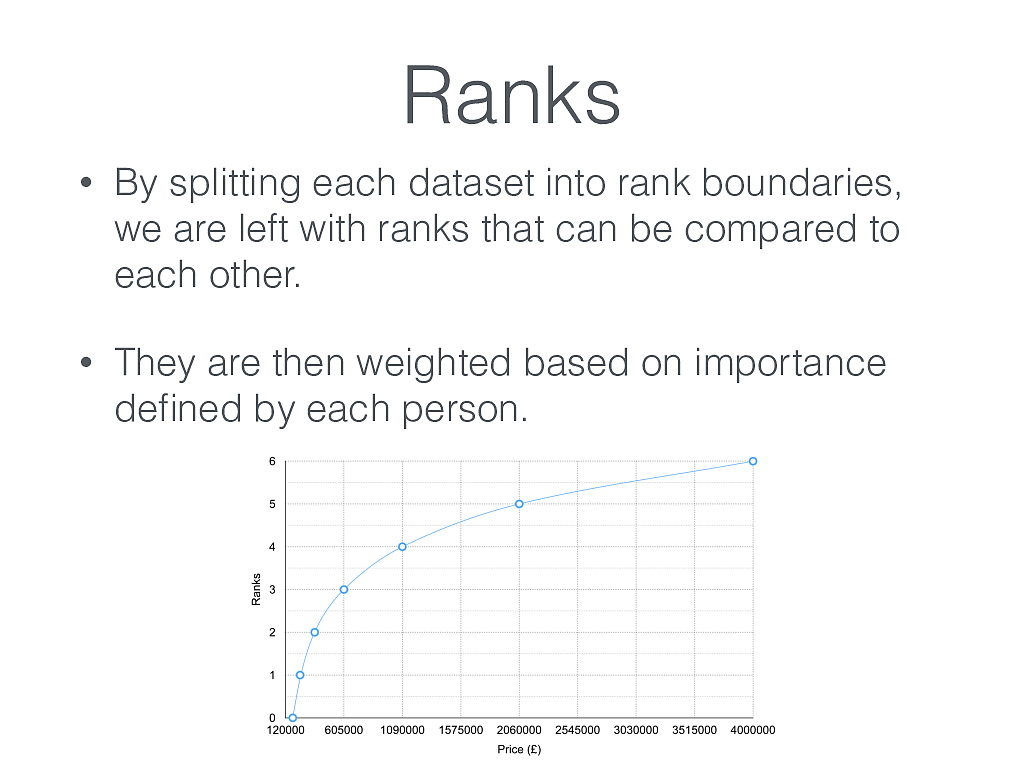
Ranks
•
By splitting each dataset into rank boundaries,
we are left with ranks that can be compared to
each other.
•
They are then weighted based on importance
defined by each person.
“But that’s too niche” • I work on large projects, but every single venue (pub, restaurant, swimming pool) has a map on their website. • I can almost guarantee they use a default Google Map.
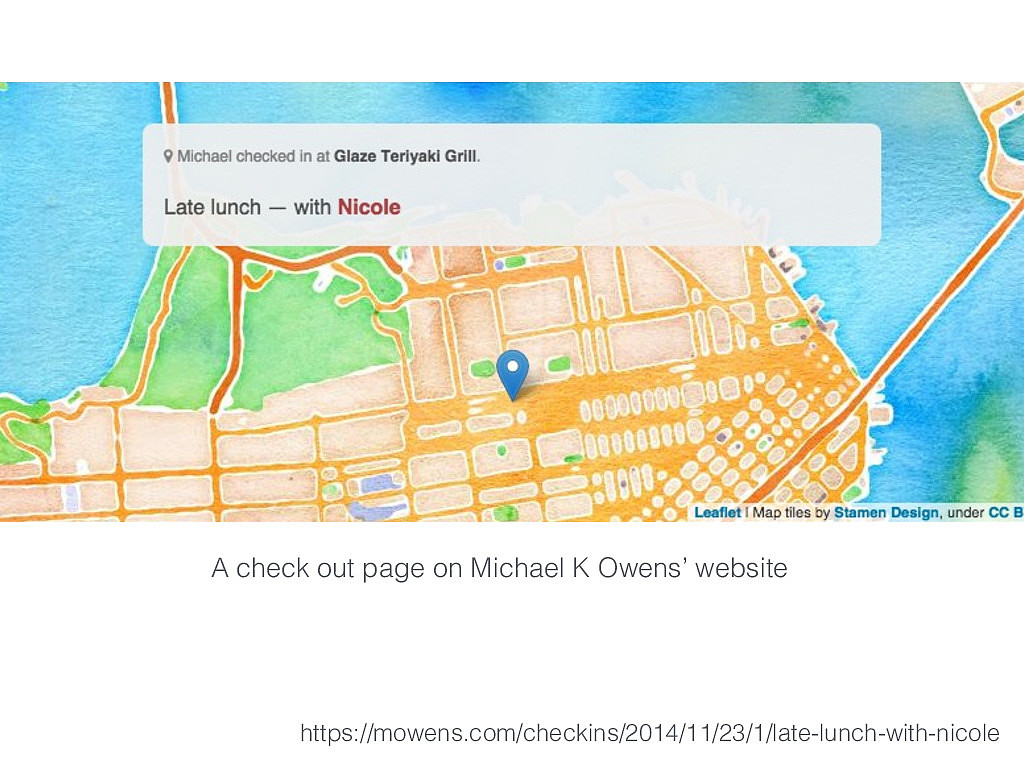
https://mowens.com/checkins/2014/11/23/1/late-lunch-with-nicole A check out page on Michael K Owens’ website
Tiles • The map itself is called the base layer. • Can be satellite imagery, earth model, vector road maps… basically anything that shows the geography. • It is split up into a grid of tiles, allowing you to use different tiles for zoom levels. • Generally people use an XYZ URL such as: http://{s}. tile.openstreetmap.org/ {z}/{x}/{y}.png • There is also the WMTS
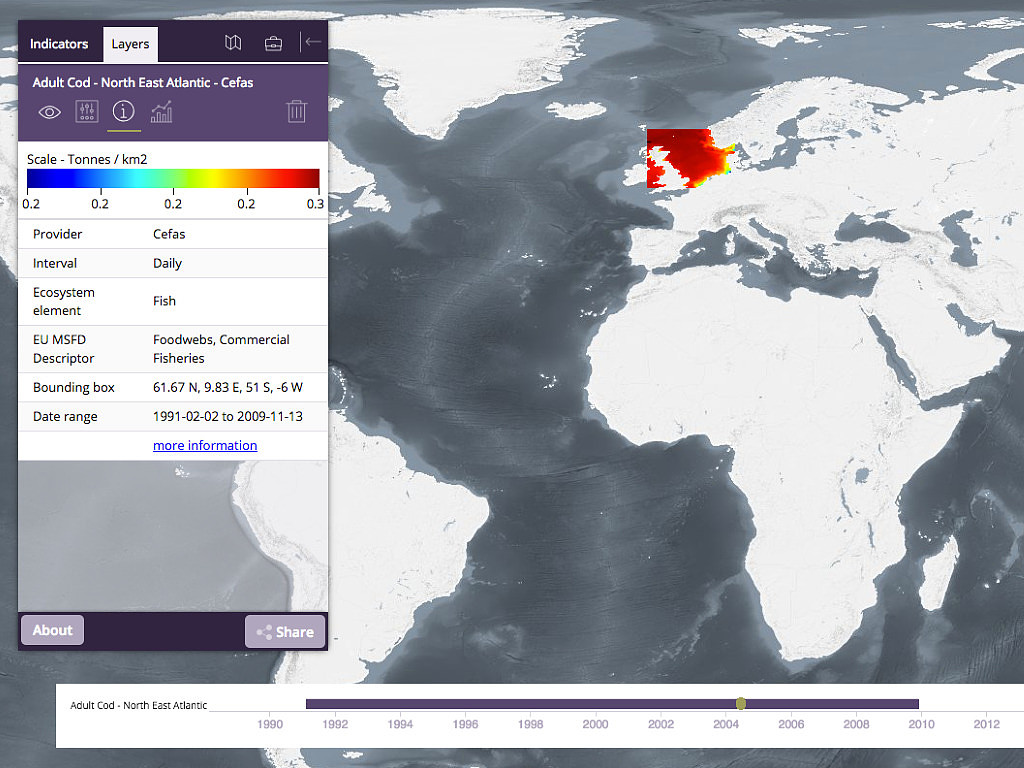
Context • It is probably obvious but make sure the map is in the right context for the user. • For instance, the GISPortal was updated to use a base map that shows the underwater terrain instead of just the land.
Performance • Tiles are your friend, load the larger tiles first and add detail afterwards. • Only render the viewport. • Load a buffer of tiles so that it feels instant as the user pans around the map.
“Features are represented by means of lines or colors; and the effective use of lines or colors requires more than knowledge of the subject – it requires artistic judgement.” Erwin Josephus Raisz, cartographer (1893–1968)
Colour
•
Most visualisations show data as colour on the
map, this is hard to understand.
•
Often better to show colour as a spectrum of
shades rather than hues.
•
Dark or light makes sense (there are only two
directions) whereas various colours could mean
anything.
•
Users often want to see the actual values too!
Database • Use the well supported and documented databases. • PostGIS has a learning curve but is better long term. • One of the worst decisions on GeoRanking was to use Spatialite over PostGIS.

Front-end Tools • Google • Leaflet • Mapbox • Open Layers • Open Street Map • ViziCities
Google Styled Maps • You have almost certainly used a Google map, but probably not customised it a lot. • You heavily customise the base map with “Styled Maps”, using a JavaScript object to change colours, hide labels etc. • https://developers.google.com/maps/ documentation/javascript/styling
Leaflet • Self hosted JavaScript library • Lightweight • Can use base maps from anywhere, defaults to Open Street Map. • I recommend for most projects where you want control but nothing too advanced.
Mapbox • Mapbox is a great service for customising maps, with built in data sources and storage for base maps. • Mapbox Studio is open source software for making vector base maps using stylesheets similar to CSS. It is the successor to Tile Mill.
Open Layers 3 • Self hosted JavaScript library • Very powerful and much faster than previous versions. • Complete control over everything, eg. CSS for UI.
Open Street Map • Openly licensed map of the world. • Road maps, building data etc.
ViziCities • Open source 3D geospatial visualisation platform. • Developed by Robin Hawkes. • Very early in development!
Thanks! @shanehudson https:// shanehudson.net
Links • https://shanehudson.net
• https://twitter.com/ShaneHudson
• http://24ways.org/2014/putting-design-on-the-map
• https://github.com/pmlrsg/GISportal
• http://portal.marineopec.eu/
• http://data.gov.uk/
• https://mowens.com/checkins/2014/11/23/1/late-lunch-with-nicole
• http://www.opengeospatial.org/standards/wms
• http://www.opengeospatial.org/standards/wcs
• http://www.opengeospatial.org/standards/wfs
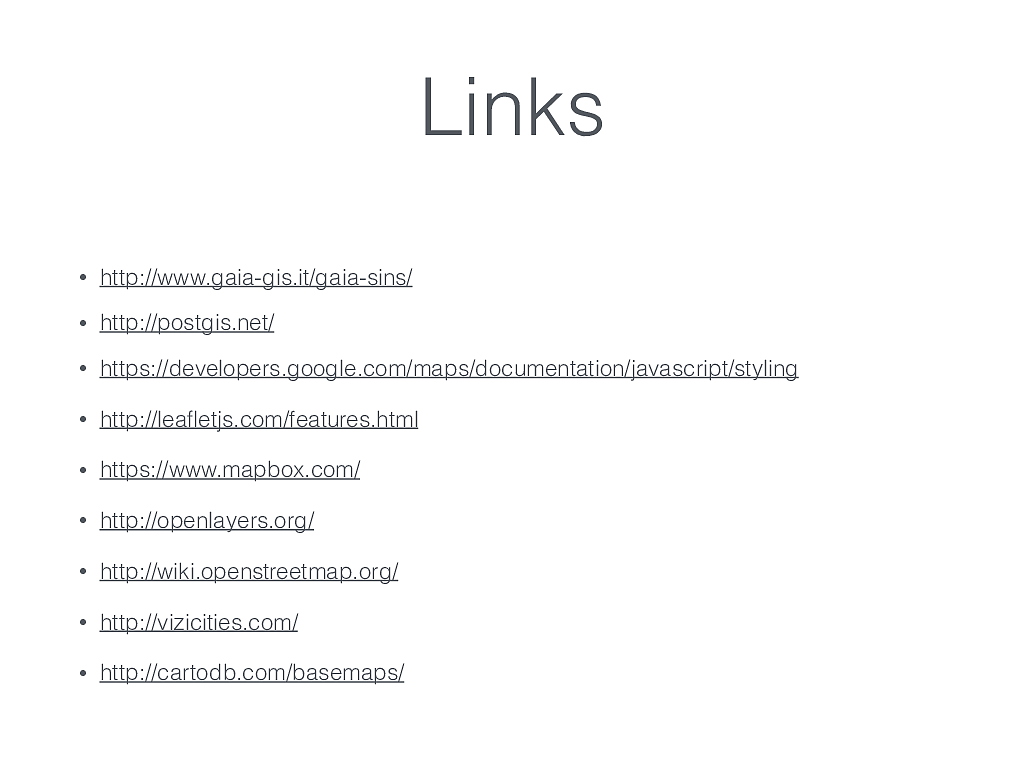
Links • http://www.gaia-gis.it/gaia-sins/
• http://postgis.net/
• https://developers.google.com/maps/documentation/javascript/styling
• http://leafletjs.com/features.html
• https://www.mapbox.com/
• http://openlayers.org/
• http://wiki.openstreetmap.org/
• http://vizicities.com/
• http://cartodb.com/basemaps/