The Psychology of Speed Simon Hearne Web Performance Solutions Engineer @ Akamai simonhearne.com/presentations/psych-speed/

A presentation at Akamai Tech Day in April 2019 in Stockholm, Sweden by Simon Hearne
The Psychology of Speed Simon Hearne Web Performance Solutions Engineer @ Akamai simonhearne.com/presentations/psych-speed/
We’ve all seen the studies… Walmart sees 1% increase in revenue for every 100ms improvement wpostats.com/tags/conversion/
We’ve all seen the studies… Walmart sees 1% increase in revenue for every 100ms improvement Staples saw a 10% increase in conversion rate when reducing homepage load time by one second wpostats.com/tags/conversion/
We’ve all seen the studies… Walmart sees 1% increase in revenue for every 100ms improvement Staples saw a 10% increase in conversion rate when reducing homepage load time by one second AliExpress saw 10.5% increase in conversions when reducing load time by 36% wpostats.com/tags/conversion/
We’ve all seen the studies… The BBC loses an additional 10% of users for every additional second it takes to load wpostats.com/tags/engagement/
We’ve all seen the studies… The BBC loses an additional 10% of users for every additional second it takes to load Pinterest improved load time by 40% and saw 15% increase in SEO traf c and 15% increase in conversions wpostats.com/tags/engagement/
We’ve all seen the studies… The BBC loses an additional 10% of users for every additional second it takes to load Pinterest improved load time by 40% and saw 15% increase in SEO traf c and 15% increase in conversions The Financial times increased user engagement by 30% when they released the new, performance focused FT.com wpostats.com/tags/engagement/
What do we mean by speed?
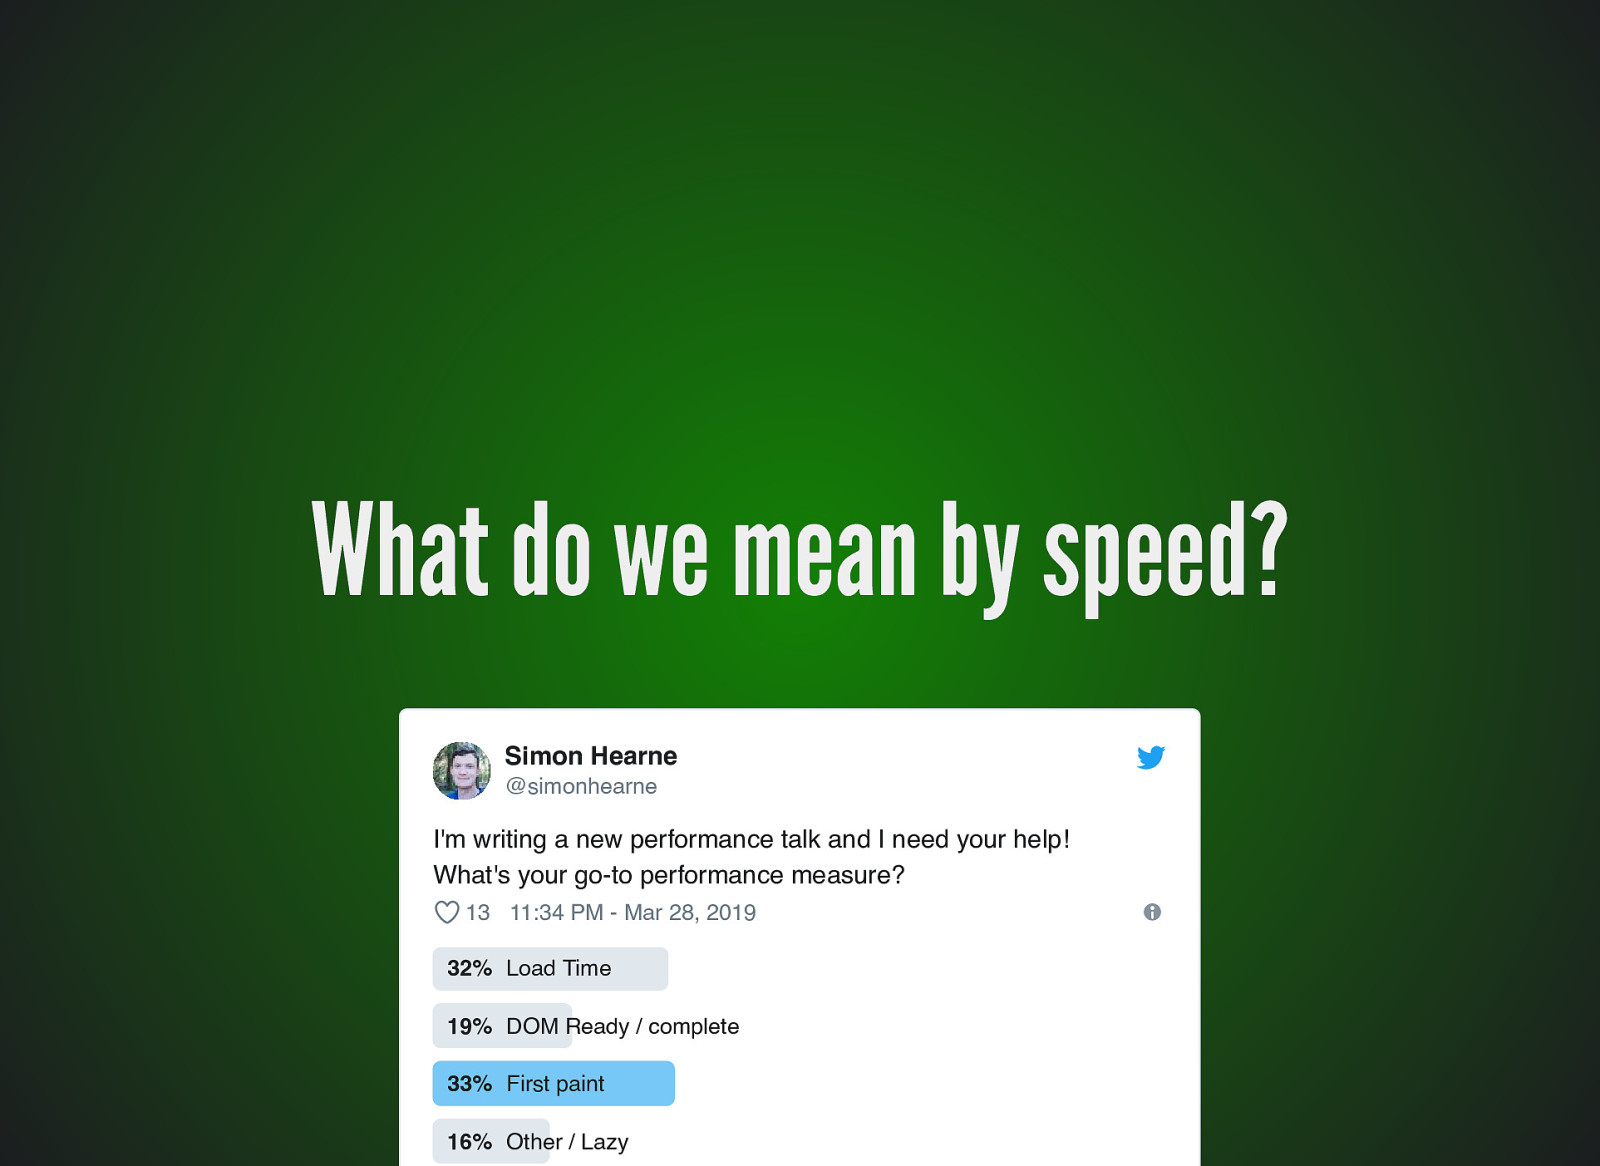
What do we mean by speed? Simon Hearne @simonhearne I’m writing a new performance talk and I need your help! What’s your go-to performance measure? 13 11:34 PM - Mar 28, 2019 32% Load Time 19% DOM Ready / complete 33% First paint 16% Other / Lazy
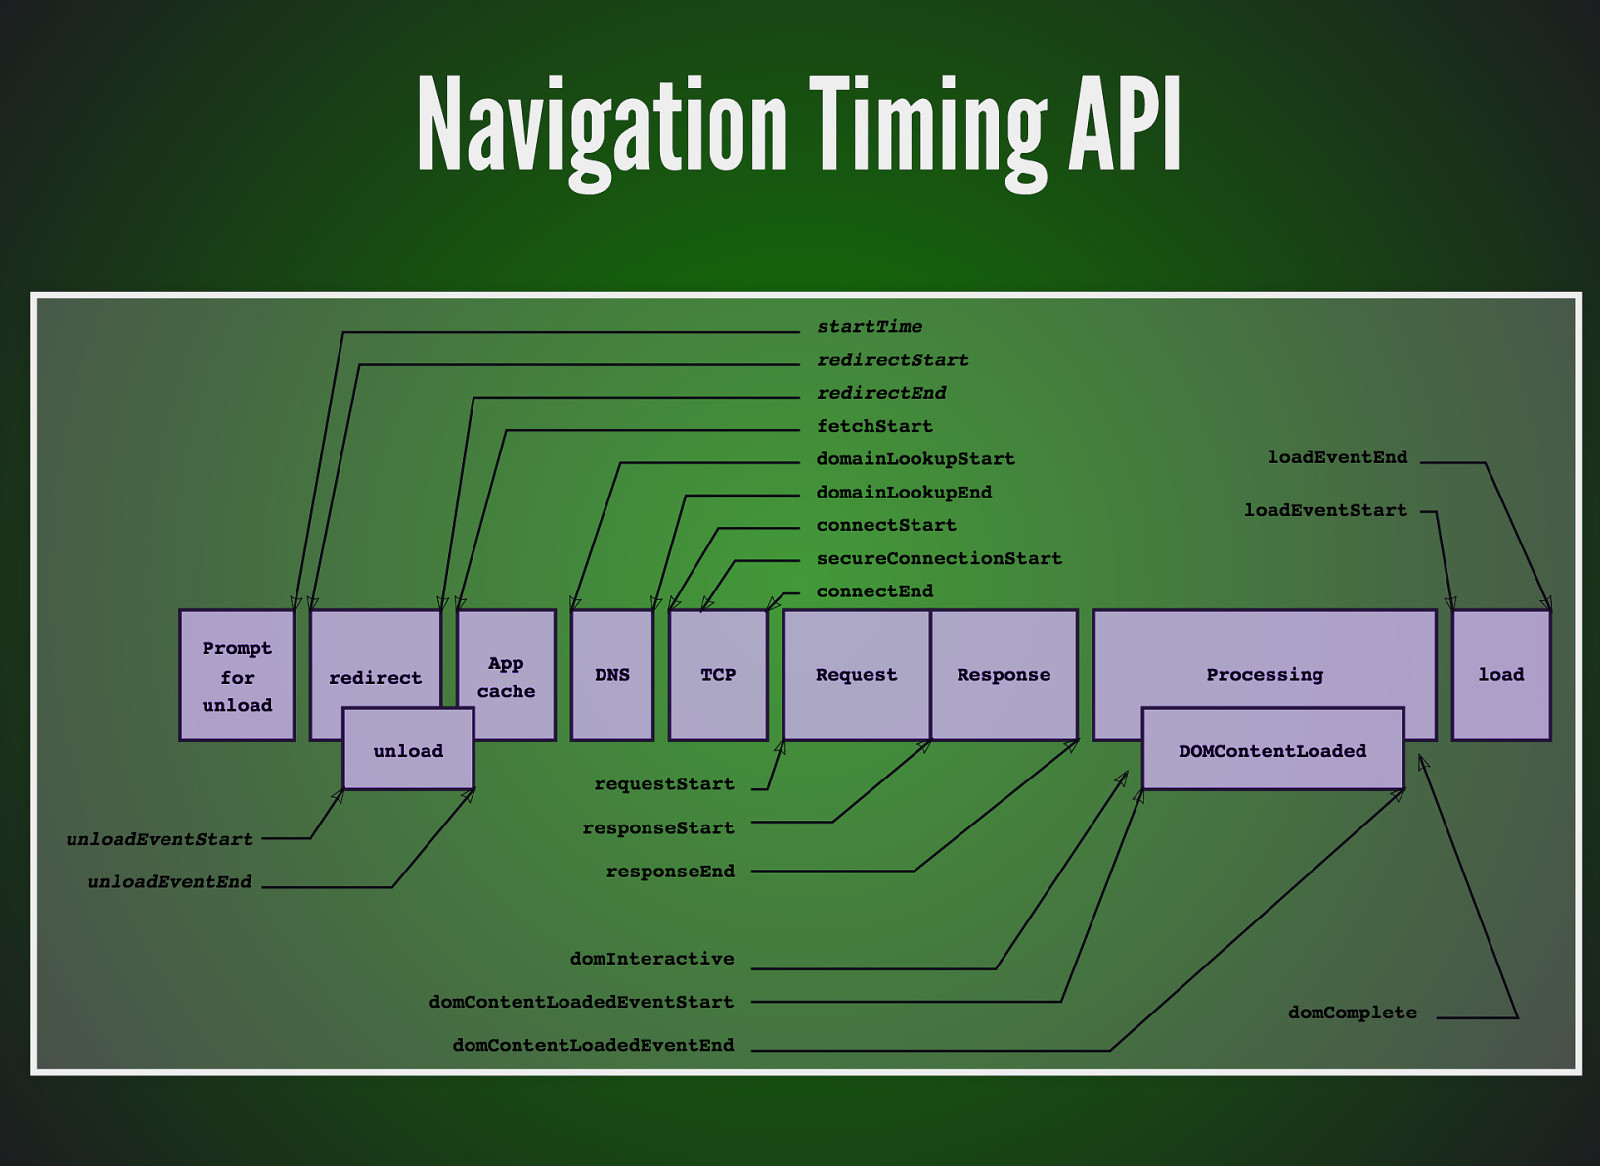
Navigation Timing API

What actually matters?
What actually matters? Is it working?
What actually matters? Is it working? Is it useful?
What actually matters? Is it working? Is it useful? Is it interactive?

Is it working?
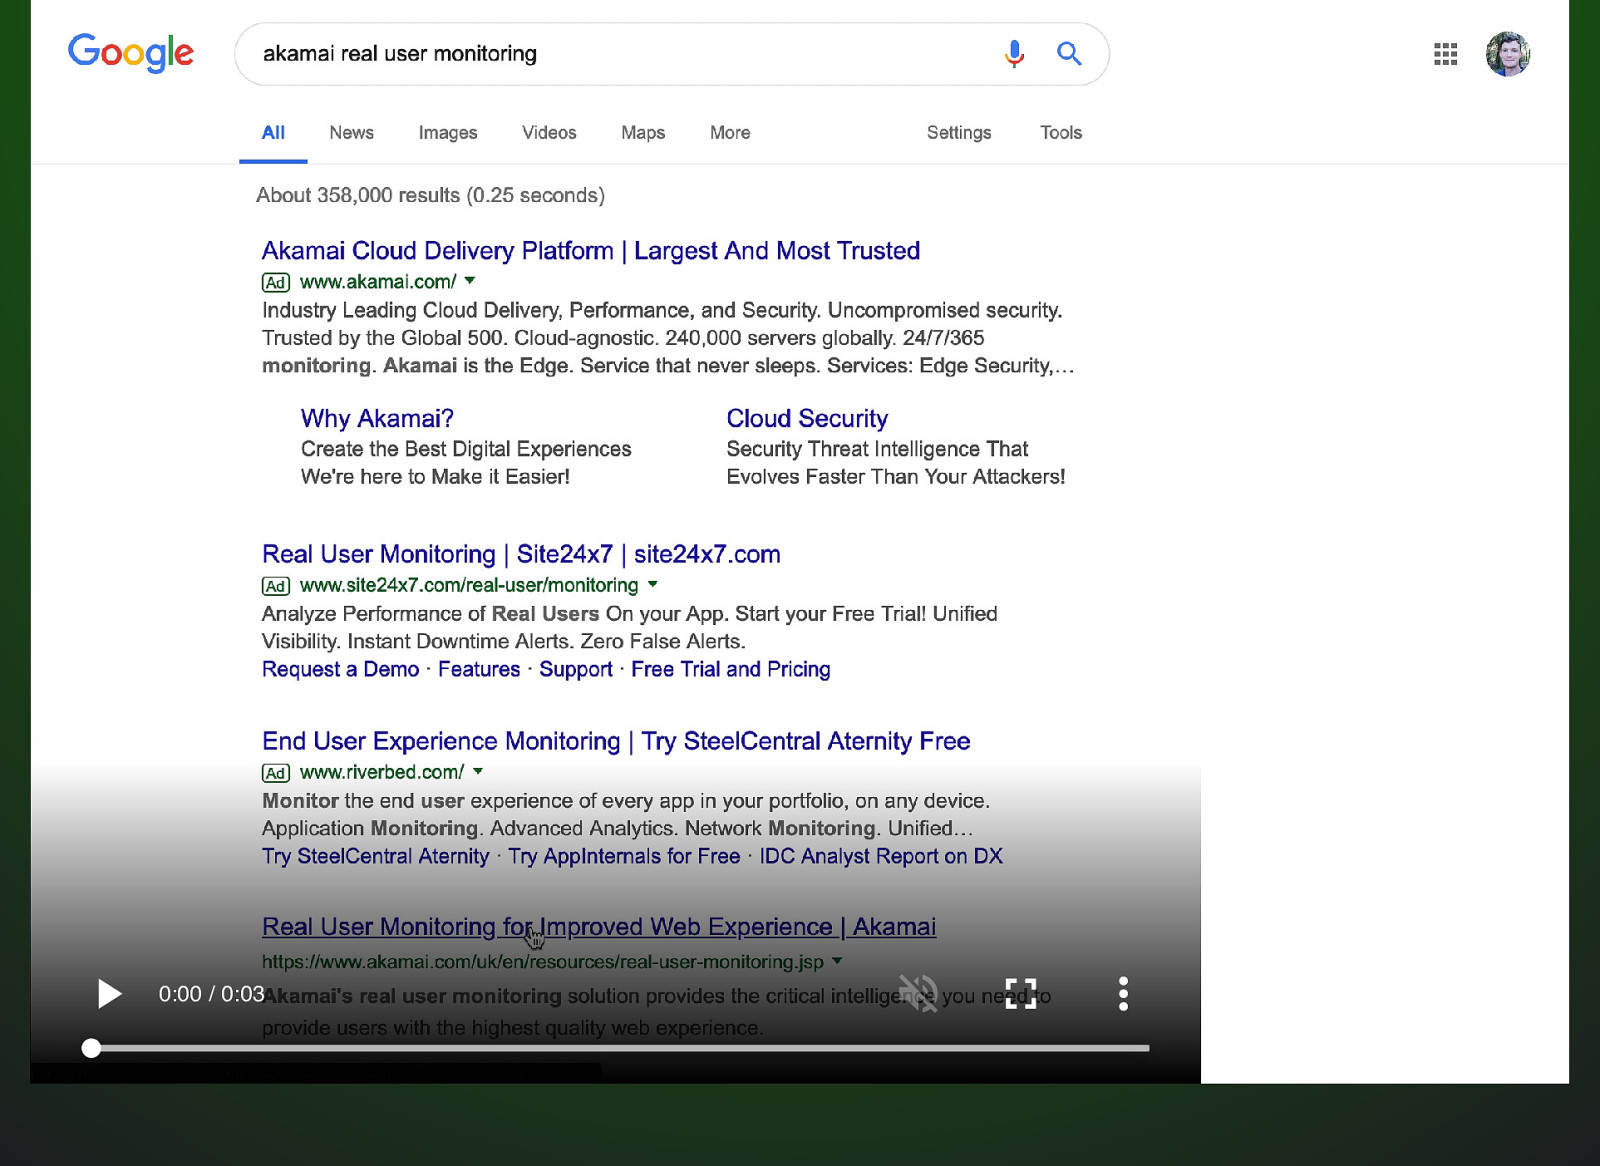
0:00 / 0:03
Is it working? Time to First Byte First Paint
Is it useful?

0:00 / 0:04
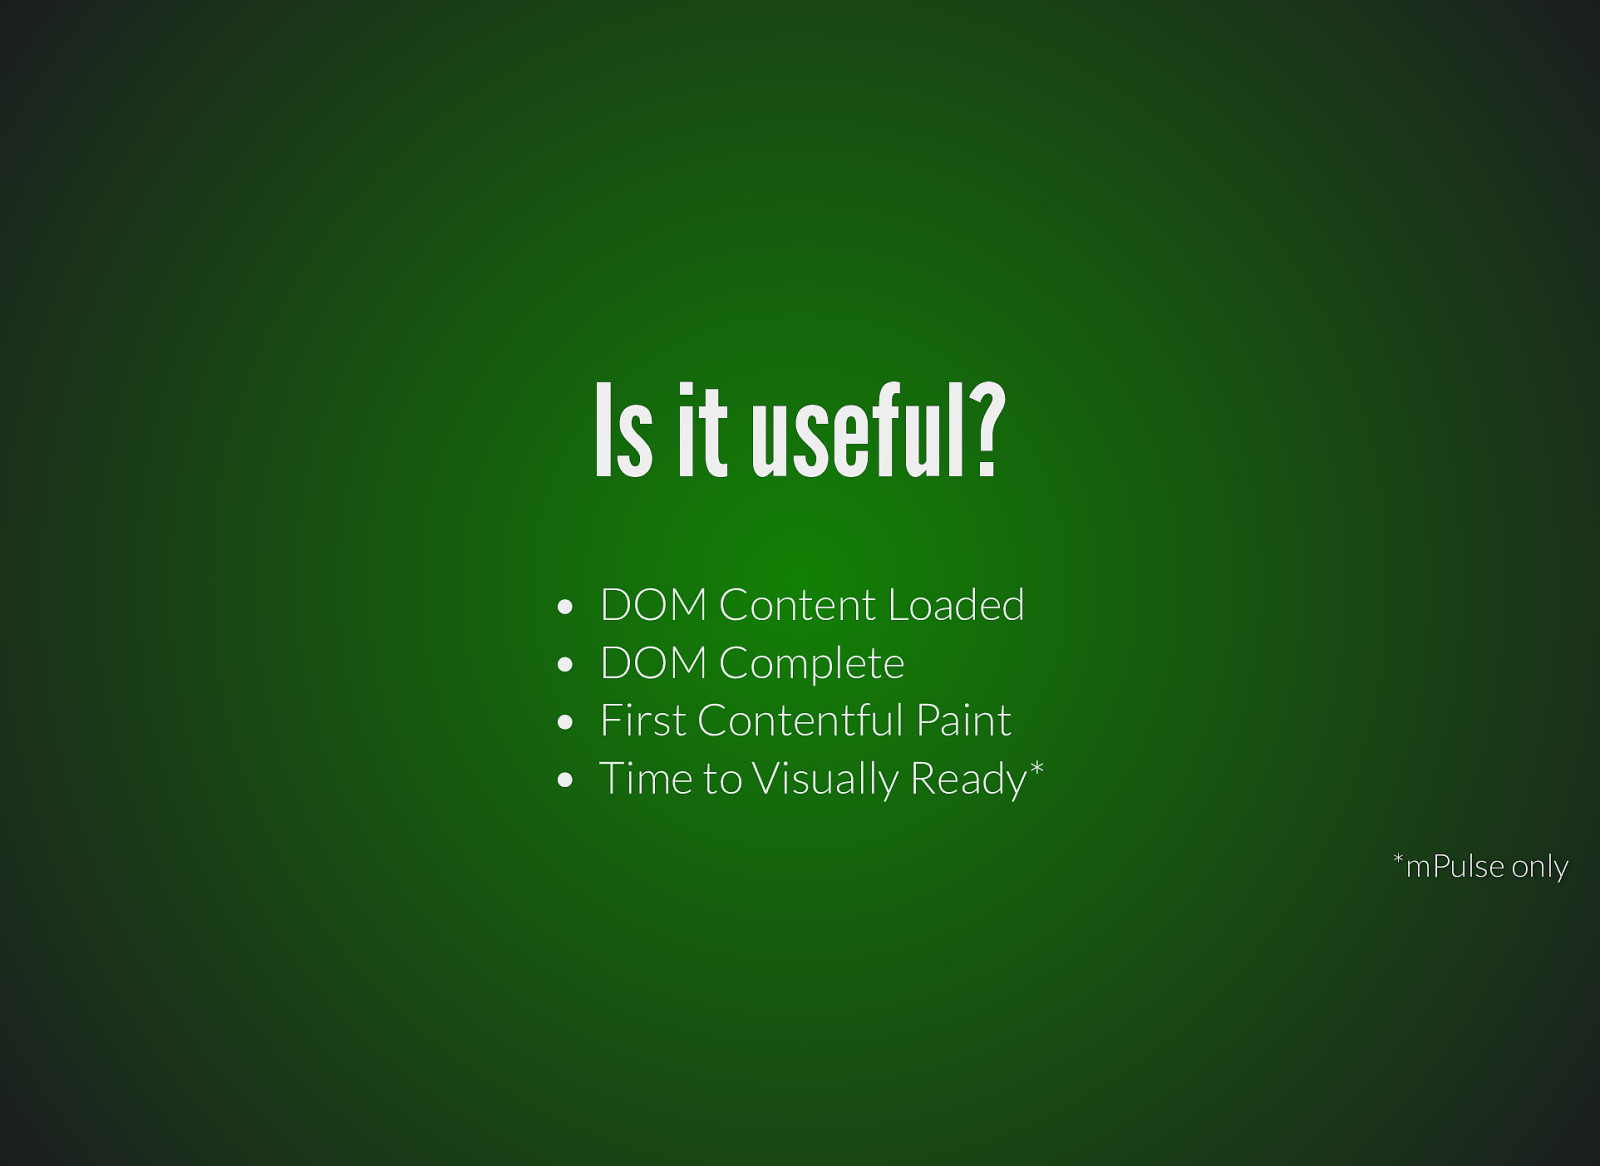
Is it useful? DOM Content Loaded DOM Complete First Contentful Paint Time to Visually Ready* *mPulse only
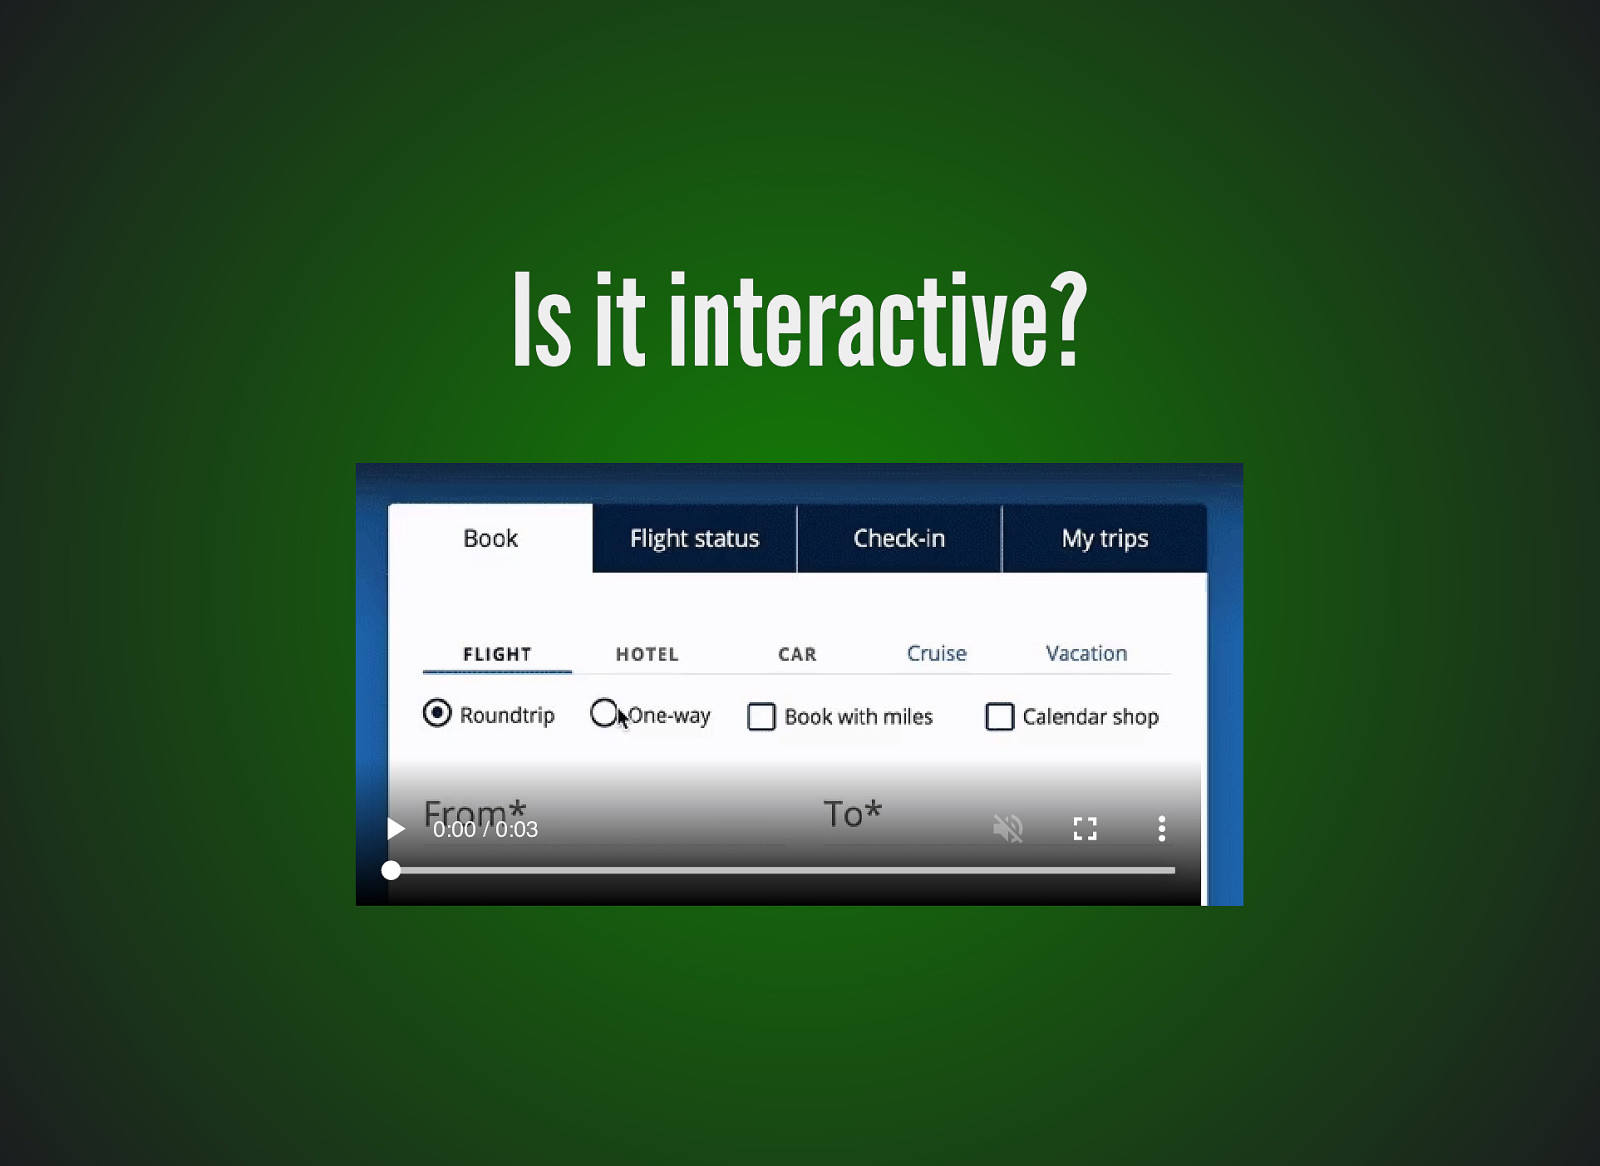
Is it interactive? 0:00 / 0:03
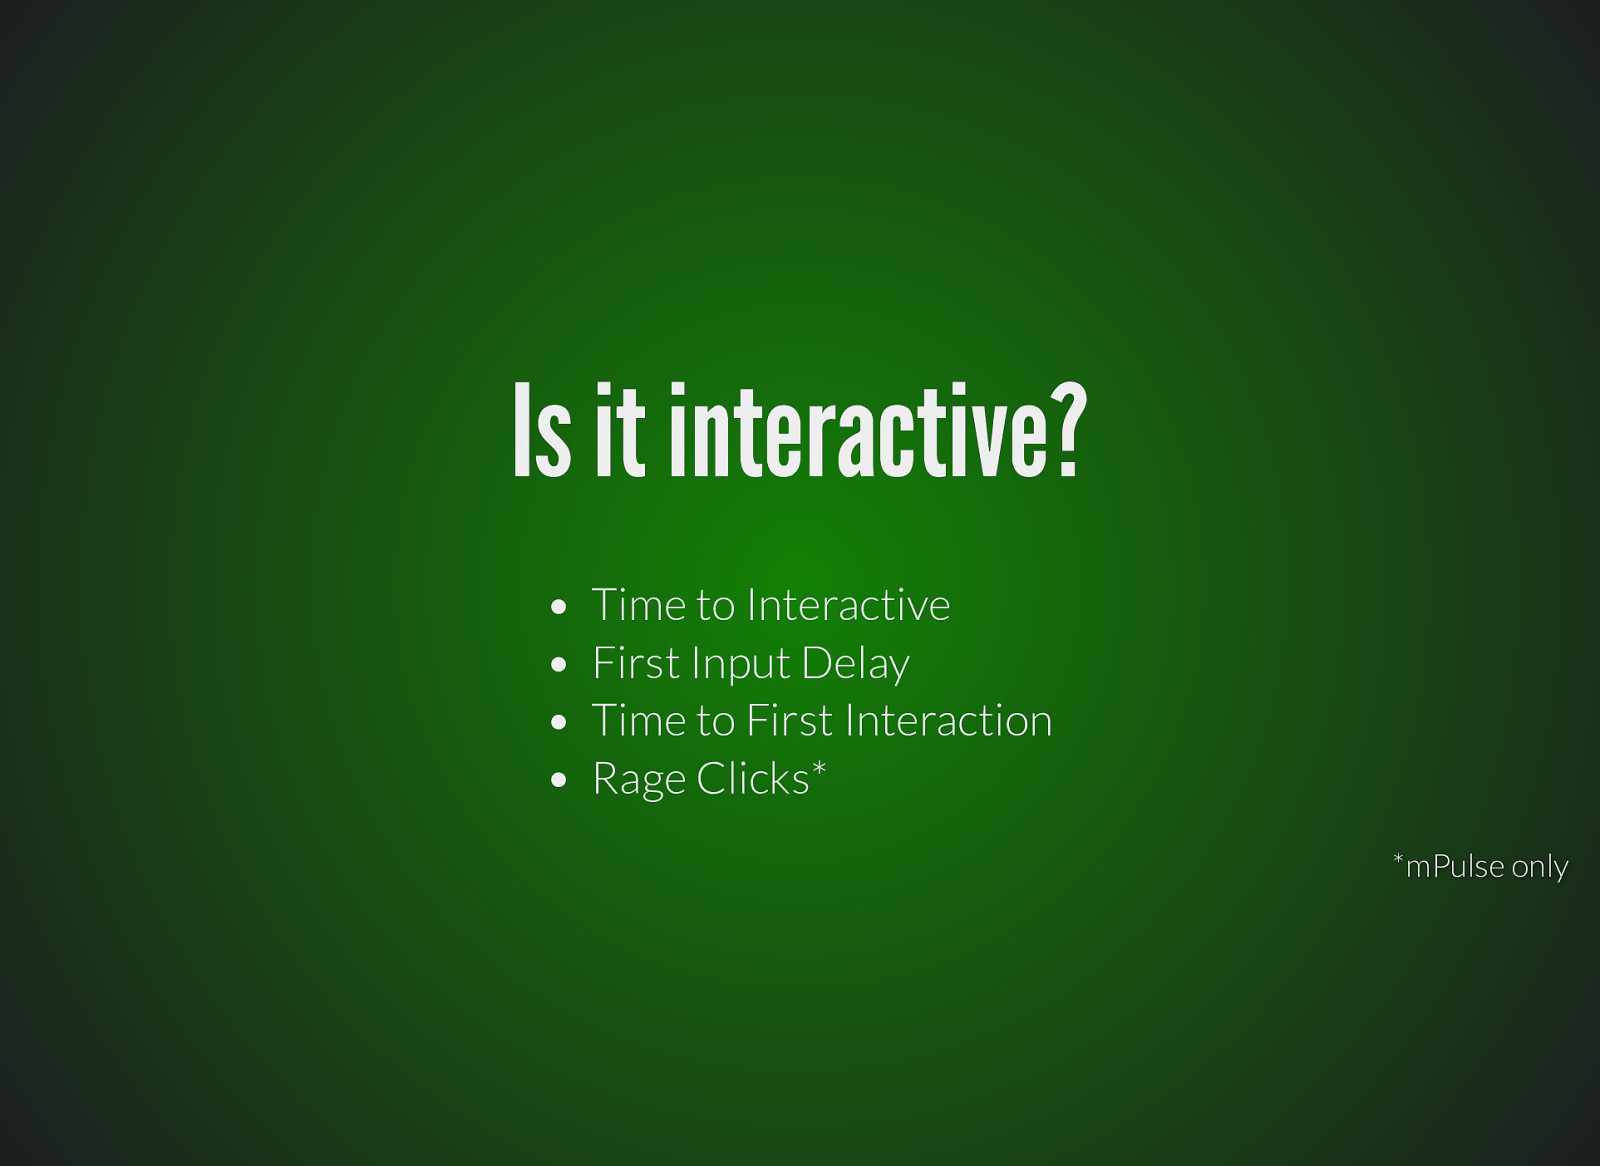
Is it interactive? Time to Interactive First Input Delay Time to First Interaction Rage Clicks* *mPulse only
POLL 1 What do you measure?
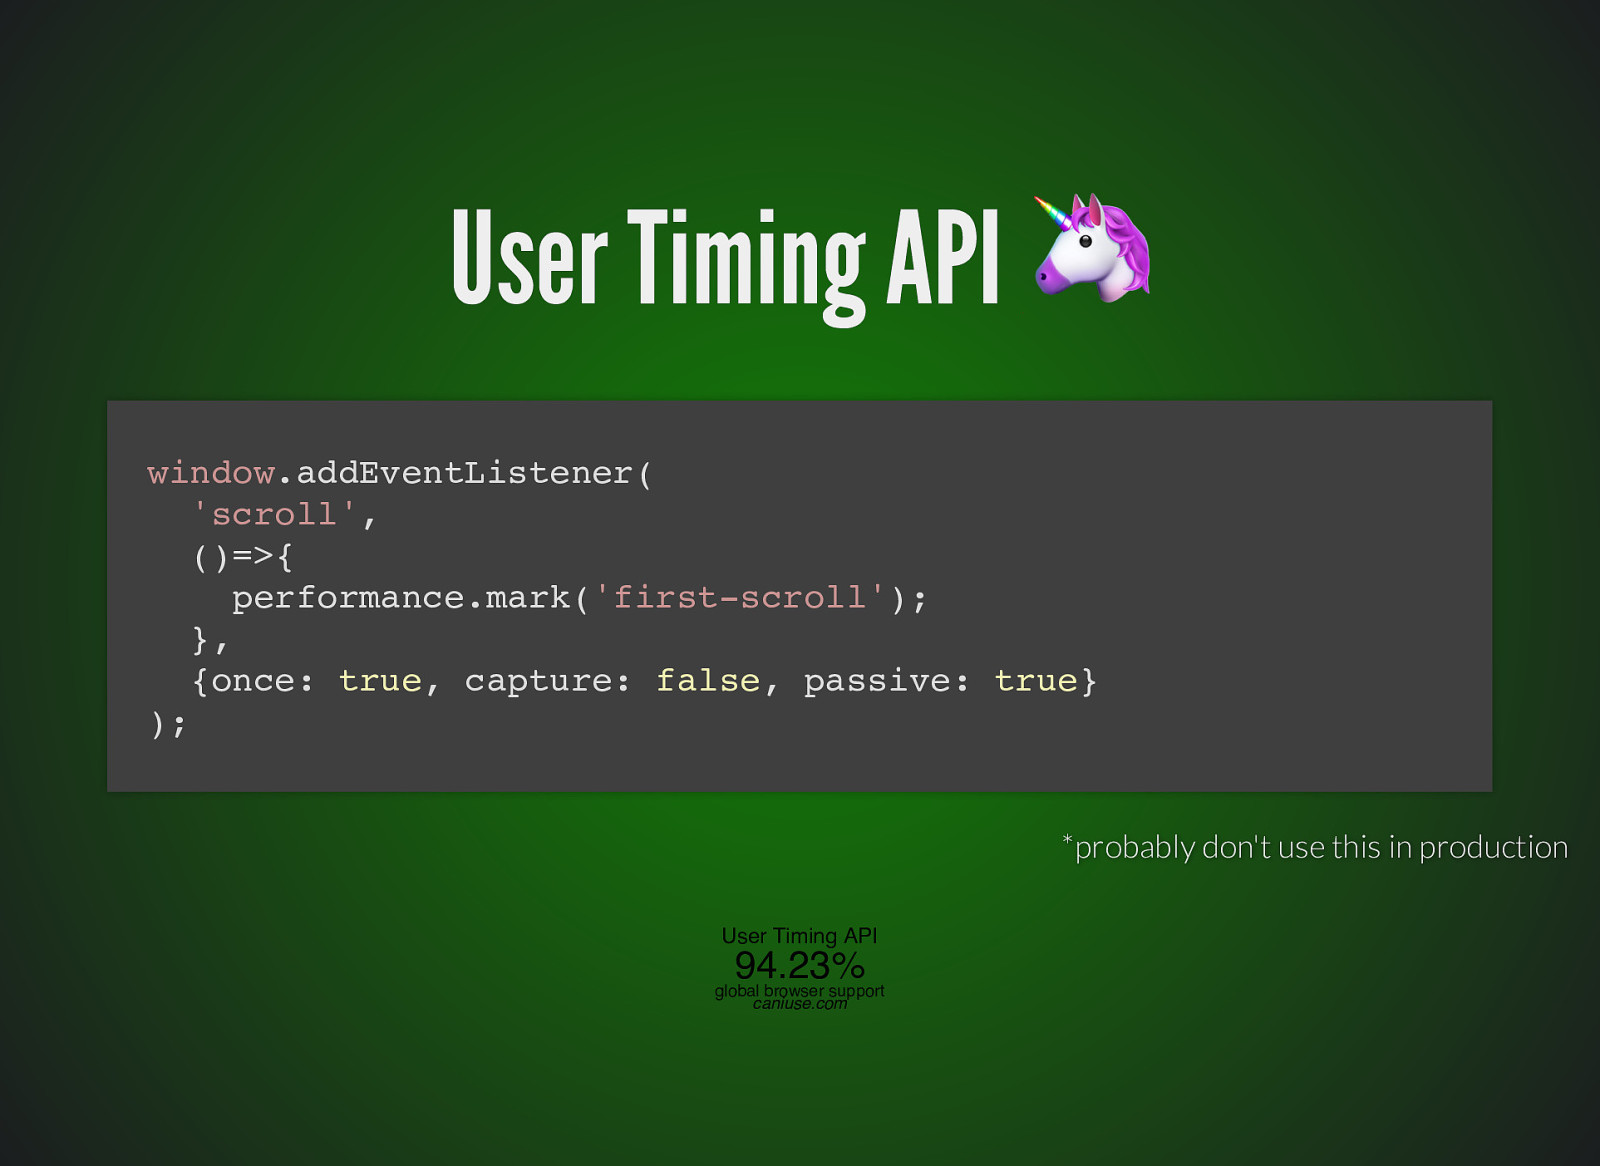
User Timing API window.addEventListener( ‘scroll’, ()=>{ performance.mark(‘first-scroll’); }, {once: true, capture: false, passive: true} ); *probably don’t use this in production User Timing API 94.23% global browser support caniuse.com
Timer Summary
Timer Summary Time to First Byte (TTFB) ⇨ The speed of the delivery stack
Timer Summary Time to First Byte (TTFB) DOM Content Loaded (DCL) ⇨ ⇨ The speed of the delivery stack The speed of critical dependencies
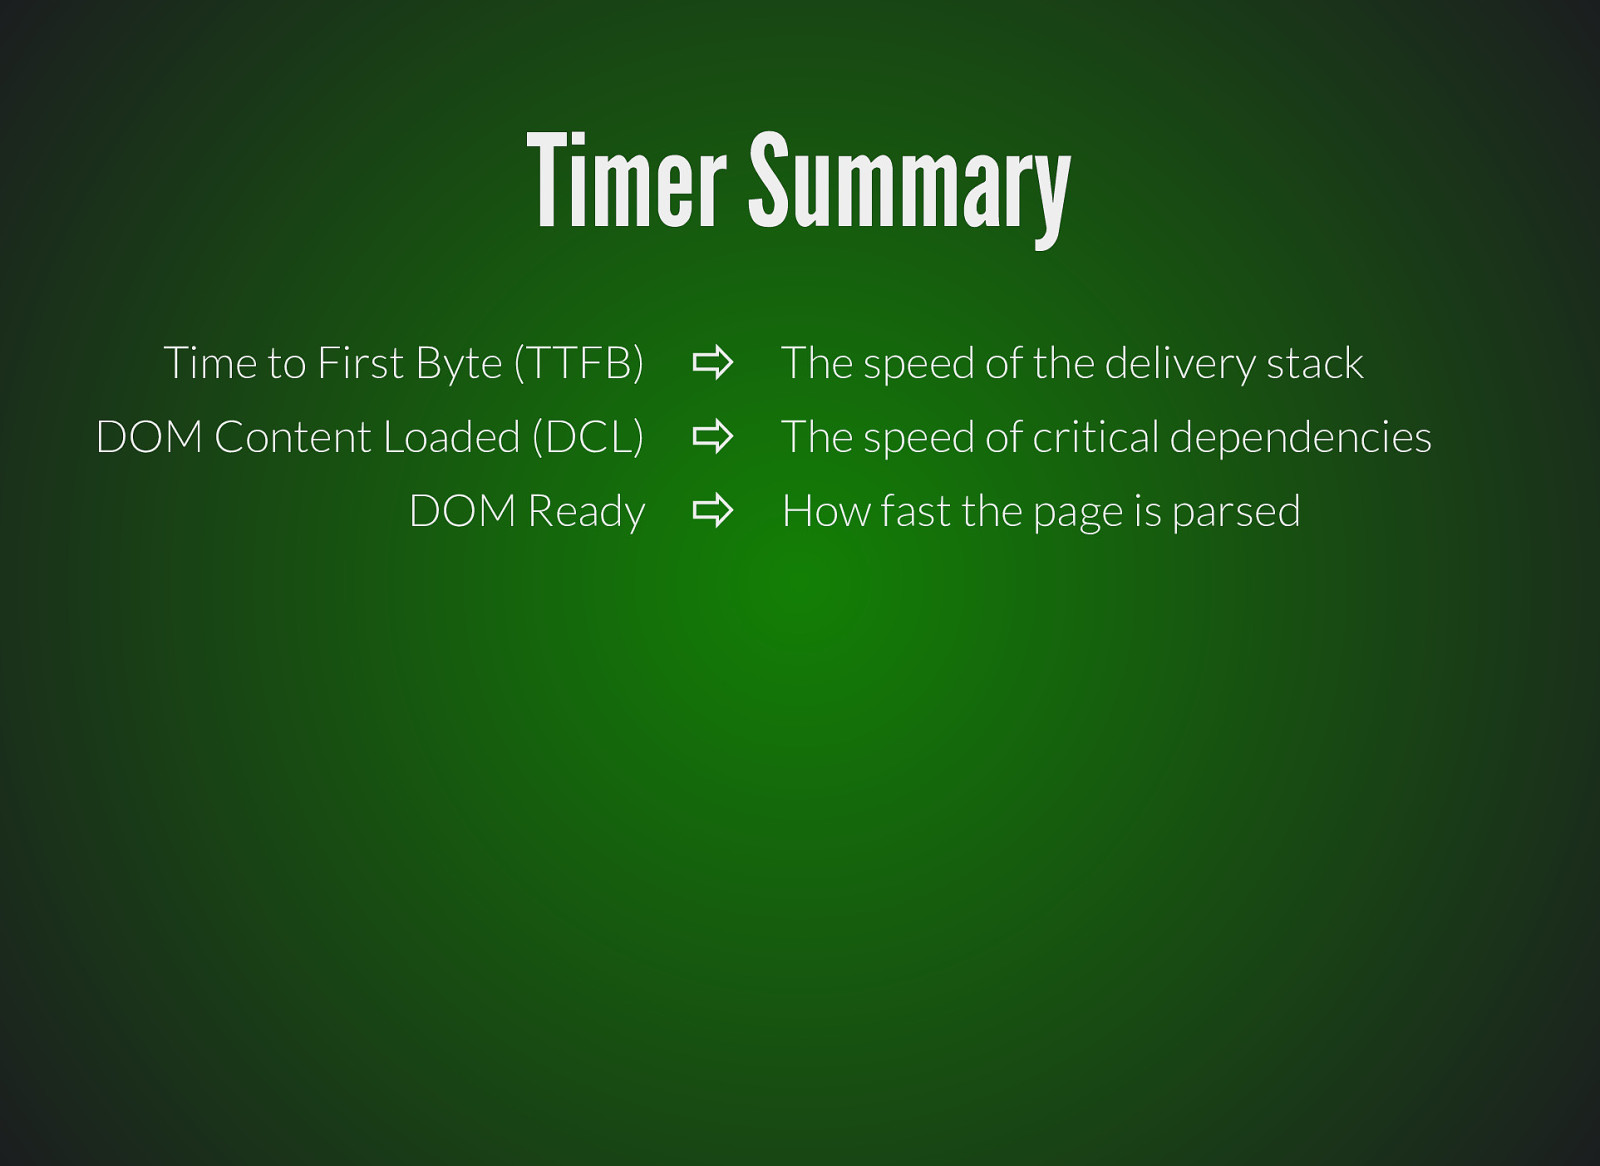
Timer Summary Time to First Byte (TTFB) DOM Content Loaded (DCL) DOM Ready ⇨ ⇨ ⇨ The speed of the delivery stack The speed of critical dependencies How fast the page is parsed
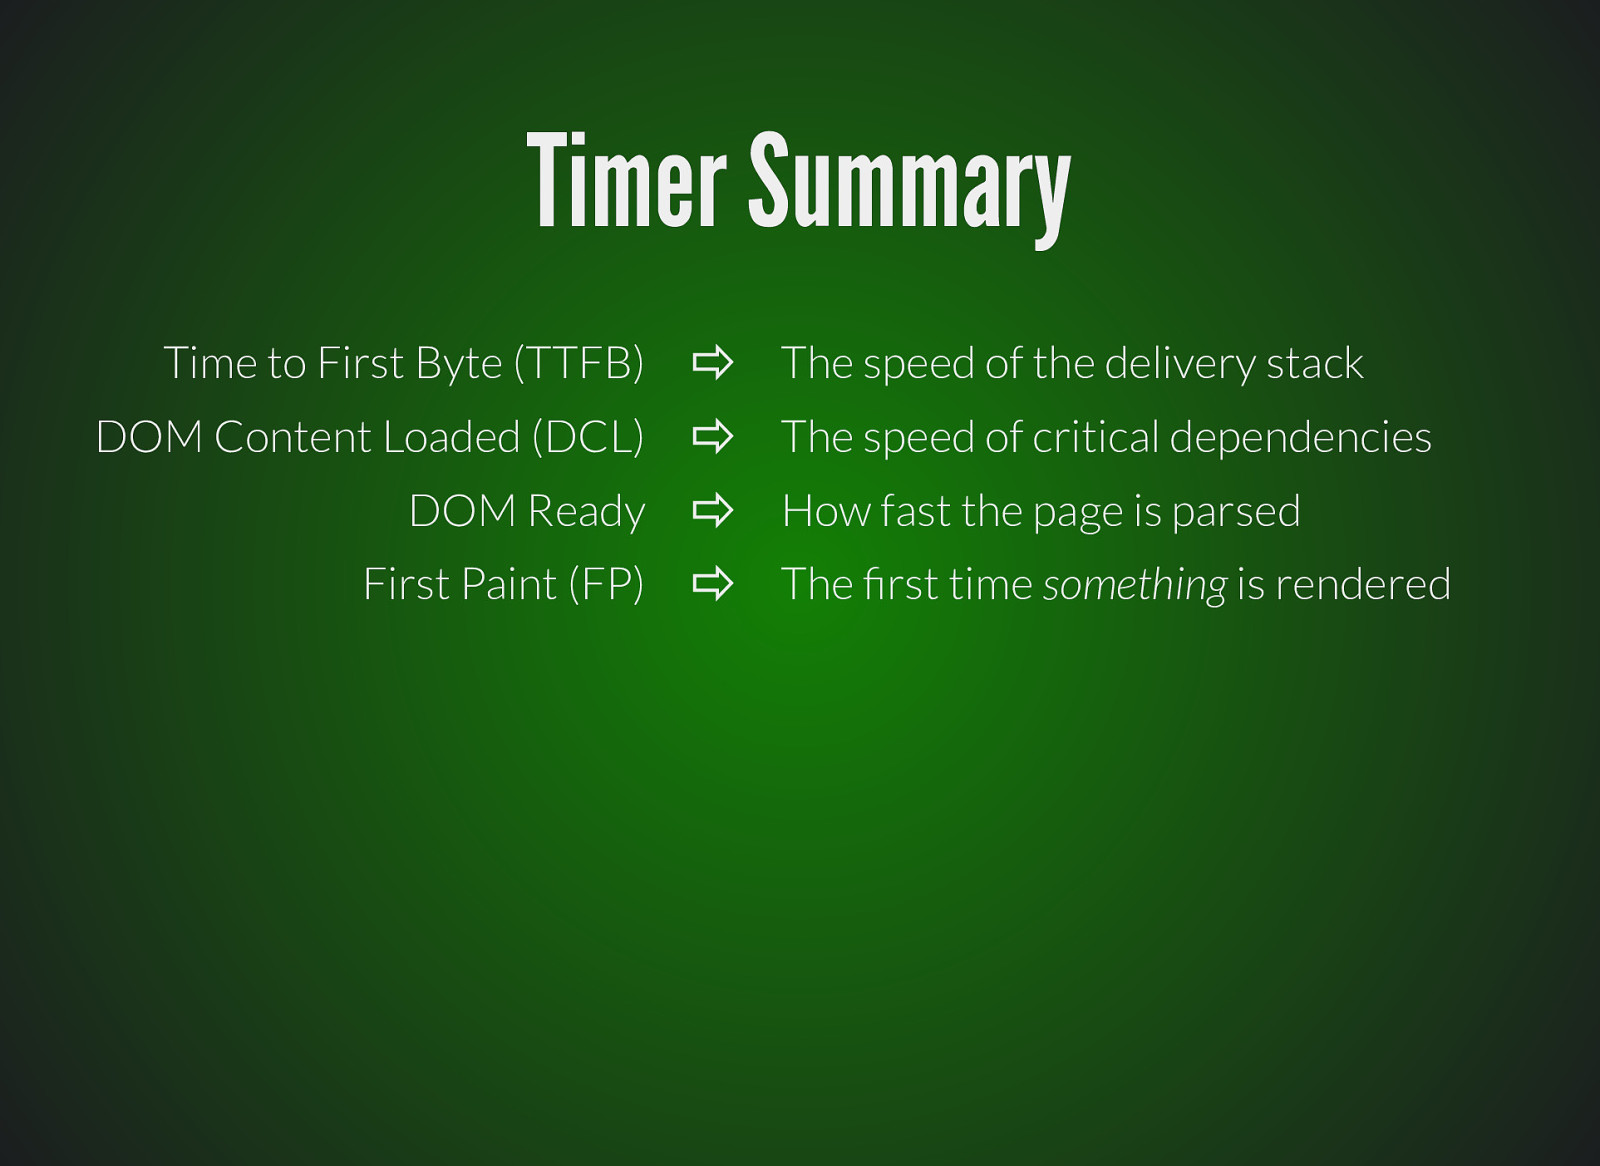
Timer Summary Time to First Byte (TTFB) DOM Content Loaded (DCL) DOM Ready First Paint (FP) ⇨ ⇨ ⇨ ⇨ The speed of the delivery stack The speed of critical dependencies How fast the page is parsed The rst time something is rendered
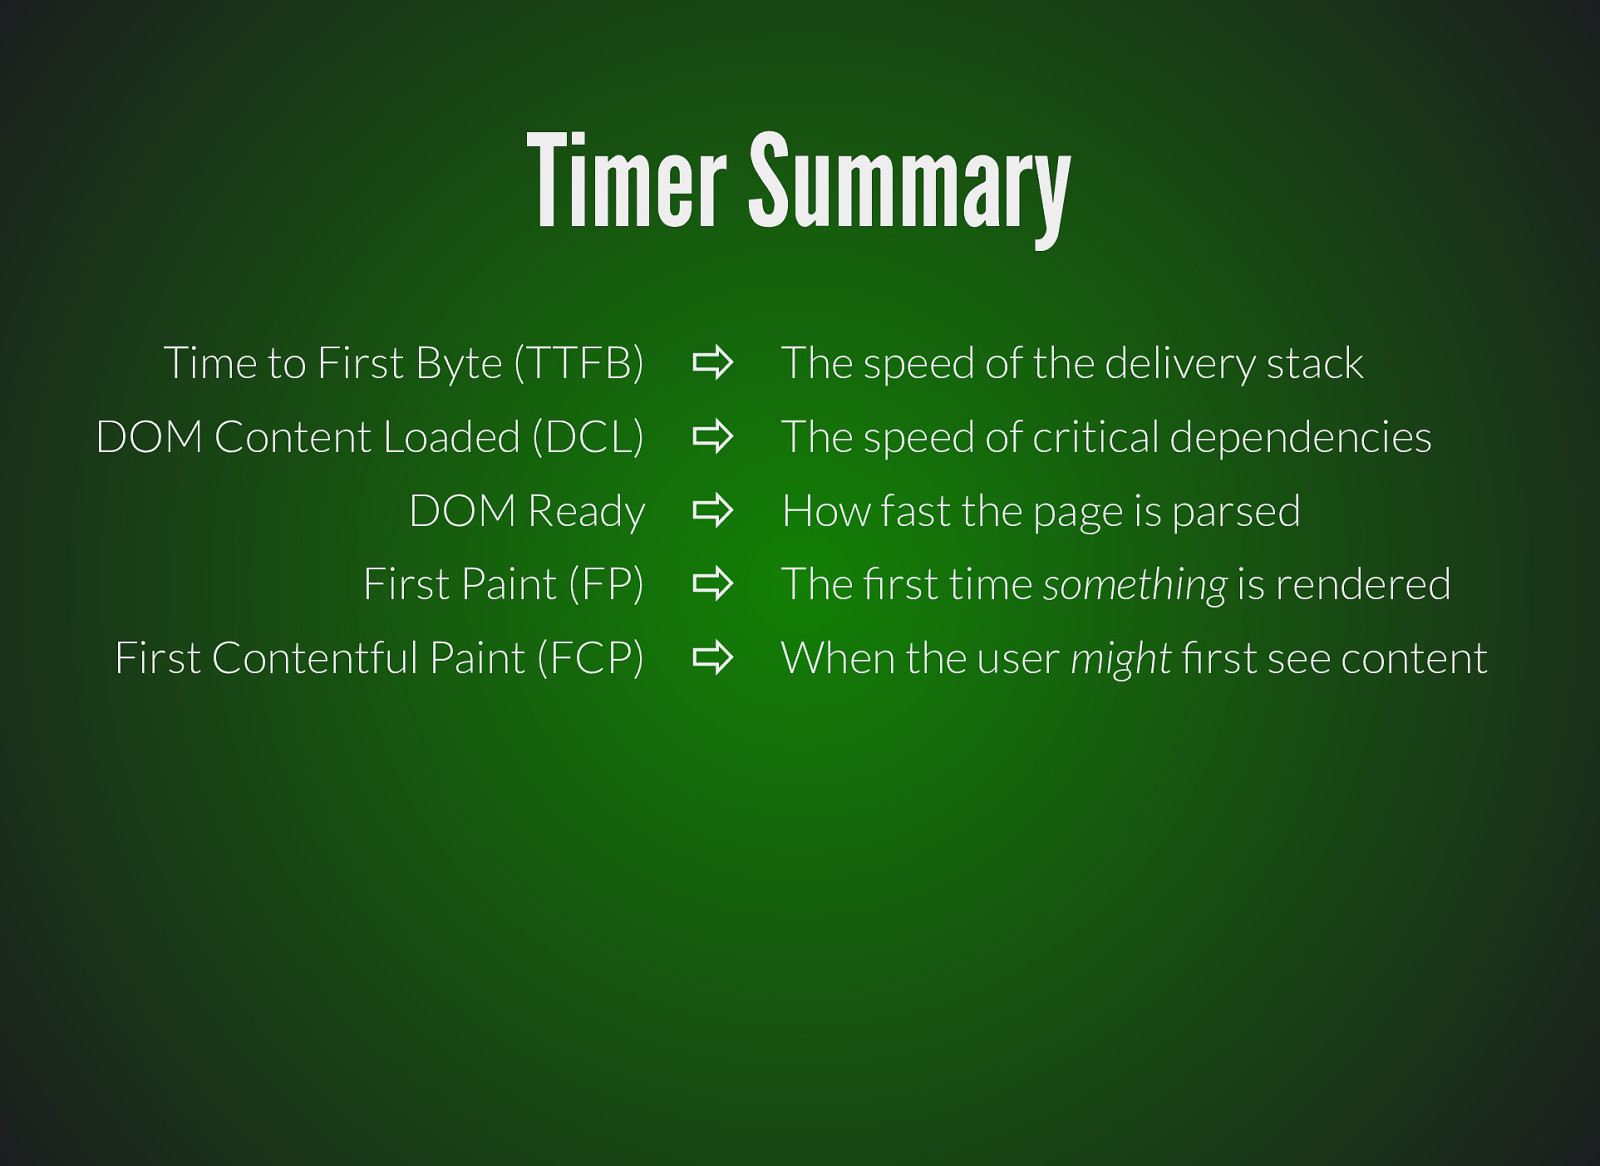
Timer Summary Time to First Byte (TTFB) DOM Content Loaded (DCL) DOM Ready First Paint (FP) First Contentful Paint (FCP) ⇨ ⇨ ⇨ ⇨ ⇨ The speed of the delivery stack The speed of critical dependencies How fast the page is parsed The rst time something is rendered When the user might rst see content
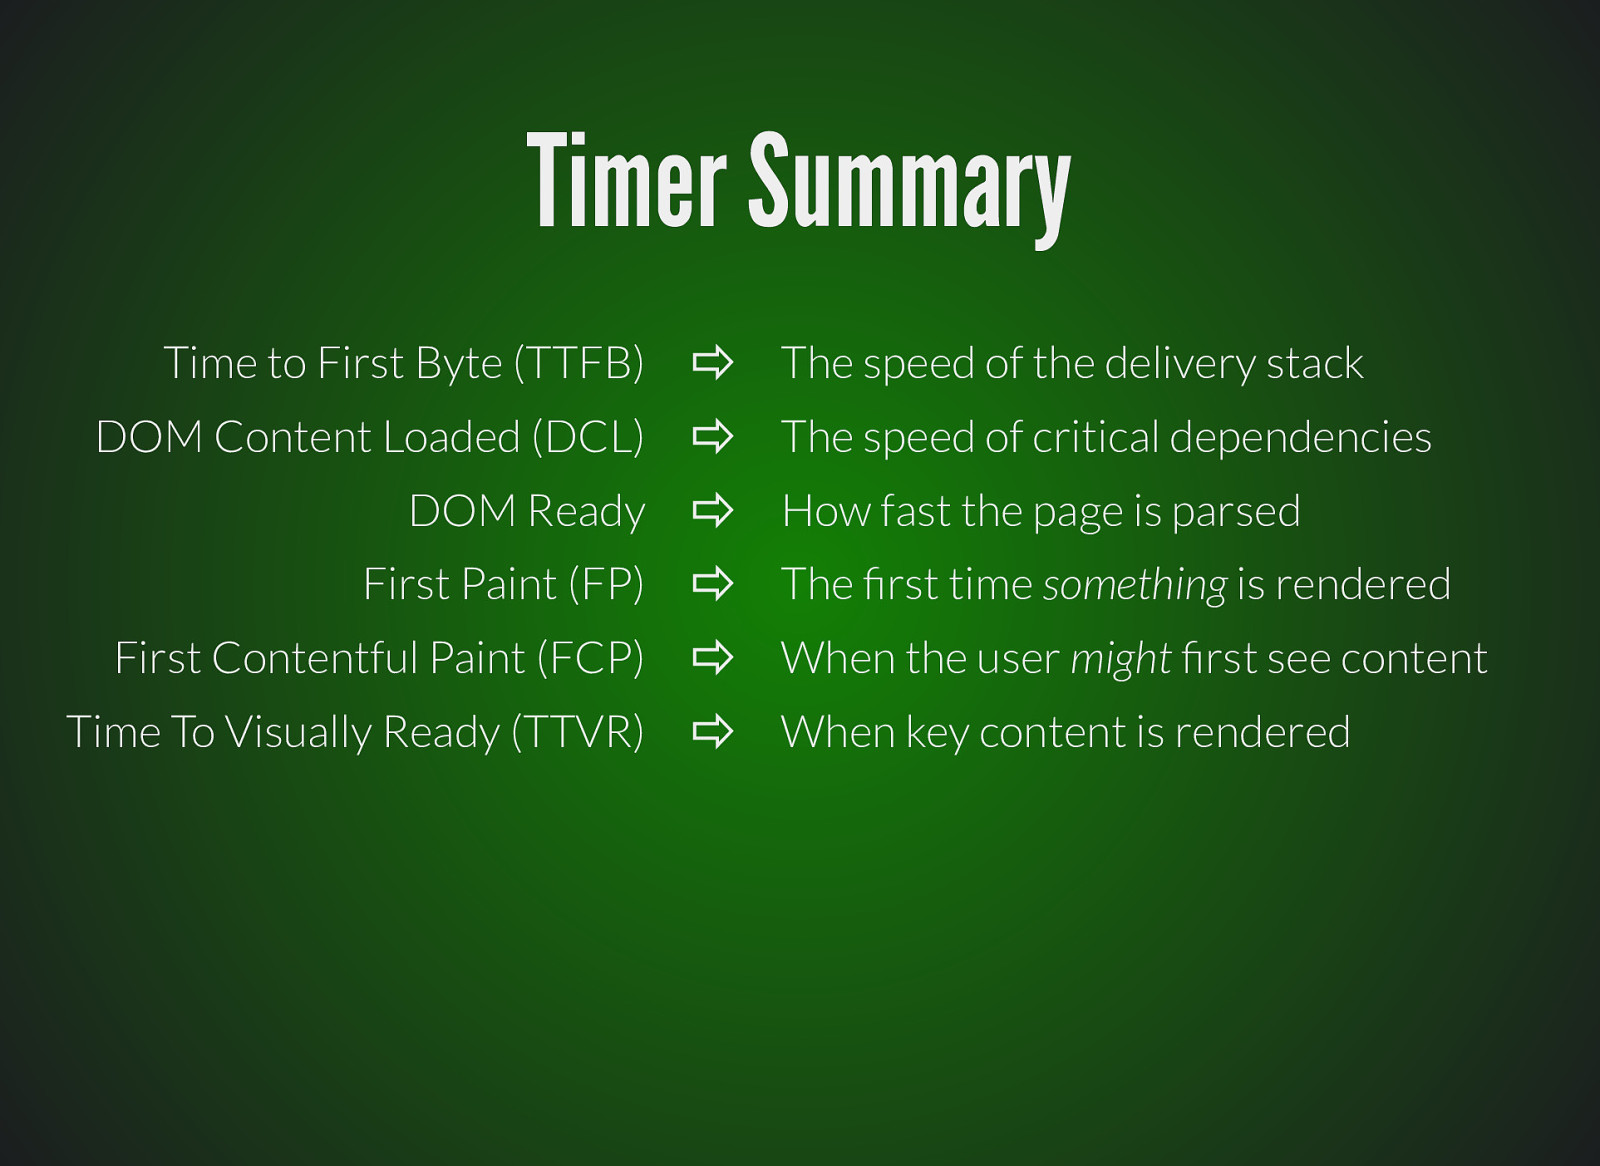
Timer Summary Time to First Byte (TTFB) DOM Content Loaded (DCL) DOM Ready First Paint (FP) First Contentful Paint (FCP) Time To Visually Ready (TTVR) ⇨ ⇨ ⇨ ⇨ ⇨ ⇨ The speed of the delivery stack The speed of critical dependencies How fast the page is parsed The rst time something is rendered When the user might rst see content When key content is rendered
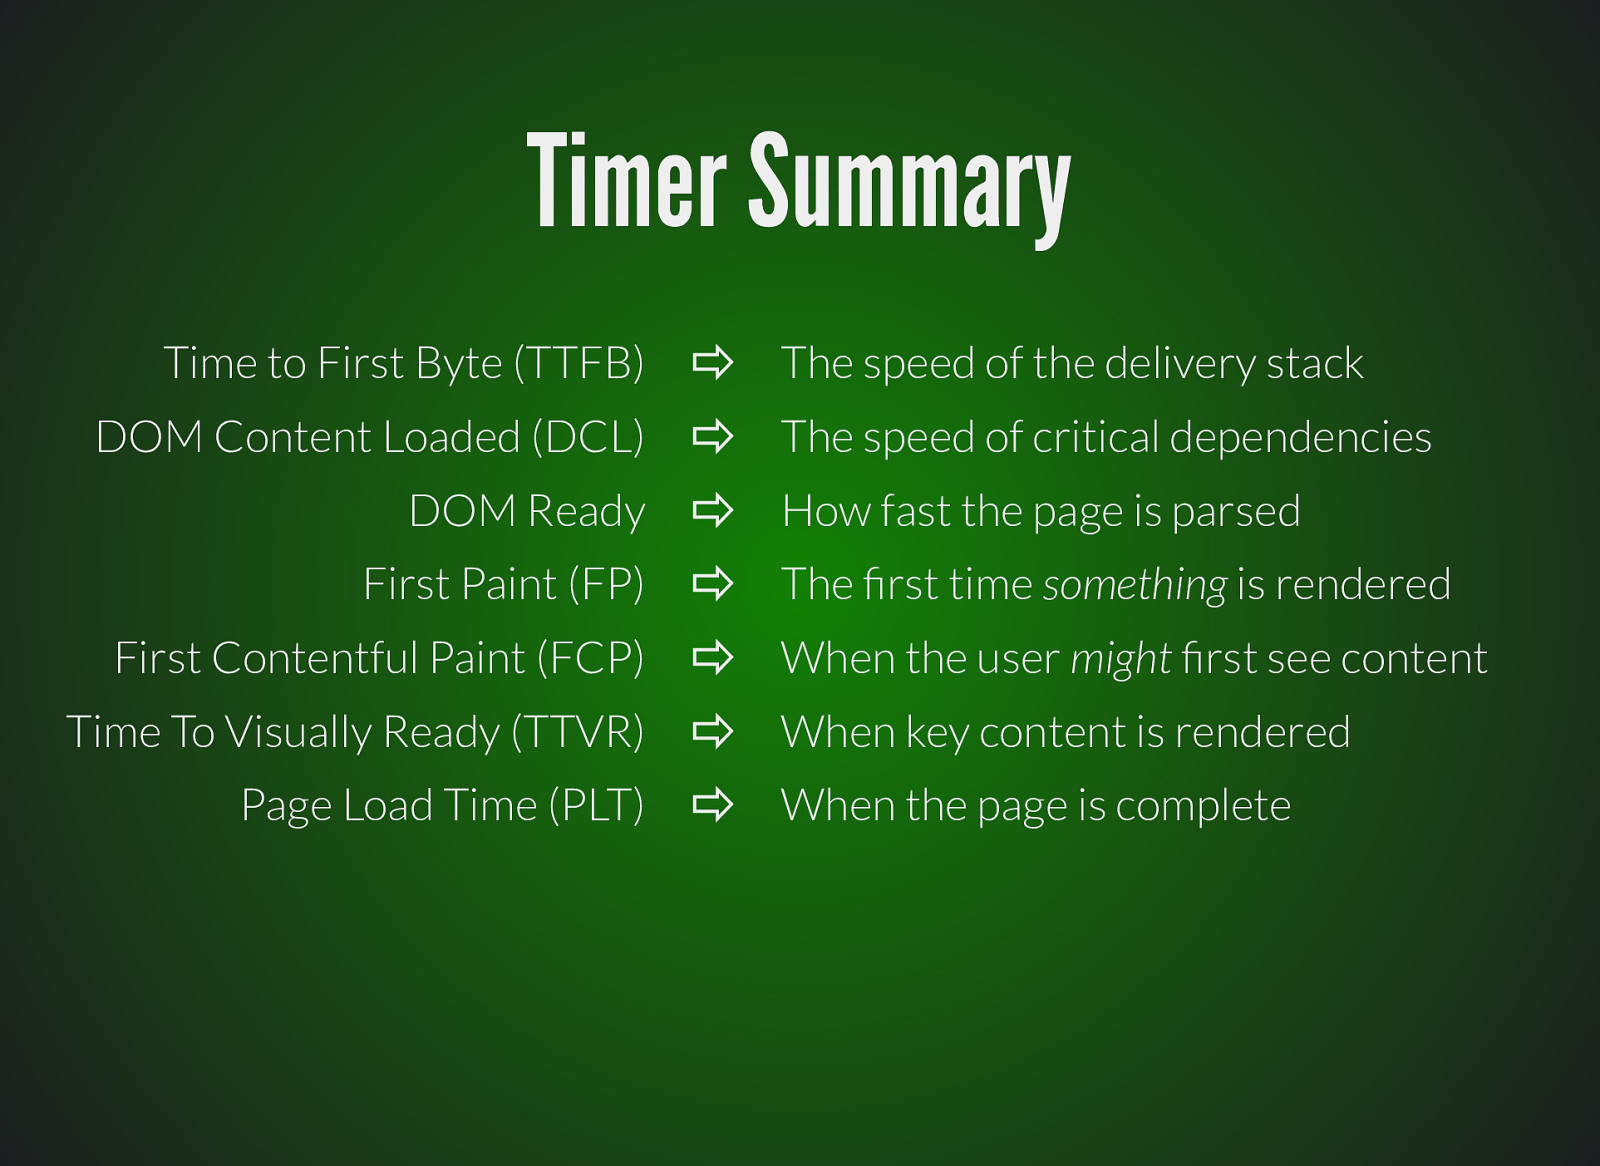
Timer Summary Time to First Byte (TTFB) DOM Content Loaded (DCL) DOM Ready First Paint (FP) First Contentful Paint (FCP) Time To Visually Ready (TTVR) Page Load Time (PLT) ⇨ ⇨ ⇨ ⇨ ⇨ ⇨ ⇨ The speed of the delivery stack The speed of critical dependencies How fast the page is parsed The rst time something is rendered When the user might rst see content When key content is rendered When the page is complete
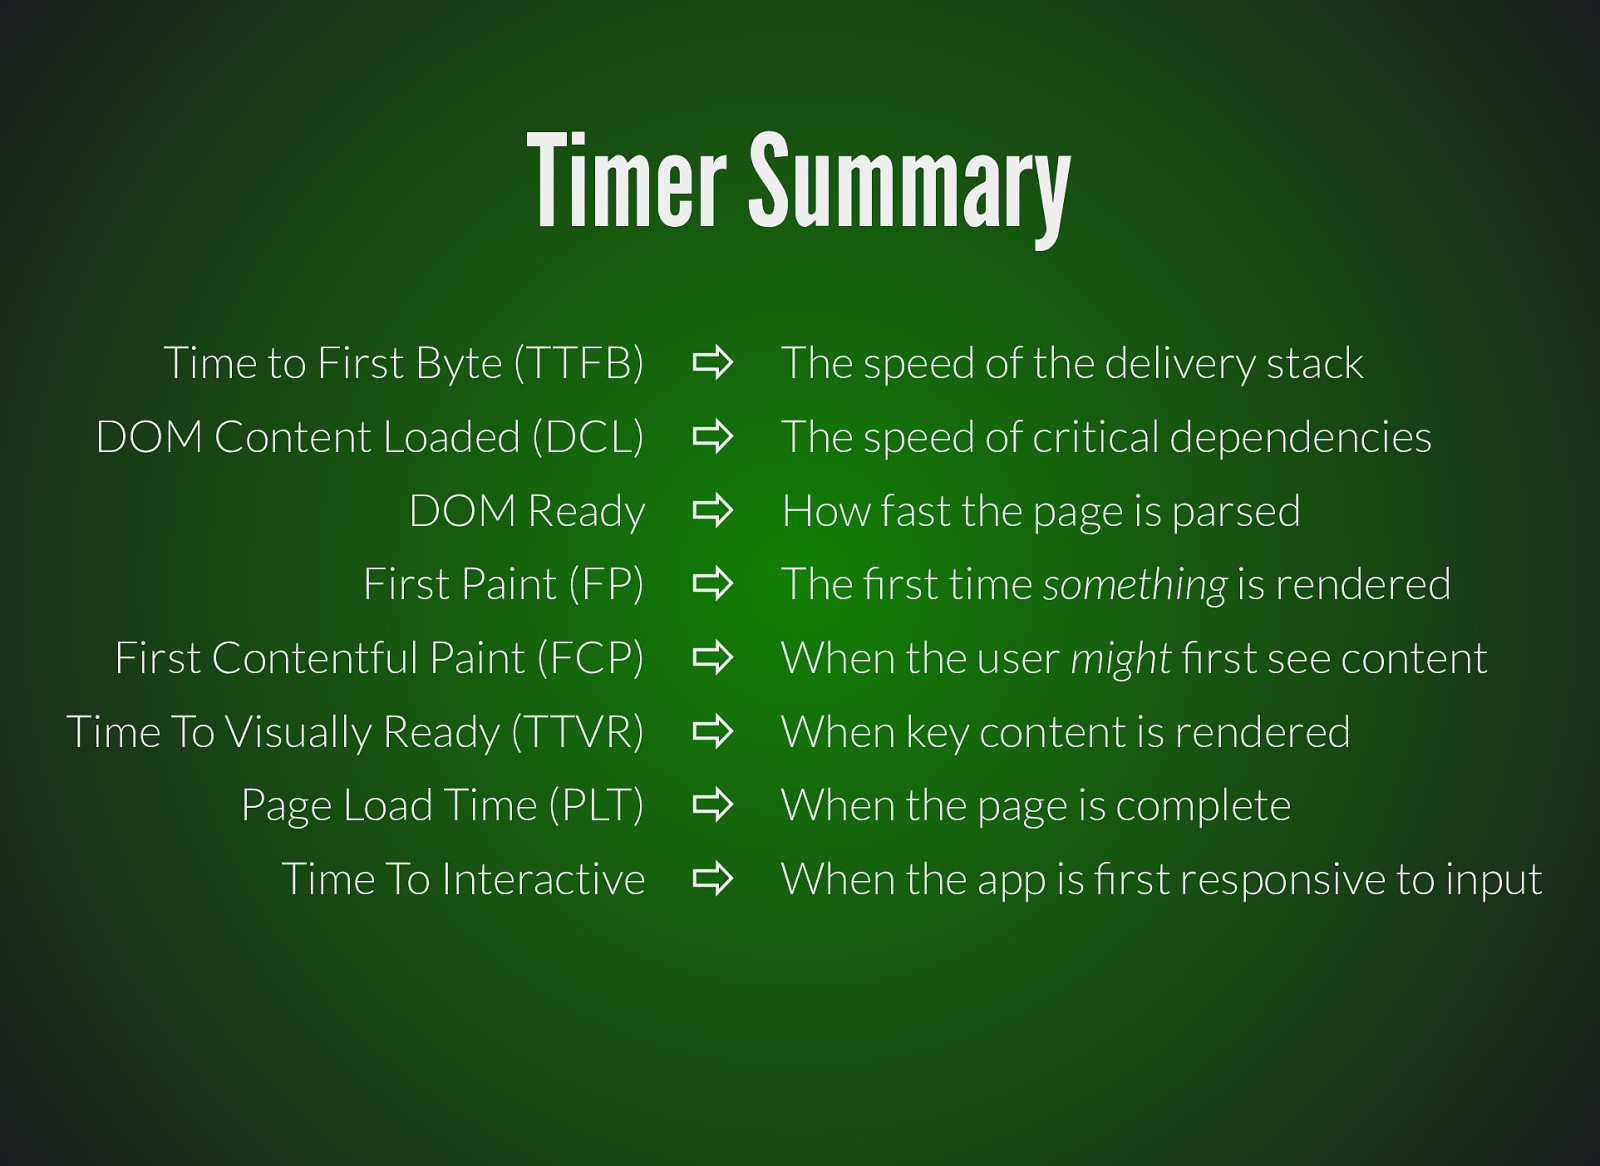
Timer Summary Time to First Byte (TTFB) DOM Content Loaded (DCL) DOM Ready First Paint (FP) First Contentful Paint (FCP) Time To Visually Ready (TTVR) Page Load Time (PLT) Time To Interactive ⇨ ⇨ ⇨ ⇨ ⇨ ⇨ ⇨ ⇨ The speed of the delivery stack The speed of critical dependencies How fast the page is parsed The rst time something is rendered When the user might rst see content When key content is rendered When the page is complete When the app is rst responsive to input
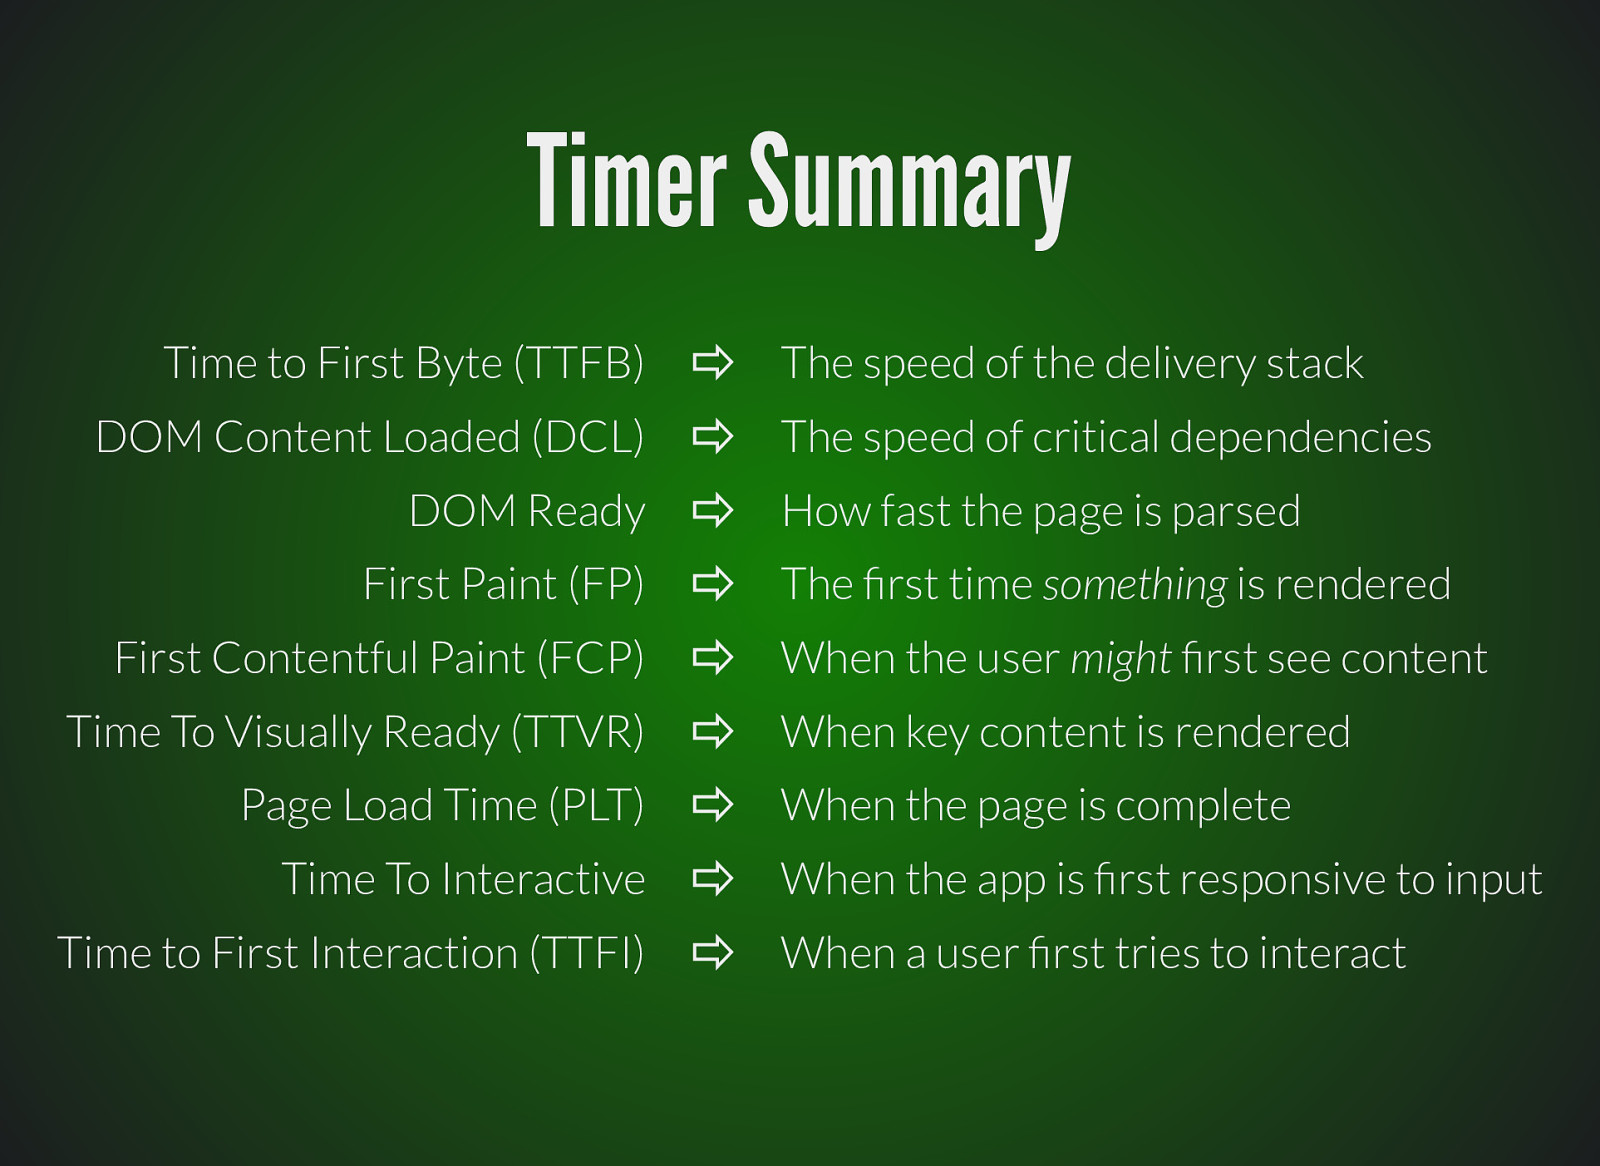
Timer Summary Time to First Byte (TTFB) DOM Content Loaded (DCL) DOM Ready First Paint (FP) First Contentful Paint (FCP) Time To Visually Ready (TTVR) Page Load Time (PLT) Time To Interactive Time to First Interaction (TTFI) ⇨ ⇨ ⇨ ⇨ ⇨ ⇨ ⇨ ⇨ ⇨ The speed of the delivery stack The speed of critical dependencies How fast the page is parsed The rst time something is rendered When the user might rst see content When key content is rendered When the page is complete When the app is rst responsive to input When a user rst tries to interact
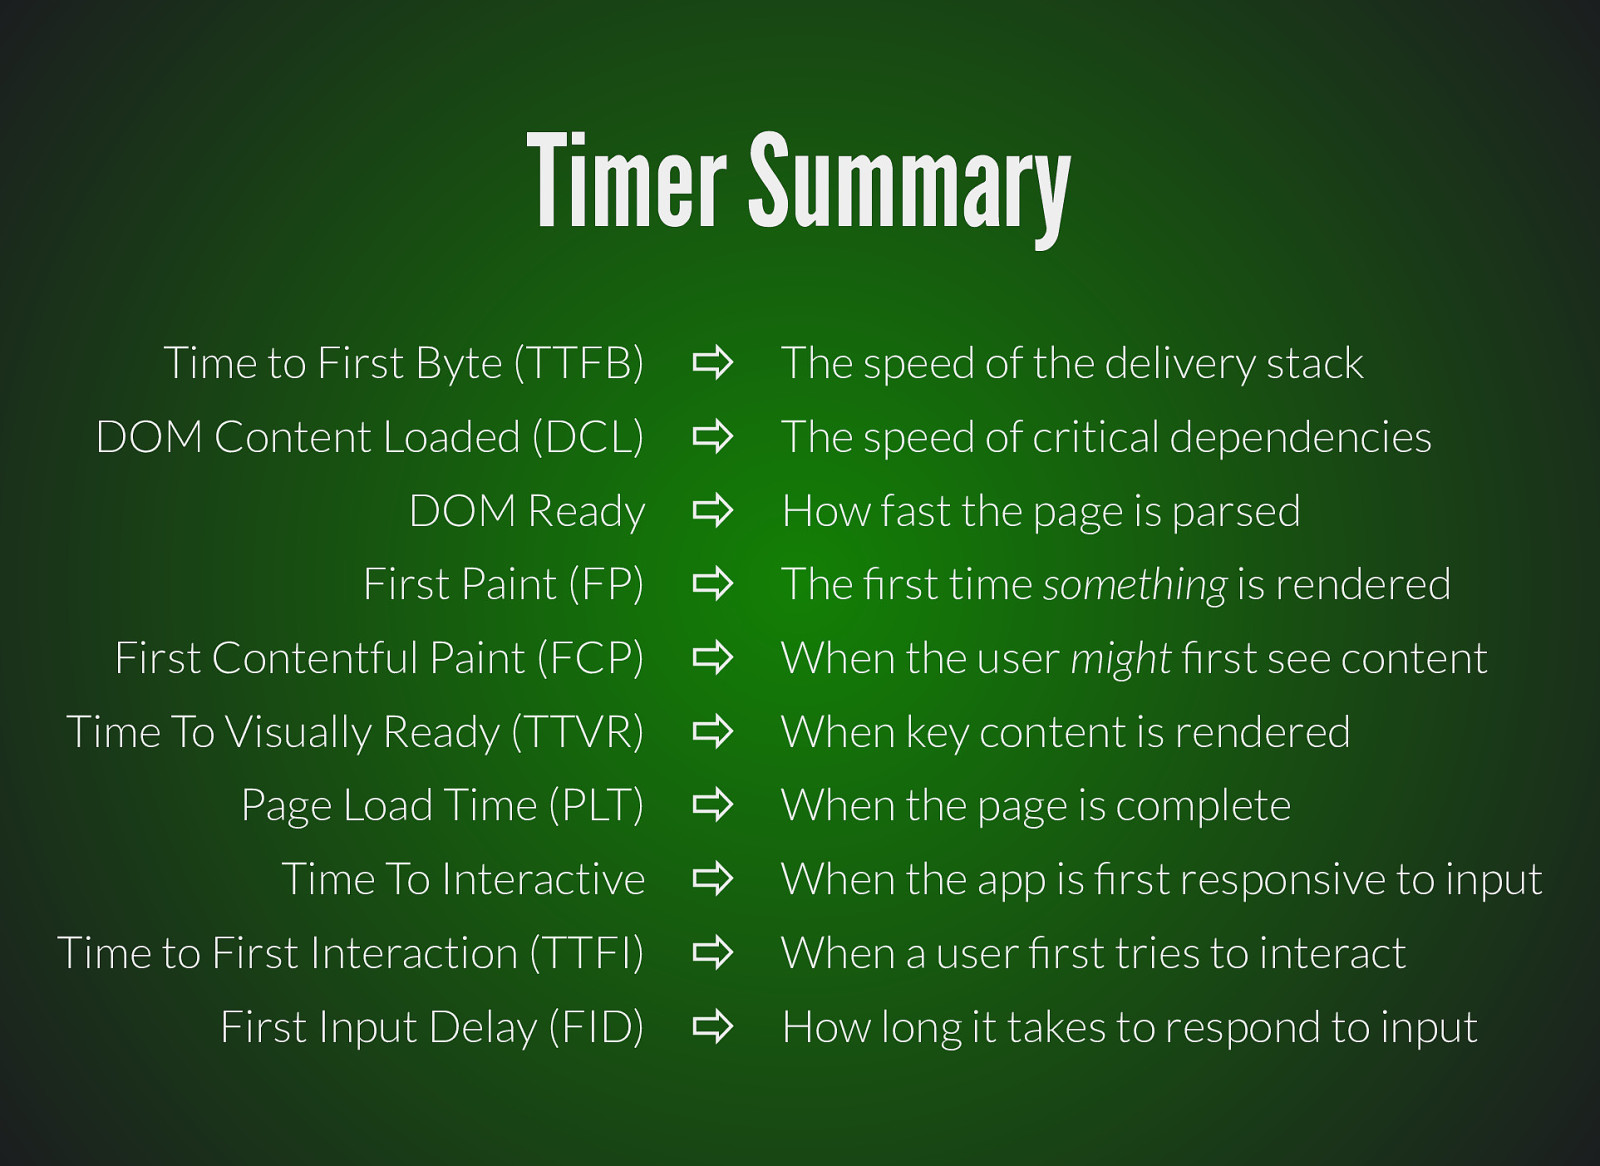
Timer Summary Time to First Byte (TTFB) DOM Content Loaded (DCL) DOM Ready First Paint (FP) First Contentful Paint (FCP) Time To Visually Ready (TTVR) Page Load Time (PLT) Time To Interactive Time to First Interaction (TTFI) First Input Delay (FID) ⇨ ⇨ ⇨ ⇨ ⇨ ⇨ ⇨ ⇨ ⇨ ⇨ The speed of the delivery stack The speed of critical dependencies How fast the page is parsed The rst time something is rendered When the user might rst see content When key content is rendered When the page is complete When the app is rst responsive to input When a user rst tries to interact How long it takes to respond to input
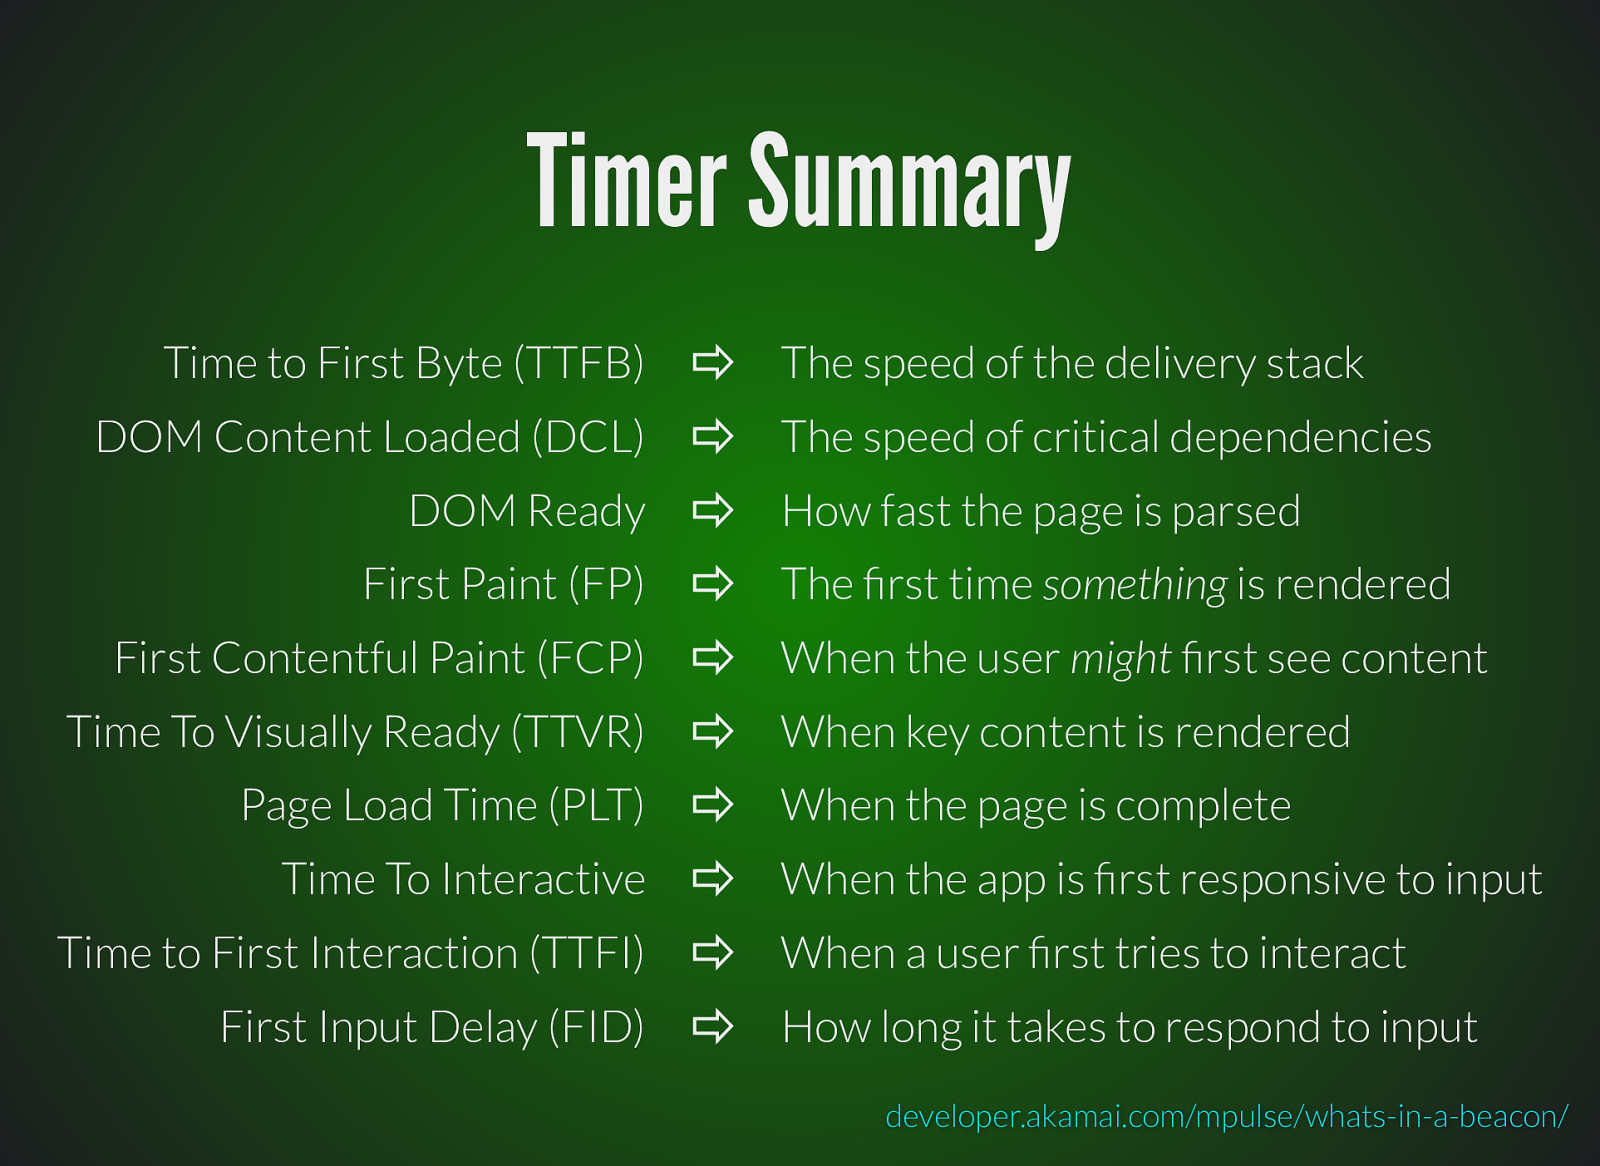
Timer Summary Time to First Byte (TTFB) DOM Content Loaded (DCL) DOM Ready First Paint (FP) First Contentful Paint (FCP) Time To Visually Ready (TTVR) Page Load Time (PLT) Time To Interactive Time to First Interaction (TTFI) First Input Delay (FID) ⇨ ⇨ ⇨ ⇨ ⇨ ⇨ ⇨ ⇨ ⇨ ⇨ The speed of the delivery stack The speed of critical dependencies How fast the page is parsed The rst time something is rendered When the user might rst see content When key content is rendered When the page is complete When the app is rst responsive to input When a user rst tries to interact How long it takes to respond to input developer.akamai.com/mpulse/whats-in-a-beacon/

My requirements (for multi-app analysis)

My requirements (for multi-app analysis)
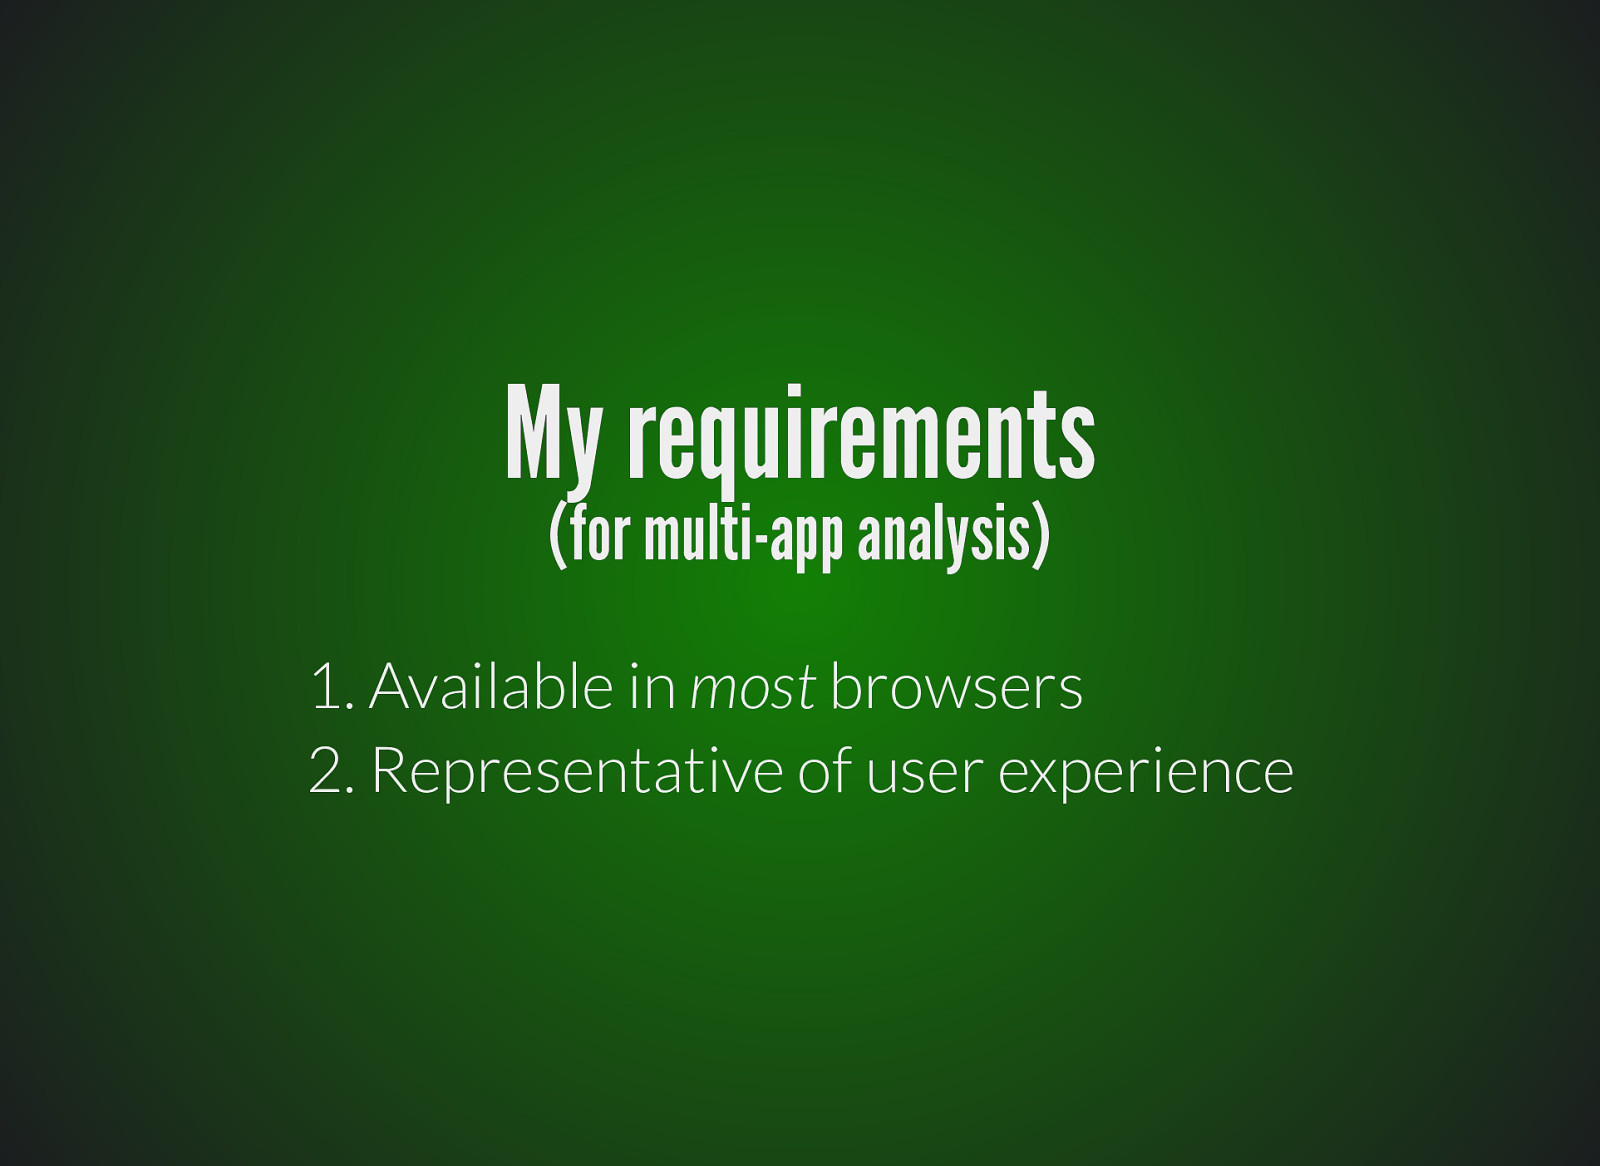
My requirements (for multi-app analysis)

< psychology >
Objective vs Subjective time Users don’t measure your speed with a stopwatch
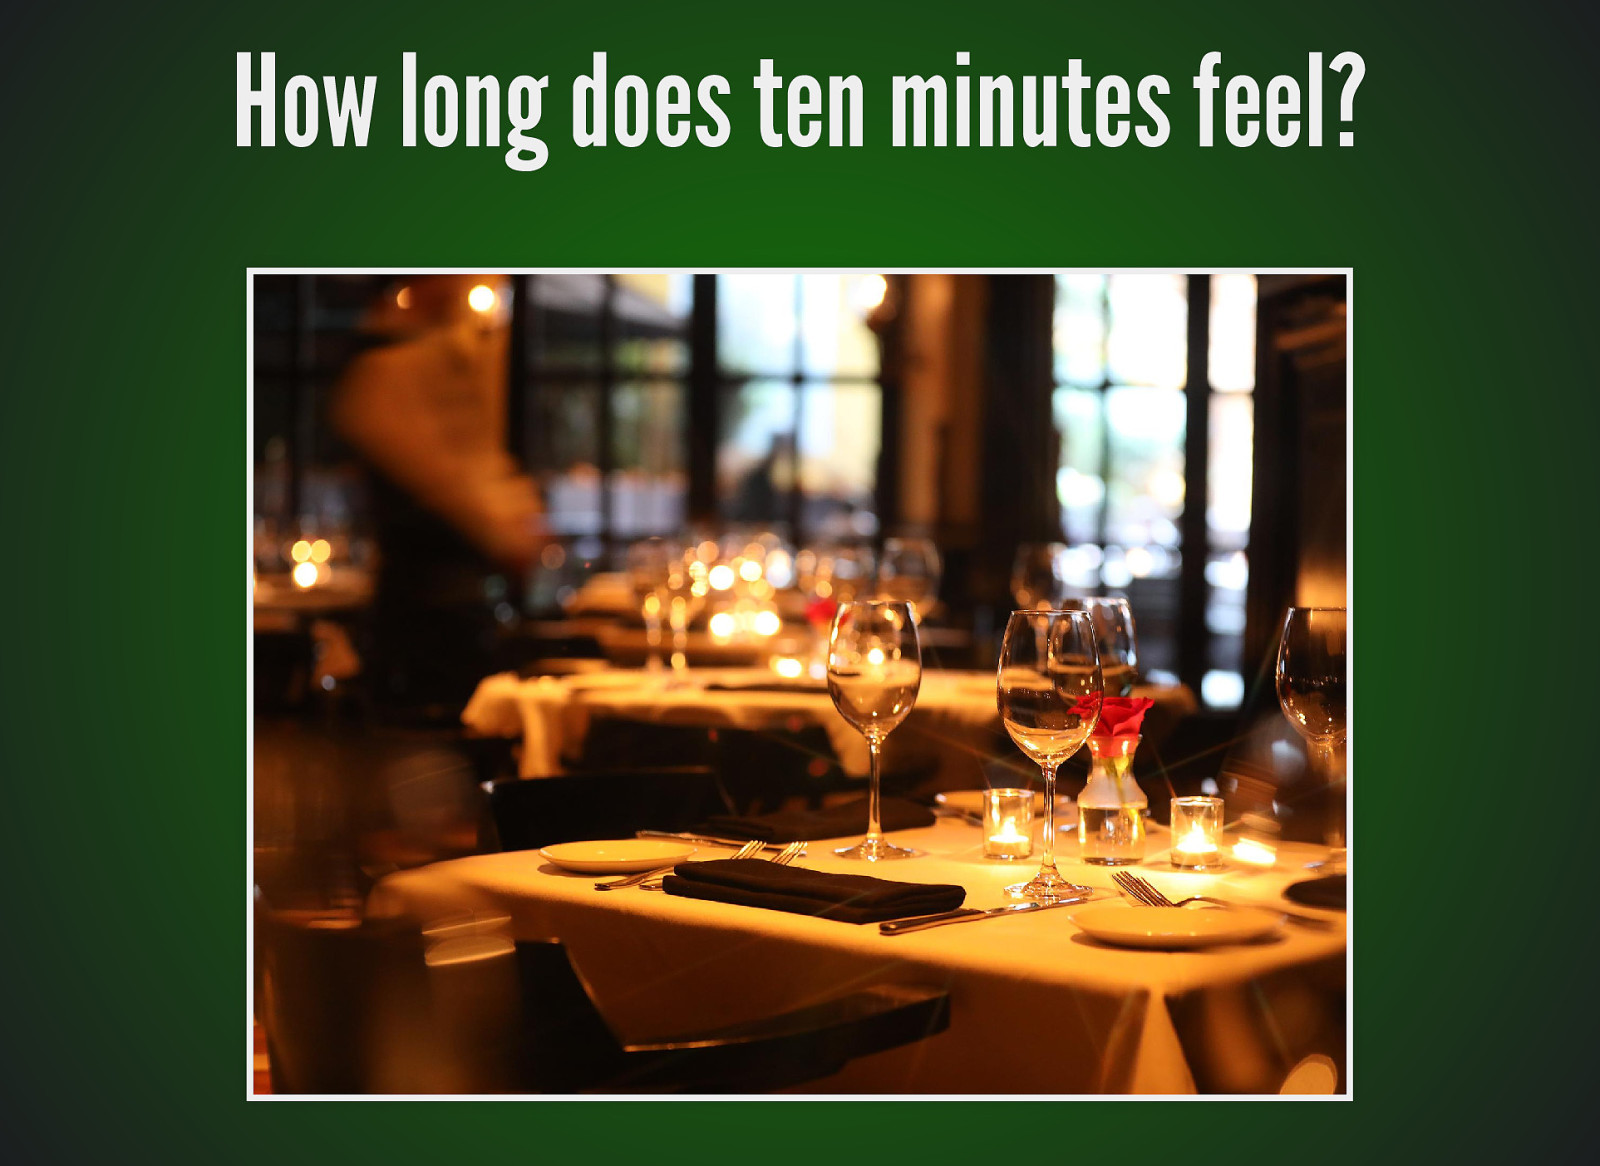
How long does ten minutes feel?
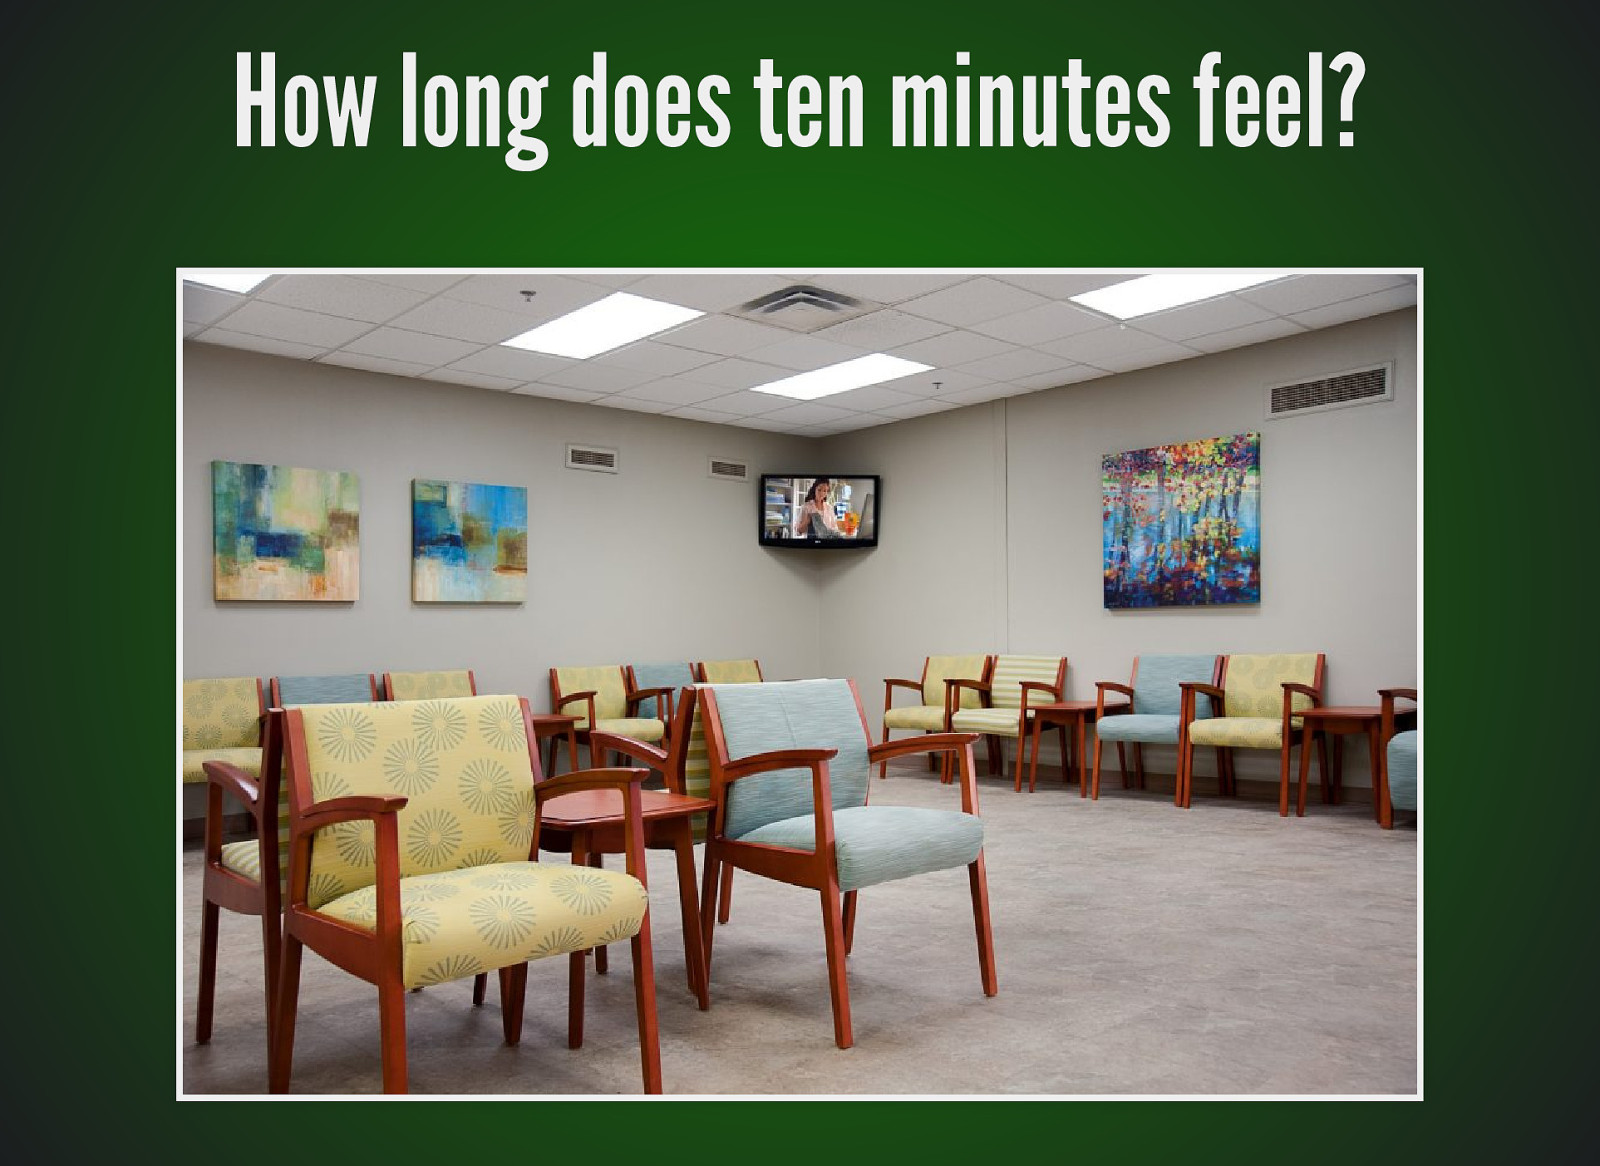
How long does ten minutes feel?
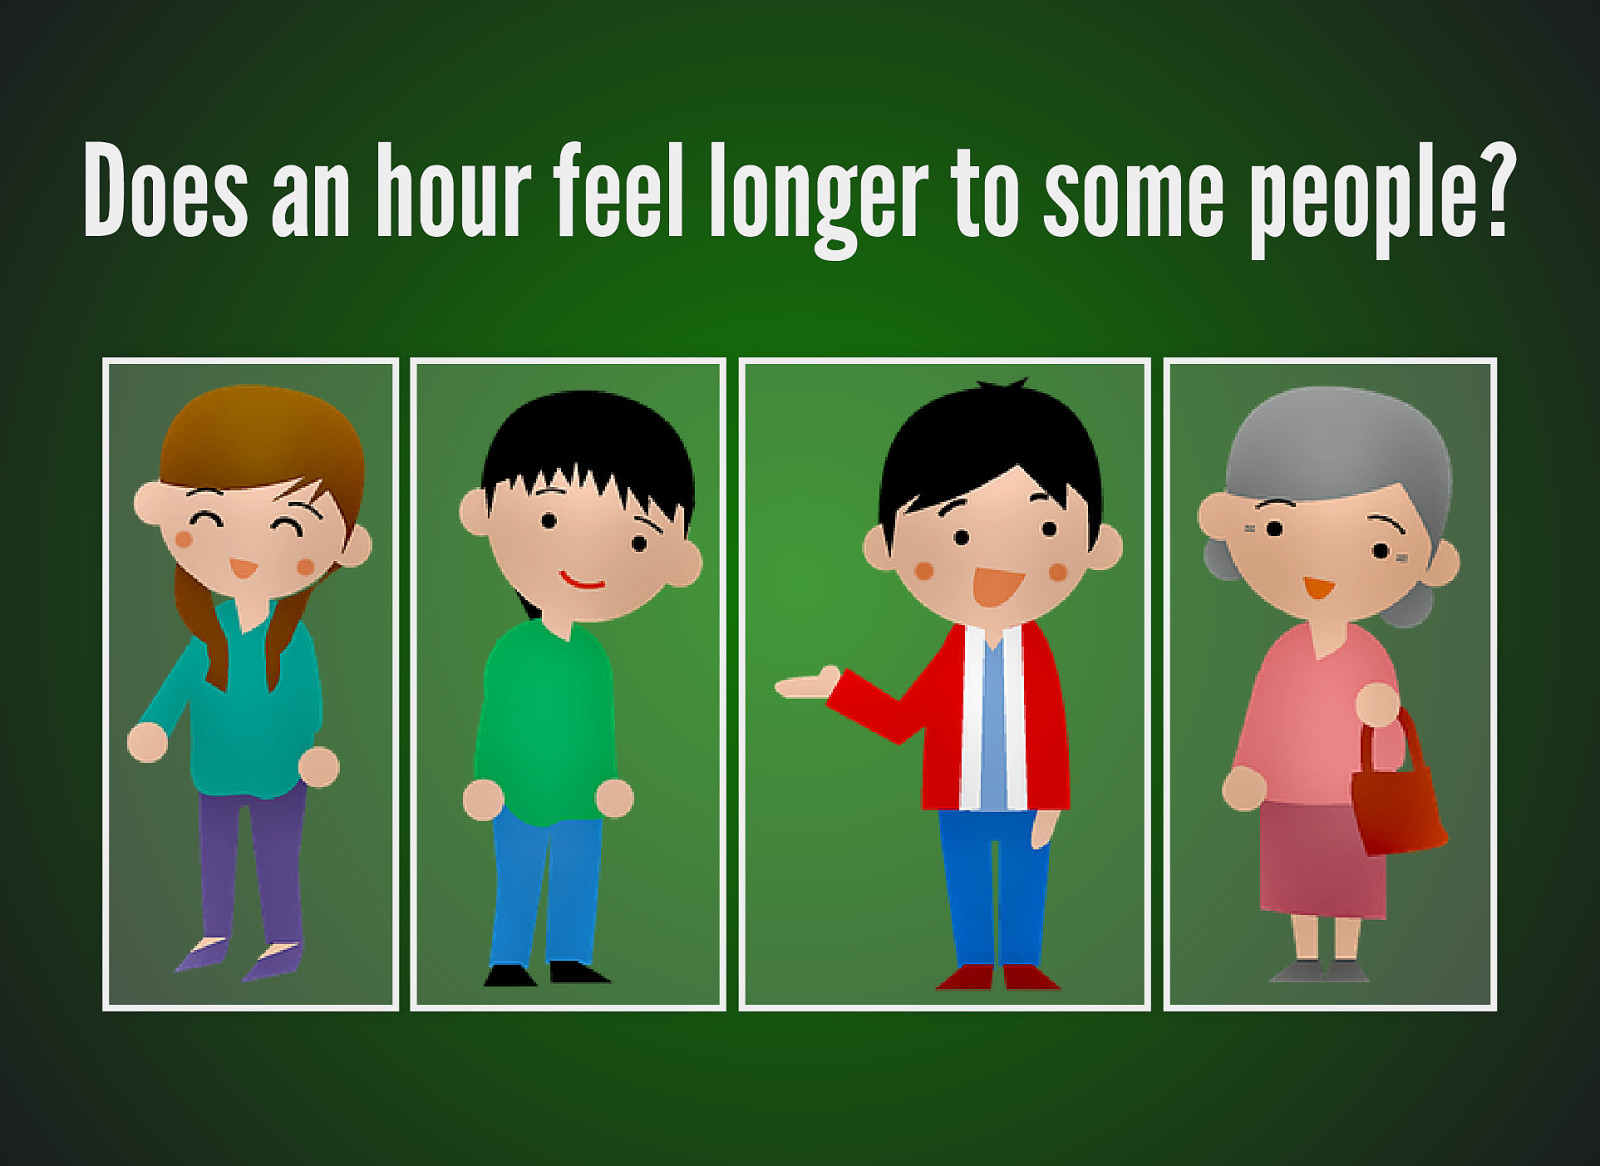
Does an hour feel longer to some people?
Our perception of time is subjective… …but our measures are objective
What about web performance?
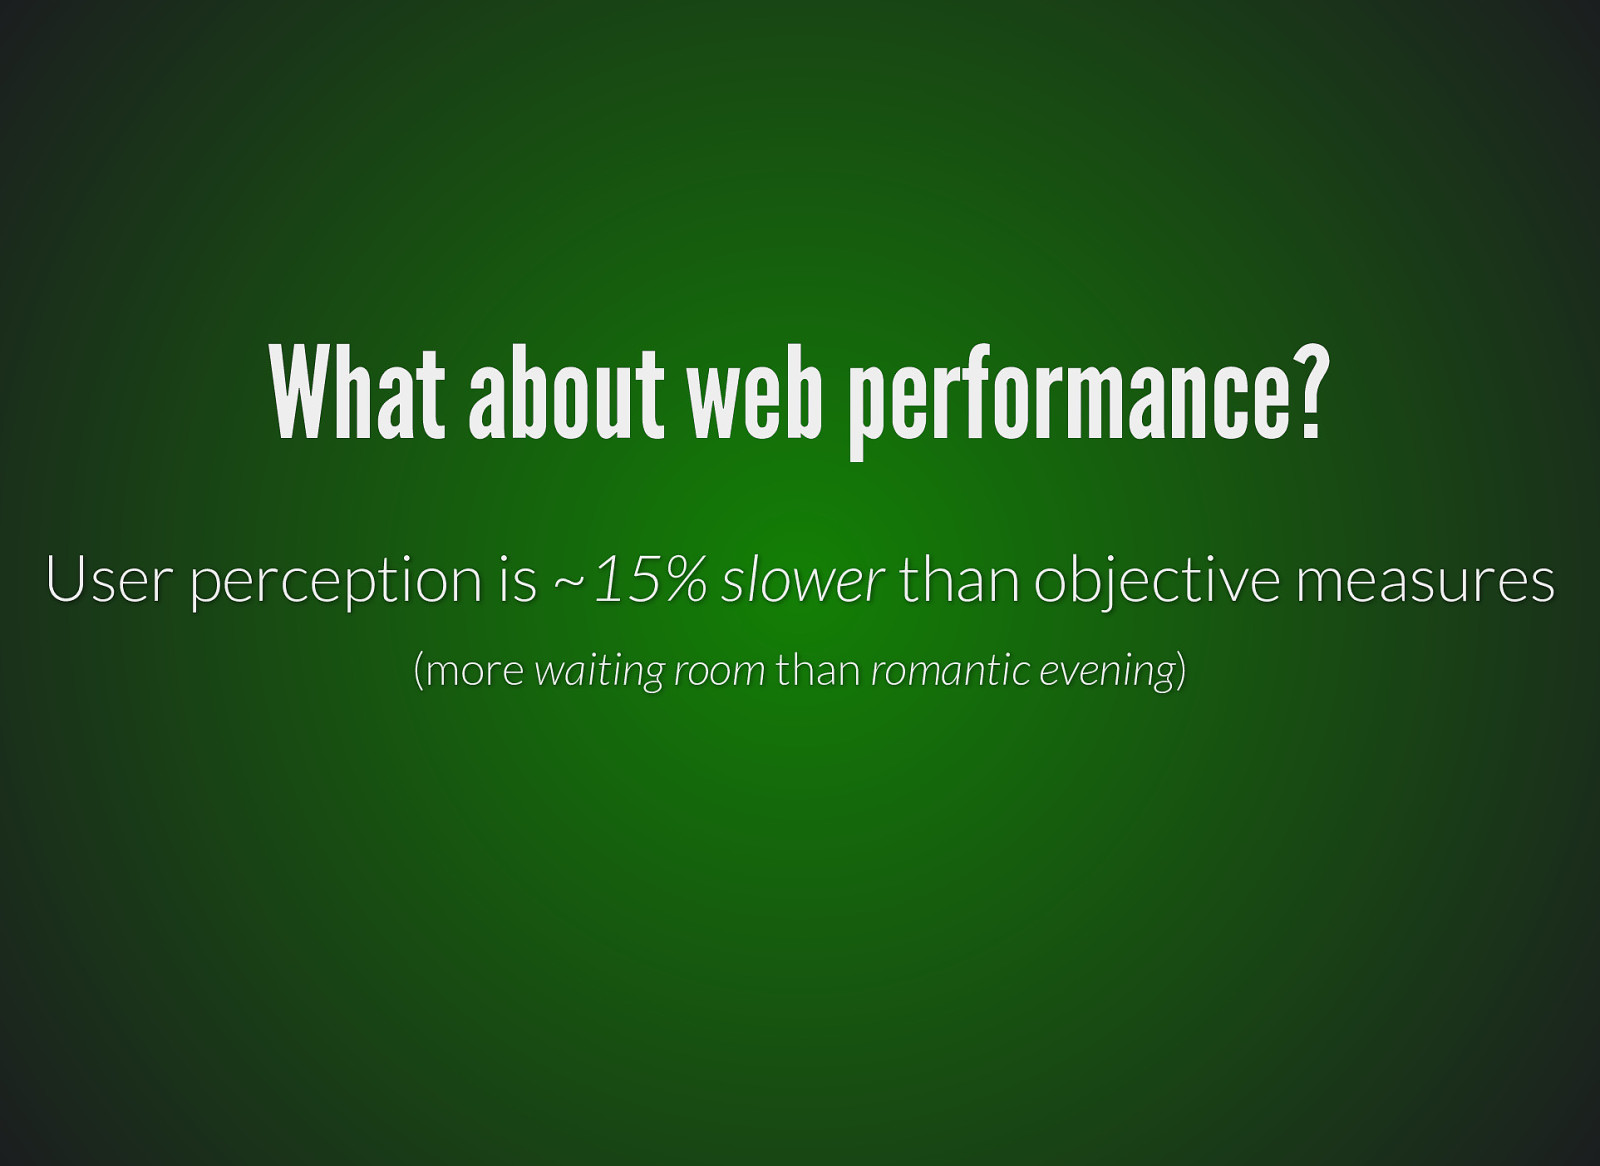
What about web performance? User perception is ~15% slower than objective measures (more waiting room than romantic evening)
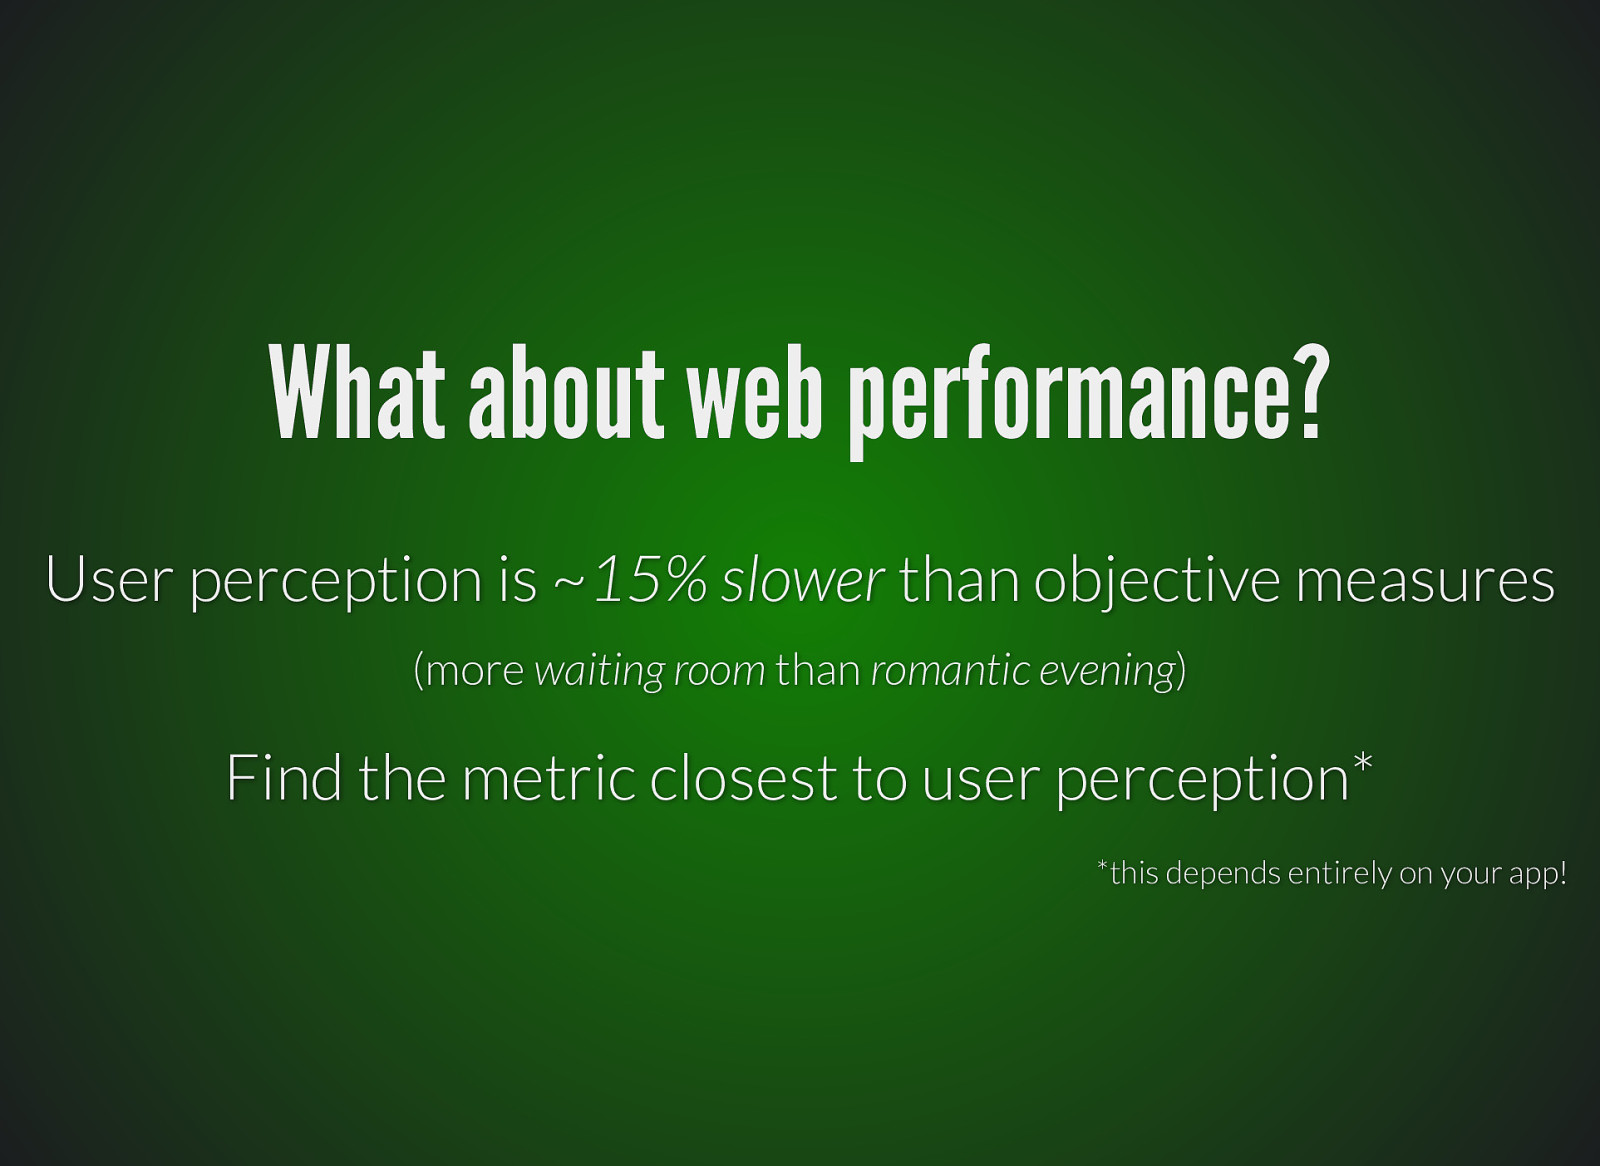
What about web performance? User perception is ~15% slower than objective measures (more waiting room than romantic evening) Find the metric closest to user perception* *this depends entirely on your app!
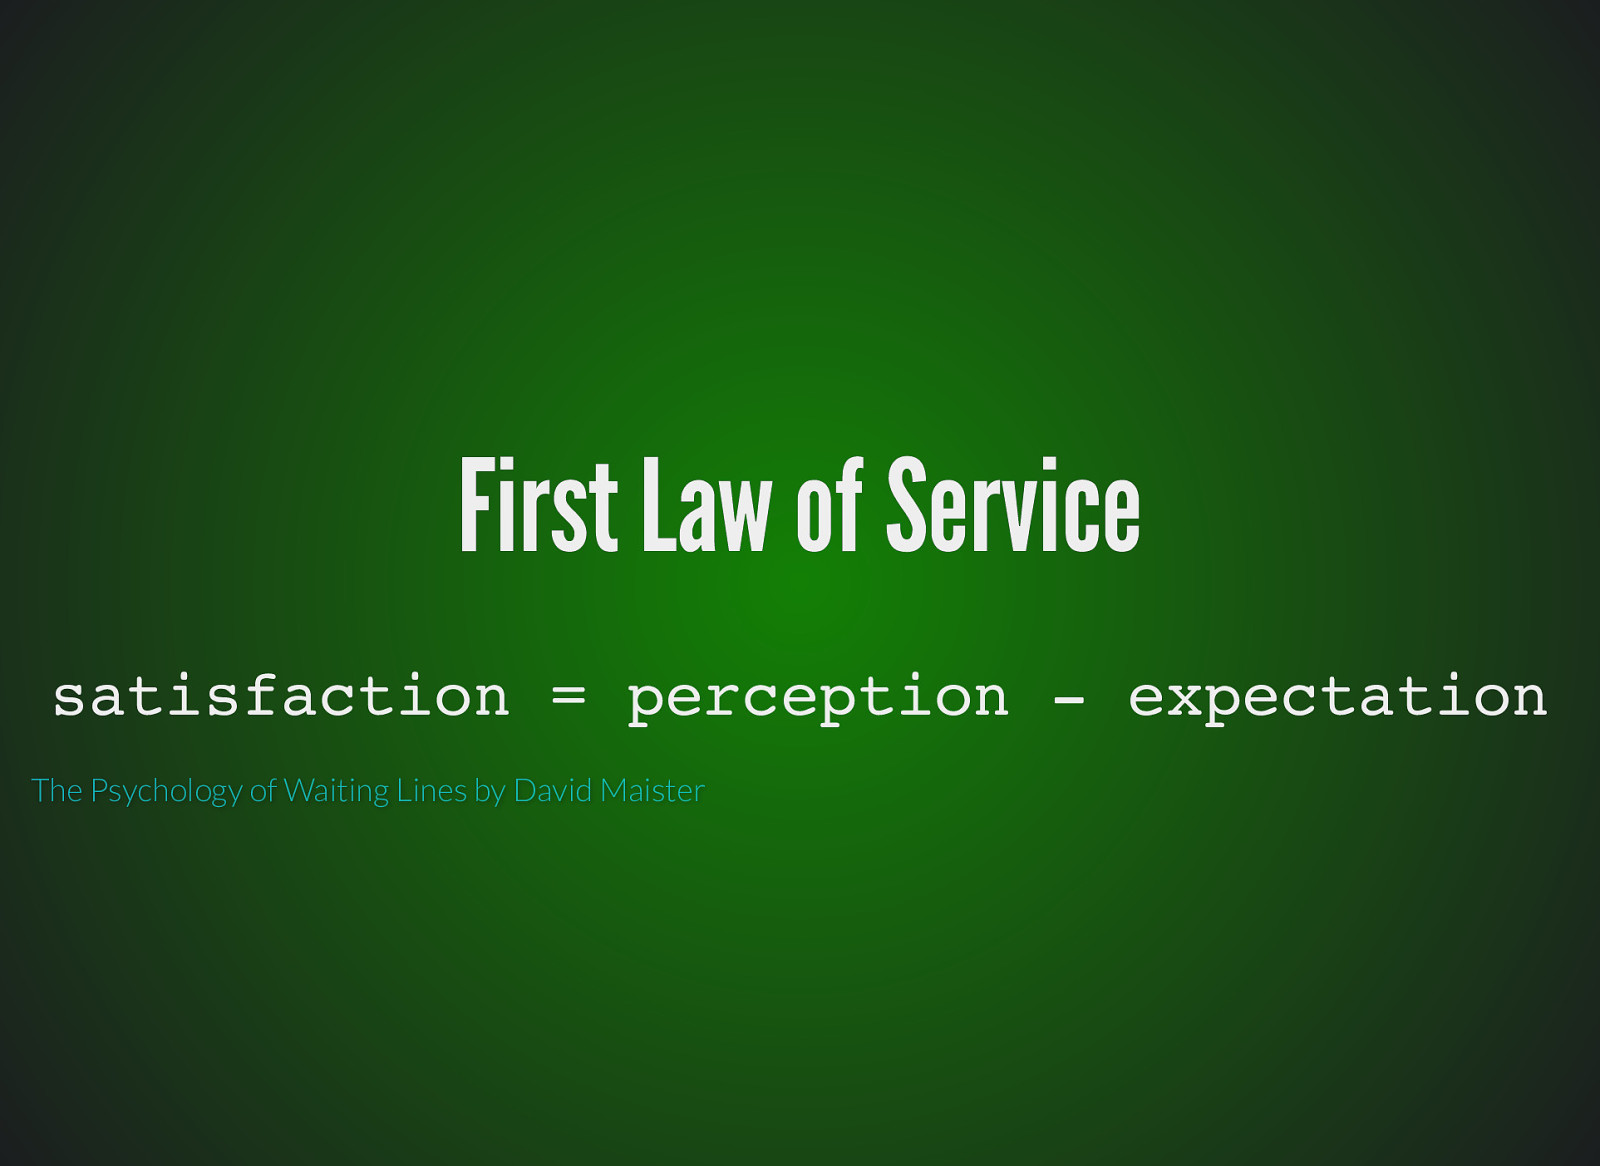
First Law of Service satisfaction = perception - expectation The Psychology of Waiting Lines by David Maister
Speed?
How can we measure speed?
How can we measure speed? Synthetic Tests
How can we measure speed? Synthetic Tests Application Monitoring
How can we measure speed? Synthetic Tests Application Monitoring Analytics
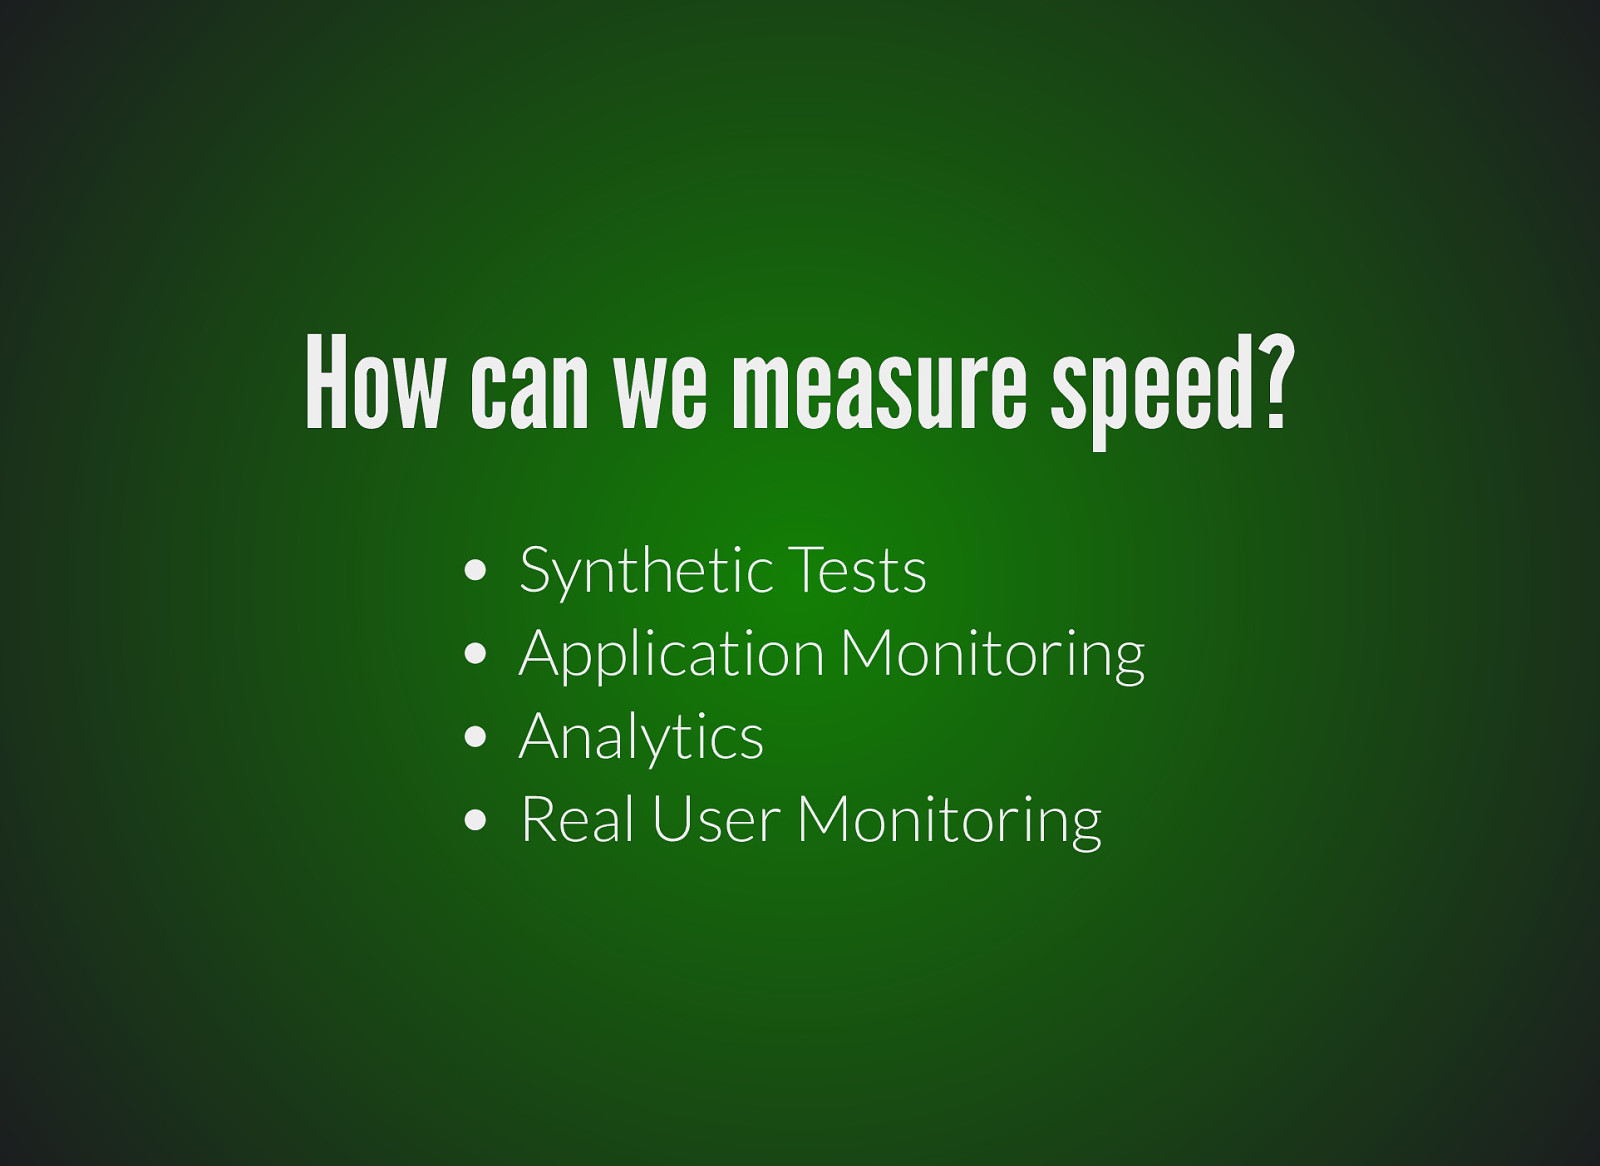
How can we measure speed? Synthetic Tests Application Monitoring Analytics Real User Monitoring
POLL 2 How do you measure speed? Synthetic Tests Application Monitoring Analytics Real User Monitoring

< psychology >

Just Noticeable Difference
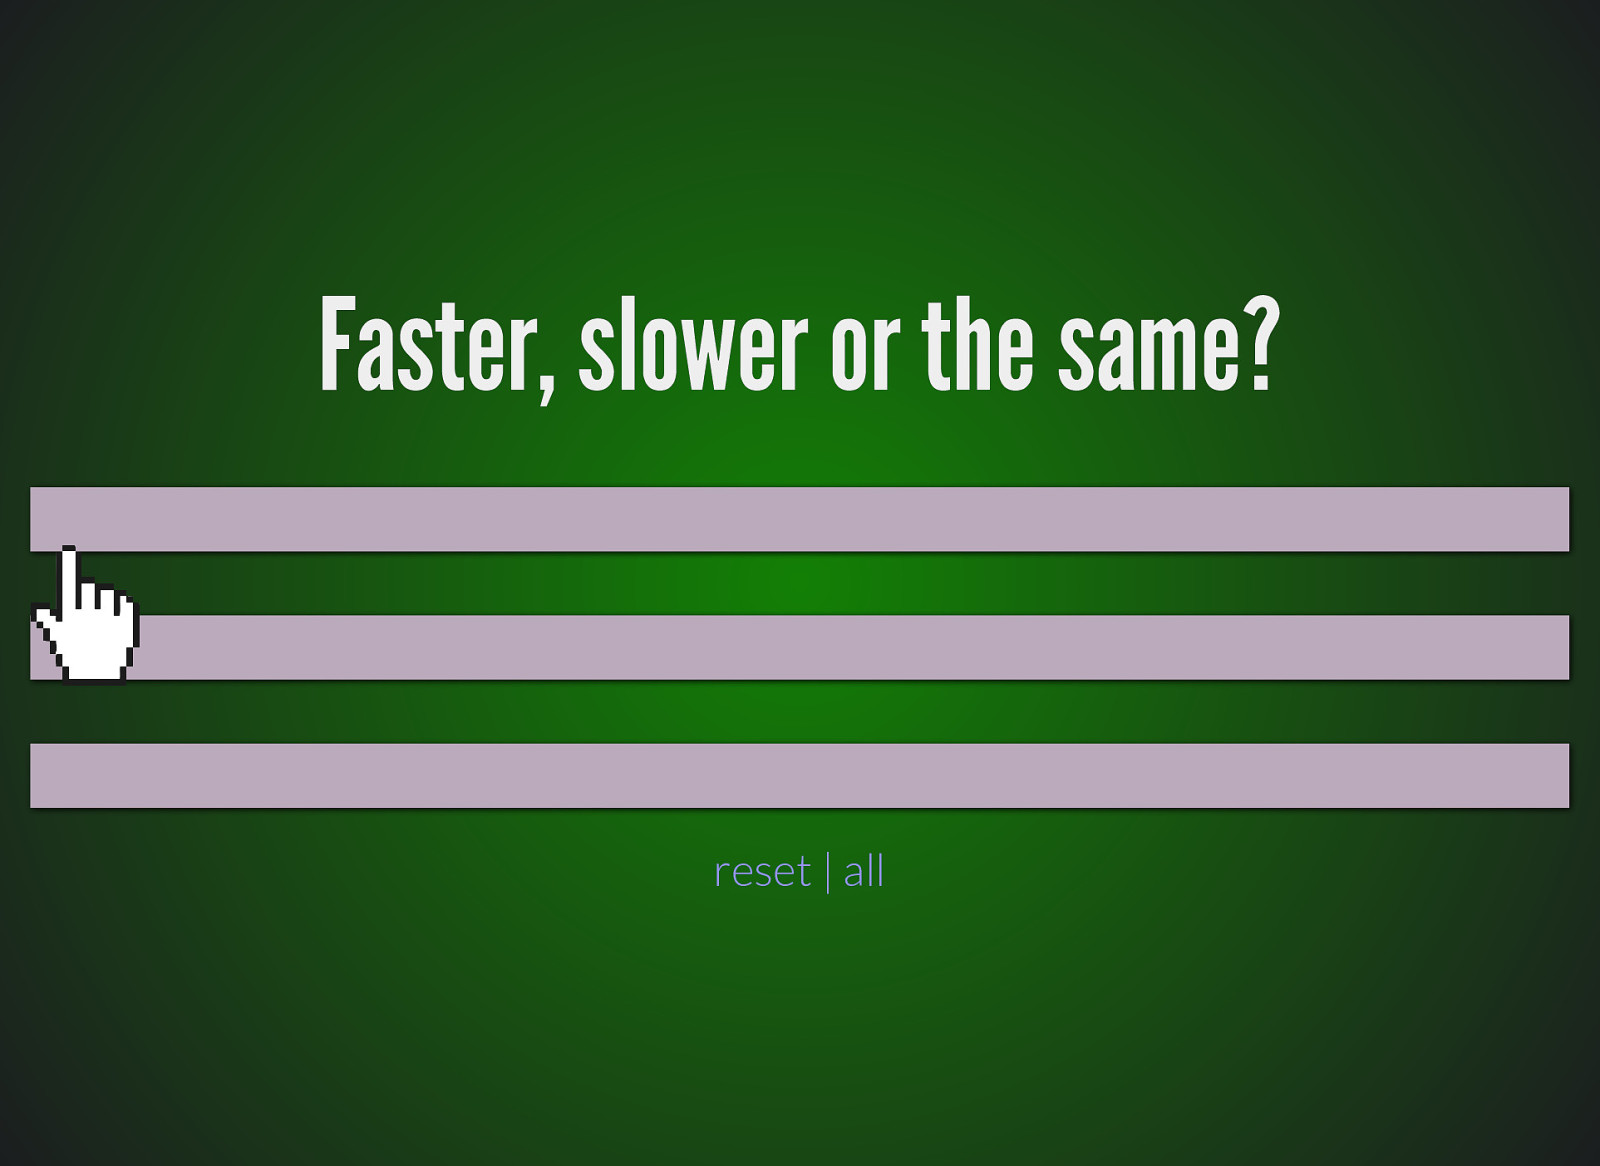
Faster, slower or the same? reset | all
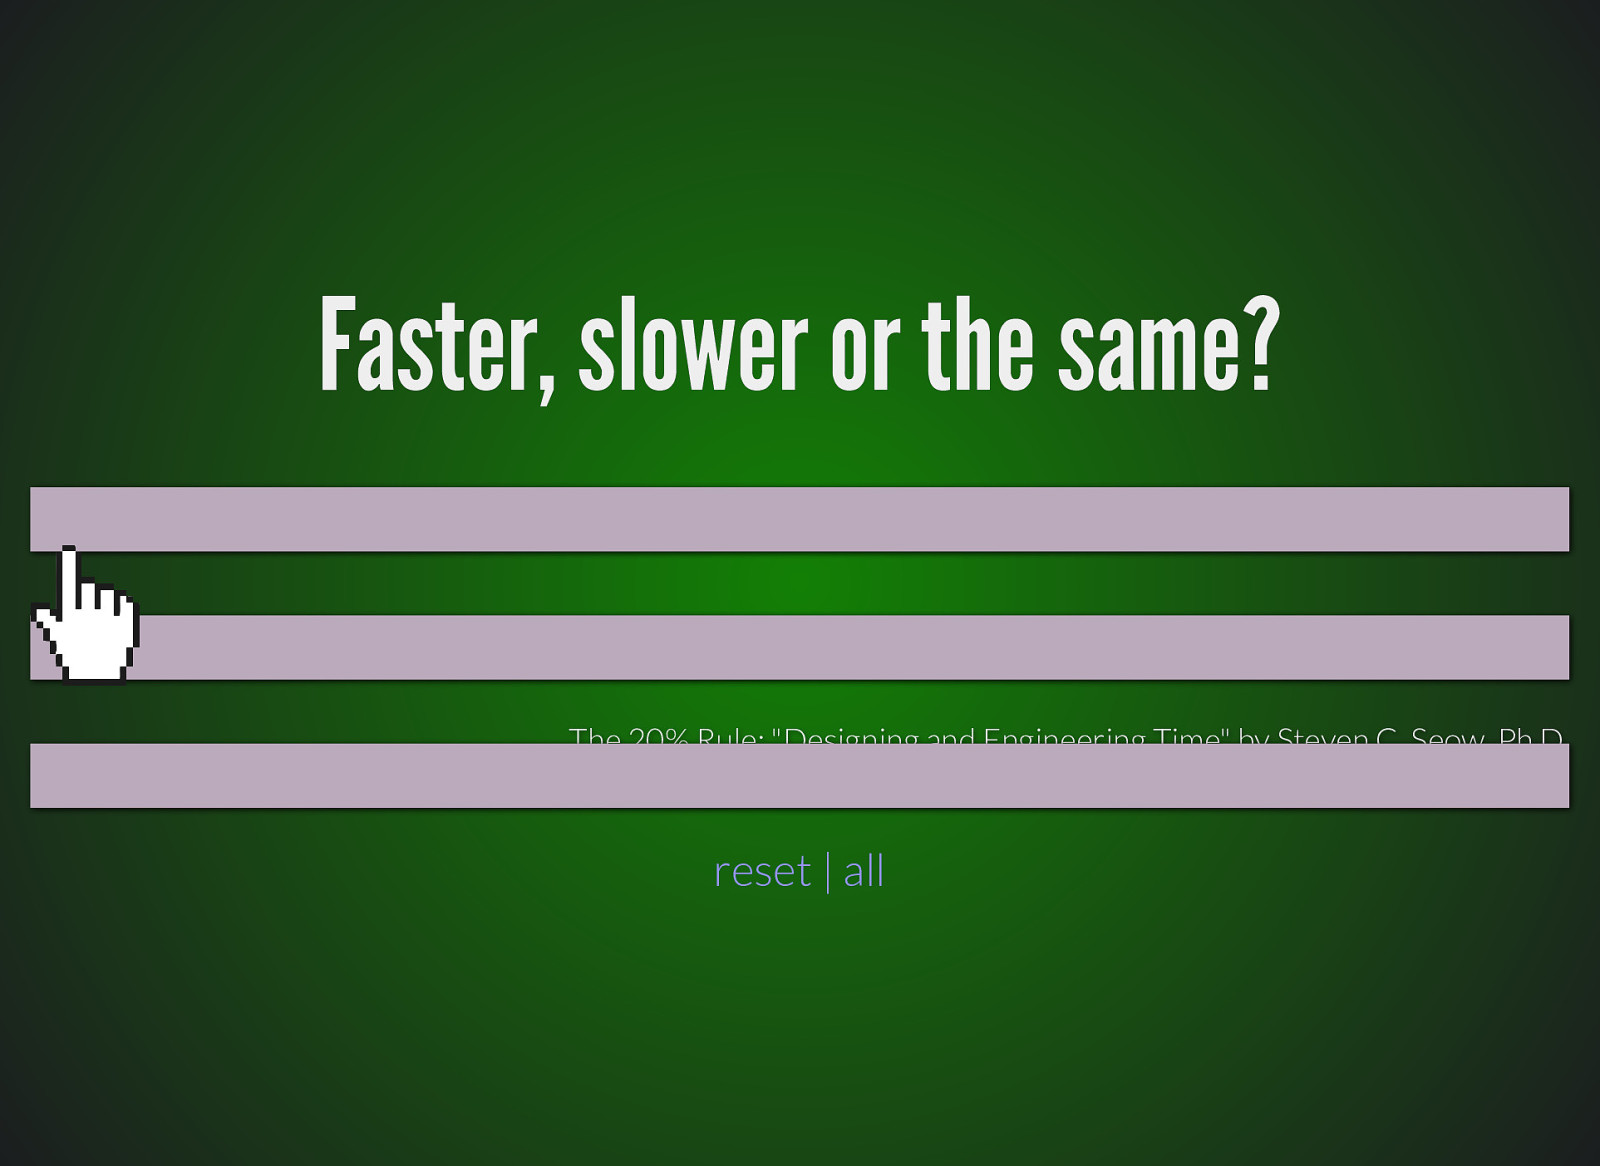
Faster, slower or the same? The 20% Rule: “Designing and Engineering Time” by Steven C. Seow, Ph.D. reset | all

So what?
So what? Get 20% faster for existing customers to notice
So what? Get 20% faster for existing customers to notice Be 20% faster than your peers & competitors

Engagement?

What do you do when you feel engaged?

What do you do when you feel engaged? Hang around

What do you do when you feel engaged? Hang around Click on things
What do you do when you feel engaged? Hang around Click on things Complete an action
How can we measure engagement?
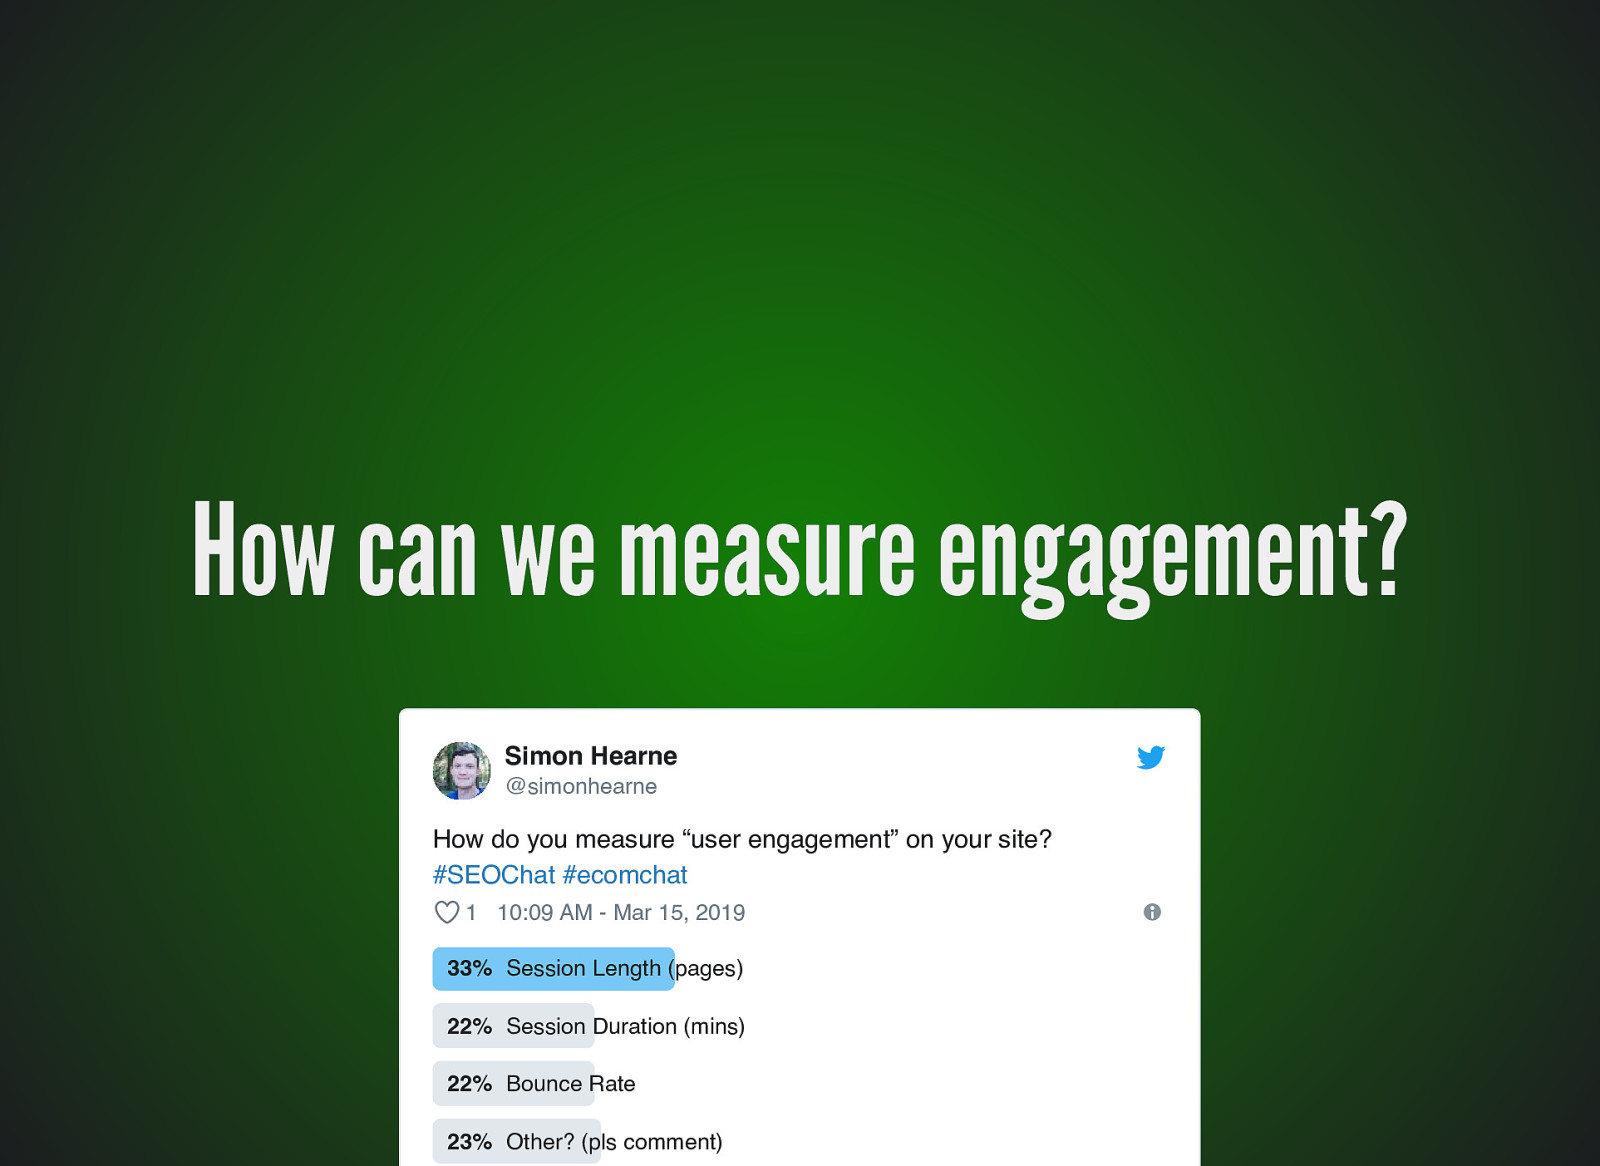
How can we measure engagement? Simon Hearne @simonhearne How do you measure “user engagement” on your site? #SEOChat #ecomchat 1 10:09 AM - Mar 15, 2019 33% Session Length (pages) 22% Session Duration (mins) 22% Bounce Rate 23% Other? (pls comment)
POLL 3 How do you measure engagement? Session Length Bounce Rate Exit Rate Time on page
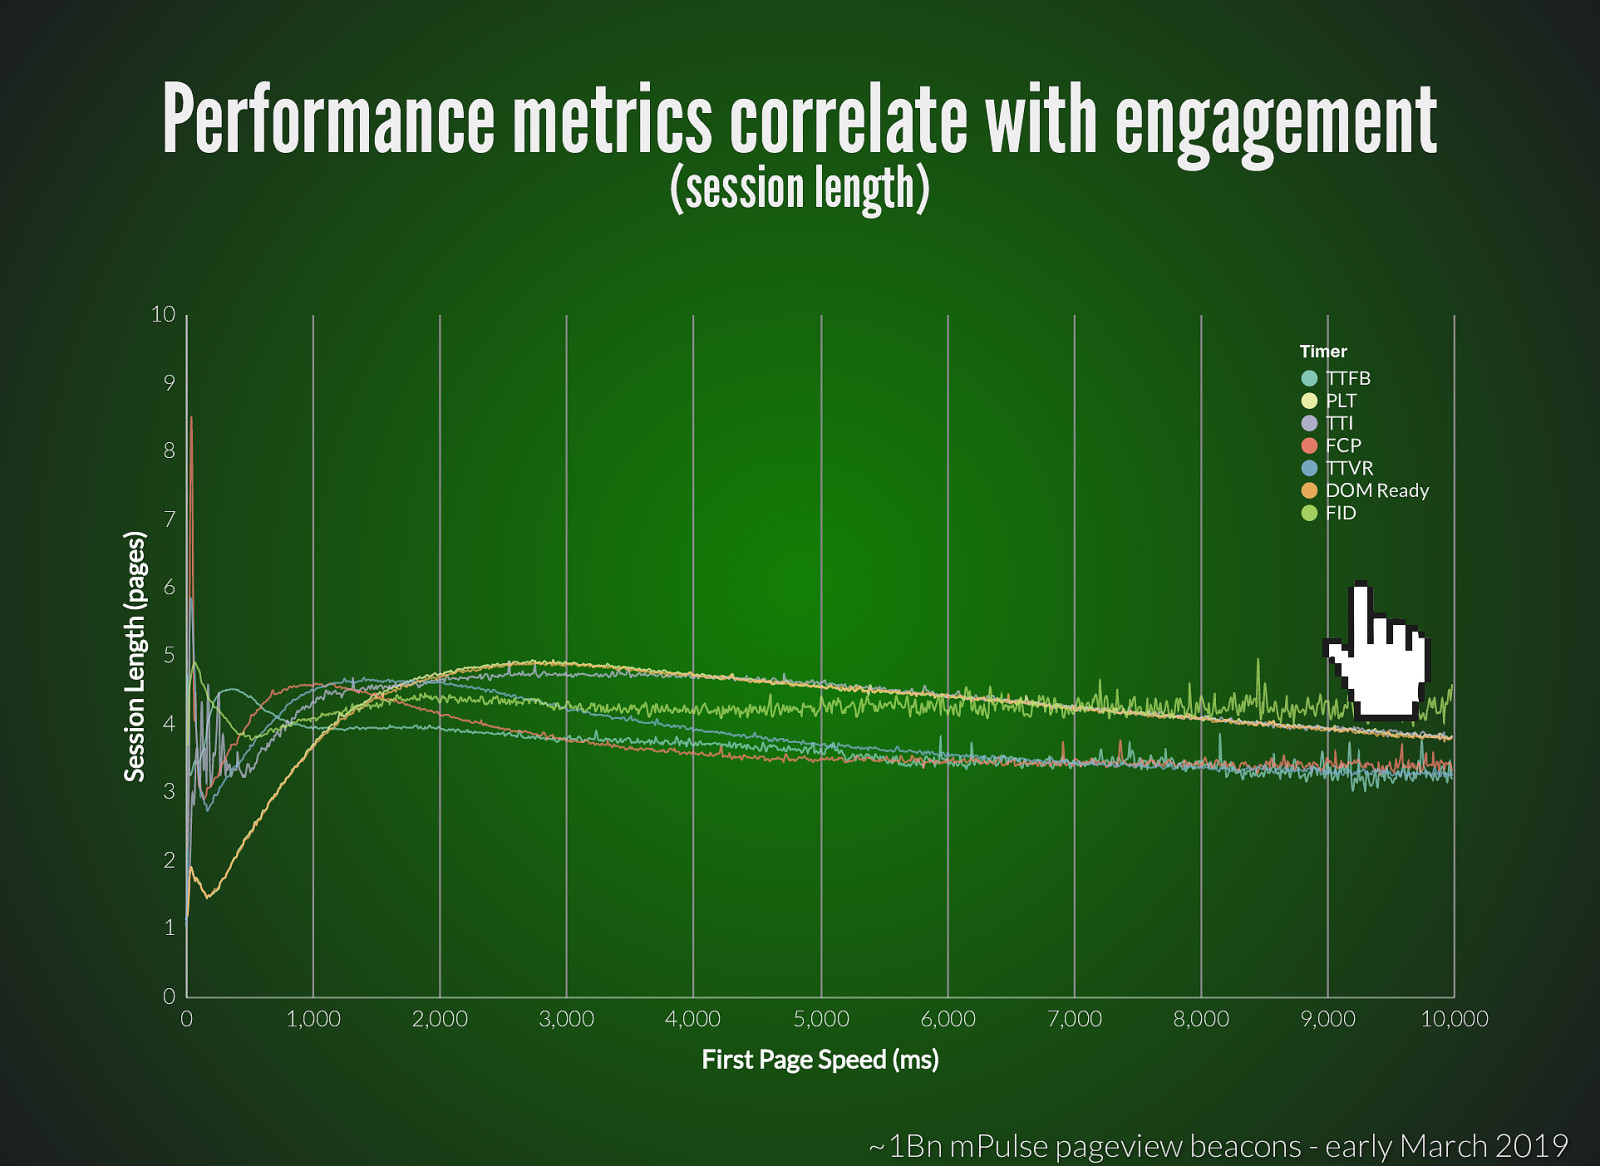
Performance metrics correlate with engagement (session length) 10 Timer TTFB PLT TTI FCP TTVR DOM Ready FID 9 Session Length (pages) 8 7 6 5 4 3 2 1 0 0 1,000 2,000 3,000 4,000 5,000 6,000 7,000 8,000 9,000 10,000 First Page Speed (ms) ~1Bn mPulse pageview beacons - early March 2019
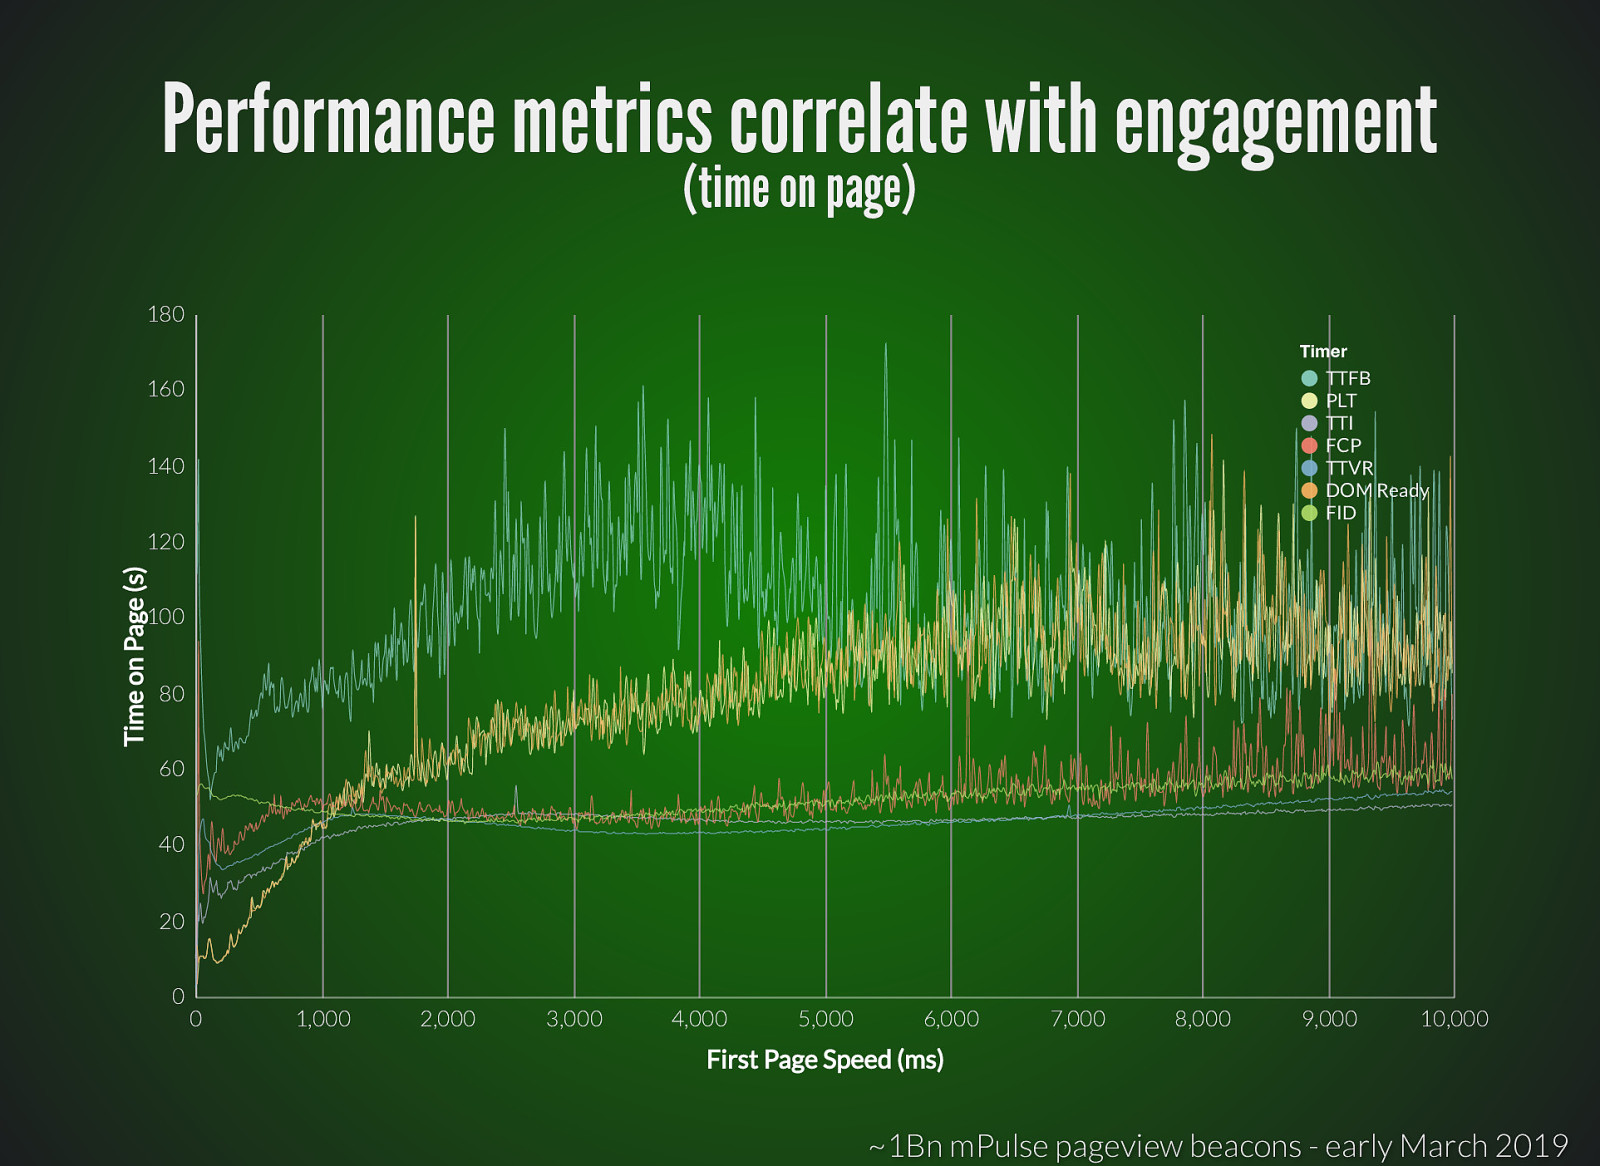
Performance metrics correlate with engagement (time on page) 180 Timer TTFB PLT TTI FCP TTVR DOM Ready FID 160 140 Time on Page (s) 120 100 80 60 40 20 0 0 1,000 2,000 3,000 4,000 5,000 6,000 7,000 8,000 9,000 10,000 First Page Speed (ms) ~1Bn mPulse pageview beacons - early March 2019
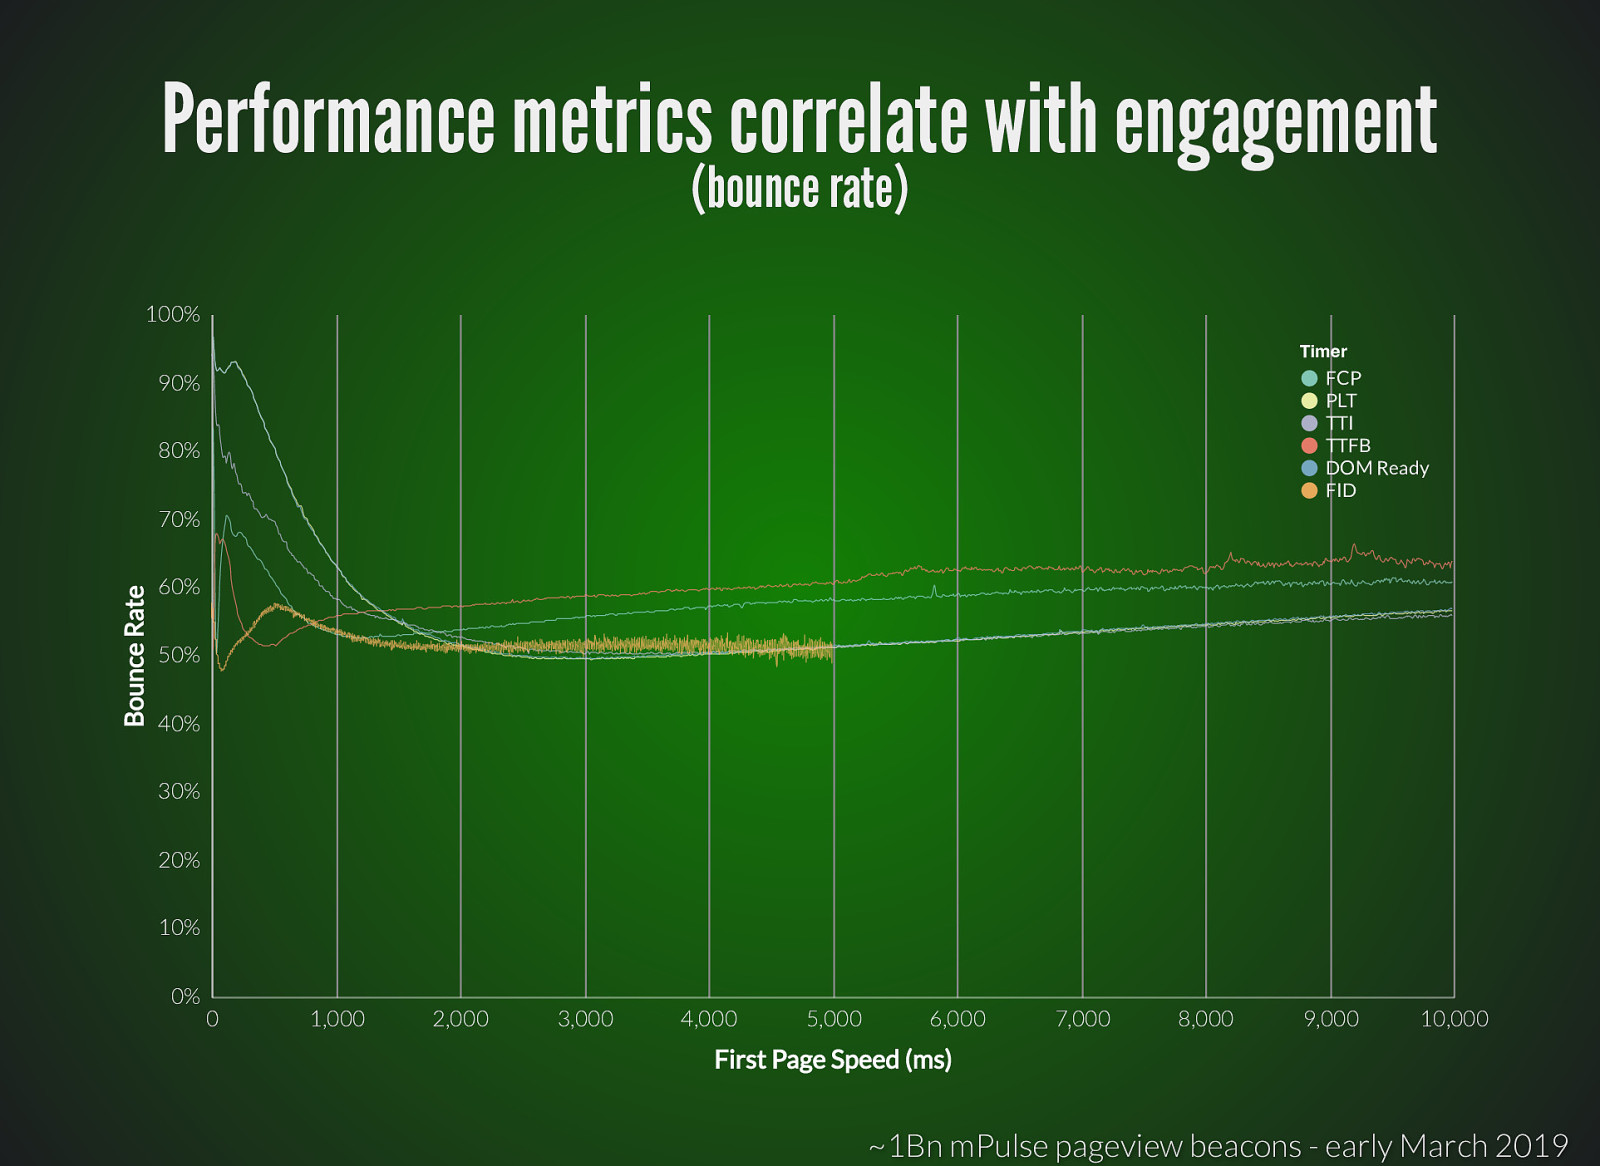
Performance metrics correlate with engagement (bounce rate) 100% Timer FCP PLT TTI TTFB DOM Ready FID 90% 80% Bounce Rate 70% 60% 50% 40% 30% 20% 10% 0% 0 1,000 2,000 3,000 4,000 5,000 6,000 7,000 8,000 9,000 10,000 First Page Speed (ms) ~1Bn mPulse pageview beacons - early March 2019
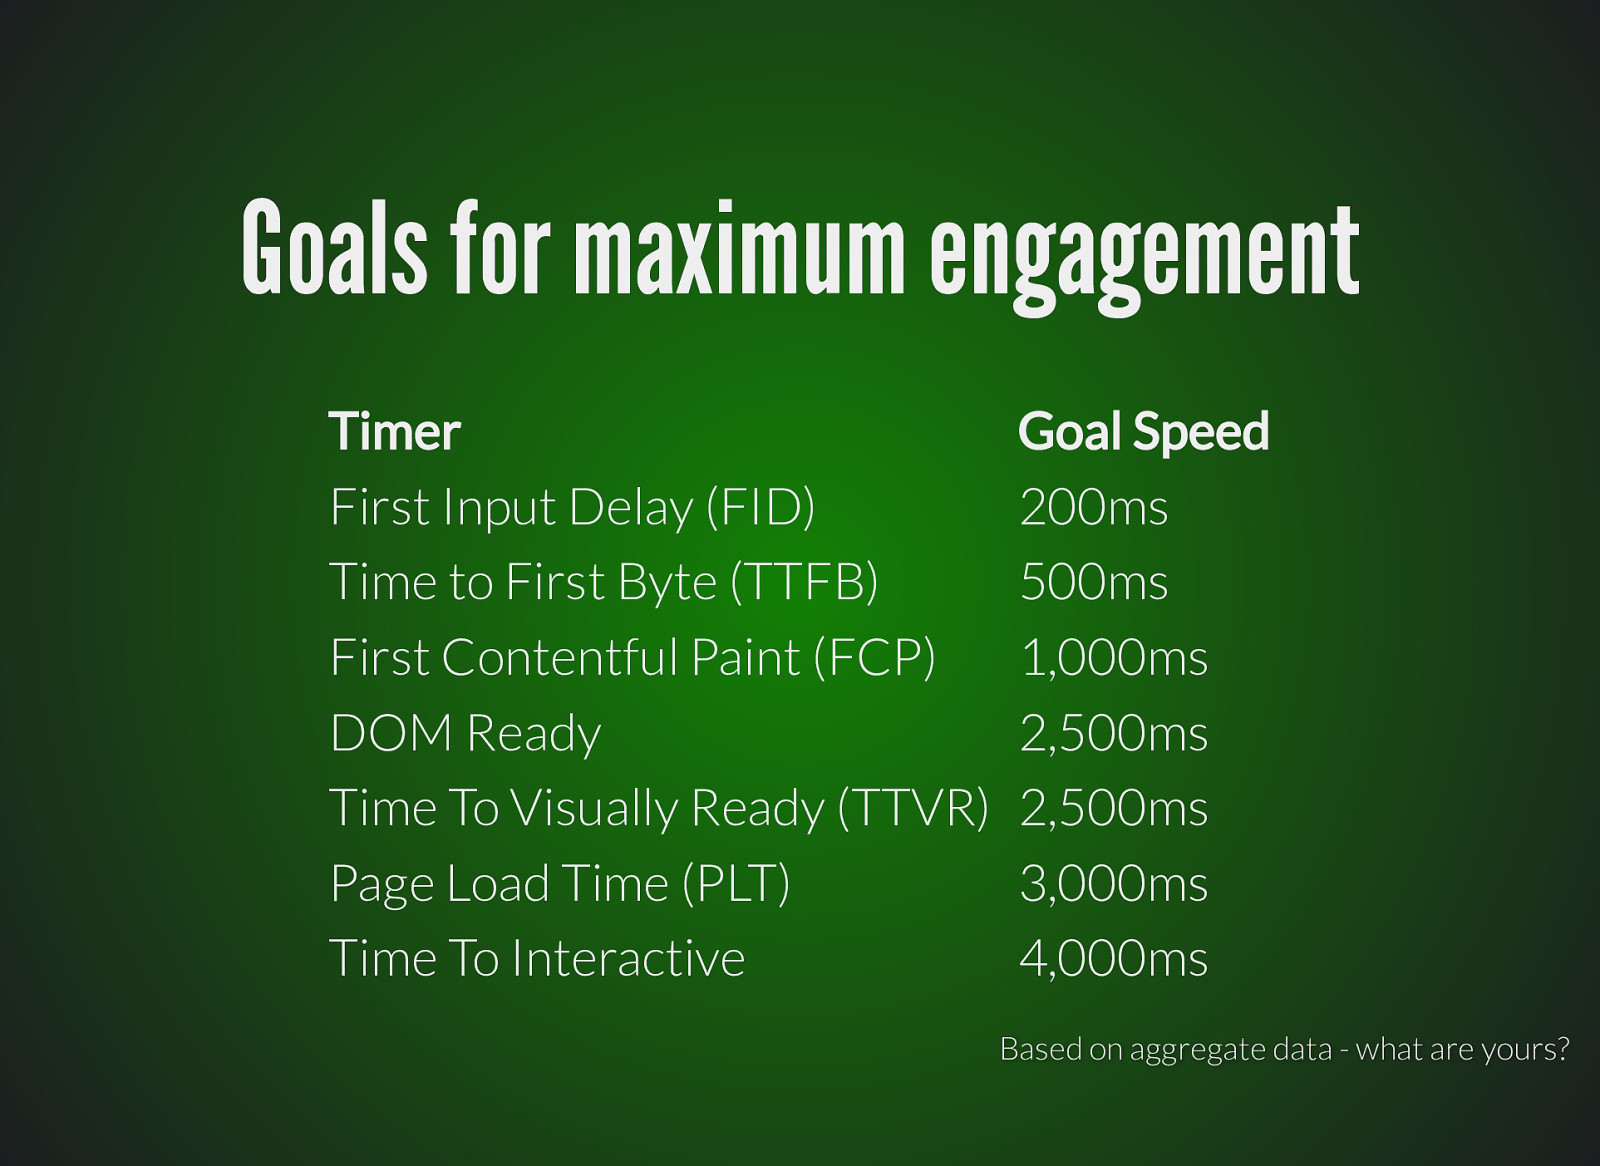
Goals for maximum engagement Timer First Input Delay (FID) Time to First Byte (TTFB) First Contentful Paint (FCP) DOM Ready Time To Visually Ready (TTVR) Page Load Time (PLT) Time To Interactive Goal Speed 200ms 500ms 1,000ms 2,500ms 2,500ms 3,000ms 4,000ms Based on aggregate data - what are yours?
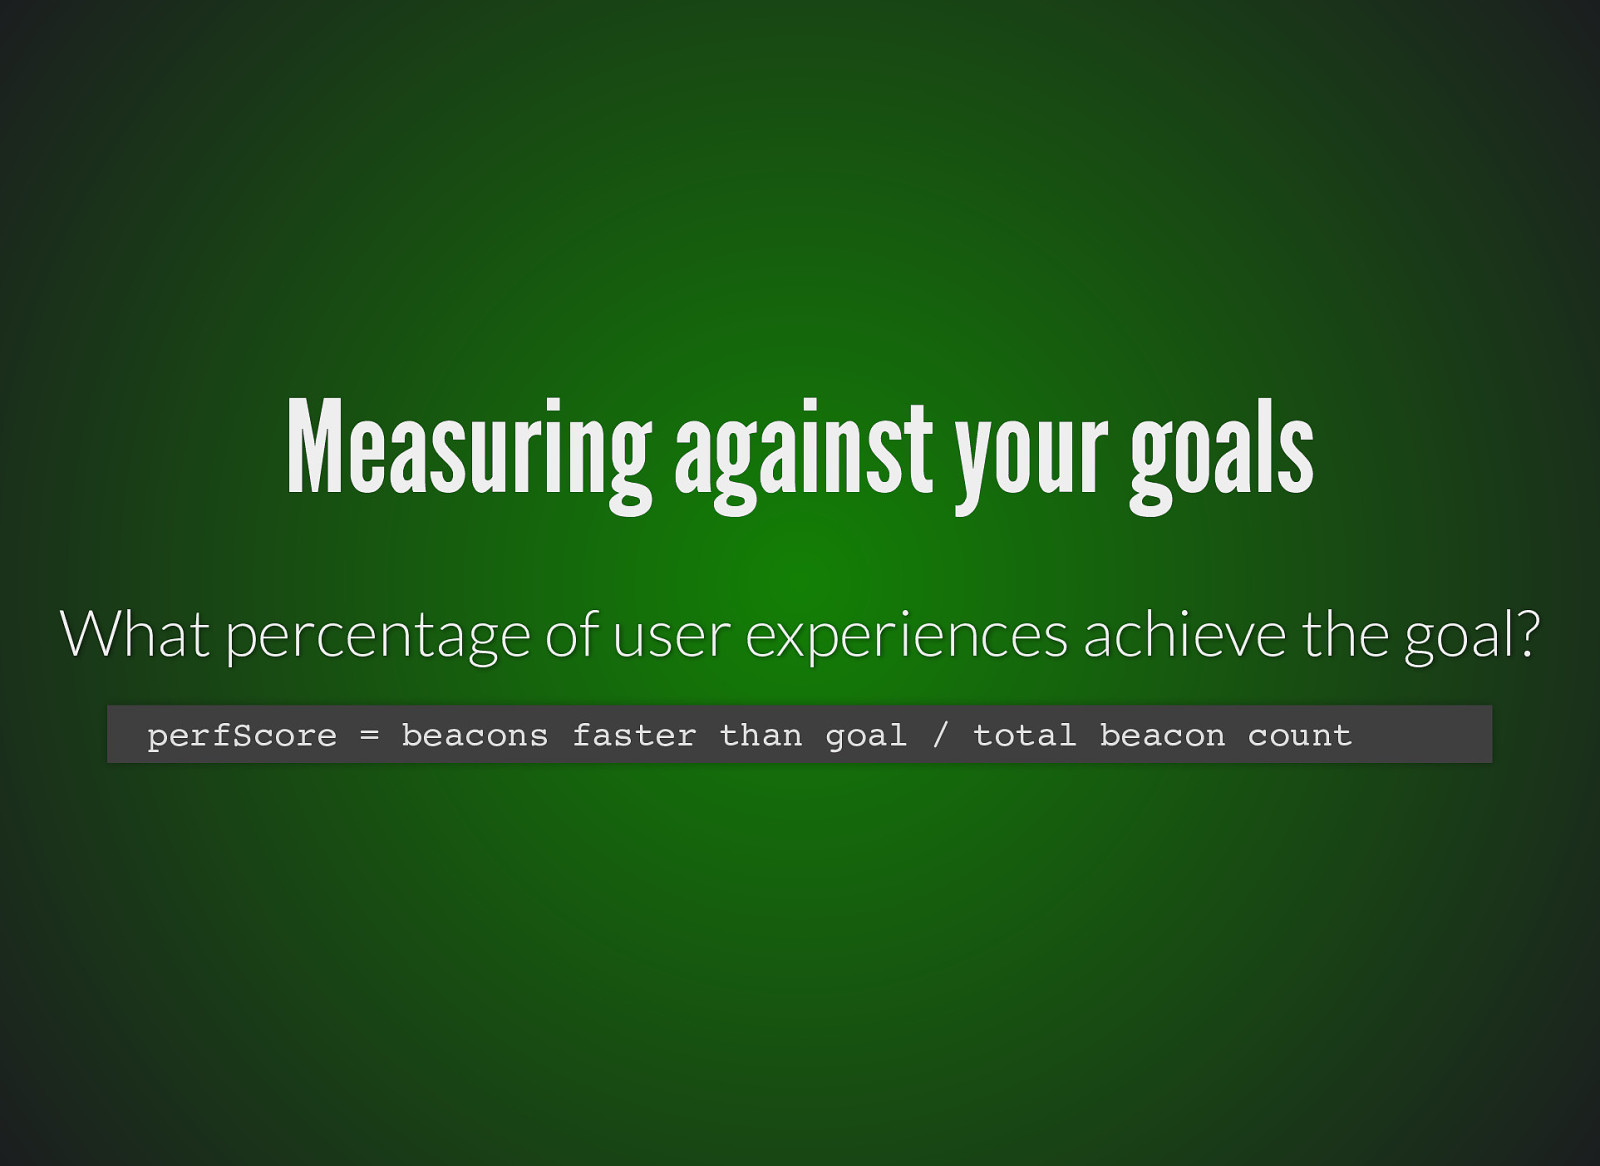
Measuring against your goals What percentage of user experiences achieve the goal? perfScore = beacons faster than goal / total beacon count
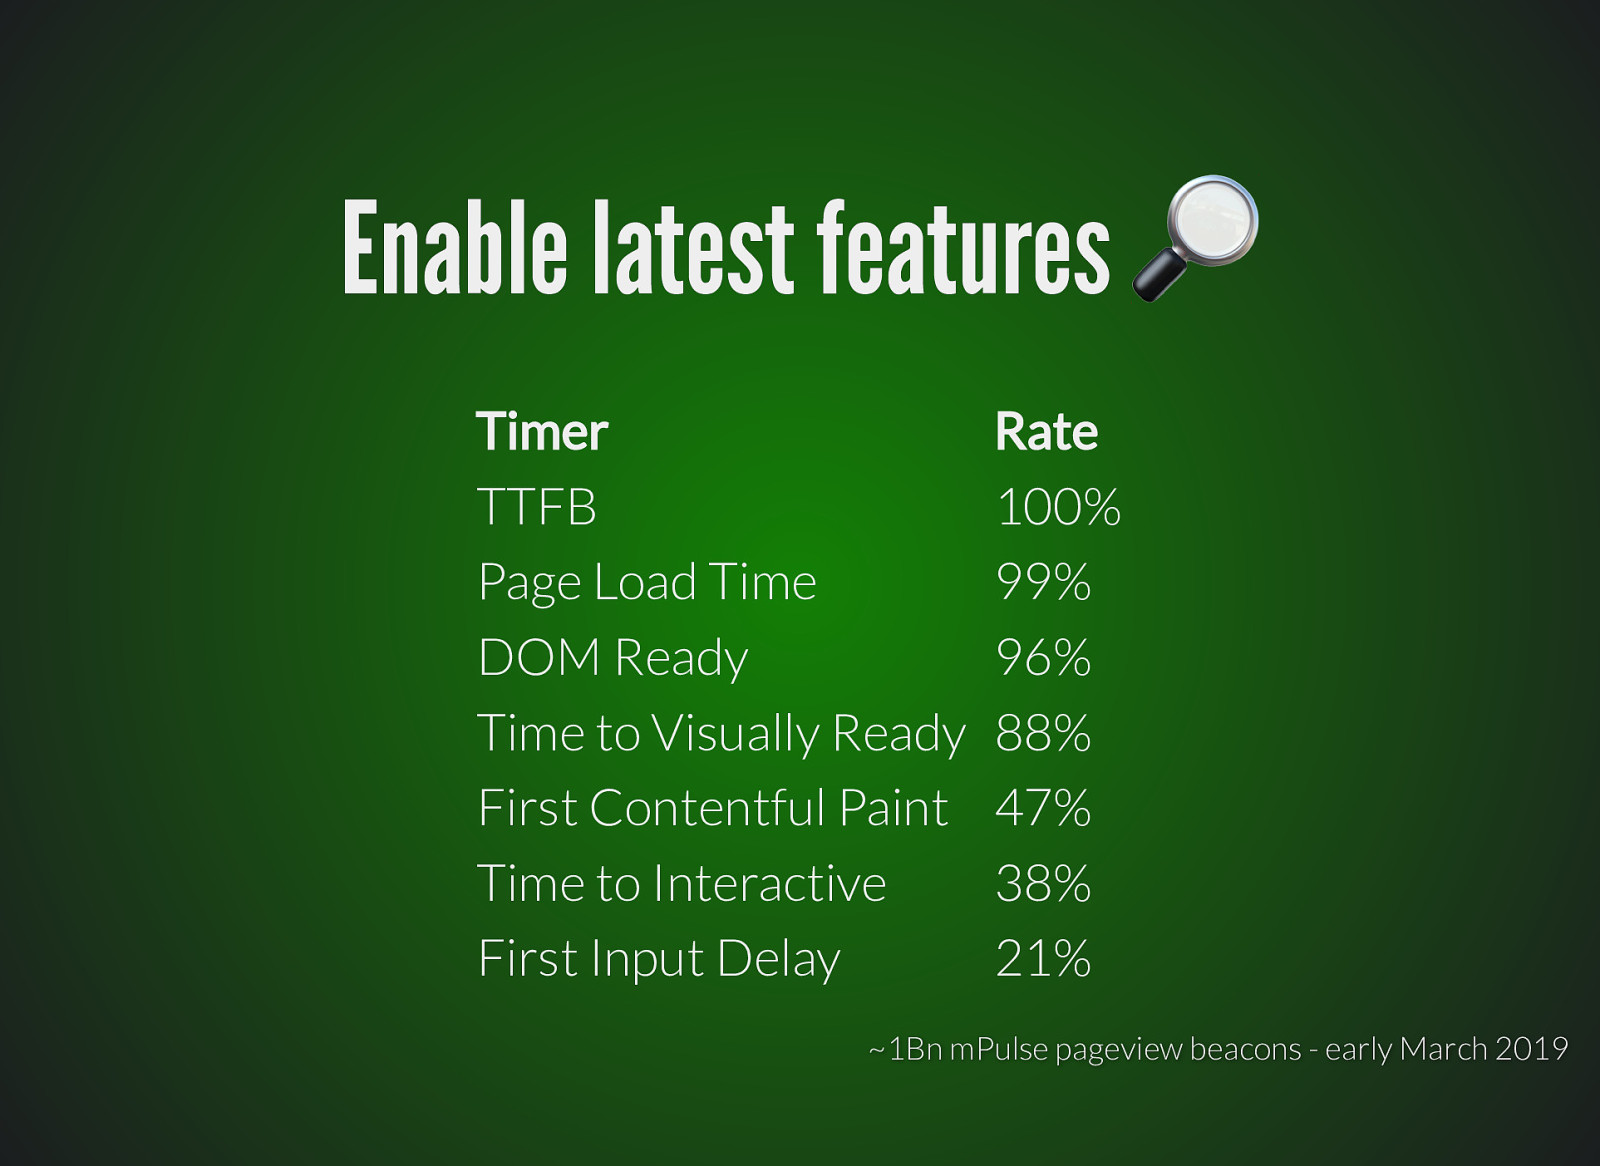
Enable latest features Timer TTFB Page Load Time DOM Ready Time to Visually Ready First Contentful Paint Time to Interactive First Input Delay Rate 100% 99% 96% 88% 47% 38% 21% ~1Bn mPulse pageview beacons - early March 2019

< psychology >
Human Computer Interaction principles
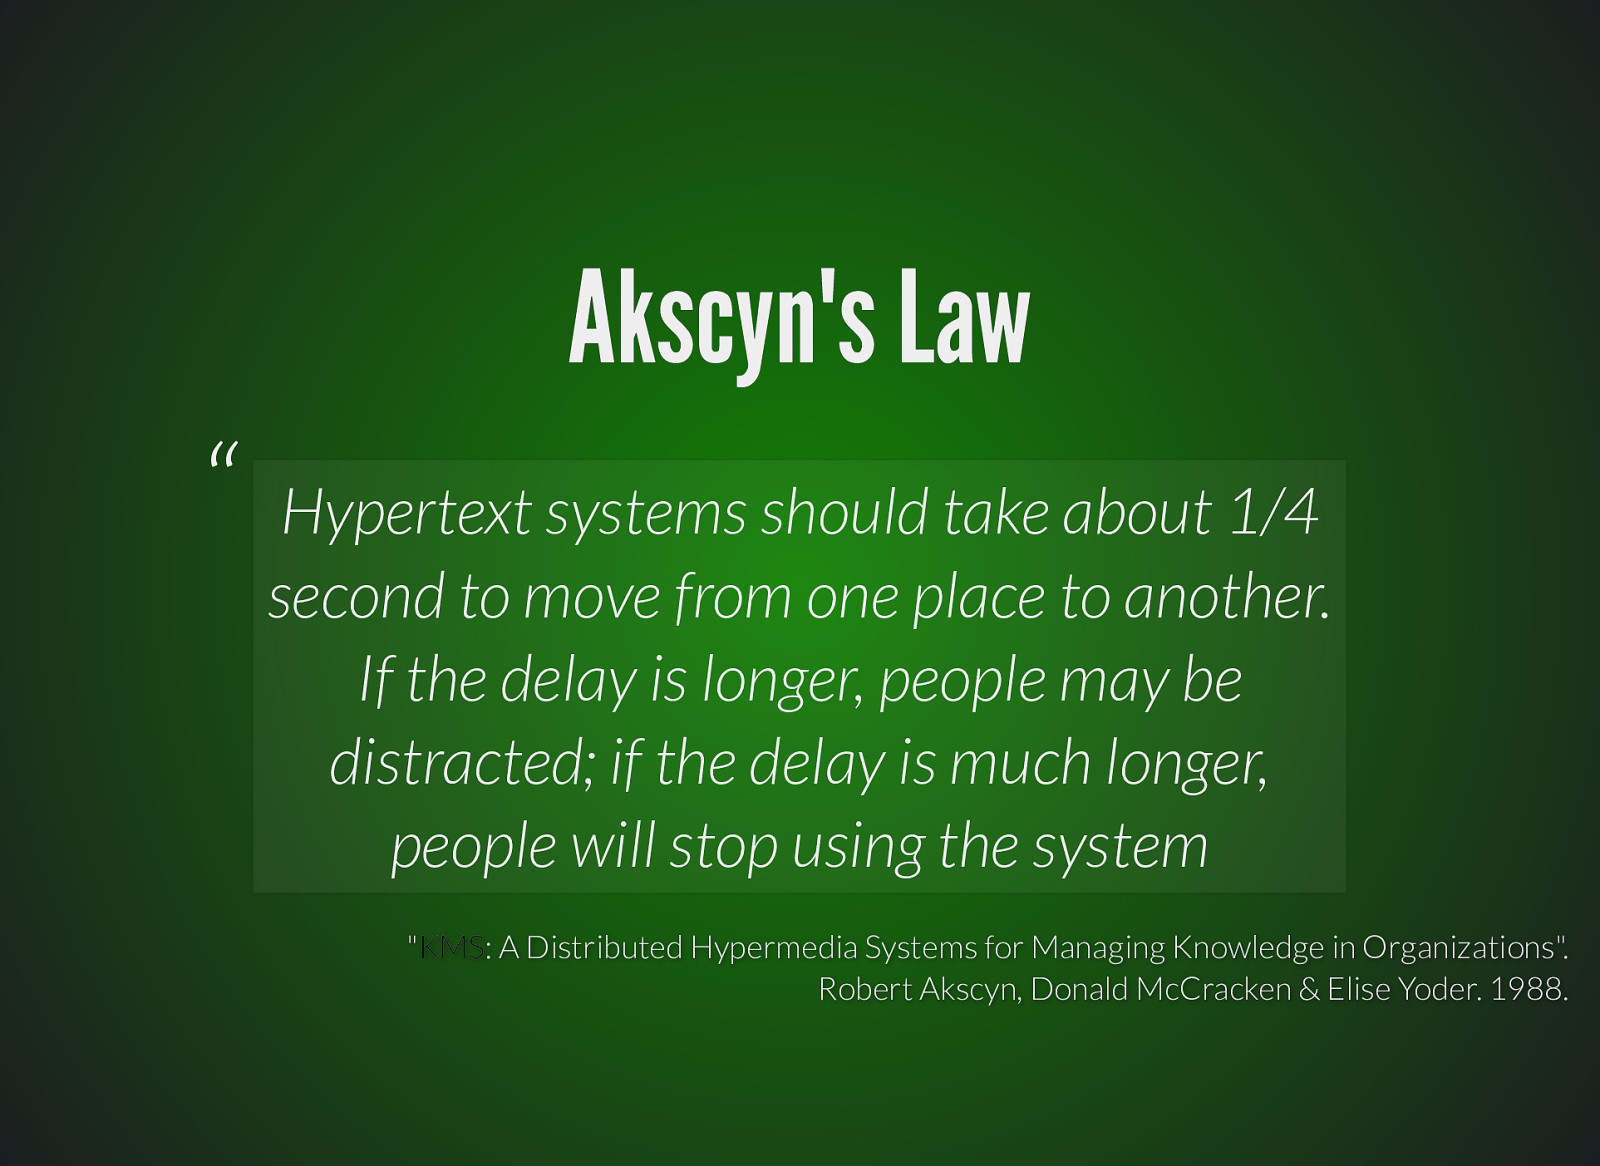
Akscyn’s Law “ Hypertext systems should take about 1/4 second to move from one place to another. If the delay is longer, people may be distracted; if the delay is much longer, people will stop using the system “KMS: KMS A Distributed Hypermedia Systems for Managing Knowledge in Organizations”. Robert Akscyn, Donald McCracken & Elise Yoder. 1988.
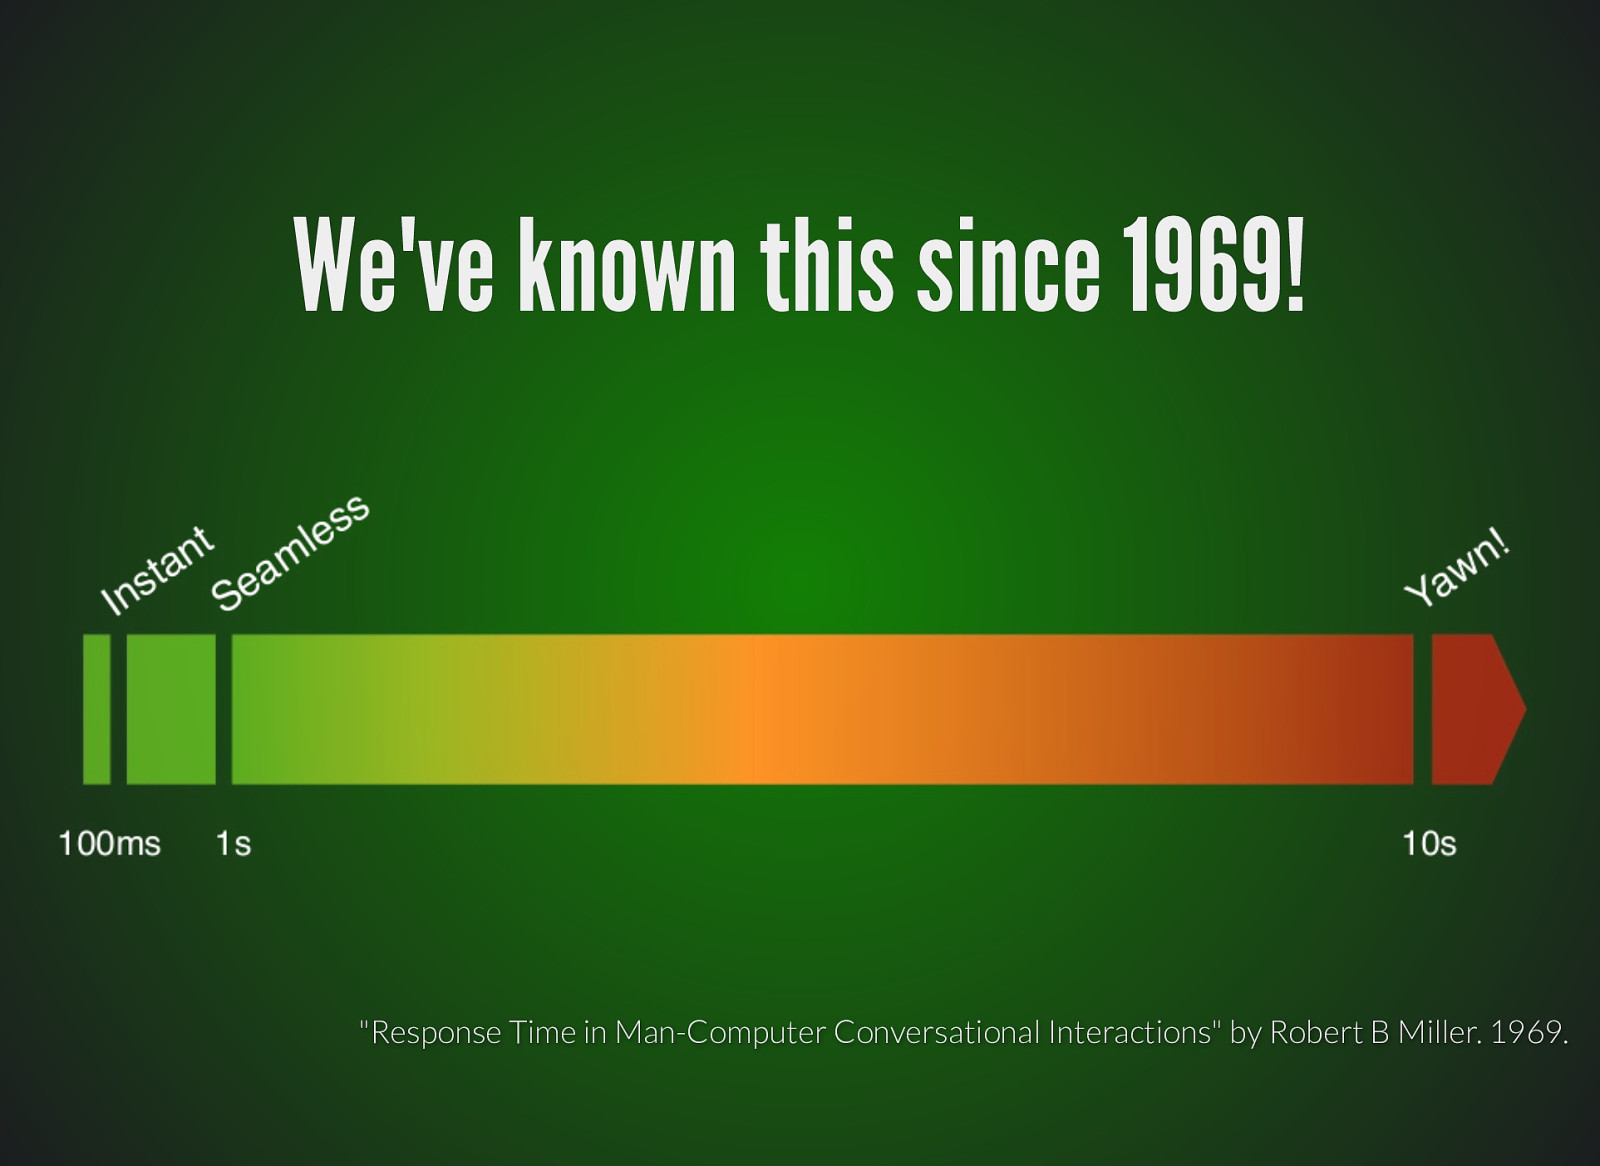
We’ve known this since 1969! “Response Time in Man-Computer Conversational Interactions” by Robert B Miller. 1969.

So what?
So what? The fundamentals don’t change
So what? The fundamentals don’t change Simple & fast is better than complex and slow
So what? The fundamentals don’t change Simple & fast is better than complex and slow Give users something every ~1 second

Conclusions ✍
Conclusions ✍ Measuring speed is dif cult Use metrics which correlate with engagement Track the 75th - 95th percentile (with RUM) Calculate scores against goal speeds
Conclusions ✍ Measuring speed is dif cult Use metrics which correlate with engagement Track the 75th - 95th percentile (with RUM) Calculate scores against goal speeds Deliver something to the user quickly Server-side rendering Inline critical dependencies Optimise your CDN con gurations
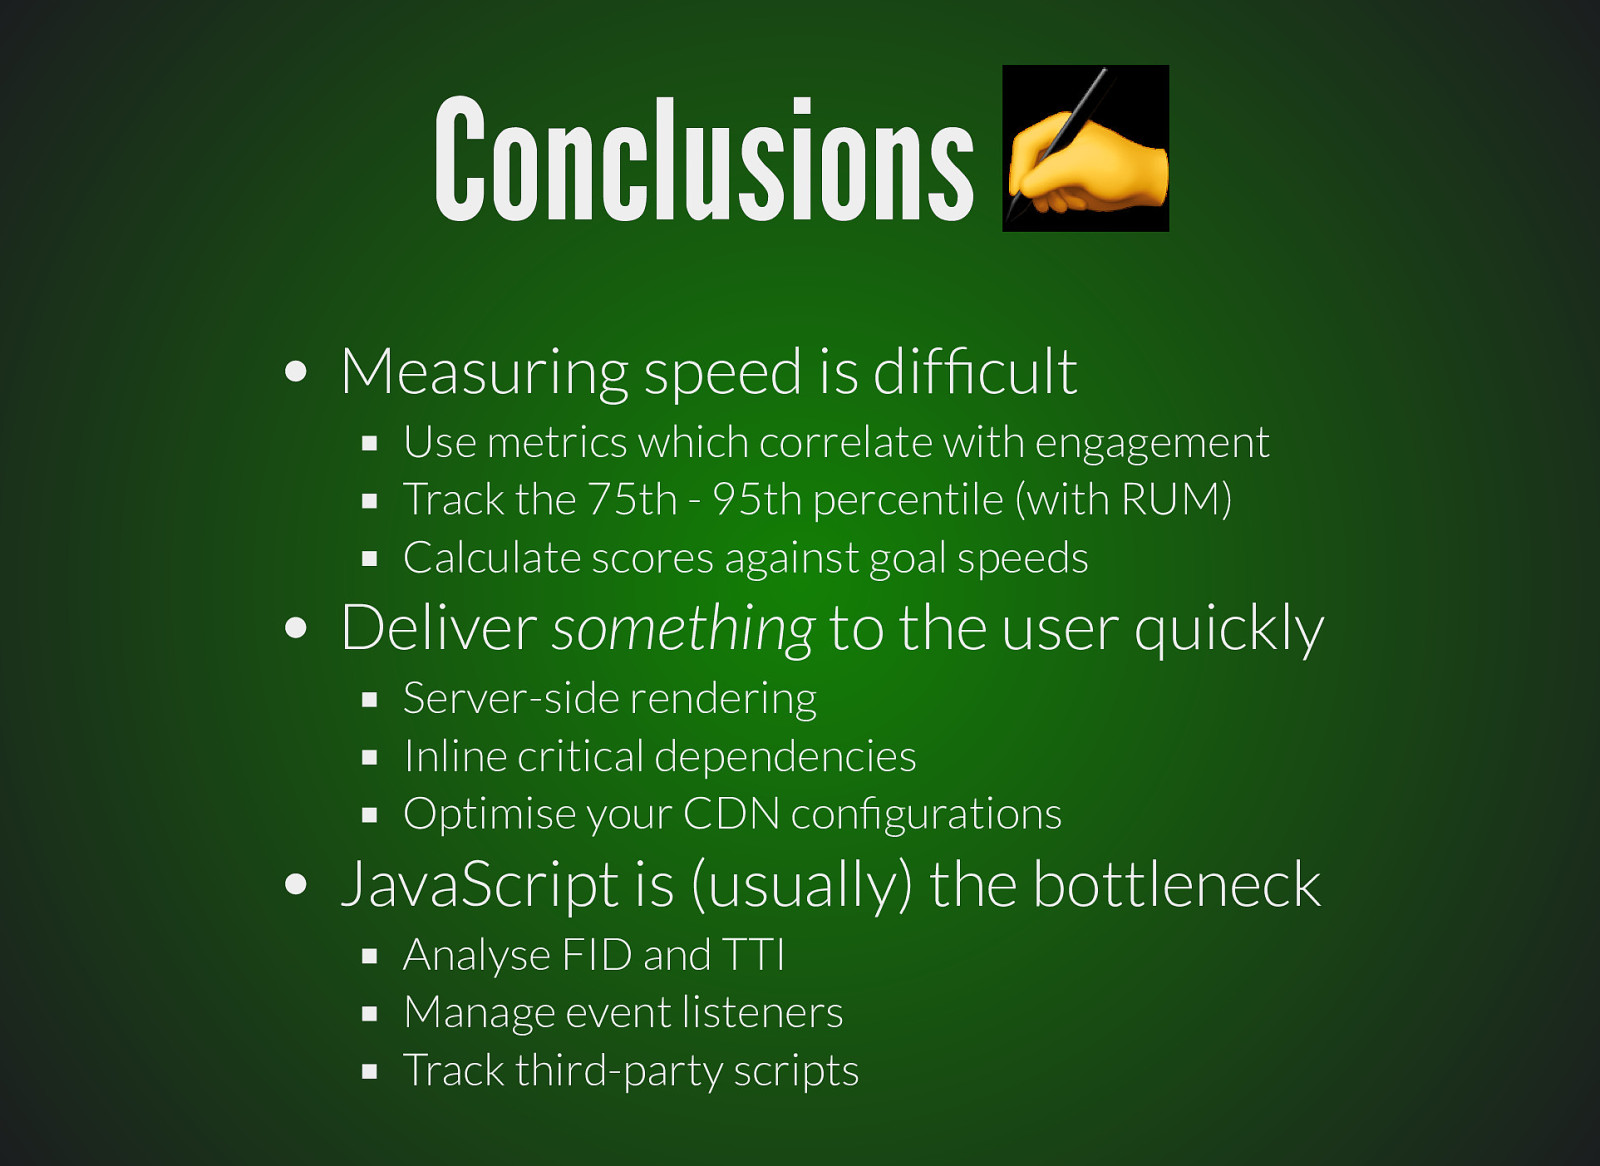
Conclusions ✍ Measuring speed is dif cult Use metrics which correlate with engagement Track the 75th - 95th percentile (with RUM) Calculate scores against goal speeds Deliver something to the user quickly Server-side rendering Inline critical dependencies Optimise your CDN con gurations JavaScript is (usually) the bottleneck Analyse FID and TTI Manage event listeners Track third-party scripts

< hacking psychology >

Hacking human perception
There are no guarantees on performance
There are no guarantees on performance but you can buy some time
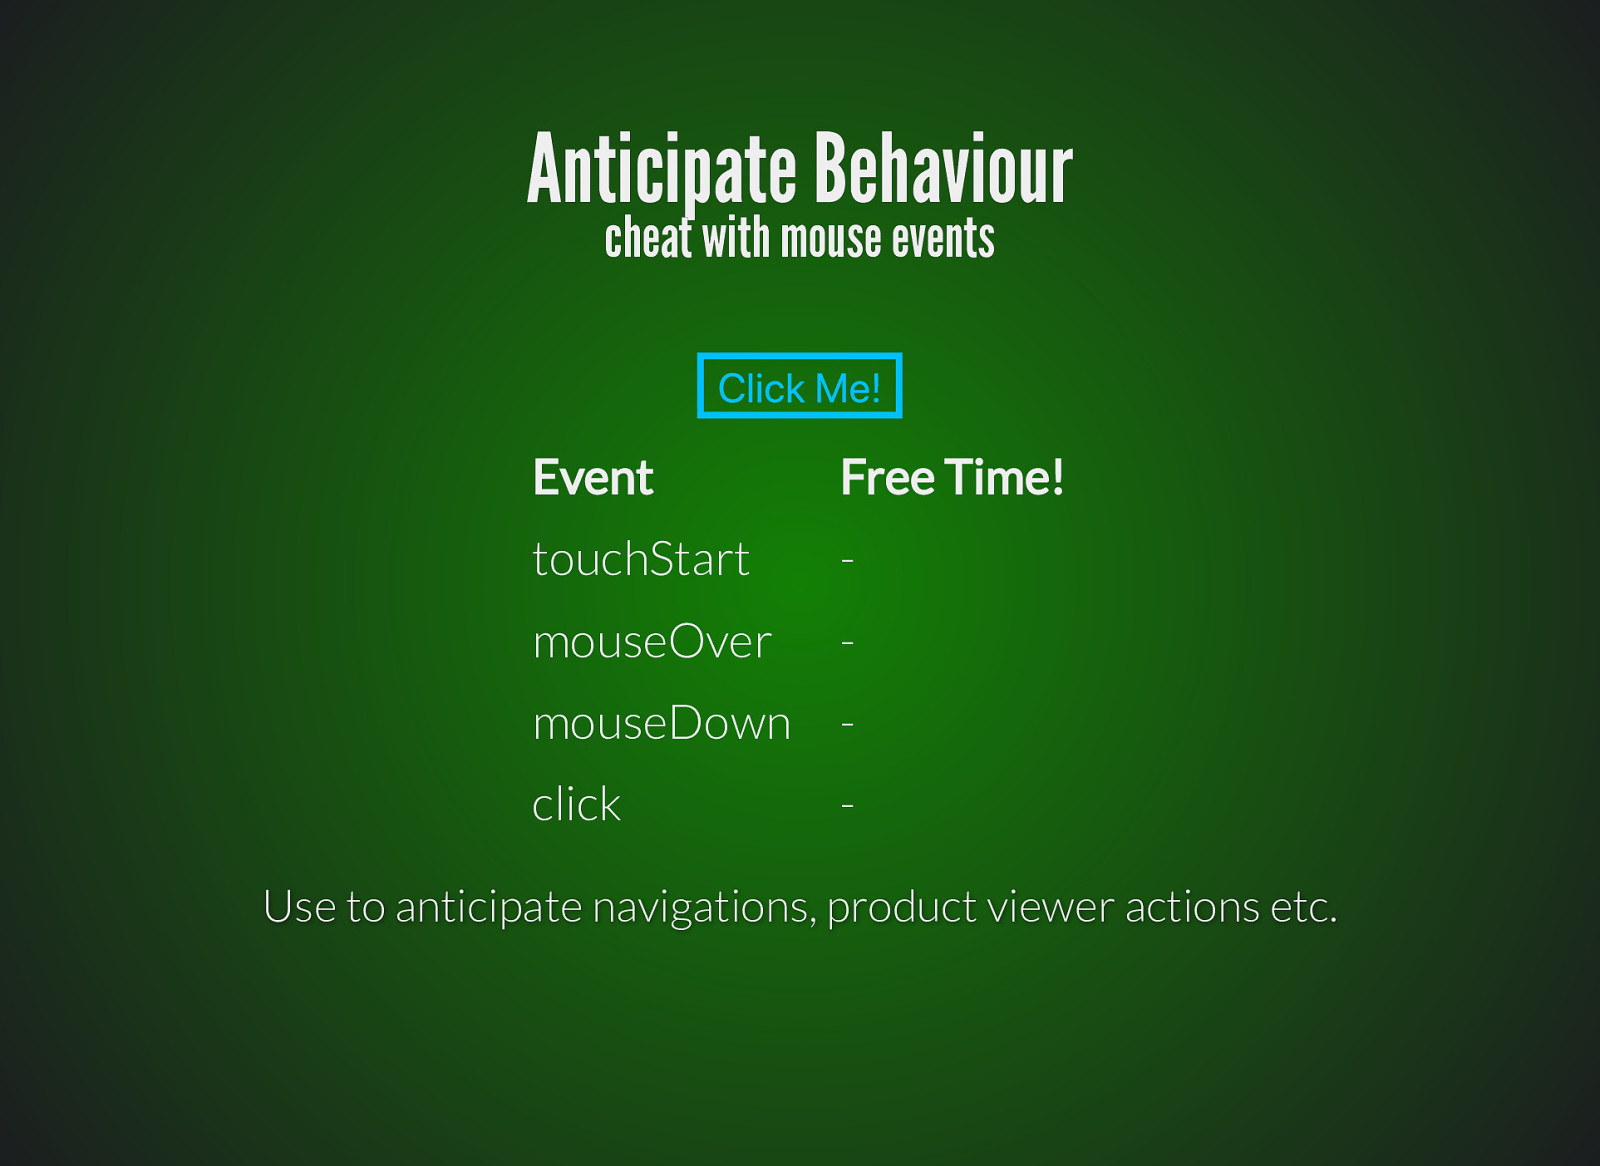
Use to anticipate navigations, product viewer actions etc.
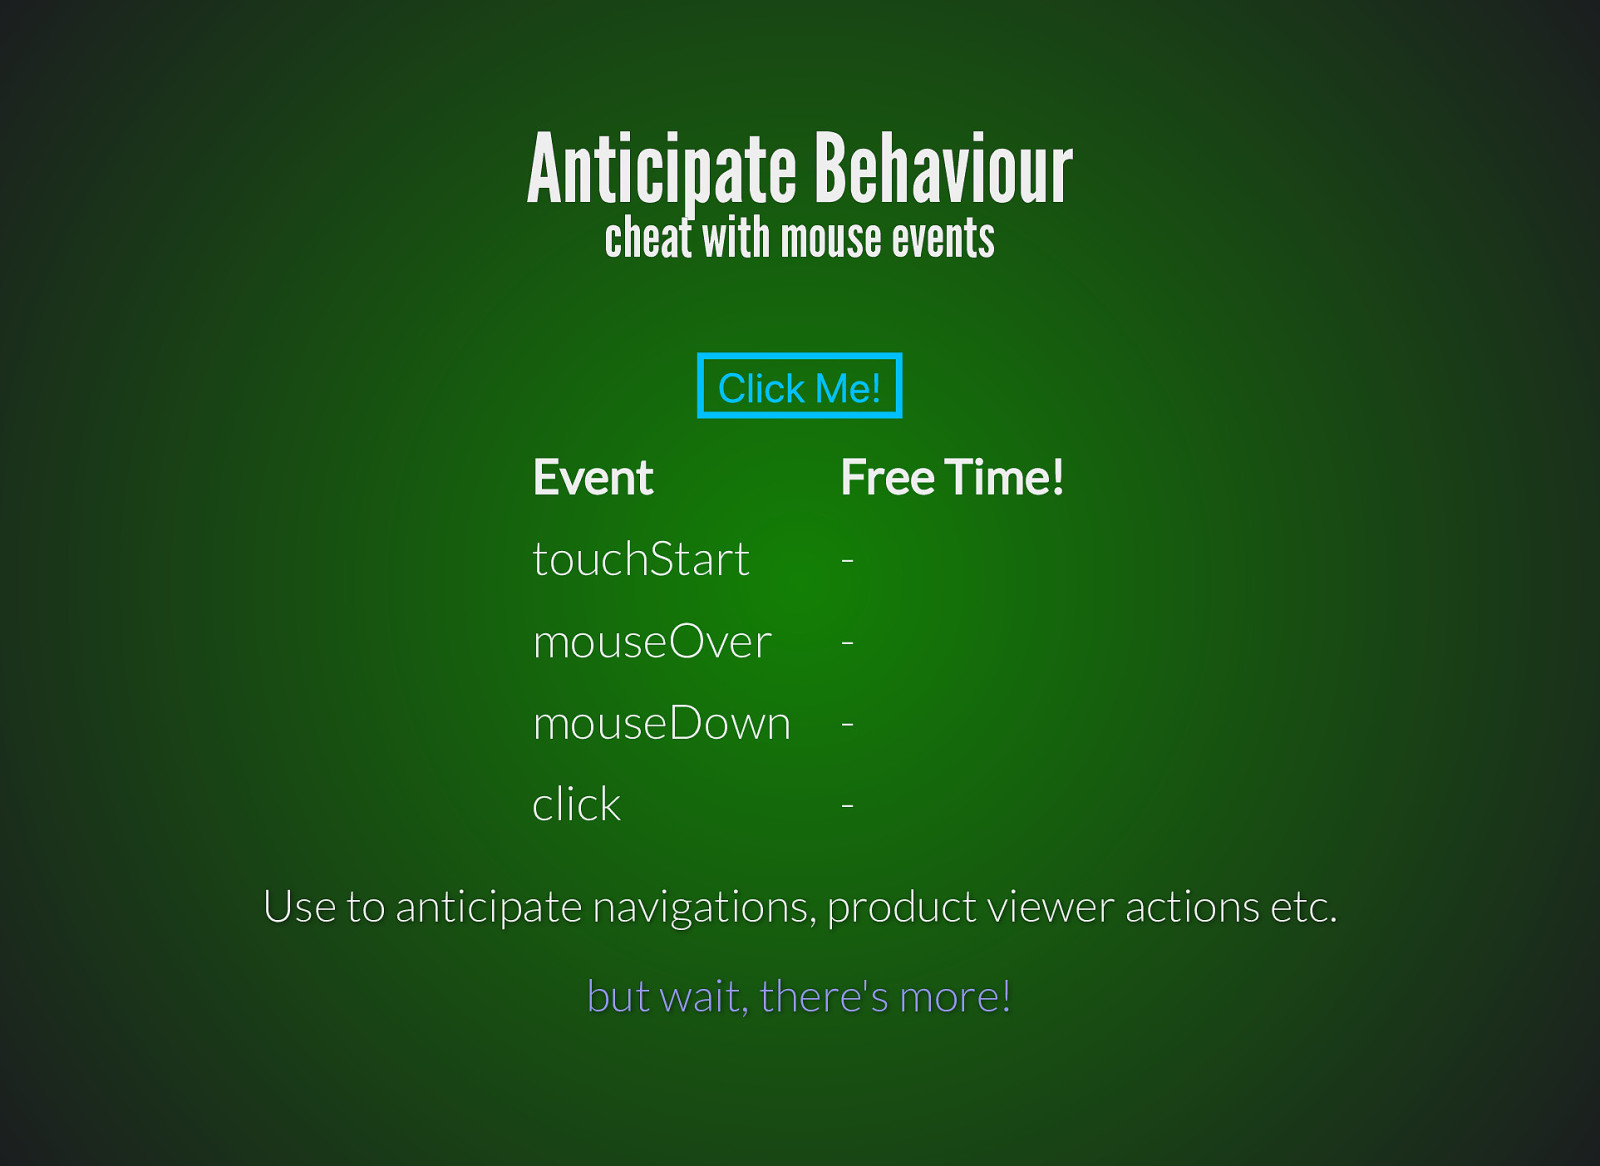
Use to anticipate navigations, product viewer actions etc. but wait, there’s more!
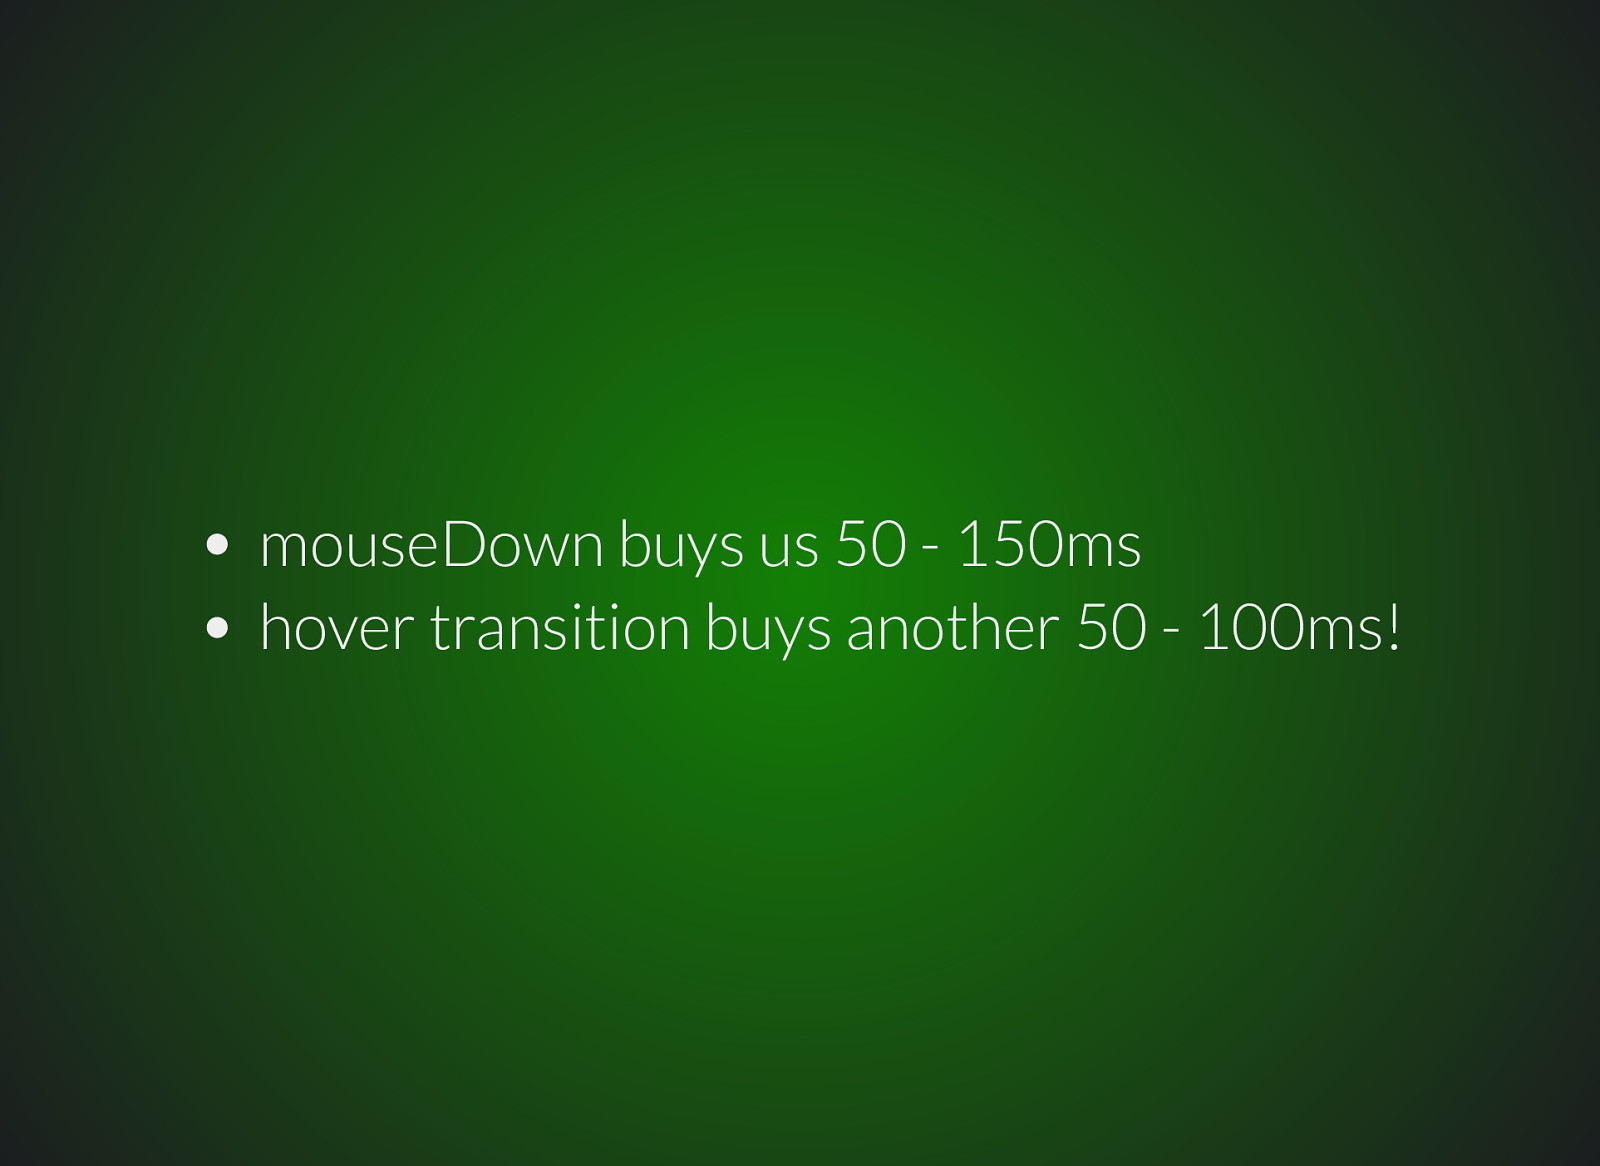
mouseDown buys us 50 - 150ms hover transition buys another 50 - 100ms!

Keep Users Engaged Skeleton UI

Keep Users Engaged Skeleton UI
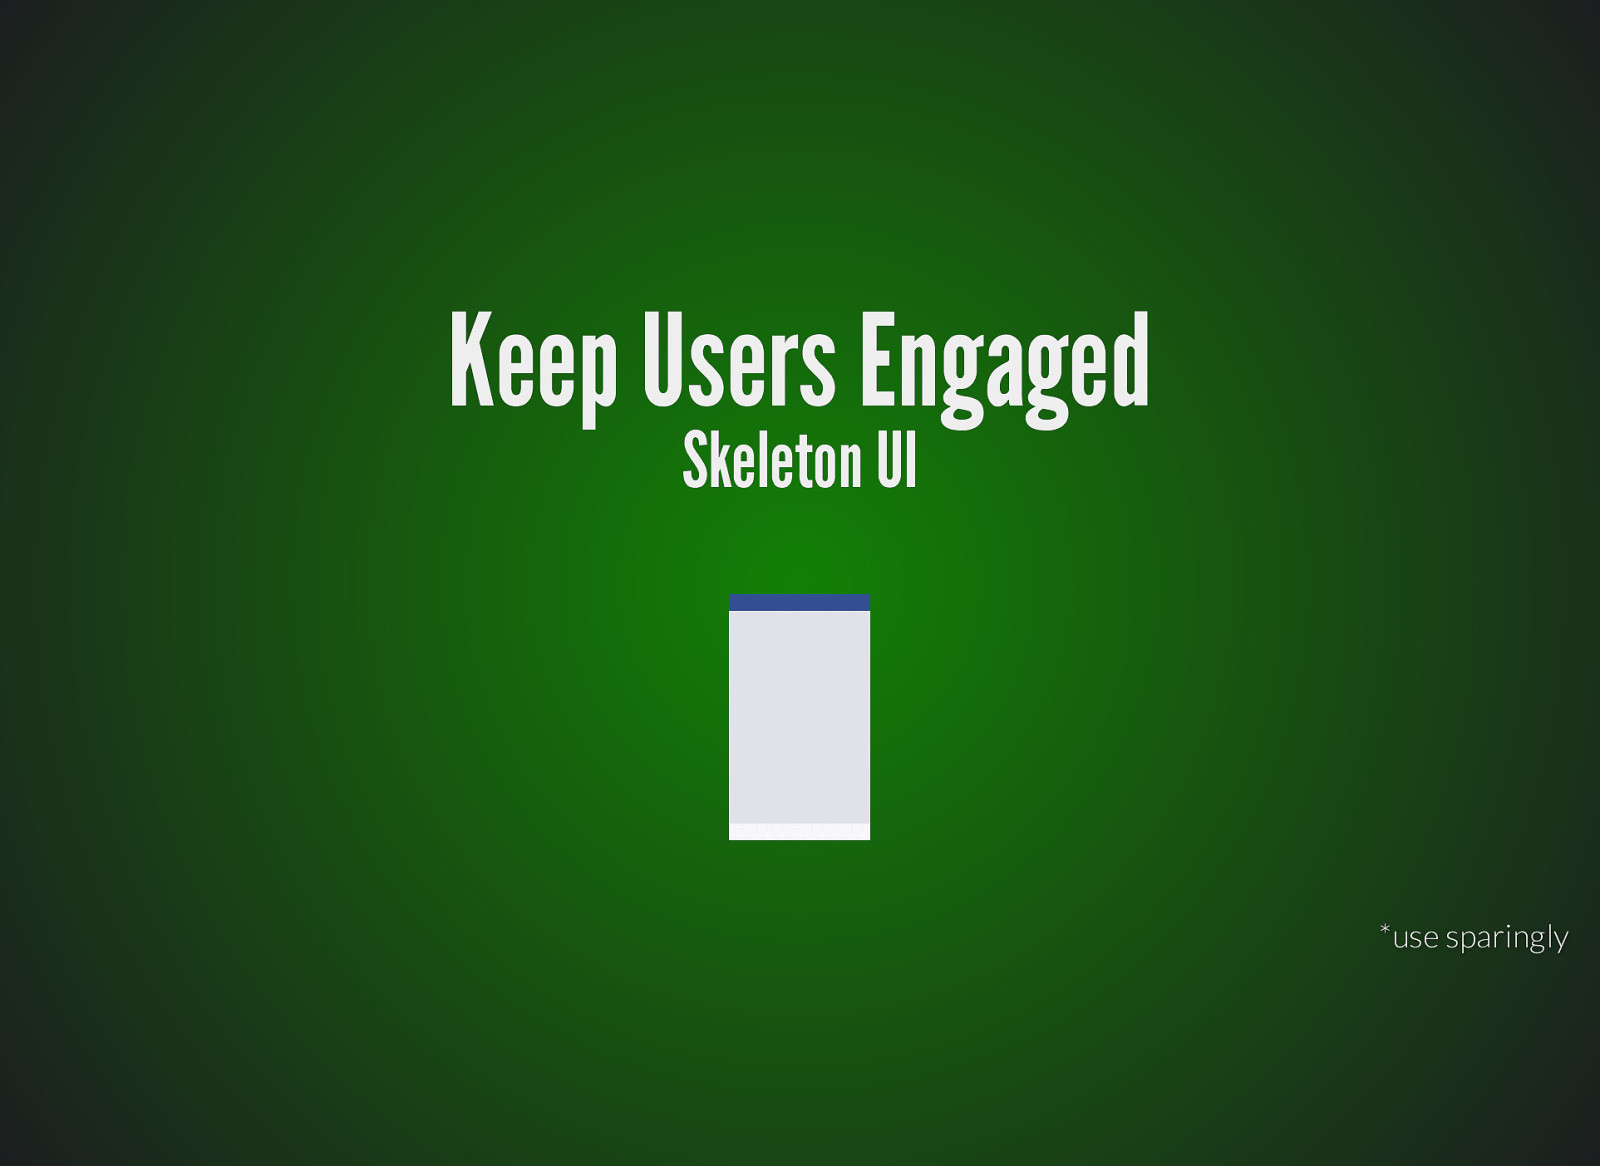
Keep Users Engaged Skeleton UI *use sparingly

Thank you @SimonHearne simonhearne.com/presentations/psych-speed @SimonHearne