Hi, I'm @MarkZeman from SpeedCurve

A presentation at Fluent in June 2018 in San Jose, CA, USA by Mark Zeman
Hi, I'm @MarkZeman from SpeedCurve

Ok, so lets get started! Now as we all know there are a lot of web performance metrics out there...

“Meaningful” Metrics ... but what I want to do today is to try and identify the most "meaningful" metrics. Now I know that "meaningful" is a pretty loaded word, so let's ask ourselves...
Meaningful to who?
What is it that we really care about, and what is it that we’re trying to represent with these metrics. There are literarily dozens of performance metrics but I believe we need to keep the focus on metrics that really represent the core of what we’re all trying to deliver…

… and that’s a great user experience. It’s our users that we should be trying to understand and we should be letting them guide us towards the most meaningful performance metrics! After all what ever product or service we’re building it’s our users that choose to make it a success or not.

Too often they are having an awful slow experience. Not everyone is on the latest and greatest device. And many of the next billion or so people who connect to the web for the first time will be doing so on slow devices over slow infrastructure across the developing world.

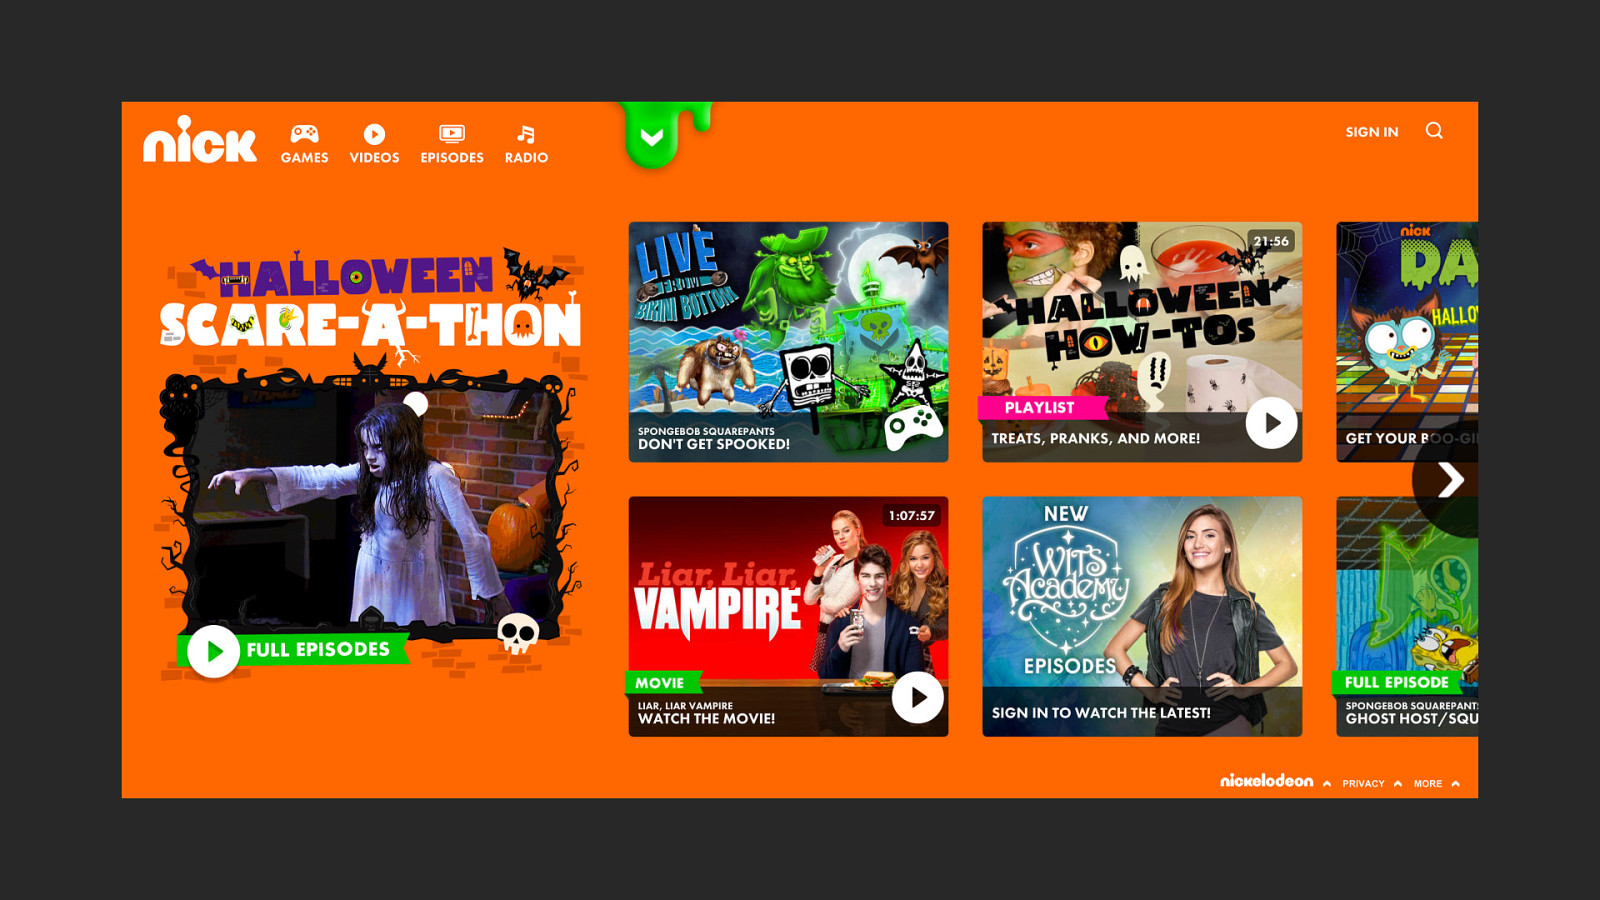
And all they want is our awesome content.
So when we talk about “meaningful” metrics. I believe we should focus our attention on the metrics that best represents the users experience and what they are actually seeing and experiencing.
Now with our user experience hat on, we can ask ourselves some questions about what our metrics should be representing...
Not all pixels on screen are equal.
As you can see these are simple questions, and ideally there should be simple answers.
Now while we all love the nut and bolts of the web, the backend, the JS frameworks and which image format we can squeeze the most out of…

Unfortunately users really don’t care about any of that. They just don’t care what your stack is!

Now I’ve seen many wonderful talks on the intricacies of how various performance metrics work. The complex algorithms behind them and how they are the next best thing! Paul Irish and Addy Osmani in particular have done great talks on the nuts and bolts of performance metrics and I’d really recommend watching their talks to get the details on how each metric works.
But rather than diving into the technical detail of the various metrics. I’d like to propose a much simpler way to evaluate each metric. One that actually reflects what our users are doing on our sites everyday…

Lets use our eyes! Lets pick metrics that reflects what our users are actually seeing and doing.
And to actually see what our users see and relate that back to different performance metrics there’s really only one tool to use…

… and that’s good old WebPageTest. We owe everything to this tool! It’s the giant whose shoulders we stand upon.
On a day to day basis I often feel like this. It really is at the core of many of tools and techniques we rely on in the performance community. So thanks again to Pat Mennan for the tireless work you do on WebPageTest.
And why is that we spend so much time in this tool? I thinks it’s because of one simple thing.
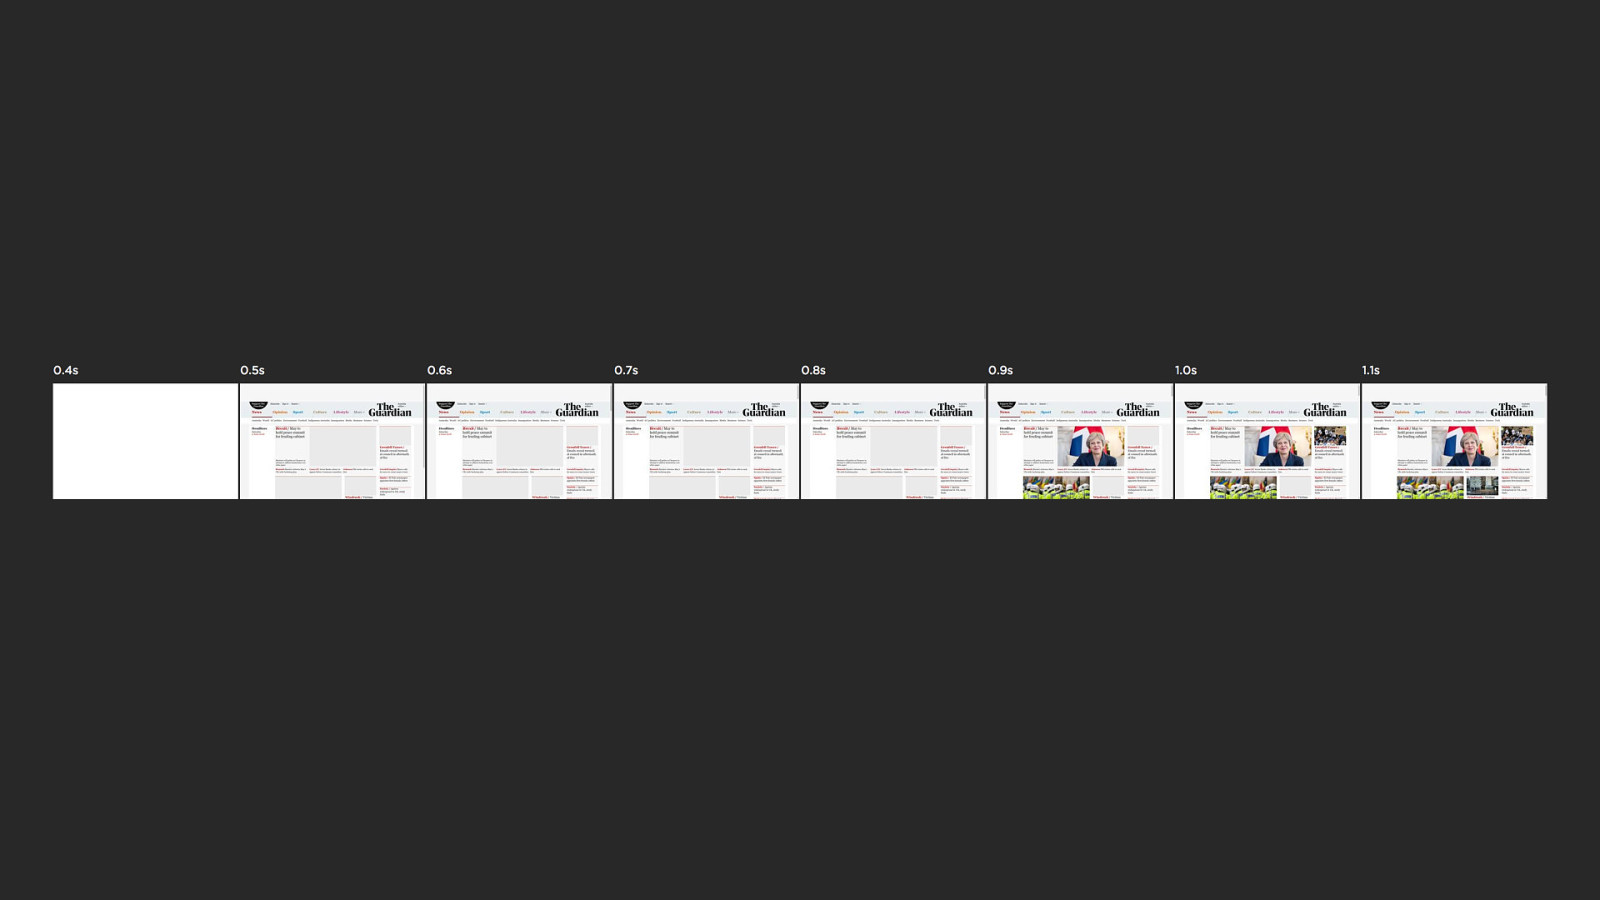
The filmstrip! It doesn’t matter what happens in the browser, WebPageTest is sitting there like a neutral observer just recording whatever happens on screen. It gives us the perspective of the user and allows us to keep that top of mind while we then dive into and interrogate all the other available data.
It allows us to relate all the performance data and metrics we have back to what we see in the filmstrip. The content on screen that actually matter to users. Be it various metrics, what the browser main thread is doing. What’s happening with our requests over the network. How does that all correlate back to what the user actually sees in their browser?
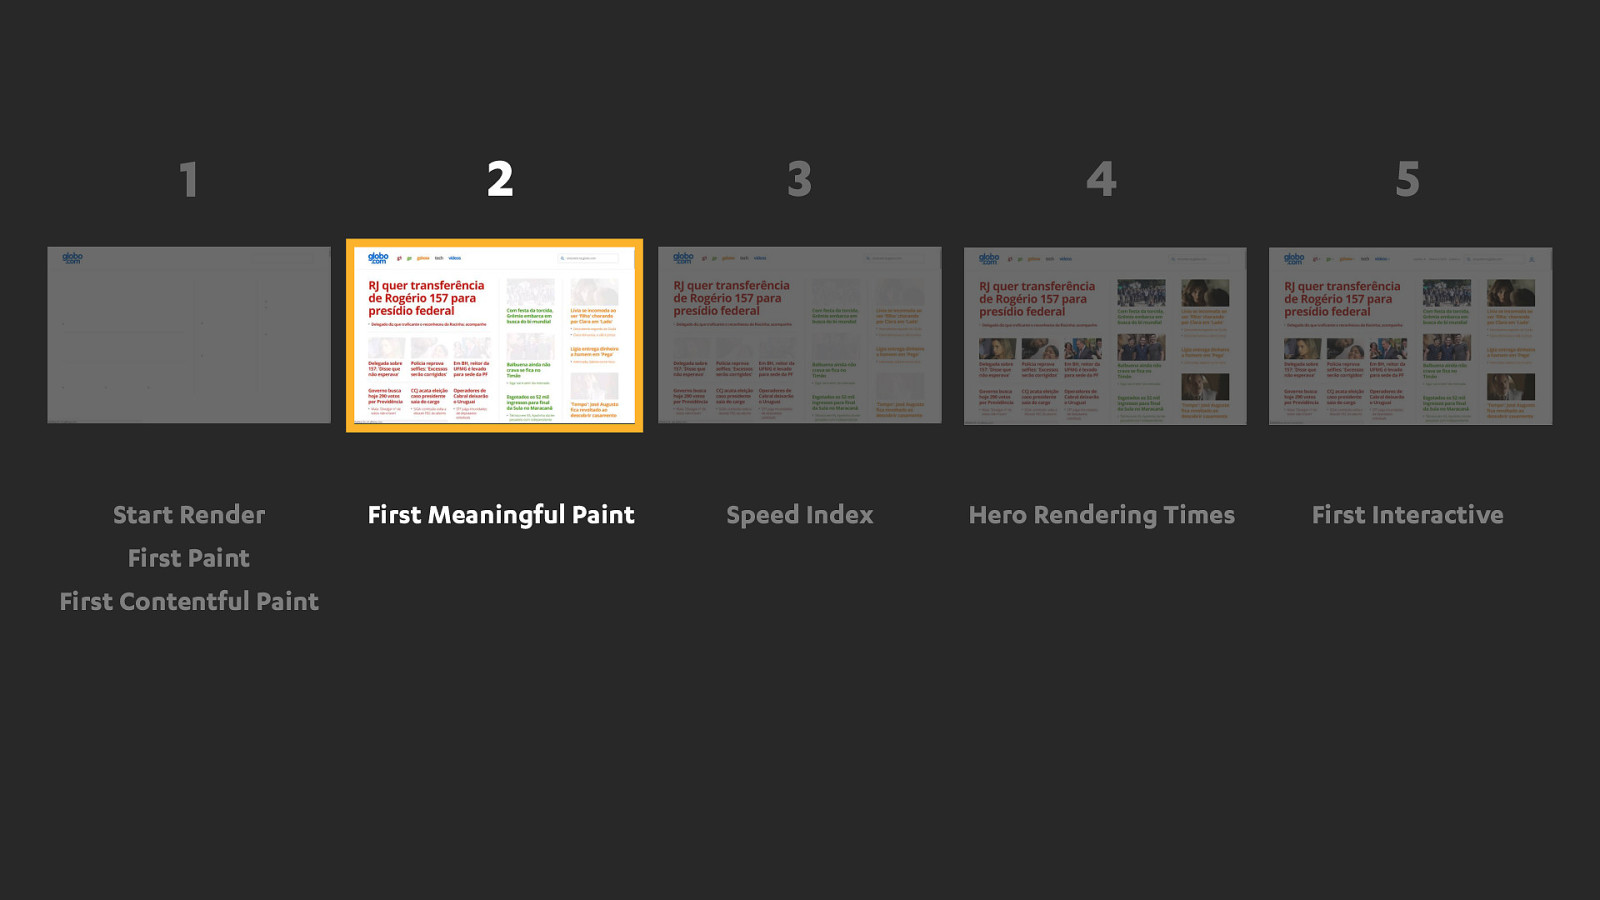
Now, we’re often using these tools in one direction. To show us what was on screen when a particular metric fired. But what if we could flip that on it’s head and do it the other way…
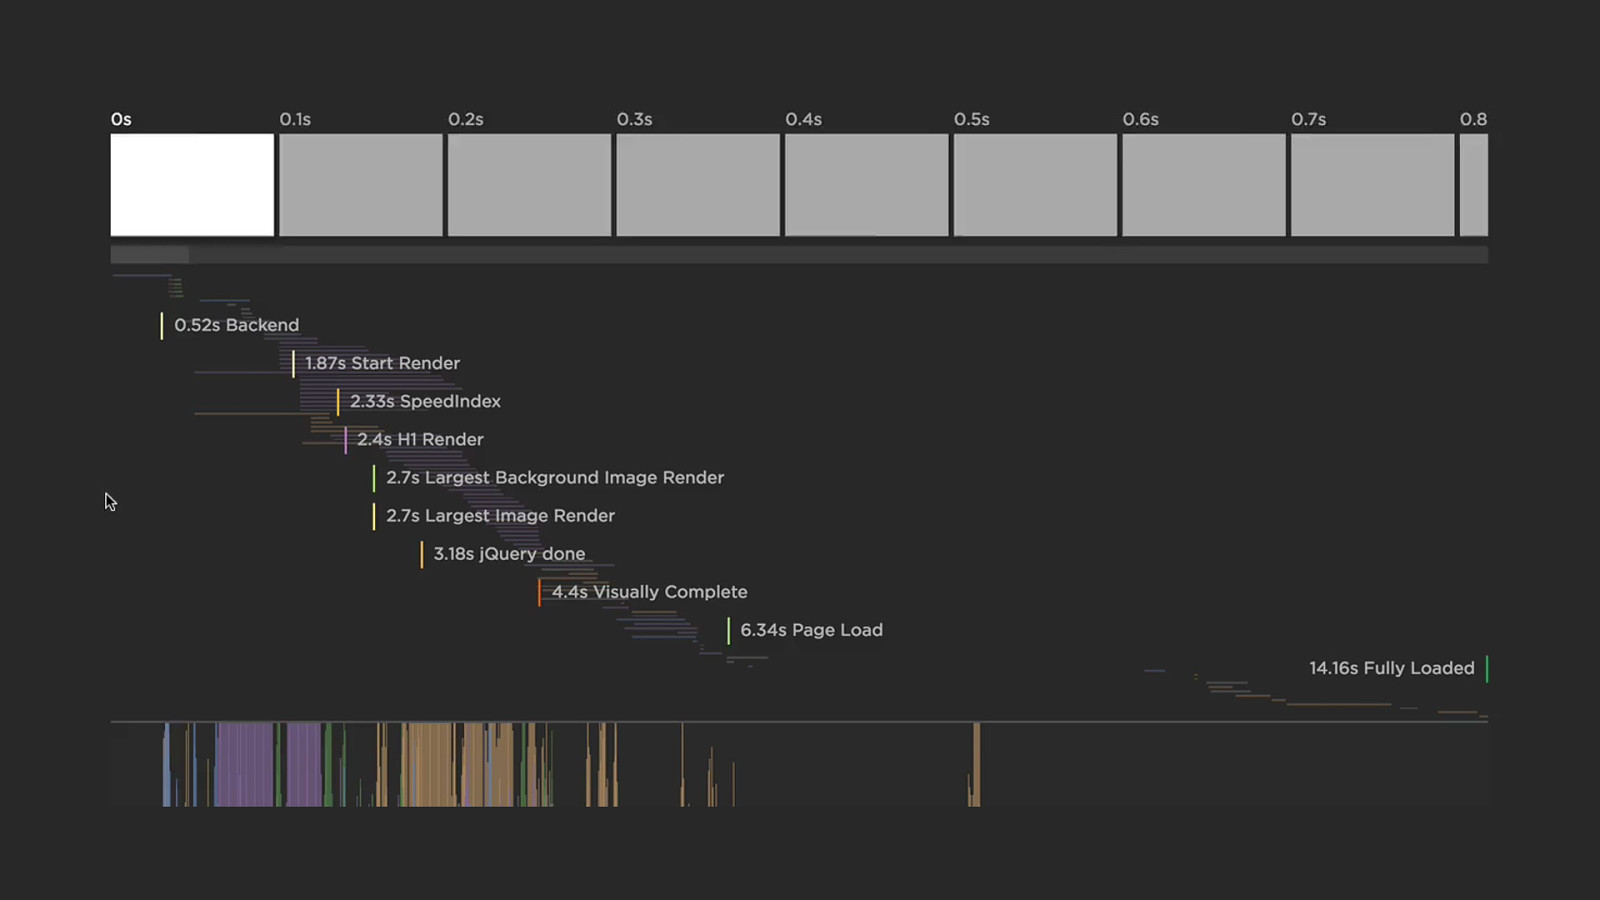
What if we could pick a moment on screen that we care about, and let it tell us what metrics fired as close as possible to that moment in time.
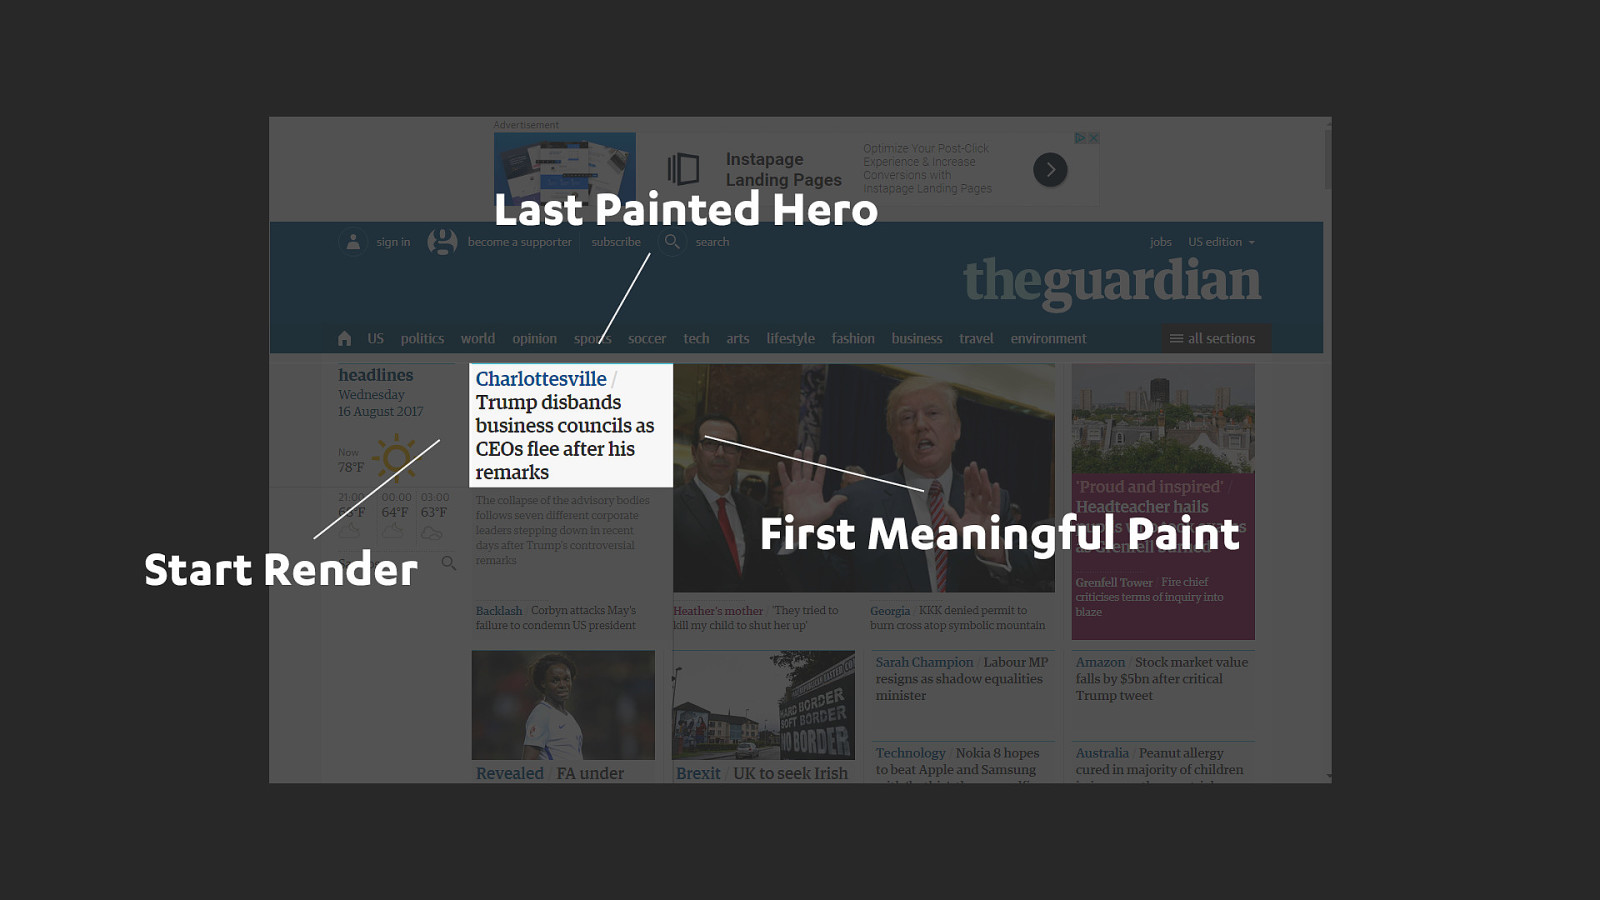
Was it last painted hero, was it first meaningful paint or start render? Maybe it was all three that match the moment when the main headline on this page was visible to a user.

Now I’m lucky enough to work everyday with this clever fish. Steve Souders, the godfather of the perf community. One of things I enjoy the most about working with Steve is that he expresses his thought process and ideas through code. Much to my ongoing frustration, you can’t slip anything past him without the data to back it up.
So when we talked about the idea of using the filmstrip as a way of evaluating metrics. He whipped up an experiment in no time and called it the Rendering Metrics Picker.
Here's how it works...
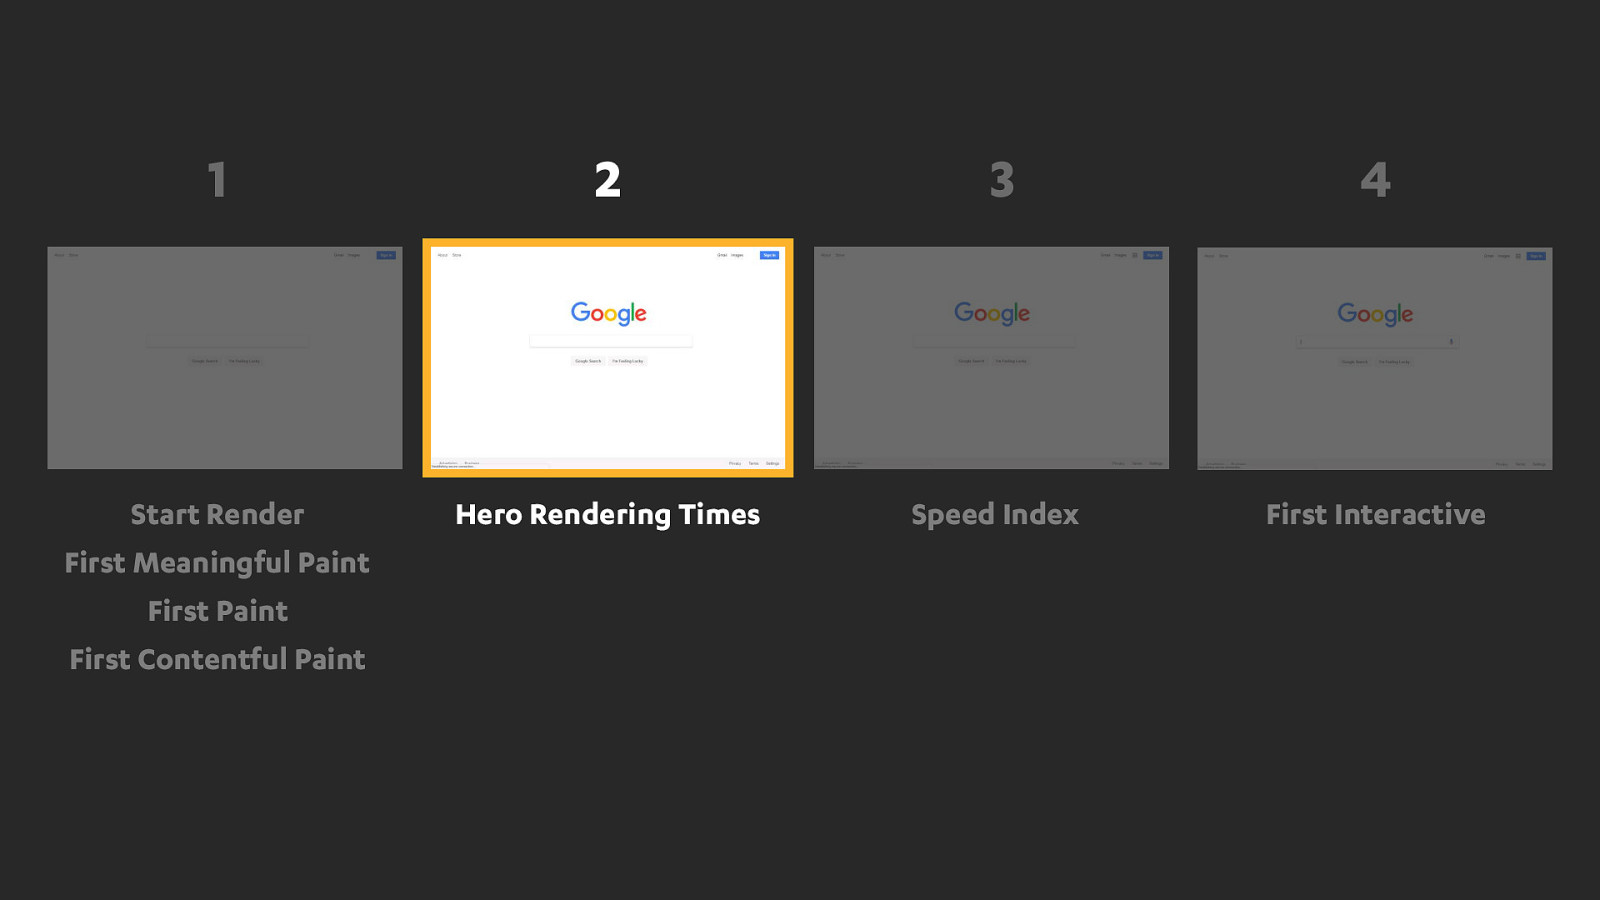
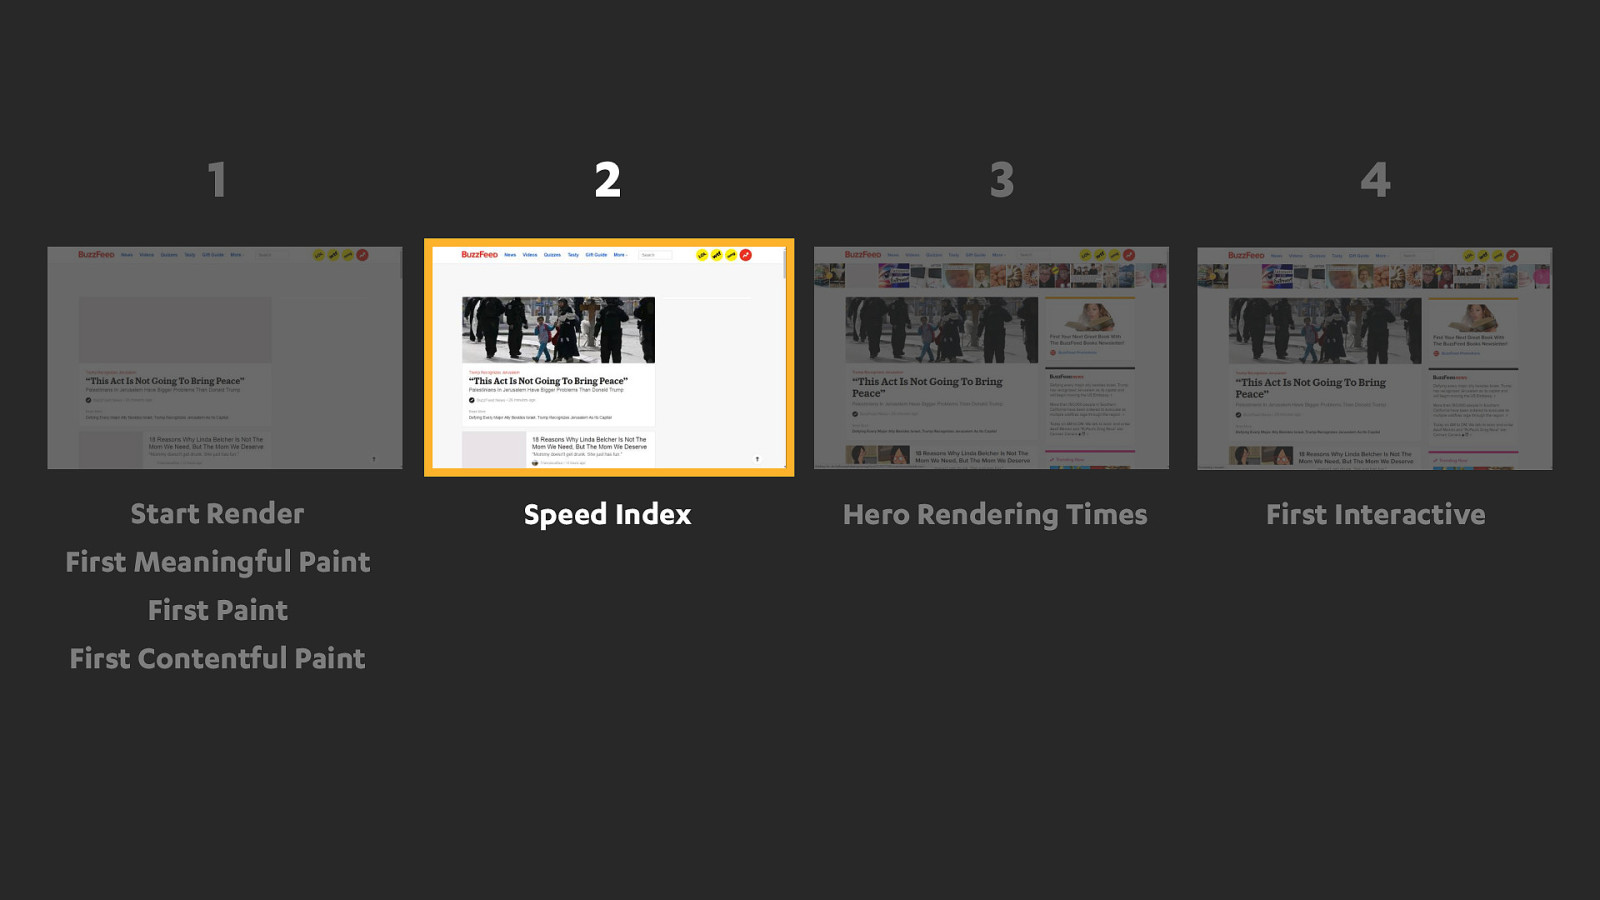
You have a filmstrip on screen and you're invited to pick the one that best represents when you thing the page is "ready". And "ready" is a subjective thing...
Is the very first pixels of content you see?
Is it when the hero content like the main heading or image is visible?
Or is it when all the content in the viewport is finished. It's up to you.
So let’s try a few of these together.
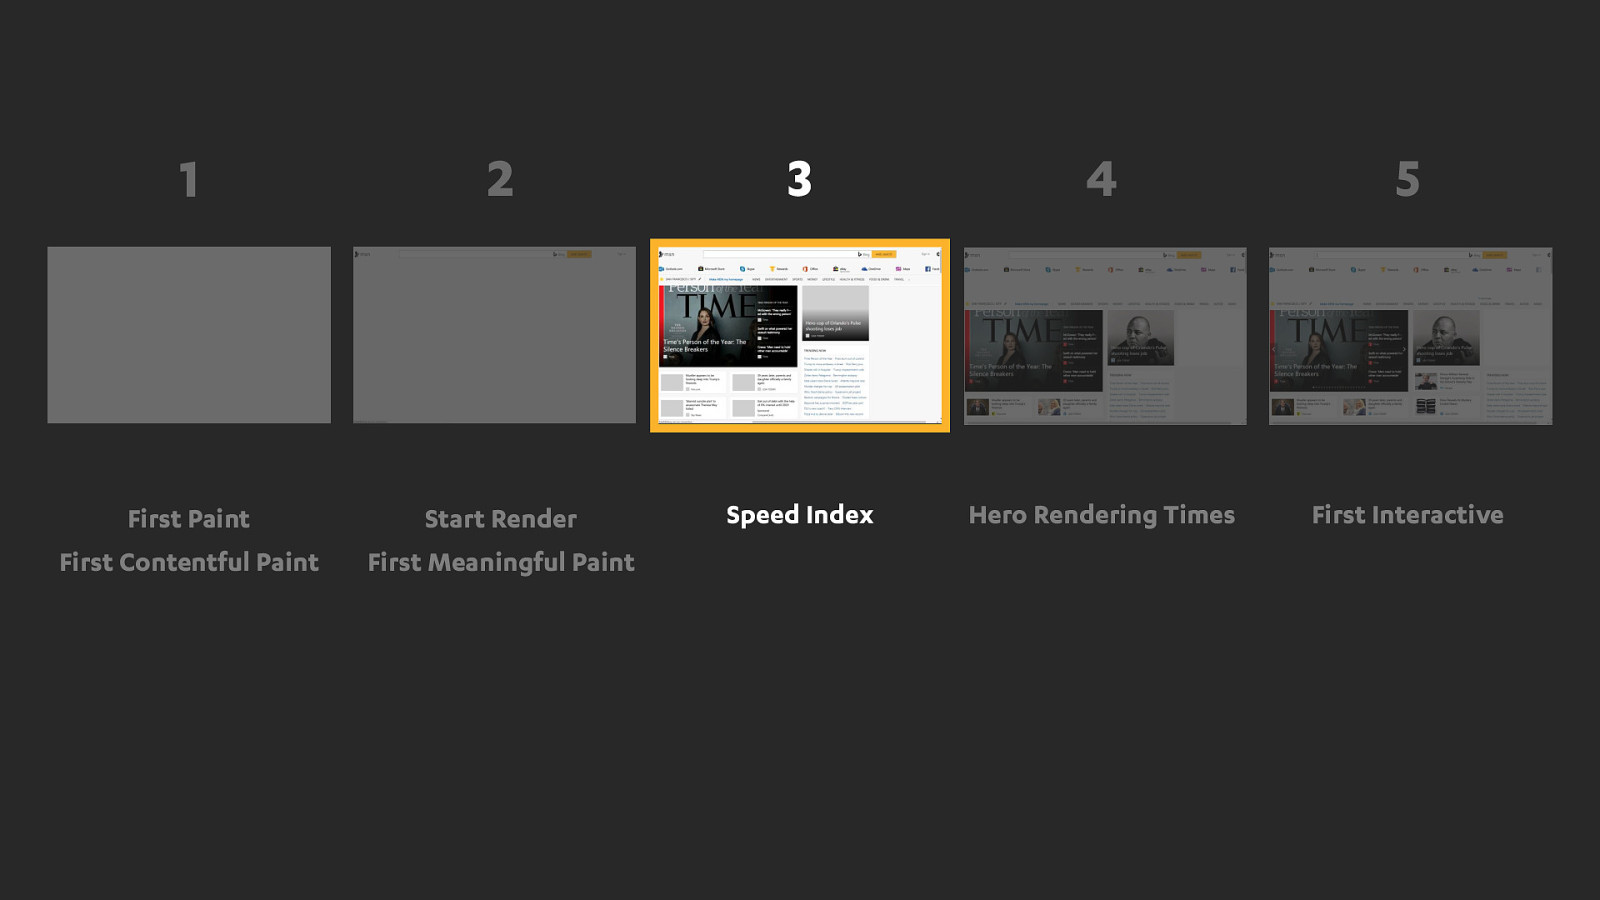
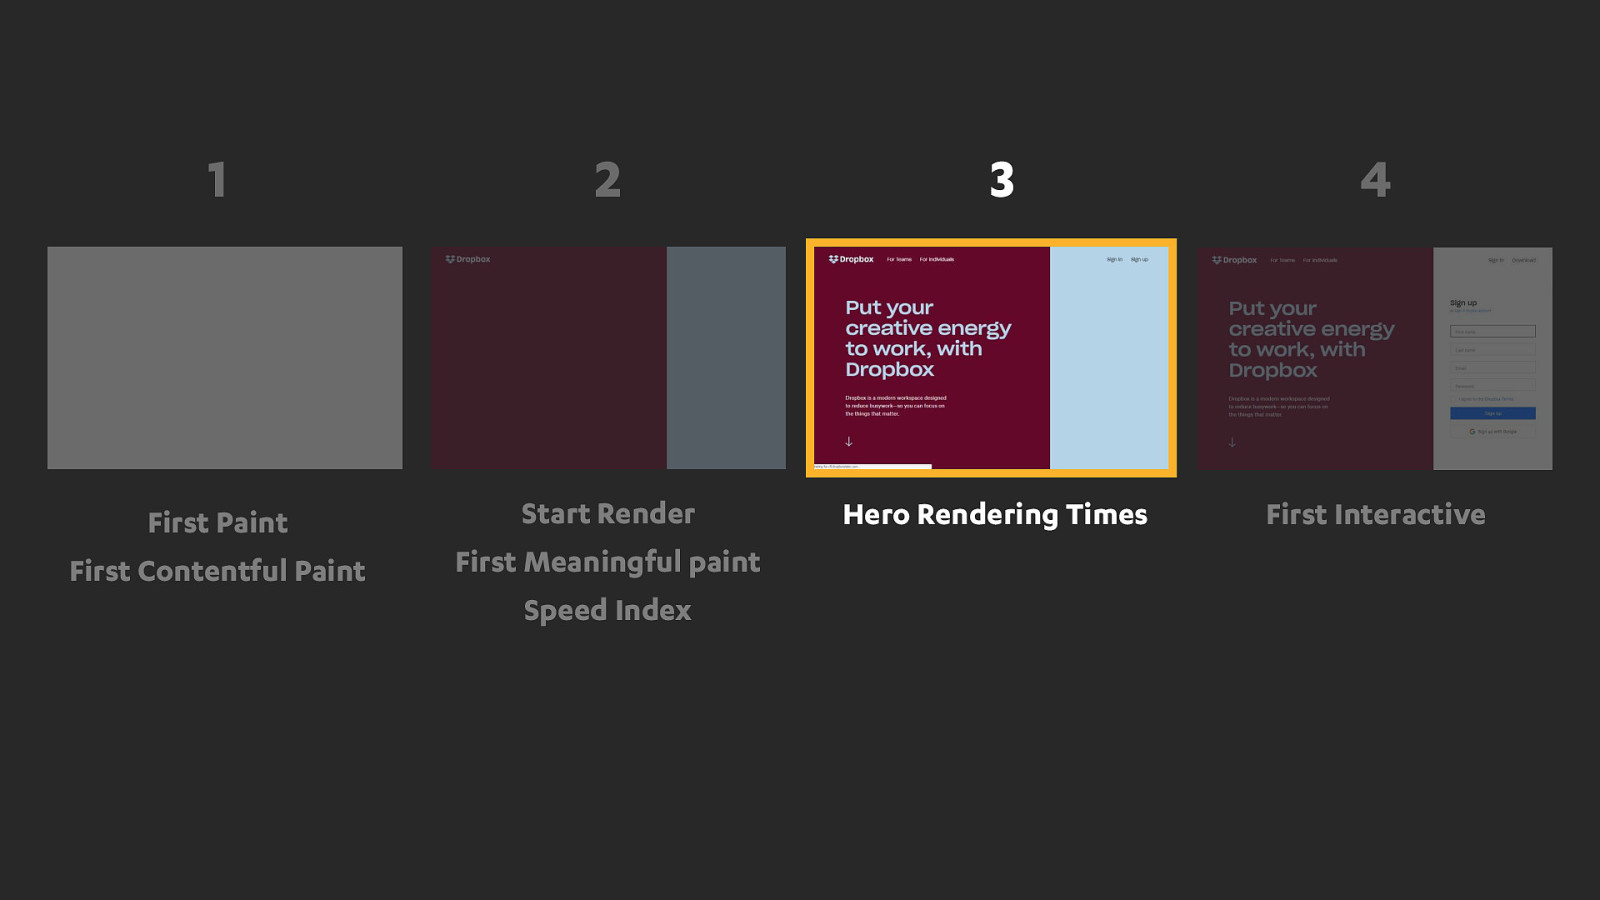
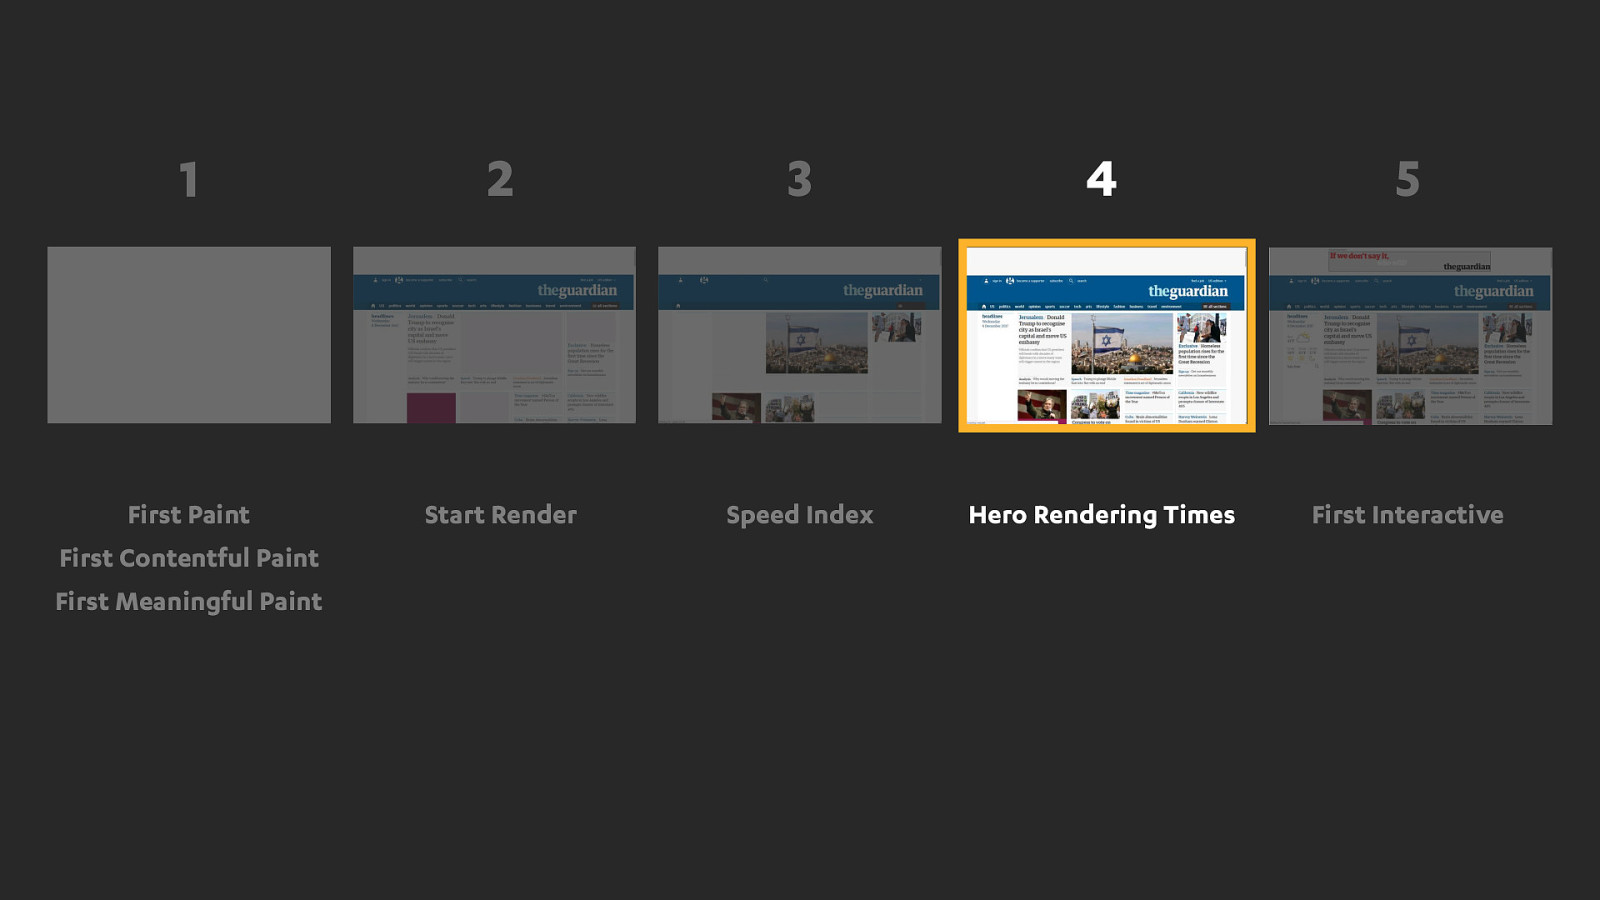
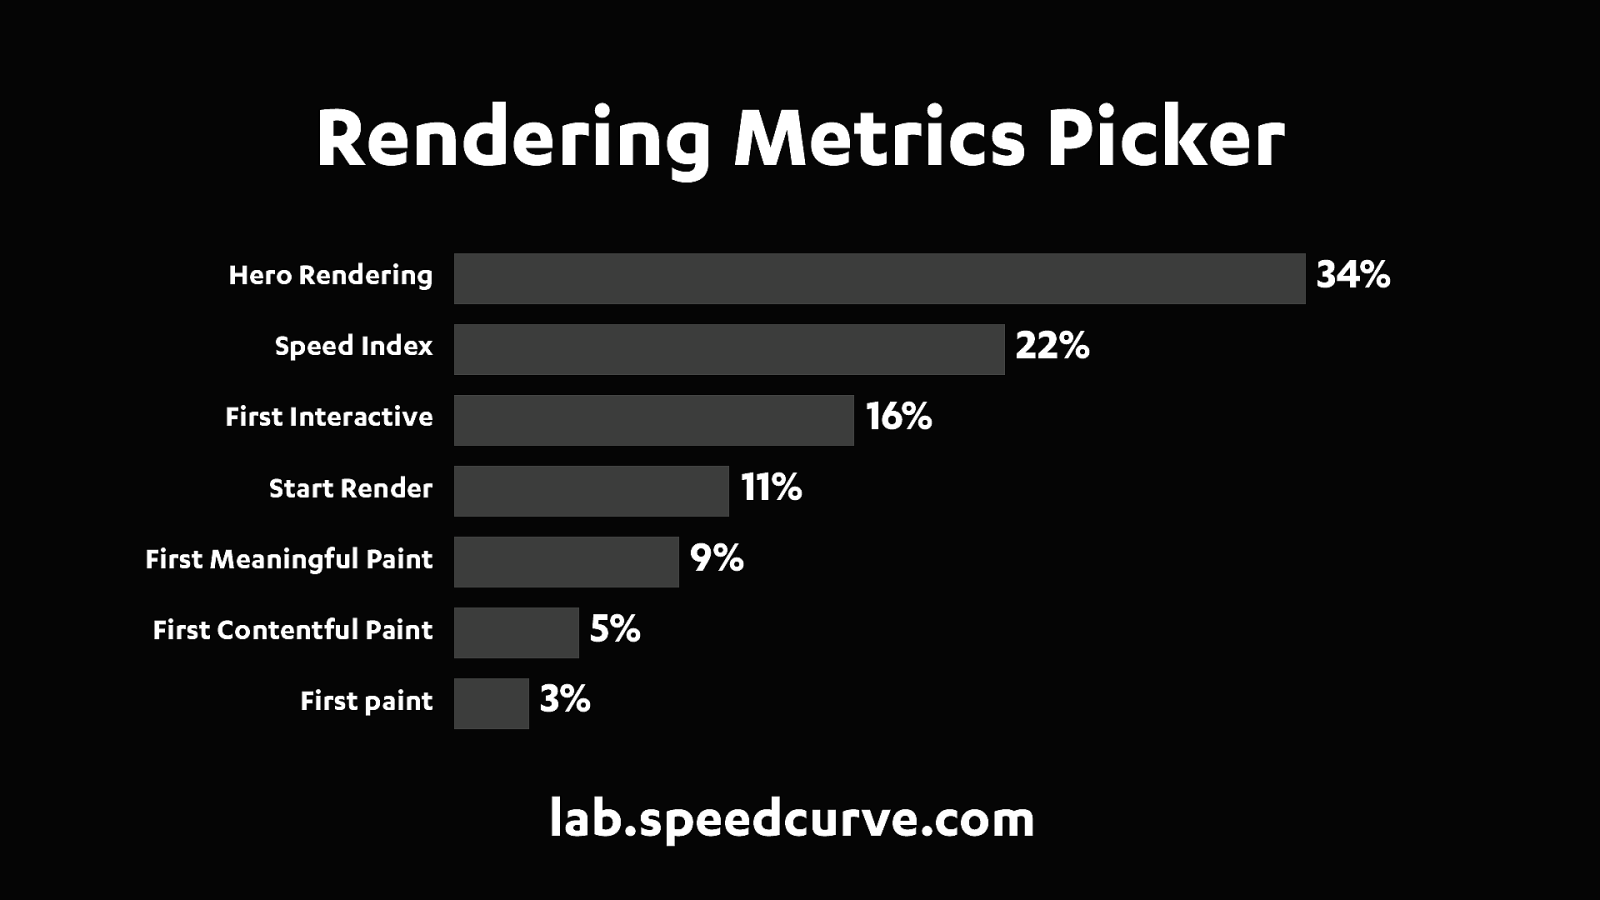
Now here are my results from 150 of the most popular websites. Yours may be different, and I'd encourage you to go through the exercise yourself as it can be really interesting to look at how each site renders and see how the content flows onto the page and decide when you think it's ready. You can find the rendering metrics picker at lab.speedcurve.com
So together the top 3 metrics captured 72% of the moments that correlated the strongest with what the users actually saw.
Lets take look at the top three metrics in a bit more detail, and find out what they actually represent.

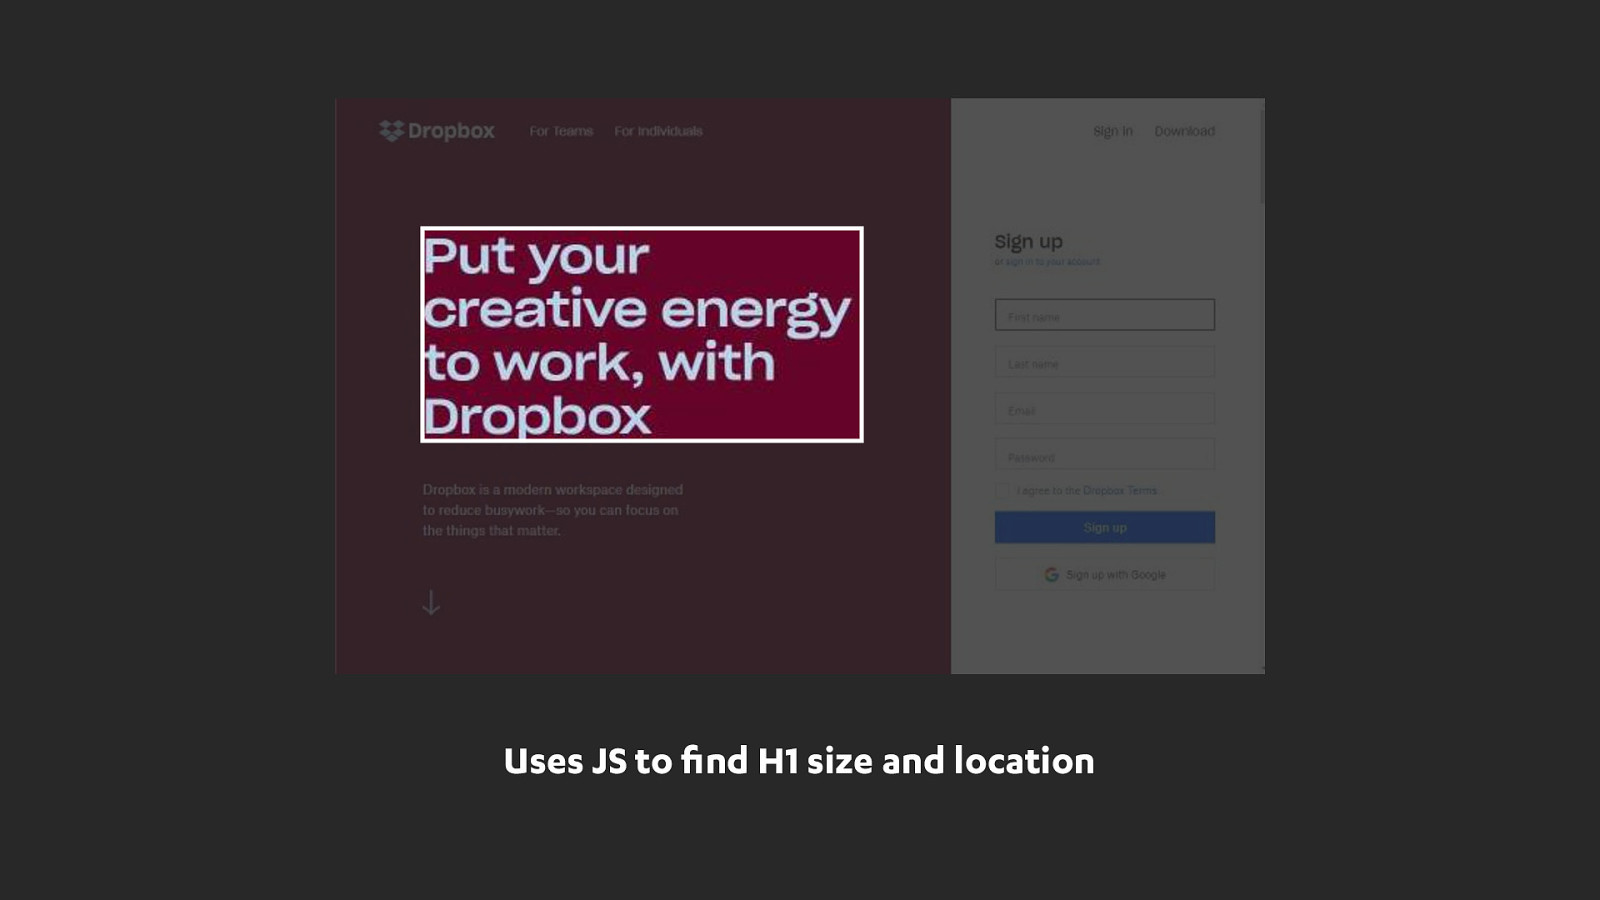
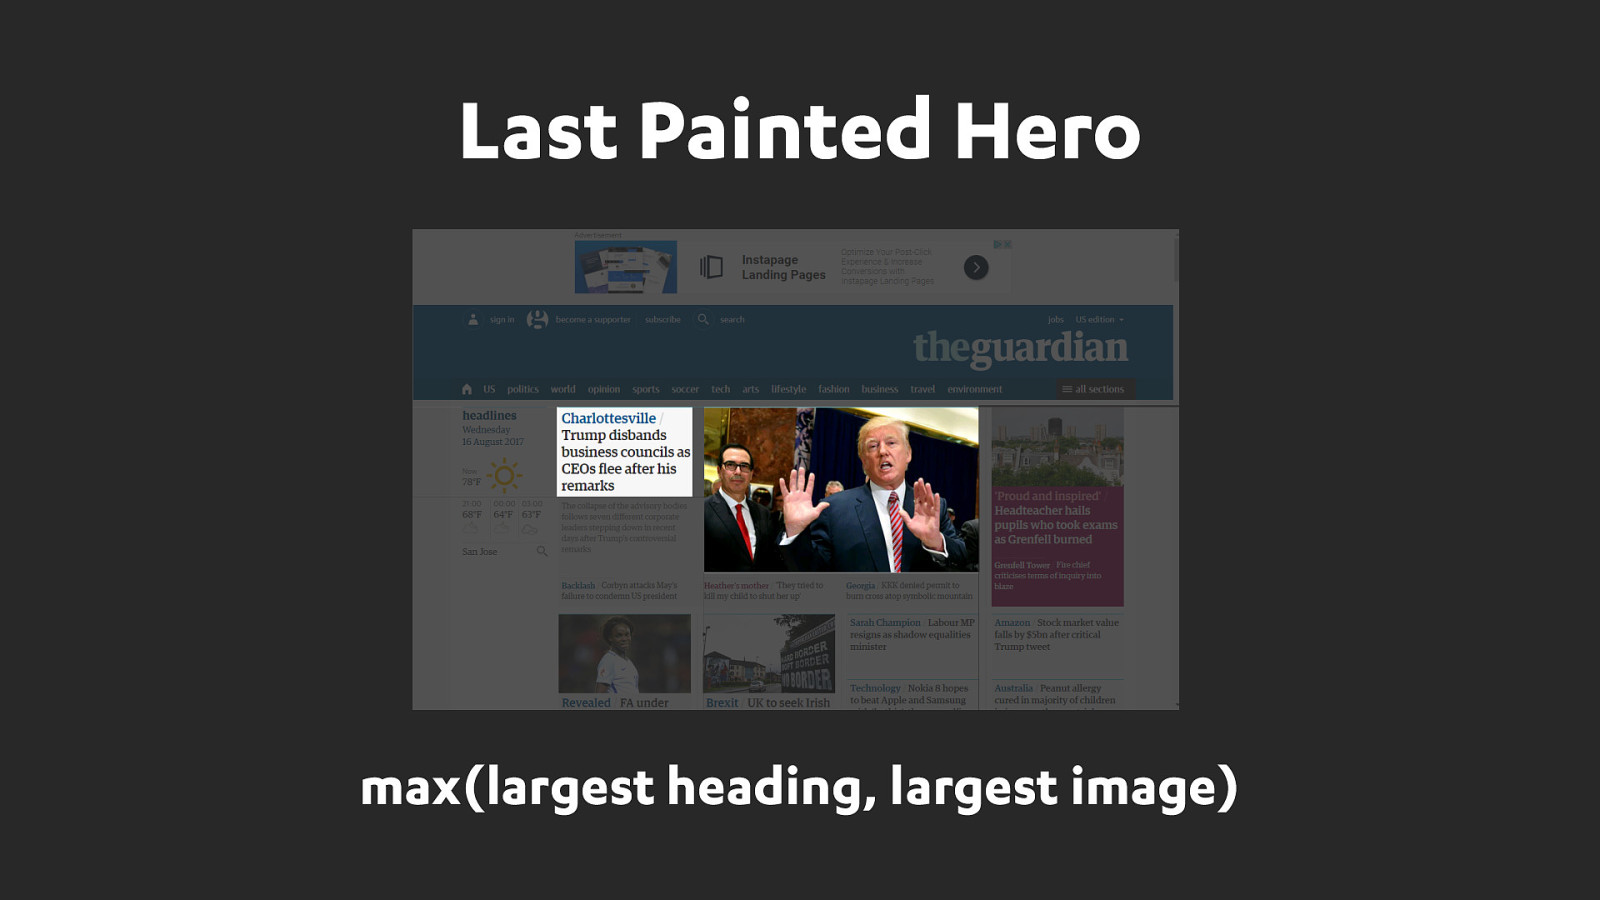
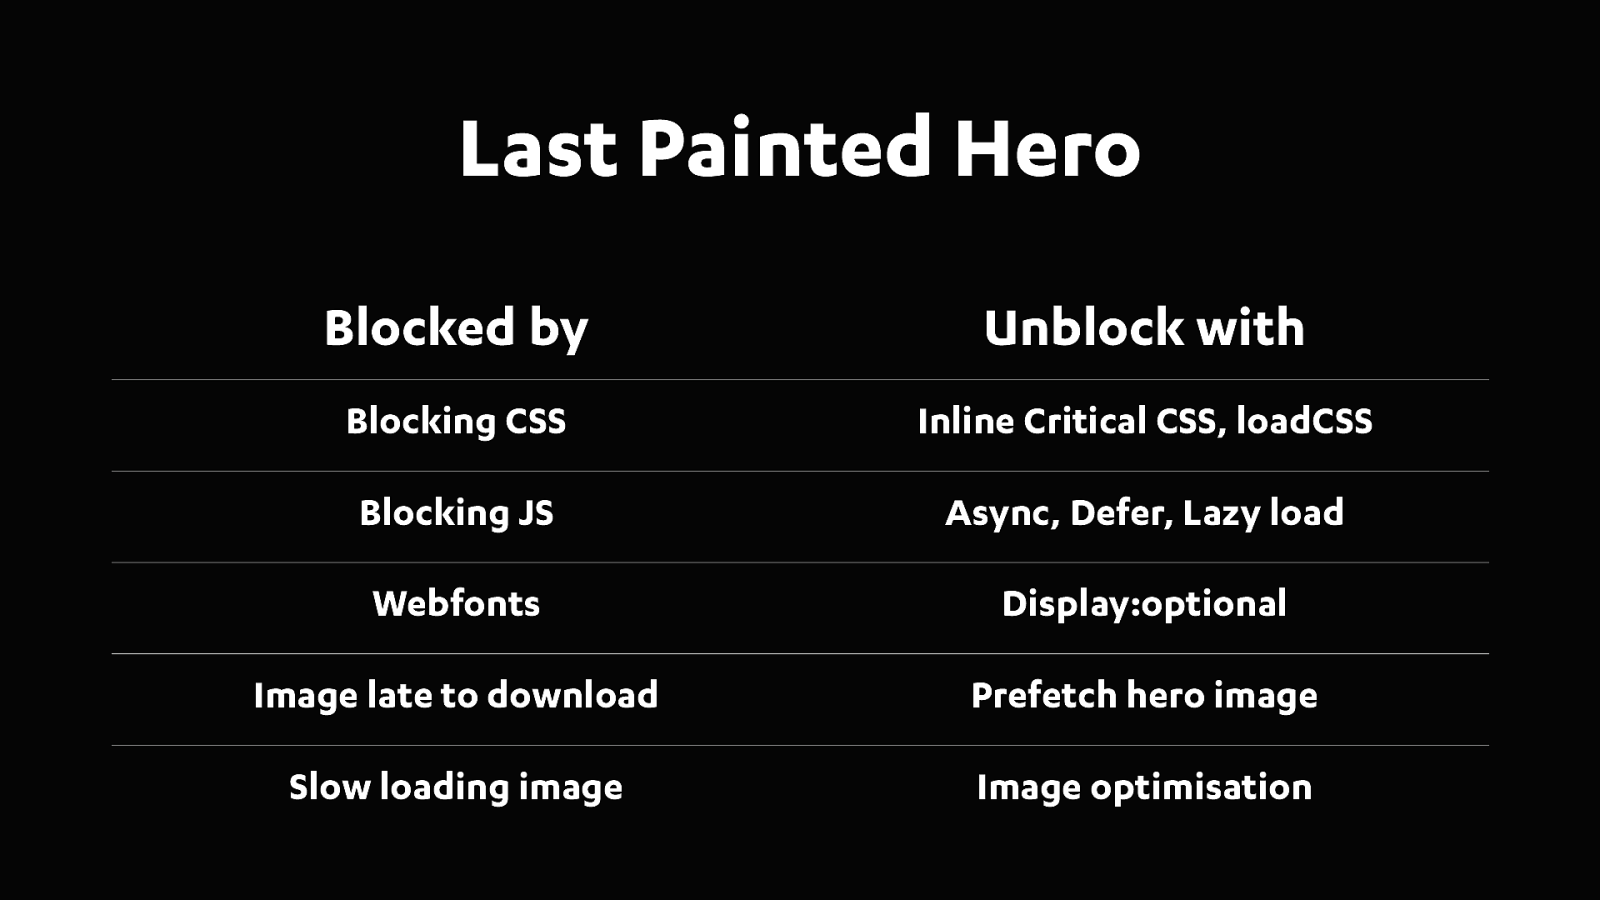
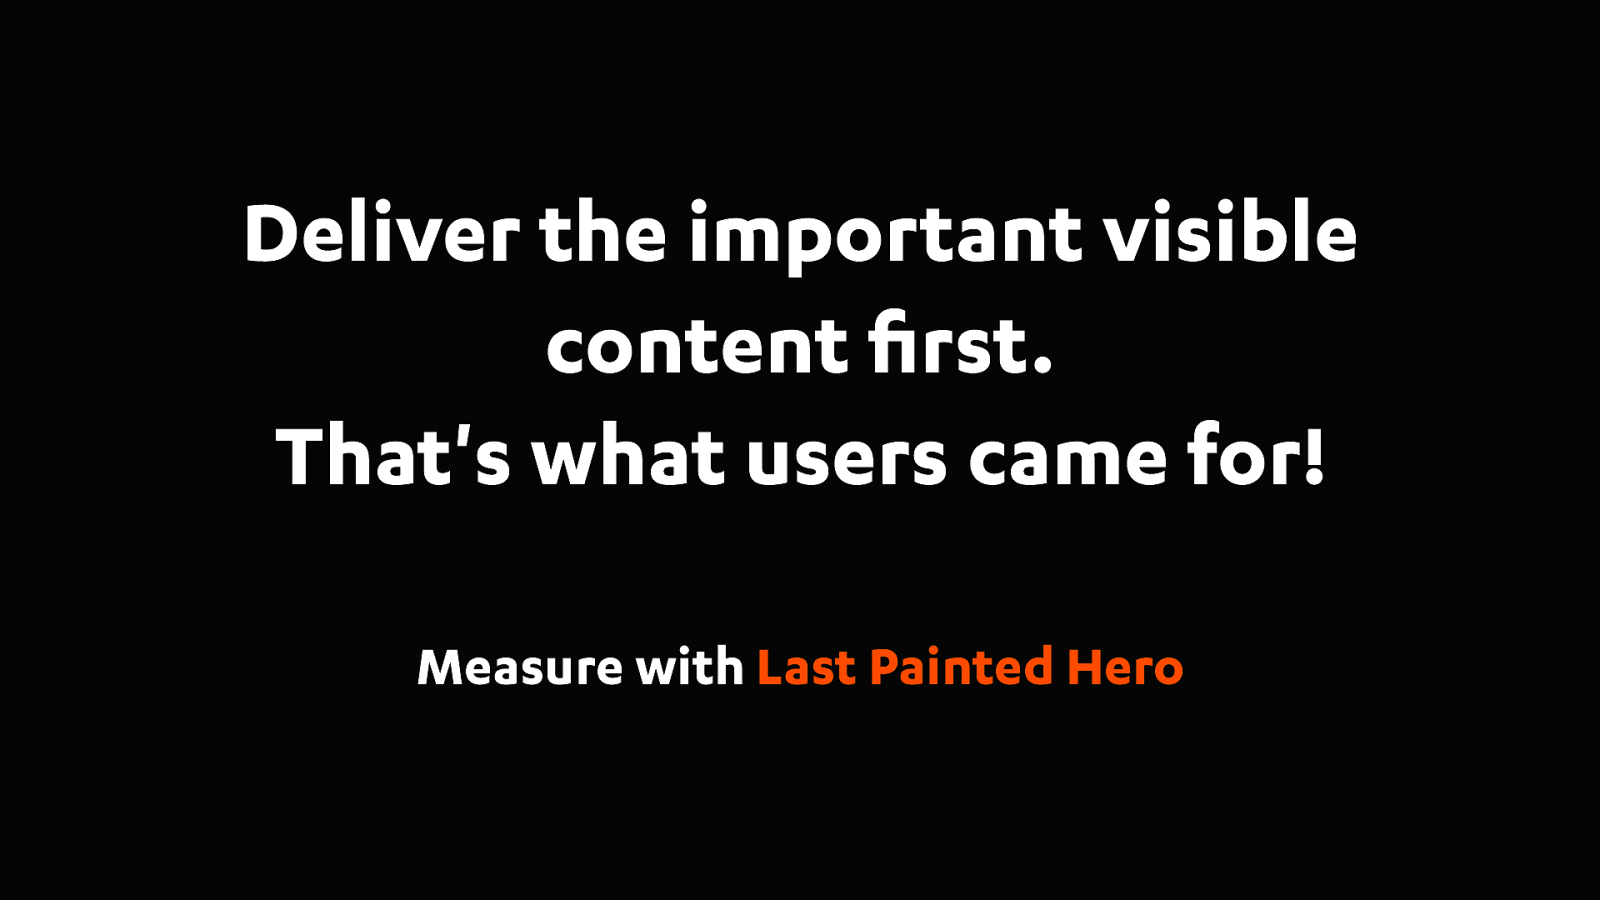
Last Painted Hero is the point in time that all the hero elements on the page have finished rendering.
Paul Irish came up with the name "Last Painted Hero" and he's keen to see the metric added to Chrome.
Very happy to announce today that we’ll be contributing the code for hero rendering times back to WebPageTest. We’re just working through a final review of the pull request and soon anyone using WebPageTest will be able to get Hero Rendering Times and Last Painted Hero.

Good old speed index. It has been around for a number of years now and still holds it’s own.
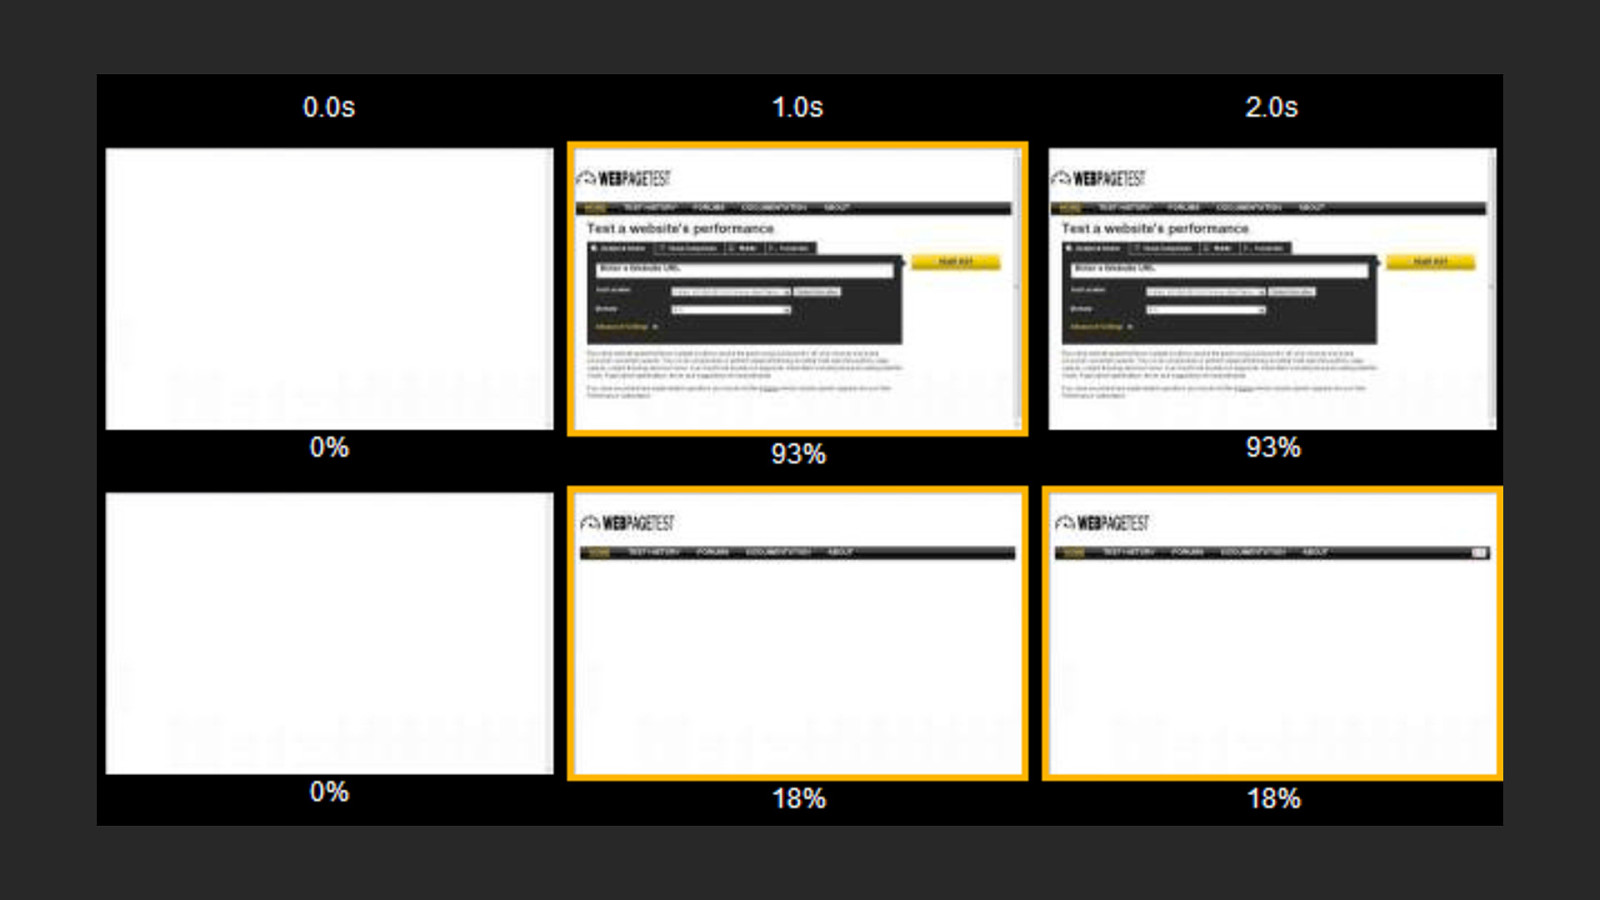
Webpagetest records video as a page loads and from this calculates a percentage of how visually complete a page is at any given point.
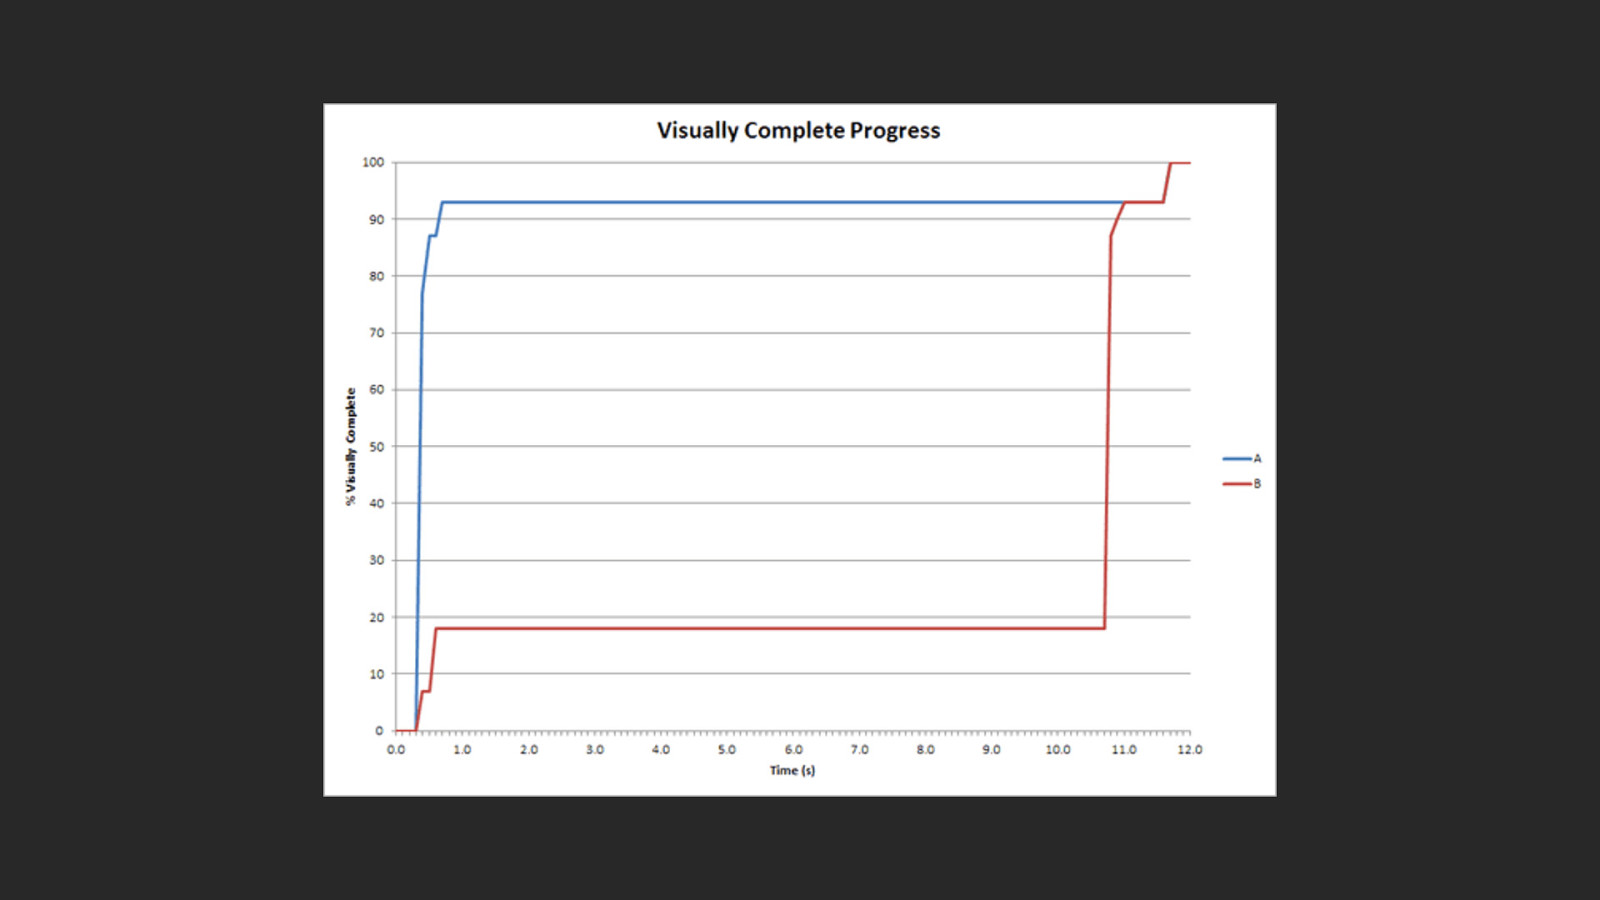
You can then plot the visual completeness over time.
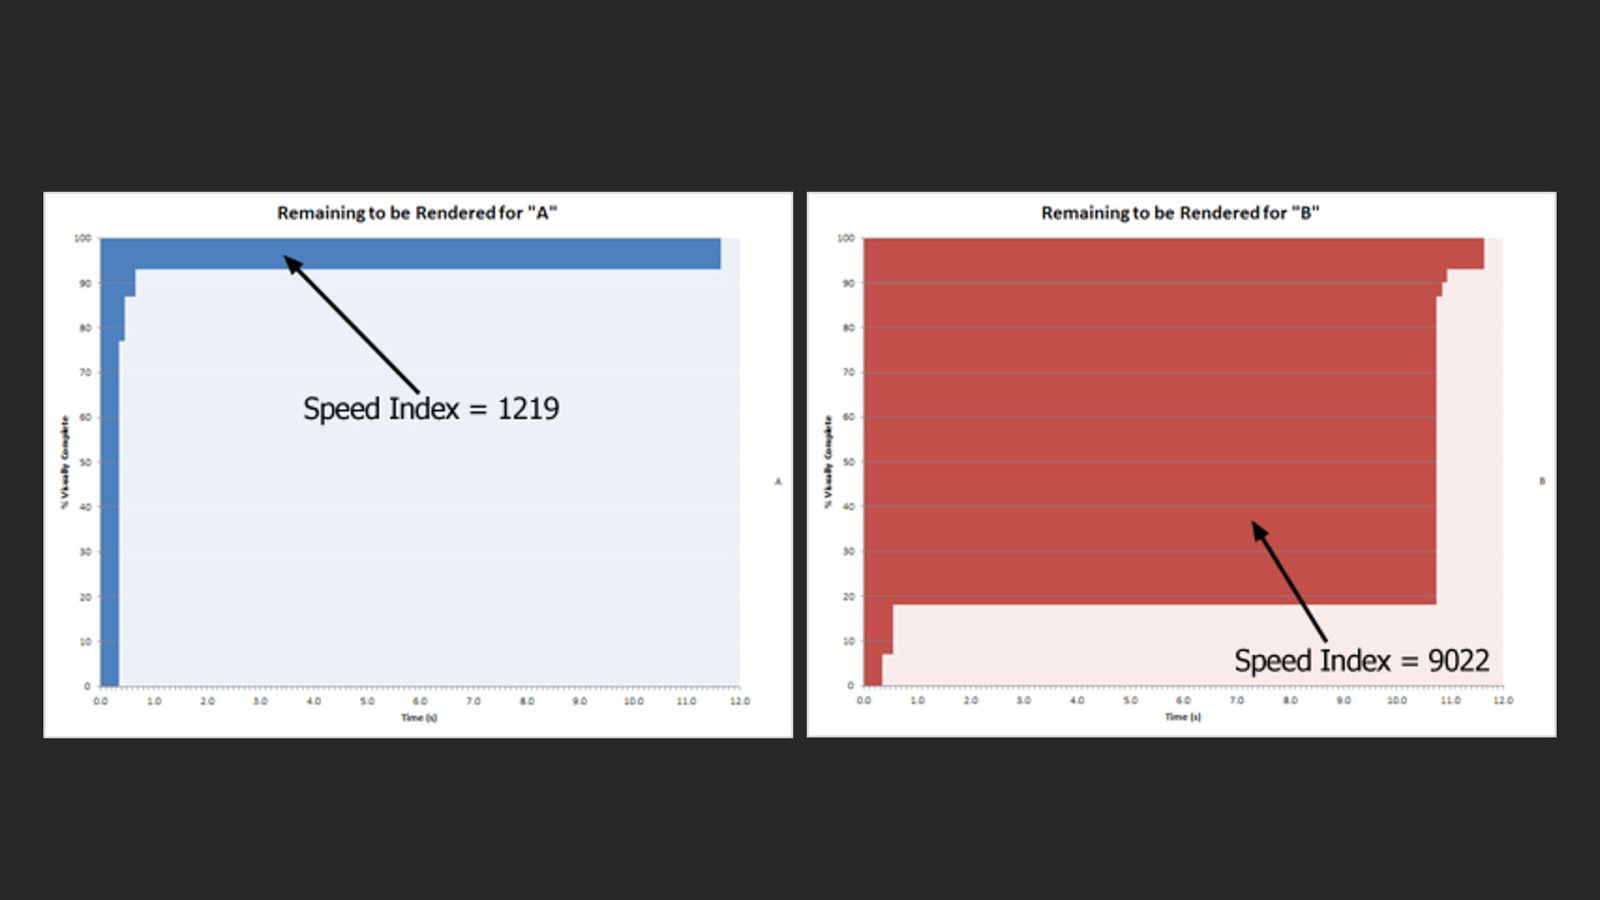
Here we can see how two different pages load. On the the left the page gets very quickly to 90% where as on the right the page spends a lot of time at only 20% waiting for other assets to load and complete the page. And as you can see here, Speed Index is actually a calculation of the area "above the curve". It's not a point in time but rather the volume of time the page was visually incomplete. Another way to describe it is that it’s…


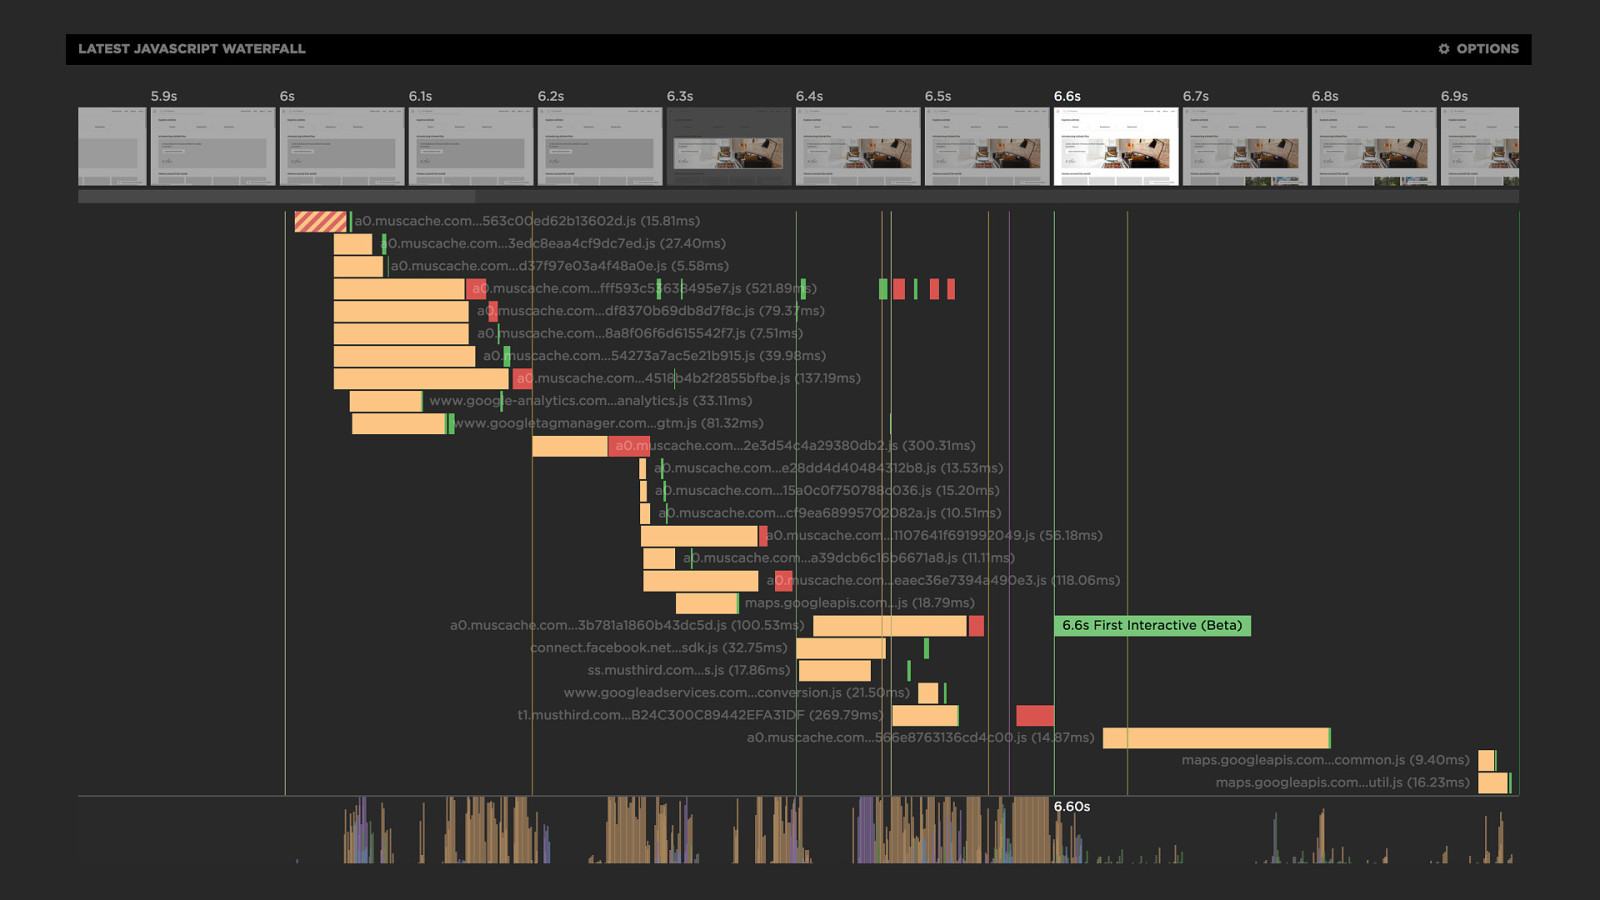
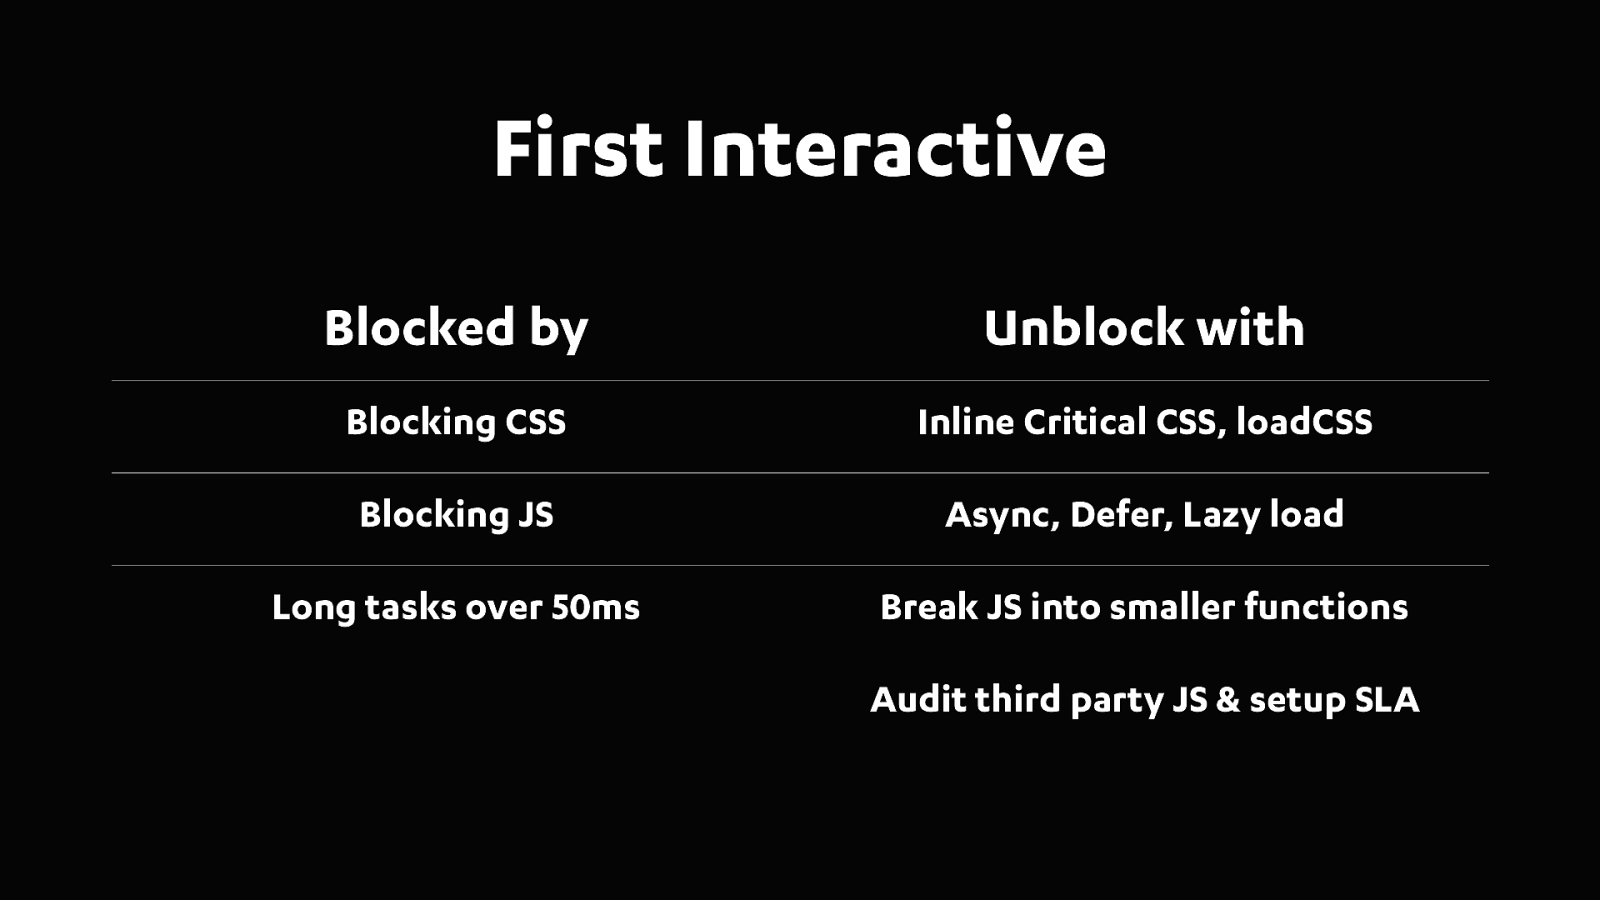
This really highlights a shift we’re seeing in web performance. Away from the network being the roadblock to Javascript now being a major problem in the rendering of pages.
So let me described what your looking at here...
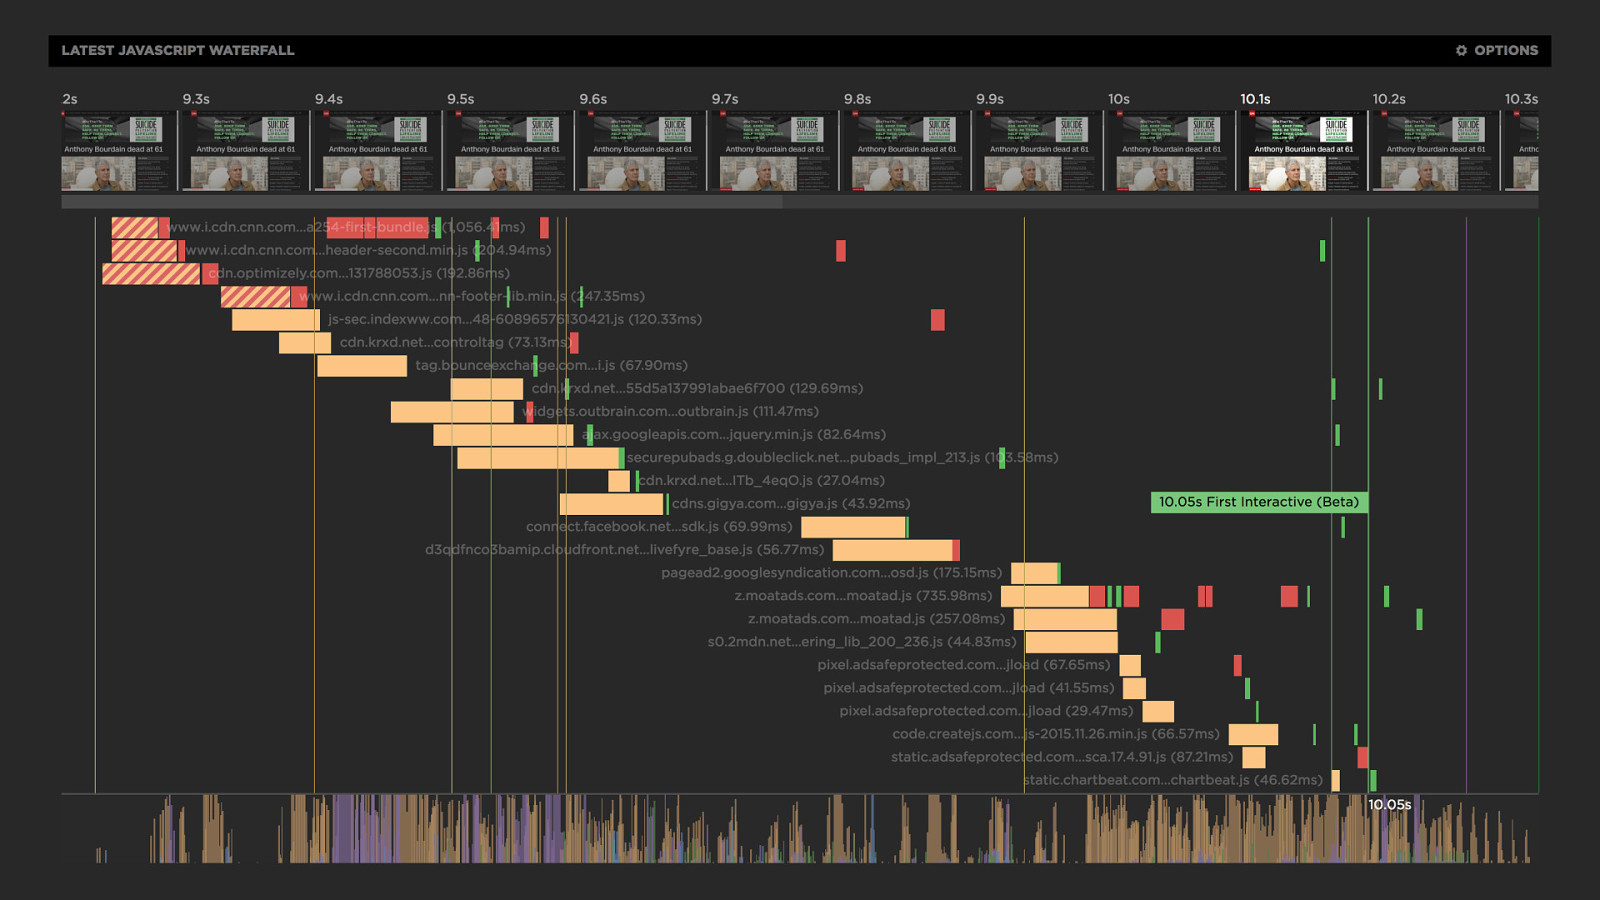
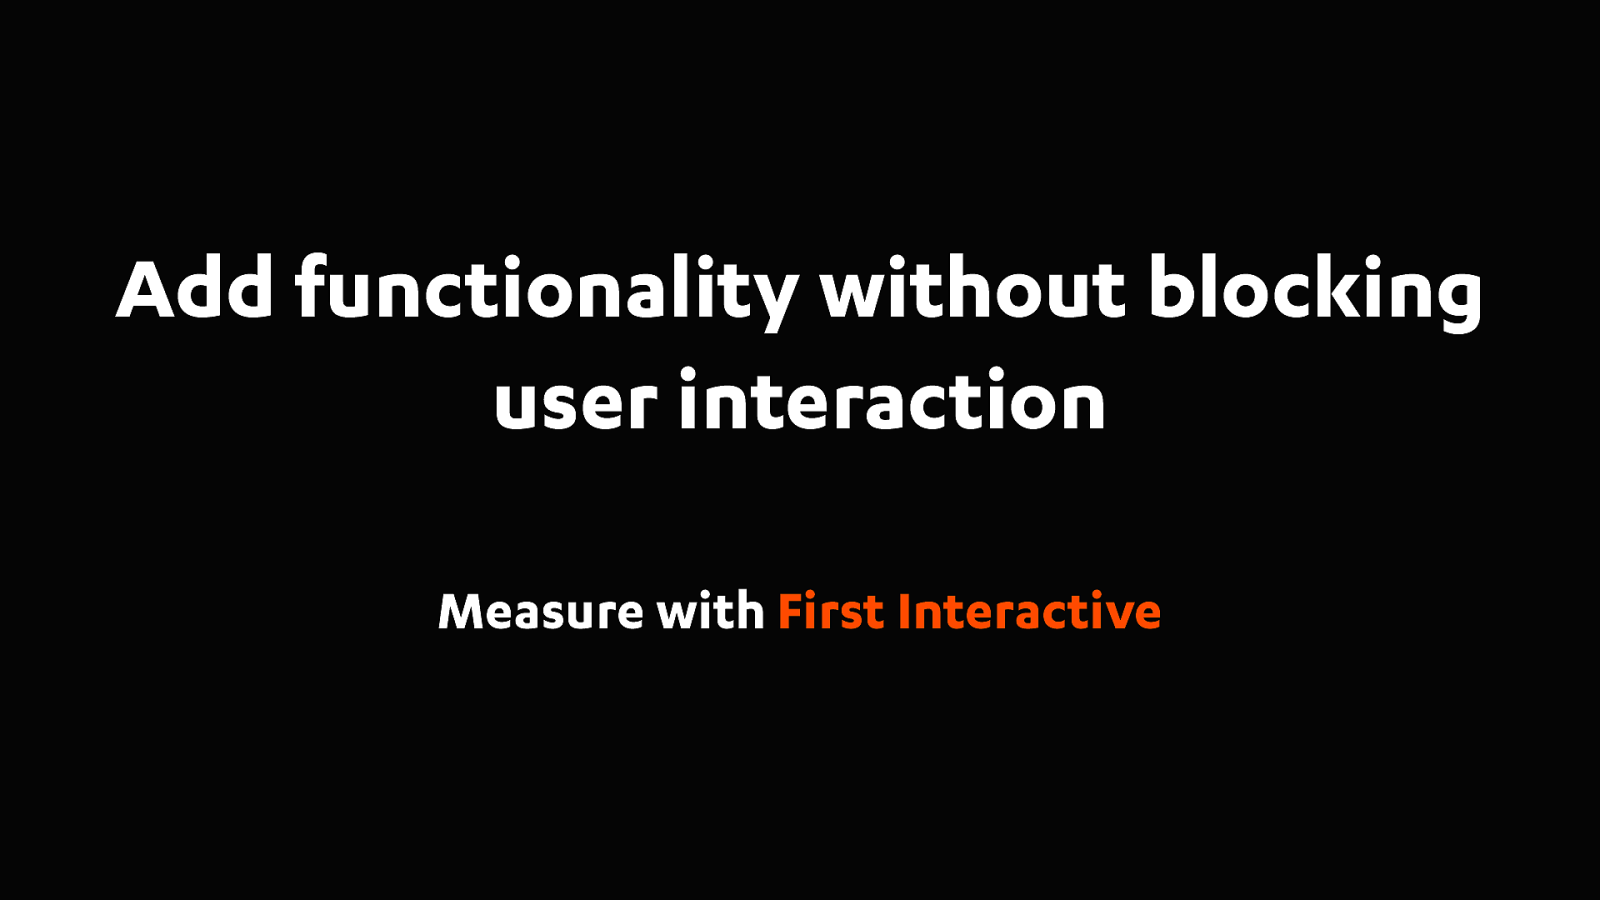
In this example we see how the third party ads are causing JS long tasks over 50ms and that's pushing the First Interactive right out to 10s. You need to audit your third parties and look at their impact on your user experience.


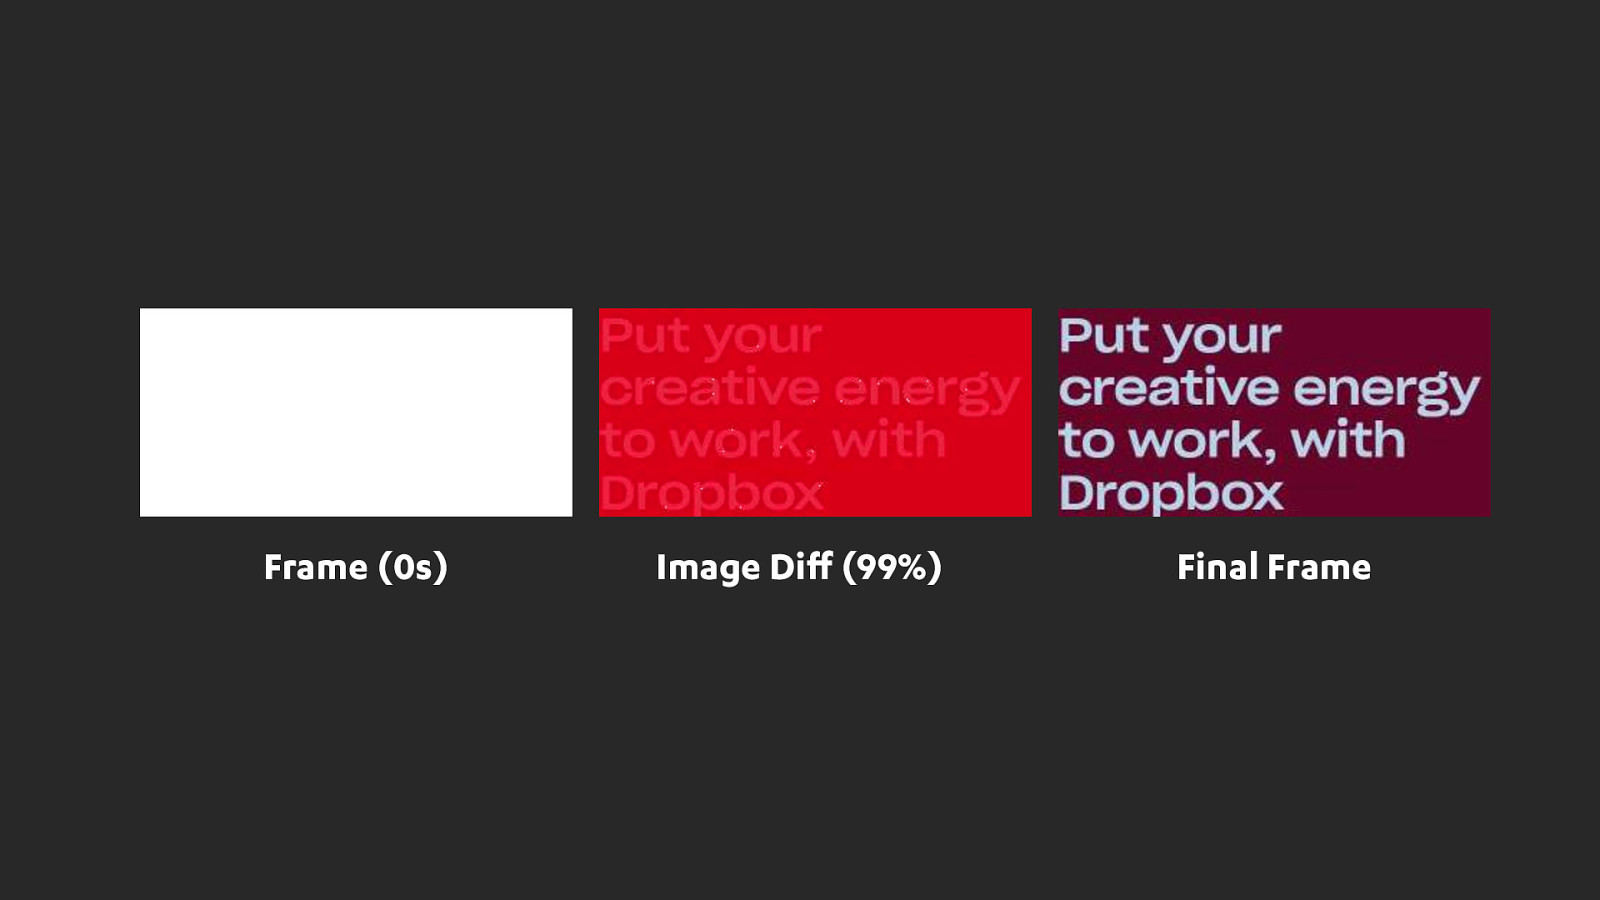
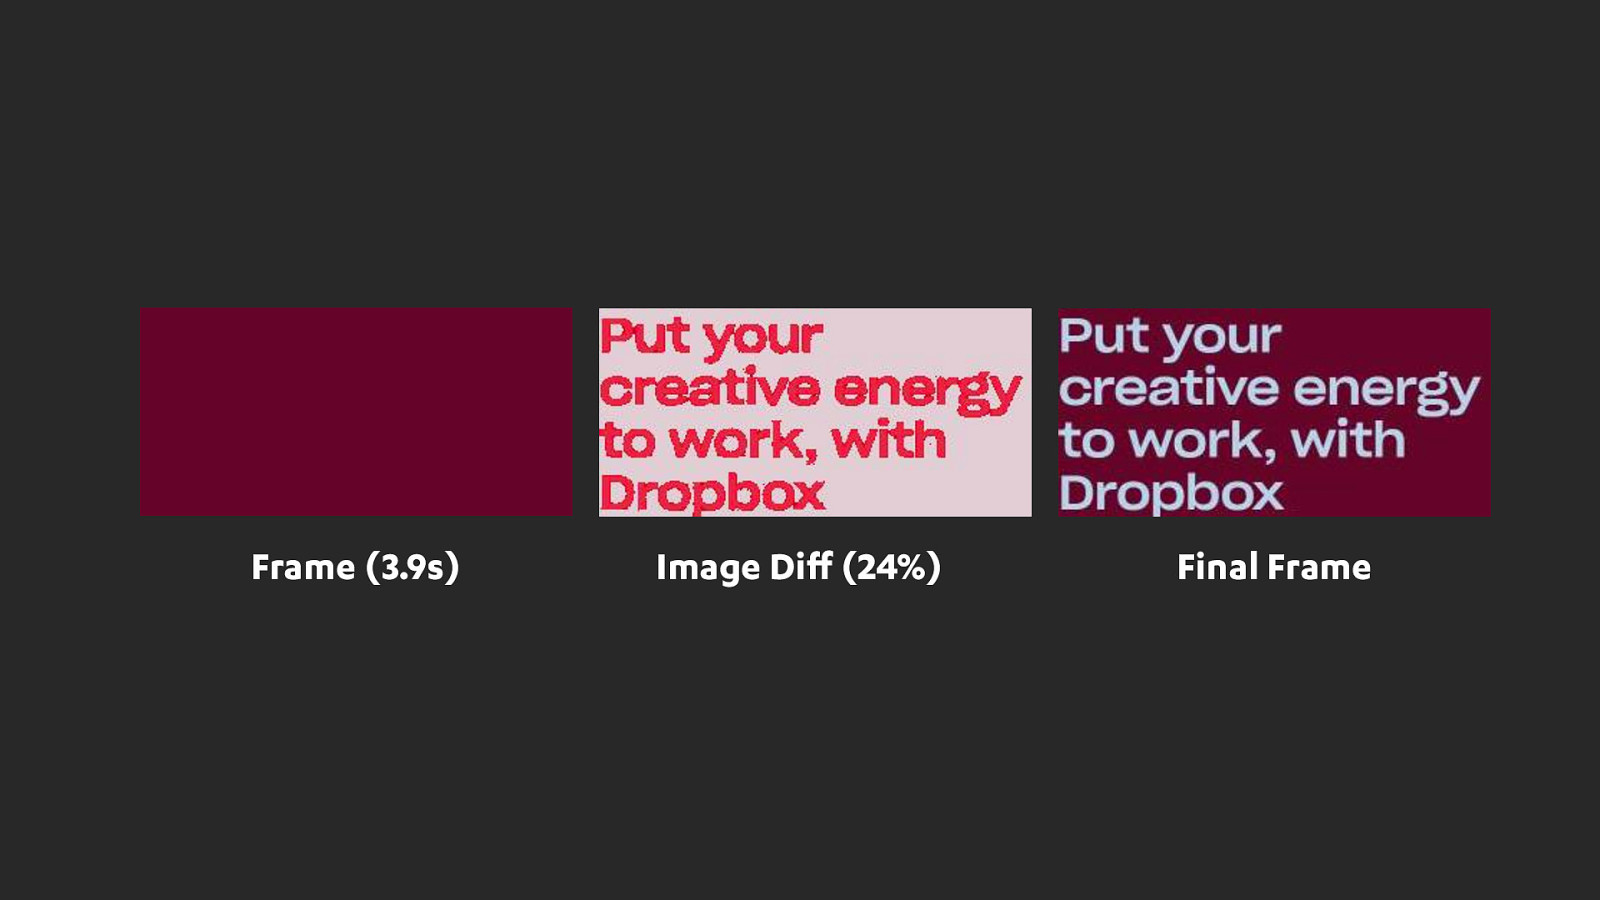
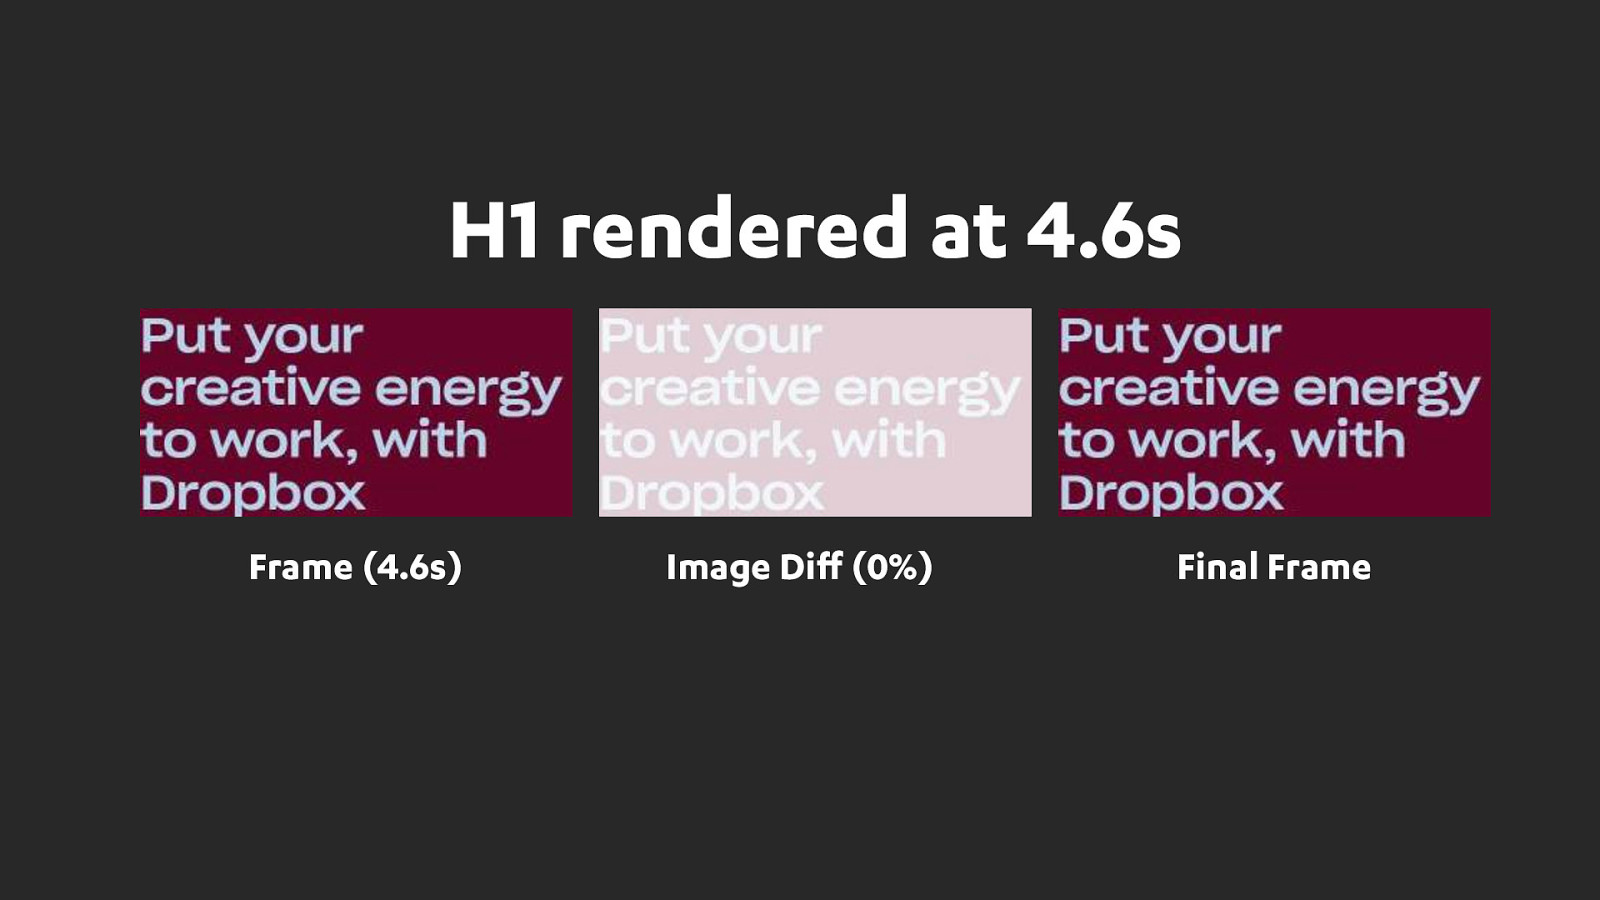
Now for a talk about meaningful metrics it would be odd to not mention some of the recent metrics from the Chrome team like First Meaningful Paint. They sound so promising and yet they didn’t feature highly when we picked metrics based on what we can see in the filmstrip. Why is that?
I think of this as the inside out problem. Chrome only knows about what’s happening inside Chrome. It doesn’t actually know when a pixel was displayed on screen, it only knows when it sent it to the OS. When we matched up the video frames with these events they were often too early and just showed a white screen.

When we dug into this issue we saw a delay of around 100-200ms between the metric and the next paint event in WebPageTest.
This is why I love WebPageTest and the video it captures so much. It’s a neutral observer.
Now these new metrics from Chrome are interesting and it’s worth keeping an eye on the paint timing spec to see how they evolve and how they are implemented by the browser vendors. I was really disappointed to see that First Meaningful Paint is not in the spec. These metrics could be really useful in RUM, where we are not capturing a filmstrip for every user.
So to review what we’ve learnt so far from our users. I think it is best summed up by Steve Souders…

This is why we saw last painted hero perform the best when comparing the metrics to user experience. As it focused on the hero elements just like our users do!
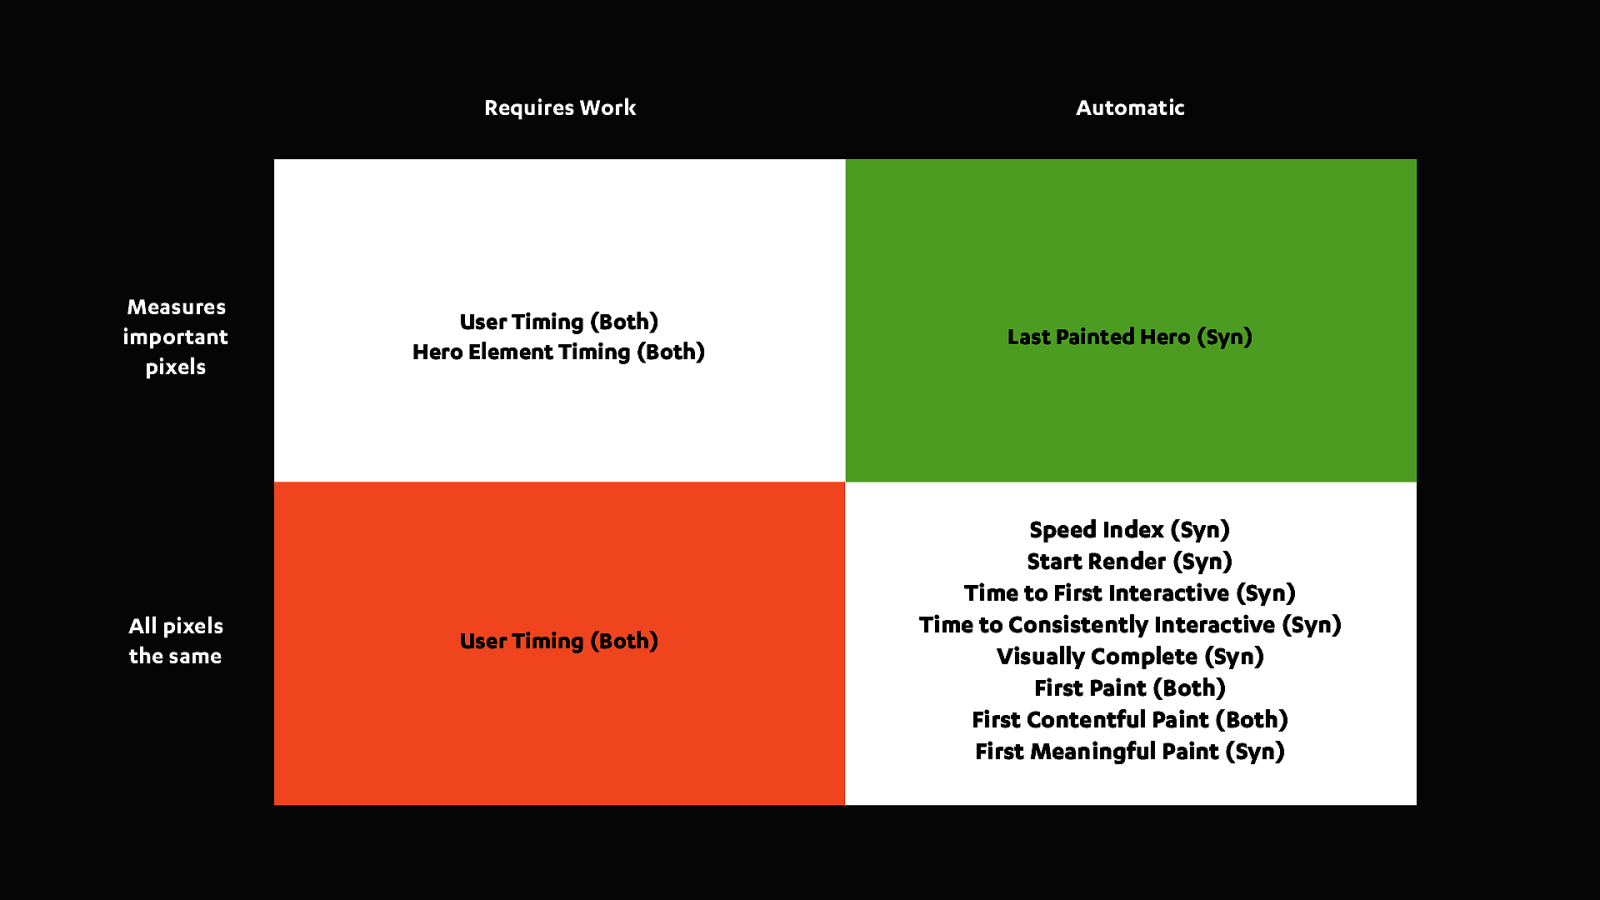
Now there are also things that we as developers need out of our metrics, so lets add a few more things that our metrics need to answer…
As articulated by Steve this is a way of filtering out the metrics that don’t prioritise the content we care about.
We also want to know how hard it is to get up and running. People are lazy, if we can get a metric out of the box without any work then those are the metrics we lean towards.
Do I get it automatically or do I have to do a whole lot of work to implement it.
Does this metric represent real life, what my users actually experience or is it a metric that just comes out of the synthetic lab. And do I have a way to relate the metrics I see in the wild with what I see in the lab.

"Time to first tweet" is a great example of a User Timing metric that gives meaning to the metric that the whole organisation can recognise and work together to improve.

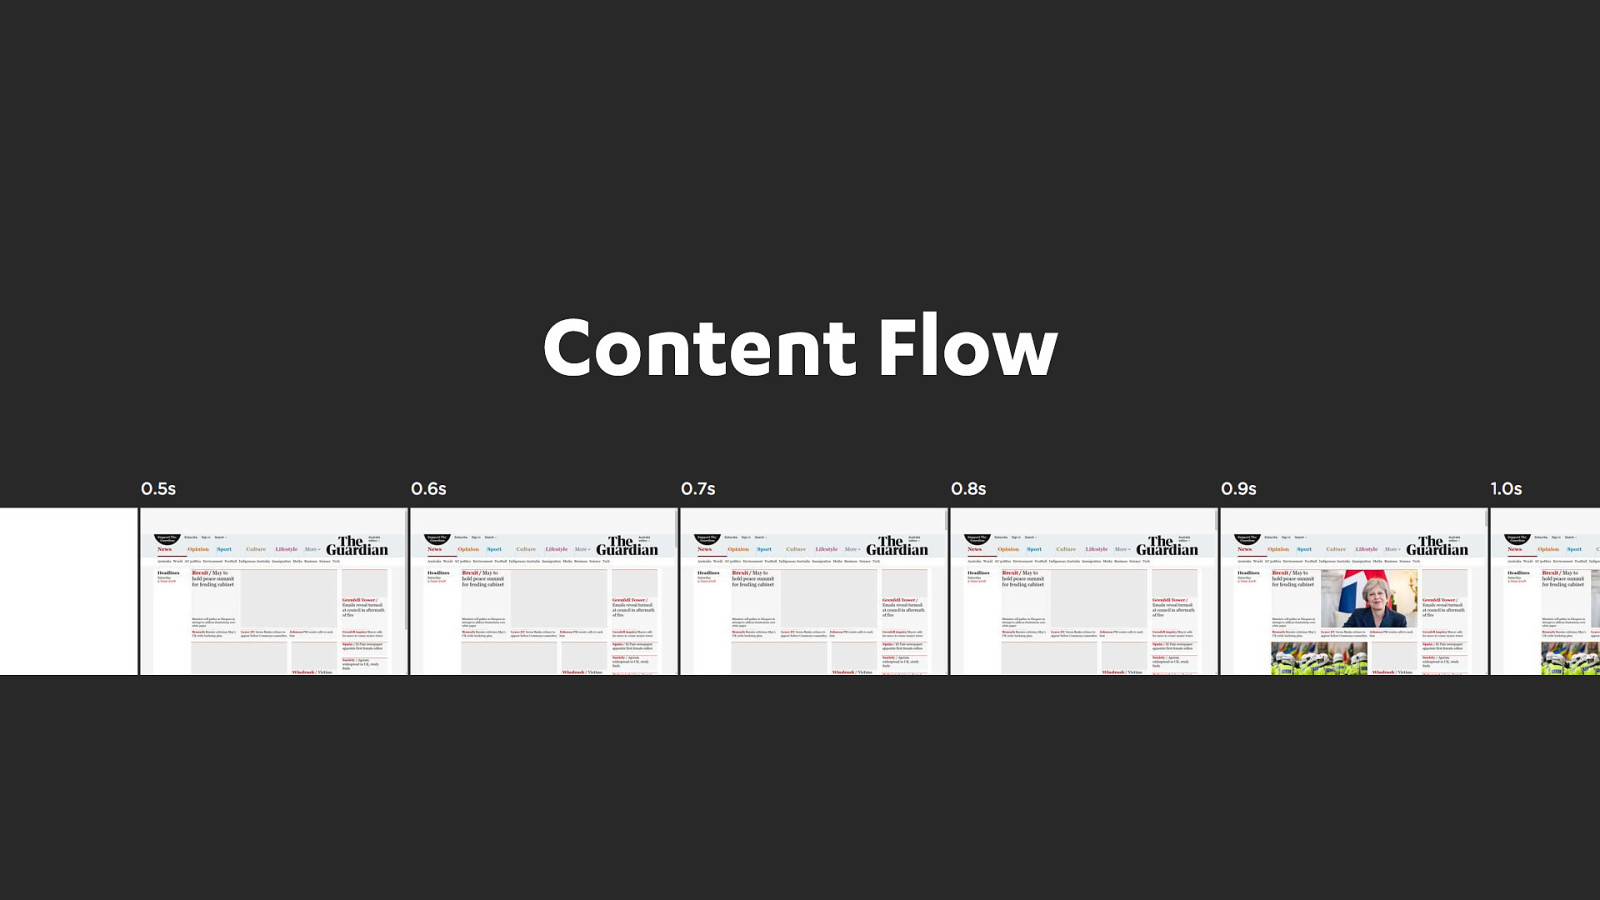
An important concept to get our head around before we start looking at specific optimisations. We want to think of our pages as a time based experience rather than a static page. Keep those filmstrips in mind. How do we flow the content of the page in and out of the browser over time?
I think we still have some deep challenges between the design and development teams in most organisations. To often the design and marketing teams run away and cook up some really rich designs and then chuck them over the fence to development who do their best to make them fast. The mental model here is that they are just trying to create the final static design as fast as possible and not think out how we flow the content into the browser. It's a time based medium and if you force people to wait then you've lost them!
Let’s start at the beginning.
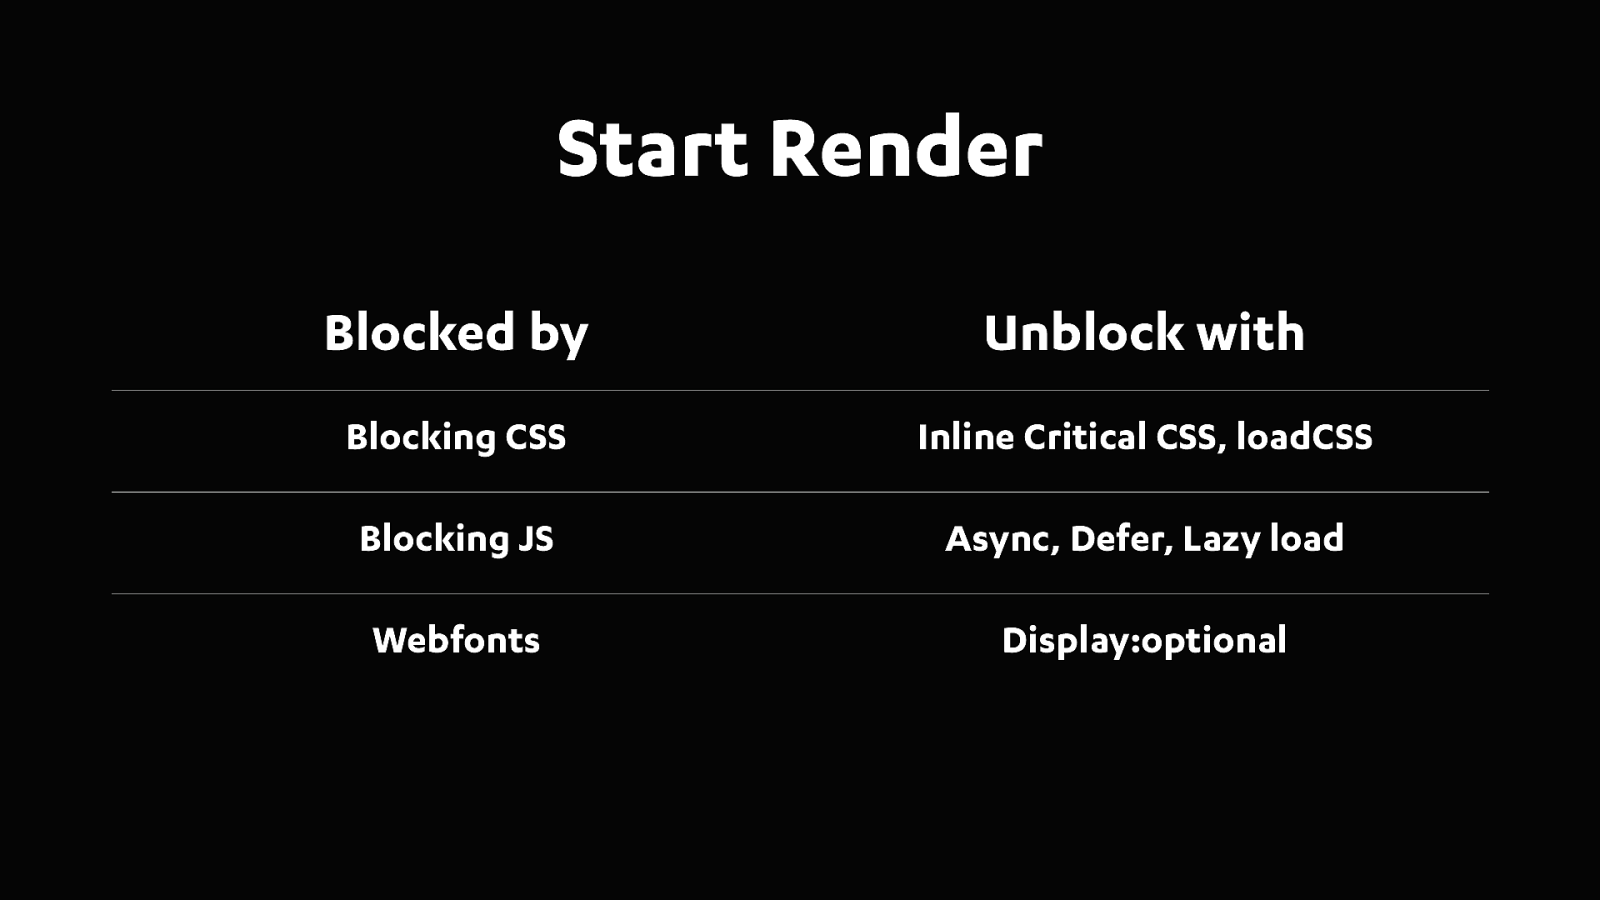
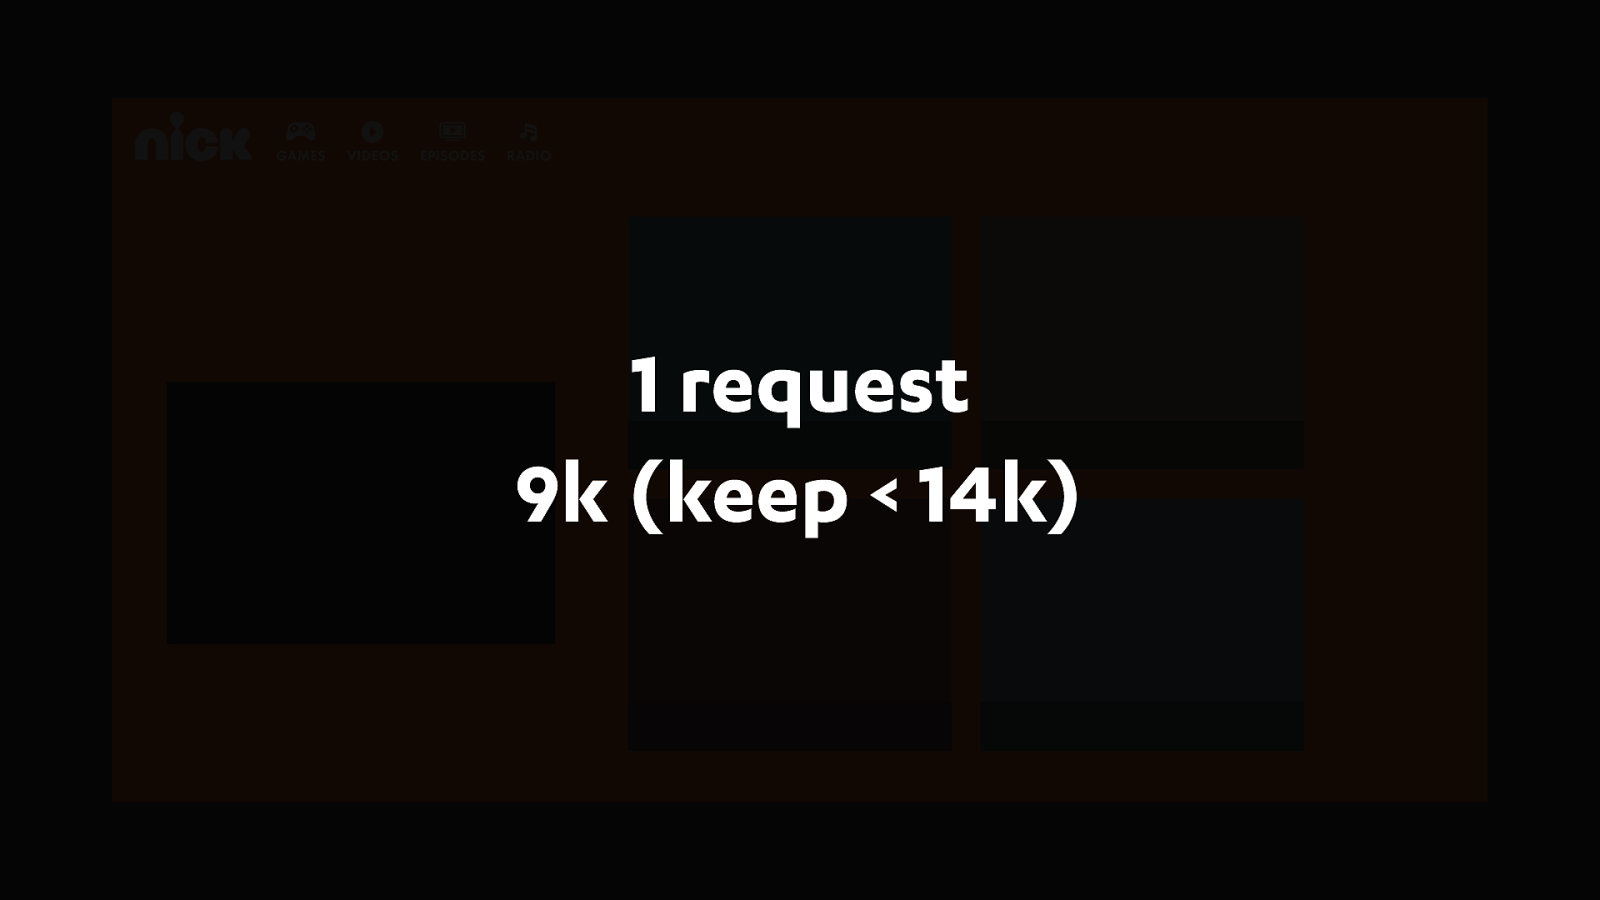
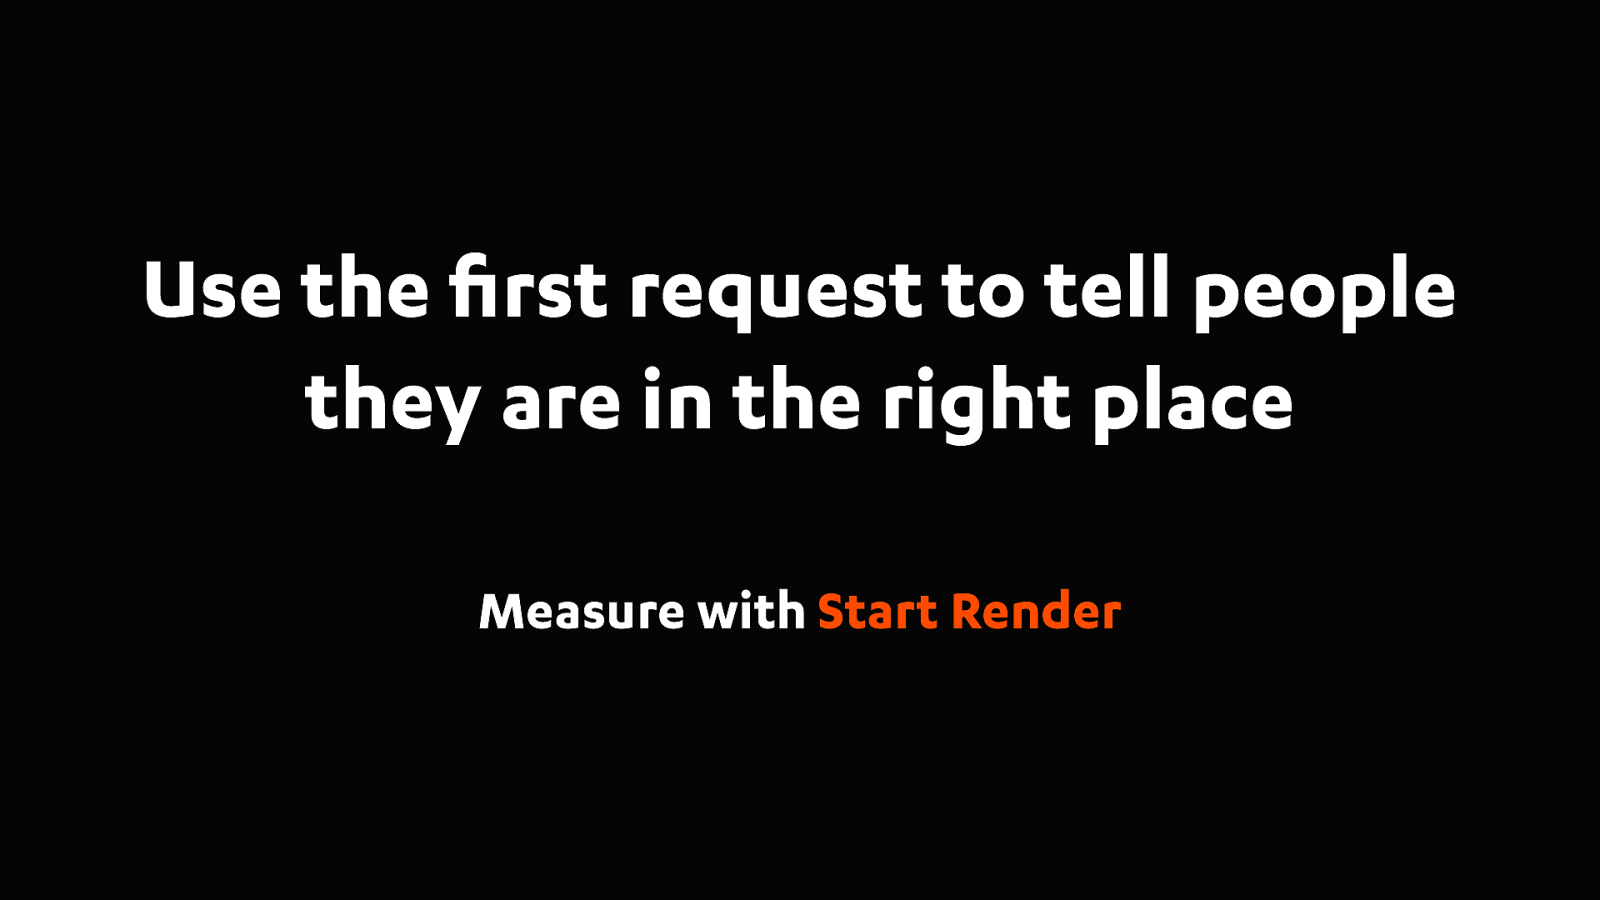
Ilya Grigorik did a great presentation on what it takes to render a webpage in under one second. You really only have one request and it should be under 14k.
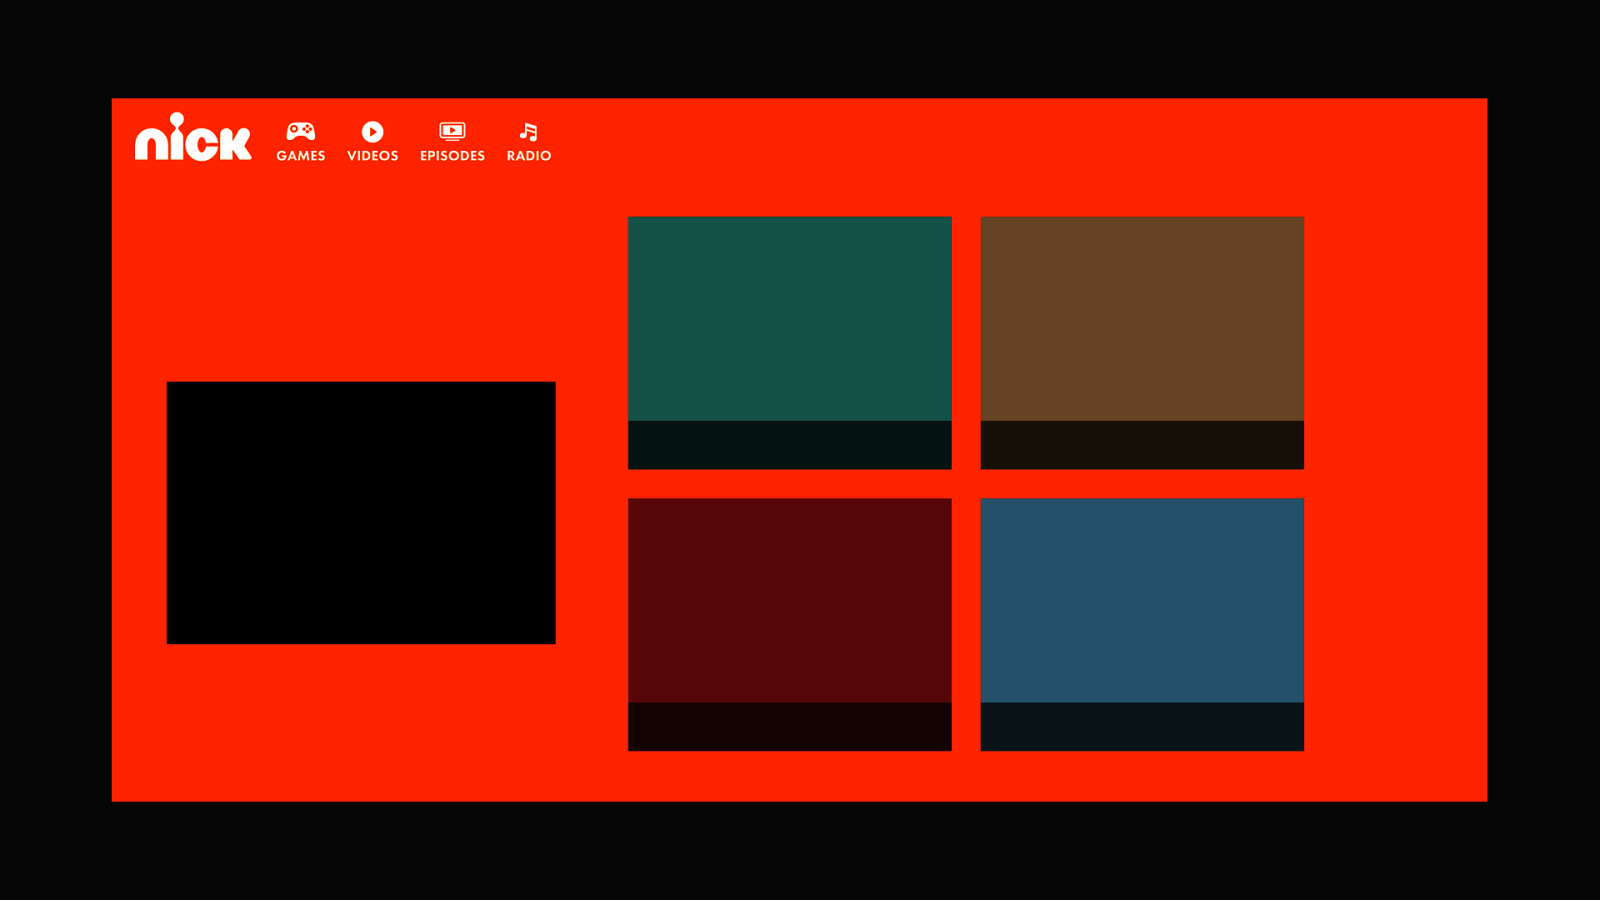
14k doesn't sound like much, but that's more than enough to tell a user they are in the right place. Give them the brand colour, a logo and the skeleton of the page. Reassure them they are in the right place.
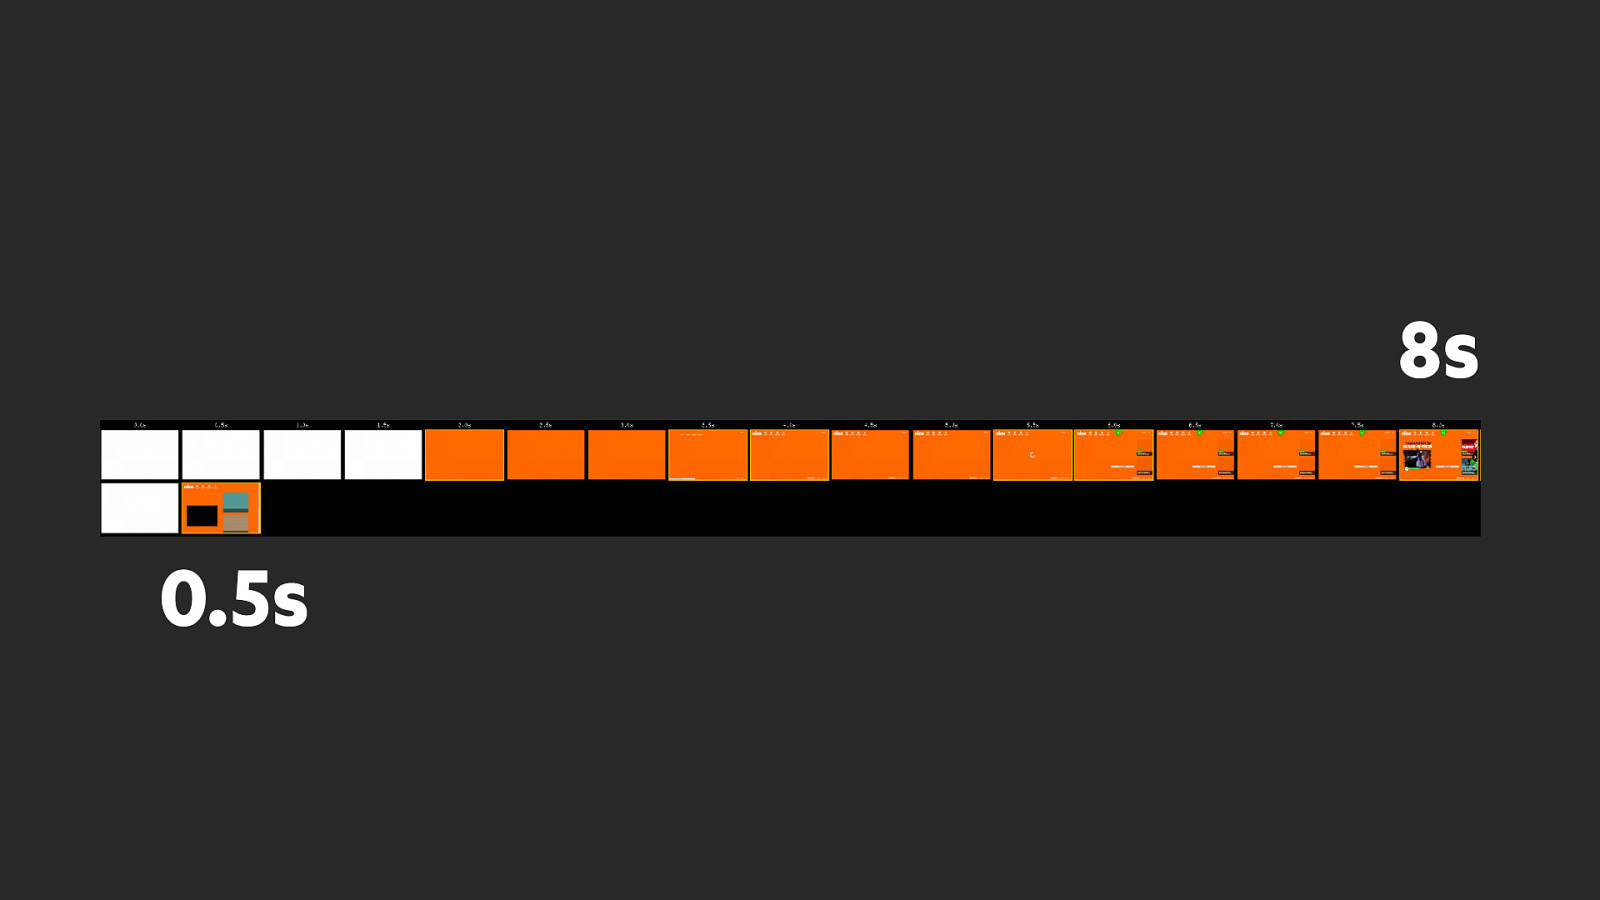
There's no reason while all our sites should be rendering some content for users in under half a second. Just unblock your JS & CSS and then inline the critical CSS. Boom!

And most importantly, never forget that we’re all working in service of our users. We want to use these metrics to get as close as possible to the experience people are having. It it fast or slow?
Lets hope that while we are adding more content and functionality to our website we’re also making them faster and more joyous to use.

And you can also find all the content I've been talking today and much more on the SpeedCurve blog.