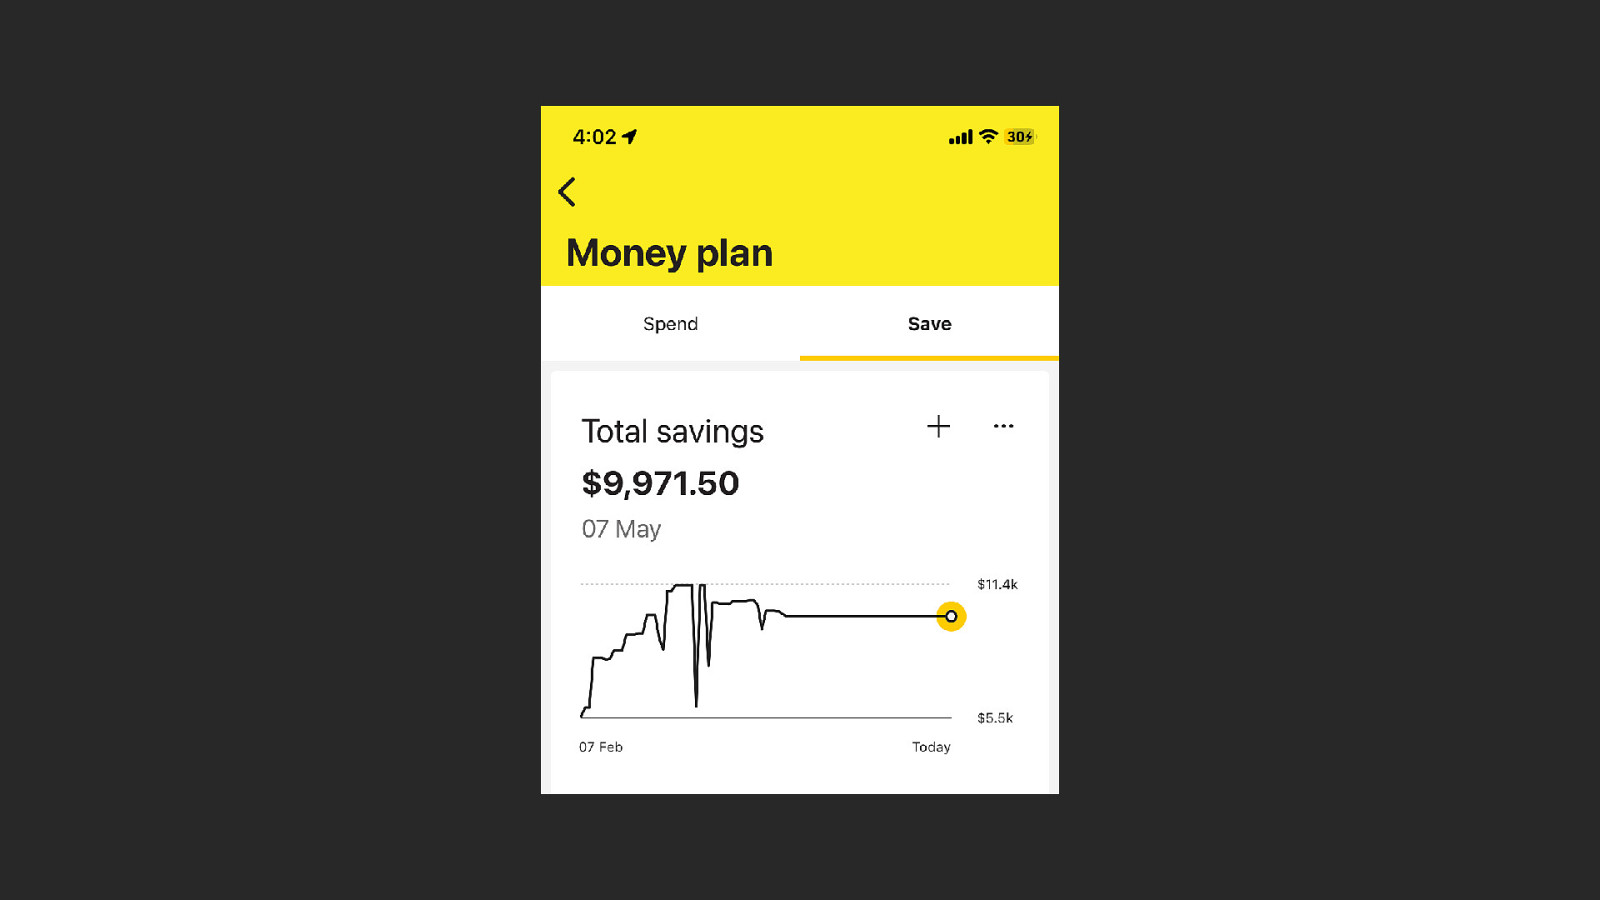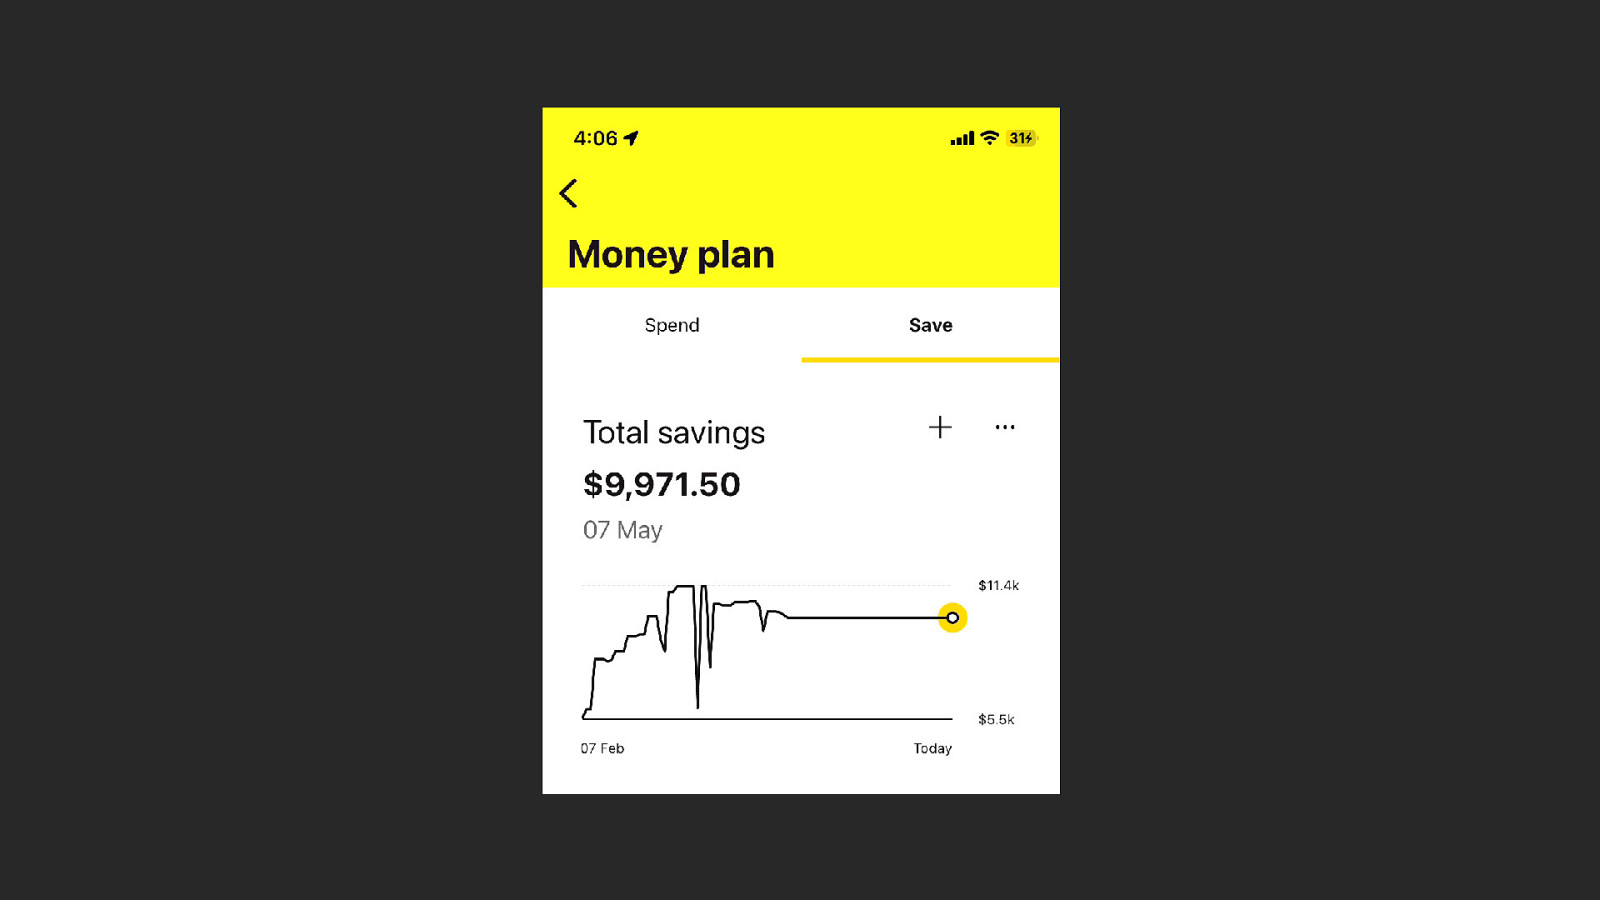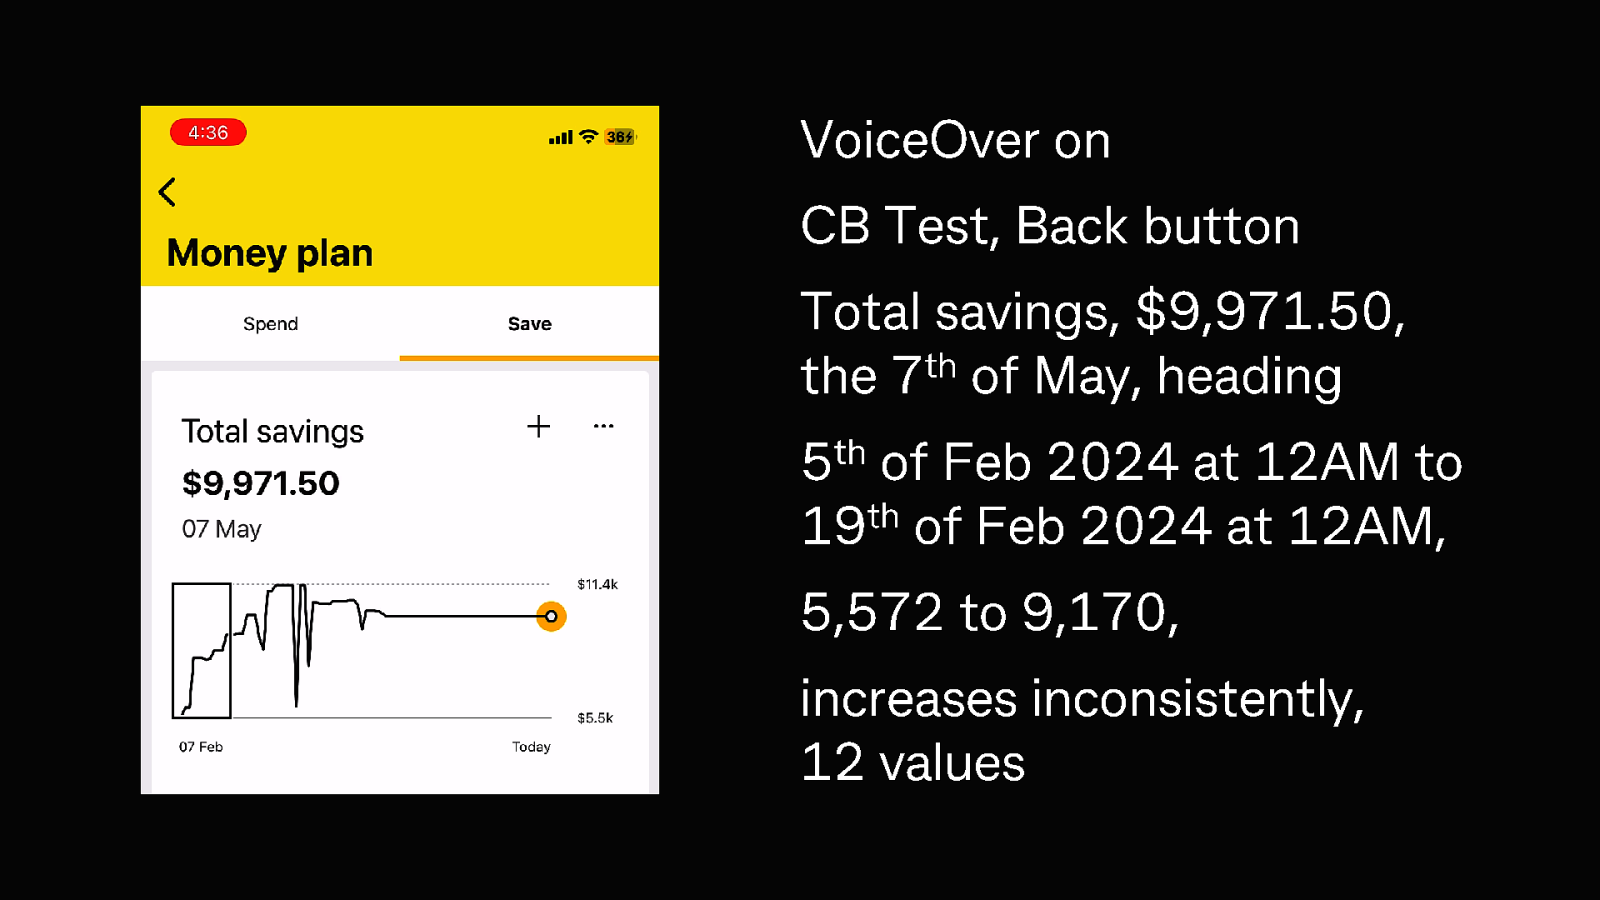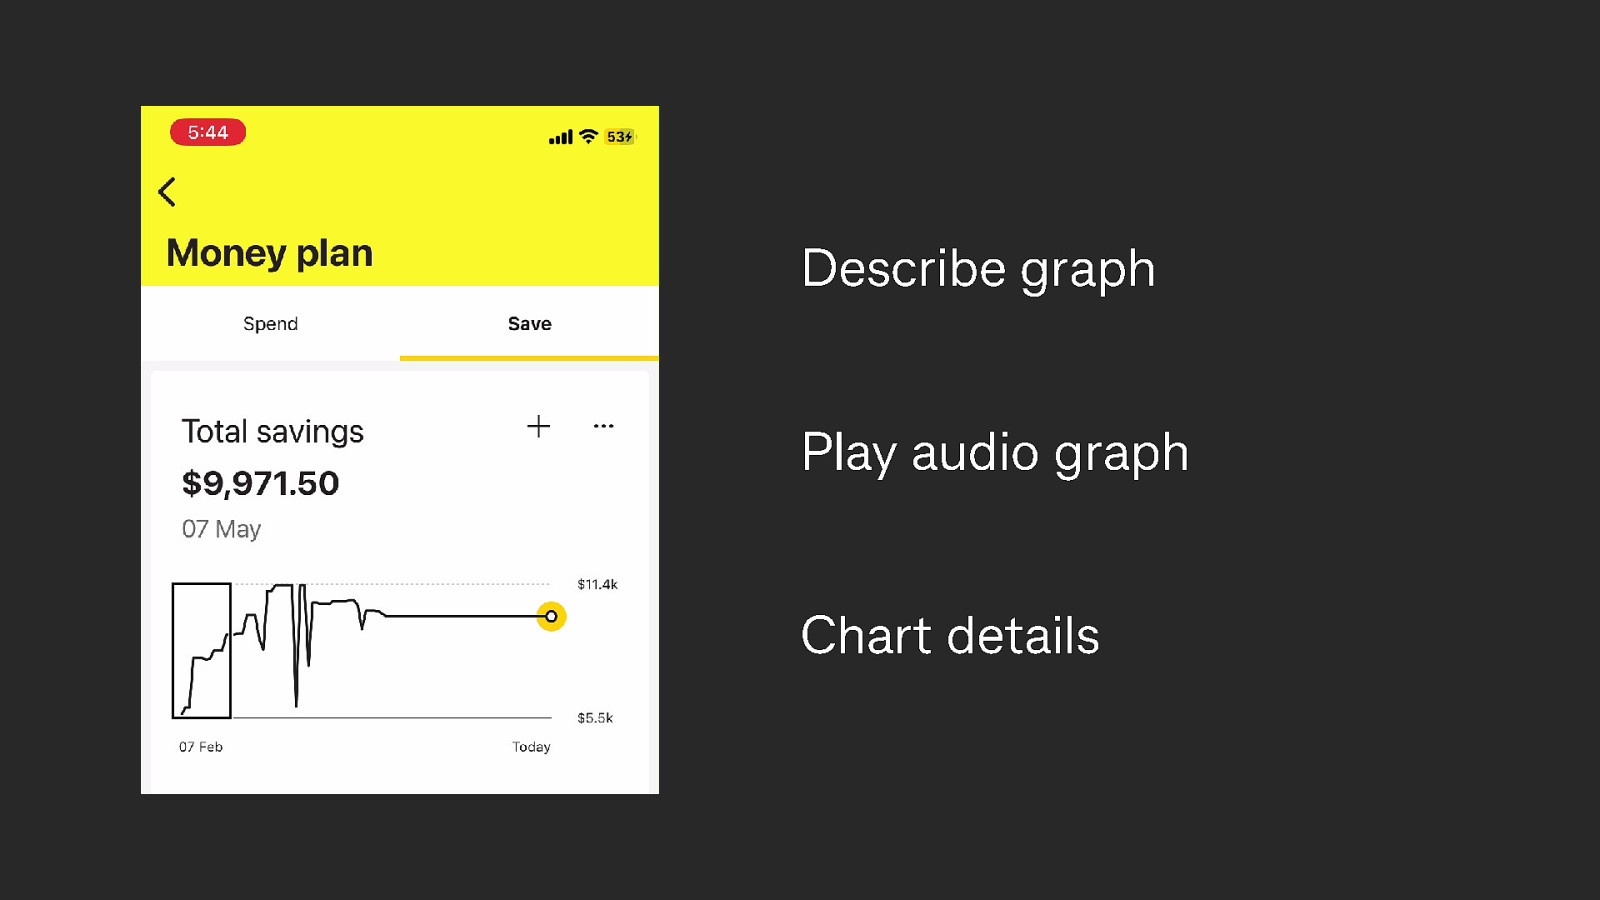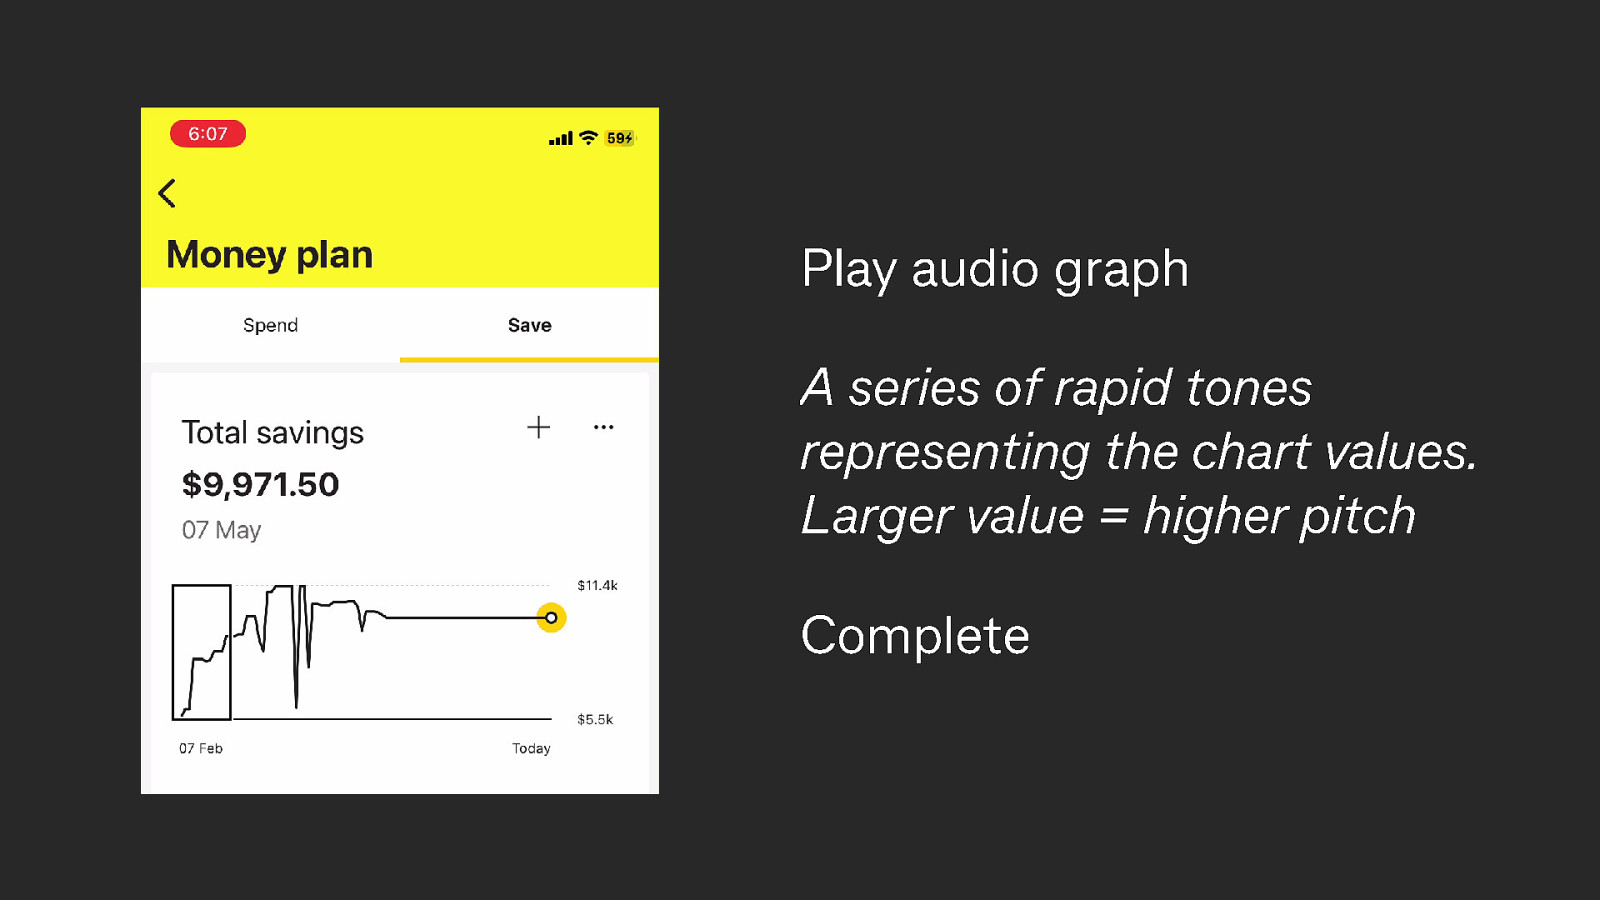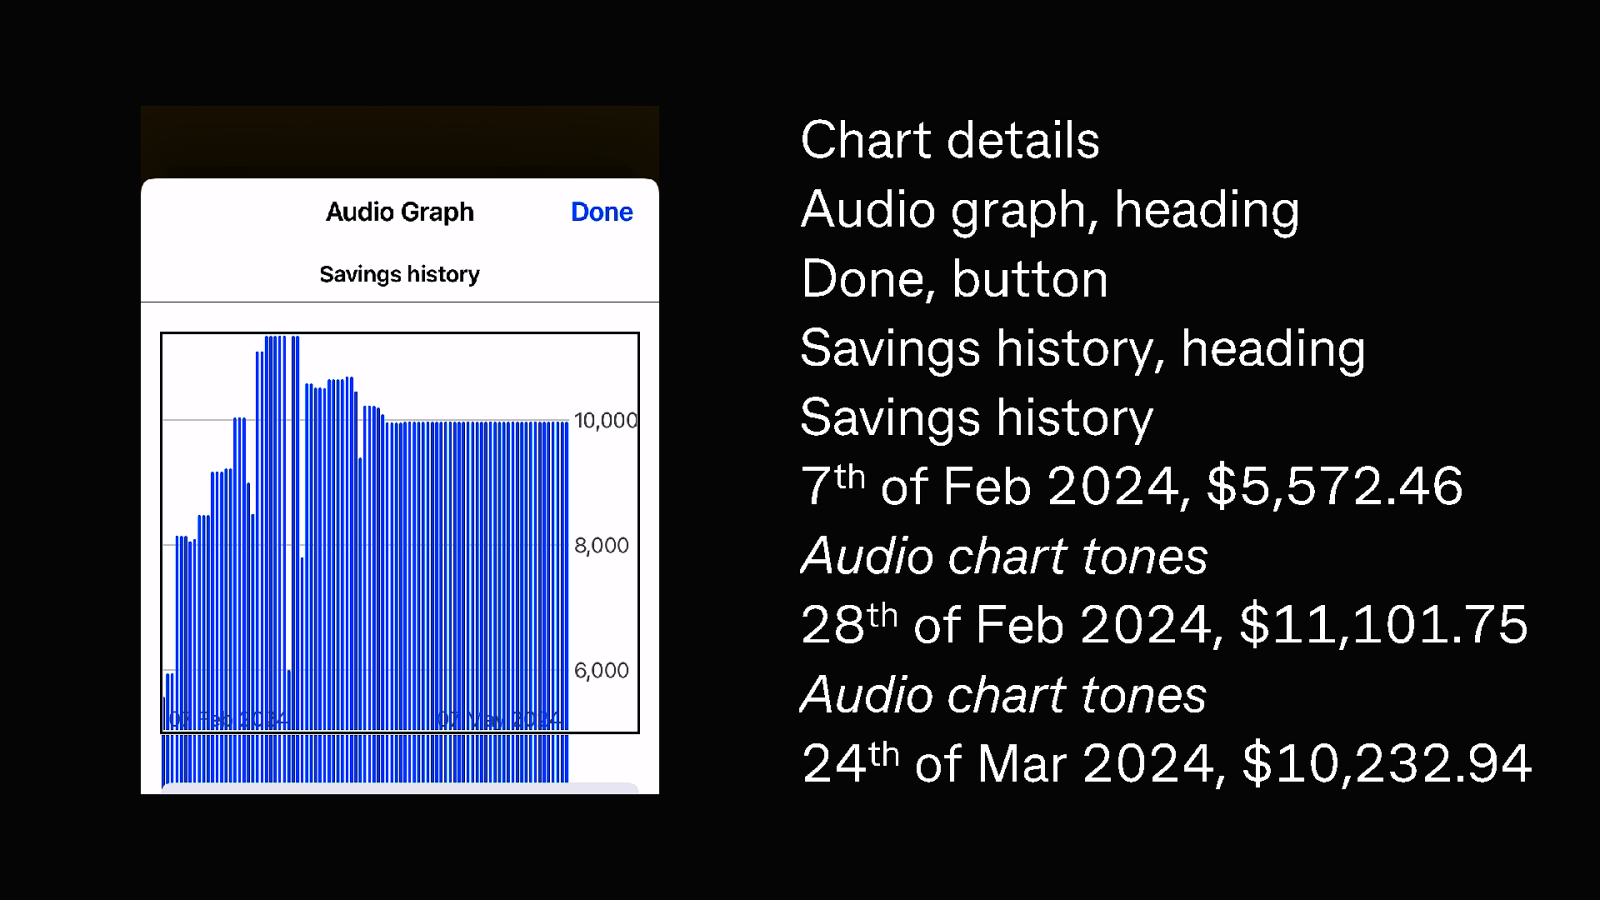
The VoiceOver experience of an interactive graph in a mobile app
There is a lot of audio in this presentation, it’s a lot more meaningful to watch the video recording if you can. I’ve added the YouTube recording to the Video section. Below I’ve briefly described the videos I presented in each slide.