
A presentation at DeltaV Conference in in London, UK by Andy Davies

Fast Fashion… How Missguided revolutionised their approach to site performance Mark Leach, Missguided Andy Davies, Eggplant DeltaV Conf, May 2018
Mark Leach Missguided @AndyDavies Eggplant
In the beginning…
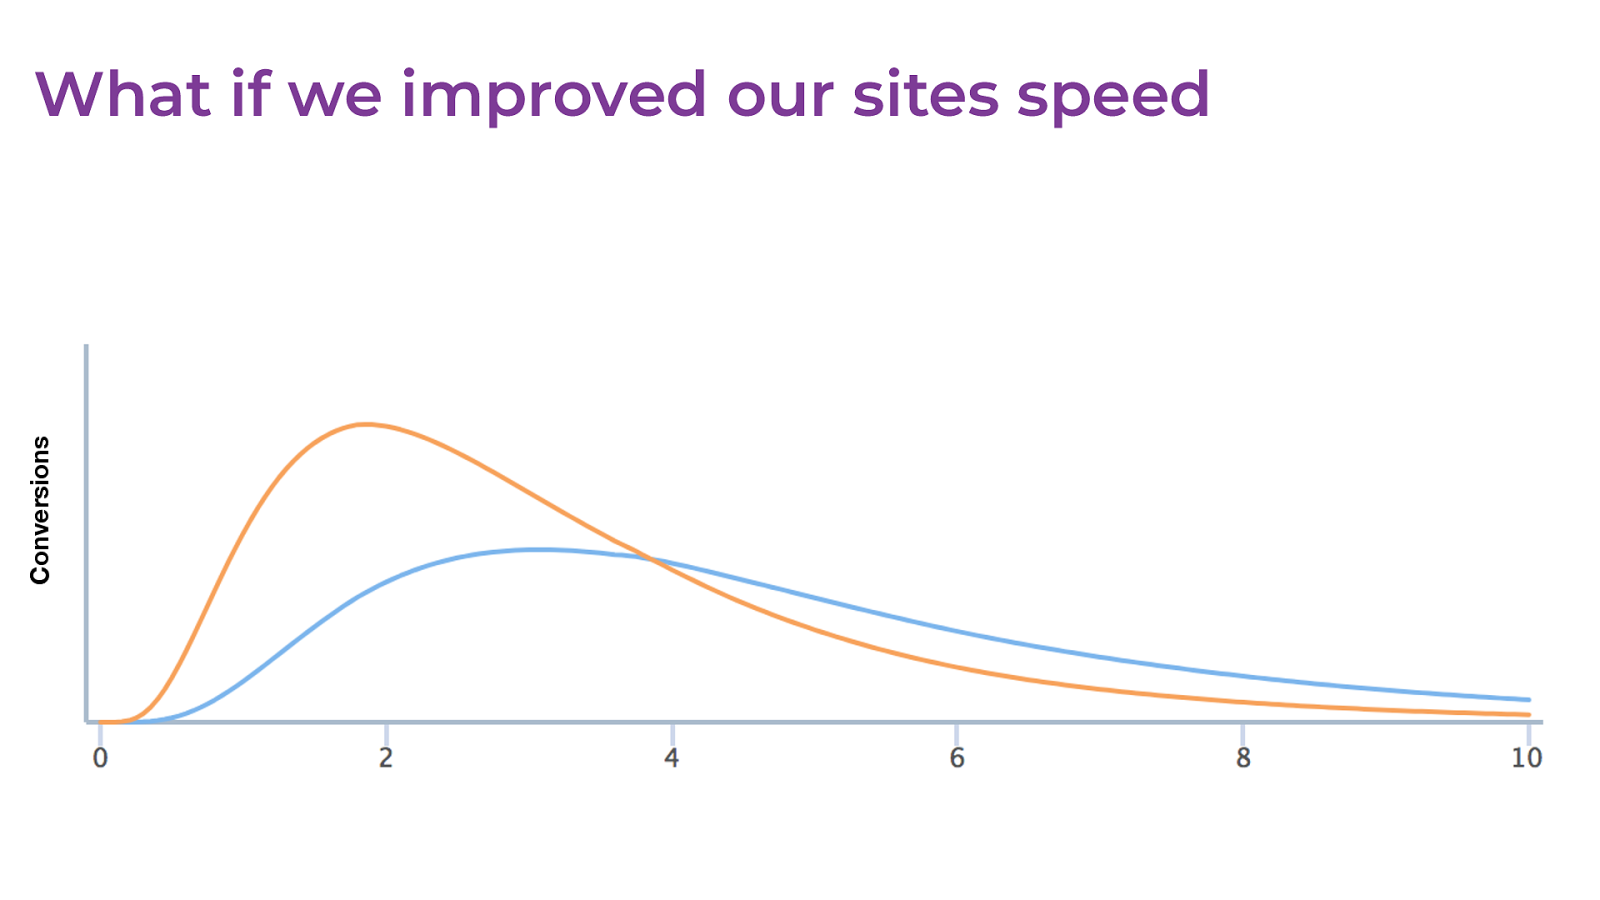
Conversions What if we improved our sites speed
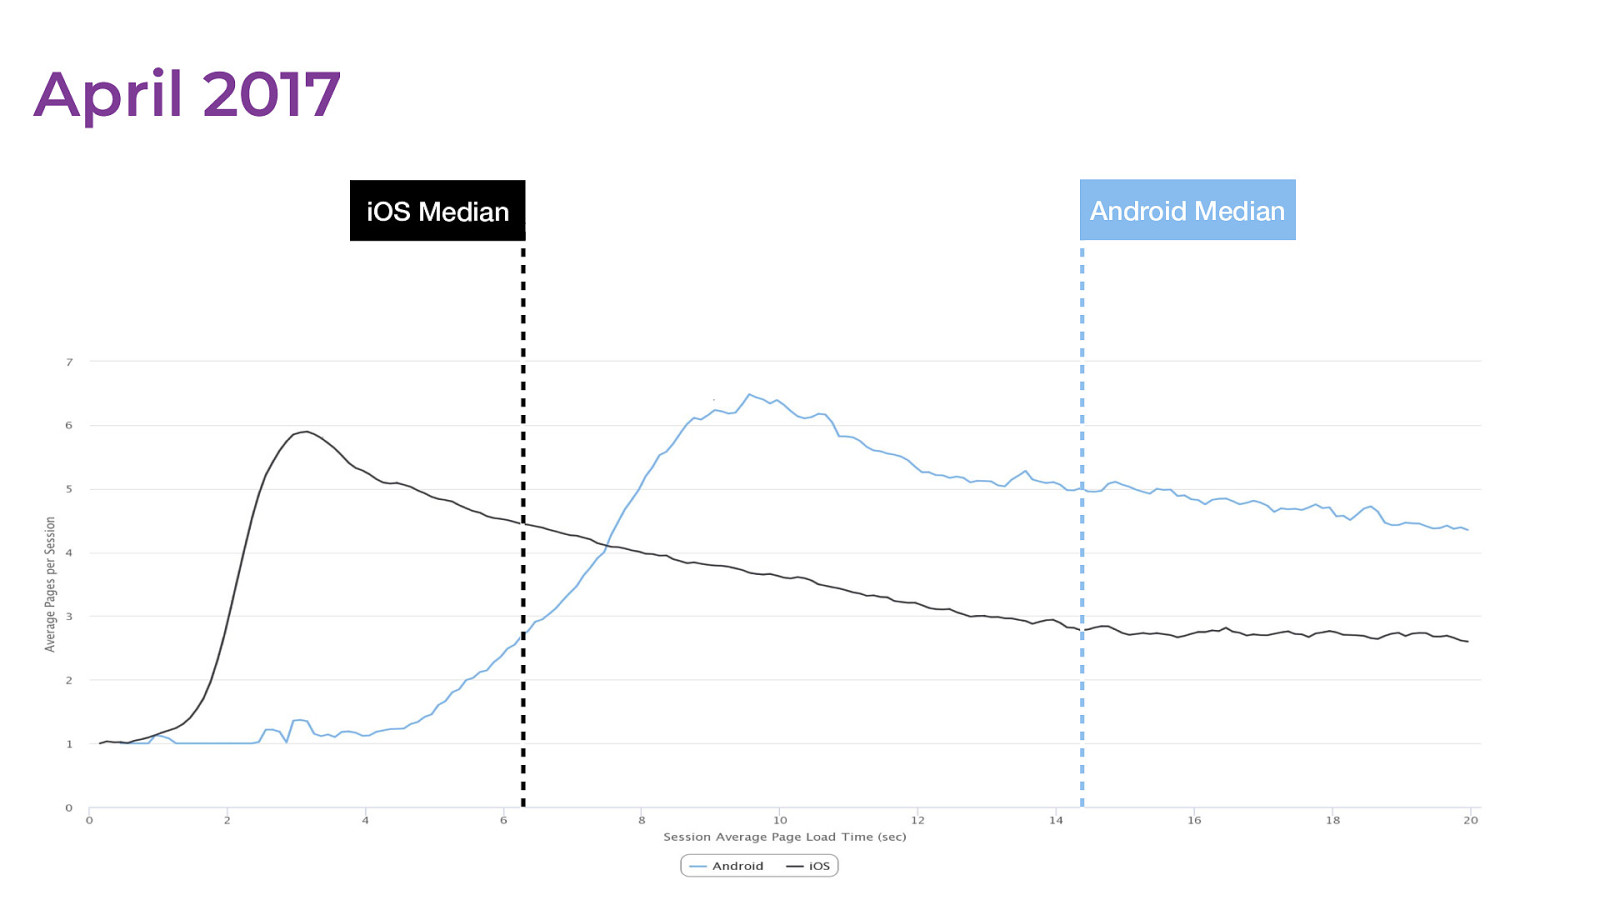
April 2017 Android Median iOS Median
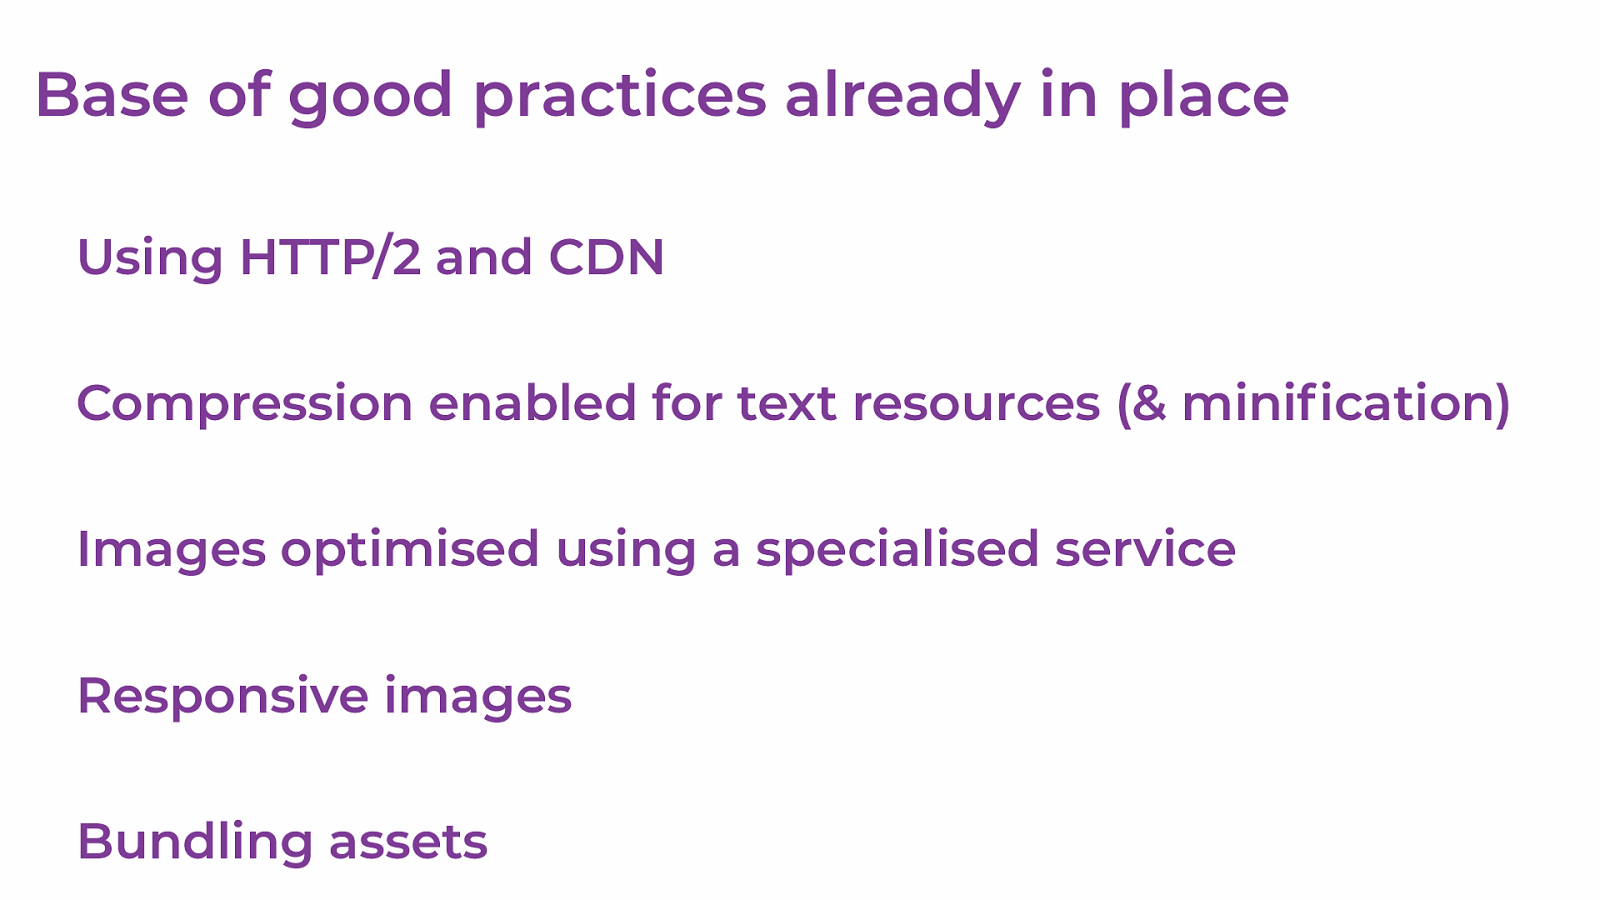
Base of good practices already in place Using HTTP/2 and CDN Compression enabled for text resources (& minification) Images optimised using a specialised service Responsive images Bundling assets
The early fixes
< link
" preload "
" https://static.missguided.co.uk/skin/ frontend/mgresponsive/default/fonts/missguided/missguided-bold.woff2 "
" font "
" font/woff2 "
crossorigin
< link
" preload "
" https://static.missguided.co.uk/skin/ frontend/mgresponsive/default/fonts/missguided/missguided- light.woff2 "
" font "
" font/woff2 "
crossorigin
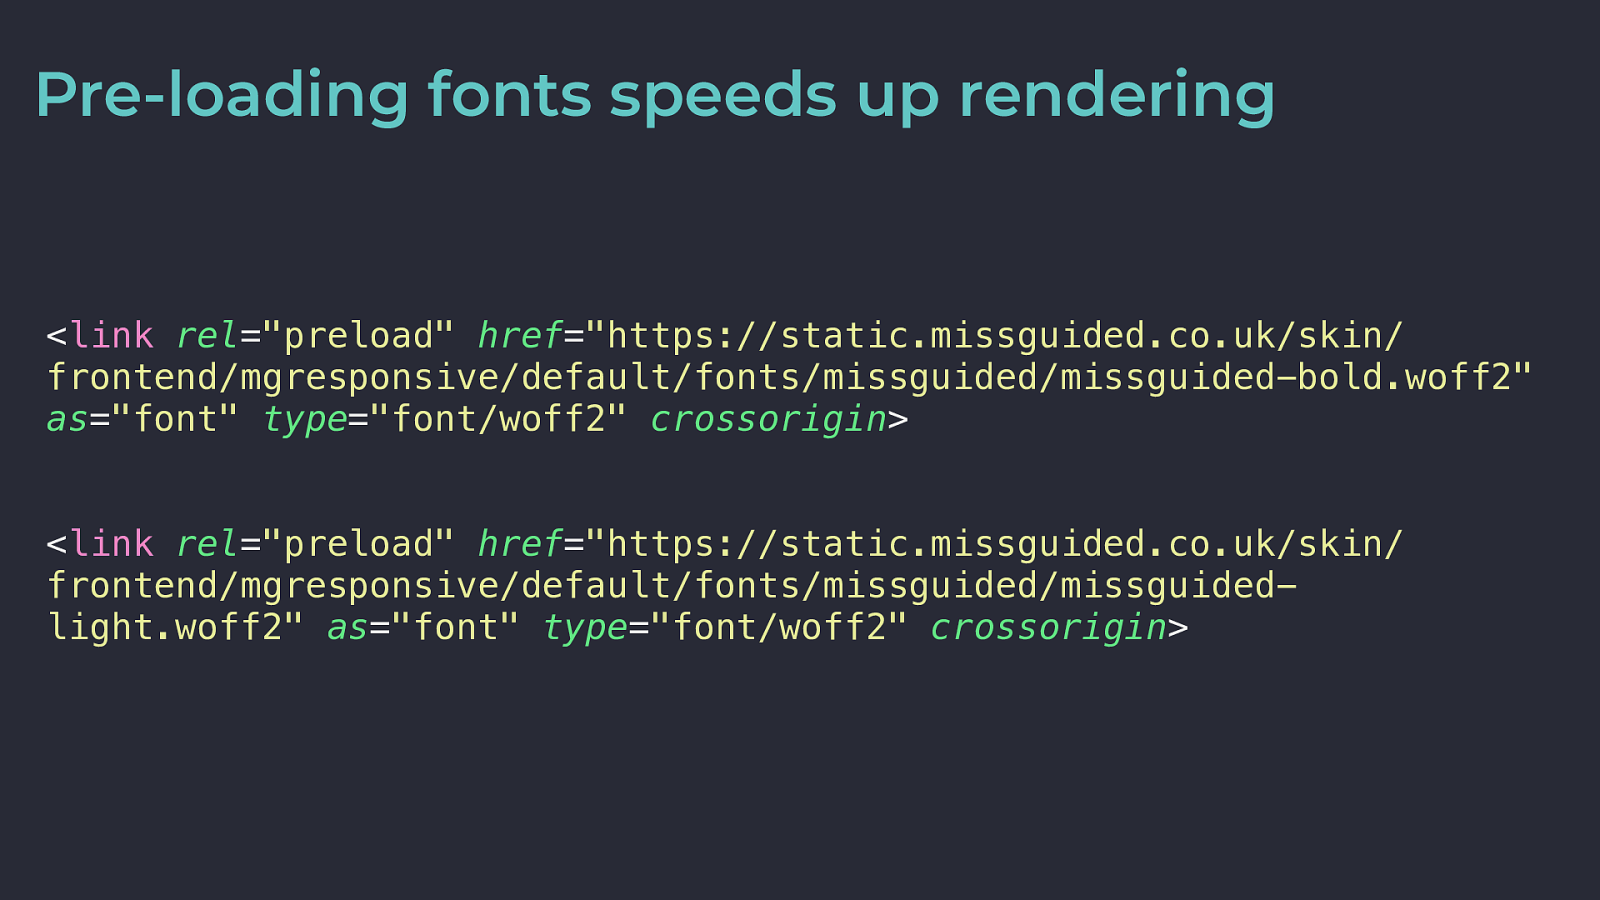
Pre-loading fonts speeds up rendering
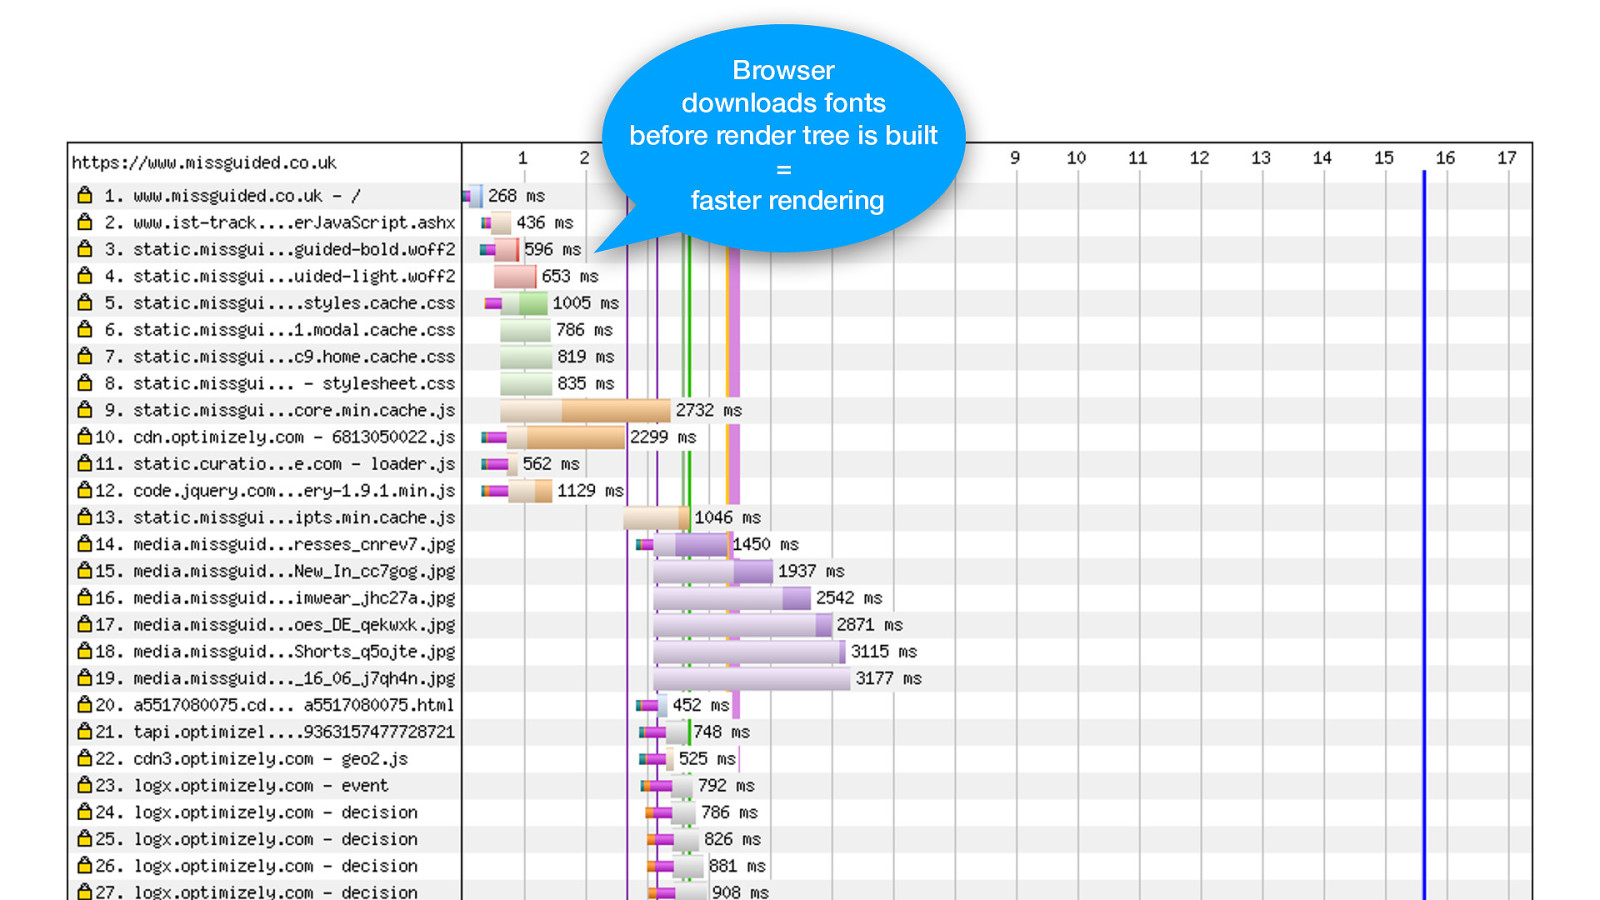
faster rendering
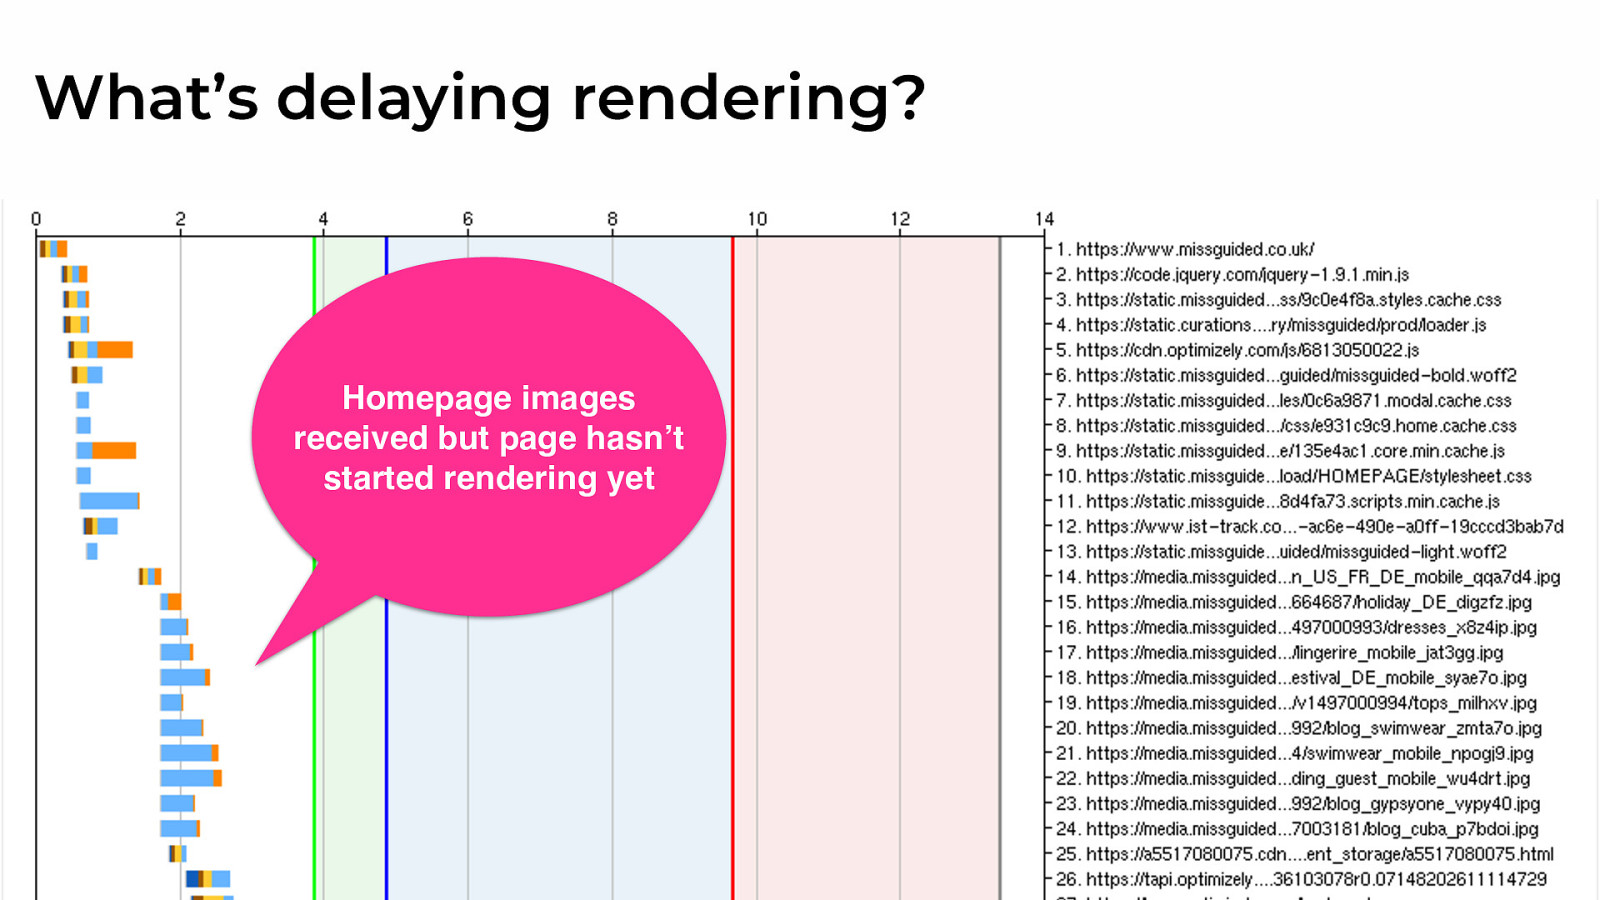
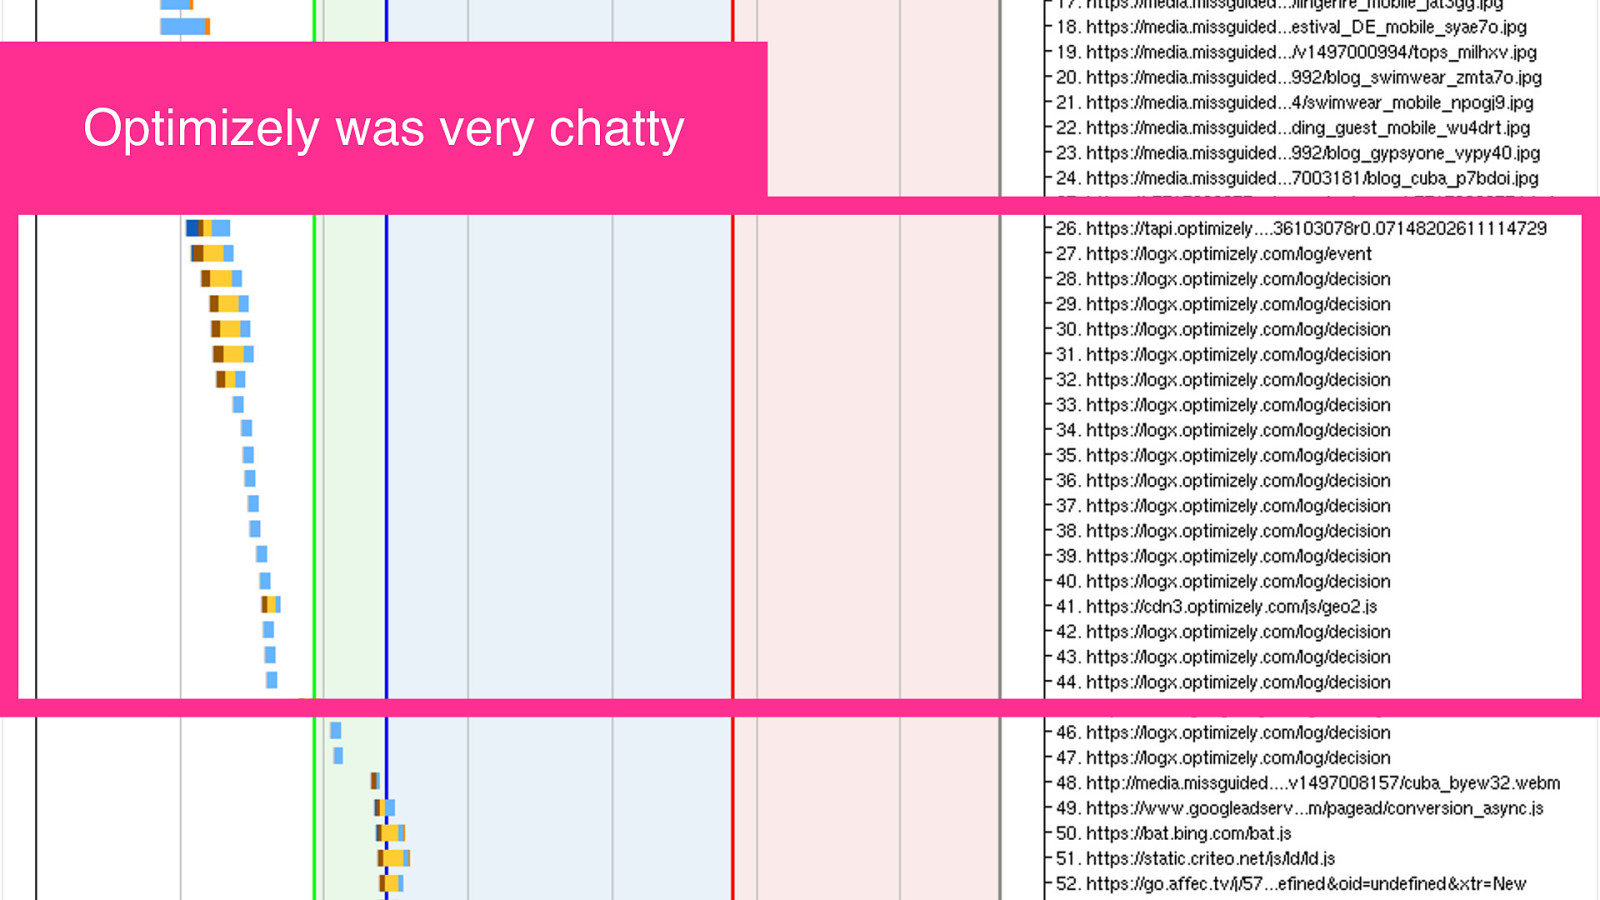
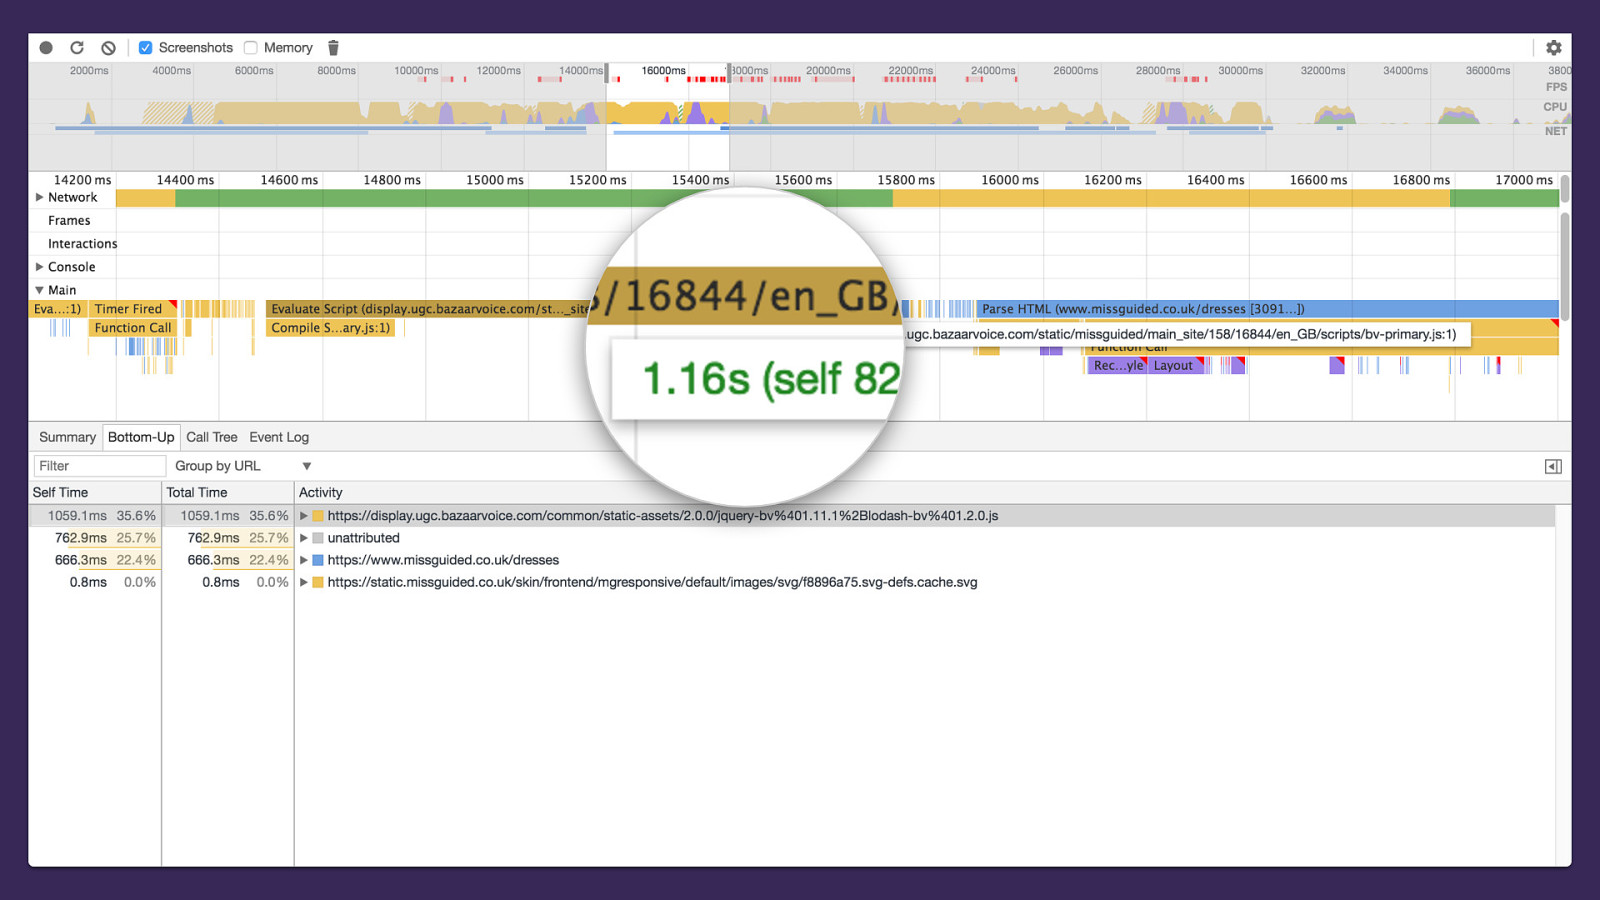
Homepage images received but page hasn’t started rendering yet What’s delaying rendering?
Optimizely was very chatty
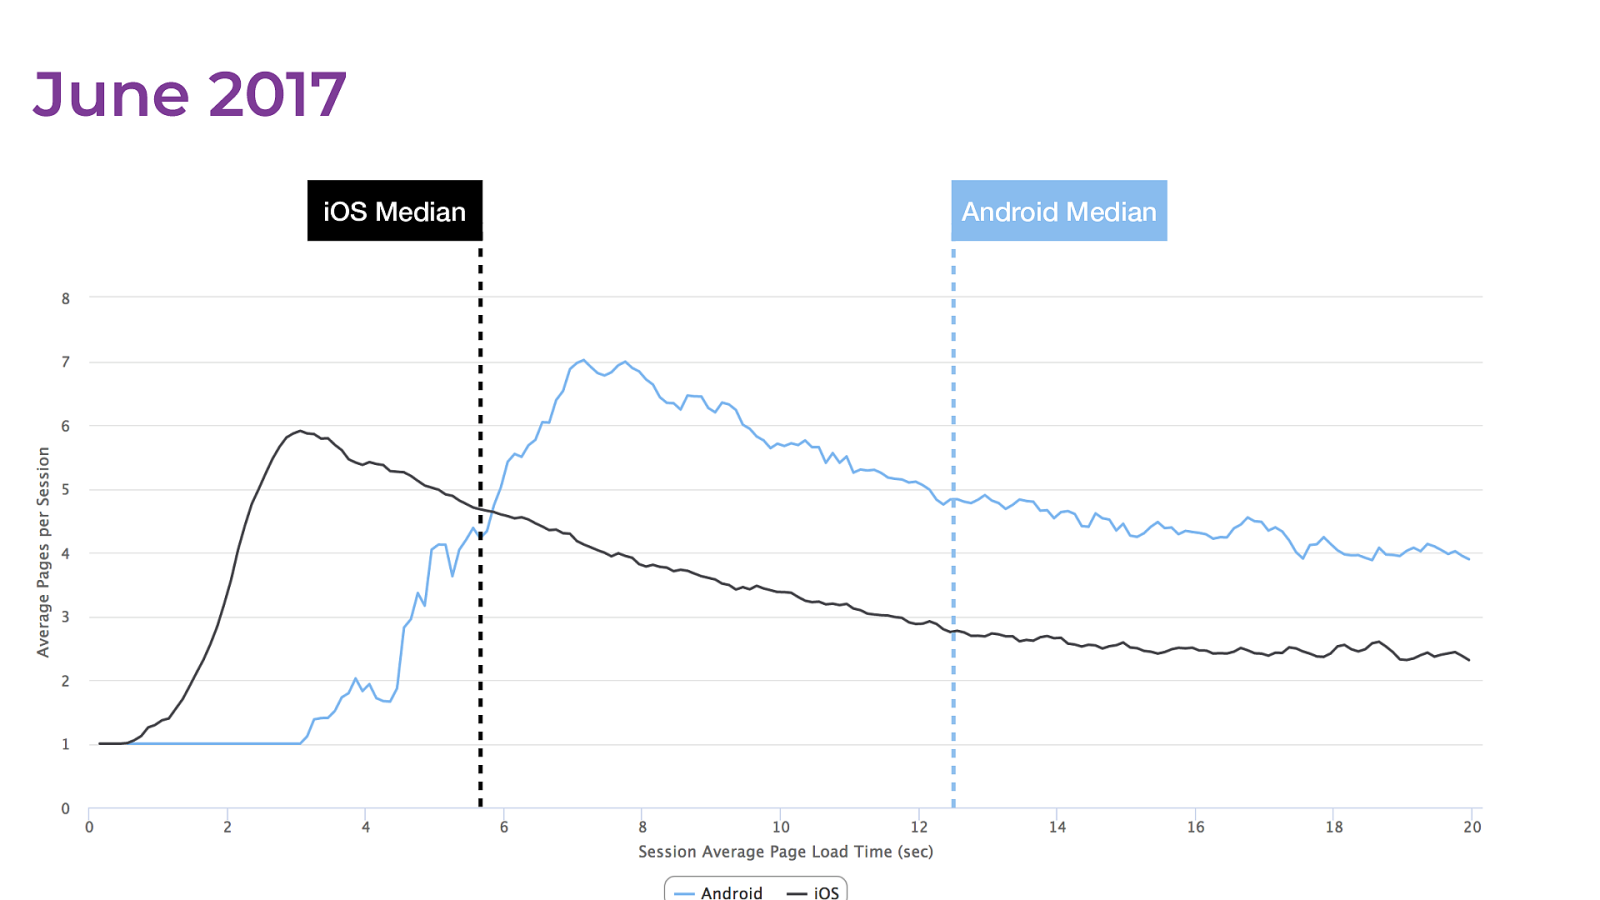
June 2017 Android Median iOS Median
Summer 2017 Proving the value of performance
⭐
⭐
⭐
⭐
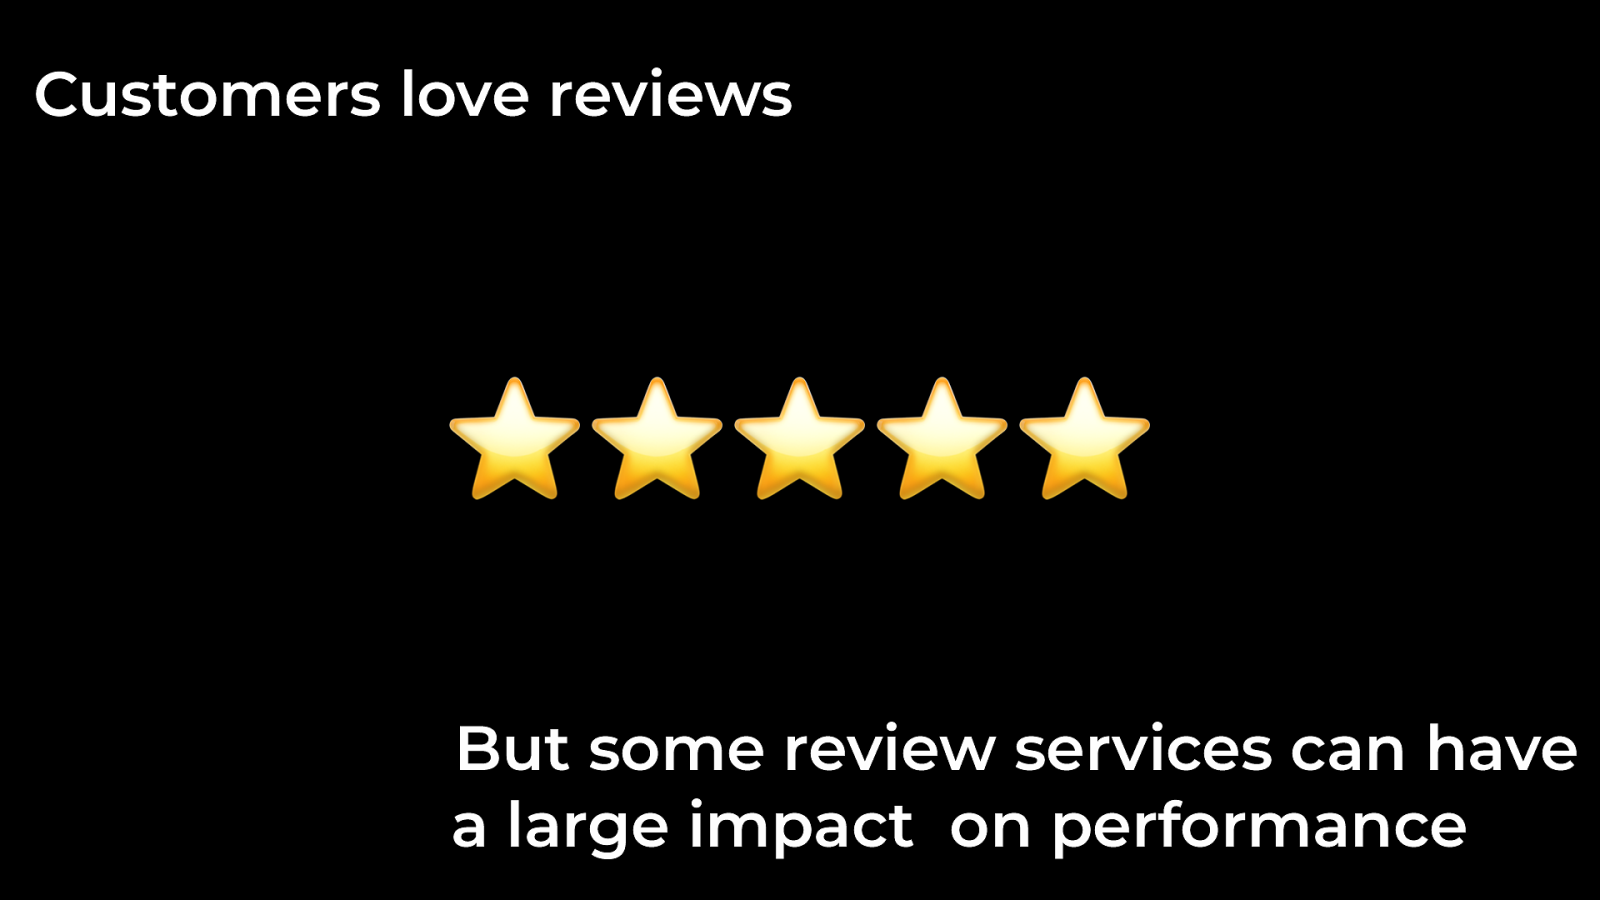
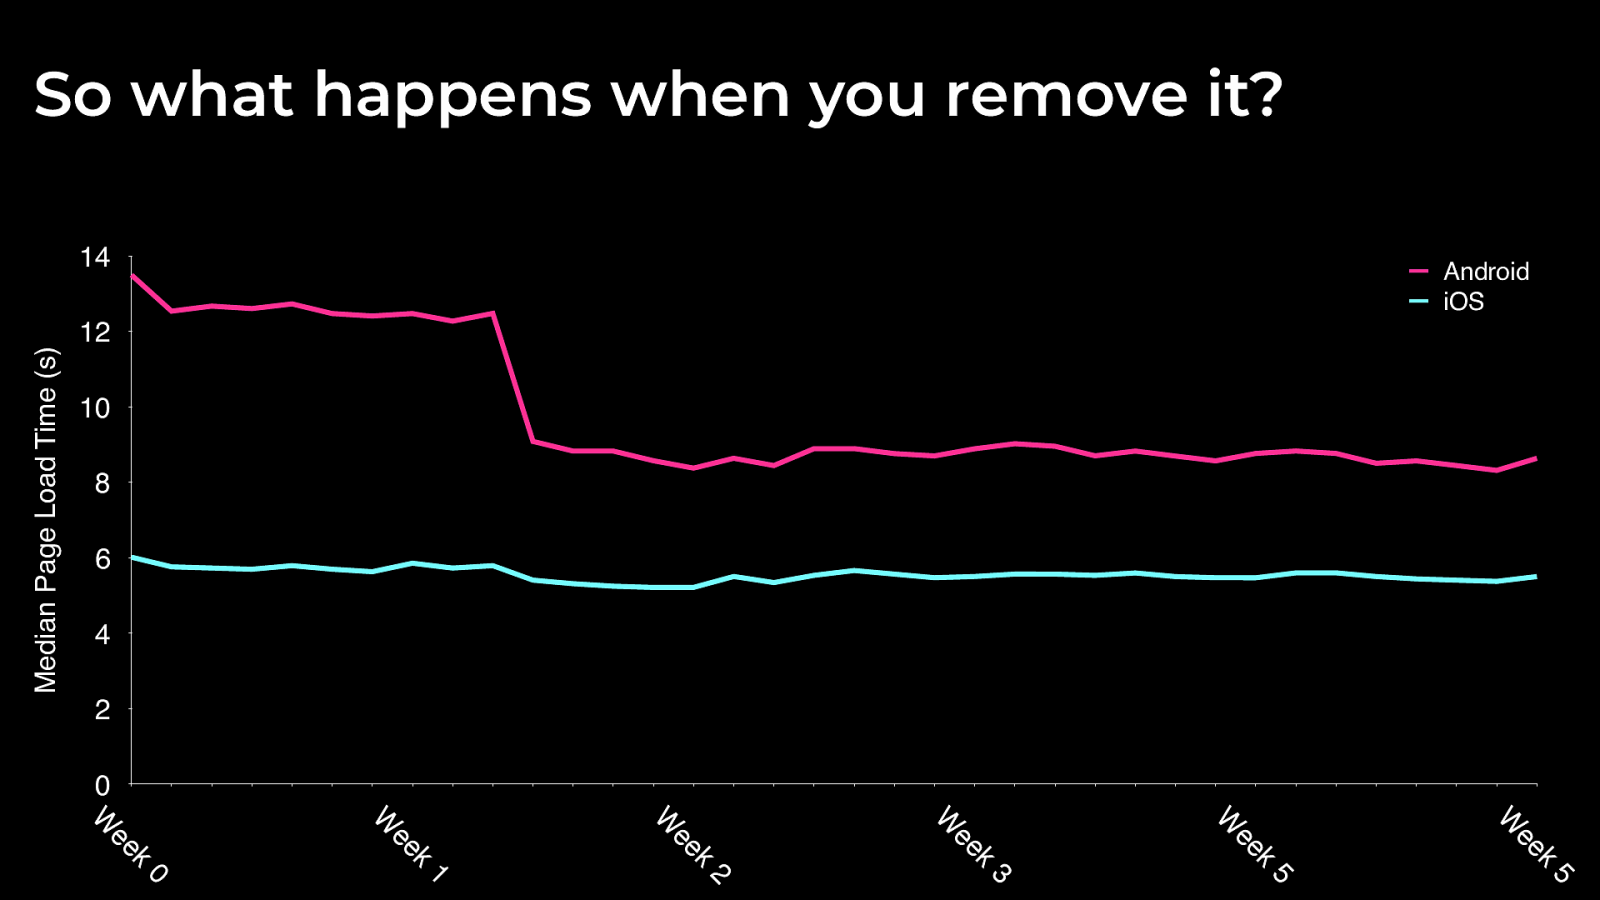
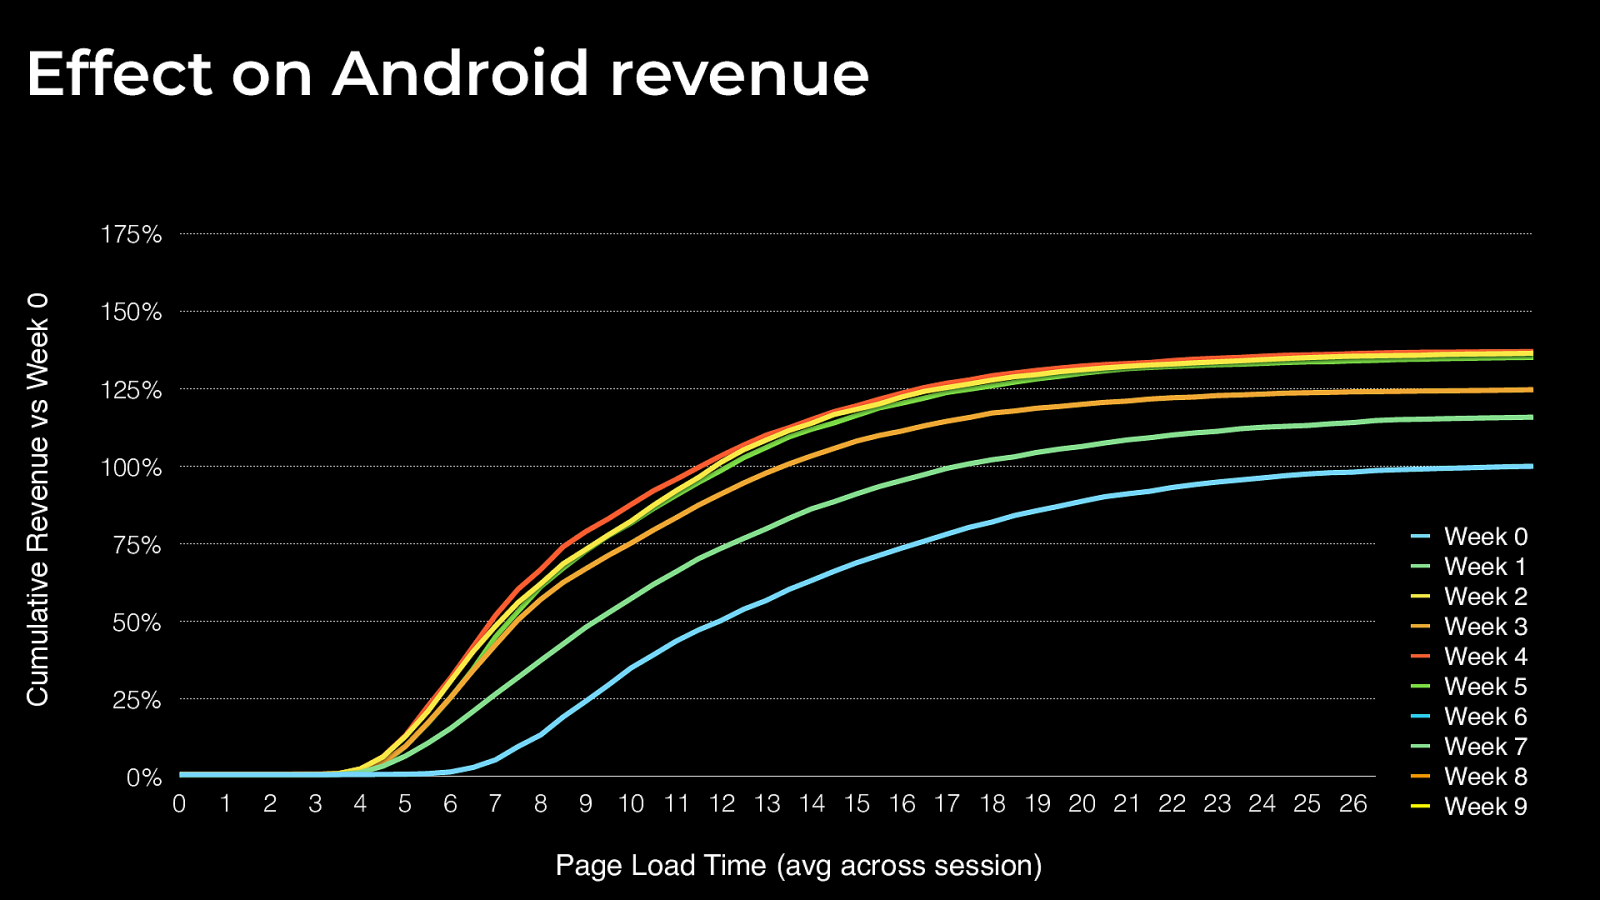
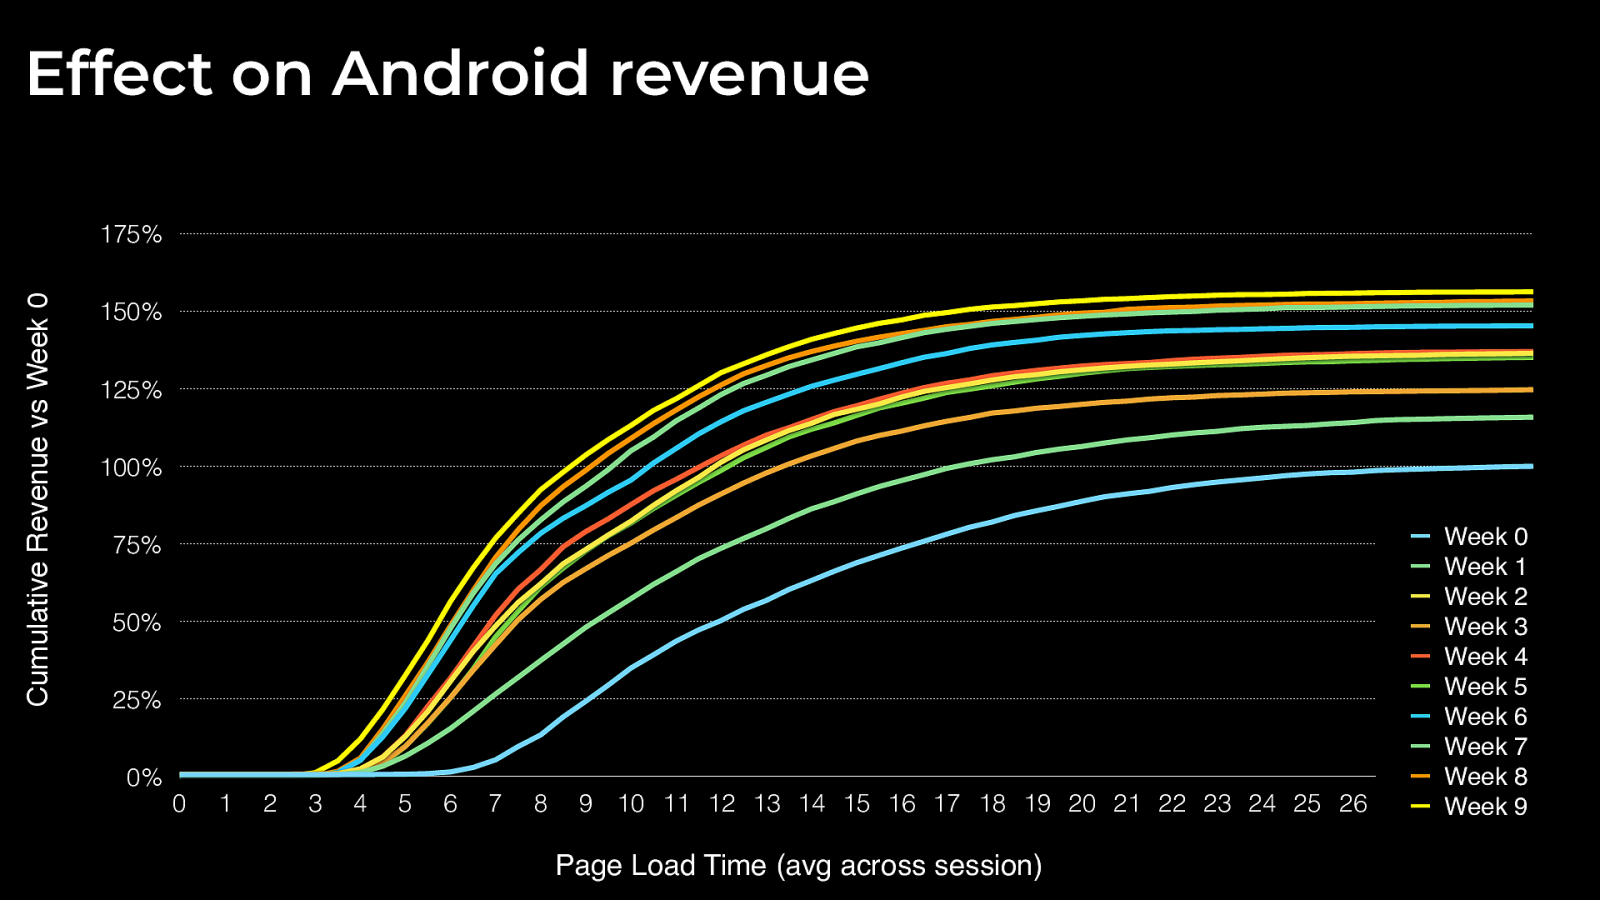
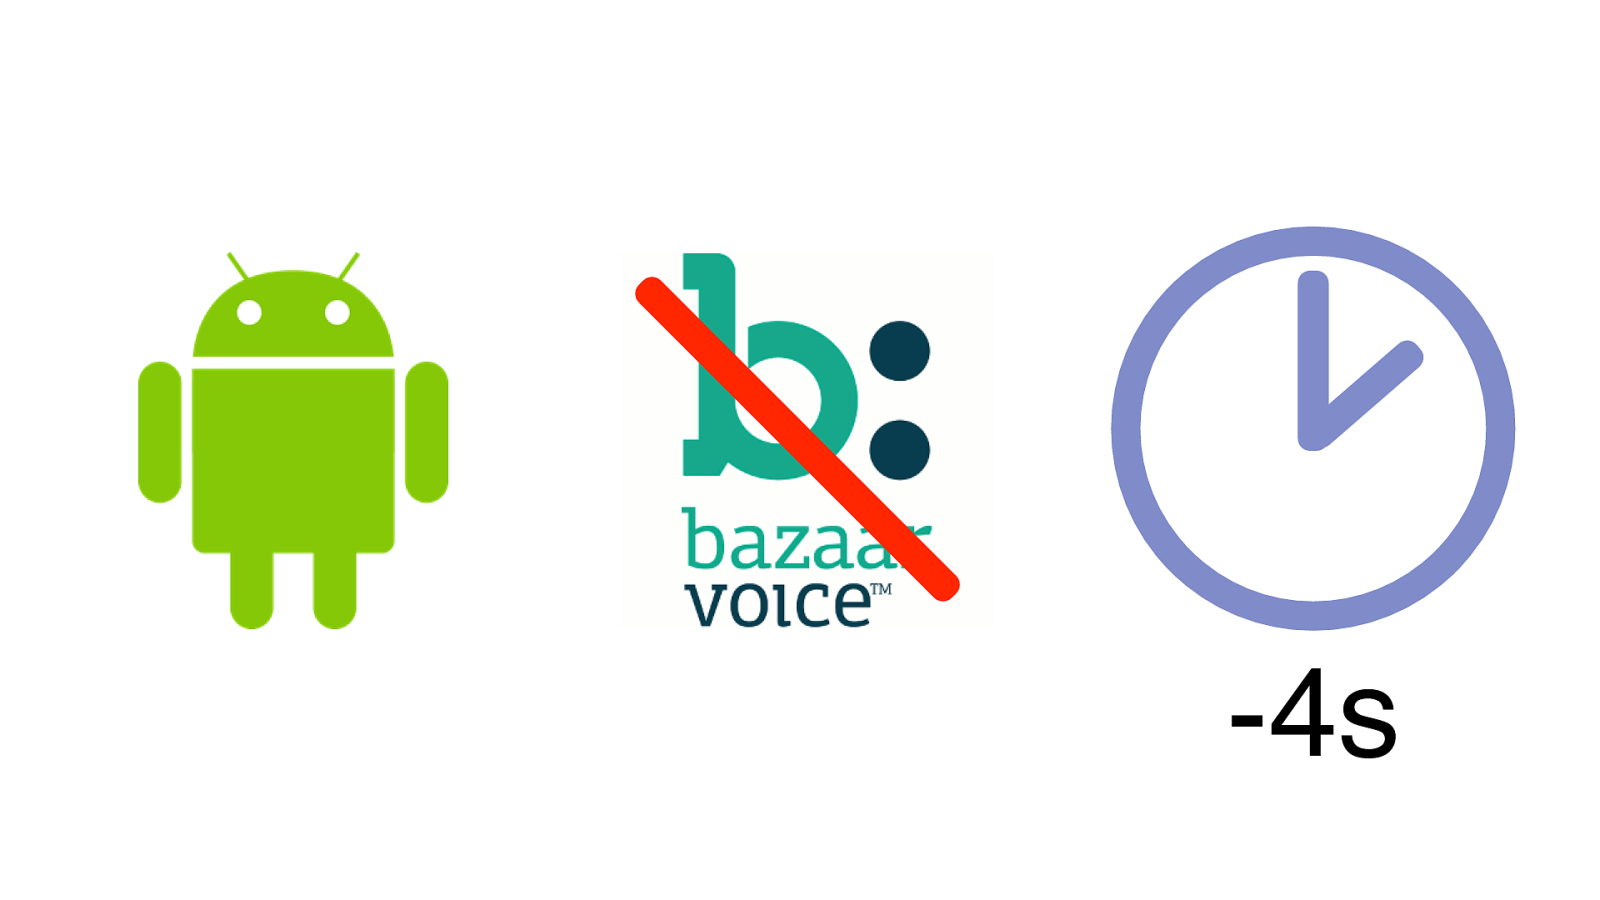
⭐ Customers love reviews But some review services can have a large impact on performance
Median Page Load Time (s) 0 2 4 6 8 10 12 14 Week 0 Week 1 Week 2 Week 3 Week 5 Week 5 Android iOS So what happens when you remove it?
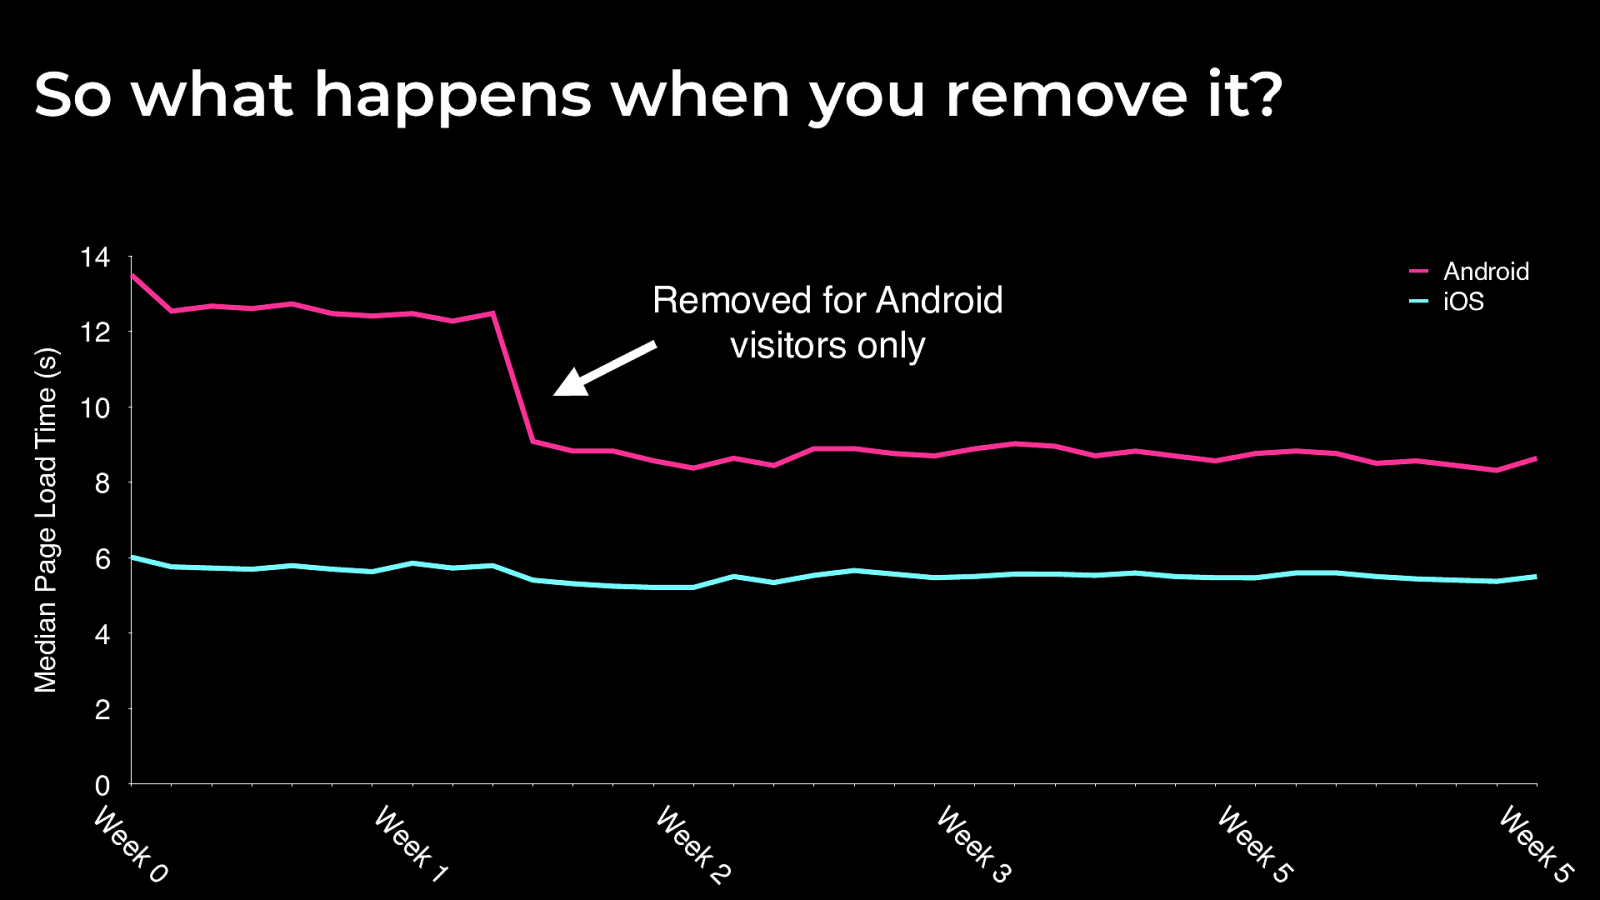
Median Page Load Time (s) 0 2 4 6 8 10 12 14 Week 0 Week 1 Week 2 Week 3 Week 5 Week 5 Android iOS Removed for Android visitors only So what happens when you remove it?
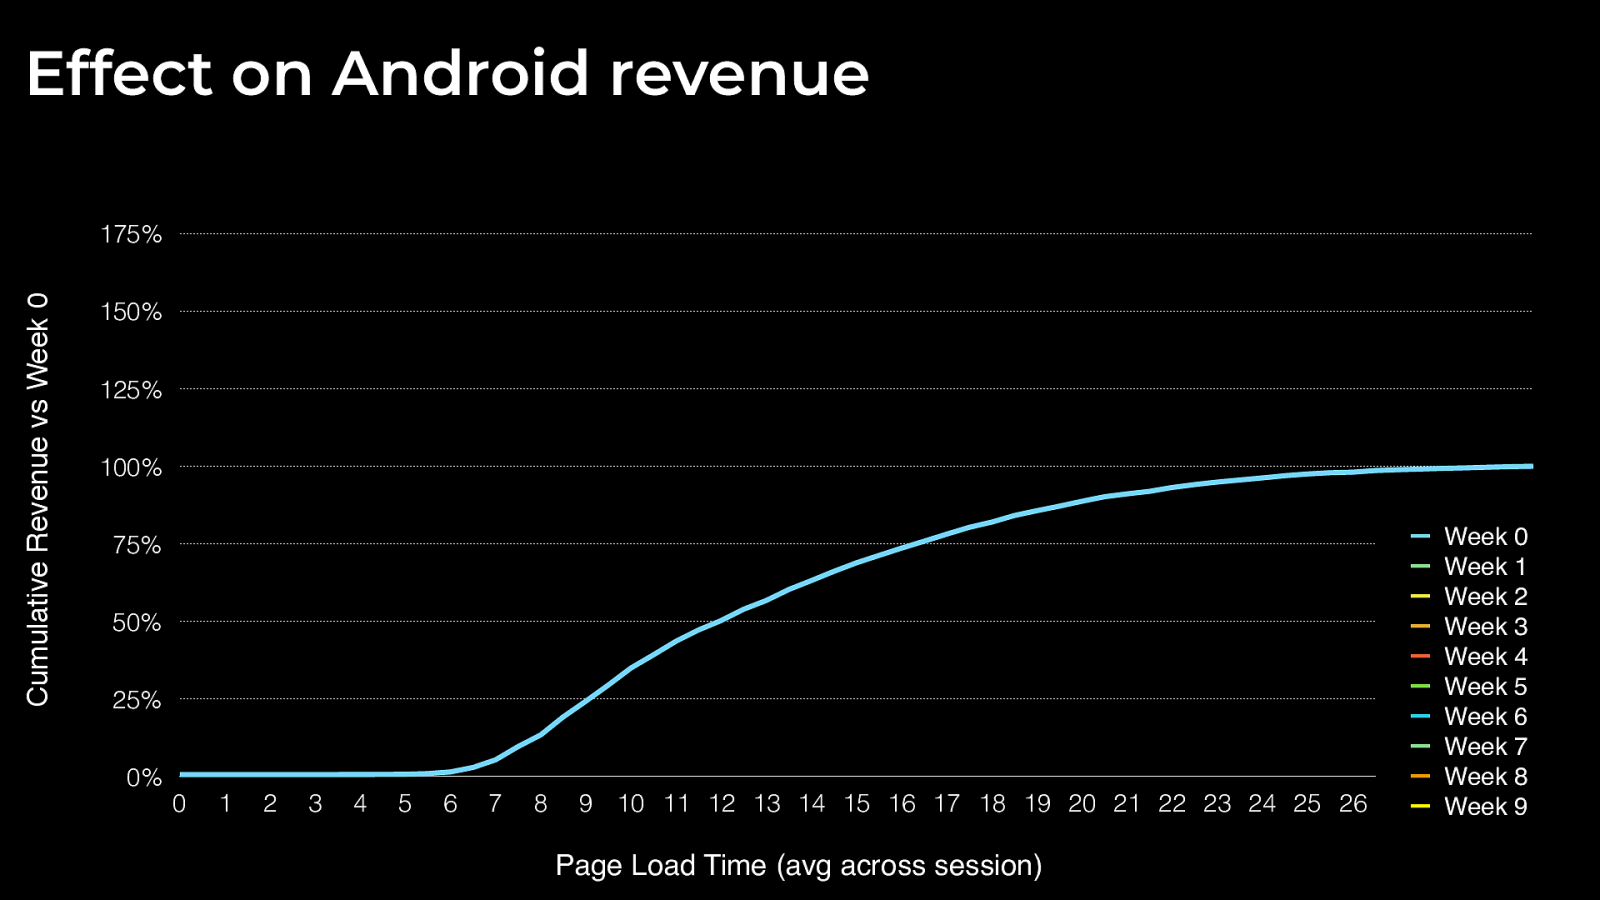
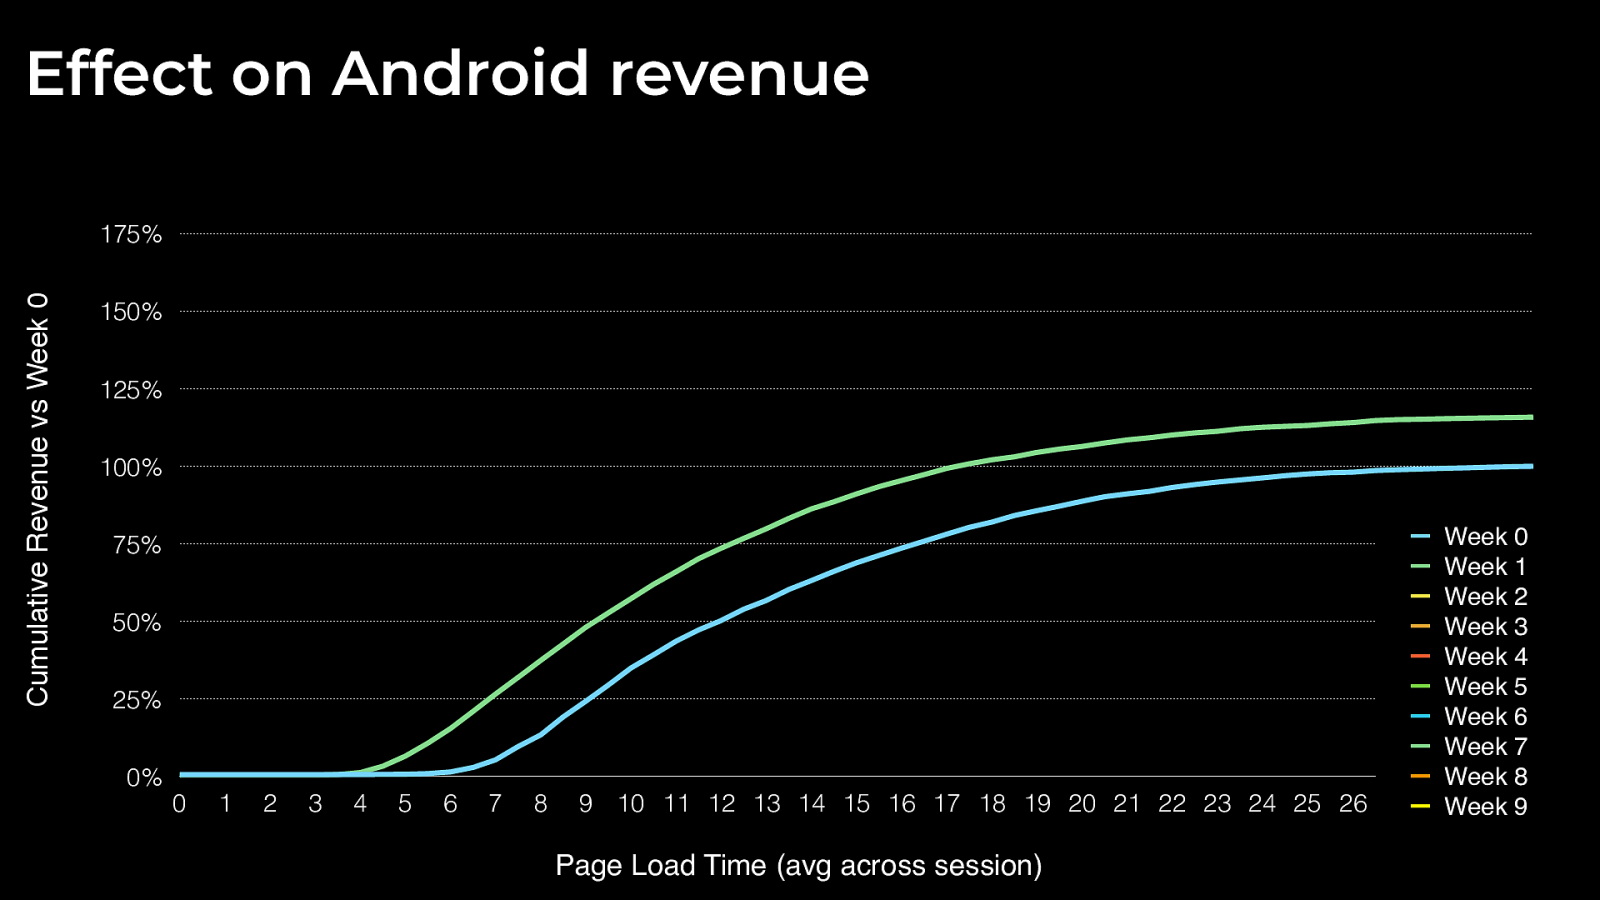
0% 25% 50% 75% 100% 125% 150% 175% 0 1 2 3 4 5 6 7 8 9 10 11 12 13 14 15 16 17 18 19 20 21 22 23 24 25 26 27 28 29 30 Week 0 Week 1 Week 2 Week 3 Week 4 Week 5 Week 6 Week 7 Week 8 Week 9 Page Load Time (avg across session) Cumulative Revenue vs Week 0 Effect on Android revenue
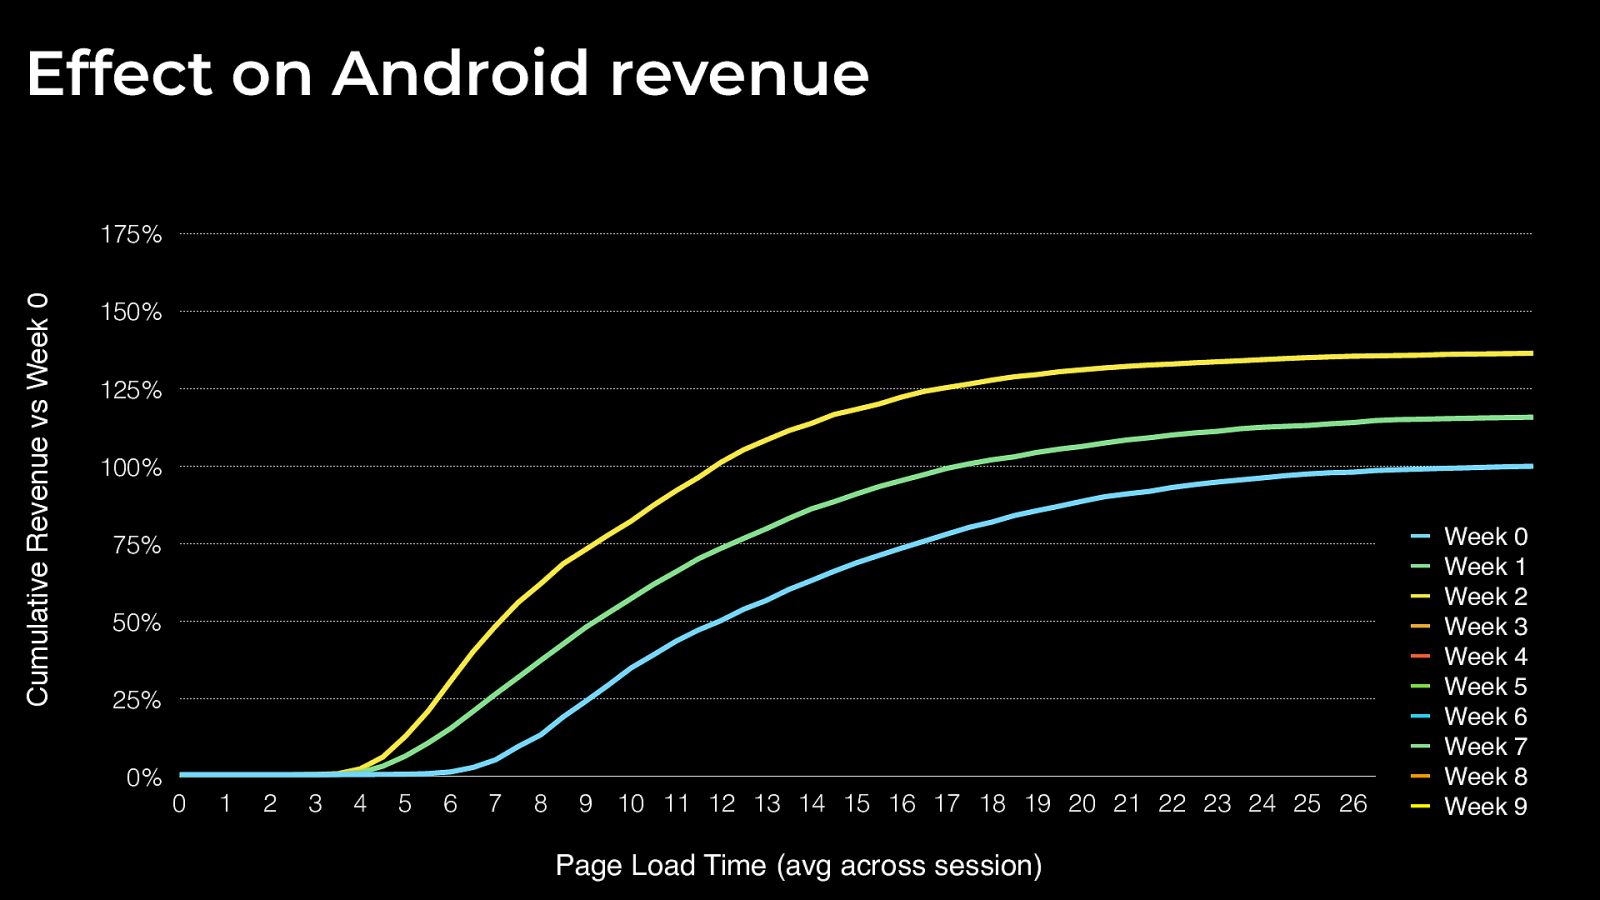
0% 25% 50% 75% 100% 125% 150% 175% 0 1 2 3 4 5 6 7 8 9 10 11 12 13 14 15 16 17 18 19 20 21 22 23 24 25 26 27 28 29 30 Week 0 Week 1 Week 2 Week 3 Week 4 Week 5 Week 6 Week 7 Week 8 Week 9 Page Load Time (avg across session) Cumulative Revenue vs Week 0 Effect on Android revenue
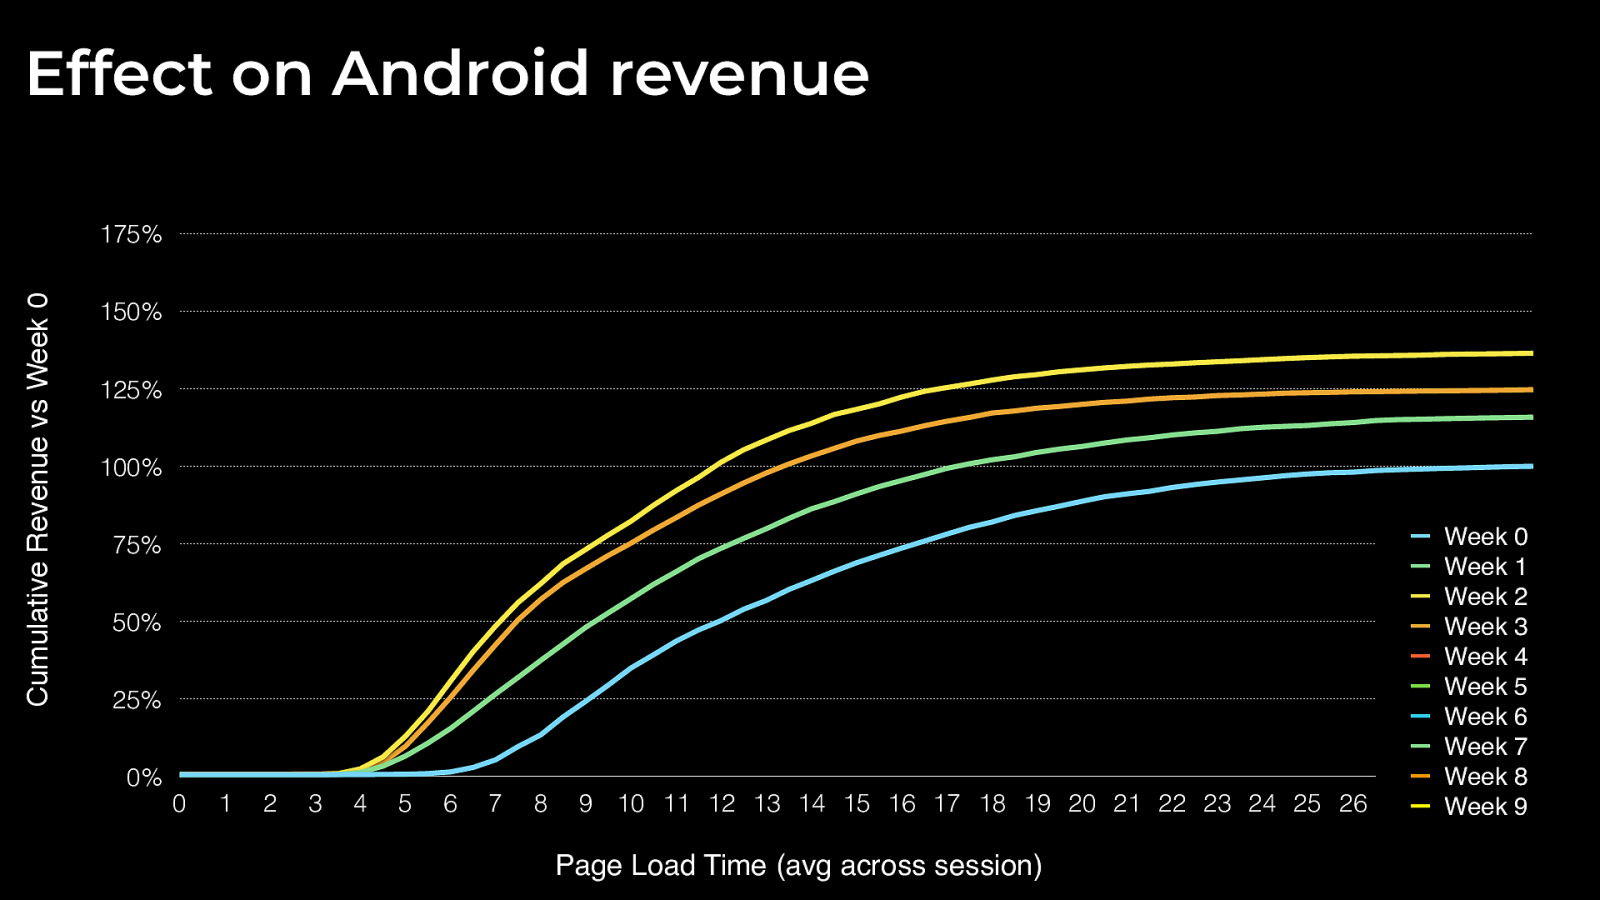
0% 25% 50% 75% 100% 125% 150% 175% 0 1 2 3 4 5 6 7 8 9 10 11 12 13 14 15 16 17 18 19 20 21 22 23 24 25 26 27 28 29 30 Week 0 Week 1 Week 2 Week 3 Week 4 Week 5 Week 6 Week 7 Week 8 Week 9 Page Load Time (avg across session) Cumulative Revenue vs Week 0 Effect on Android revenue
0% 25% 50% 75% 100% 125% 150% 175% 0 1 2 3 4 5 6 7 8 9 10 11 12 13 14 15 16 17 18 19 20 21 22 23 24 25 26 27 28 29 30 Week 0 Week 1 Week 2 Week 3 Week 4 Week 5 Week 6 Week 7 Week 8 Week 9 Page Load Time (avg across session) Cumulative Revenue vs Week 0 Effect on Android revenue
0% 25% 50% 75% 100% 125% 150% 175% 0 1 2 3 4 5 6 7 8 9 10 11 12 13 14 15 16 17 18 19 20 21 22 23 24 25 26 27 28 29 30 Week 0 Week 1 Week 2 Week 3 Week 4 Week 5 Week 6 Week 7 Week 8 Week 9 Page Load Time (avg across session) Cumulative Revenue vs Week 0 Effect on Android revenue
0% 25% 50% 75% 100% 125% 150% 175% 0 1 2 3 4 5 6 7 8 9 10 11 12 13 14 15 16 17 18 19 20 21 22 23 24 25 26 27 28 29 30 Week 0 Week 1 Week 2 Week 3 Week 4 Week 5 Week 6 Week 7 Week 8 Week 9 Page Load Time (avg across session) Cumulative Revenue vs Week 0 Effect on Android revenue
0% 25% 50% 75% 100% 125% 150% 175% 0 1 2 3 4 5 6 7 8 9 10 11 12 13 14 15 16 17 18 19 20 21 22 23 24 25 26 27 28 29 30 Week 0 Week 1 Week 2 Week 3 Week 4 Week 5 Week 6 Week 7 Week 8 Week 9 Page Load Time (avg across session) Cumulative Revenue vs Week 0 Effect on Android revenue
0% 25% 50% 75% 100% 125% 150% 175% 0 1 2 3 4 5 6 7 8 9 10 11 12 13 14 15 16 17 18 19 20 21 22 23 24 25 26 27 28 29 30 Week 0 Week 1 Week 2 Week 3 Week 4 Week 5 Week 6 Week 7 Week 8 Week 9 Page Load Time (avg across session) Cumulative Revenue vs Week 0 Effect on Android revenue
0% 25% 50% 75% 100% 125% 150% 175% 0 1 2 3 4 5 6 7 8 9 10 11 12 13 14 15 16 17 18 19 20 21 22 23 24 25 26 27 28 29 30 Week 0 Week 1 Week 2 Week 3 Week 4 Week 5 Week 6 Week 7 Week 8 Week 9 Page Load Time (avg across session) Cumulative Revenue vs Week 0 Effect on Android revenue
0% 25% 50% 75% 100% 125% 150% 175% 0 1 2 3 4 5 6 7 8 9 10 11 12 13 14 15 16 17 18 19 20 21 22 23 24 25 26 27 28 29 30 Week 0 Week 1 Week 2 Week 3 Week 4 Week 5 Week 6 Week 7 Week 8 Week 9 Page Load Time (avg across session) Cumulative Revenue vs Week 0 Effect on Android revenue
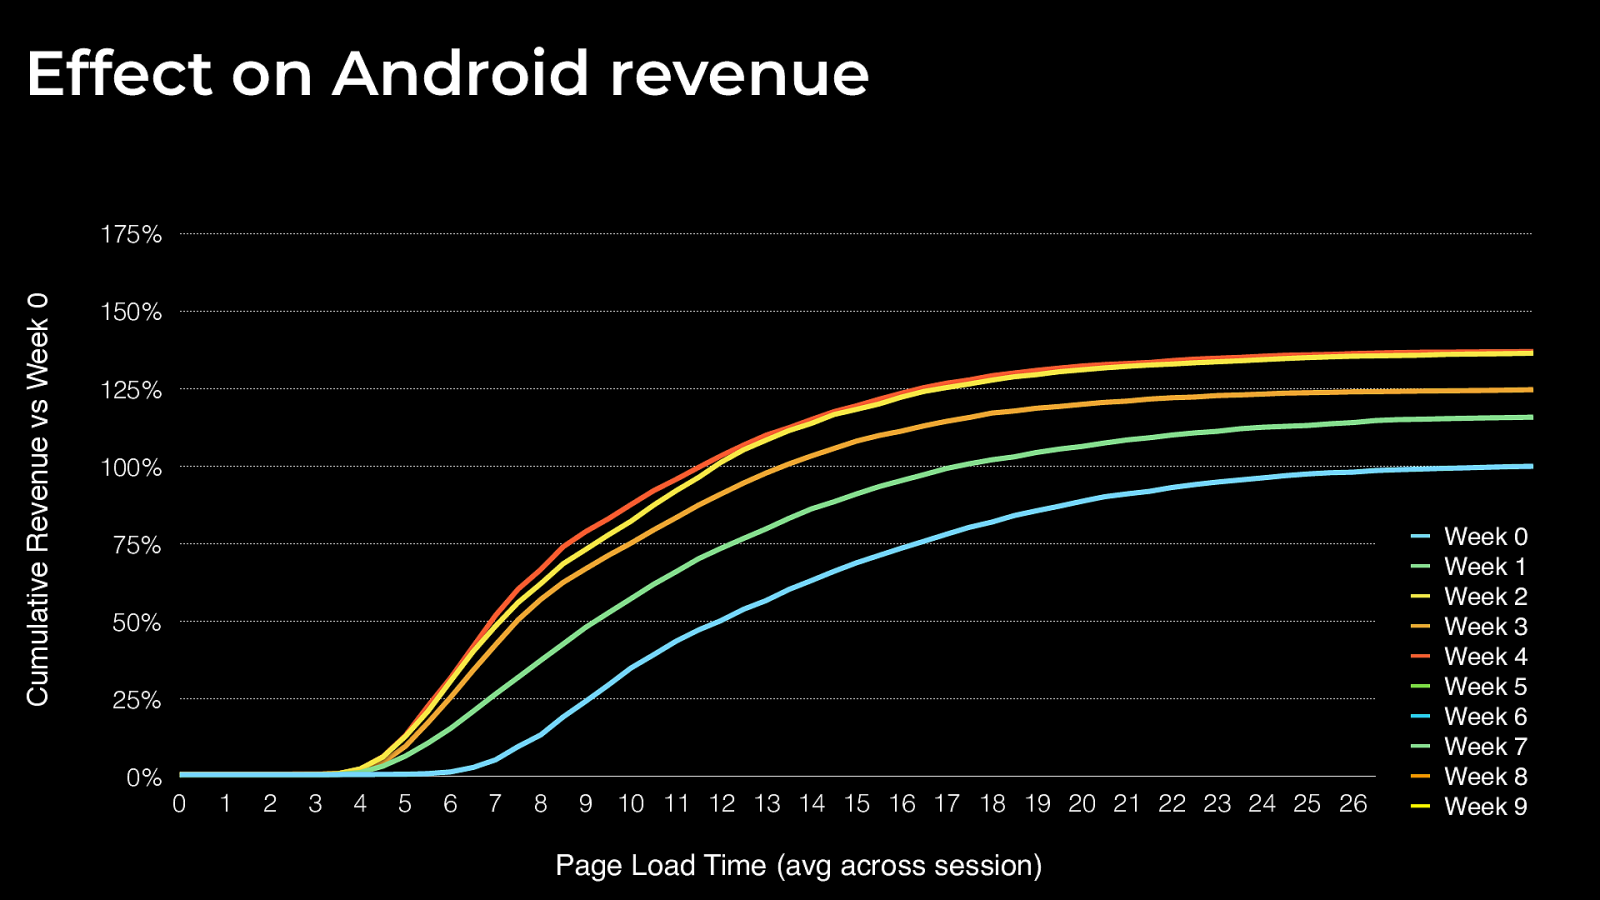
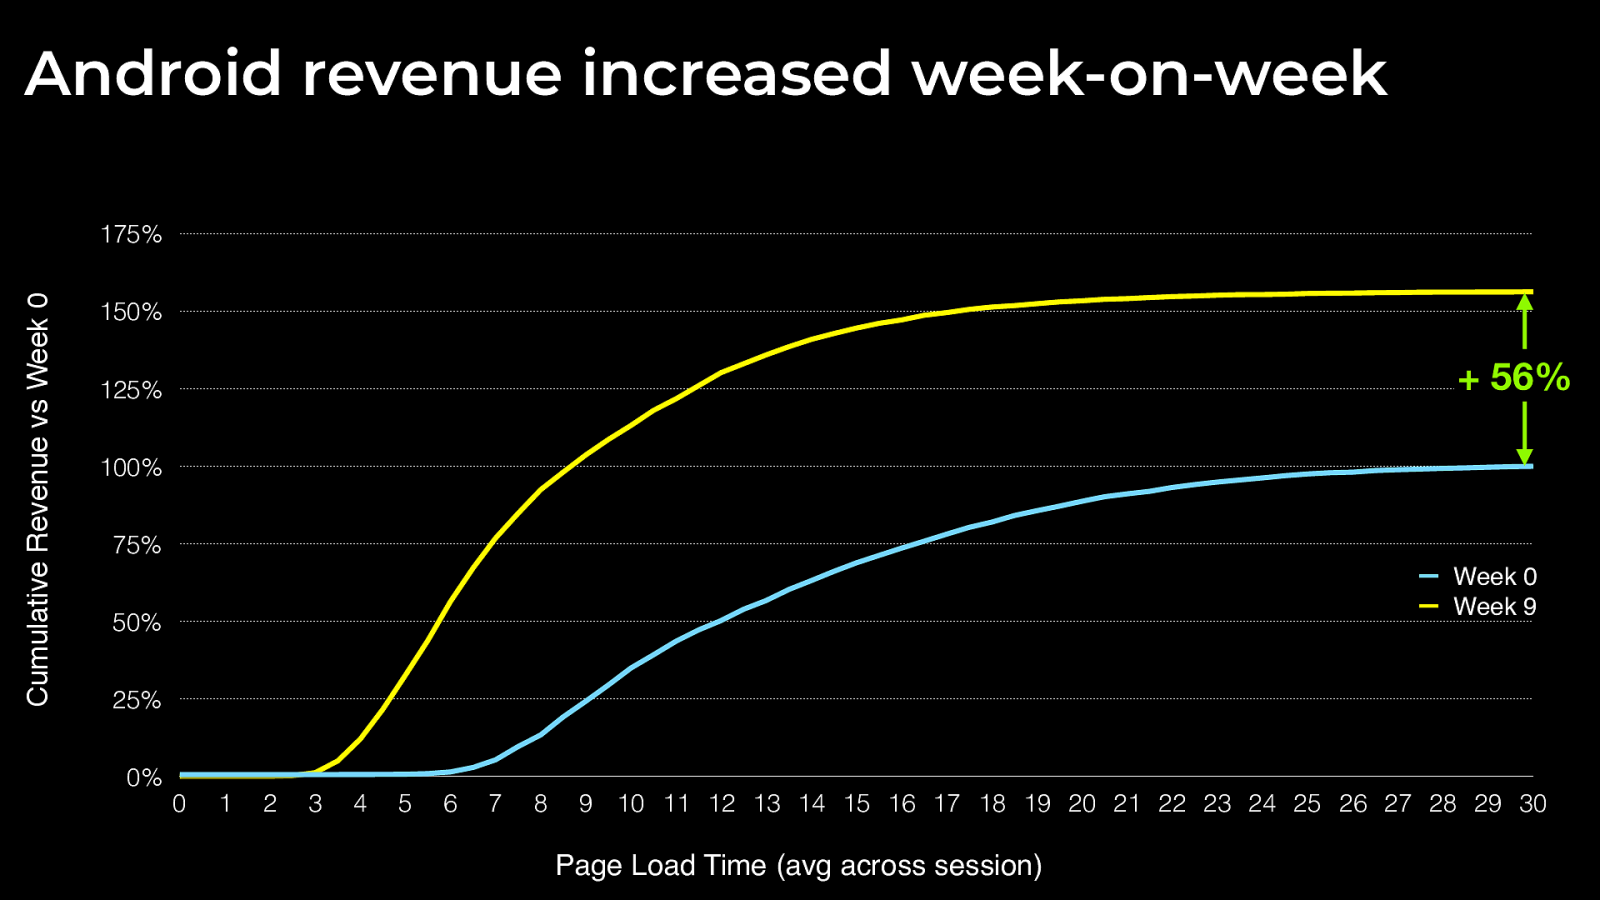
0% 25% 50% 75% 100% 125% 150% 175% 0 1 2 3 4 5 6 7 8 9 10 11 12 13 14 15 16 17 18 19 20 21 22 23 24 25 26 27 28 29 30 Week 0 Week 9 Page Load Time (avg across session) Cumulative Revenue vs Week 0 Android revenue increased week-on-week
Nothing stays still in retail!
-4s
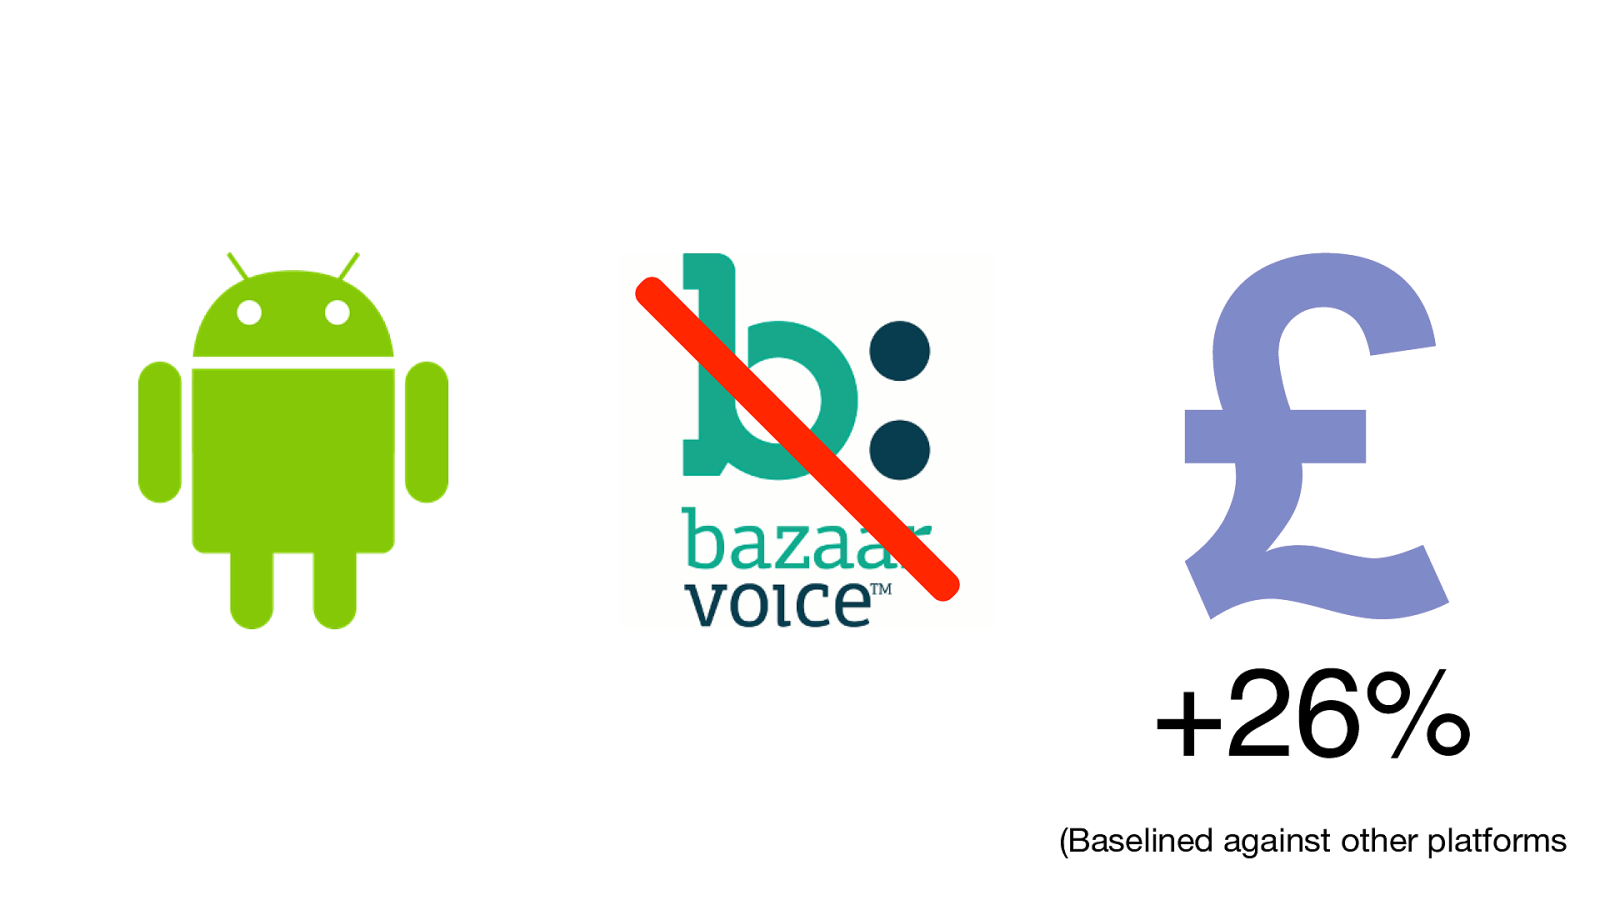
£ +26% (Baselined against other platforms
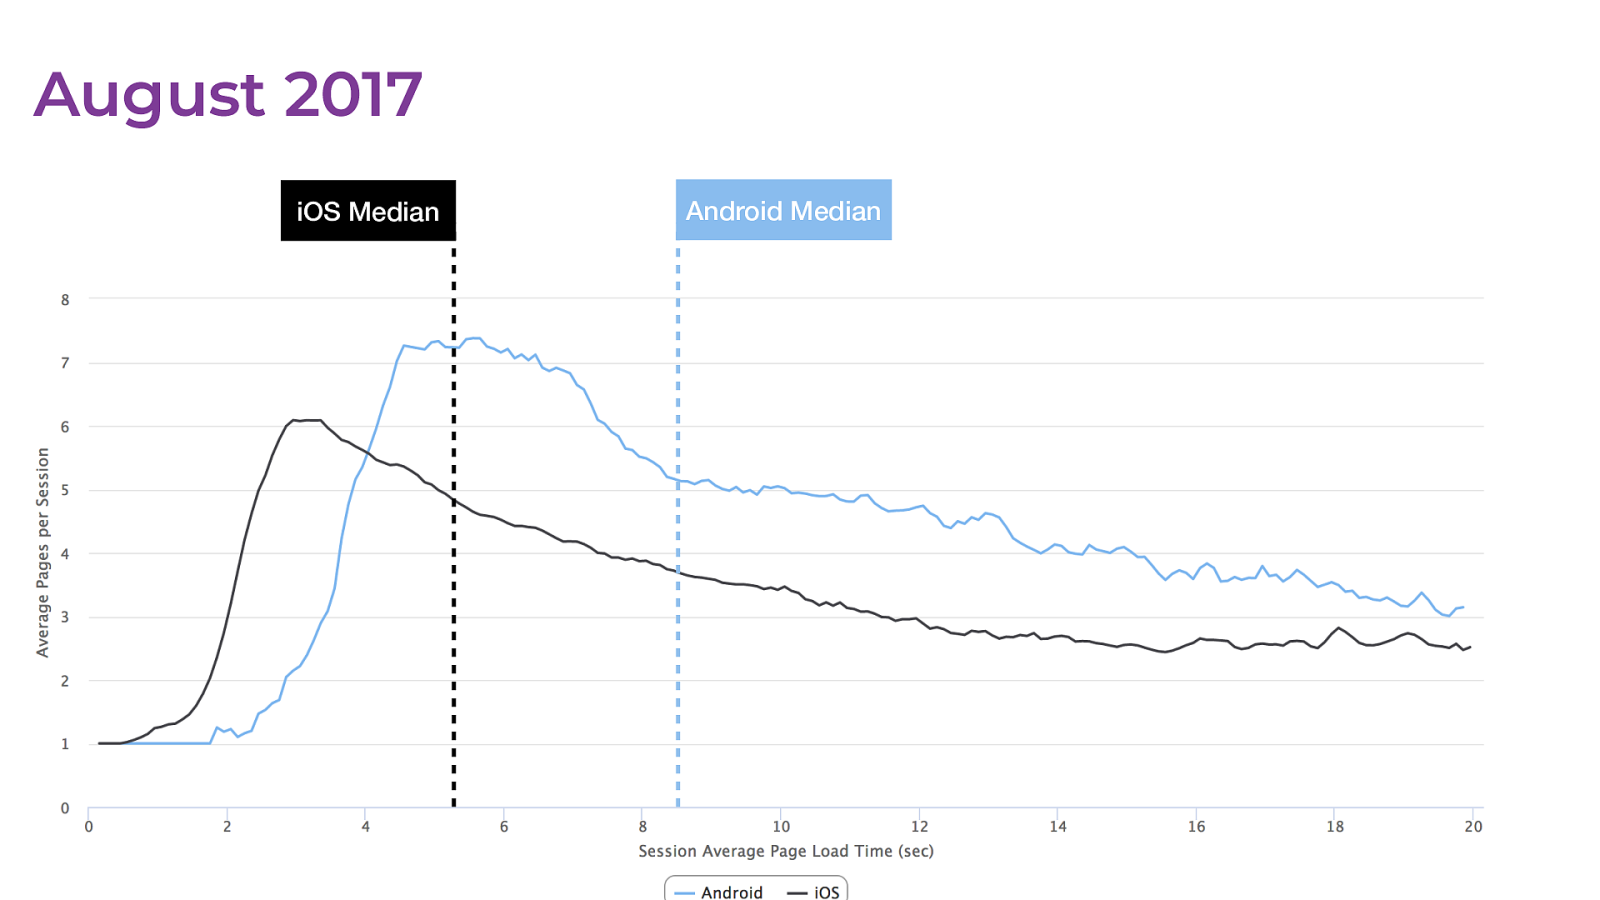
August 2017 Android Median iOS Median
https://www.flickr.com/photos/rs_butner/7505567608
Winter 2017 “Can we make it to three seconds?”
Assembled a performance team https://www.flickr.com/photos/soldiersmediacenter/7112630285
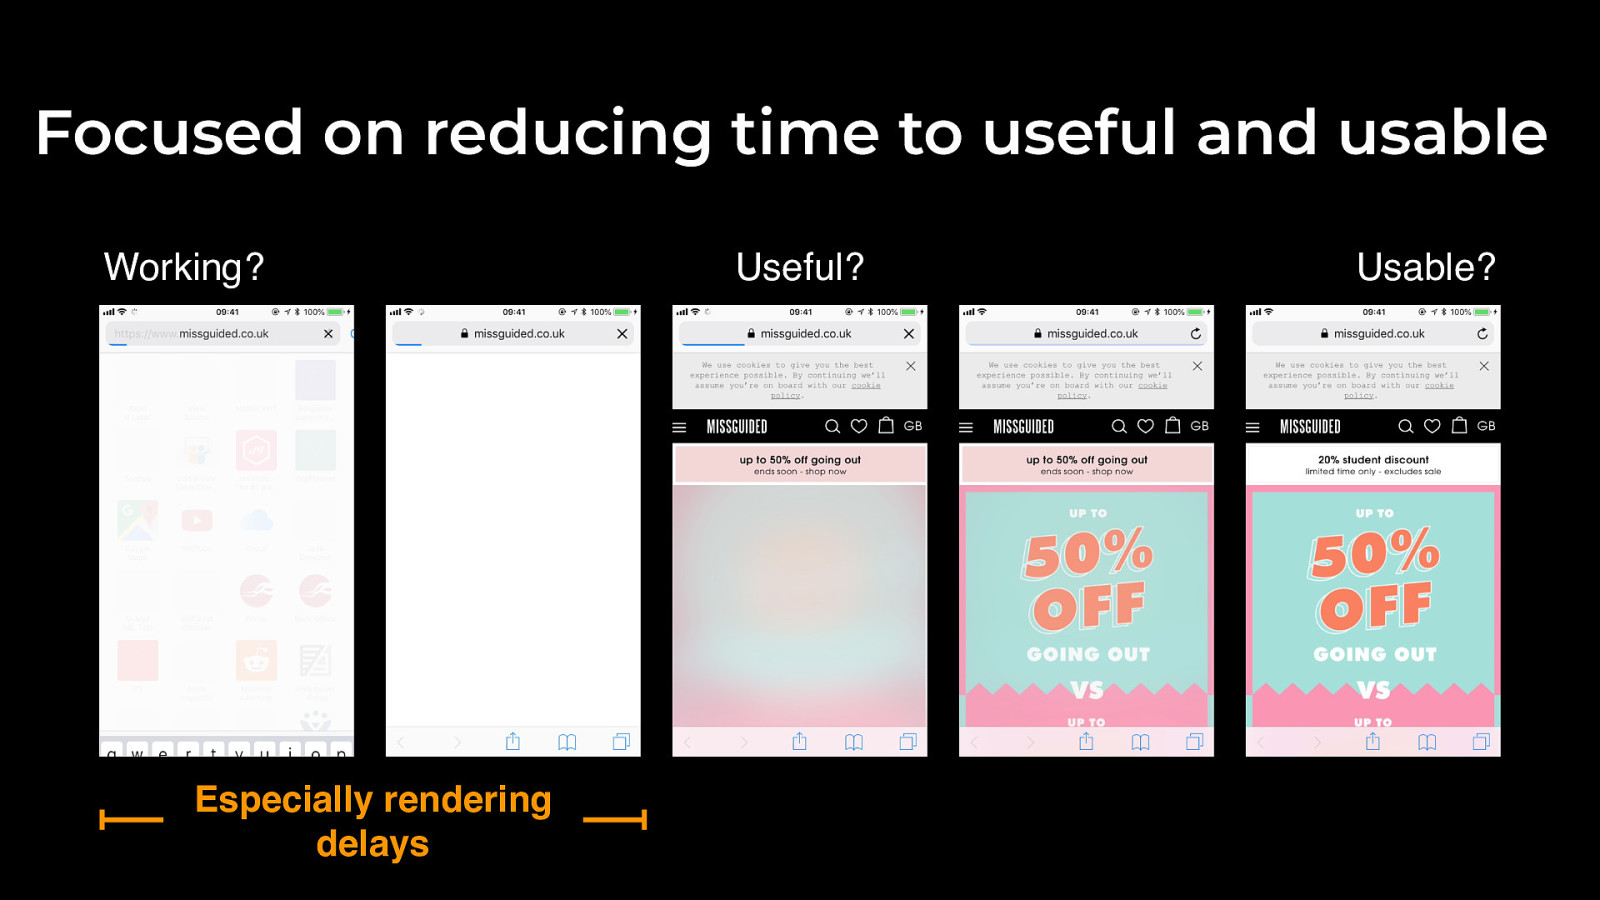
Working? Useful? Usable? Focused on reducing time to useful and usable Especially rendering delays
https://www.flickr.com/photos/poetatum/3457696479 No magic go faster button
https://www.flickr.com/photos/colleenmorgan/2721589361 “Frontend Performance Archaeology” Katie Sylor-Miller
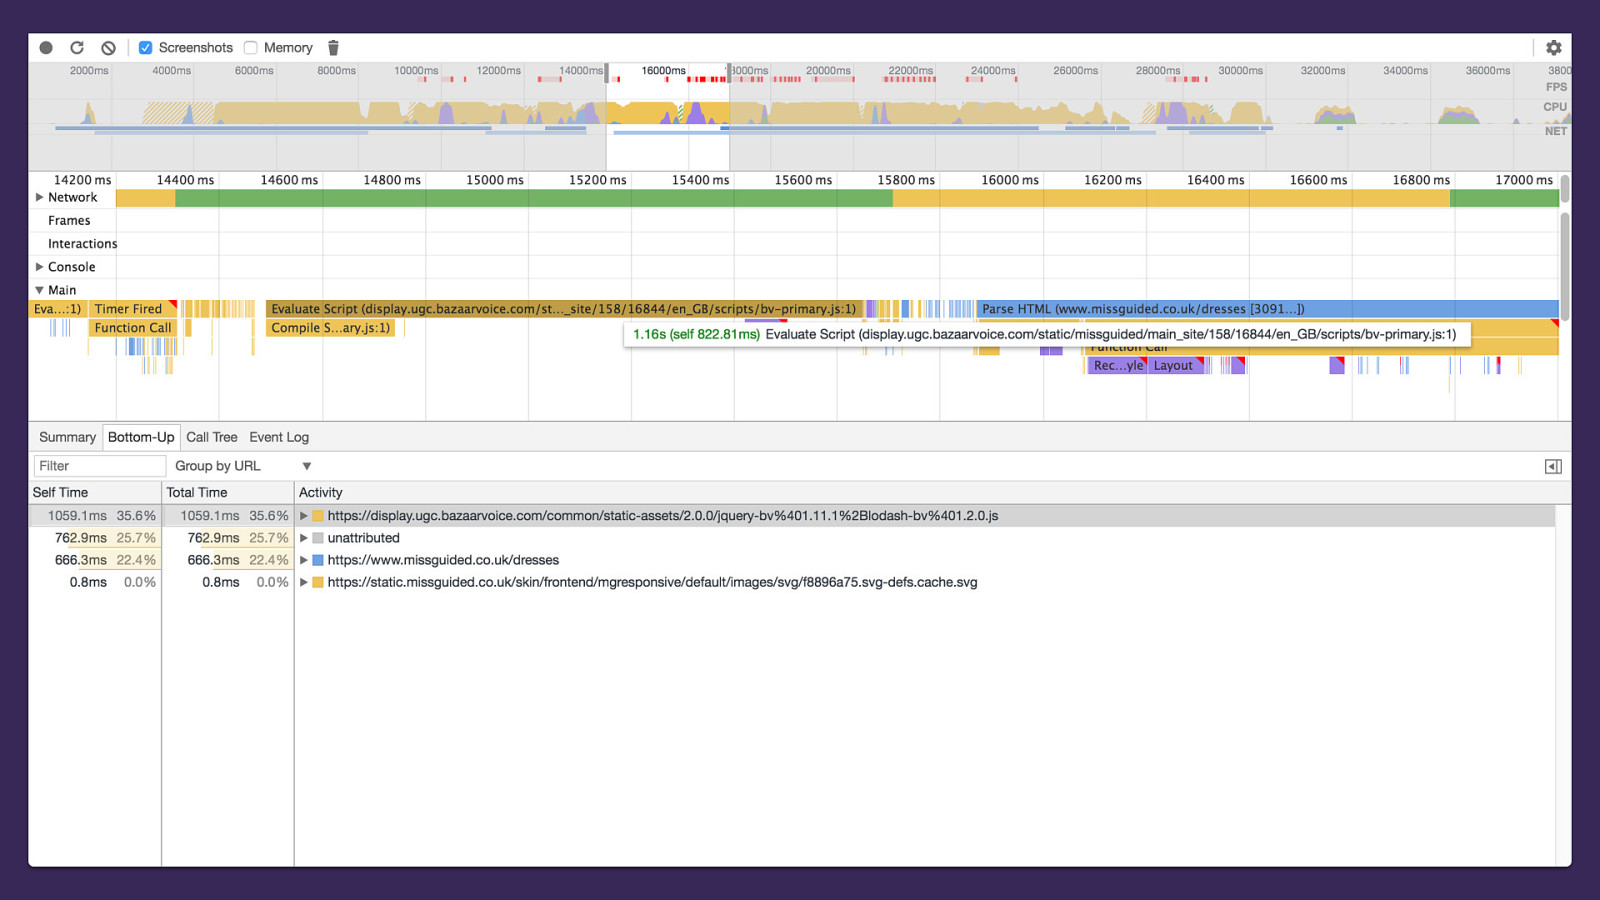
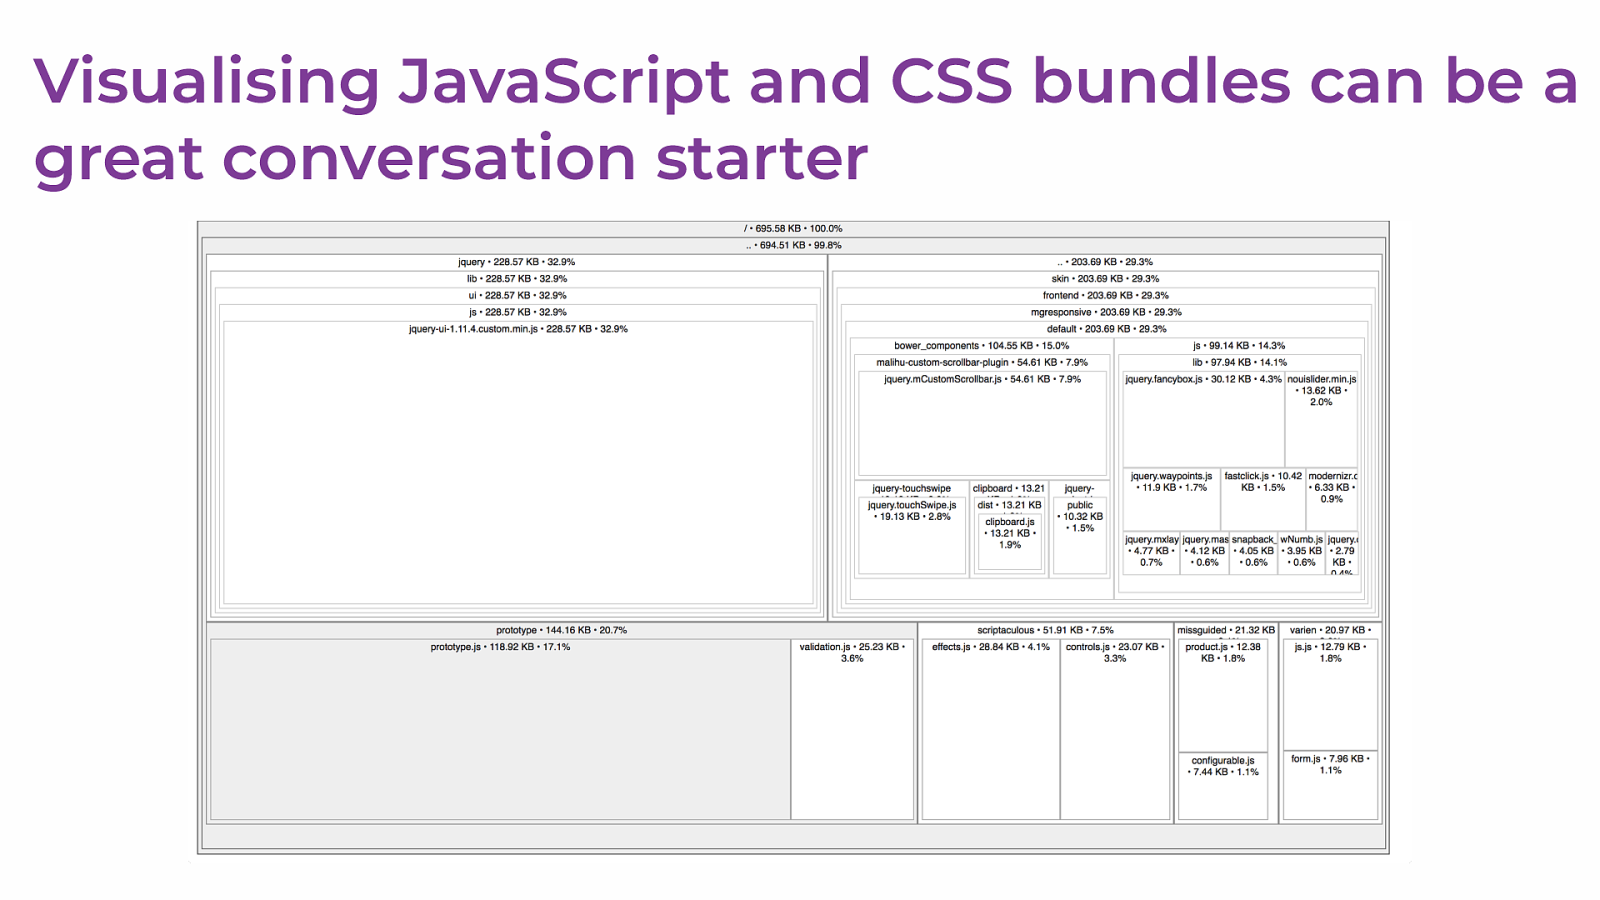
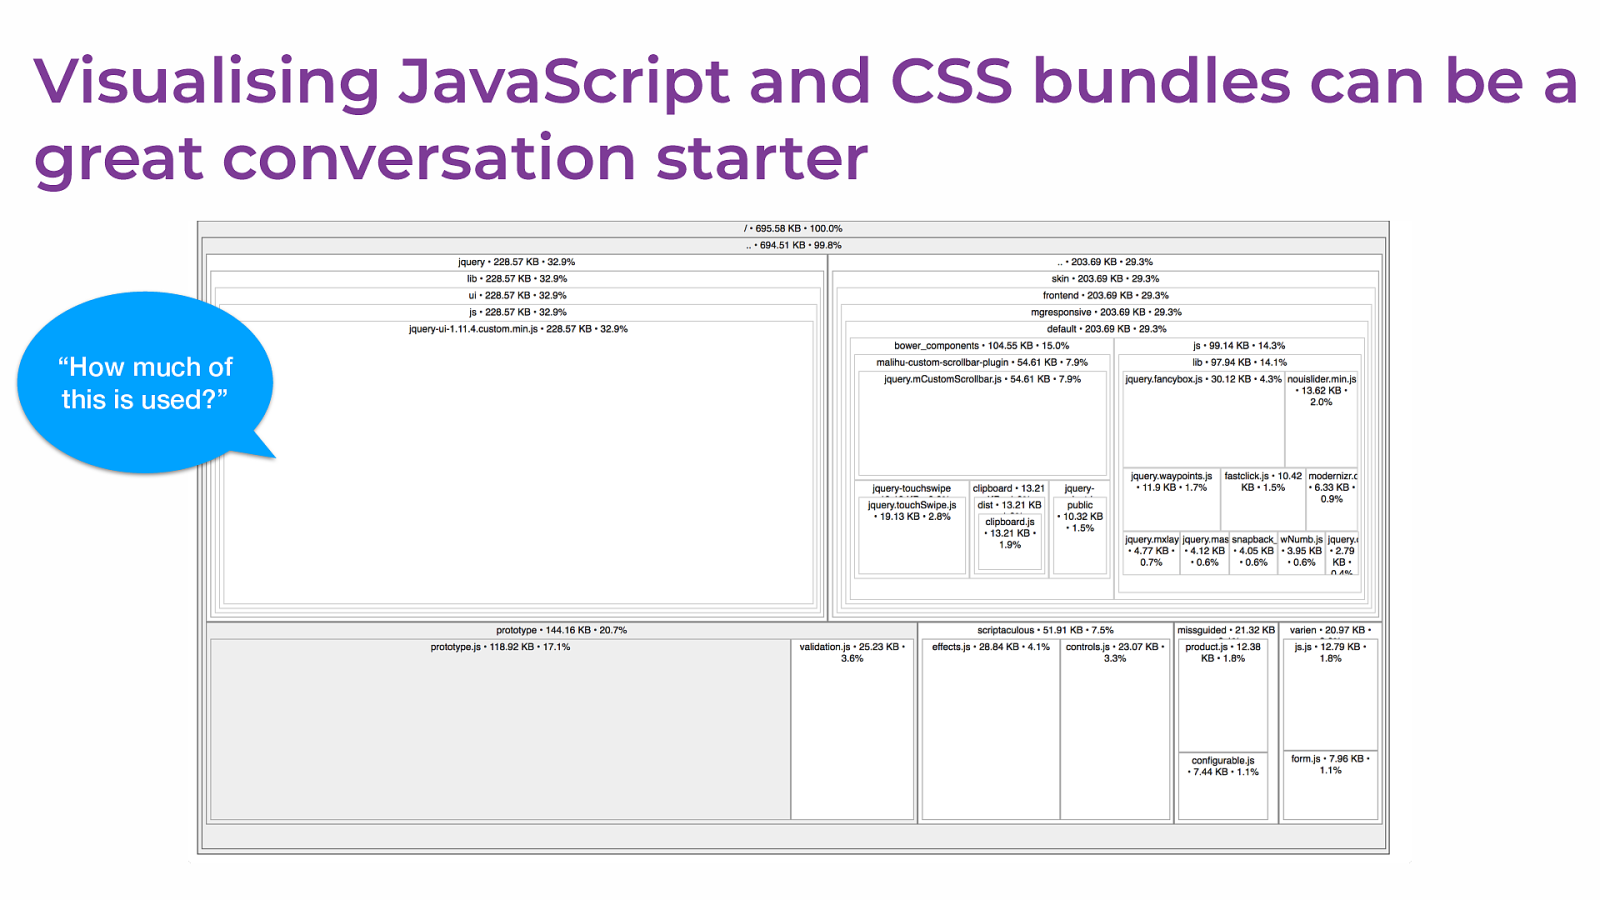
Visualising JavaScript and CSS bundles can be a great conversation starter
Visualising JavaScript and CSS bundles can be a great conversation starter “How much of this is used?”
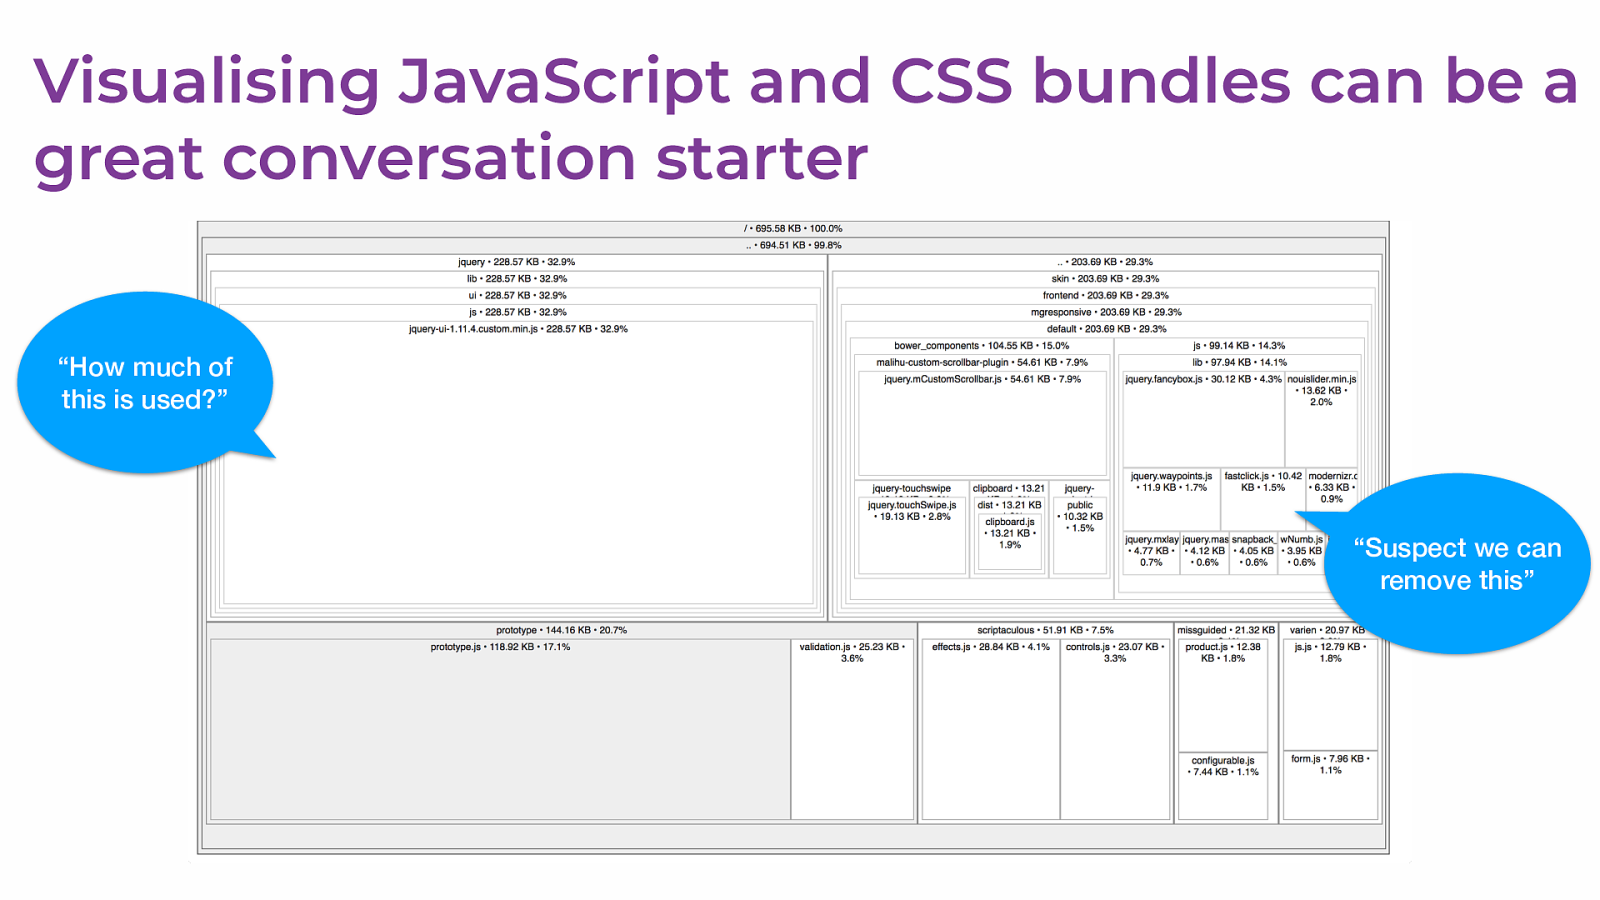
Visualising JavaScript and CSS bundles can be a great conversation starter “How much of this is used?” “Suspect we can remove this”
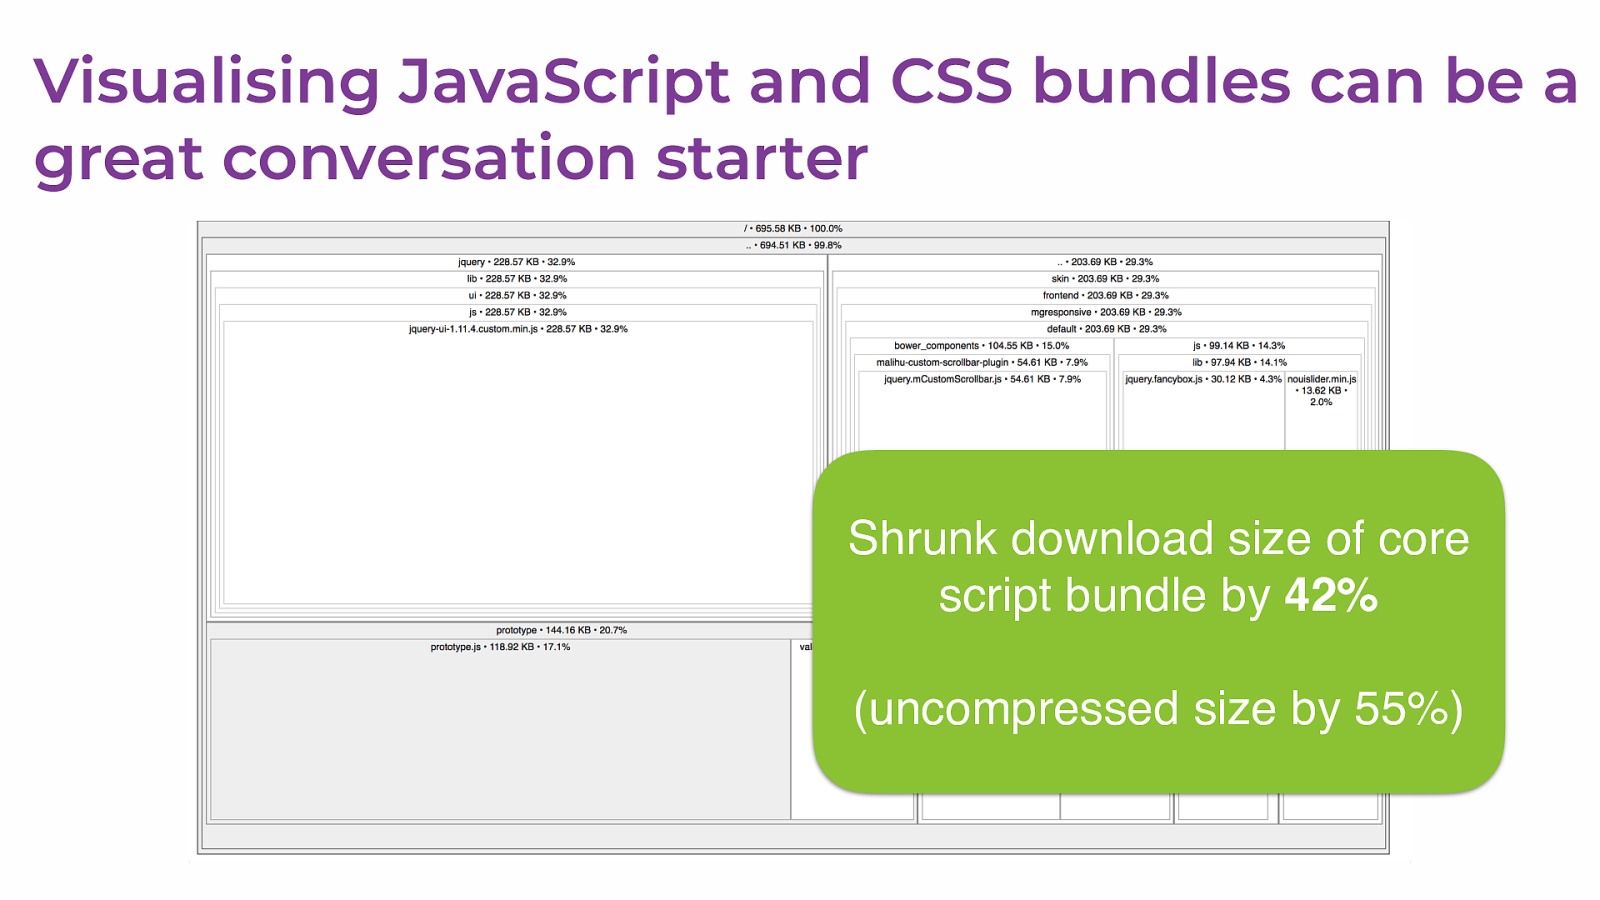
Visualising JavaScript and CSS bundles can be a great conversation starter Shrunk download size of core script bundle by 42% (uncompressed size by 55%)
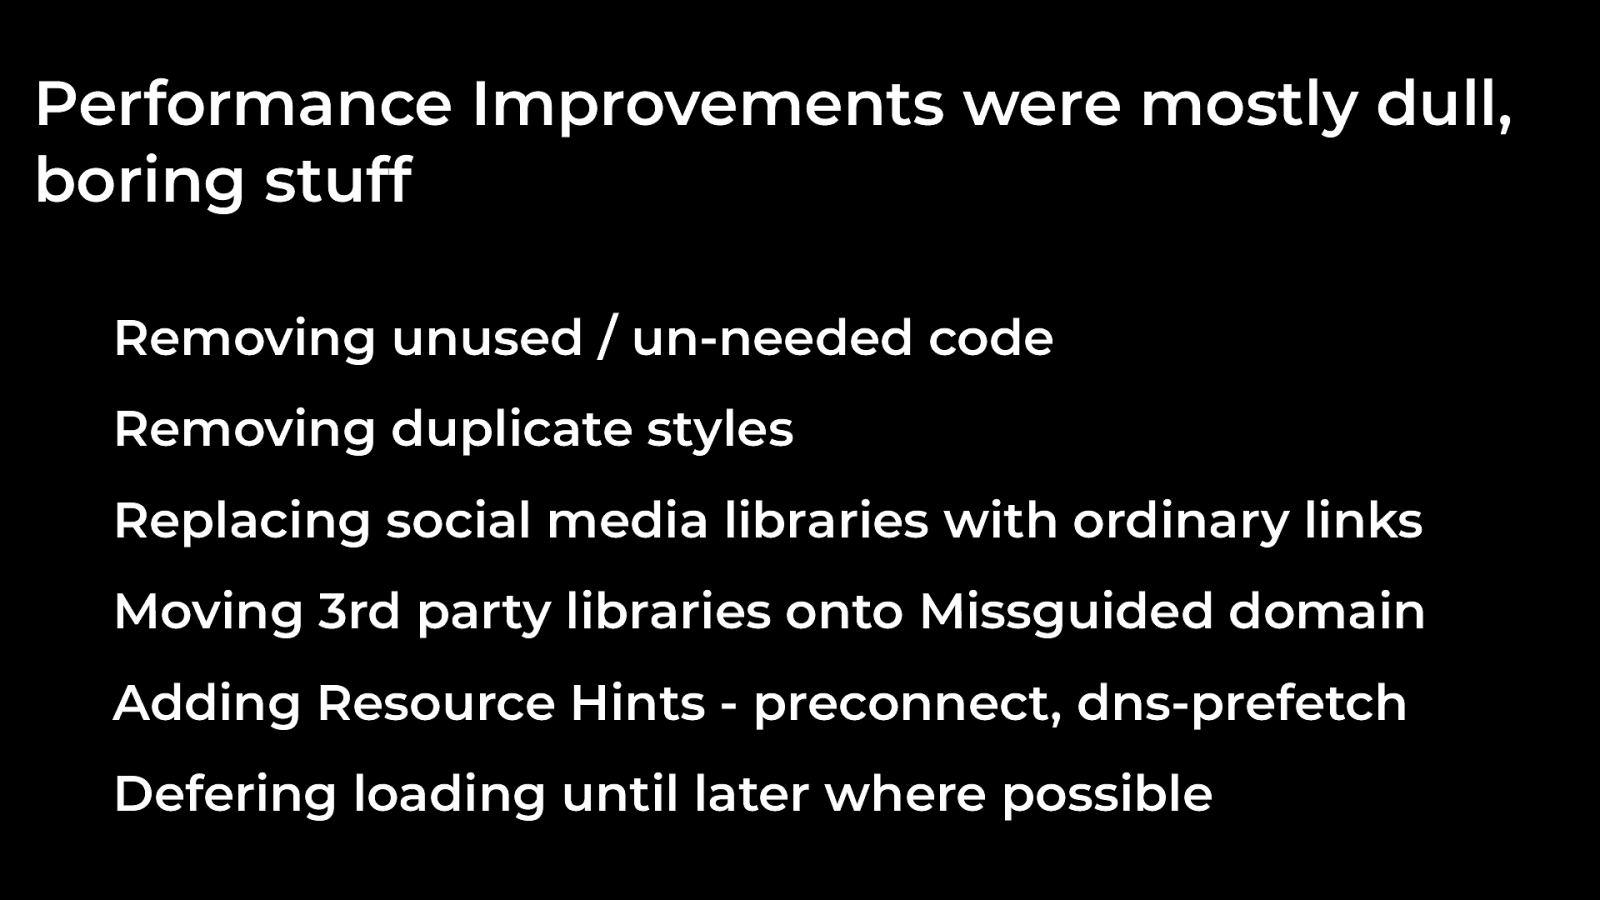
Performance Improvements were mostly dull, boring stuff Removing unused / un-needed code Removing duplicate styles Replacing social media libraries with ordinary links Moving 3rd party libraries onto Missguided domain Adding Resource Hints - preconnect, dns-prefetch Defering loading until later where possible
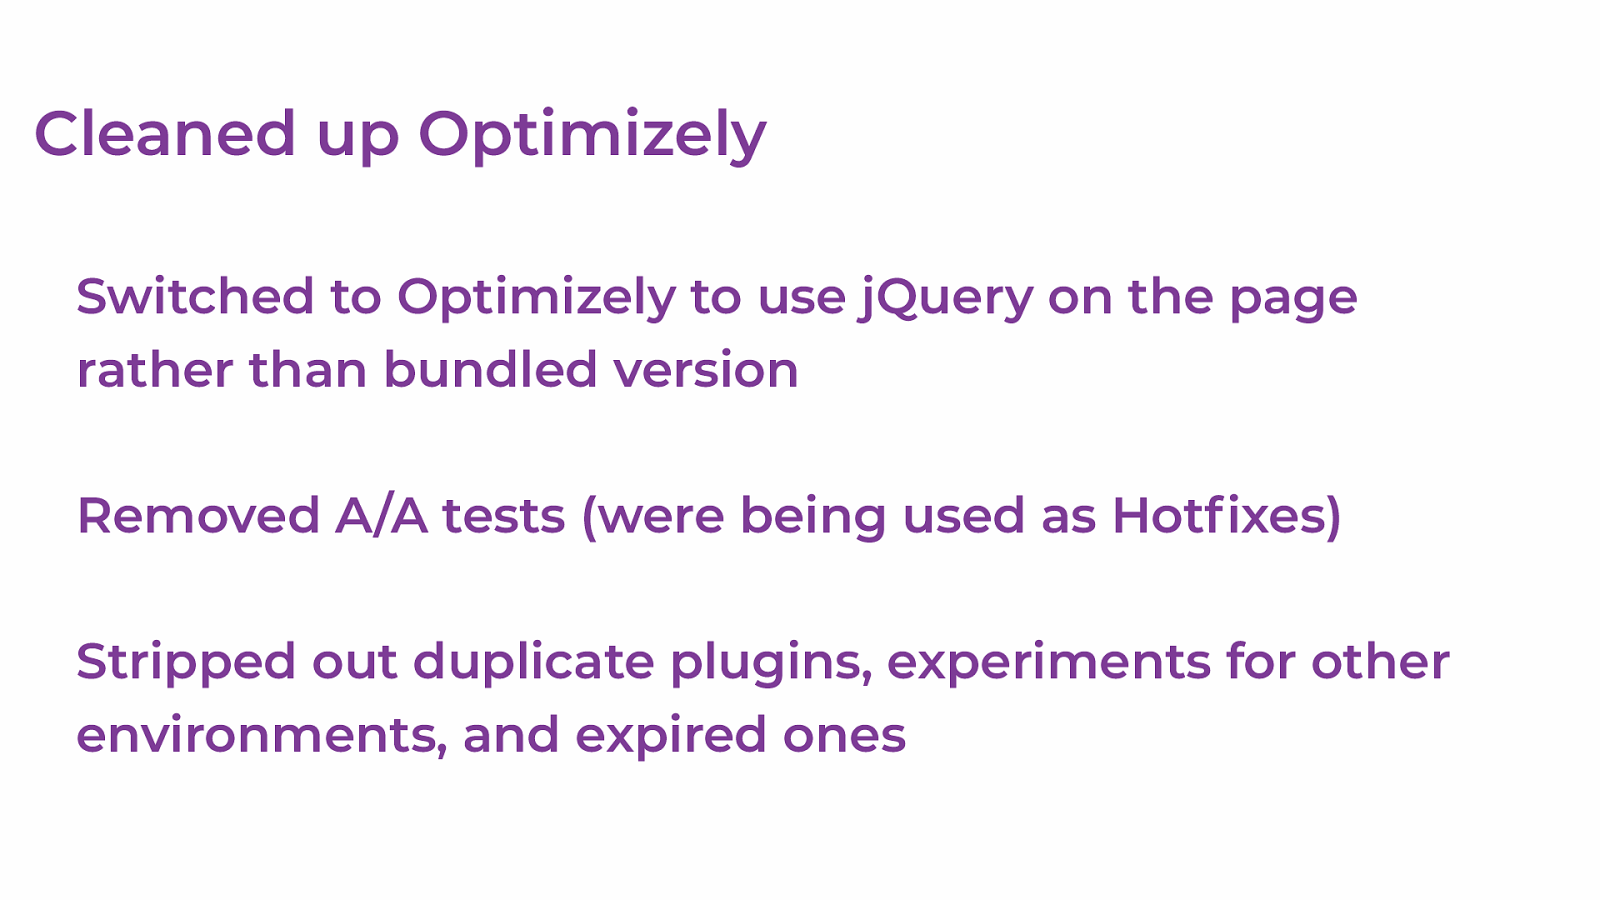
Cleaned up Optimizely Switched to Optimizely to use jQuery on the page rather than bundled version Removed A/A tests (were being used as Hotfixes) Stripped out duplicate plugins, experiments for other environments, and expired ones
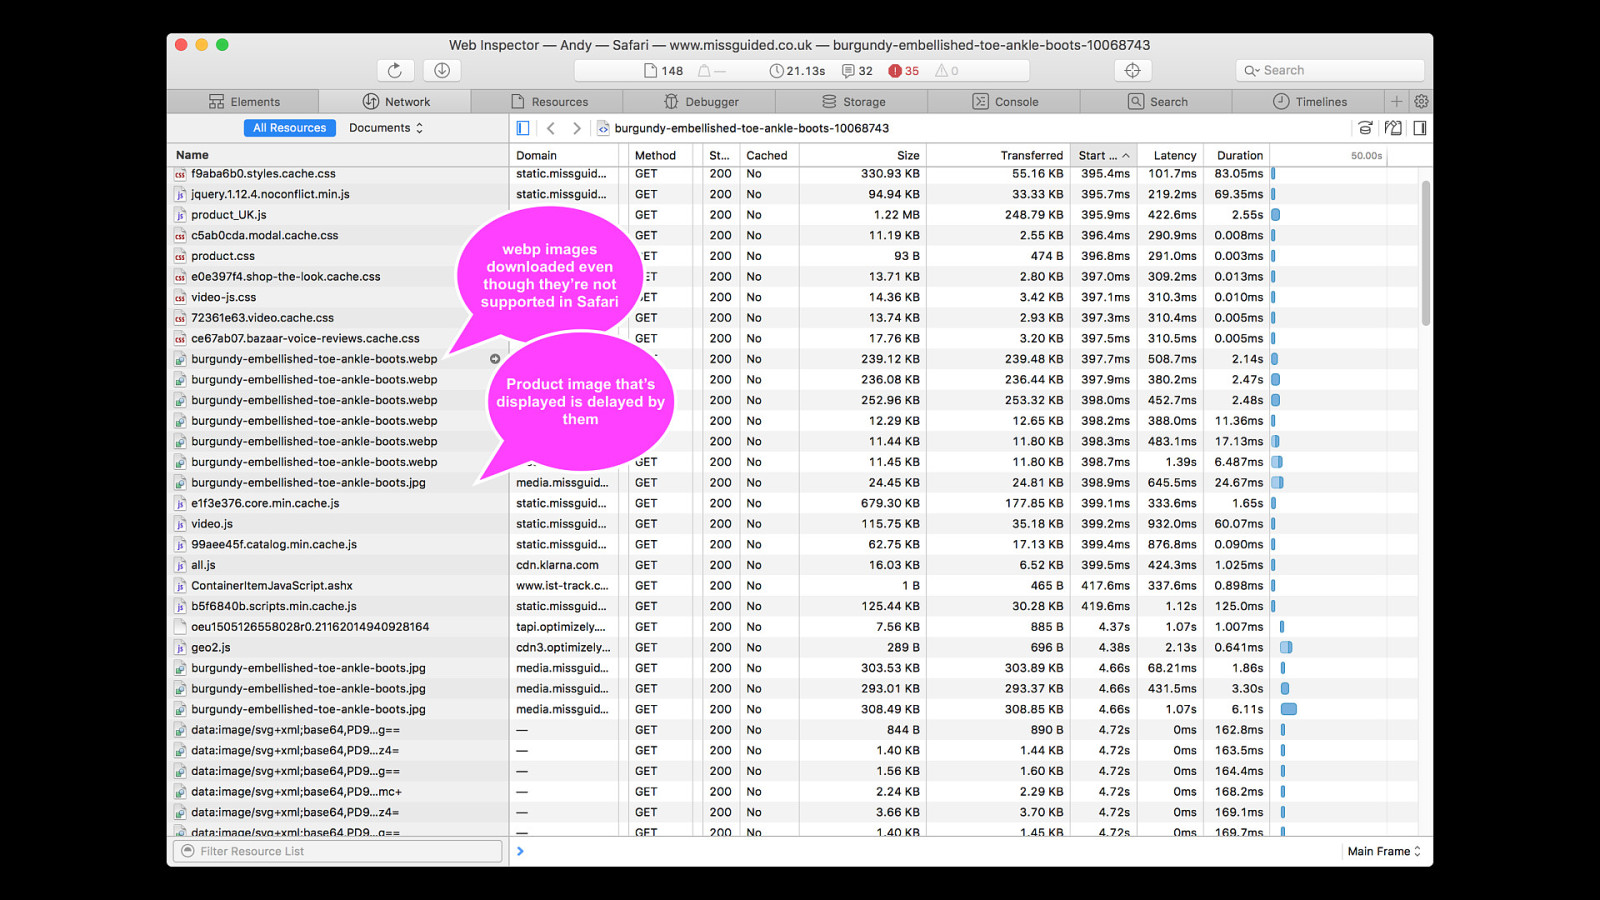
https://www.flickr.com/photos/derekbruff/9759290413 There were a few bumps along the way
"foo.webp"
<source type = "image/jp2""foo.jp2"
"foo.jpg"
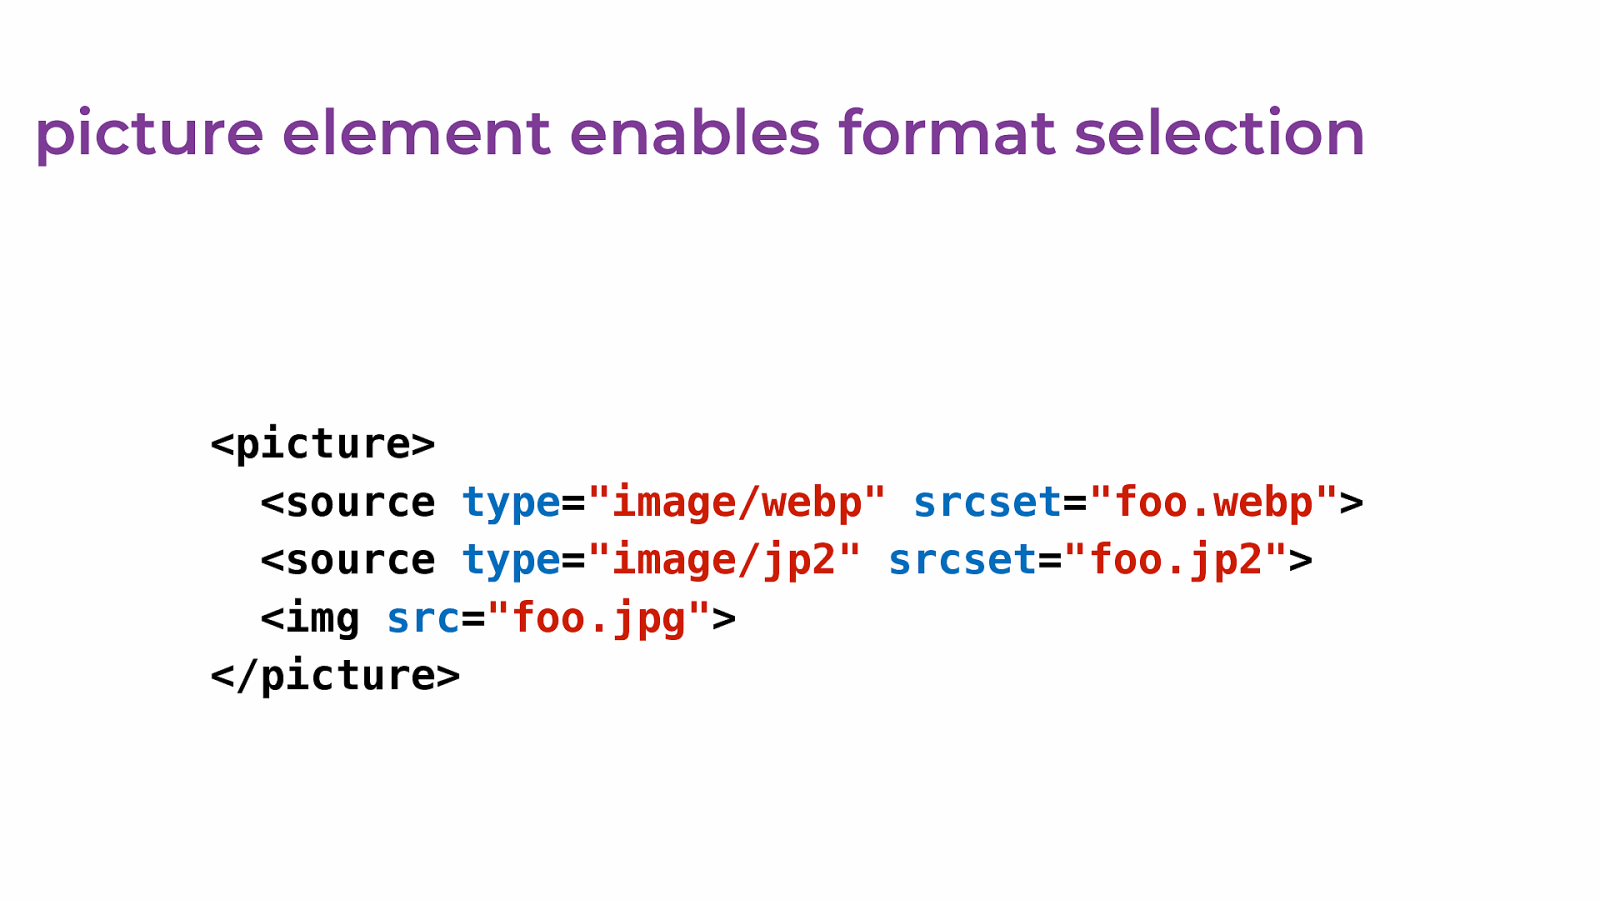
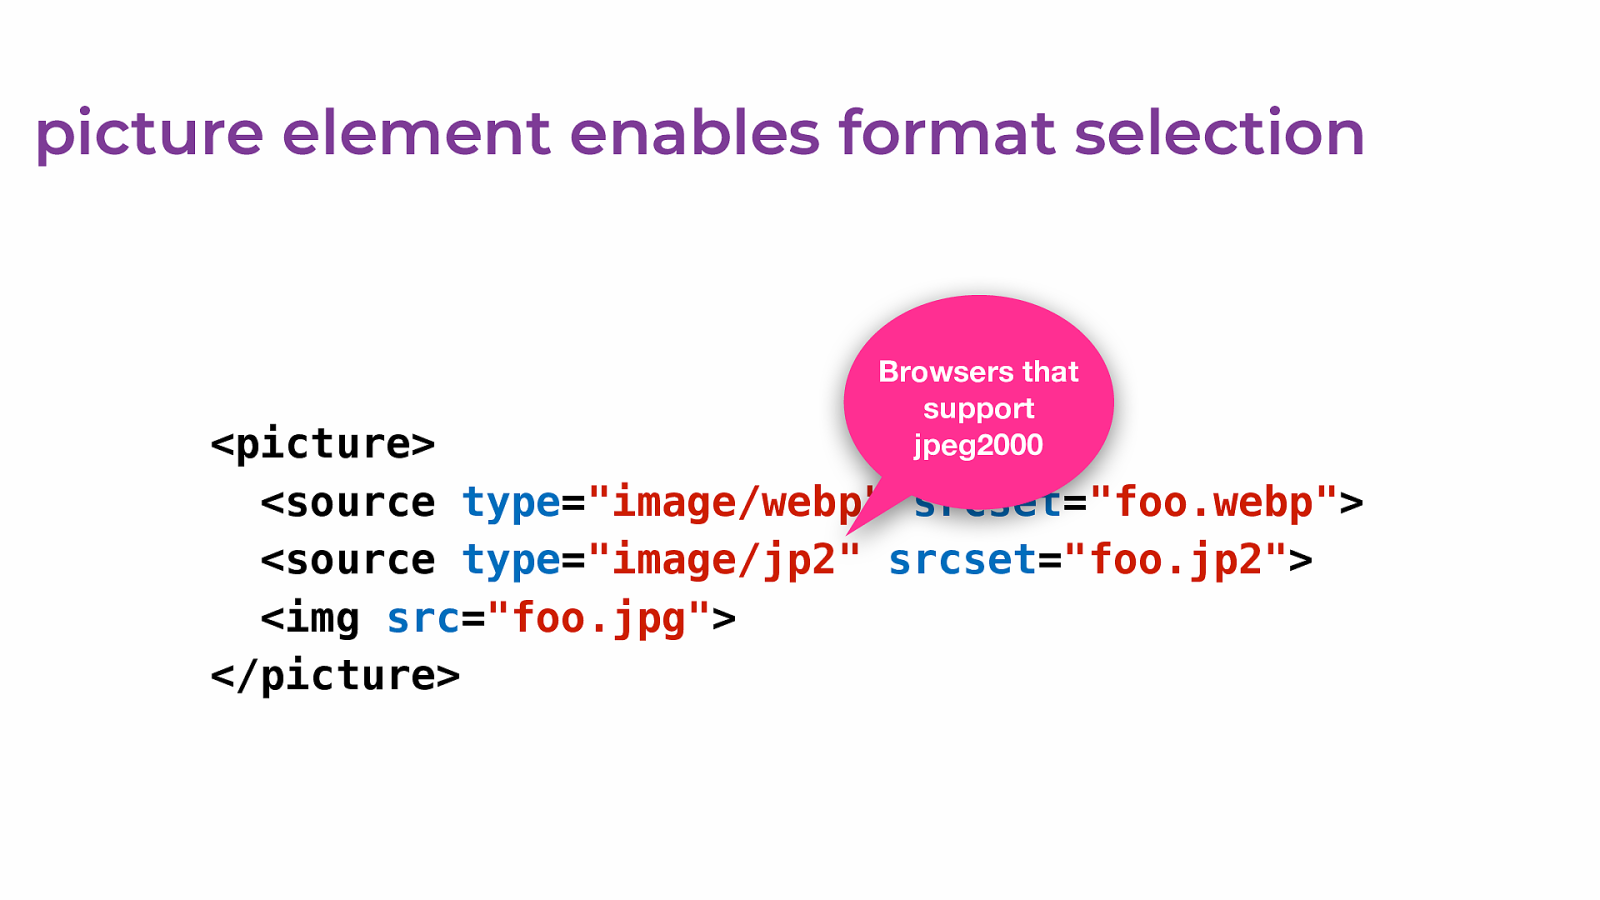
</picture> picture element enables format selection"foo.webp"
<source type = "image/jp2""foo.jp2"
"foo.jpg"
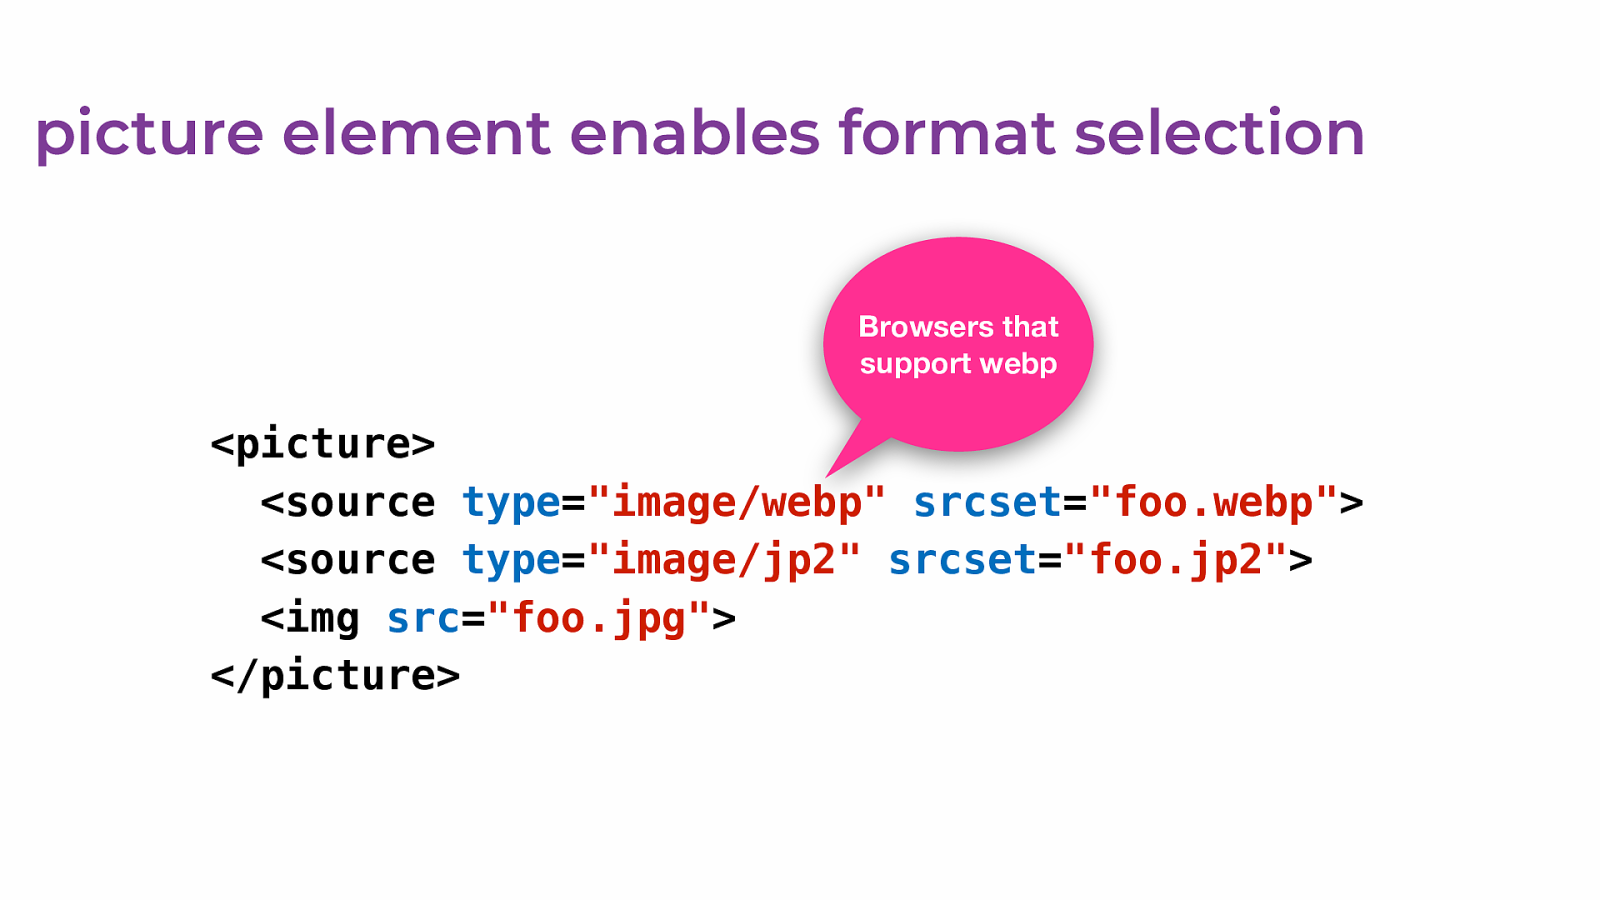
</picture> picture element enables format selection Browsers that support webp"foo.webp"
<source type = "image/jp2""foo.jp2"
"foo.jpg"
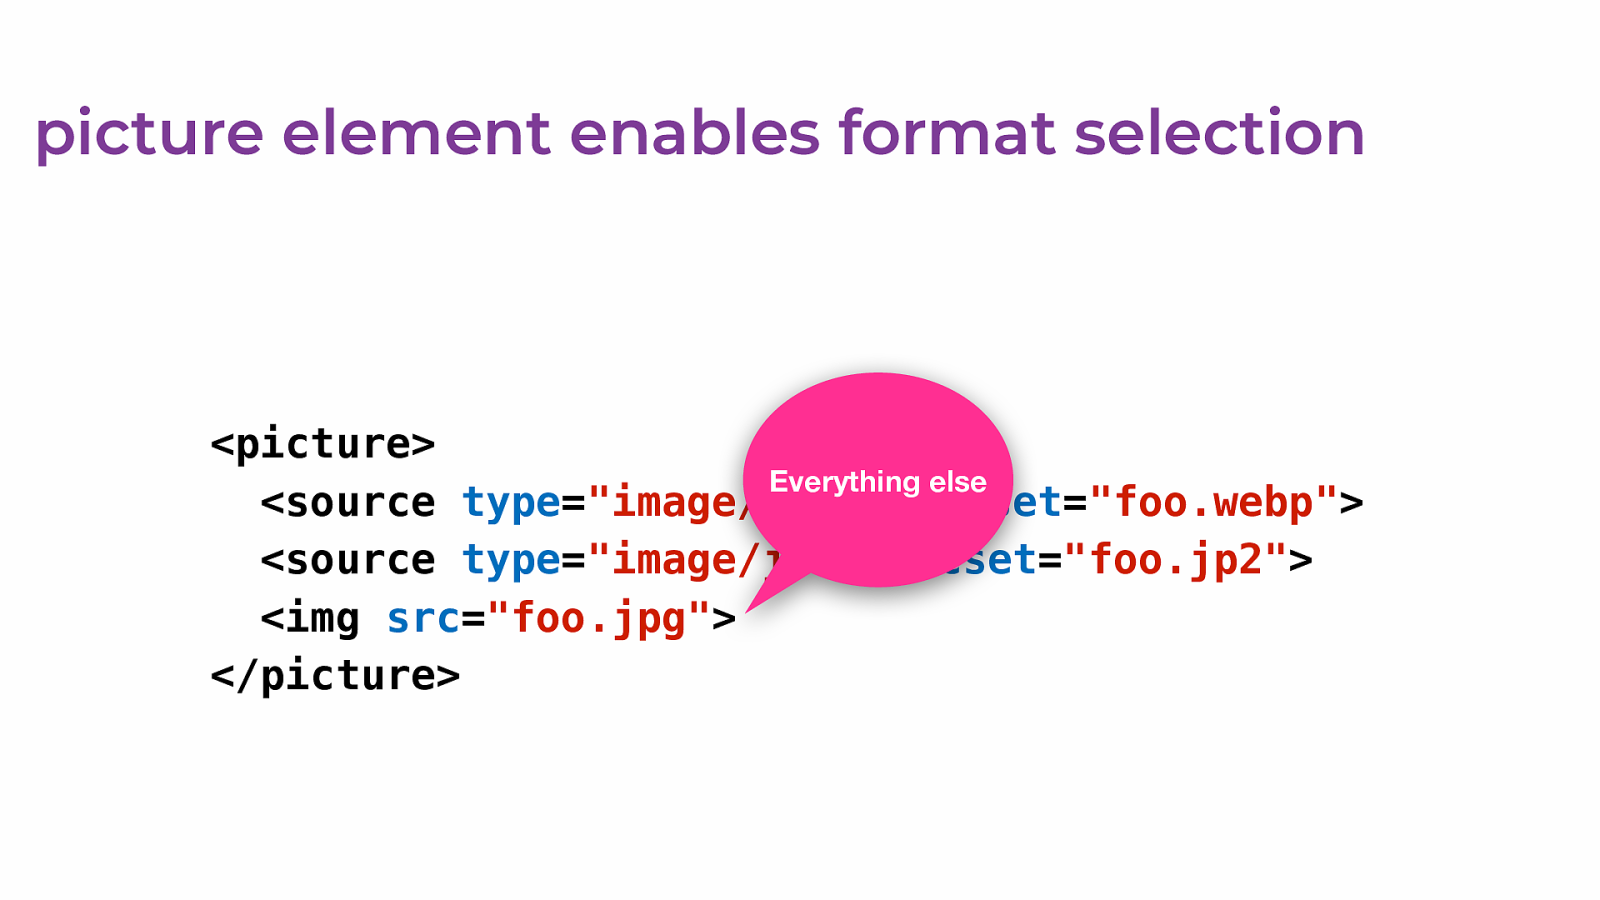
</picture> picture element enables format selection Browsers that support jpeg2000"foo.webp"
<source type = "image/jp2""foo.jp2"
"foo.jpg"
</picture> picture element enables format selection Everything elsehttps://bugs.webkit.org/show_bug.cgi?id=179231
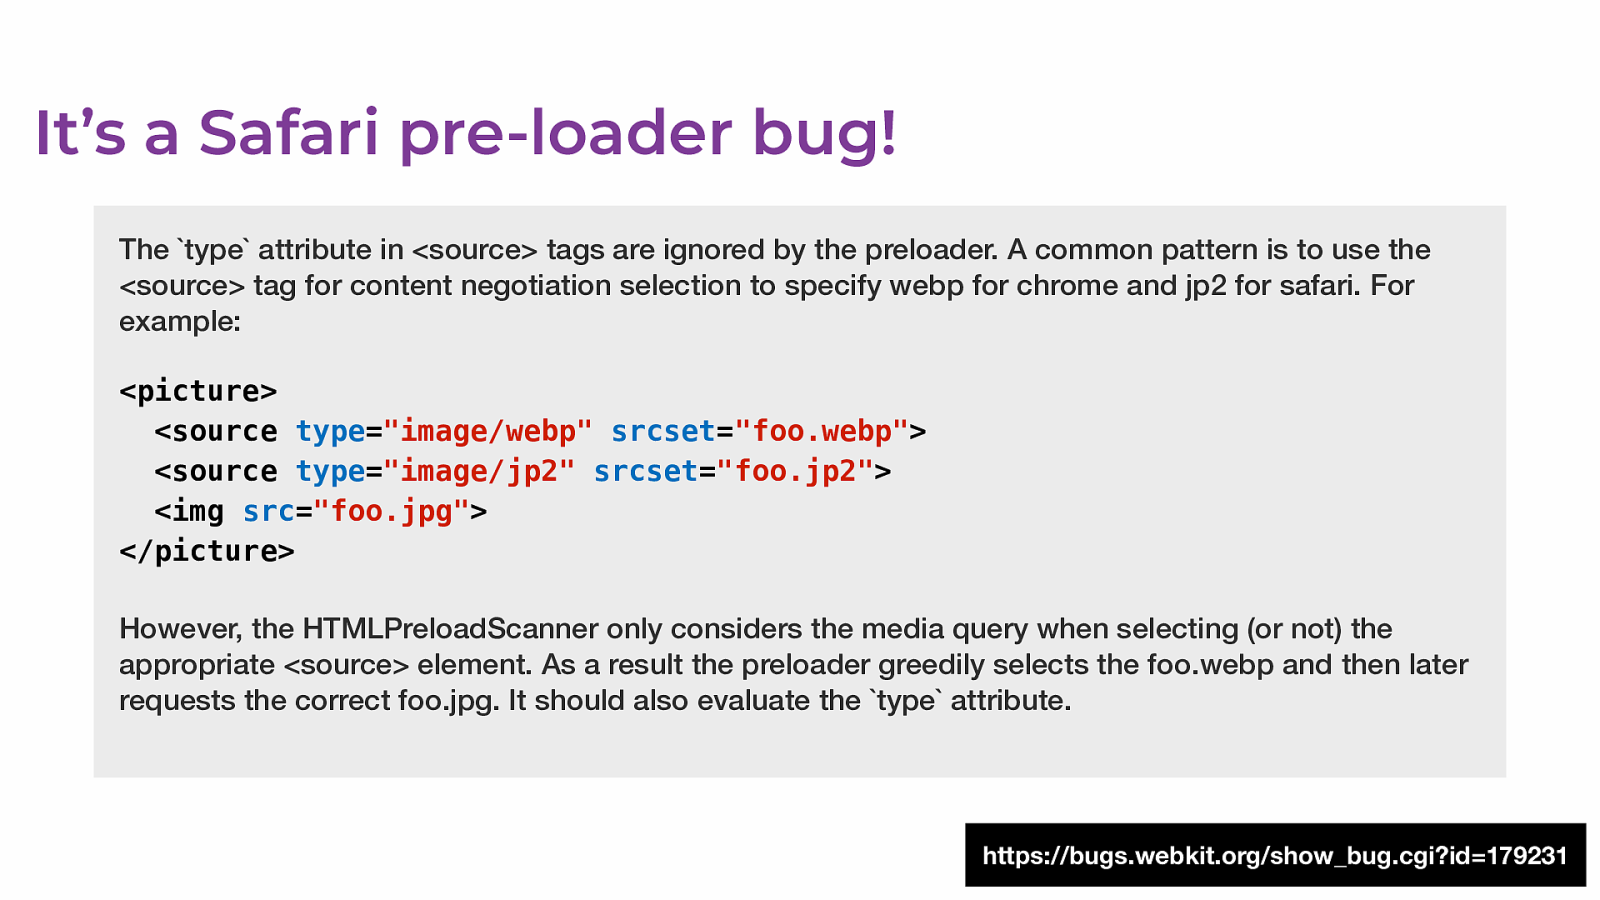
It’s a Safari pre-loader bug!
The type attribute in <source> tags are ignored by the preloader. A common pattern is to use the
"foo.webp"
<source type = "image/jp2""foo.jp2"
"foo.jpg"
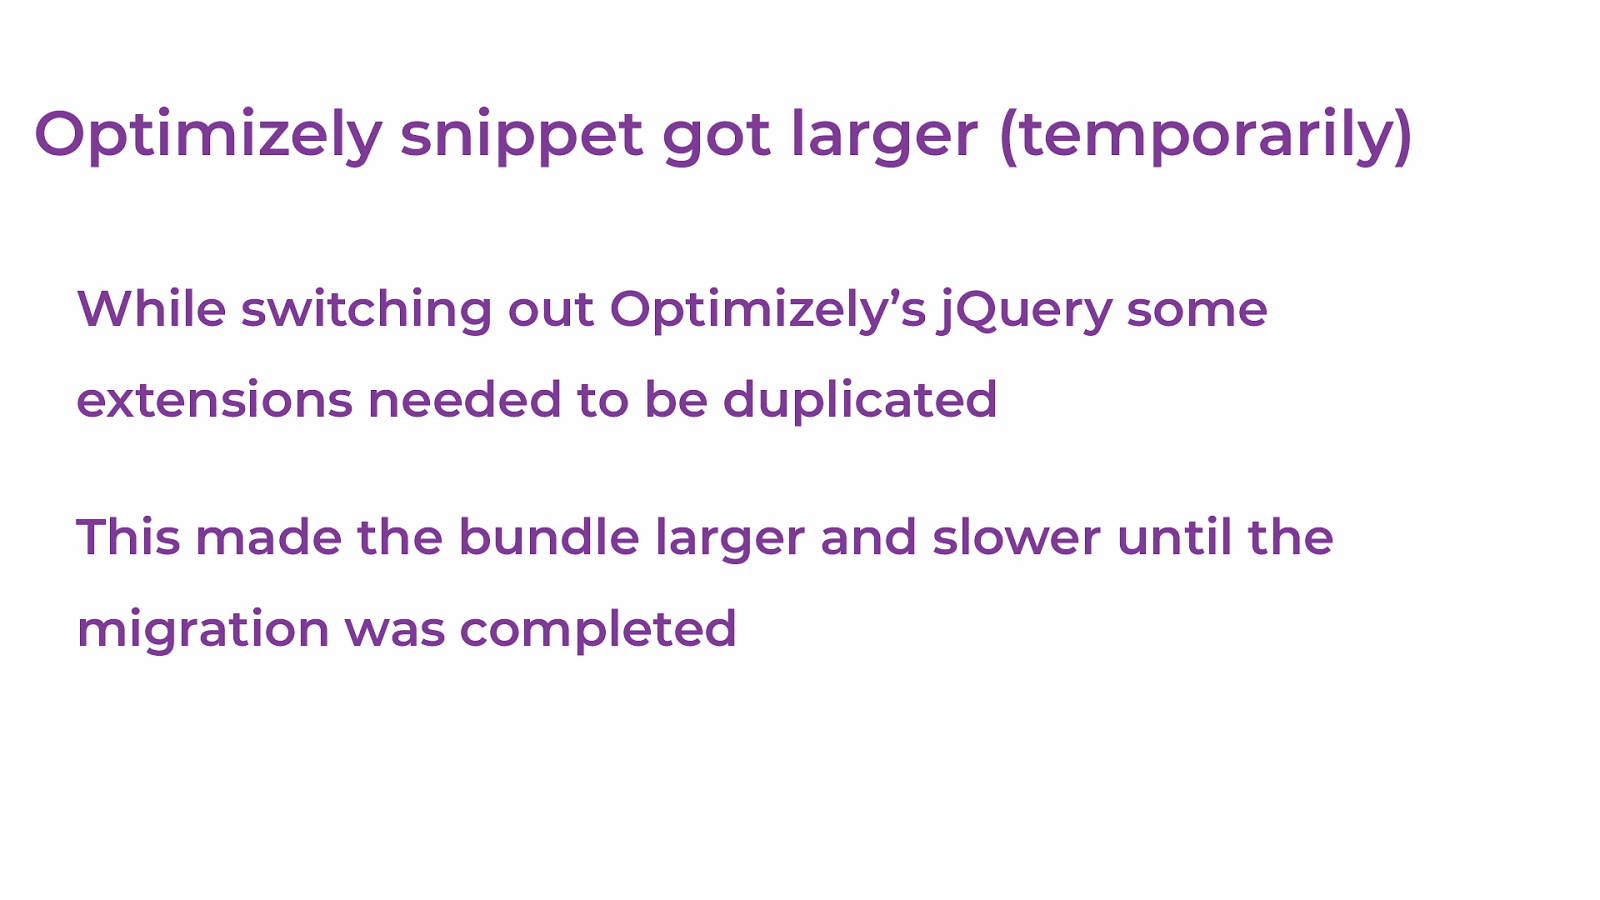
</picture> However, the HTMLPreloadScanner only considers the media query when selecting (or not) the appropriate <source> element. As a result the preloader greedily selects the foo.webp and then later requests the correct foo.jpg. It should also evaluate the `type` attribute.Optimizely snippet got larger (temporarily) While switching out Optimizely’s jQuery some extensions needed to be duplicated This made the bundle larger and slower until the migration was completed
So where are we now?
April 2017 Android Median iOS Median
June 2017 Android Median iOS Median
August 2017 Android Median iOS Median
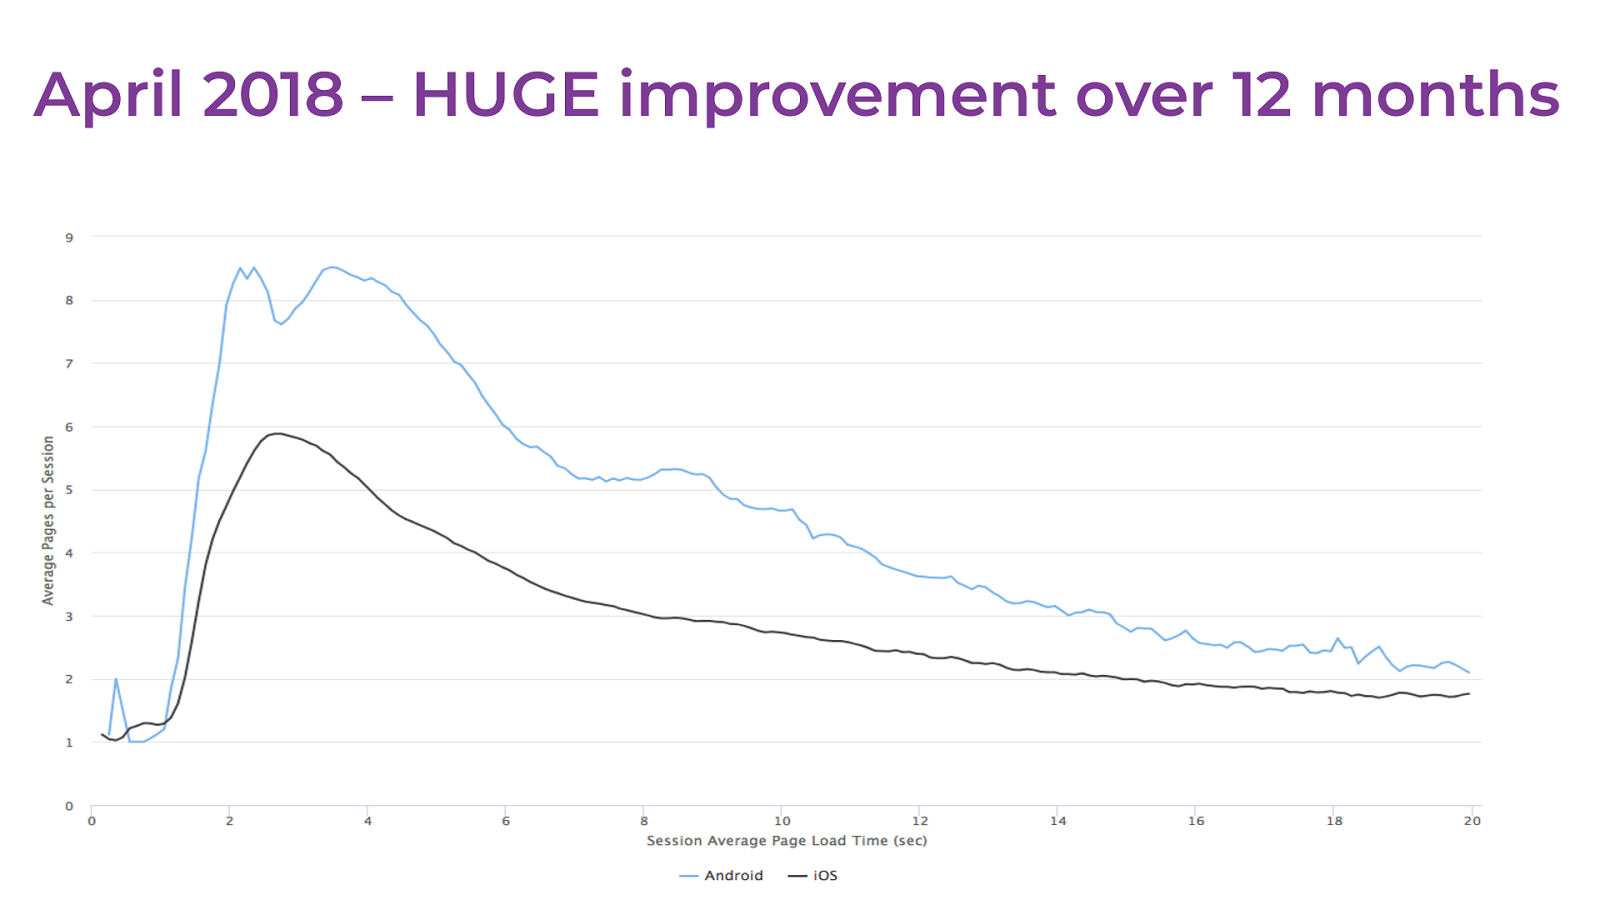
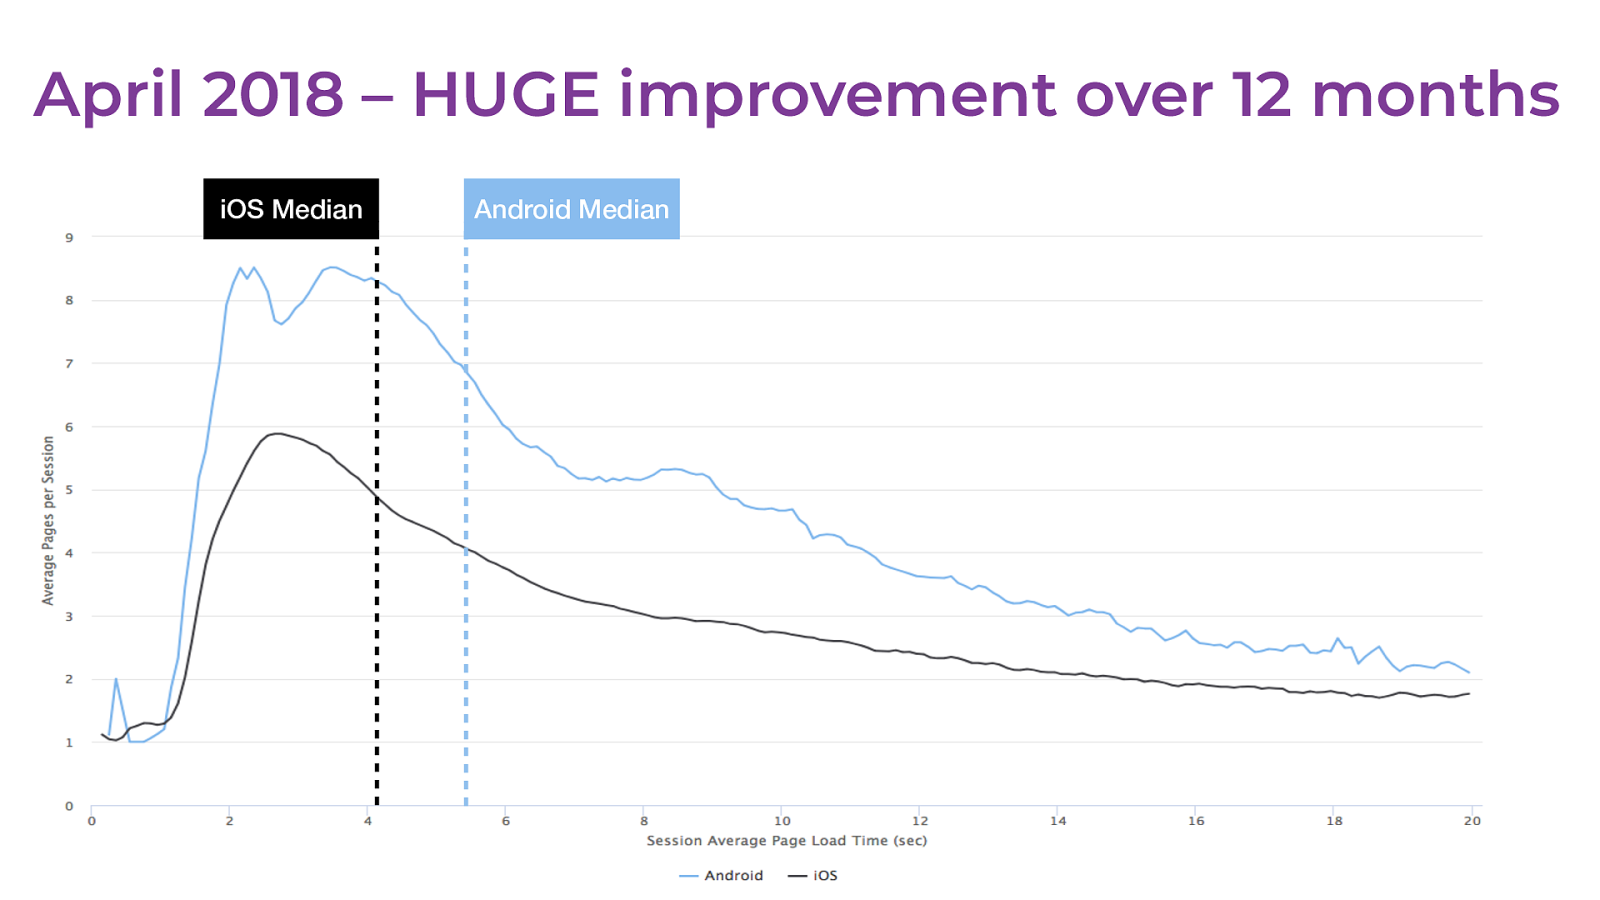
April 2018 – HUGE improvement over 12 months
April 2018 – HUGE improvement over 12 months Android Median iOS Median
What did we learn?
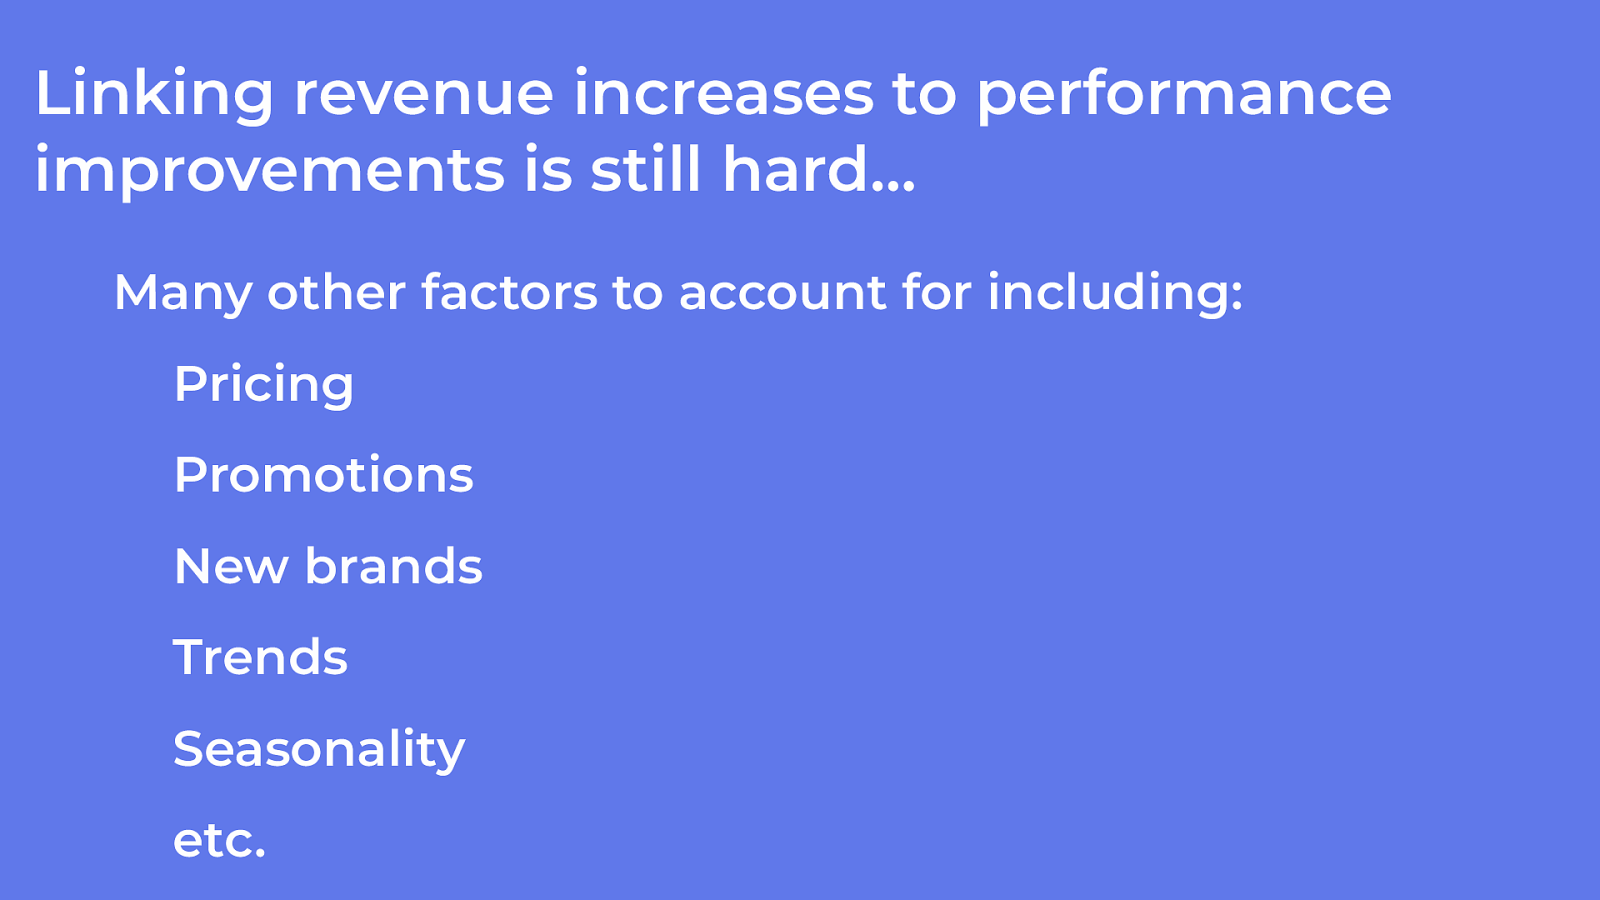
Linking revenue increases to performance improvements is still hard… Many other factors to account for including: Pricing Promotions New brands Trends Seasonality etc.
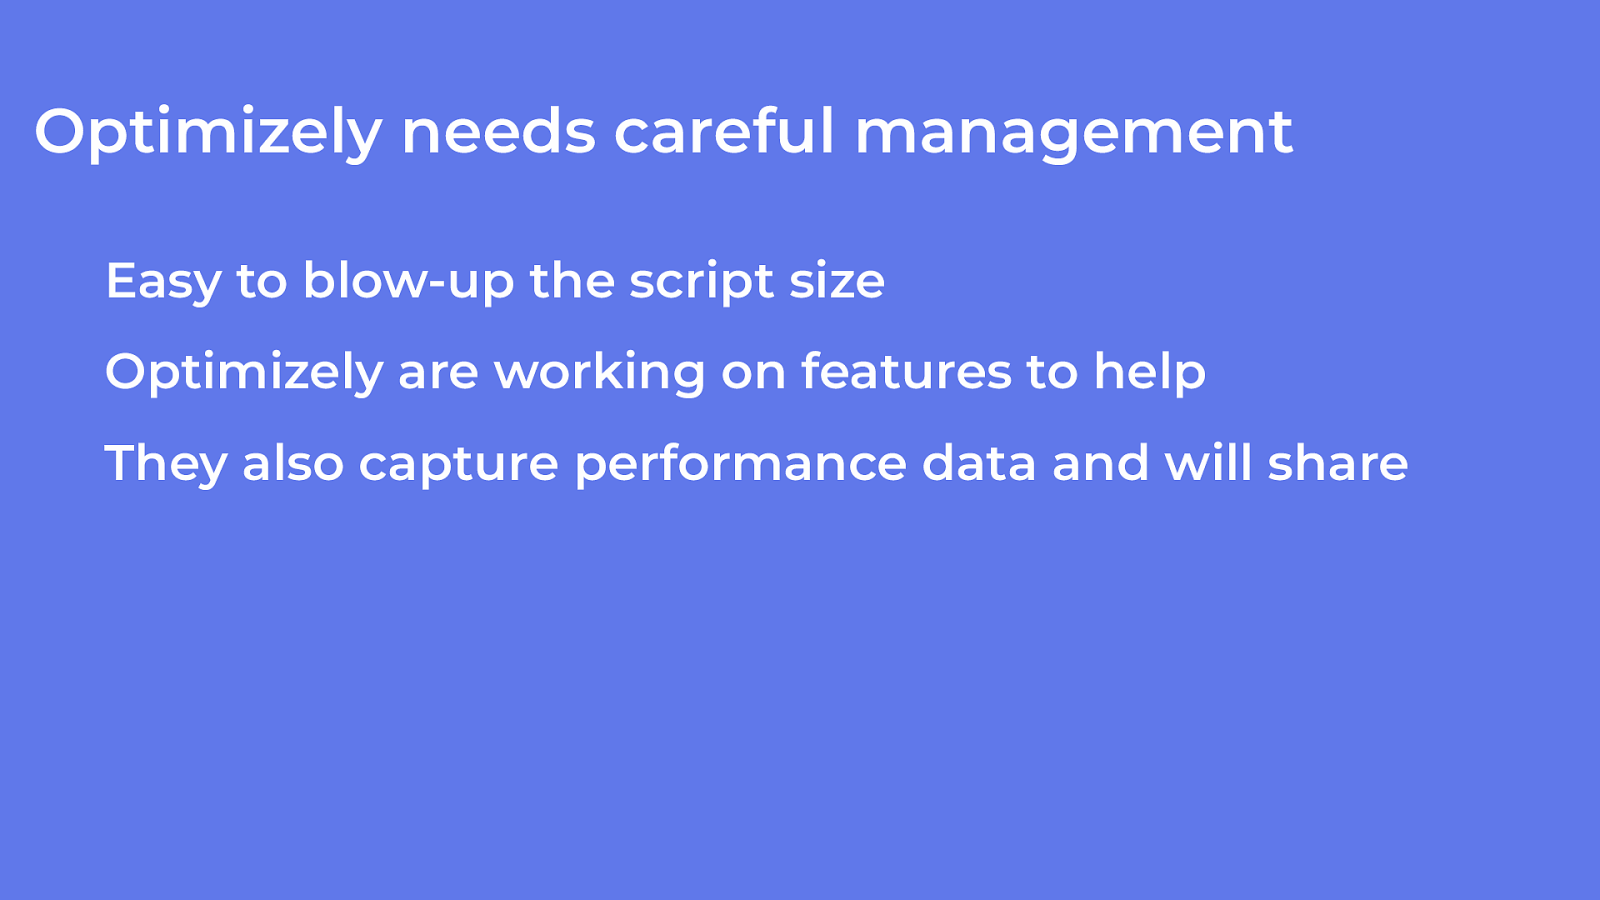
Optimizely needs careful management Easy to blow-up the script size Optimizely are working on features to help They also capture performance data and will share
Perseverance Pays
Where next?
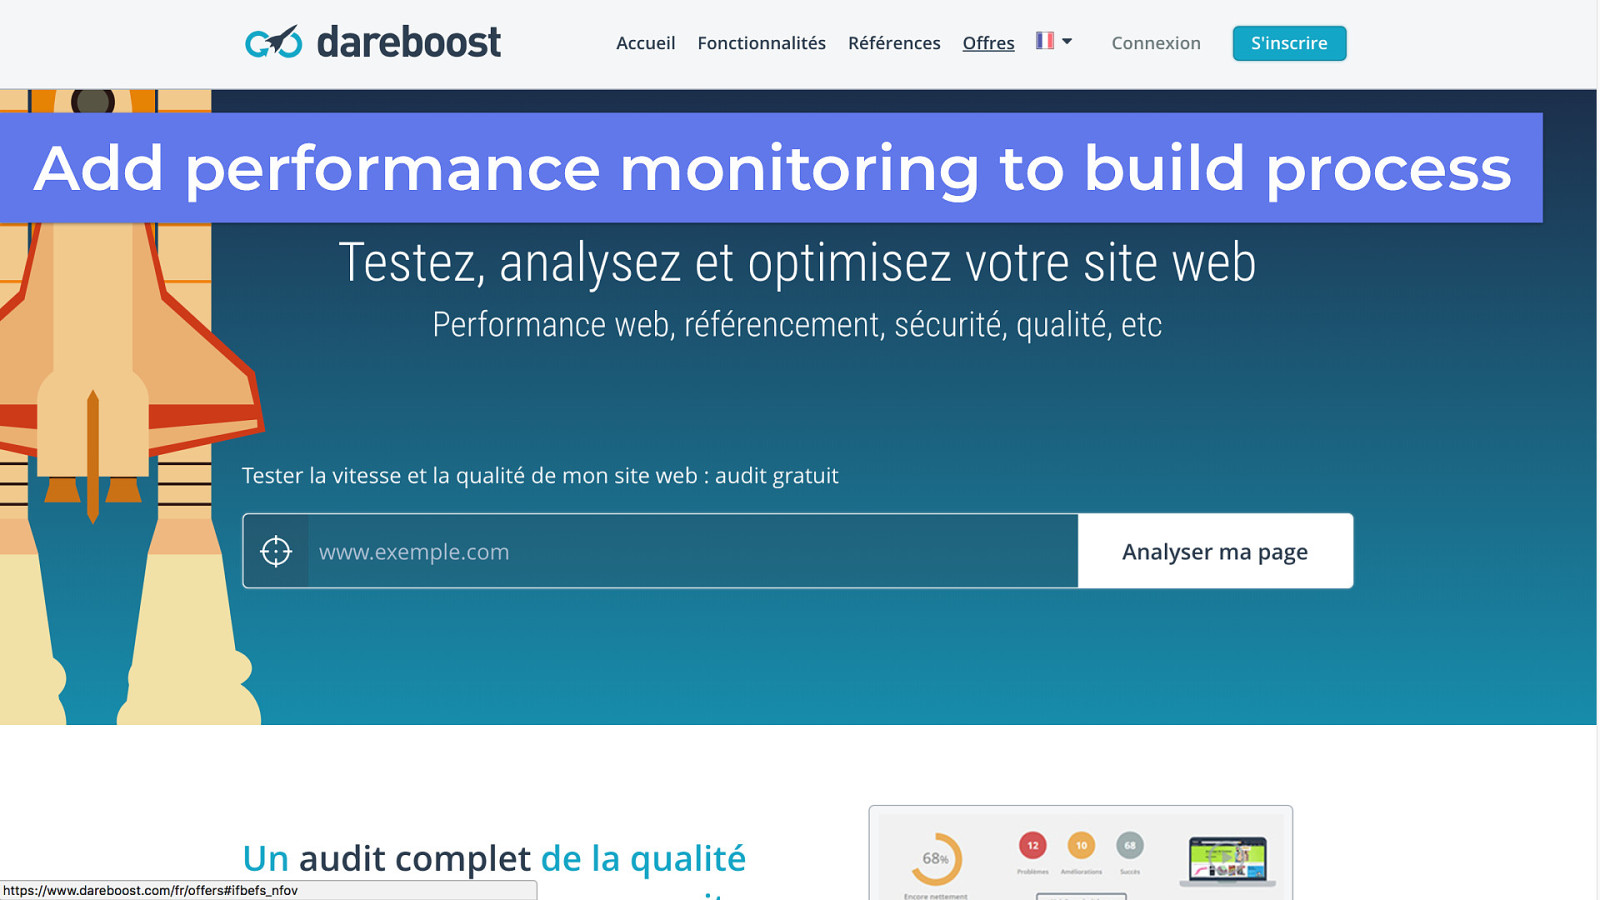
Add performance monitoring to build process
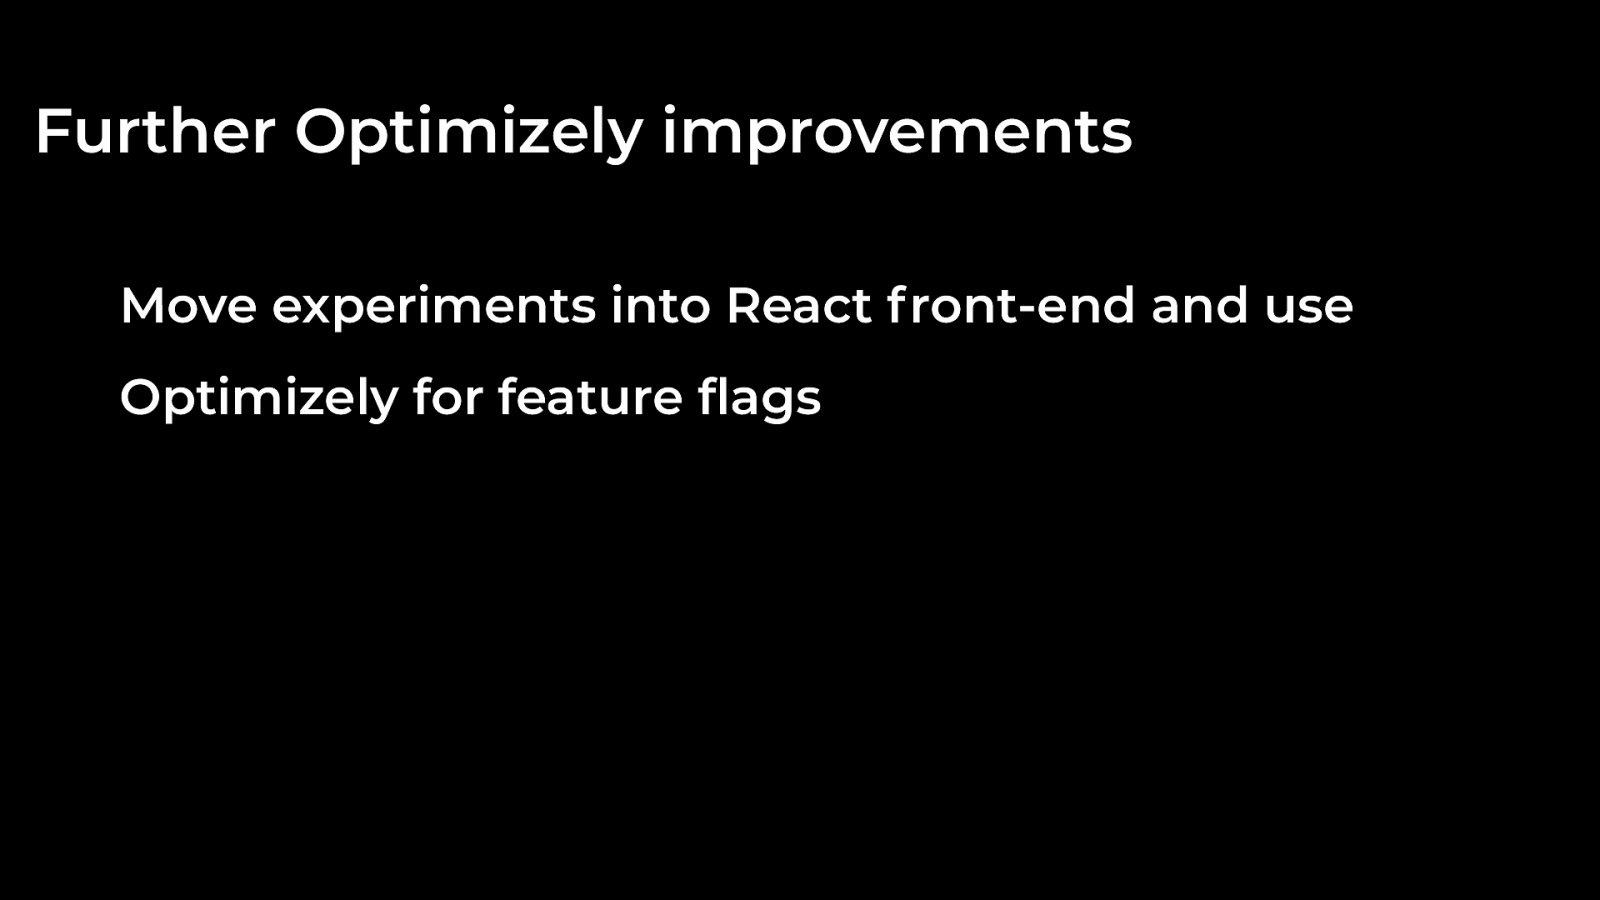
Further Optimizely improvements Move experiments into React f ront-end and use Optimizely for feature flags
Did we make it to 3 seconds?
Over May bank holiday weekend median was just above 3.5s
Thank You! https://www.slideshare.net/andydavies

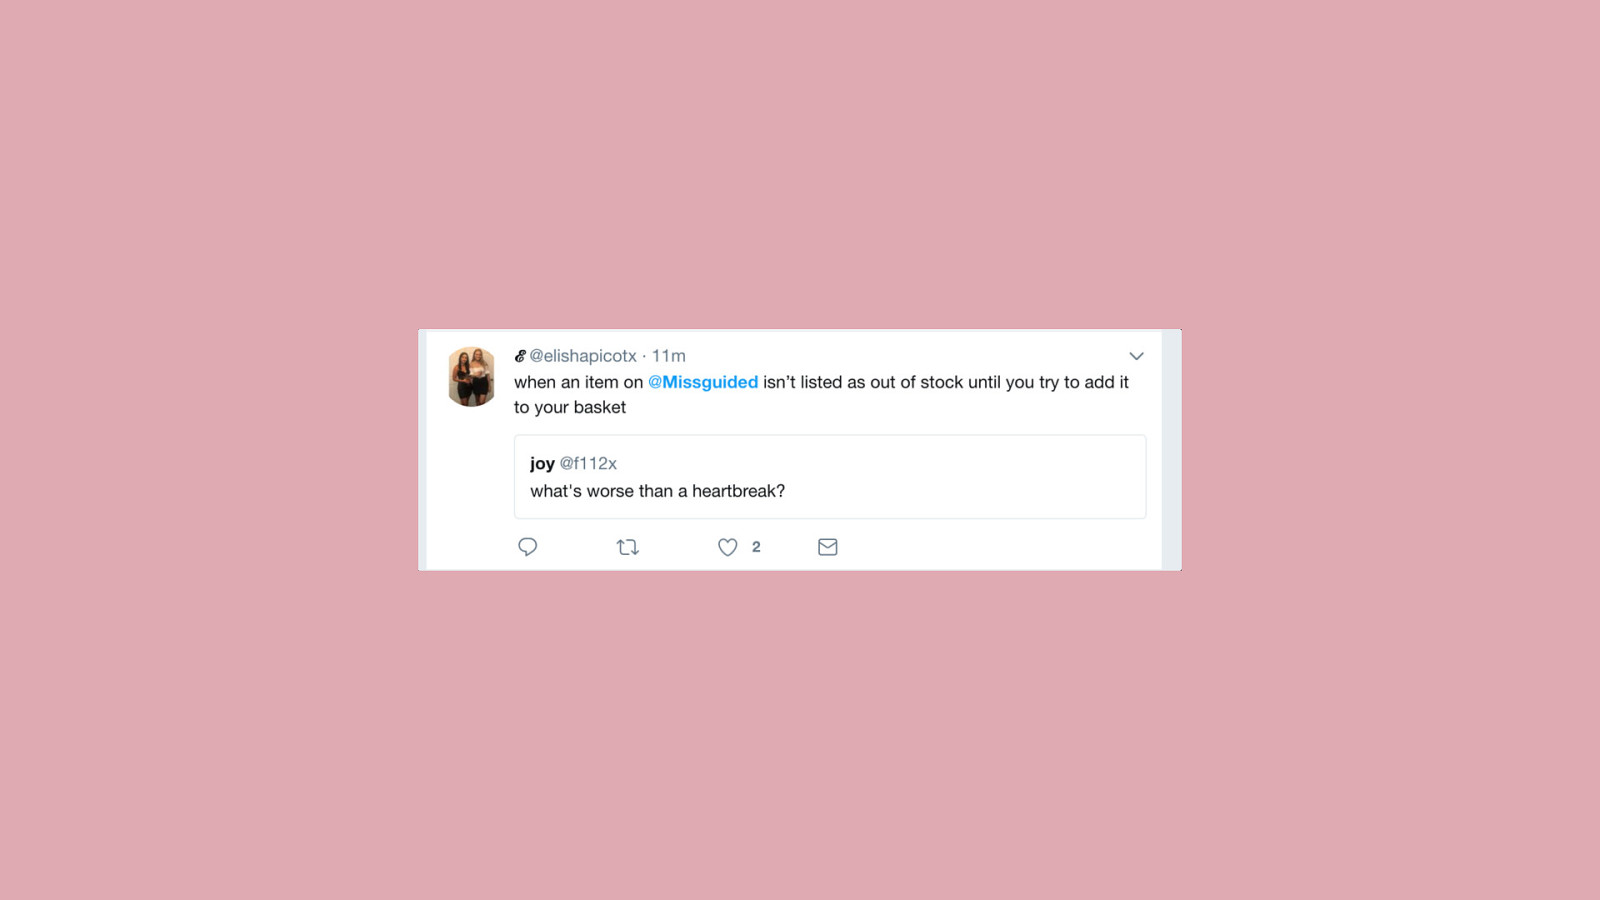
Missguided are one of the UK's most innovative and fast-moving fashion retailers but as with many other retailers, web performance hasn't always been our highest priority.
In summer 2017 we started to make performance improvements and as a result, Android revenue increased significantly. Spurred on by this success we created a dedicated performance team and embarked on a journey to dramatically improve performance right across the site. All sites evolve over time and ours was no different, there was legacy code to be unpicked, new techniques to try and stakeholder needs to balance.
In this talk, we share some of the approaches we took, the challenges we faced and the lessons we learned. We'll also talk about the performance and revenue gains, and as ultimately getting faster is about making customers happier, their reaction too.


 for free. You
can too.
for free. You
can too.