
A presentation at Voxxed Days Singapore in in Singapore by David Pilato
Monitor your microservices with Logs, Metrics, Pings et Traces David Pilato @dadoonet
Developer | Evangelist !
Disclaimer I’m building “Hello World” apps. But monitored apps.
https://github.com/xeraa/microservice-monitoring
Application
Showtime
Bonus
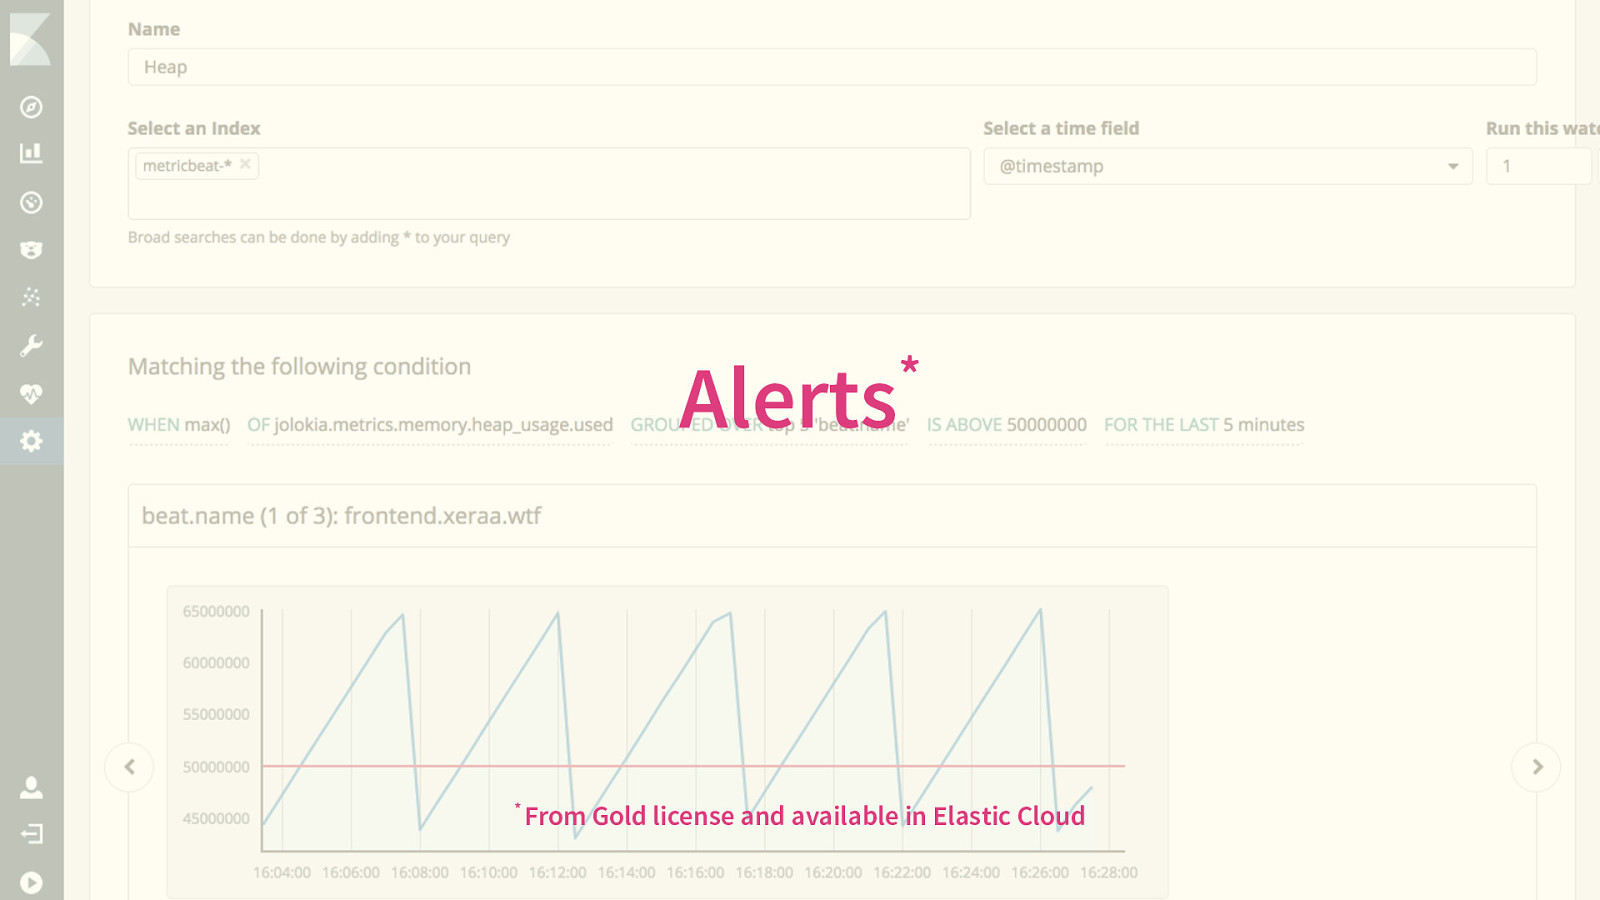
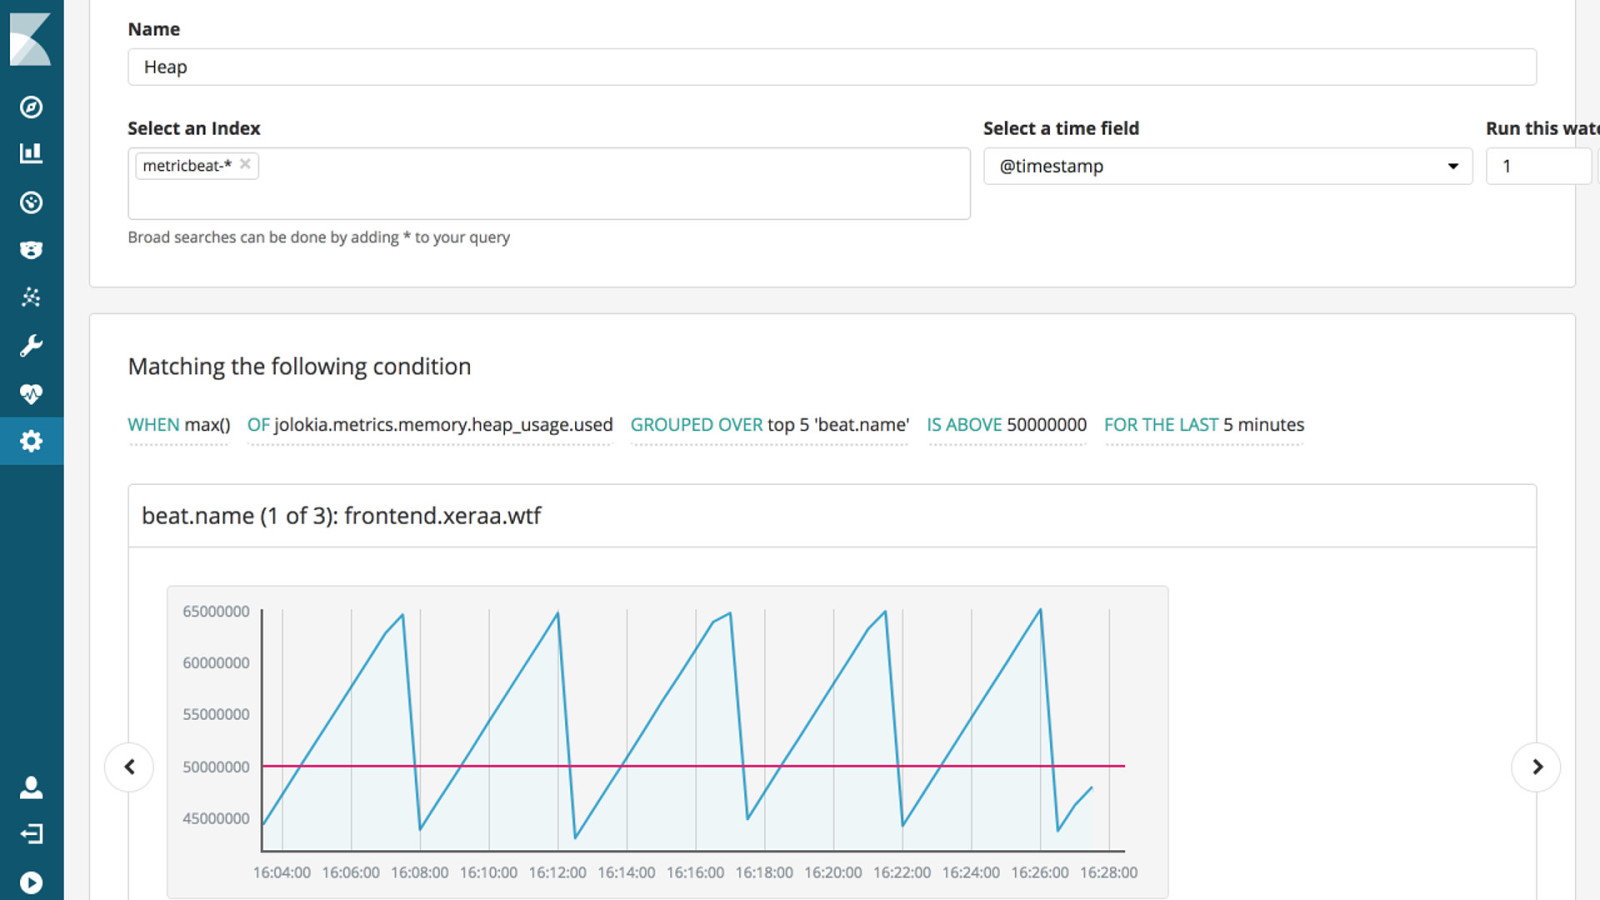
Alerts * From Gold license and available in Elastic Cloud
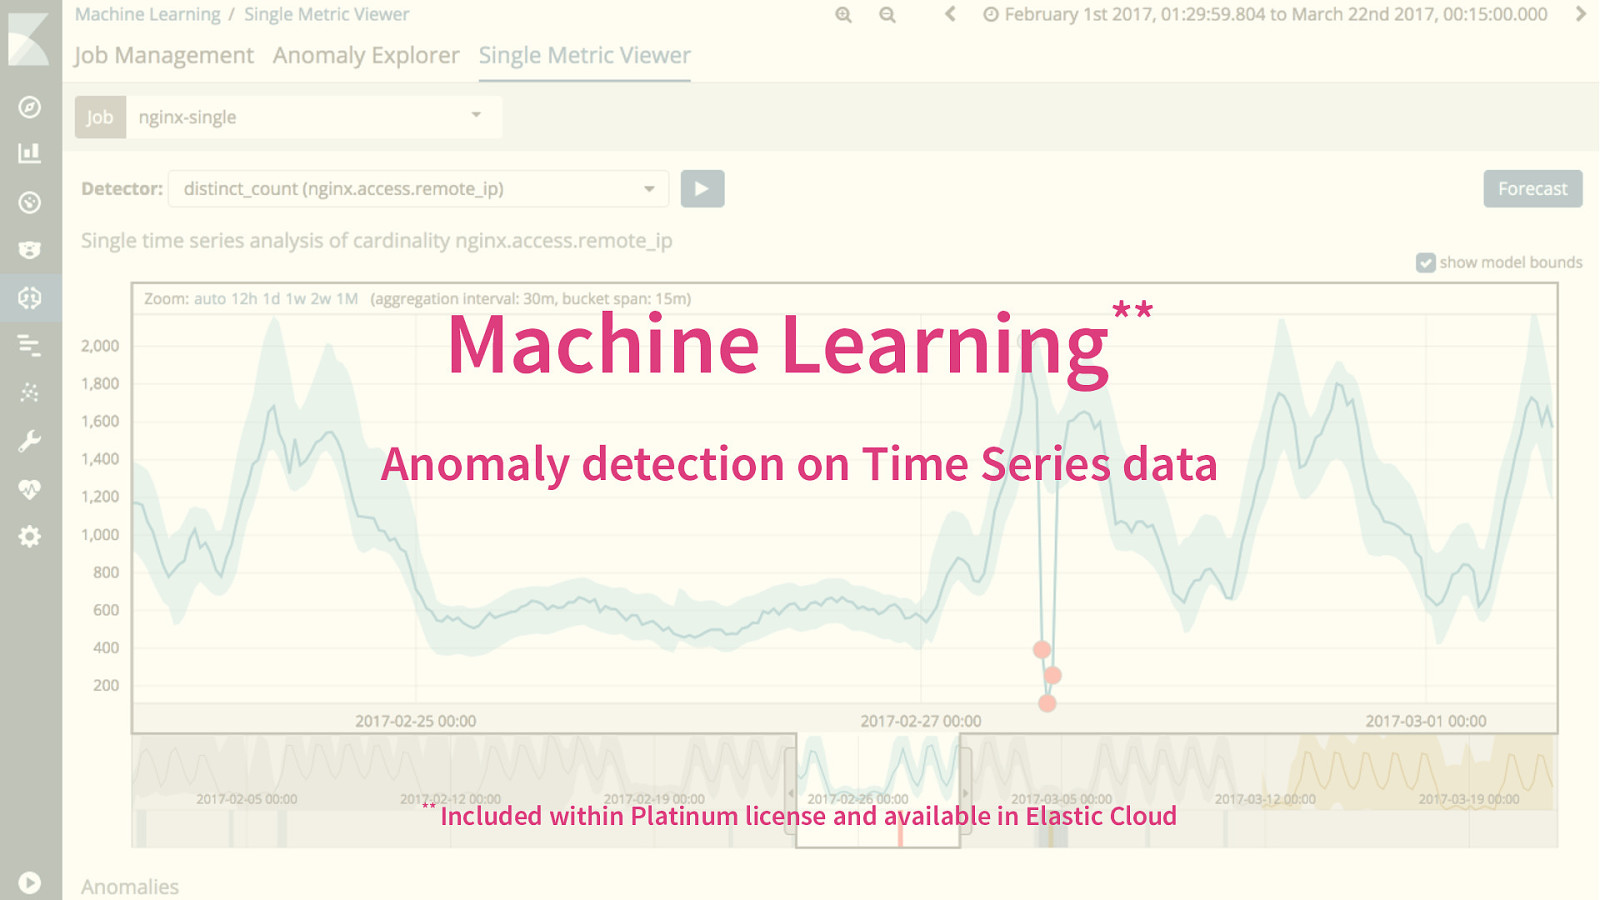
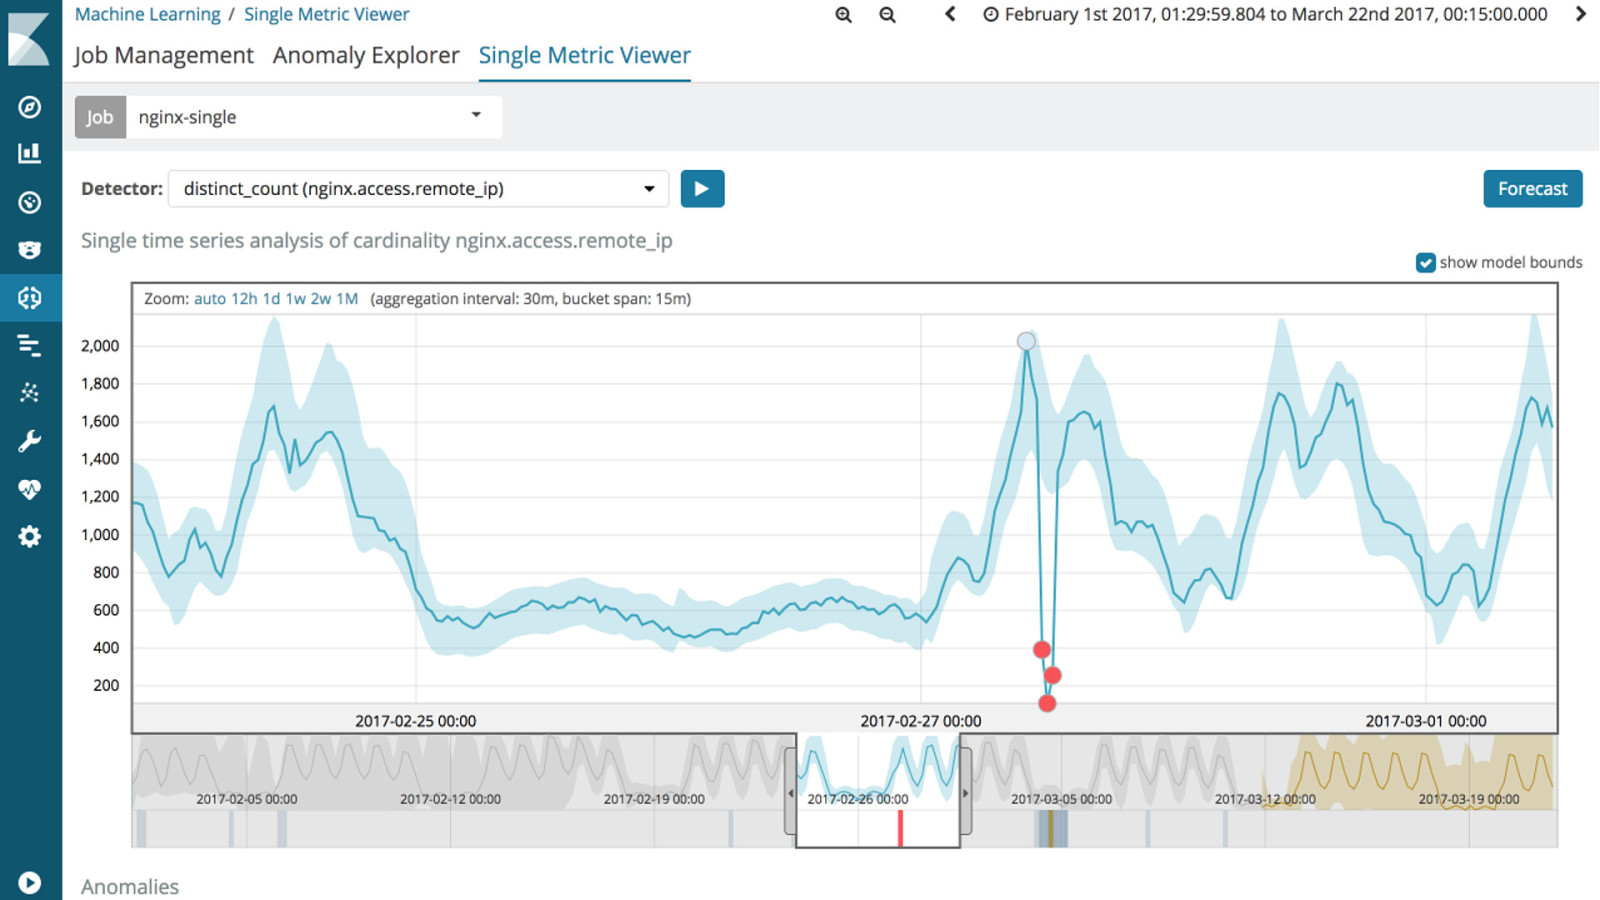
** Machine Learning Anomaly detection on Time Series data ** Included within Platinum license and available in Elastic Cloud
Conclusion
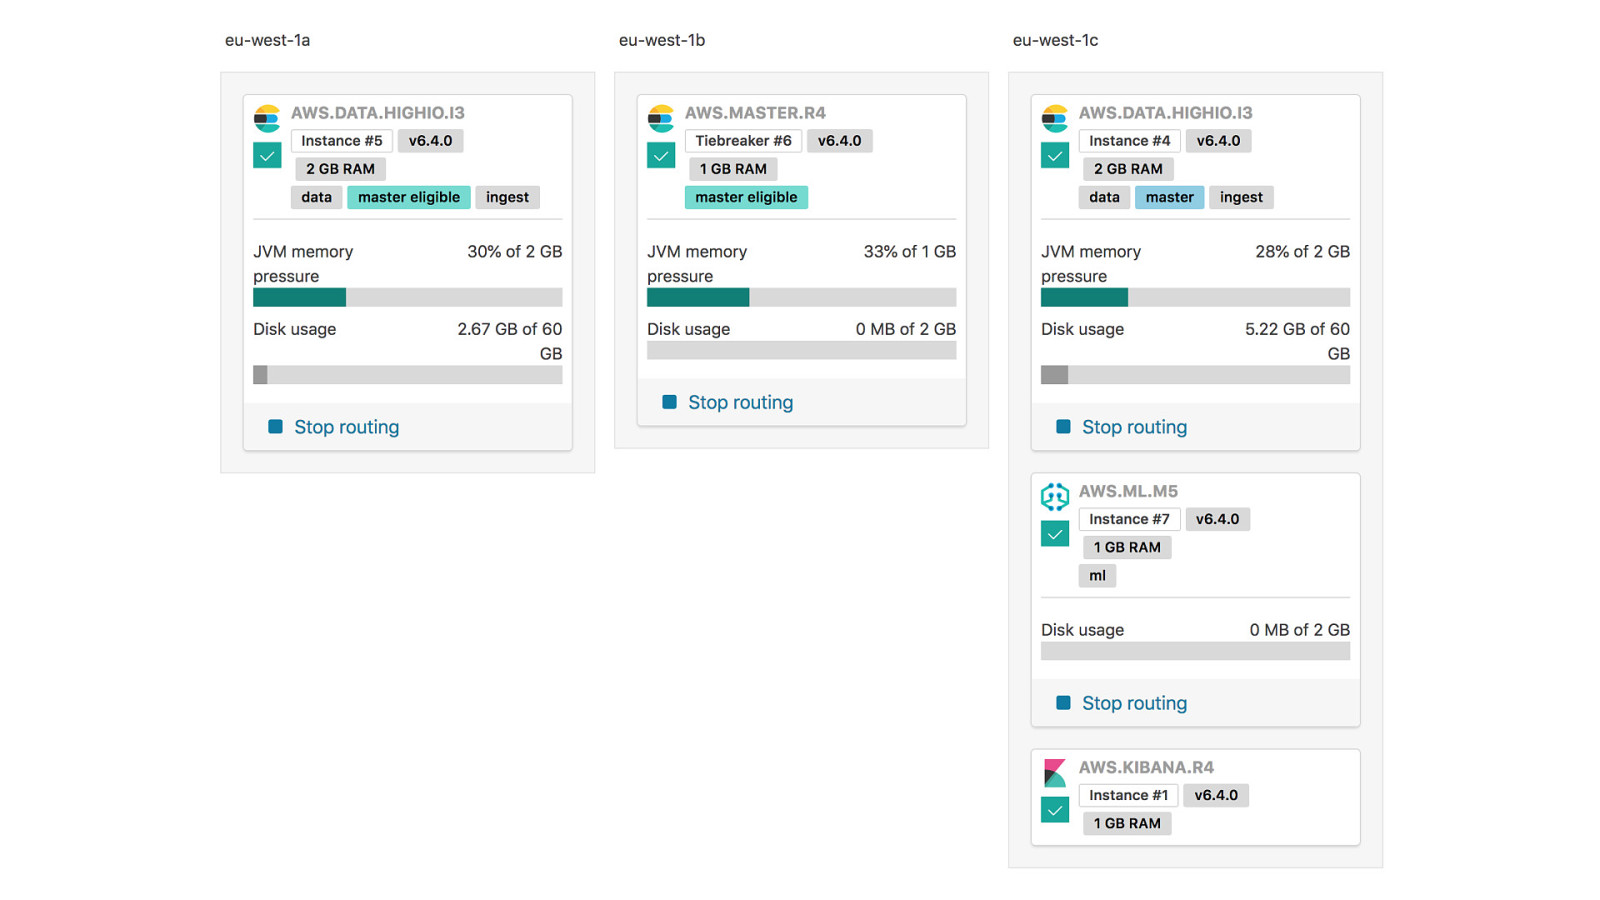
System and Network metrics Filebeat and Auditbeat modules Application logs
Uptime (Heartbeat) Application metrics Request tracing (APM)
Questions? ^^^ Feedback ^^^ David Pilato @dadoonet

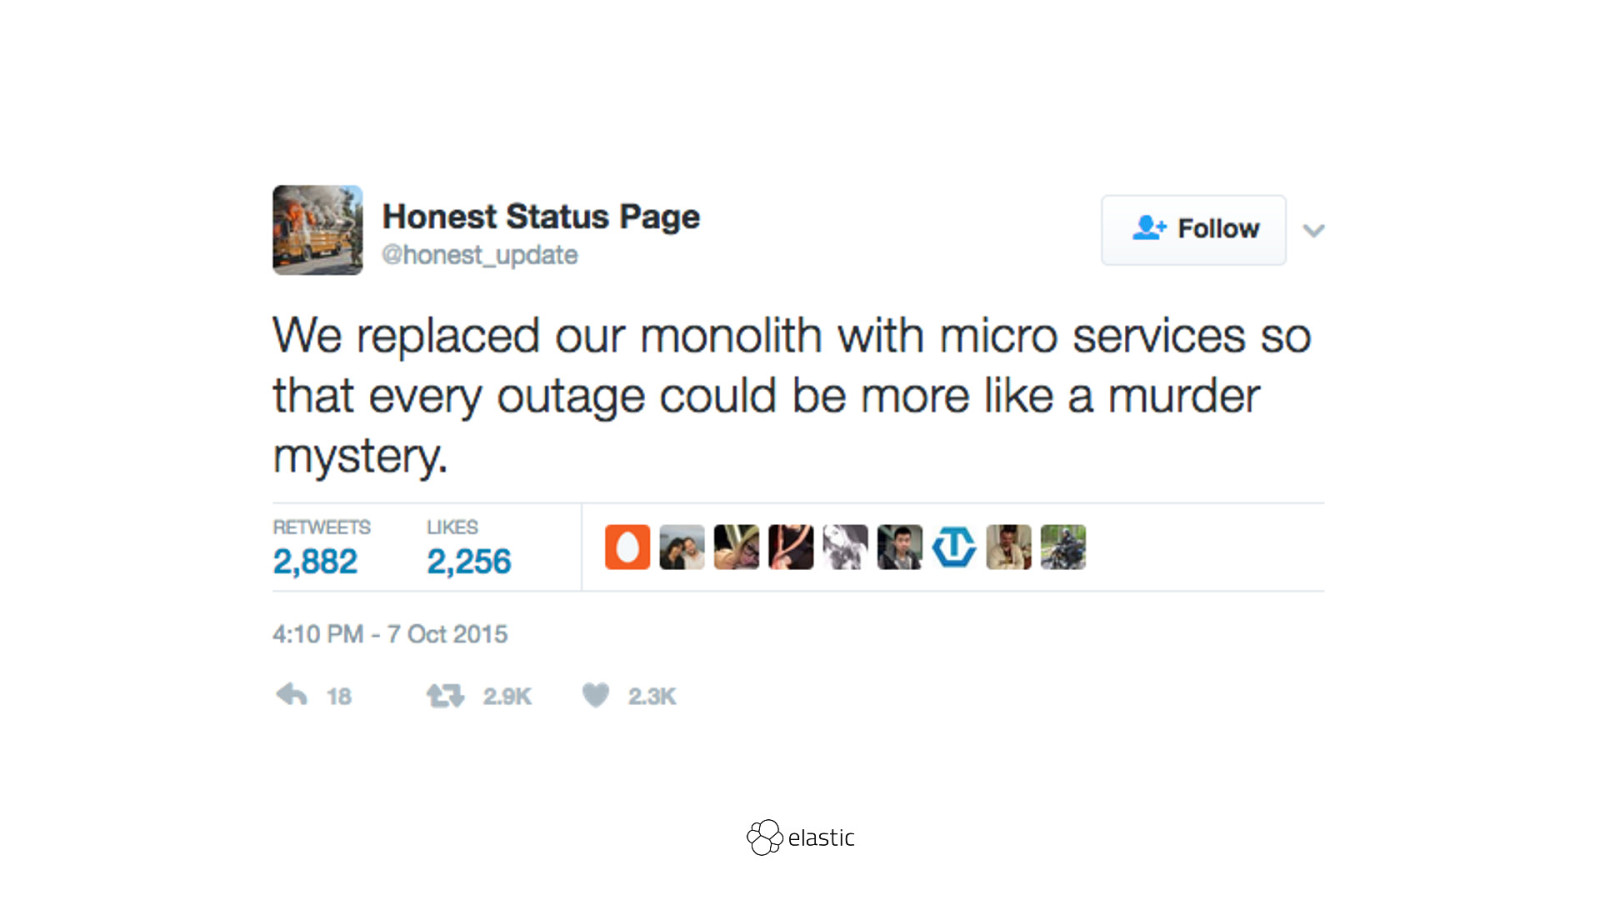
“With microservices every outage is like a murder mystery” is a common complaint. But it doesn’t have to be! This talk gives an overview on how to monitor distributed applications. We dive into:
And we will do all of that live, since it is so easy and much more interactive that way.
The following code examples from the presentation can be tried out live.


 for free. You
can too.
for free. You
can too.