
A presentation at stackconf in in Berlin, Germany by David Pilato
Visualize your threats with Elastic SIEM David Pilato @dadoonet
Security incidents come in three levels FYI, WTF, and OMG
Learn about a breach From the press or users
Learn about a breach Attackers asking for a ransom
Learn about a breach Cloud provider’s bill
Learn about a breach Yourself after the fact
Learn about a breach Yourself & you can prove no harm
uditd https://github.com/linux-audit
Demo
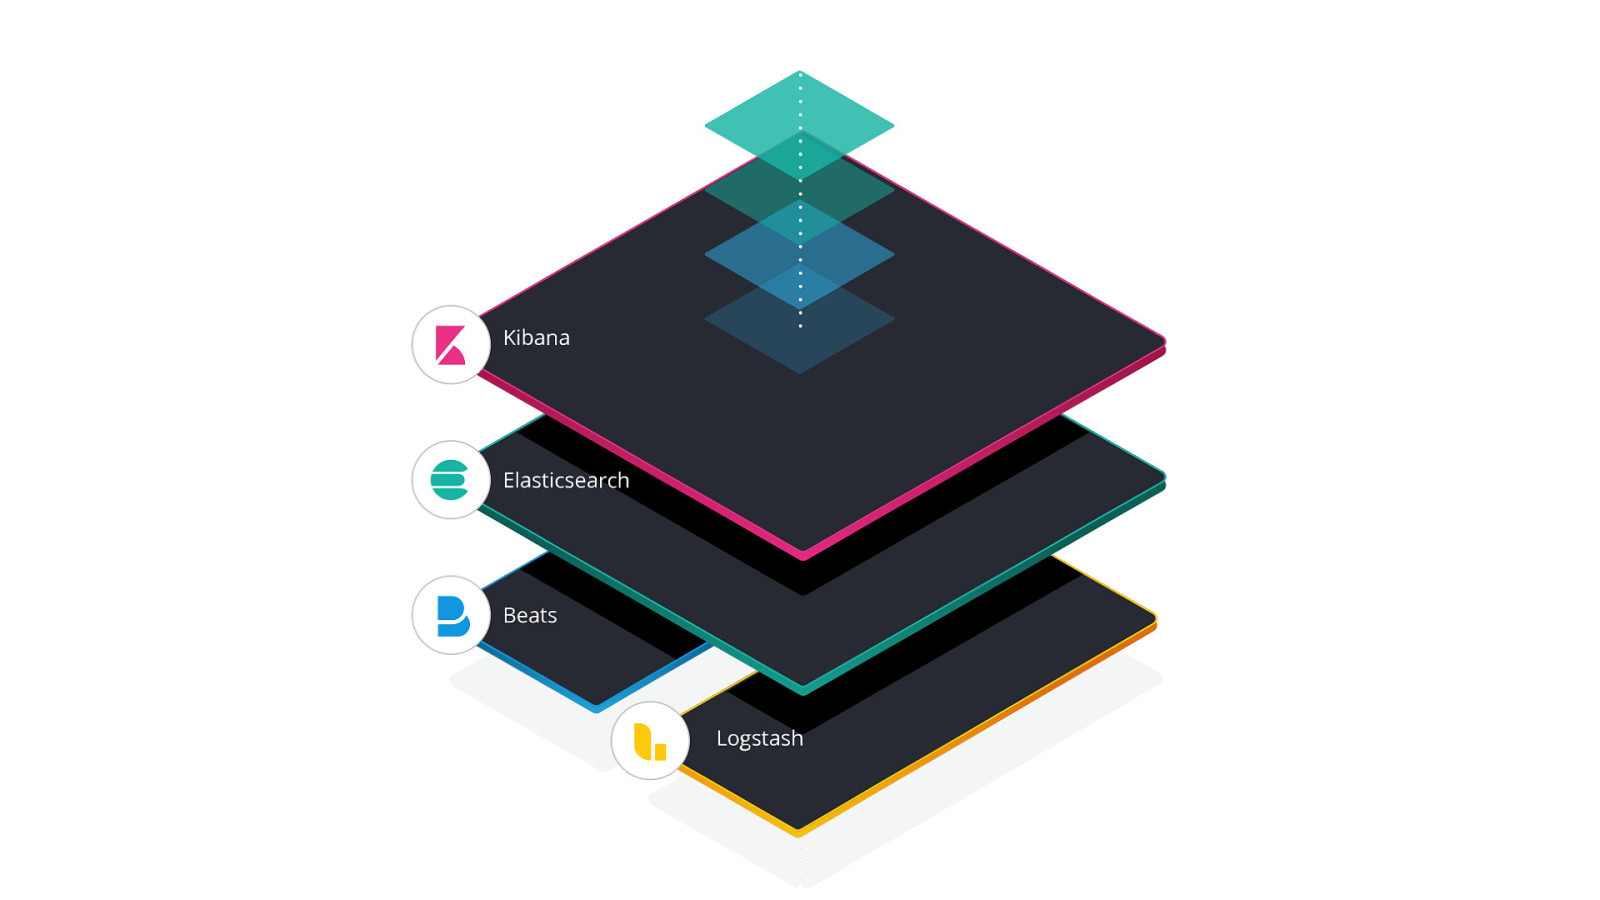
Problem How to centralize?
Developer | Evangelist !
Filebeat Module: Auditd
Demo
Auditbeat
Demo
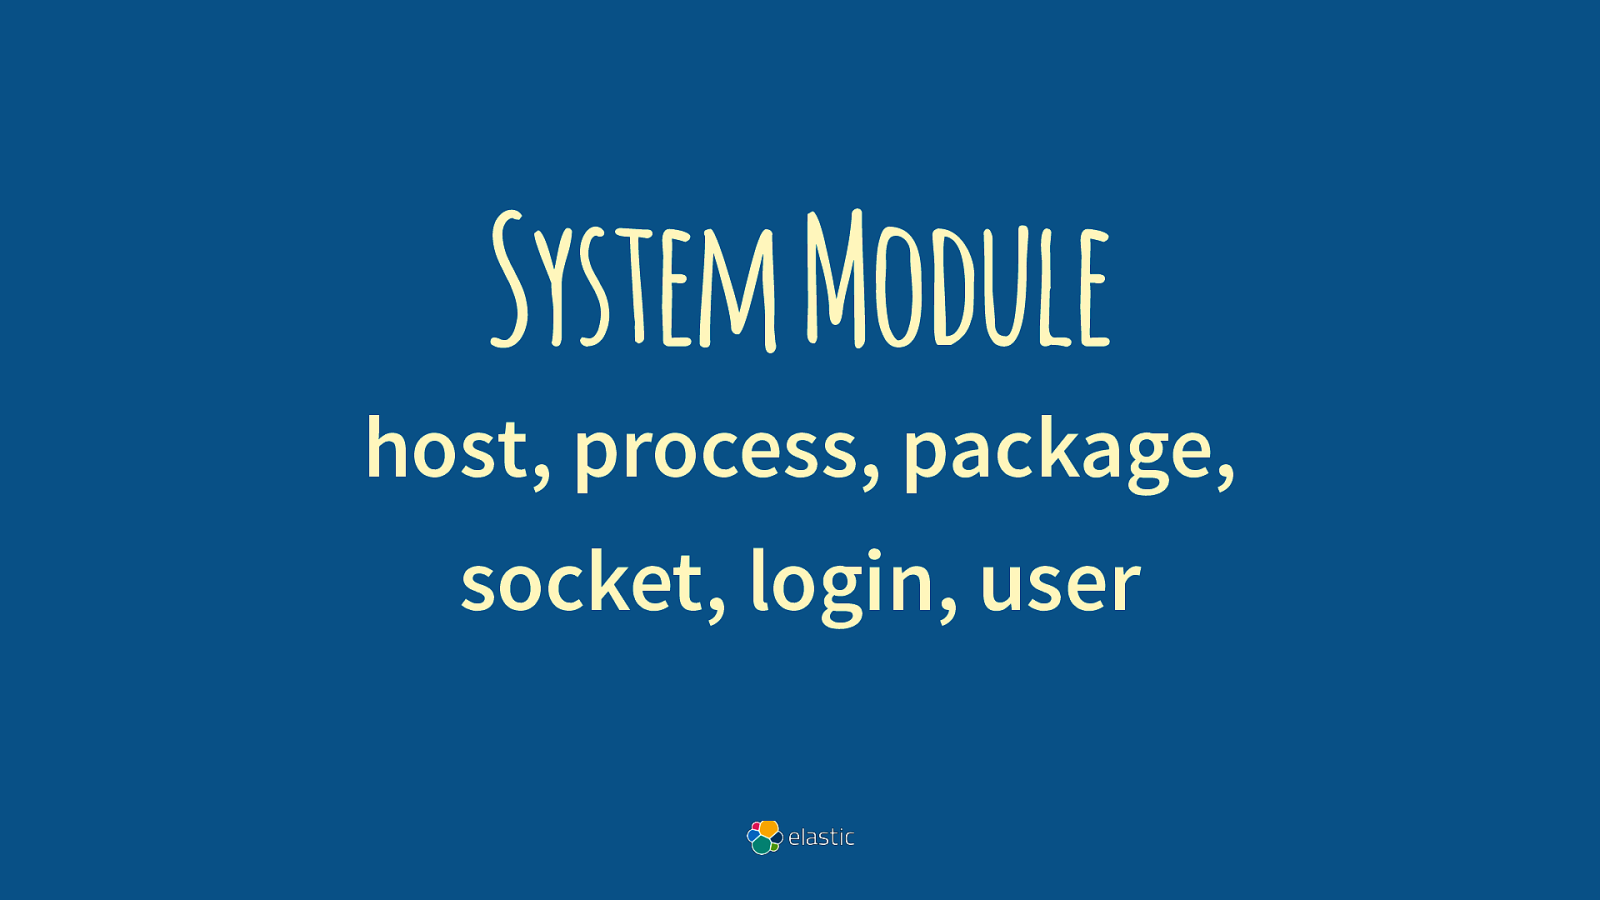
System Module host, process, package, socket, login, user
Demo
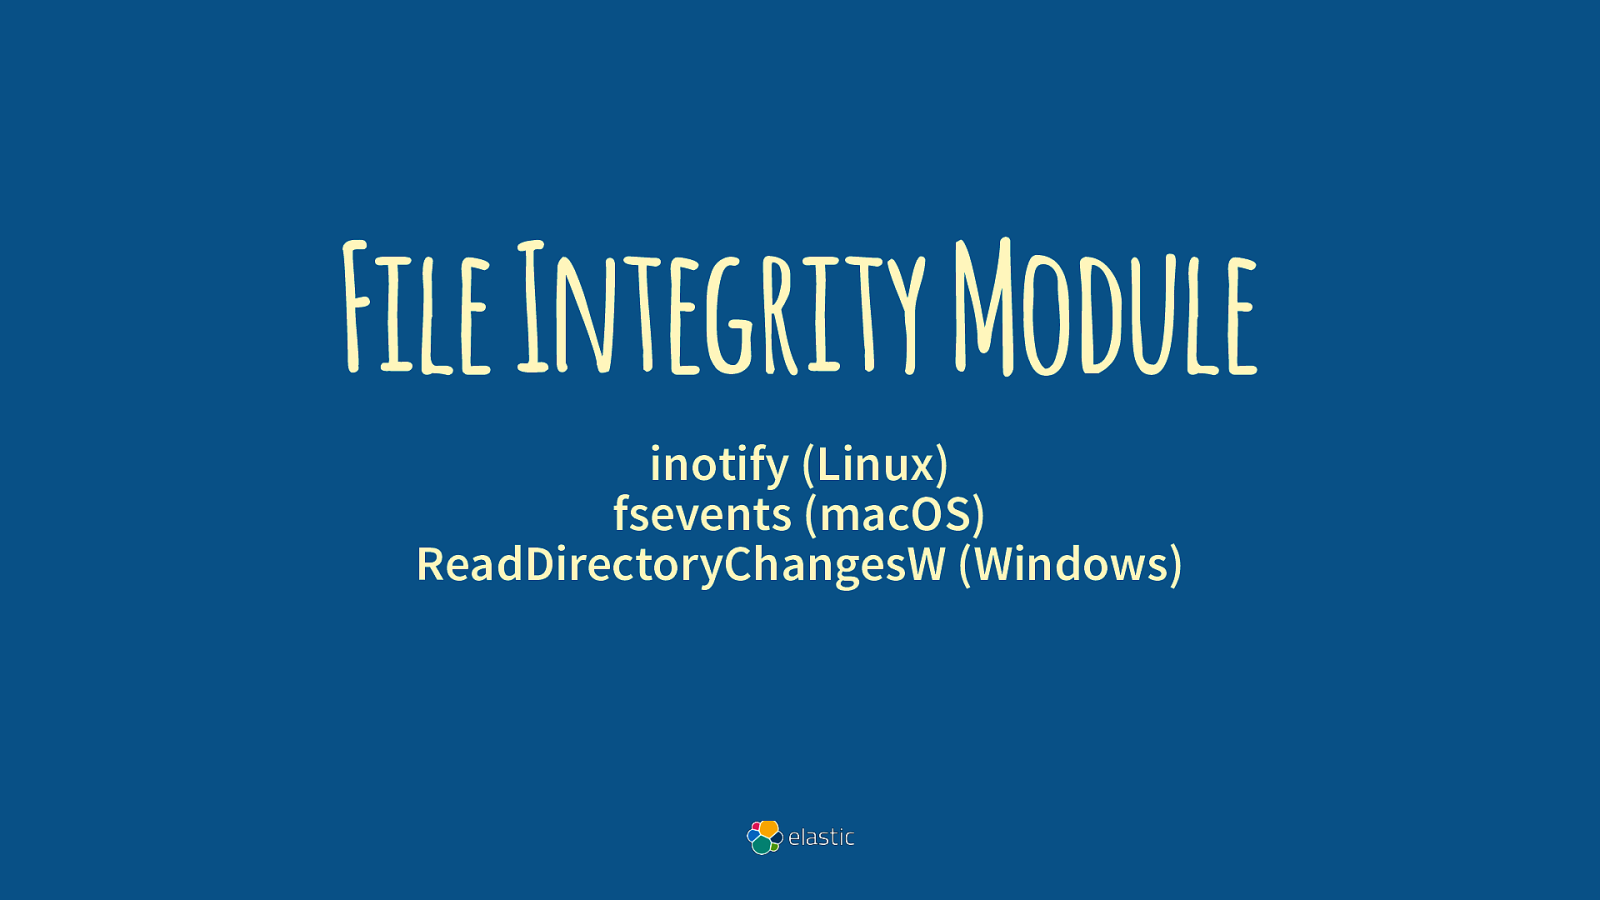
File Integrity Module inotify (Linux) fsevents (macOS) ReadDirectoryChangesW (Windows)
Demo
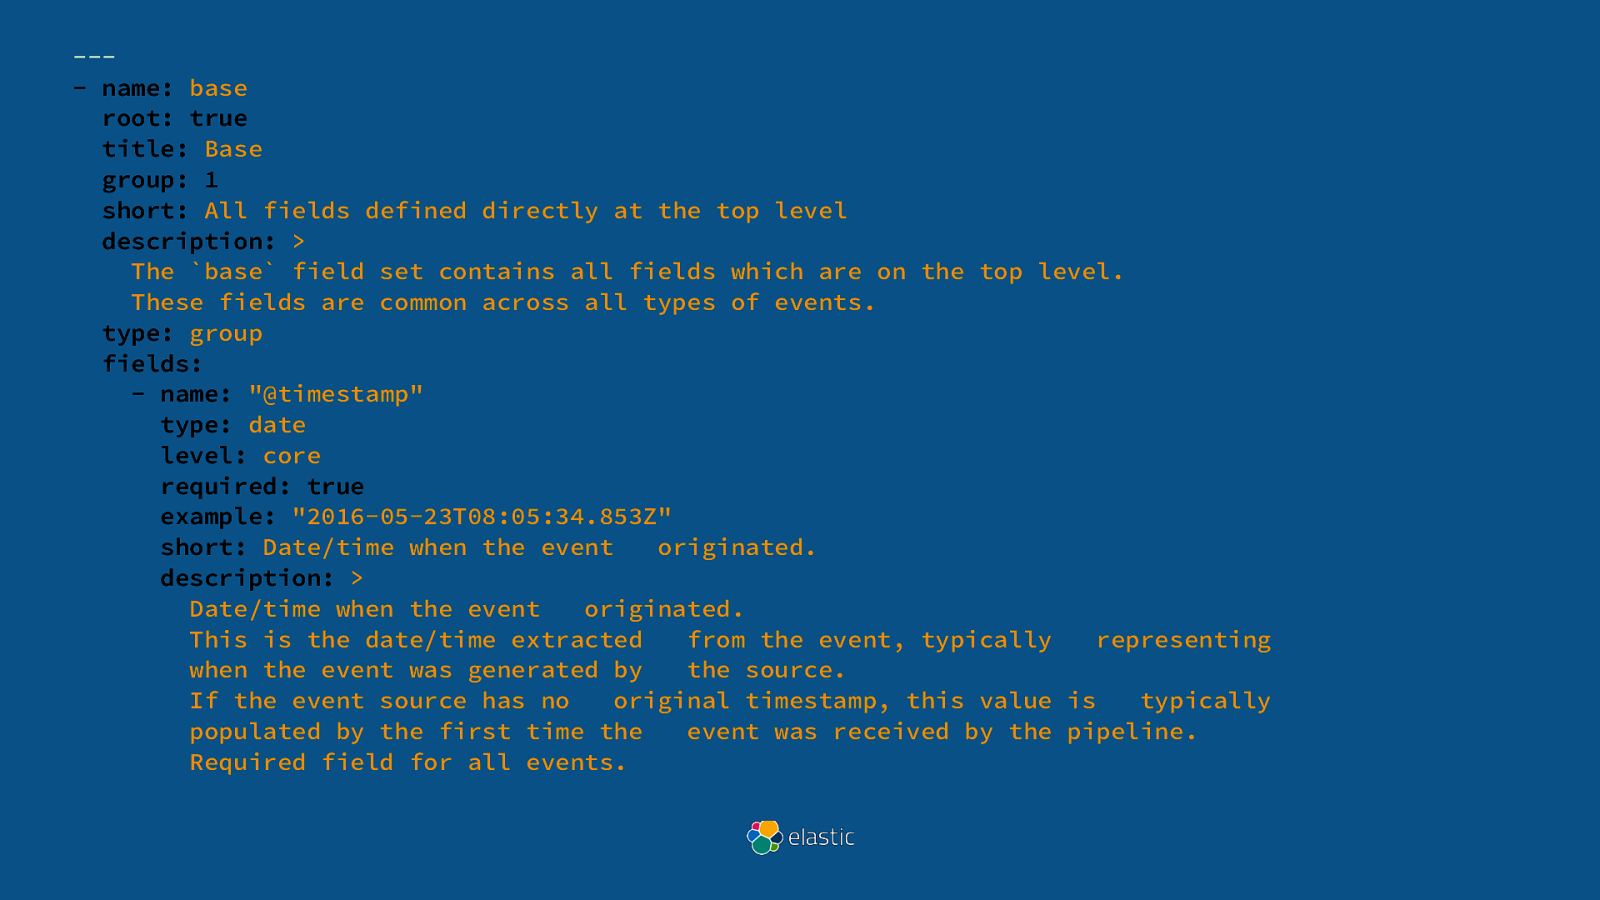
Elastic Common Schema https://github.com/elastic/ecs
—- name: base root: true title: Base group: 1 short: All fields defined directly at the top level description: > The base field set contains all fields which are on the top level. These fields are common across all types of events. type: group fields: - name: “@timestamp” type: date level: core required: true example: “2016-05-23T08:05:34.853Z” short: Date/time when the event originated. description: > Date/time when the event originated. This is the date/time extracted from the event, typically representing when the event was generated by the source. If the event source has no original timestamp, this value is typically populated by the first time the event was received by the pipeline. Required field for all events.
Elastic SIEM Security Information and Event Management
Demo
Code https://github.com/xeraa/ auditbeat-in-action
Visualize your threats with Elastic SIEM David Pilato @dadoonet

Knowing what is going on in your environment is an important part of staying on top of security issues. But how do you capture relevant metrics and visualize them? One widely-used tool for that job is the Elastic Stack, formerly known as the ELK stack. This talk shows how to ingest relevant metrics from your network and hosts as well as how to easily visualize them to find suspicious patterns and behaviors. We will be also using the latest tool named SIEM.
We will use real-world honeypot data for this example:
Everything done live.
The following resources were mentioned during the presentation or are useful additional information.
Templates for common auditD rules
Here’s what was said about this presentation on social media.


 for free. You
can too.
for free. You
can too.