Sharpening Our Pencils on revision 5 Carbon Measurement

A presentation at OCP Regional Summit in April 2023 in Prague, Czechia by erik riedel
Sharpening Our Pencils on revision 5 Carbon Measurement
Sustainability Sharpening Our Pencils on Carbon Measurement Erik Riedel, PhD Chief Engineering Officer Flax Computing
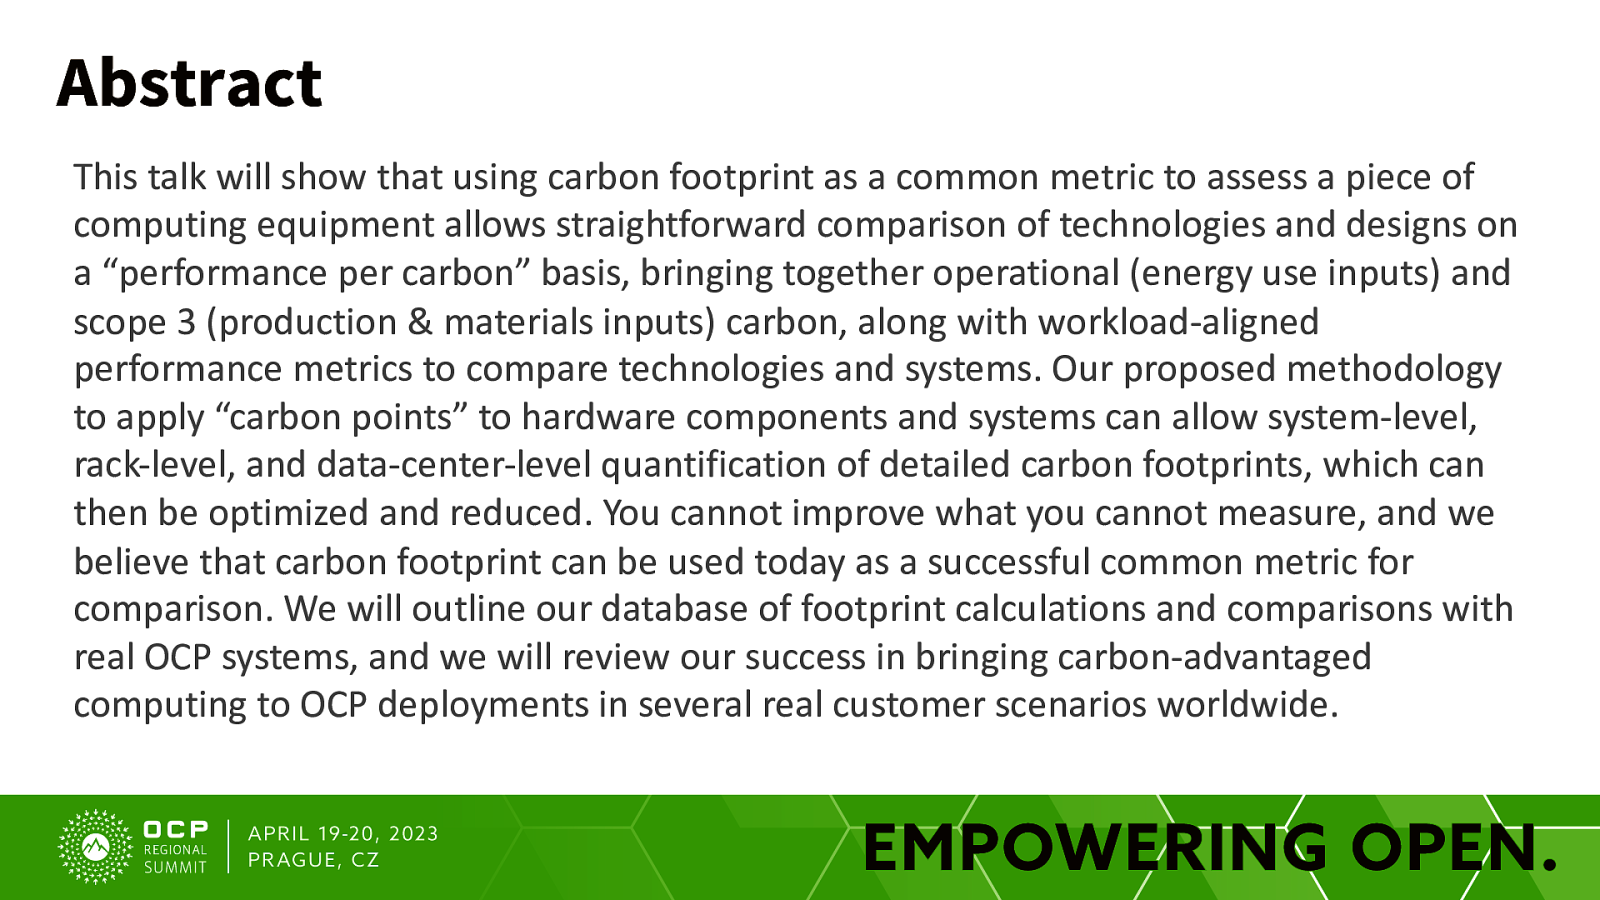
Abstract This talk will show that using carbon footprint as a common metric to assess a piece of computing equipment allows straightforward comparison of technologies and designs on a “performance per carbon” basis, bringing together operational (energy use inputs) and scope 3 (production & materials inputs) carbon, along with workload-aligned performance metrics to compare technologies and systems. Our proposed methodology to apply “carbon points” to hardware components and systems can allow system-level, rack-level, and data-center-level quantification of detailed carbon footprints, which can then be optimized and reduced. You cannot improve what you cannot measure, and we believe that carbon footprint can be used today as a successful common metric for comparison. We will outline our database of footprint calculations and comparisons with real OCP systems, and we will review our success in bringing carbon-advantaged computing to OCP deployments in several real customer scenarios worldwide.

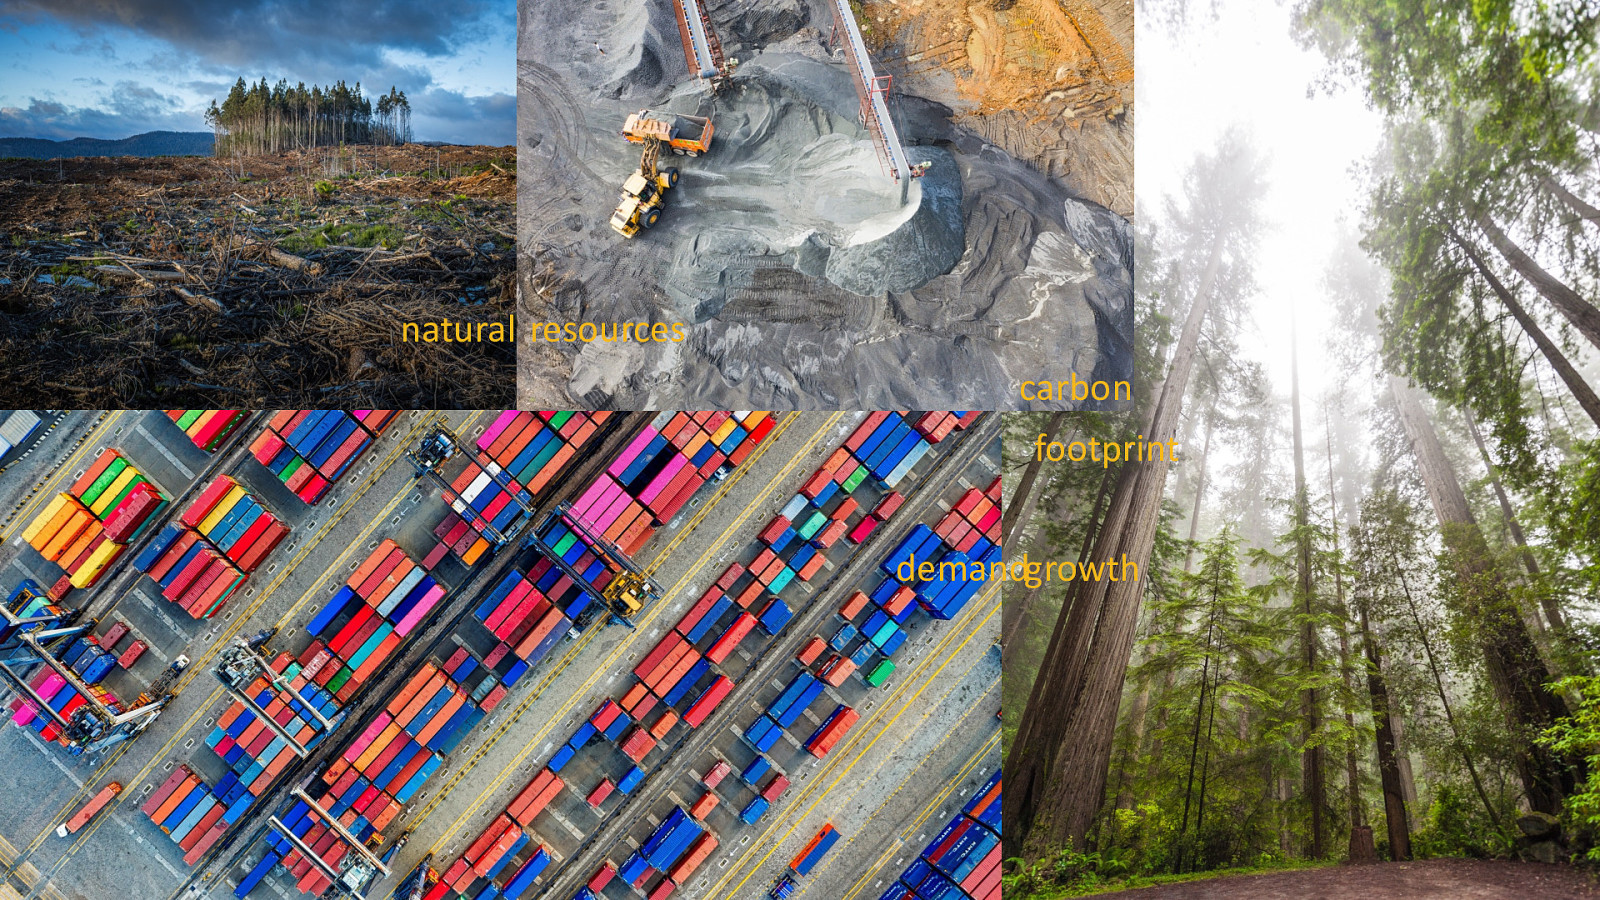
natural resources carbon footprint demandgrowth
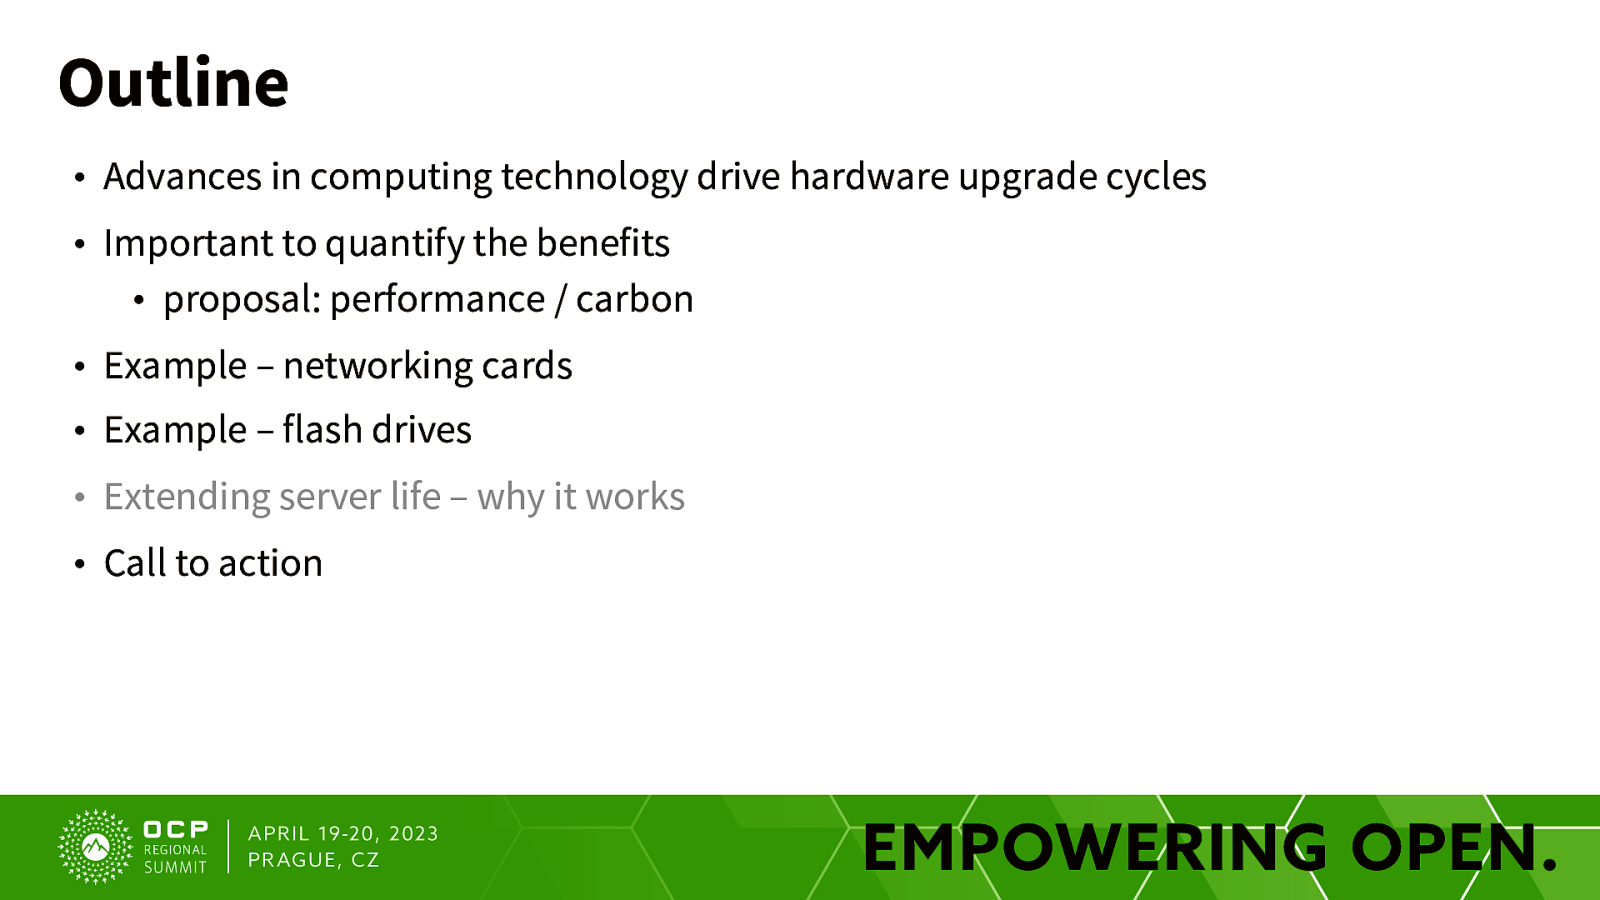
Outline • Advances in computing technology drive hardware upgrade cycles • Important to quantify the benefits • proposal: performance / carbon • Example – networking cards • Example – flash drives • Extending server life – why it works • Call to action

Technology Advance Drives Upgrades
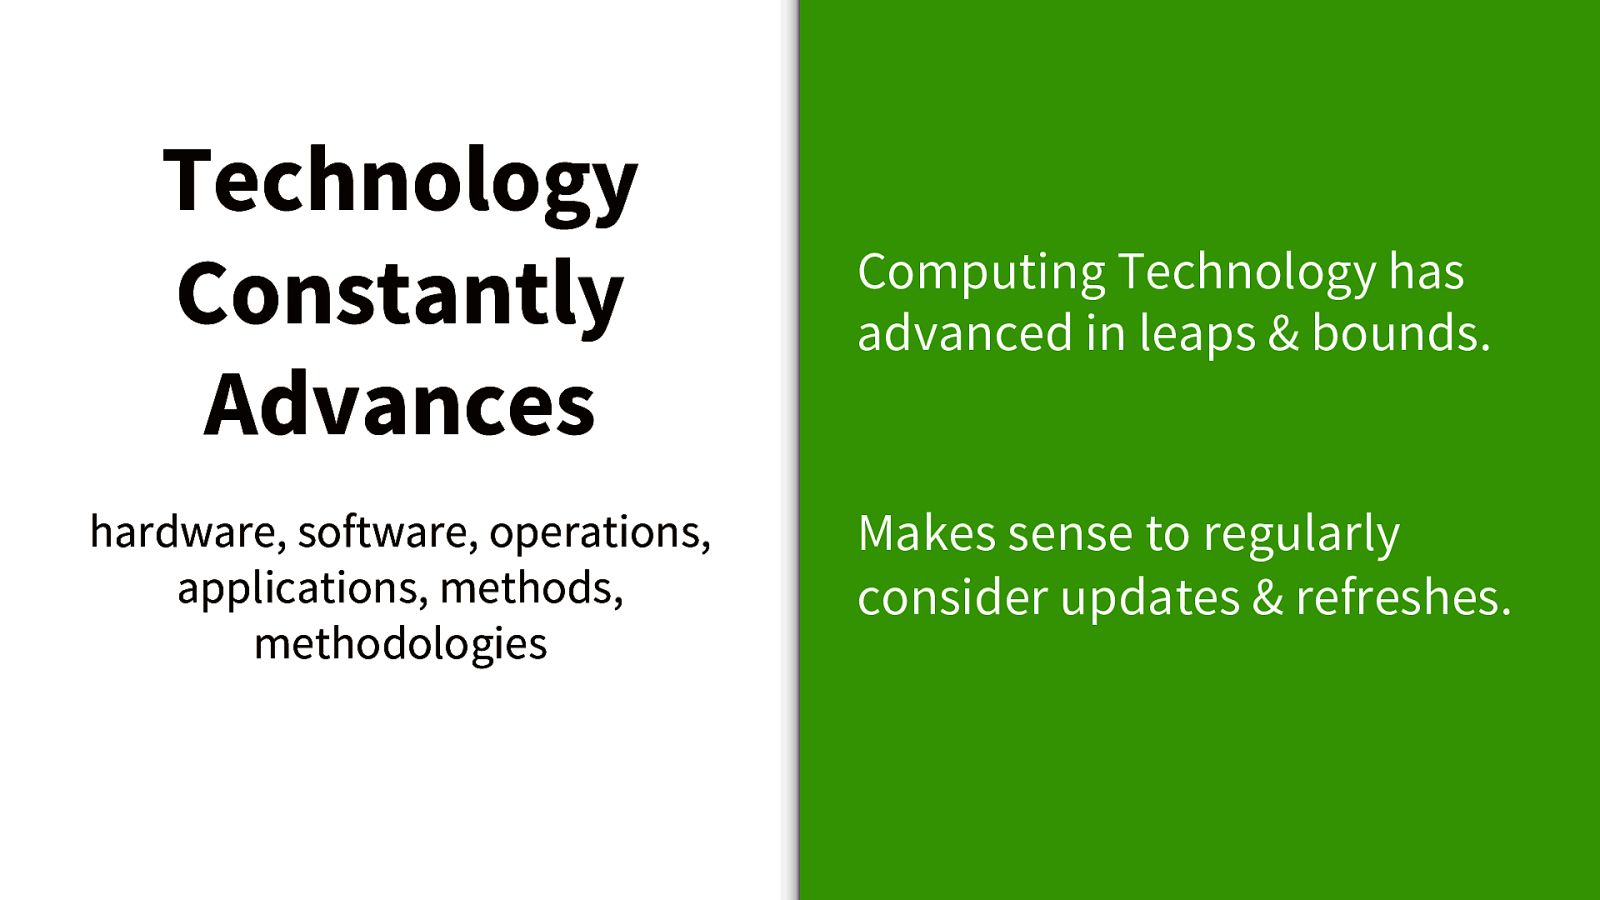
Technology Constantly Advances Computing Technology has advanced in leaps & bounds. hardware, software, operations, applications, methods, methodologies Makes sense to regularly consider updates & refreshes.
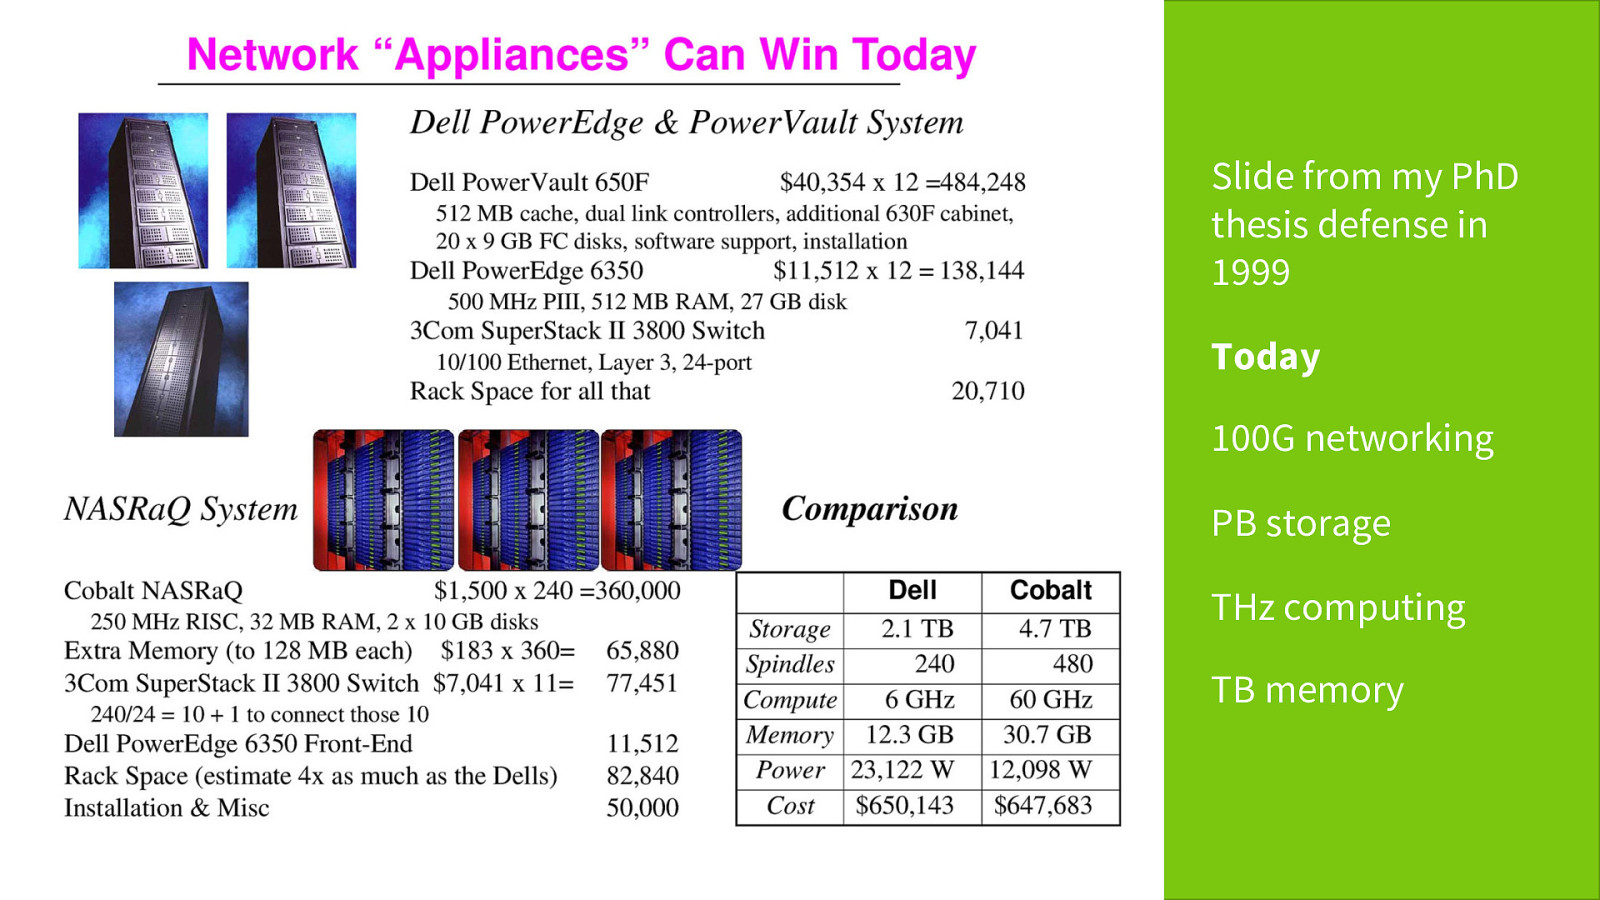
Slide from my PhD thesis defense in 1999 Today 100G networking PB storage THz computing TB memory
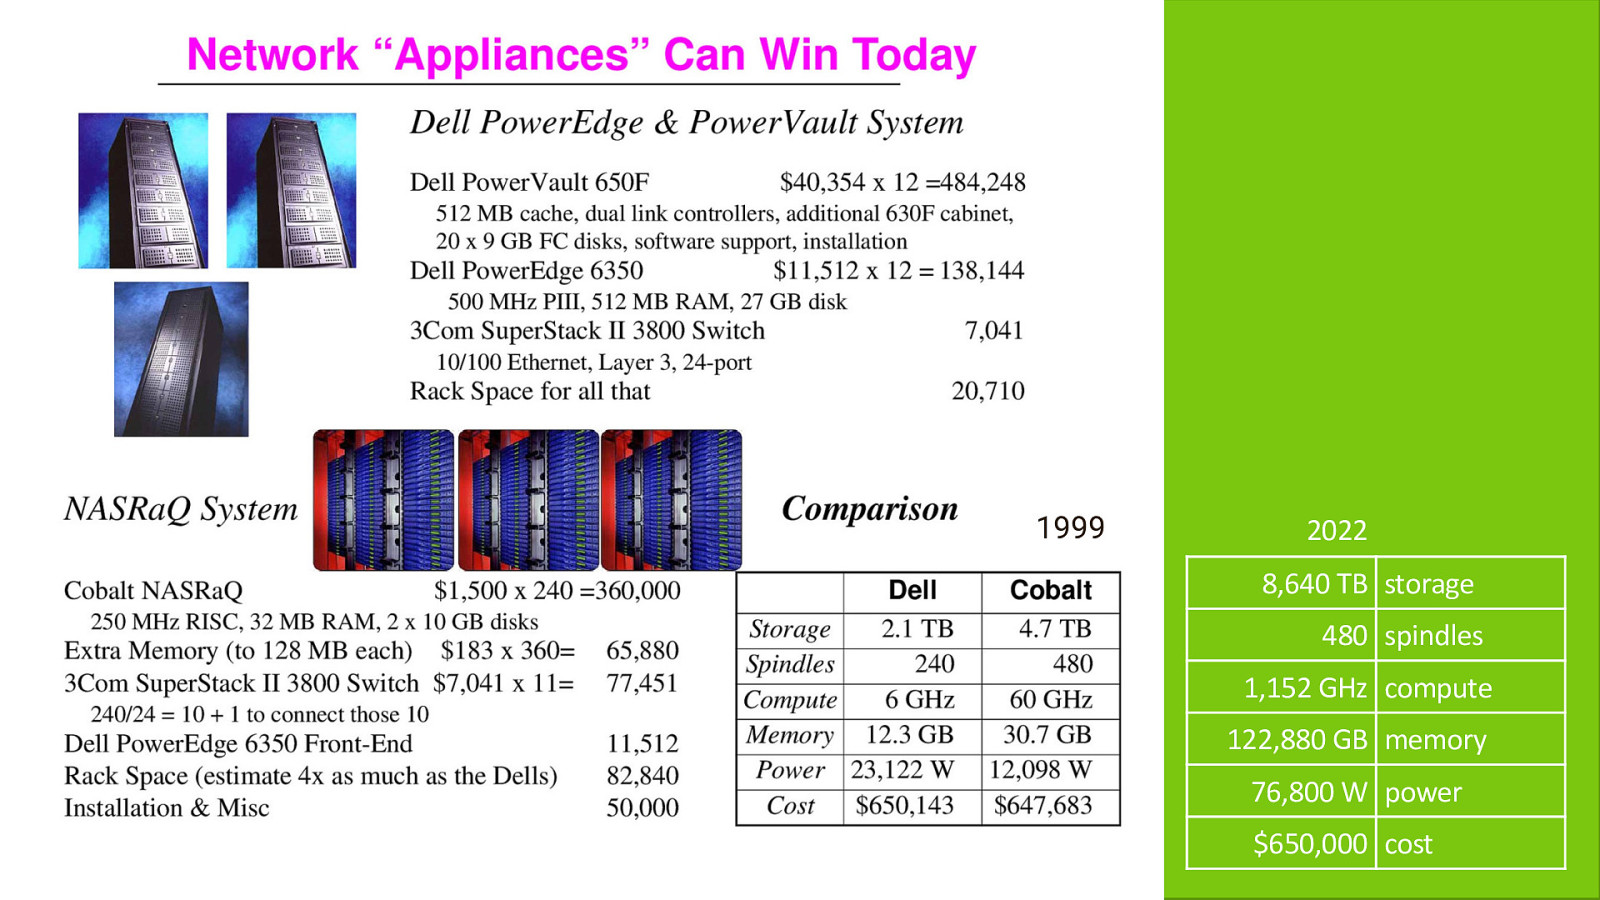
1999 2022 8,640 TB storage 480 spindles 1,152 GHz compute 122,880 GB memory 76,800 W power $650,000 cost

Detailed Example – Networking Cards
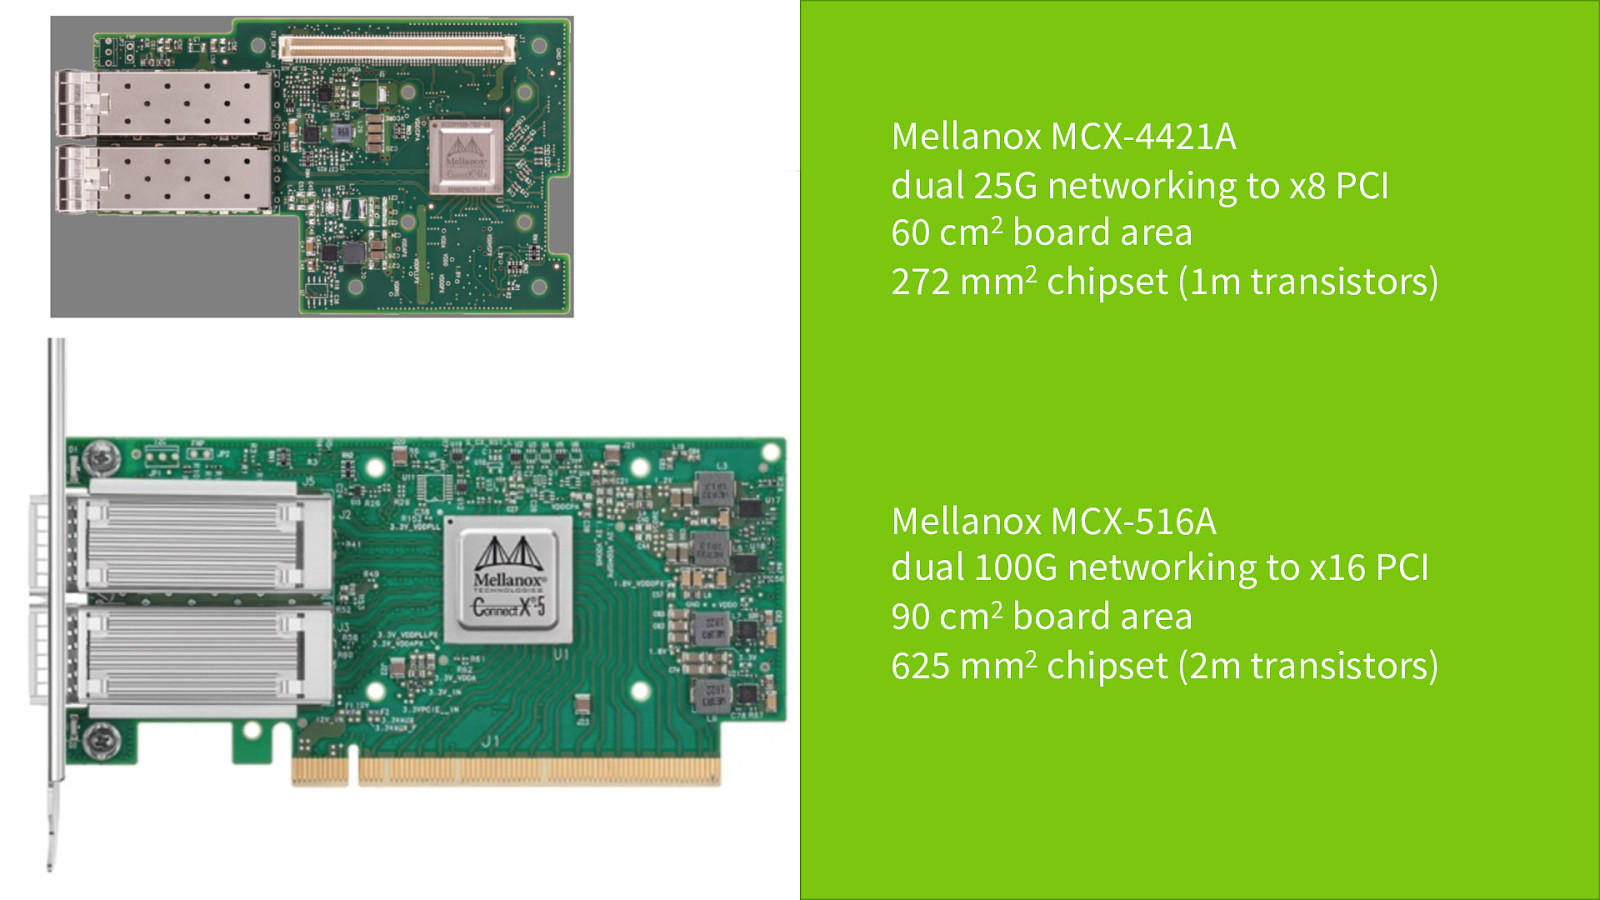
Mellanox MCX-4421A dual 25G networking to x8 PCI 60 cm2 board area 272 mm2 chipset (1m transistors) NETWORK CARD FlaxPoints (™) NEW TECHNOLOGY Mellanox MCX-516A dual 100G networking to x16 PCI 90 cm2 board area 625 mm2 chipset (2m transistors)
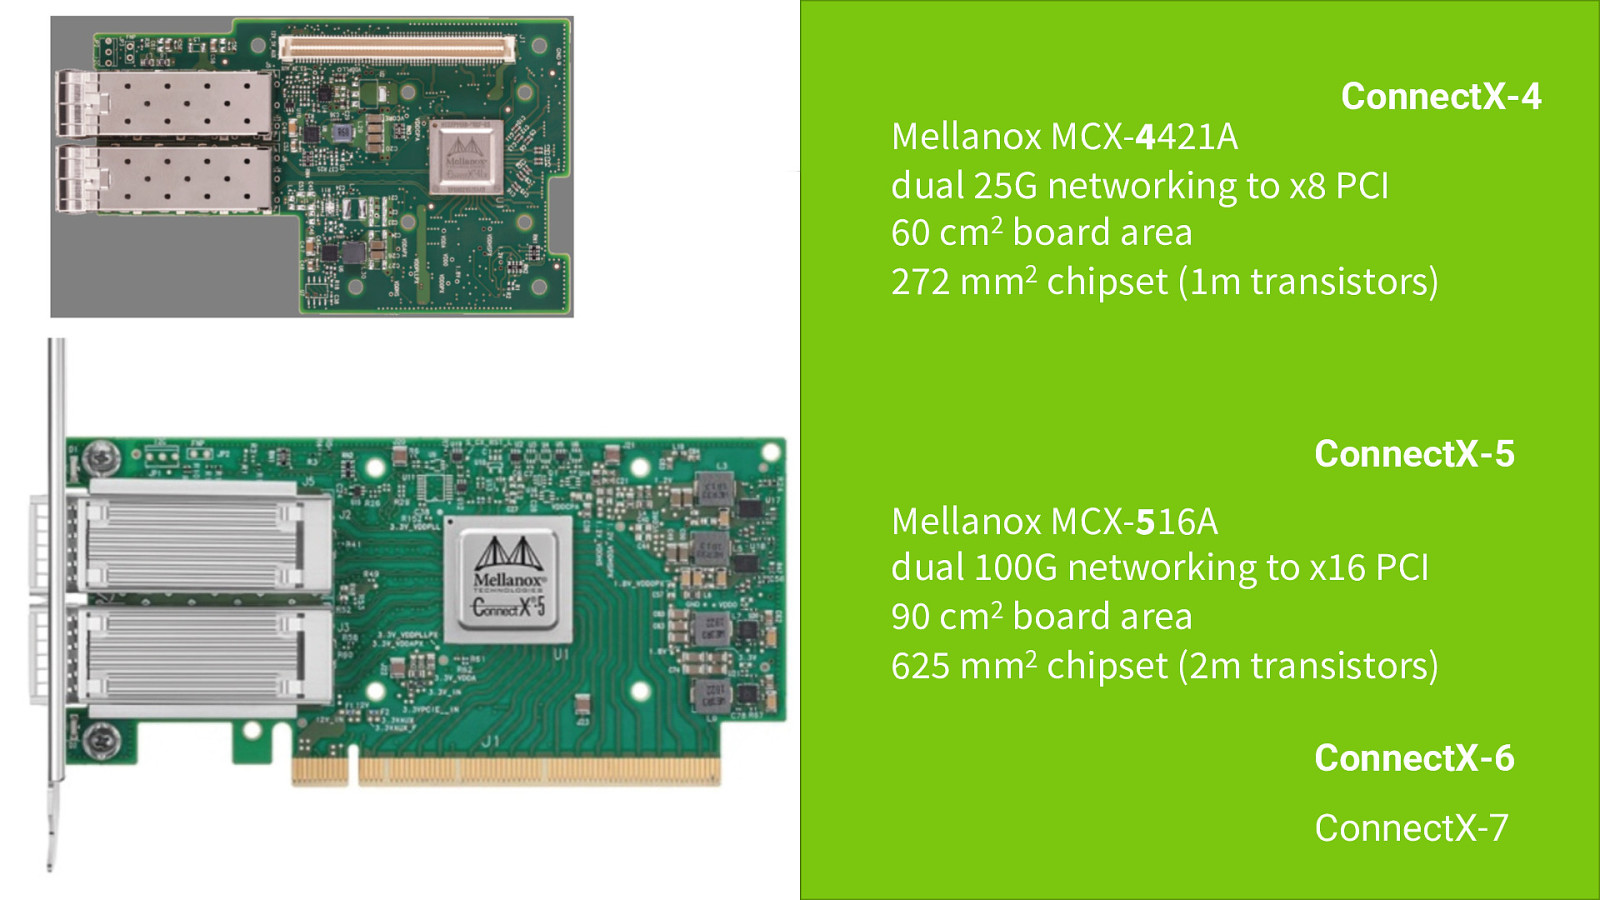
ConnectX-4 Mellanox MCX-4421A dual 25G networking to x8 PCI 60 cm2 board area 272 mm2 chipset (1m transistors) NETWORK CARD FlaxPoints (™) NEW TECHNOLOGY ConnectX-5 Mellanox MCX-516A dual 100G networking to x16 PCI 90 cm2 board area 625 mm2 chipset (2m transistors) ConnectX-6 ConnectX-7
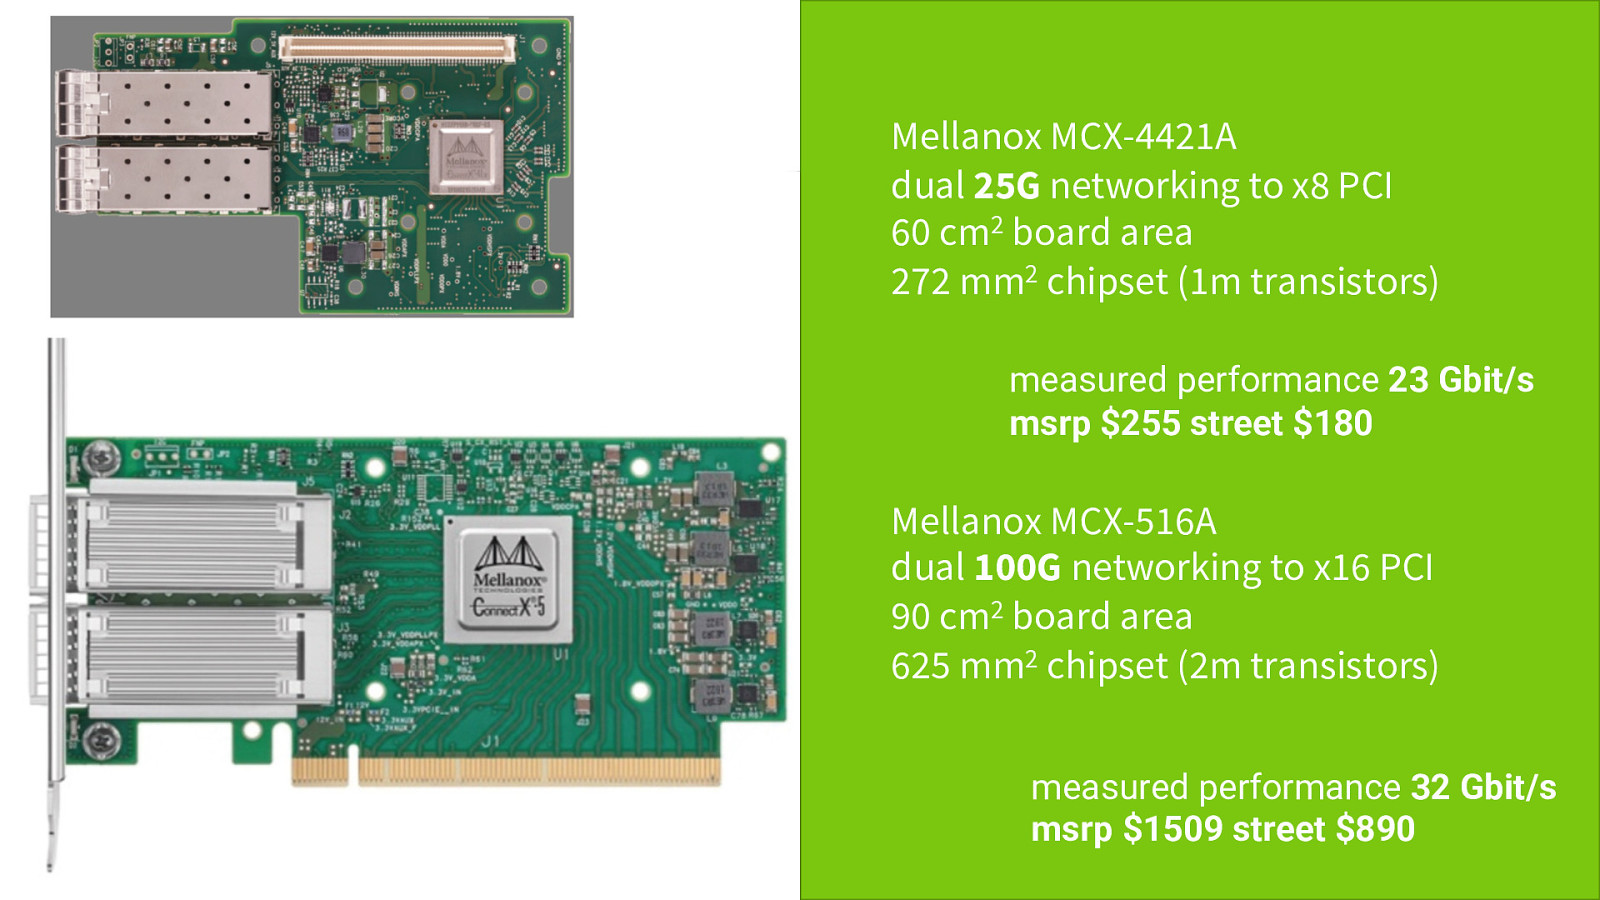
Mellanox MCX-4421A dual 25G networking to x8 PCI 60 cm2 board area 272 mm2 chipset (1m transistors) NETWORK CARD FlaxPoints (™) NEW TECHNOLOGY measured performance 23 Gbit/s msrp $255 street $180 Mellanox MCX-516A dual 100G networking to x16 PCI 90 cm2 board area 625 mm2 chipset (2m transistors) measured performance 32 Gbit/s msrp $1509 street $890

Mellanox MCX-4421A dual 25G networking to x8 PCI 60 cm2 board area 272 mm2 chipset (1m transistors) NETWORK CARD FlaxPoints (™) NEW TECHNOLOGY measured performance 23 Gbit/s msrp $255 street $180 Mellanox MCX-516A dual 100G networking to x16 PCI 90 cm2 board area 625 mm2 chipset (2m transistors) 96 Gbit/s measured performance 32 Gbit/s msrp $1509 street $890

Detailed Example – Flash Drives
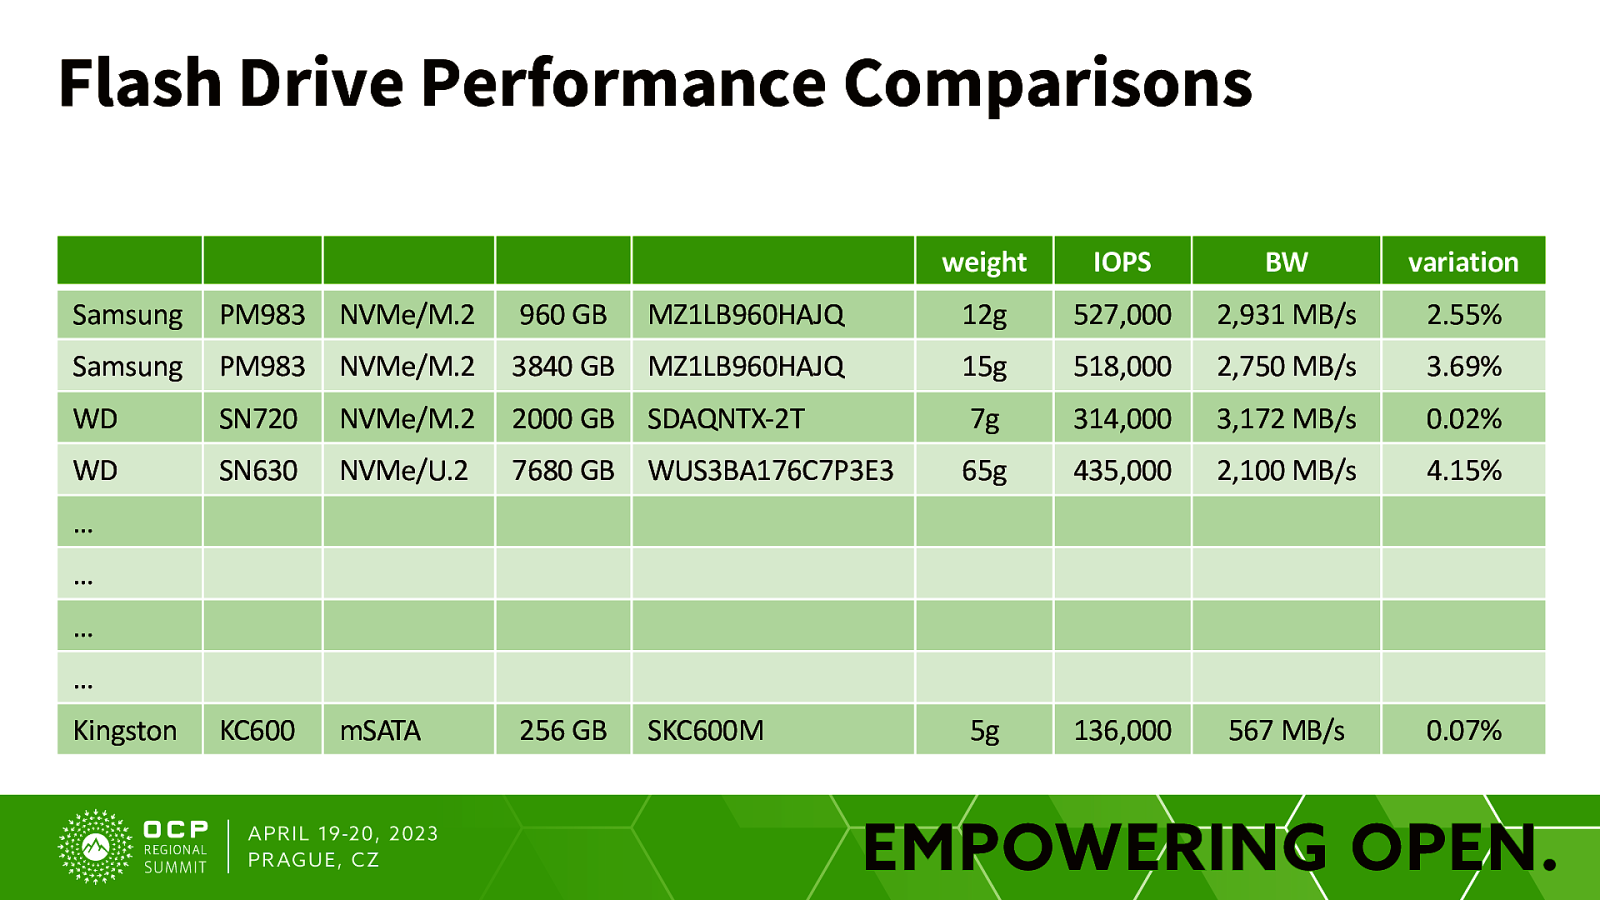
Flash Drive Performance Comparisons weight IOPS BW variation Samsung PM983 NVMe/M.2 960 GB MZ1LB960HAJQ 12g 527,000 2,931 MB/s 2.55% Samsung PM983 NVMe/M.2 3840 GB MZ1LB960HAJQ 15g 518,000 2,750 MB/s 3.69% WD SN720 NVMe/M.2 2000 GB SDAQNTX-2T 7g 314,000 3,172 MB/s 0.02% WD SN630 NVMe/U.2 7680 GB WUS3BA176C7P3E3 65g 435,000 2,100 MB/s 4.15% KC600 mSATA 256 GB SKC600M 5g 136,000 567 MB/s 0.07% … … … … Kingston
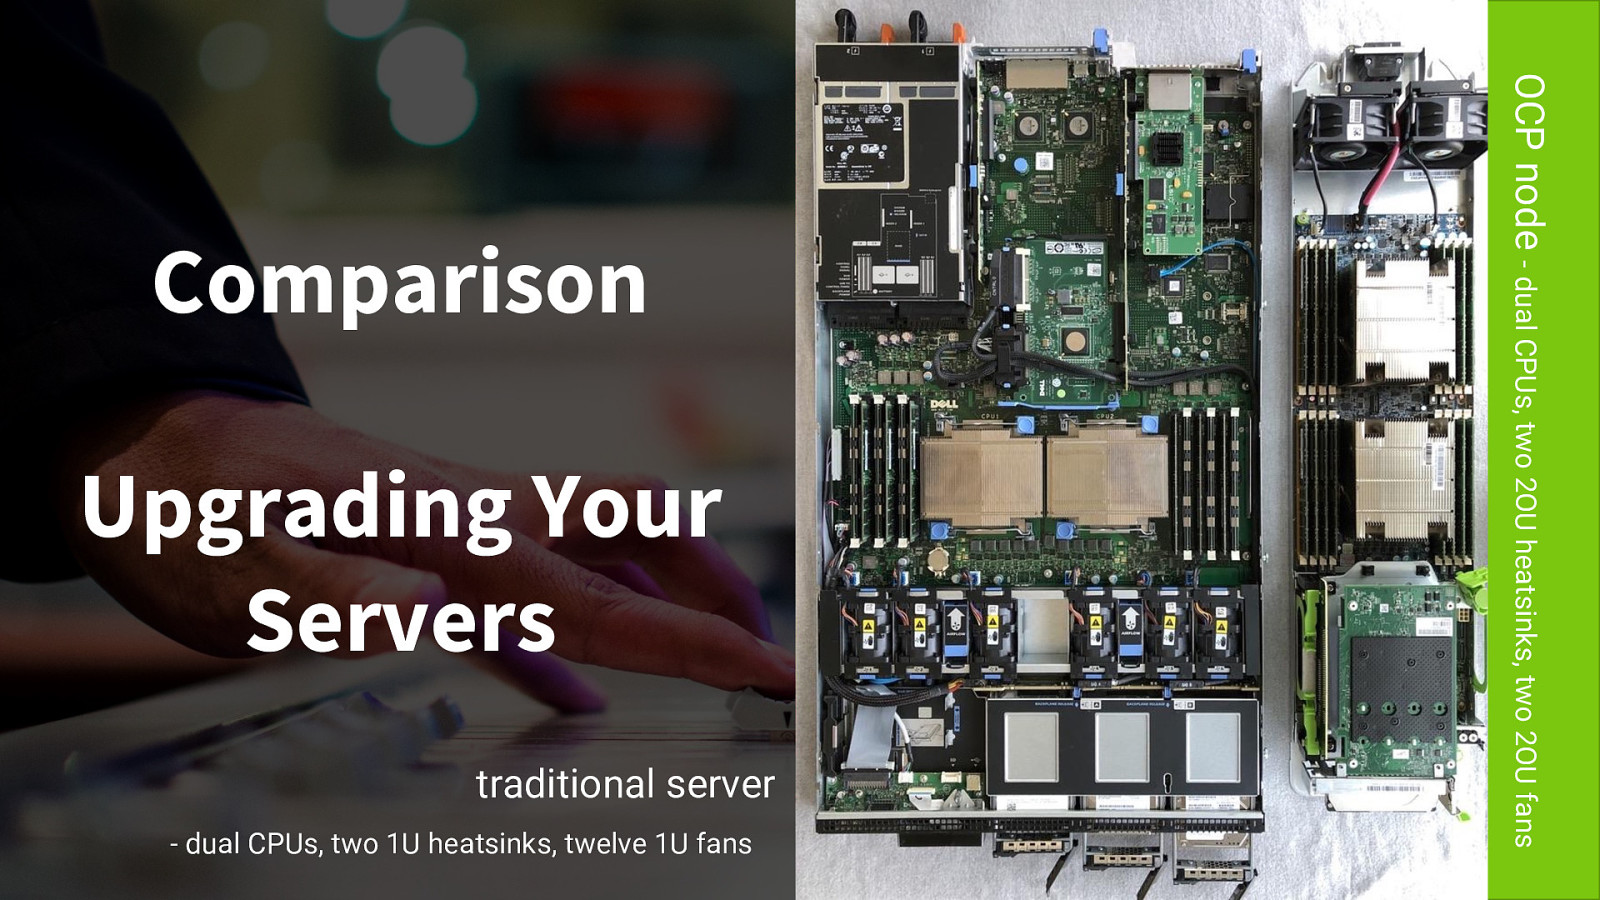
Upgrading Your Servers traditional server - dual CPUs, two 1U heatsinks, twelve 1U fans 17 MPG 0-60 in 12 seconds 25 MPG 0-60 in 2 seconds OCP node - dual CPUs, two 2OU heatsinks, two 2OU fans Comparison
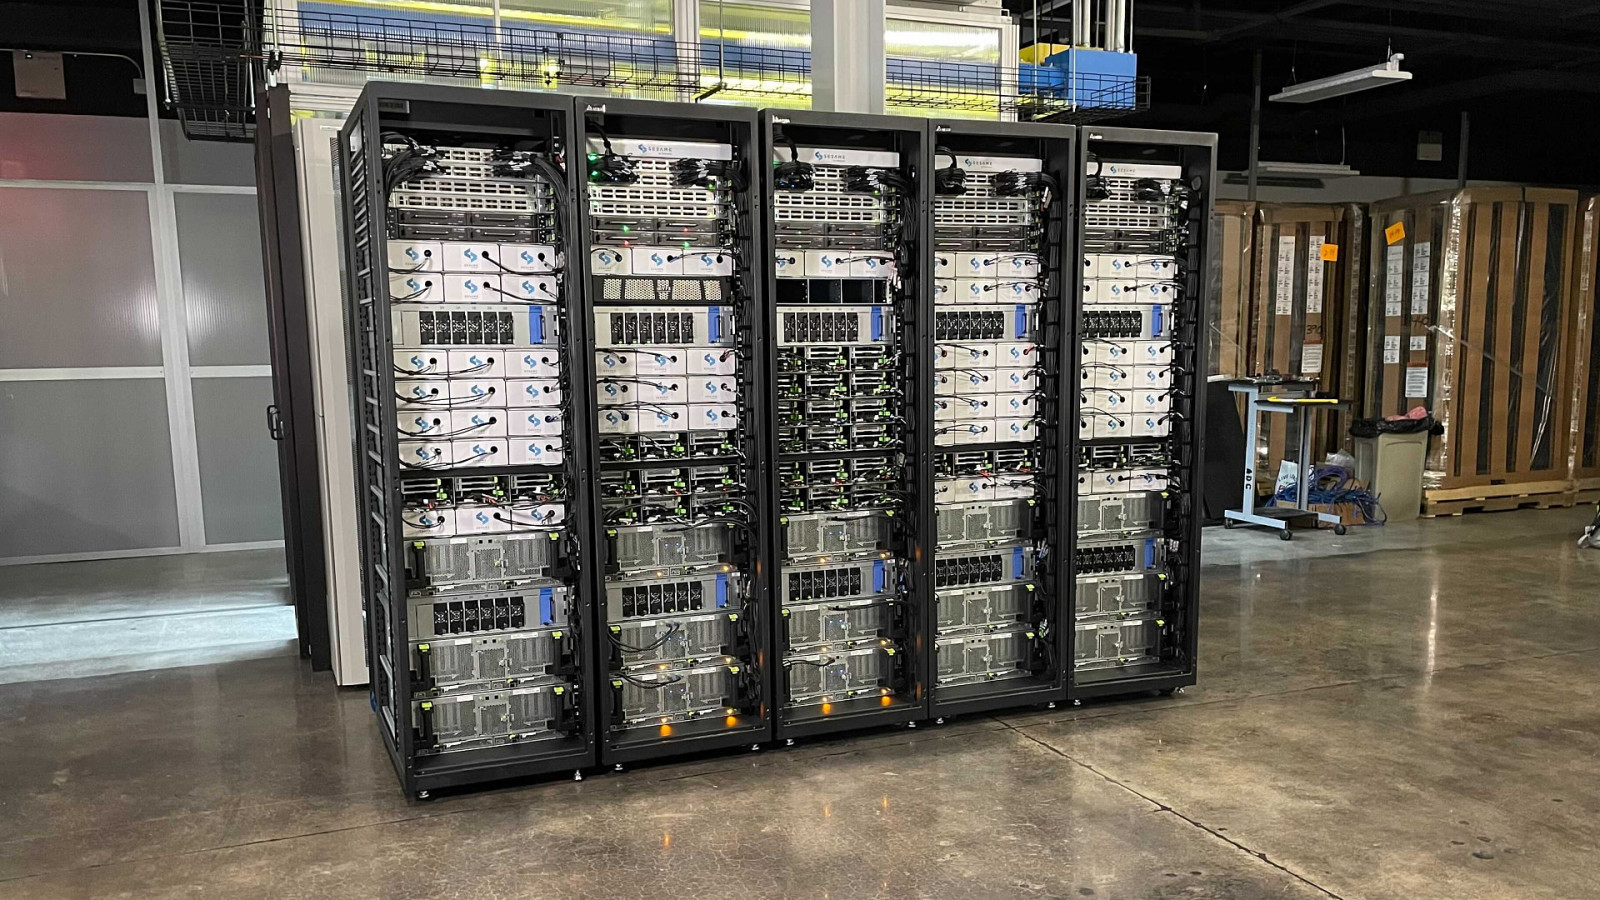
Rack-Level Carbon
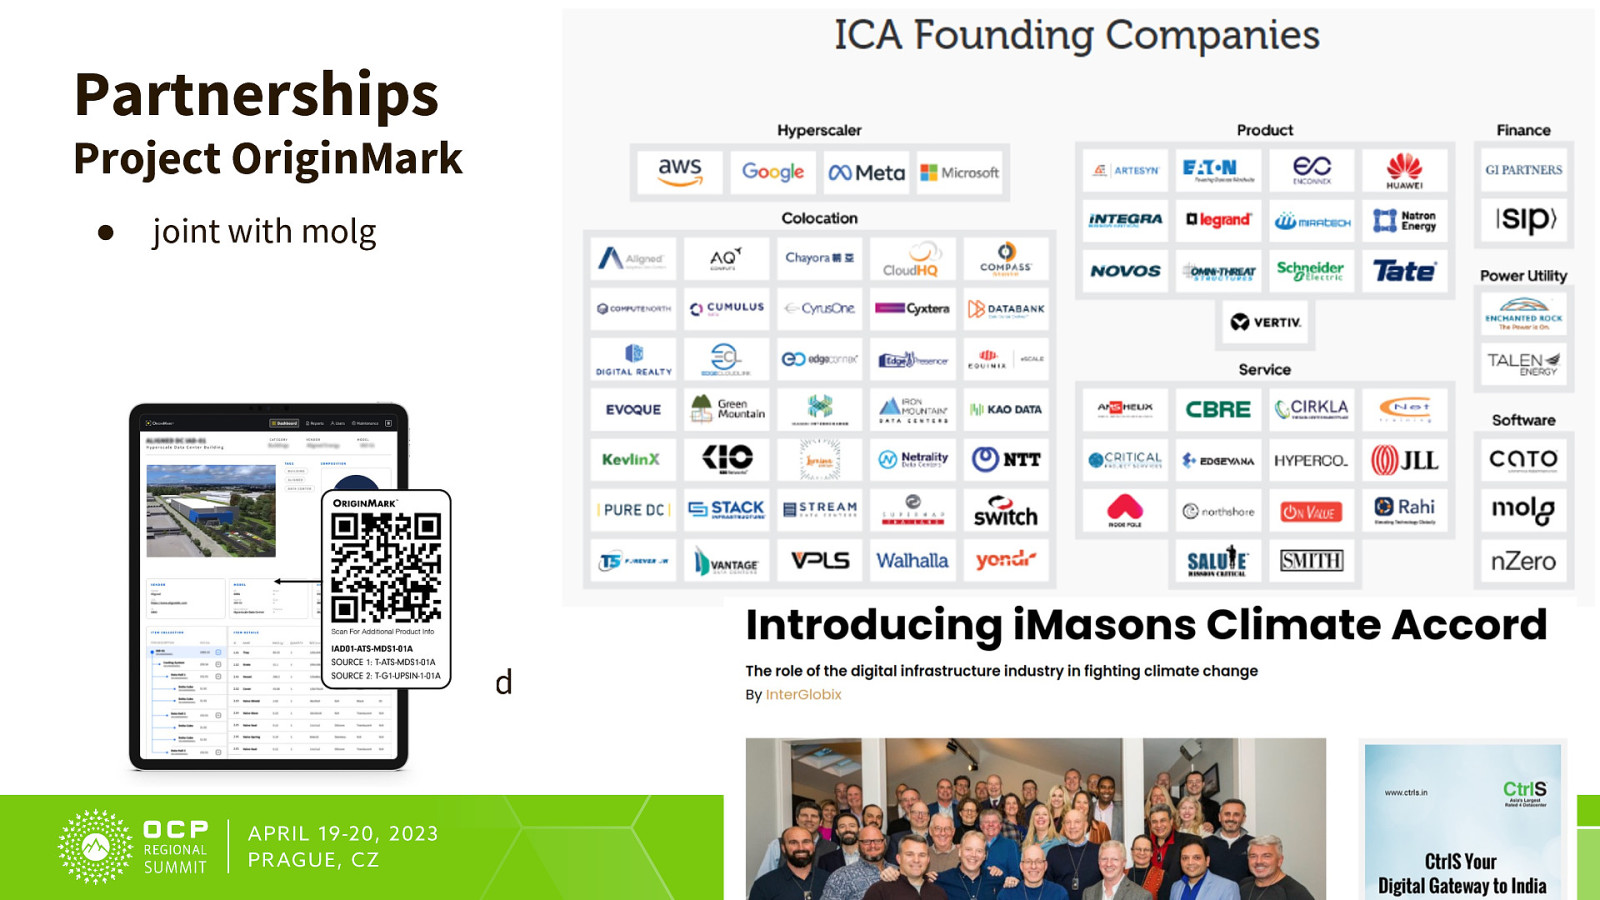
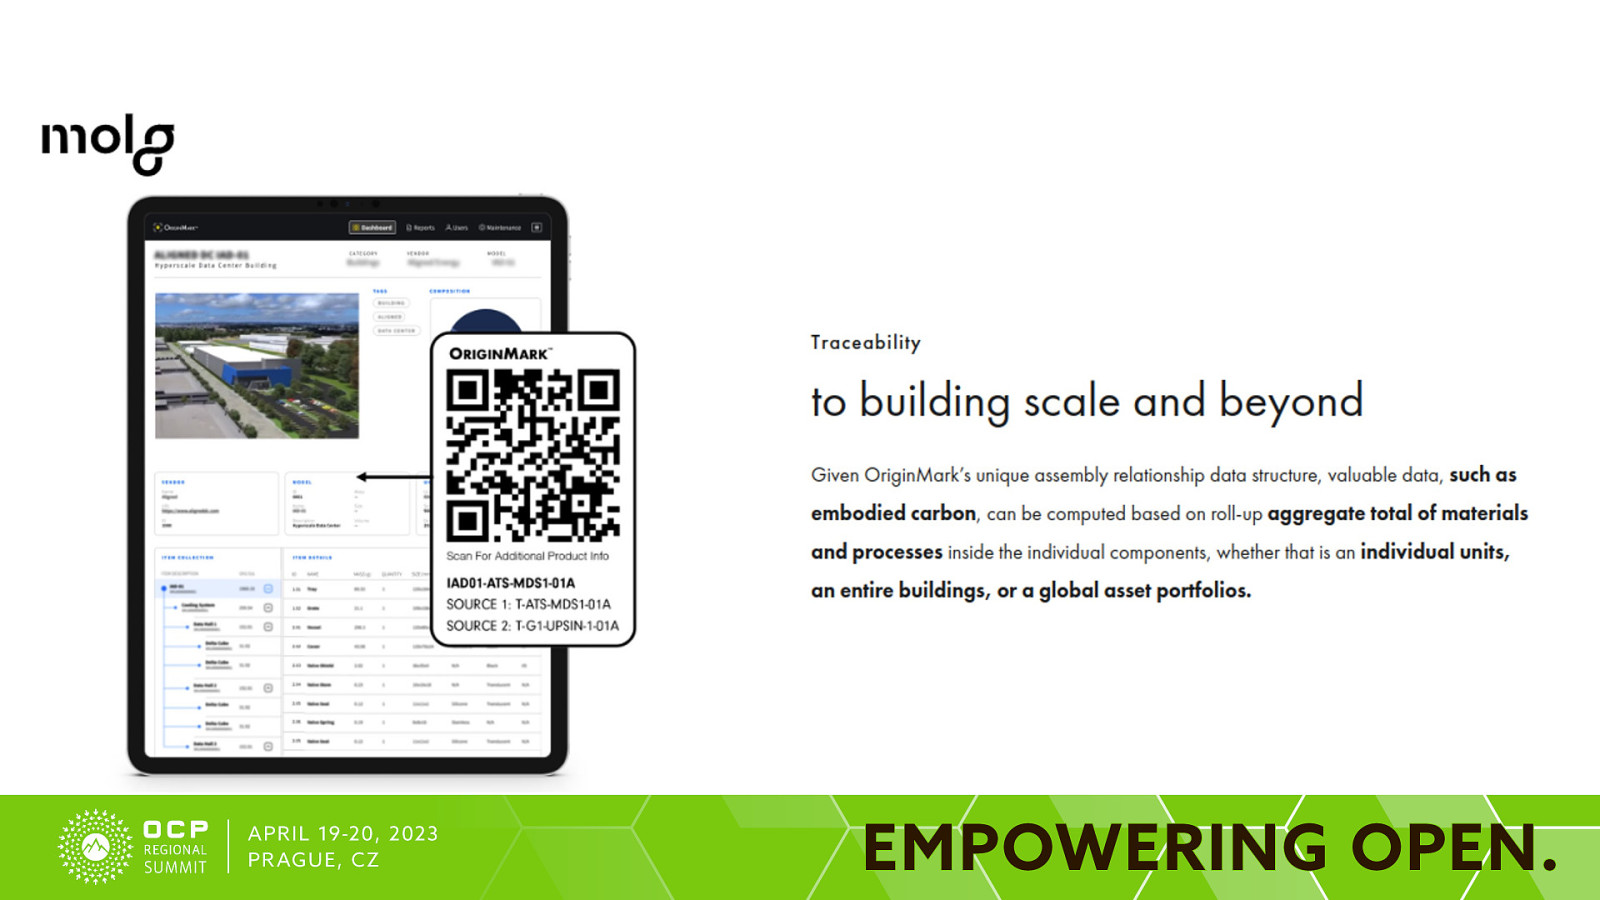
Partnerships Project OriginMark ● joint with molg ● Carbon / Climate Accord

Consider Extending Server Life

The Best Server Is The One You Already Have (Maybe) Understand the full carbon footprint of your computing. Reduce your footprint. And your complexity. And your costs.
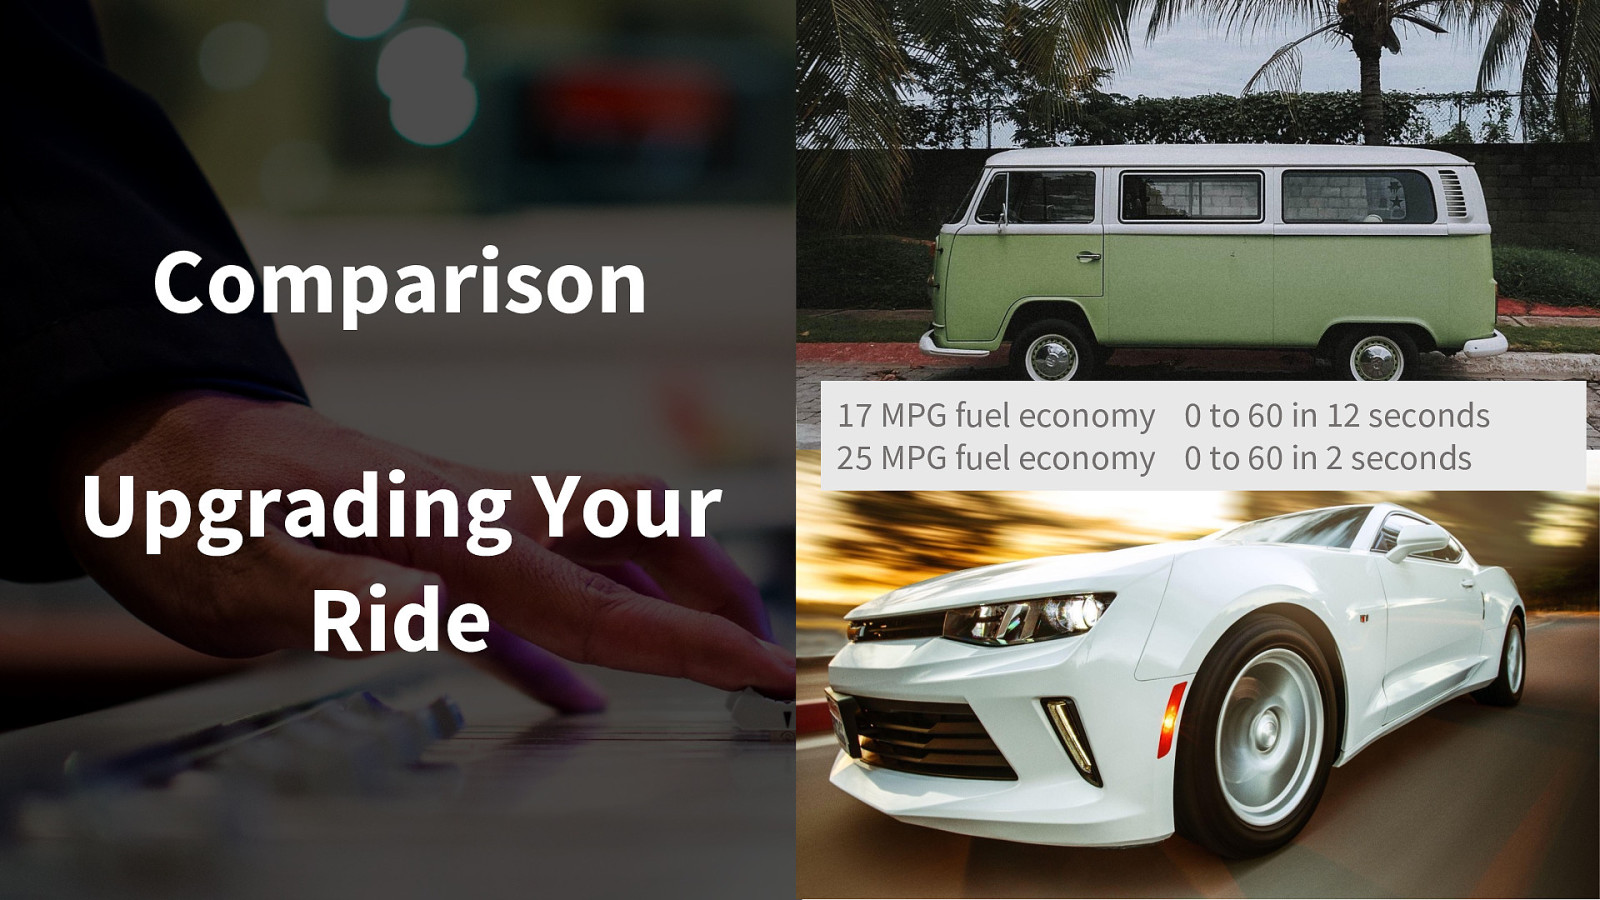
Comparison Upgrading Your Ride 17 MPG fuel economy 0 to 60 in 12 seconds 25 MPG fuel economy 0 to 60 in 2 seconds
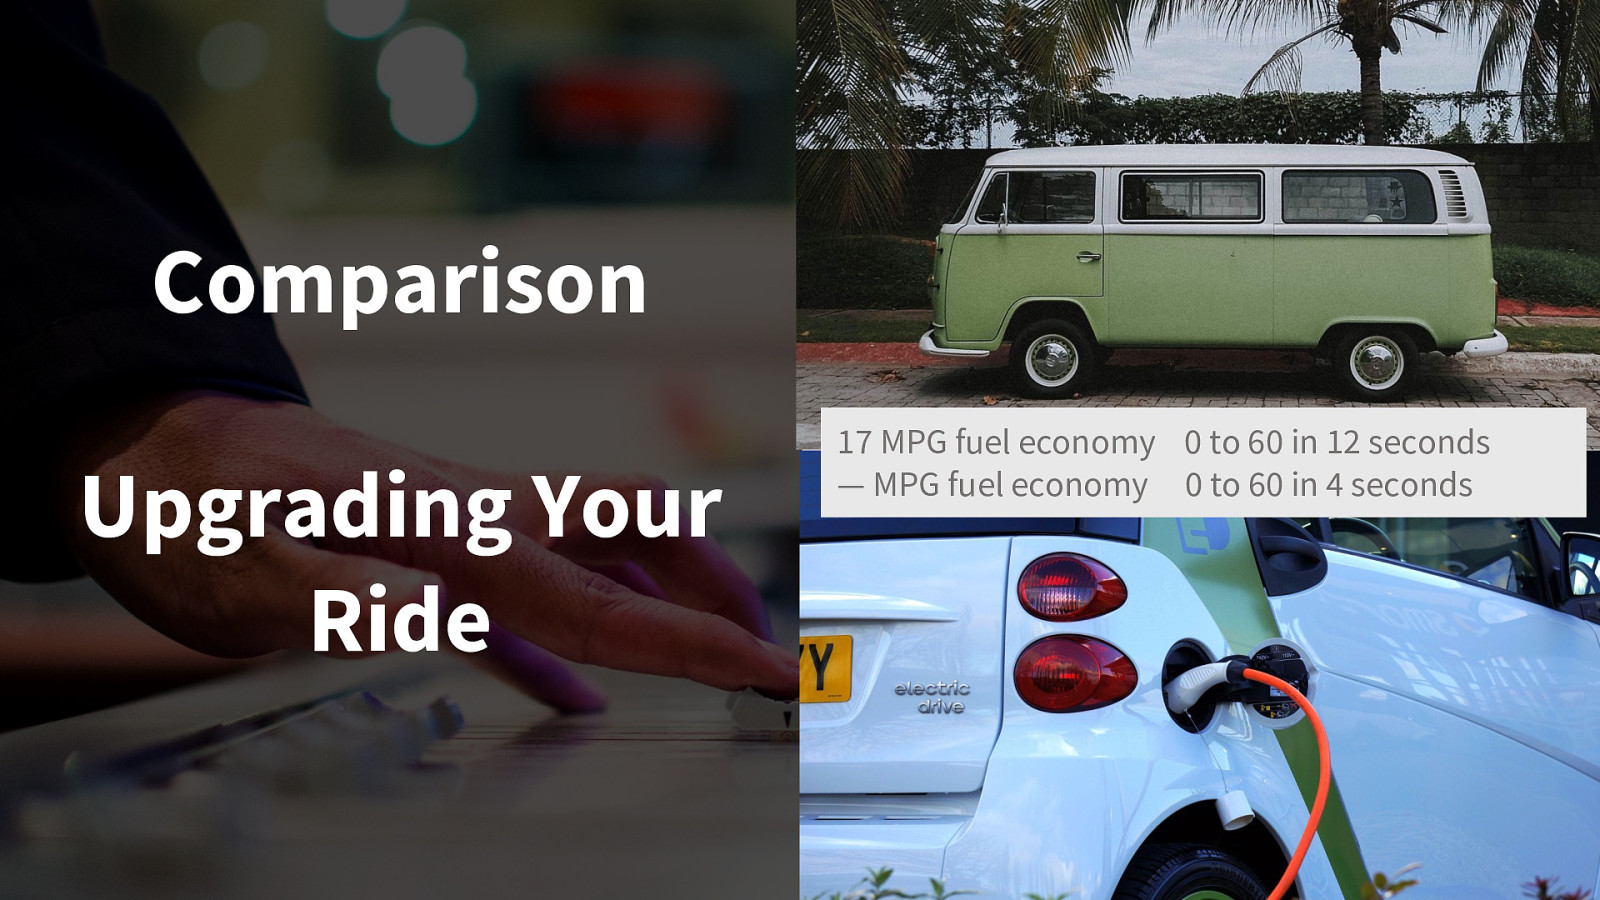
Comparison Upgrading Your Ride 17 MPG fuel economy 0 to 60 in 12 seconds — MPG fuel economy 0 to 60 in 4 seconds
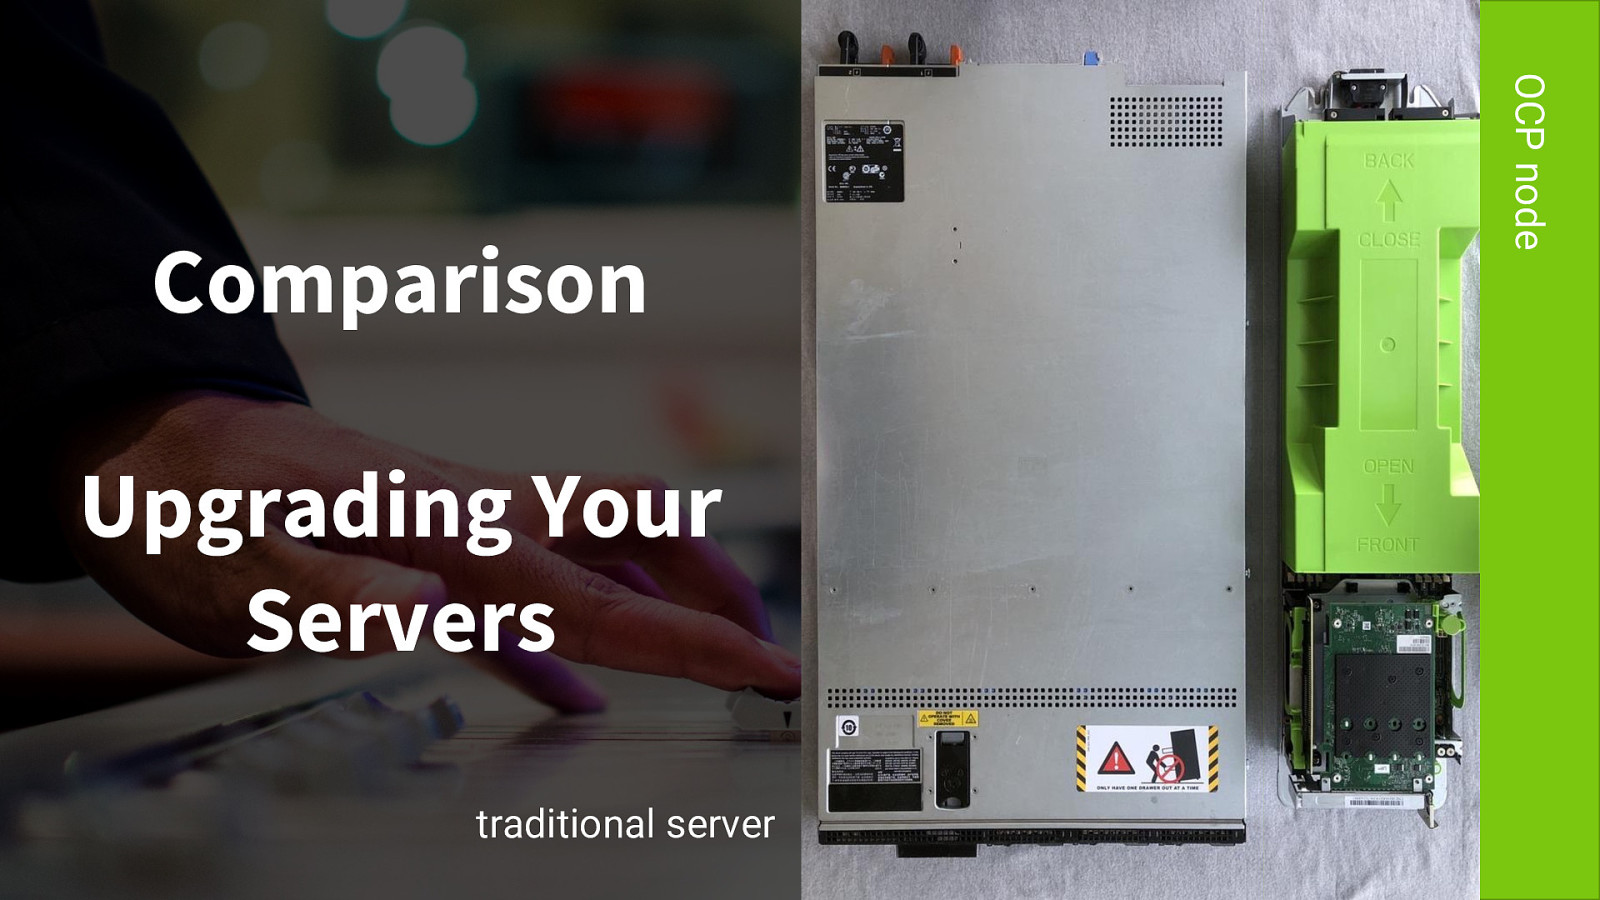
OCP node Comparison Upgrading Your Servers traditional server 17 MPG 0-60 in 12 seconds 25 MPG 0-60 in 2 seconds

Upgrading Your Servers traditional server - dual CPUs, two 1U heatsinks, twelve 1U fans 17 MPG 0-60 in 12 seconds 25 MPG 0-60 in 2 seconds OCP node - dual CPUs, two 2OU heatsinks, two 2OU fans Comparison
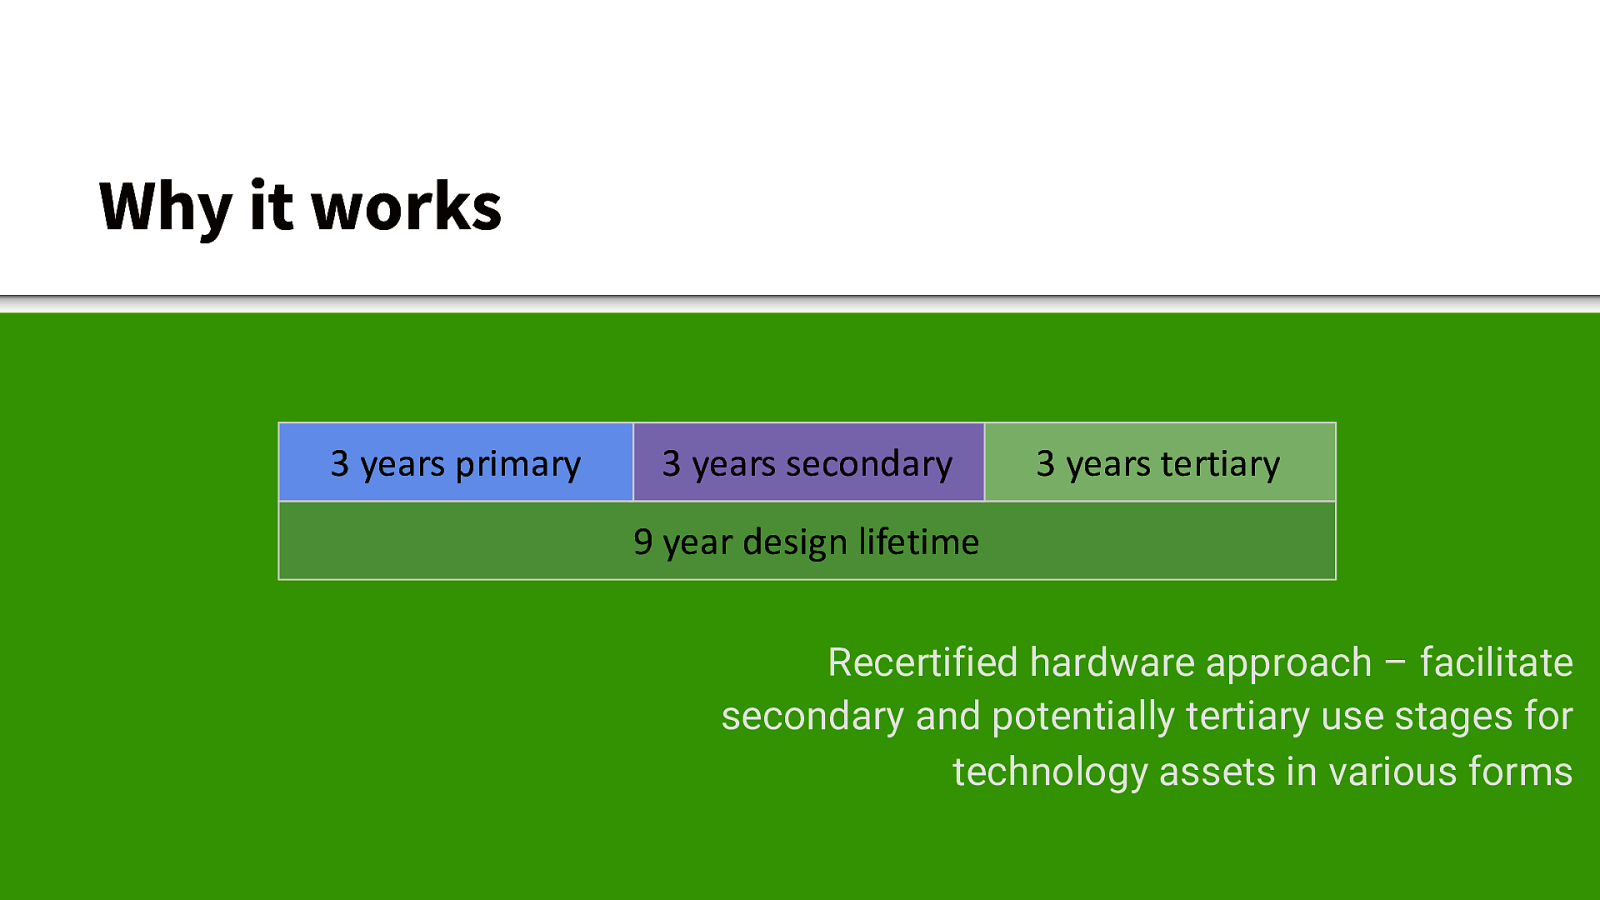
Why it works 3 years primary 3 years secondary 3 years tertiary 9 year design lifetime Recertified hardware approach – facilitate secondary and potentially tertiary use stages for technology assets in various forms
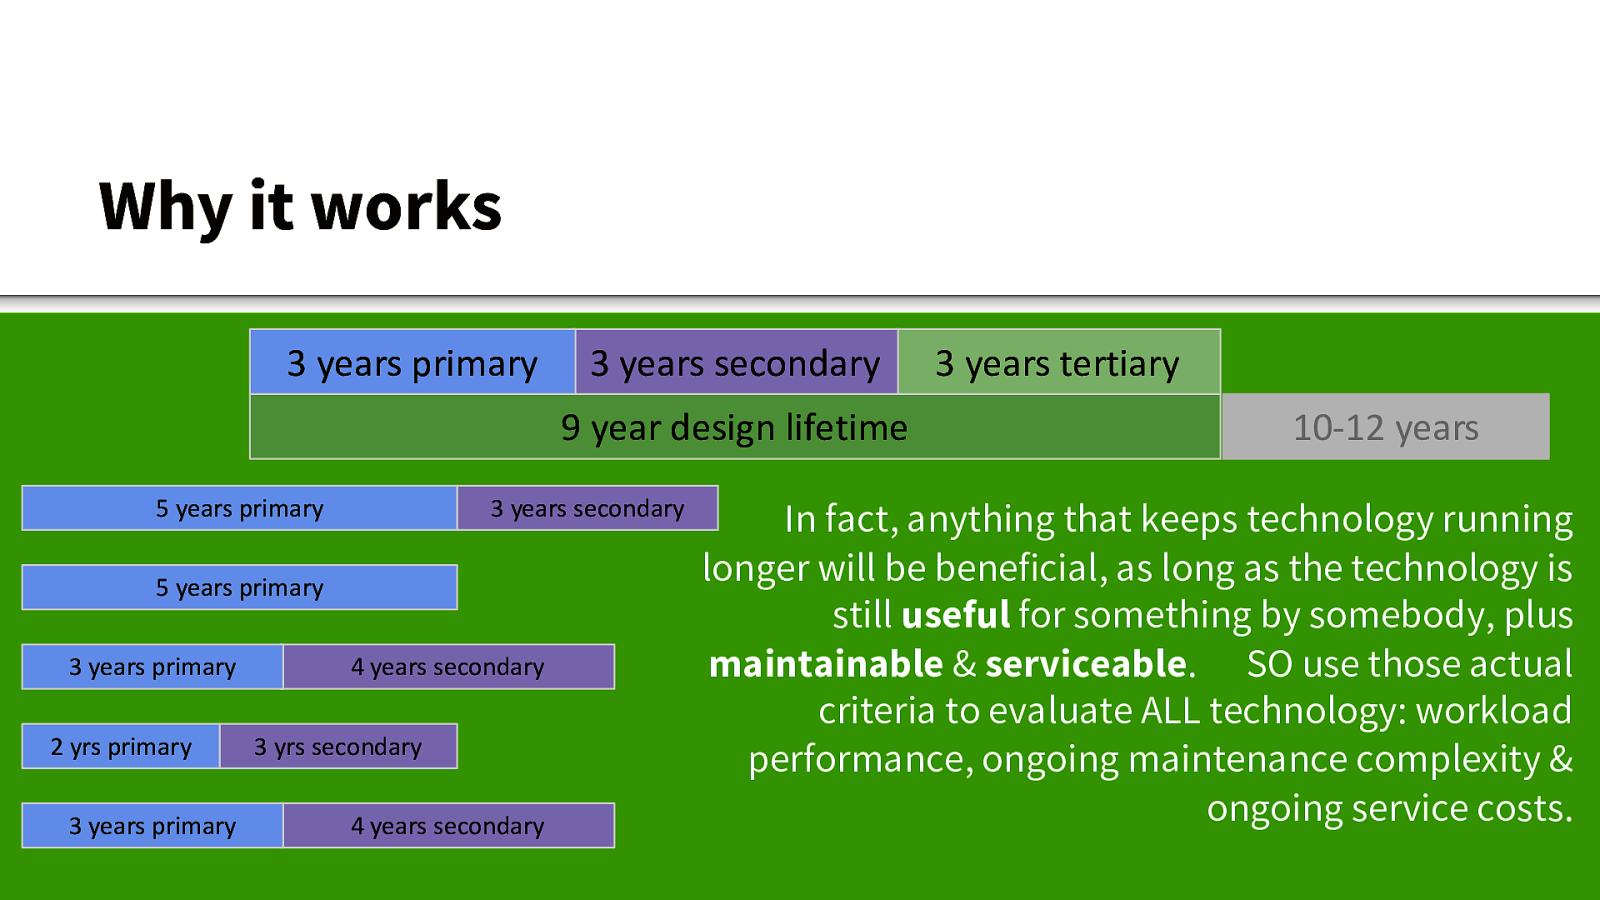
Why it works 3 years primary 3 years secondary 9 year design lifetime 5 years primary 3 years secondary 5 years primary 3 years primary 2 yrs primary 3 years primary 4 years secondary 3 yrs secondary 4 years secondary 3 years tertiary 10-12 years In fact, anything that keeps technology running longer will be beneficial, as long as the technology is still useful for something by somebody, plus maintainable & serviceable. SO use those actual criteria to evaluate ALL technology: workload performance, ongoing maintenance complexity & ongoing service costs.
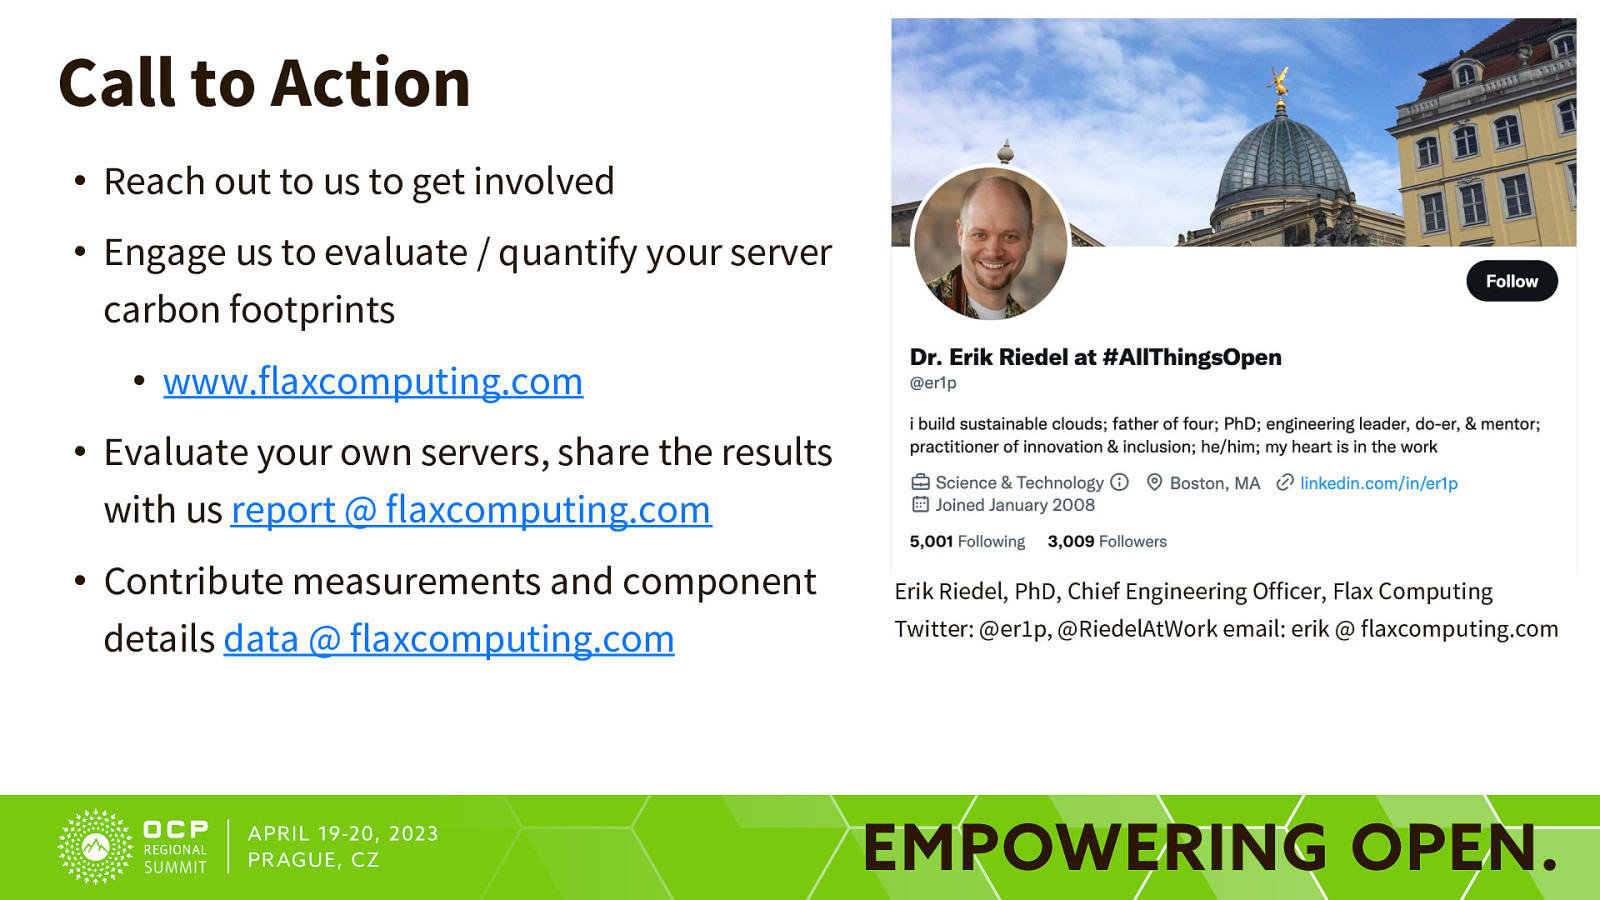
Call to Action • Reach out to us to get involved • Engage us to evaluate / quantify your server carbon footprints • www.flaxcomputing.com • Evaluate your own servers, share the results with us report @ flaxcomputing.com • Contribute measurements and component details data @ flaxcomputing.com Erik Riedel, PhD, Chief Engineering Officer, Flax Computing Twitter: @er1p, @RiedelAtWork email: erik @ flaxcomputing.com

Open Discussion
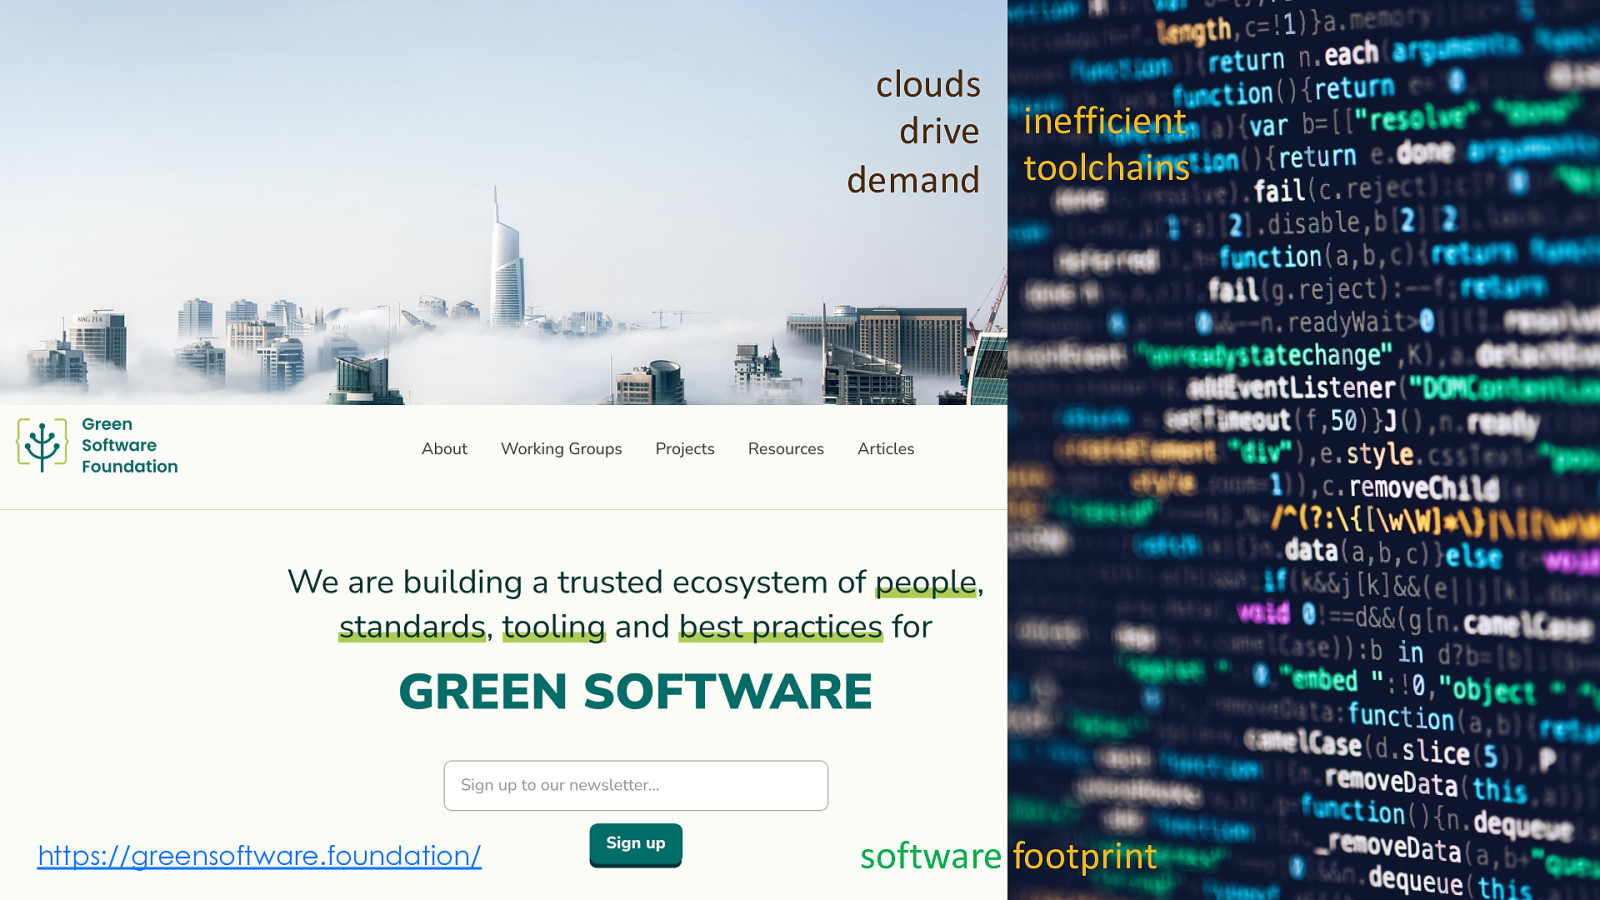
clouds drive demand https://greensoftware.foundation/ inefficient toolchains software footprint
Acknowledgements Photo acknowledgement and thanks to: https://unsplash.com/photos/K5KmnZHv1Pg https://unsplash.com/photos/rmzQwpKt4XM https://unsplash.com/photos/oalS6SkZc_s https://unsplash.com/photos/MgtHZ4zlC1U https://unsplash.com/photos/k39RGHmLoV8 Tom Fisk for https://www.pexels.com/photo/yellow-excavator-2101137 Zetong Li for https://www.pexels.com/photo/green-leafed-plant-1784577 Aleksandar Pasaric for https://www.pexels.com/photo/view-of-cityscape-325185 Anete Lusina for https://www.pexels.com/photo/glass-bottle-with-activated-charcoal-granules-scattered-on-table-6331084/ Oleksandr Pidvalnyi for https://www.pexels.com/photo/color-pencil-lot-2836955/