Active Disks - Remote Execution in Network-Attached Storage

A presentation at Thesis Defense - Carnegie Mellon ECE in November 1999 in Pittsburgh, PA, USA by erik riedel

Slide 1

Slide 1

Active Disks - Remote Execution for Network-Attached Storage Erik Riedel Thesis Defense Electrical and Computer Engineering Prof. David Nagle, ECE Prof. Christos Faloutsos, SCS Prof. Garth Gibson, SCS Prof. Pradeep Khosla, ECE Dr. Jim Gray, Microsoft Research Carnegie Electrical and Computer Engineering Mellon Active Disks http://www.pdl.cs.cmu.edu/Active Thesis Defense

Slide 2

Slide 2

Thesis Statement A number of important I/O-intensive applications can take advantage of computational power available directly at storage devices Computation in Storage Carnegie Electrical and Computer Engineering Mellon Active Disks http://www.pdl.cs.cmu.edu/Active Thesis Defense

Slide 3

Slide 3

Thesis Statement A number of important I/O-intensive applications can take advantage of computational power available directly at storage devices to improve their overall performance Computation in Storage Performance Model Carnegie Electrical and Computer Engineering Mellon Active Disks http://www.pdl.cs.cmu.edu/Active Thesis Defense

Slide 4

Slide 4

Thesis Statement A number of important I/O-intensive applications can take advantage of computational power available directly at storage devices to improve their overall performance, more effectively balance their consumption of system-wide resources Computation in Storage Performance Model Applications & Prototype Carnegie Electrical and Computer Engineering Mellon Active Disks http://www.pdl.cs.cmu.edu/Active Thesis Defense

Slide 5

Slide 5

Thesis Statement A number of important I/O-intensive applications can take advantage of computational power available directly at storage devices to improve their overall performance, more effectively balance their consumption of system-wide resources, and provide functionality that would not otherwise be available. Computation in Storage Performance Model Applications & Prototype Drive-Specific Functionality Carnegie Electrical and Computer Engineering Mellon Active Disks http://www.pdl.cs.cmu.edu/Active Thesis Defense

Slide 6

Slide 6

Outline Motivation Computation in Storage Performance Model Applications & Prototype Drive-Specific Functionality Related Work Contributions & Future Work Carnegie Electrical and Computer Engineering Mellon Active Disks http://www.pdl.cs.cmu.edu/Active Thesis Defense

Slide 7

Slide 7

Motivation Allow faster, more flexible access to storage Storage requirements are pushing • more data • increased sharing • richer data types • novel applications data from www.EMC.com survey of Senior IS Executives

Slide 8

Slide 8

Outline Motivation Computation in Storage Performance Model Applications & Prototype Drive-Specific Functionality Related Work Contributions & Future Work Carnegie Electrical and Computer Engineering Mellon Active Disks http://www.pdl.cs.cmu.edu/Active Thesis Defense

Slide 9

Slide 9

Evolution of Disk Drive Electronics Integration • • • • reduces chip count improves reliability reduces cost future integration to processor on-chip • but there must be at least one chip

Slide 10

Slide 10

Excess Device Cycles Are Coming Here Higher and higher levels of integration in electronics • specialized drive chips combined into single ASIC • technology trends push toward integrated control processor • Siemens TriCore - 100 MHz, 32-bit superscalar today • to 500 MIPS within 2 years, up to 2 MB on-chip memory • Cirrus Logic 3CI - ARM7 core today • to ARM9 core at 200 MIPS in next generation High volume, commodity product • 145 million disk drives sold in 1998 • about 725 petabytes of total storage • manufacturers looking for value-added functionality Carnegie Electrical and Computer Engineering Mellon Active Disks http://www.pdl.cs.cmu.edu/Active Thesis Defense

Slide 11

Slide 11

Opportunity TPC-D 300 GB Benchmark, Decision Support System = 7,344 total MHz Database Server Digital AlphaServer 8400 • 12 x 612 MHz 21164 3 x 266 = 798 MB/s • 8 GB memory • 3 64-bit PCI busses • 29 FWD SCSI controllers 29 x 40 = 1,160 MB/s Storage • 520 rz29 disks • 4.3 GB each • 2.2 TB total = 104,000 total MHz (with 200 MHz drive chips) = 5,200 total MB/s (at 10 MB/s per disk) Controller Controller SCSIController SCSIController SCSIController SCSIController SCSI SCSI Controller Controller SCSIController SCSIController SCSIController SCSIController SCSI SCSI Controller Controller SCSIController SCSIController SCSIController SCSIController SCSI SCSI Controller Controller SCSIController SCSIController SCSIController SCSIController SCSI SCSI Controller Controller SCSIController SCSIController SCSIController SCSIController SCSI SCSI Controller Controller SCSIController SCSIController SCSIController SCSIController SCSI SCSI Controller Controller SCSIController SCSIController SCSIController SCSIController SCSI SCSI Controller Controller SCSIController SCSIController SCSIController SCSIController SCSI SCSI Controller Controller SCSIController SCSIController SCSIController SCSIController SCSI SCSI

Slide 12

Slide 12

Advantage - Active Disks Active Disks execute application-level code on drives Basic advantages of an Active Disk system parallelism compute at the edges • parallel processing - lots of disks • bandwidth reduction - filtering operations are common • scheduling - little bit of “strategy” can go a long way Characteristics of appropriate applications • • • • execution time dominated by data-intensive “core” allows parallel implementation of “core” cycles per byte of data processed - computation data reduction of processing - selectivity Carnegie Electrical and Computer Engineering Mellon Active Disks http://www.pdl.cs.cmu.edu/Active Thesis Defense

Slide 13

Slide 13

Example Application Data mining - association rules [Agrawal95] • • • • • retail data, analysis of “shopping baskets” frequent sets summary counts count of 1-itemsets and 2-itemsets milk & bread => cheese diapers & beer Partitioning with Active Disks • each drive performs count of its portion of the data • counts combined at host for final result Carnegie Electrical and Computer Engineering Mellon Active Disks http://www.pdl.cs.cmu.edu/Active Thesis Defense

Slide 14

Slide 14

Outline Motivation Computation in Storage Performance Model Applications & Prototype Drive-Specific Functionality Related Work Contributions & Future Work Carnegie Electrical and Computer Engineering Mellon Active Disks http://www.pdl.cs.cmu.edu/Active Thesis Defense

Slide 15

Slide 15

Performance Model System Parameters Application Parameters s cpu = CPU speed of the host N in = number of bytes processed r d = disk raw read rate N out = number of bytes produced r n = disk interconnect rate w = cycles per byte t = run time for traditional system t active = run time for active disk system Active Disk Parameters s cpu’ = CPU speed of the disk d = number of disks r d’ = active disk raw read rate Traditional vs. Active Disk Ratios α N = N in ⁄ N out α d = r d’ ⁄ r d r n’ = active disk interconnect rate α n = r n’ ⁄ r n α s = s cpu’ ⁄ s cpu Carnegie Electrical and Computer Engineering Mellon Active Disks http://www.pdl.cs.cmu.edu/Active Thesis Defense

Slide 16

Slide 16

Performance Model Traditional server:  N in N in N in ⋅ w t = max  ——————-, ————-, ————————- + ( 1 – p ) ⋅ t serial  d ⋅ r d r n s cpu  disk network cpu overhead Active Disks:  N in N out N in ⋅ w  t active = max  ———————, ——————, —————————- + ( 1 – p ) ⋅ t serial  d ⋅ r d’ r n’ d ⋅ s cpu’ Carnegie Electrical and Computer Engineering Mellon Active Disks http://www.pdl.cs.cmu.edu/Active Thesis Defense

Slide 17

Slide 17

Throughput Model Scalable throughput • speedup = (#disks)/(host-cpu-speed/disk-cpu-speed) Throughput disk saturation Number of Disks Carnegie Electrical and Computer Engineering Mellon Active Disks http://www.pdl.cs.cmu.edu/Active Thesis Defense

Slide 18

Slide 18

Throughput Model Scalable throughput • speedup = (#disks)/(host-cpu-speed/disk-cpu-speed) Throughput disk saturation host saturation server Number of Disks Carnegie Electrical and Computer Engineering Mellon Active Disks http://www.pdl.cs.cmu.edu/Active Thesis Defense

Slide 19

Slide 19

Throughput Model Scalable throughput • speedup = (#disks)/(host-cpu-speed/disk-cpu-speed) • (host-cpu/disk-cpu-speed) ~ 5 (two processor generations) Throughput disk saturation disk-cpu saturation active disks host saturation server host-cpu ⁄ disk-cpu Number of Disks Carnegie Electrical and Computer Engineering Mellon Active Disks http://www.pdl.cs.cmu.edu/Active Thesis Defense

Slide 20

Slide 20

Throughput Model Scalable throughput • speedup = (#disks)/(host-cpu-speed/disk-cpu-speed) • (host-cpu/disk-cpu-speed) ~ 5 (two processor generations) • selectivity = #bytes-input / #bytes-output Throughput disk saturation disk-cpu saturation transfer saturation active disks host saturation server host-cpu ⁄ disk-cpu selectivity Number of Disks Carnegie Electrical and Computer Engineering Mellon Active Disks http://www.pdl.cs.cmu.edu/Active Thesis Defense

Slide 21

Slide 21

Outline Motivation Computation in Storage Performance Model Applications & Prototype Drive-Specific Functionality Related Work Contributions & Future Work Carnegie Electrical and Computer Engineering Mellon Active Disks http://www.pdl.cs.cmu.edu/Active Thesis Defense

Slide 22

Slide 22

Prototype Comparison Database Server Controller Controller SCSI SCSI Traditional System Digital AlphaServer 500/500 UltraSCSI Controller Controller SCSI SCSI • 500 MHz, 256 MB memory • Seagate Cheetah disks • 4.5 GB, 11.2 MB/s UltraSCSI Controller Obj Stor Obj Stor Network Active Disk System Network Security Controller Controller Obj Stor Obj Stor Network Server Controller Security Network Security Security Digital AXP 3000/400 “Active Disks” Switched Network ATM • 133 MHz, 64 MB, software NASD • Seagate Medallist disks • 4.1 GB, 6.5MB/s

Slide 23

Slide 23

Data Mining & Multimedia Data Mining - association rules [Agrawal95] • frequent sets summary counts • milk & bread => cheese Database - nearest neighbor search • k records closest to input record • with large number of attributes, reduces to scan Multimedia - edge detection [Smith95] • detect edges in an image Multimedia - image registration [Welling97] • find rotation and translation from reference image Carnegie Electrical and Computer Engineering Mellon Active Disks http://www.pdl.cs.cmu.edu/Active Thesis Defense

Slide 24

Slide 24

Data Mining & Multimedia Prototype Scaling Up 250.0 Throughput (MB/s) Throughput (MB/s) 25.0 Frequent Sets 20.0 15.0 Active Disks 10.0 Server 5.0 0.0 1 2 4 6 8 10 Number of Disks Frequent Sets 200.0 150.0 Active Disks 100.0 Server 50.0 0.0 20 40 60 80 100 Number of Disks Prototype performance • factor of 2.5x with Active Disks • scalable in a more realistic, larger system Carnegie Electrical and Computer Engineering Mellon Active Disks http://www.pdl.cs.cmu.edu/Active Thesis Defense

Slide 25

Slide 25

Performance with Active Disks computation throughput memory selectivity bandwidth (inst/byte) (MB/s) (KB) (factor) (KB/s) Search k=10 7 28.6 72 80,500 0.4 Frequent Sets s=0.25% 16 12.5 620 15,000 0.8 Edge Detection t=75 303 0.67 1776 110 6.1 Image Registration 4740 0.04 672 180 0.2 application input Throughput (MB/s) 60.0 0.80 5.0 Search Image Registration Edge Detection 4.0 40.0 3.0 Active Disks 0.60 Active Disks Active Disks 2.0 20.0 Server Server 1.0 0.0 0.40 2 4 6 8 10 0.0 Number of Disks 2 4 6 8 0.20 10 0.00 Number of Disks Scalable performance • crossover at four disks - “technology gap” • cycles/byte => throughput • selectivity => network bottleneck Server 2 4 6 8 Number of Disks 10

Slide 26

Slide 26

Model Validation Frequent Sets 25.0 60.0 20.0 Throughput (MB/s) Throughput (MB/s) Search 80.0 40.0 20.0 15.0 10.0 5.0 0.0 2 4 6 8 Number of Disks 0.0 10 Edge Detection 10 0.80 4.0 Throughput (MB/s) Throughput (MB/s) 4 6 8 Number of Disks Image Registration 5.0 3.0 2.0 1.0 0.0 2 2 4 6 Number of Disks 8 10 0.60 0.40 0.20 0.00 2 4 6 8 Number of Disks 10

Slide 27

Slide 27

Database Systems Basic Operations • select - scan • project - scan & sort • join - scan & hash-join Workload • TPC-D decision support - large data, scale factor of 300 GB uses 520 disks - ad-hoc queries - high-selectivity, “summary” questions Carnegie Electrical and Computer Engineering Mellon Active Disks http://www.pdl.cs.cmu.edu/Active Thesis Defense

Slide 28

Slide 28

TM Digital Equipment Corporation & Oracle Corporation Digital AlphaServer 8400 5/625 12 CPUs using Oracle8 Total System Cost TPC-D Power TPC-D Throughput $2,649,262 Database Size 2406.2 QppD@ 300GB Database Manager 986.1 QthD@ 300GB Operating System 300GB Oracle8 v8.0.4 Digital UNIX V4.0D TPC-D Rev. 1.3.1 Report Date: 27 May 98 Price/Performance $1,720 QphD@ 300GB Other Software Availability Date None May 27, 1998 Power Test Geometric Mean of Power Test Arithmetic Mean of Throughput Test Query Time in Seconds 448.9 UF2 UF1 Q1 Q2a 897.8 Q3 Q4 Q5 Q6 Q7 Q8b Q9 Q10 Q11 Q12b Q13 Q14c Q15b Q16 Q17 0 500 1000 1500 2000 Database Load Time = 22 hours 50 minutes 17 seconds Components Processors Cache Memory per Processor Memory Disk Controllers Disks Total Disk Storage Qty 12 2 29 521 2500 3000 3500 Disk Size/Database Size=7.47 Type 612 Mhz DECchip 21164 4MB 4 GB PCI 4.3 GB Disks 2240.3GB 4000 RAID: No 4500

Slide 29

Slide 29

Active PostgreSQL Select Select (Low Match) Experimental setup Throughput (MB/s) 40.0 • • • • 30.0 20.0 10.0 0.0 2 4 8 Number of Disks 10 database is PostgreSQL 6.5 server is 500 MHz Alpha, 256 MB disks are Seagate Cheetahs vs. n Active Disks • 133 MHz Alpha, 64 MB • Digital UNIX 3.2g • ATM networking vs. Ultra SCSI performance results • SQL select operation (selectivity = 52) • interconnect limited • scalable Active Disk performance Carnegie Electrical and Computer Engineering Mellon Active Disks http://www.pdl.cs.cmu.edu/Active Thesis Defense

Slide 30

Slide 30

Database - Aggregation (Project) l_return sum_revenue sum_qty A 39599.7 29 R 67936.6 71 select sum(l_price), sum(l_qty) from lineitem group by l_return relation S l_orderkey l_shipdate l_qty l_price l_return 1730 01-25-93 6 11051.6 A 3713 04-12-96 32 29600.3 R 7010 10-05-98 23 29356.3 A 32742 05-05-95 8 9281.9 R 36070 11-27-98 31 34167.9 R Carnegie Electrical and Computer Engineering Mellon Active Disks http://www.pdl.cs.cmu.edu/Active Thesis Defense

Slide 31

Slide 31

Database - Aggregation II Query Plan Query Text sum(l_quantity), sum(l_price), Aggregate Group group by l_return Sort SeqScan from lineitem Carnegie Electrical and Computer Engineering Mellon Active Disks http://www.pdl.cs.cmu.edu/Active Thesis Defense

Slide 32

Slide 32

Database - Aggregation II Query Plan Query Text sum(l_quantity), sum(l_price), Aggregate Group group by l_return Modification for Active Disks Sort SeqScan from lineitem AggGrpSort sum(l_quantity), sum(l_price), group by l_return SeqScan from lineitem Carnegie Electrical and Computer Engineering Mellon Active Disks http://www.pdl.cs.cmu.edu/Active Thesis Defense

Slide 33

Slide 33

Active PostgreSQL Aggregation Aggregation Q1 (Group By) Throughput (MB/s) 16.0 • replacement selection sort • maintain sorted heap in memory • combine (aggregate) records when keys match exactly 12.0 8.0 Benefits 4.0 0.0 Algorithm 2 4 8 10 Number of Disks • memory requirements determined by output size • longer average run length • easy to make adaptive Disadvantage • poor memory behavior vs. qsort performance results • SQL sum()…group by operation (selectivity = 650) • cycles/byte = 32, cpu limited Carnegie Electrical and Computer Engineering Mellon Active Disks http://www.pdl.cs.cmu.edu/Active Thesis Defense

Slide 34

Slide 34

Database - Join l_return sum_revenue sum_qty A 40407.9 29 R 34167.9 31 select sum(l_price), sum(l_qty) from lineitem, part where p_name like ‘%green%’ and l_partkey = p_partkey group by l_return relation R relation S p_partkey p_name p_brand p_type l_orderkey l_partkey l_qty l_price l_return 2593 green car vw 11 1730 2593 6 11051.6 A 5059 red boat fast 29 3713 0412 32 29600.3 R 1098 green tree pine 35 7010 1098 23 29356.3 A 0412 blue sky clear 92 5692 red river dirty 34 32742 5059 8 9281.9 R 36070 2593 31 34167.9 R Carnegie Electrical and Computer Engineering Mellon Active Disks http://www.pdl.cs.cmu.edu/Active Thesis Defense

Slide 35

Slide 35

Bloom Join select sum(l_price), sum(l_qty) from lineitem, part where p_name like ‘%green%’ and l_partkey = p_partkey group by l_return Bloom filter relation R p_partkey p_name p_brand p_type 2593 green car vw 11 5059 red boat fast 29 1098 green tree pine 35 0412 blue sky clear 92 5692 red river dirty 34

Slide 36

Slide 36

Bloom Join l_orderkey l_partkey l_qty l_price l_return 1730 2593 6 11051.6 A 7010 1098 23 29356.3 A 36070 2593 31 34167.9 R select sum(l_price), sum(l_qty) from lineitem, part where p_name like ‘%green%’ and l_partkey = p_partkey group by l_return Bloom filter relation S relation R l_orderkey l_partkey l_qty l_price l_return 1730 2593 6 11051.6 A p_partkey p_name p_brand p_type 3713 0412 32 29600.3 R 2593 green car vw 11 7010 1098 23 29356.3 A 5059 red boat fast 29 1098 green tree pine 35 0412 blue sky clear 92 5692 red river dirty 34 32742 5059 8 9281.9 R 36070 2593 31 34167.9 R

Slide 37

Slide 37

Bloom Join l_orderkey l_partkey l_qty l_price l_return 1730 2593 6 11051.6 A 7010 1098 23 29356.3 A 36070 2593 31 34167.9 R select sum(l_price), sum(l_qty) from lineitem, part where p_name like ‘%green%’ and l_partkey = p_partkey group by l_return Bloom filter relation S relation R l_orderkey l_partkey l_qty l_price l_return 1730 2593 6 11051.6 A p_partkey p_name p_brand p_type 3713 0412 32 29600.3 R 2593 green car vw 11 7010 1098 23 29356.3 A 5059 red boat fast 29 1098 green tree pine 35 0412 blue sky clear 92 5692 red river dirty 34 32742 5059 8 9281.9 R 36070 2593 31 34167.9 R

Slide 38

Slide 38

Bloom Join l_return sum_revenue sum_qty A 40407.9 29 R 34167.9 31 l_orderkey l_partkey l_qty l_price l_return 1730 2593 6 11051.6 A 7010 1098 23 29356.3 A 36070 2593 31 34167.9 R select sum(l_price), sum(l_qty) from lineitem, part where p_name like ‘%green%’ and l_partkey = p_partkey group by l_return Bloom filter relation S relation R l_orderkey l_partkey l_qty l_price l_return 1730 2593 6 11051.6 A p_partkey p_name p_brand p_type 3713 0412 32 29600.3 R 2593 green car vw 11 7010 1098 23 29356.3 A 5059 red boat fast 29 1098 green tree pine 35 0412 blue sky clear 92 5692 red river dirty 34 32742 5059 8 9281.9 R 36070 2593 31 34167.9 R

Slide 39

Slide 39

Active PostgreSQL Join Two-Way Join Algorithm Throughput (MB/s) 30.0 25.0 20.0 15.0 10.0 5.0 0.0 2 4 Number of Disks 8 10 • read R to host • create hash table for R • generate Bloom filter • broadcast filter to all disks • parallel scan at disks • semi-join to host • final join at host performance results • SQL 2-way join operation (selectivity = 8) • will eventually be network limited Carnegie Electrical and Computer Engineering Mellon Active Disks http://www.pdl.cs.cmu.edu/Active Thesis Defense

Slide 40

Slide 40

Active PostgreSQL Join II Join Q9 (5-way) Experimental setup Throughput (MB/s) 10.0 • • • • 8.0 6.0 4.0 2.0 0.0 2 4 8 10 Number of Disks database is PostgreSQL 6.5 server is 500 MHz Alpha, 256 MB disks are Seagate Cheetahs vs. n Active Disks • 133 MHz Alpha, 64 MB • Digital UNIX 3.2g • ATM networking vs. Ultra SCSI performance results • SQL 5-way join operation • large serial fraction, Amdahl’s Law kicks in Carnegie Electrical and Computer Engineering Mellon Active Disks http://www.pdl.cs.cmu.edu/Active Thesis Defense

Slide 41

Slide 41

Model Validation (Database) Aggregation Q1 (Group By) Select Q1 (5% Match) 30.0 Throughput (MB/s) Throughput (MB/s) 70.0 50.0 30.0 10.0 0.0 4 8 12 20.0 10.0 0.0 16 Number of Disks 4 8 12 16 4 8 12 Number of Disks 16 Number of Disks Two-Way Join Join Q9 30.0 Throughput (MB/s) Throughput (MB/s) 10.0 20.0 10.0 0.0 4 8 12 Number of Disks 16 8.0 6.0 4.0 2.0 0.0 Carnegie Electrical and Computer Engineering Mellon Active Disks http://www.pdl.cs.cmu.edu/Active Thesis Defense

Slide 42

Slide 42

Database - Summary Active PostgreSQL Prototype Query Q1 Q5 Q6 Q9 Bottleneck computation serial fraction interconnect serial fraction Traditional (seconds) 76.0 219.0 27.2 95.0 Active Disks (seconds) 38.0 186.5 17.0 85.4 Improvement 100% 17% 60% 11% Measured performance • four most expensive of the 17 TPC-D queries • compares eight disk systems • PostgreSQL 6.5 with Active Disk modifications Carnegie Electrical and Computer Engineering Mellon Active Disks http://www.pdl.cs.cmu.edu/Active Thesis Defense

Slide 43

Slide 43

Database - Extrapolation Estimated Speedup on Digital 8400 (TPC-D, May 1998) Query Q1 Q5 Q6 Q9 Bottleneck computation serial fraction interconnect serial fraction Traditional (seconds) 4,357.1 1988.2 63.1 2710.8 Active Disks (seconds) 307.7 1,470.8 6.1 2,232.1 Improvement 1,320% 35% 900% 22% Predicted performance • comparison of Digital 8400 with 520 traditional disks • vs. the same system with 520 Active Disks Carnegie Electrical and Computer Engineering Mellon Active Disks http://www.pdl.cs.cmu.edu/Active Thesis Defense

Slide 44

Slide 44

Database - Extrapolation Estimated Speedup on Digital 8400 (TPC-D, May 1998) Query Bottleneck Q1 computation Q5 serial fraction Q6 interconnect Q9 serial fraction Other Qs Overall Traditional Active Disks (seconds) (seconds) 4,357.1 307.7 1988.2 1,470.8 63.1 6.1 2710.8 2,232.1 assume unchanged 18,619.5 13,517.0 Improvement 1,320% 35% 900% 22% 38% Predicted performance • comparison of Digital 8400 with 520 traditional disks • vs. the same system with 520 Active Disks Carnegie Electrical and Computer Engineering Mellon Active Disks http://www.pdl.cs.cmu.edu/Active Thesis Defense

Slide 45

Slide 45

Database - Extrapolation Estimated Speedup on Digital 8400 (TPC-D, May 1998) Query Bottleneck Q1 computation Q5 serial fraction Q6 interconnect Q9 serial fraction Other Qs Overall Cost Traditional Active Disks (seconds) (seconds) 4,357.1 307.7 1988.2 1,470.8 63.1 6.1 2710.8 2,232.1 assume unchanged 18,619.5 13,517.0 $2,649,262 $3,034,045 Improvement 1,320% 35% 900% 22% 38% 15% Predicted performance • comparison of Digital 8400 with 520 traditional disks • vs. the same system with 520 Active Disks • overall cost increase of about 15% - assuming an Active Disk costs twice a traditional disk Carnegie Electrical and Computer Engineering Mellon Active Disks http://www.pdl.cs.cmu.edu/Active Thesis Defense

Slide 46

Slide 46

Outline Motivation Computation in Storage Performance Model Applications & Prototype Drive-Specific Functionality Related Work Contributions & Future Work Carnegie Electrical and Computer Engineering Mellon Active Disks http://www.pdl.cs.cmu.edu/Active Thesis Defense

Slide 47

Slide 47

Additional Functionality Data Mining for Free • process sequential workload during “idle” time in OLTP • allows e.g. data mining on an OLTP system Action in Today’s Disk Drive B 1 foreground demand request 2 A seek from A to B 3 wait for rotation read block Modified Action With “Free” Block Scheduling B 1a background requests C A seek from A to C 1b C read “free” block at C, seek from C to B 2 wait for rotation 3 read block

Slide 48

Slide 48

Data Mining for Free • combine background and “free” blocks OLTP Throughput − 1 disk Mining Throughput 2500 60 throughput (KB/s) throughput (req/s) 70 50 40 30 20 2000 1500 1000 500 10 0 0 10 20 30 40 50 multiprogramming level (MPL) of OLTP average response time (ms) OLTP Response Time 400 300 200 100 0 0 10 20 30 40 50 multiprogramming level (MPL) of OLTP 0 0 10 20 30 40 50 multiprogramming level (MPL) of OLTP Integrated scheduling • possible only at drives • combines applicationlevel and disk-level information • achieves 30% of the drives sequential bandwidth “for free”

Slide 49

Slide 49

Outline Motivation Computation in Storage Performance Model Applications & Prototype Drive-Specific Functionality Related Work Contributions & Future Work Carnegie Electrical and Computer Engineering Mellon Active Disks http://www.pdl.cs.cmu.edu/Active Thesis Defense

Slide 50

Slide 50

Related Work Database Machines (CASSM, RAP, Gamma) • • • • today’s advantages - higher disk bandwidth, parallelism general-purpose programmability parallel databases (Teradata, Tandem, Oracle, IBM) CAFS and SCAFS search accelerator (ICL, Fujitsu) Parallel Programming • automatic data parallelism (HPF), task parallelism (Fx) • parallel I/O (Kotz, IBM, Intel) Parallel Database Operations • scan [Su75, Ozkarahan75, DeWitt81, …] • sort [Knuth73, Salzberg90, DeWitt91, Blelloch97, …] • hash-join [Kitsuregawa83, DeWitt85, …] Carnegie Electrical and Computer Engineering Mellon Active Disks http://www.pdl.cs.cmu.edu/Active Thesis Defense

Slide 51

Slide 51

Related Work - “Smart Disks” Intelligent Disks (Berkeley) • • • • SMP database functions [Keeton98] analytic model, large speedups for join and sort (!) different architecture - everything is iDisks disk layout [Wang98], write optimizations Programming Model (Santa Barbara/Maryland) • select, sort, image processing via extended SCSI [Acharya98] • simulation comparisons among Active Disks, Clusters, SMPs • focus on network bottlenecks SmartSTOR (Berkeley/IBM) • analysis of TPC-D, significant benefits possible (!) • suggest using one processor for multiple disks • “simple” functions have limited benefits Carnegie Electrical and Computer Engineering Mellon Active Disks http://www.pdl.cs.cmu.edu/Active Thesis Defense

Slide 52

Slide 52

Contributions Exploit technology trends • “excess” cycles on individual disk drives • large systems => lots of disks => lots of power Analytic • performance model - predicts within 25% • algorithms & query optimizer - map to Active Disk functions Prototype • data mining & multimedia - 2.5x in prototype, scale to 10x • database with TPC-D benchmark - 20% to 2.5x in prototype, extrapolate 35% to 15x in larger system • changed ~2% of database code, run ~5% of code at drives Novel functionality • data mining for free - close to 30% bandwidth “for free” Conclusion - lots of potential and realistically attainable

Slide 53

Slide 53

Future Work Extension of Database Functions • optimization for index-based scans • update and small request performance Programming Model - Application Layers • • • • explicit programmer-controlled? vs. fully adaptive application mobility? databases have query optimizers, filesystems don’t challenges: identify “structure” and identify “functions” Masses of Storage, Pervasive Storage • large volumes of data • really large scale (1,000s or 10,000s of devices) • MEMS-devices w/ storage and compute, everything is “active” Carnegie Electrical and Computer Engineering Mellon Active Disks http://www.pdl.cs.cmu.edu/Active Thesis Defense

Slide 54

Slide 54

Detail Slides Carnegie Electrical and Computer Engineering Mellon Active Disks http://www.pdl.cs.cmu.edu/Active Thesis Defense

Slide 55

Slide 55

Amdahl’s Law serial = S p⋅S ( 1 – p ) ⋅ S + —————n parallel = ————————————————————-S Speedup in a Parallel System • p is parallel fraction • (1 - p) serial fraction is not improved Carnegie Electrical and Computer Engineering Mellon Active Disks http://www.pdl.cs.cmu.edu/Active Thesis Defense

Slide 56

Slide 56

Database - Select l_orderkey l_shipdate l_qty l_price 7010 10-05-98 23 29356.3 36070 11-27-98 31 34167.9 select * from lineitem where l_shipdate > ‘01-01-1998’ relation S l_orderkey l_shipdate l_qty l_price l_disc 1730 01-25-93 6 11051.6 0.02 3713 04-12-96 32 29600.3 0.07 7010 10-05-98 23 29356.3 0.09 32742 05-05-95 8 9281.9 0.01 36070 11-27-98 31 34167.9 0.04 Carnegie Electrical and Computer Engineering Mellon Active Disks http://www.pdl.cs.cmu.edu/Active Thesis Defense

Slide 57

Slide 57

Bloom Join Use only Bloom filter at disks • semi-join only, final join at host • fixed-size bit vectors - memory size O(1)! Query Join Q3 Q5 Q9 Q10 1.1 4.1 1.1 2.1 Size of Bloom filter Keys Table 128 bits 8 kilobytes 64 kilobytes 1 megabyte ideal MB GB 1.00 0.90 1.00 - 0.33 0.22 0.11 0.33 0.33 0.22 0.11 0.21 0.33 0.22 0.11 0.21 0.21 0.22 0.05 0.08 12.4 0.9 4.0 21.9 4.2 0.3 4.7 28.6 Memory size required at each disk • from TPC-D queries at 100 GB scale factor • using a single hash function for all tables and keys Carnegie Electrical and Computer Engineering Mellon Active Disks http://www.pdl.cs.cmu.edu/Active Thesis Defense

Slide 58

Slide 58

Outline Motivation Computation in Storage Performance Model Applications & Prototype Software Structure Drive-Specific Functionality Related Work Contributions & Future Work Carnegie Electrical and Computer Engineering Mellon Active Disks http://www.pdl.cs.cmu.edu/Active Thesis Defense

Slide 59

Slide 59

Database Primitives Scan • evaluate predicate, return matching records • low memory requirement Join • identify matching records in semijoin • via direct table lookup • or Bloom filter, when memory is limited Aggregate/Sort • replacement selection with record merging • memory size proportional to result, not input • runs of length 2m when used in full mergesort Carnegie Electrical and Computer Engineering Mellon Active Disks http://www.pdl.cs.cmu.edu/Active Thesis Defense

Slide 60

Slide 60

Execute Node query parameters system catalogs Qual HeapTuple matching tuple ExecScan tuple table schema TupleDesc SeqScan ExprEval memory page Heap data type operators Heap disk page File Disk traditional disk FuncMgr adt/datetime adt/float adt/varchar adt/network adt/geo_ops

Slide 61

Slide 61

Active Disk Structure query parameters system catalogs Qual HeapTuple memory page matching tuple ExecScan tuple table schema TupleDesc SeqScan ExprEval Heap data type operators Heap disk page File Disk active disk FuncMgr adt/datetime adt/float adt/varchar adt/network adt/geo_ops

Slide 62

Slide 62

Data Mining for Free • read background blocks only when queue is empty OLTP Throughput − 1 disk Mining Throughput 2500 60 throughput (KB/s) throughput (req/s) 70 50 40 30 20 2000 1500 1000 500 10 0 0 10 20 30 40 50 multiprogramming level (MPL) of OLTP average response time (ms) OLTP Response Time 400 300 200 100 0 0 10 20 30 40 50 multiprogramming level (MPL) of OLTP 0 0 10 20 30 40 50 multiprogramming level (MPL) of OLTP Background scheduling • vary multiprogramming level - total number of pending requests • background forced out at high foreground load • up to 30% response time impact at low load

Slide 63

Slide 63

Data Mining for Free • read background blocks only when completely “free” OLTP Throughput − 1 disk Mining Throughput 2500 60 throughput (KB/s) throughput (req/s) 70 50 40 30 20 2000 1500 1000 500 10 0 0 10 20 30 40 50 multiprogramming level (MPL) of OLTP average response time (ms) OLTP Response Time 400 300 200 100 0 0 10 20 30 40 50 multiprogramming level (MPL) of OLTP 0 0 10 20 30 40 50 multiprogramming level (MPL) of OLTP Free block scheduling • opportunistic read • constant background bandwidth, even at highest loads • no impact on foreground respond time

Slide 64

Slide 64

Data Mining for Free • combine background and “free” blocks OLTP Throughput − 1 disk Mining Throughput 2500 60 throughput (KB/s) throughput (req/s) 70 50 40 30 20 2000 1500 1000 500 10 0 0 10 20 30 40 50 multiprogramming level (MPL) of OLTP average response time (ms) OLTP Response Time 400 300 200 100 0 0 10 20 30 40 50 multiprogramming level (MPL) of OLTP 0 0 10 20 30 40 50 multiprogramming level (MPL) of OLTP Integrated scheduling • possible only at drives • combines applicationlevel and disk-level information • achieves 30% of the drives sequential bandwidth “for free”

Slide 65

Slide 65

Extra Slides Carnegie Electrical and Computer Engineering Mellon Active Disks http://www.pdl.cs.cmu.edu/Active Thesis Defense

Slide 66

Slide 66

Why Isn’t This Parallel Programming? It is • parallel cores • distributed computation • serial portion needs to be small Disks are different • • • • • must protect the data, can’t “just reboot” must continue to serve demand requests memory/CPU ratios driven by cost, reliability, volume come in boxes of ten basic advantage - compute close to the data Opportunistically use this power • e.g. data mining possible on an OLTP system • ok to “waste” the power if it can’t be used Carnegie Electrical and Computer Engineering Mellon Active Disks http://www.pdl.cs.cmu.edu/Active Thesis Defense

Slide 67

Slide 67

Application Characteristics Critical properties for Active Disk performance • cycles/byte => maximum throughput • memory footprint • selectivity => network bandwidth computation throughput memory selectivity bandwidth (instr/byte) (MB/s) (KB) (factor) (KB/s) Select m=1% 7 28.6 100 290 Search k=10 7 28.6 72 80,500 0.4 Frequent Sets s=0.25% 16 12.5 620 15,000 0.8 Edge Detection t=75 303 0.67 1776 110 6.1 Image Registration 4740* 0.04 672 180 0.2 application Select Frequent Sets Edge Detection input m=20% s=0.025% t=20 7 16 394 28.6 12.5 0.51 2,000 1750 5 14,000 3 Carnegie Electrical and Computer Engineering Mellon Active Disks http://www.pdl.cs.cmu.edu/Active Thesis Defense 5,700 0.9 170

Slide 68

Slide 68

Sorts Local Sort Phase • replacement selection in Active Disk memory process as data comes off the disk • build sorted runs of average size 2m • can easily adapt to changes in available memory Local Merge Phase • perform sub-merges at disks less runs to process at host • also adaptable to changes in memory Global Merge Phase • moves all data to the host and back Optimizations • duplicate removal, aggregation lower requirements memory required only for result, not source relations Bottleneck is the Network - the Data Must Move Once • so goal is optimal utilization of links

Slide 69

Slide 69

Sort Performance Key-Only Sort 60.0 60.0 50.0 Active Disks 40.0 30.0 Server 20.0 10.0 0.0 8 16 32 48 Number of Disks Throughput (MB/s) 70.0 Network is the bottleneck • Active Disks benefit from reduced interconnect traffic • using key-only sort improves both systems • with direct disk to disk transfers, data never goes to the host 50.0 40.0 30.0 Active Disks Server 20.0 10.0 0.0 64 16 32 64 96 Number of Disks 128 Key-Only Sort (Allow Disk-to-Disk) 400.0 Throughput (MB/s) Throughput (MB/s) Full Data Sort 70.0 300.0 Active Disks 200.0 100.0 0.0 Server 64 96 16 32 Number of Disks 128 Carnegie Electrical and Computer Engineering Mellon Active Disks http://www.pdl.cs.cmu.edu/Active Thesis Defense

Slide 70

Slide 70

Database - Joins Size of R determines Active Disk partitioning • if |R| << |S| (R is the inner, smaller relation) - and |R| < |Active Disk memory| embarassingly parallel, linear speedup

  • and |R| < |Server memory| retain portion of R at each disk, and “assist” Server • if |R| ~ |S| and |R| > |Server memory| process R in parallel, minimize network traffic • pre-join scan on S and R is always a win reduces interconnect traffic Server Active Disk System Switched Network 4 - 64 MB Controller Controller Obj Stor Obj Stor Network Security Network Security 4,096 MB Assumptions • non-indexed keys • not partition keys • large S (multi-GB) => many disks AlphaServer 8400 TPC-D • 521 disks, low CPU cost • network bottlenecked

Slide 71

Slide 71

Join Performance 1 gigabyte R join 4 gigabyte S 1 gigabyte R join 128 gigabyte S 40.0 500.0 Server Throughput (MB/s) Throughput (MB/s) 45.0 35.0 30.0 Active Disks 25.0 20.0 15.0 10.0 16 32 64 96 Number of Disks 128 400.0 300.0 Active Disks 200.0 100.0 0.0 Server 64 96 16 32 Number of Disks 128 benefits from reduced interconnect traffic • determinant is relative size of inner and outer relations • savings in network transfer • vs. multiple passes at disks Carnegie Electrical and Computer Engineering Mellon Active Disks http://www.pdl.cs.cmu.edu/Active Thesis Defense

Slide 72

Slide 72

Database - TPC-D Query 1 Data Reduction Sort Aggr 9 -> 9 33,935 -> 9 Query Plan Query Text order by l_returnflag, l_linestatus Sort sum(l_quantity), sum(l_price), sum(l_price*(1-l_disc)), sum(l_price*(1-l_disc)(1+l_tax)), avg(l_quantity), avg(l_price), avg(l_disc), count() Aggregate Group 33,935 -> 33,935 Group group by l_returnflag, l_linestatus Sort 33,935 -> 33,935 Sort where l_shipdate <= ’1998-09-02’ Qual 35,189 -> 33,935 Scan 126,440 -> 35,189 SeqScan select l_returnflag, l_linestatus, from lineitem 126,440 KB (15,805 pages) on disk Query Result input output l_rf|l_ls|sum_qty|sum_base_price|sum_disc_price| sum_charge|avg_qty| price| disc| count ——+——+———-+———————+———————+———————+———-+————+——-+——-A |F |3773034| 5319329289.67| 5053976845.78| 5256336547.67| 25.509|35964.01|0.049|147907 N |F | 100245| 141459686.10| 134380852.77| 139710306.87| 25.625|36160.45|0.050| 3912 N |O |7464940|10518546073.97| 9992072944.46|10392414192.06| 25.541|35990.12|0.050|292262 R |F |3779140| 5328886172.98| 5062370635.93| 5265431221.82| 25.548|36025.46|0.050|147920 (4 rows)

Slide 73

Slide 73

Database - Data Reduction Data Reduction for Sequential Scan and Aggregation Query Input Data (KB) Q1 Q4 Q6 126,440 29,272 126,440 SeqScan Result (KB) 34,687 86 177 SeqScan Aggregate Aggregate Savings Result Savings (selectivity) (bytes) (selectivity) 3.6 240 147,997.9 340.4 80 1100.8 714.4 8 22,656.0 Input Table l_okey|l_quantity| l_price|l_disc|l_tax|l_rf|l_ls|l_shipdate|l_commitdate|l_receiptdate|l_shipmode|l_comment ———+—————+————+———+——-+——+——+—————+——————+——————-+—————+————1730| 6|11051.58| 0.02| 0|N |O |09-02-1998| 10-10-1998| 09-13-1998|TRUCK |wSRnnCx2 3713| 32|29600.32| 0.07| 0.03|N |O |09-02-1998| 06-11-1998| 09-28-1998|TRUCK |MOgnCO1 7010| 23|29356.28| 0.09| 0.06|N |O |09-02-1998| 08-01-1998| 09-14-1998|MAIL |jPNQlx3i 19876| 4| 6867.24| 0.09| 0.08|N |O |09-02-1998| 09-06-1998| 09-29-1998|AIR |3nRkNn4 24839| 8|12845.52| 0.05| 0.02|N |O |09-02-1998| 10-14-1998| 09-06-1998|REG AIR |jlw61g3 25217| 10| 18289.1| 0.05| 0.07|N |O |09-02-1998| 08-12-1998| 09-26-1998|TRUCK |SQ7xS5 29348| 29|41688.08| 0.05| 0.02|N |O |09-02-1998| 07-04-1998| 09-18-1998|FOB |C0NxhzM 32742| 8| 9281.92| 0.01| 0.03|N |O |09-02-1998| 07-17-1998| 09-19-1998|FOB |N3MO1C 36070| 31|34167.89| 0.04| 0|N |O |09-02-1998| 07-11-1998| 09-21-1998|REG AIR |k10wyR […more…] (600752 rows) Carnegie Electrical and Computer Engineering Mellon Active Disks http://www.pdl.cs.cmu.edu/Active Thesis Defense

Slide 74

Slide 74

Database - Aggregation Data Reduction Query Plan Query Text select Aggr 43 -> 1 sum(l_price*l_disc) Aggregate SeqScan Qual 9,383 -> 43 Scan 126,440 -> 9,383 where l_shipdate >= ’1994-01-01’ and l_shipdate < ’1995-01-01’ and l_disc between 0.05 and 0.07 and l_quantity < 24 from lineitem 126,440 KB (15,805 pages) on disk input output Query Result revenue —————11450588.04 (1 row)

Slide 75

Slide 75

Database - Partitioning How to split operations between host and drives? Answer: Use existing query optimizer • operation costs • per-table and per-attribute statistics • ok if they are slightly out-of-date, only an estimate Input Data Query (KB) Q1 Q4 Q6 126,440 29,272 126,440 Scan Result (KB) 35,189 2,343 9,383 Optimizer Estimate (KB) 35,189 2,343 9,383 Qualifier Result (KB) 34,687 86 177 Optimizer Aggregate Optimizer Estimate Result Estimate (KB) (bytes) (bytes) 33,935 240 9,180 141 80 64 43 8 8 Move ops to drives if there are sufficient resources • if selectivity and parallelism overcome slower CPU Be prepared to revert to host as two-stage algorithm • consider the disk as “pre-filtering” • still offloads significant host CPU and interconnect

Slide 76

Slide 76

Database - Optimizer Statistics starelid|staattnum|staop|stalokey |stahikey ————+————-+——-+——————+———————————18663| 1| 66| 1|600000 18663| 2| 66| 1|20000 18663| 3| 66| 1|1000 18663| 4| 66| 1|7 18663| 5| 295| 1|50 18663| 6| 295| 901|95949.5 18663| 7| 295| 0|0.1 18663| 8| 295| 0|0.08 18663| 9| 1049| A|R 18663| 10| 1049| F|O 18663| 11| 1087| 01-02-1992|12-01-1998 18663| 12| 1087| 01-31-1992|10-31-1998 18663| 13| 1087| 01-08-1992|12-30-1998 18663| 14| 1049| COLLECT COD|TAKE BACK RETURN 18663| 15| 1049| AIR|TRUCK 18663| 16| 1049| 0B6wmAww2Pg|zzzyRPS40ABMRSzmPyCNzA6 […more…] (61 rows) attrelid|attname |atttypid|attdisbursion|attlen|attnum ————+———————-+————+——————-+———+——-18663|l_orderkey | 23| 2.33122e-06| 4| 1 18663|l_partkey | 23| 1.06588e-05| 4| 2 18663|l_suppkey | 23| 0.000213367| 4| 3 18663|l_linenumber | 23| 0.0998572| 4| 4 18663|l_quantity | 701| 0.00434997| 8| 5 18663|l_extendedprice| 701| 2.66427e-06| 8| 6 18663|l_discount | 701| 0.0247805| 8| 7 18663|l_tax | 701| 0.0321099| 8| 8 18663|l_returnflag | 1042| 0.307469| -1| 9 18663|l_linestatus | 1042| 0.300911| -1| 10 18663|l_shipdate | 1082| 8.94076e-05| 4| 11 18663|l_commitdate | 1082| 8.33926e-05| 4| 12 18663|l_receiptdate | 1082| 8.90733e-05| 4| 13 18663|l_shipinstruct | 1042| 0.100238| -1| 14 18663|l_shipmode | 1042| 0.0451101| -1| 15 18663|l_comment | 1042| 0| -1| 16 […more…] (572 rows) Statistics estimate 17 output tuples Attributes estimate 4 output tuples

Slide 77

Slide 77

Active PostgreSQL - Code Changes Module access bootstrap catalog commands executor parser lib nodes optimizer port regex rewrite storage tcop utils/adt utils/fmgr utils Total Original Files 72 2 43 34 49 31 35 24 72 5 12 13 50 11 40 4 81 578 Code 26,385 1,259 13,584 11,635 17,401 9,477 7,794 13,092 19,187 514 4,665 5,462 17,088 4,054 31,526 2,417 19,908 205,448 Modified Host (New & Changed) Files 9 1 10 Code 938 273 1,211 Active Disk Files 1 4 6 2 1 1 15 New Code 838 3,574 4,130 315 281 47 9,185 1,257

Slide 78

Slide 78

Code Specialization query Q1 Q13 computation throughput memory selectivity instructions (instr/byte) (MB/s) (KB) (factor) (KB) aggregation 1.82 73.1 488 816 9.1/4.7 hash-join 0.15 886.7 576 967,000 14.3/10.5 type Optimized Implementation • direct C code, single query only, raw binary files • 133 MHz Alpha 3000/400, Digital UNIX 3.2 computation (cycles/byte) Scan 28 Qualification 29 Sort/Group 71 Sort/Aggregate 196 operation throughput (MB/s) 17.8 17.2 7.0 2.5 selectivity (factor) 4.00 1.05 1.00 3,770.00 Database System • database manager database is PostgreSQL 6.4.2 • much higher cycles/byte than direct C implementation - parses general SQL statements - handles arbitrary tuple formats

Slide 79

Slide 79

History - SCAFS SCAFS (Son of Content-Addressable File Store) • processing unit in a 3.5” form factor, fit into a drive shelf • communication via SCSI commands Goals • invisible to the application layer (i.e. hidden under SQL) • established as an industry-standard for high volume market Benefits • • • • 40% to 3x throughput improvement in a mixed workload 20% to 20x improvement in response time 2x to 20x for a “pure” decision support workload up to 100x improvement in response time Carnegie Electrical and Computer Engineering Mellon Active Disks http://www.pdl.cs.cmu.edu/Active Thesis Defense

Slide 80

Slide 80

Lessons from CAFS [Anderson98] Why did CAFS not become wildly popular? • “synchronization was a big problem” Answer - Yes. Major concern for OLTP, less for “mining”. • “dynamic switching between applications is a problem” Answer - Yes. But operating systems know how to do this. • “not the most economical way to add CPU power” Answer - but it is the best bandwidth/capacity/compute combo and you can still add CPU if that helps (and if you can keep it fed) • “CPU is a more flexible resource”, disk processor wasted when not in use Answer - you’re already wasting it today, silicon is everywhere • “memory size is actually a bigger problem” Answer - use adaptive algorithms, apps have “sweet spots” • “needed higher volume, lower cost function” Answer - this is exactly what the drive vendors can provide no specialized, database-specific hardware necessary • “could not get it to fit into the database world” Answer - proof of concept, community willing to listen

Slide 81

Slide 81

Yesterday’s Server-Attached Disks Store-and-forward data copy through server machine File/Database Server Controller Controller SCSI SCSI SCSI Local Area Network Controller Controller SCSI SCSI SCSI Clients Separate storage and client networks • storage moving to packetized FC • clients moving to scalable switches Carnegie Electrical and Computer Engineering Mellon Active Disks http://www.pdl.cs.cmu.edu/Active Thesis Defense

Slide 82

Slide 82

Network-Attached Secure Disks Eliminate server bottleneck w/ network-attached • server scaling [SIGMETRICS ‘97] • object interface, filesystems [CMU-CS ‘98] • cost-effective, high bandwidth [ASPLOS ‘98] File Manager Object Storage Object Storage Controller Controller Network Security Network Security Switched Network Local Area Network Object Storage Object Storage Controller Controller Network Security Network Security Combined storage and client networks • single, switched infrastructure • delivers max. bandwidth to clients Clients • drives must handle security

Slide 83

Slide 83

TPC-D Benchmark Consists of high selectivity, ad-hoc queries query Q1 Q5 Q7 Q9 Q11 input (MB) 672 857 857 976 117 entire query result selectivity (KB) (factor) 0.2 4.8 million 0.09 9.7 million 0.02 3.5 million 6.5 154,000 0.3 453,000 scan only input selectivity (MB) (factor) 672 3.3 672 3.5 672 4.0 672 2.2 115 7.2 Scale Factor = 1 GB Simple filtering on input • factors of 3x and more savings in load on interconnect Entire queries (including aggregation and joins) • factors of 100,000 and higher savings Carnegie Electrical and Computer Engineering Mellon Active Disks http://www.pdl.cs.cmu.edu/Active Thesis Defense

Slide 84

Slide 84

Implementation Issues Partitioning • combining disk code with “traditional” code Mobility • code must run on disks and/or host • Java (!) (?) + popular, tools (coming soon), strong typing - somewhat different emphasis what to optimize for • more “static” extensions Interfaces • capability system of NASD as a base • additional inquiry functions for scheduling • additional power (via capabilities) for storage mgmt Carnegie Electrical and Computer Engineering Mellon Active Disks http://www.pdl.cs.cmu.edu/Active Thesis Defense

Slide 85

Slide 85

Value-Added Storage Variety of value-added storage devices System Seagate Cheetah 18LP LVD Seagate Cheetah 18LP FC Dell 200S PowerVault Dell 650F PowerVault Dell 720N PowerVault EMC Symmetrix 3330-18 Function disk only disk only drive shelves & cabinet dual RAID controllers CIFS, NFS, Filer RAID, management Cost Premium Other $900 18 GB, lvd, 10,000 rpm $942 5% FC $10,645 48% 8 lvd disks $32,005 240% 10 disks, full FC $52,495 248% 16 disks, ether, 256/8 cache $160,000 962% 16 disks, 2 GB cache Price premium • cabinet cost is significant • network-attached storage is as costly as RAID • “management” gets the biggest margin Carnegie Electrical and Computer Engineering Mellon Active Disks http://www.pdl.cs.cmu.edu/Active Thesis Defense

Slide 86

Slide 86

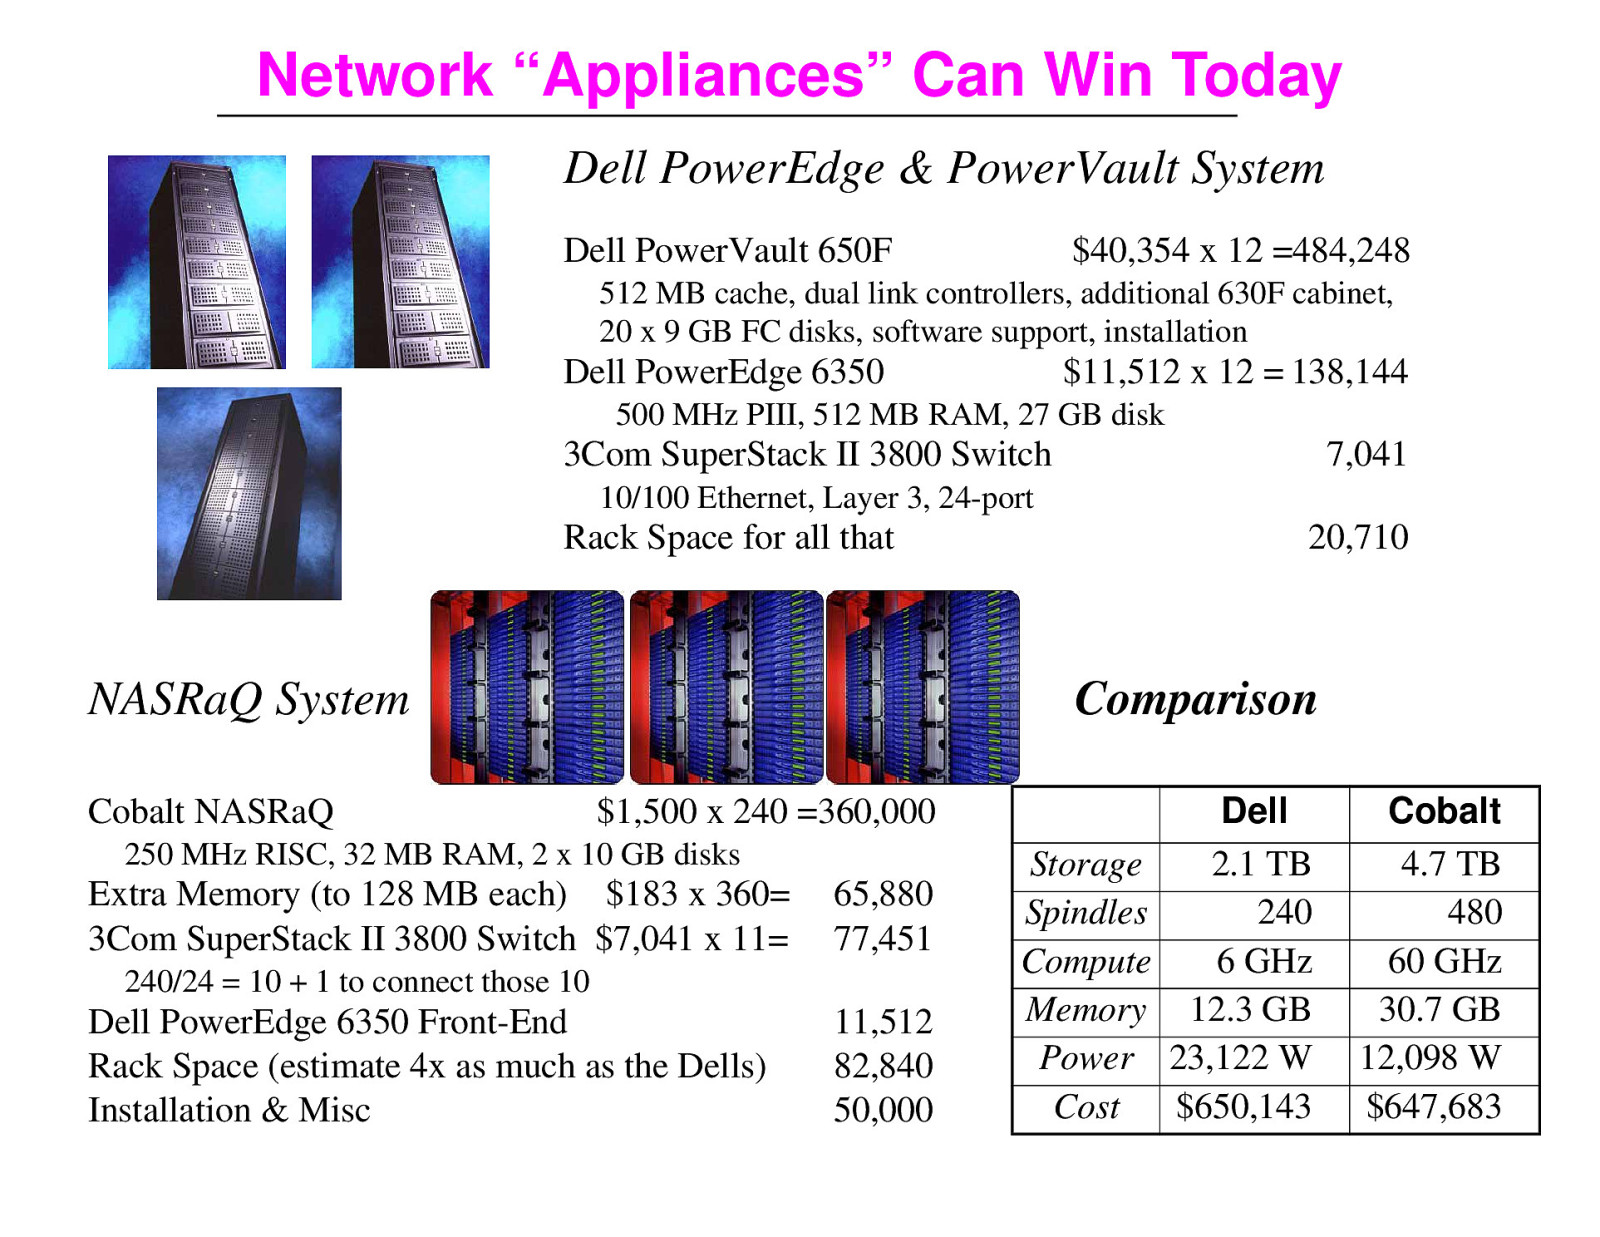
Network “Appliances” Can Win Today Dell PowerEdge & PowerVault System Dell PowerVault 650F $40,354 x 12 =484,248 512 MB cache, dual link controllers, additional 630F cabinet, 20 x 9 GB FC disks, software support, installation Dell PowerEdge 6350 $11,512 x 12 = 138,144 500 MHz PIII, 512 MB RAM, 27 GB disk 3Com SuperStack II 3800 Switch 7,041 10/100 Ethernet, Layer 3, 24-port Rack Space for all that NASRaQ System Cobalt NASRaQ 20,710 Comparison $1,500 x 240 =360,000 250 MHz RISC, 32 MB RAM, 2 x 10 GB disks Extra Memory (to 128 MB each) $183 x 360= 3Com SuperStack II 3800 Switch $7,041 x 11= 65,880 77,451 240/24 = 10 + 1 to connect those 10 Dell PowerEdge 6350 Front-End Rack Space (estimate 4x as much as the Dells) Installation & Misc 11,512 82,840 50,000 Storage Spindles Compute Memory Power Cost Dell 2.1 TB 240 6 GHz 12.3 GB 23,122 W $650,143 Cobalt 4.7 TB 480 60 GHz 30.7 GB 12,098 W $647,683