
A presentation at Litmus Live 2019 in in Boston, MA, USA by Heidi Olsen
Effective Storytelling with Data Visualization #LitmusLive • @swisswebmiss
Hi, I’m Heidi. Pronouns are She/Her Proud #EmailGeek for 10+ years Senior Frontend Engineer @ Bumped @swisswebmiss #LitmusLive • @swisswebmiss
heidiolsen.com/LL19 Slides • Code Samples • Links to Resources #LitmusLive • @swisswebmiss
#LitmusLive • @swisswebmiss
#LitmusLive • @swisswebmiss
#LitmusLive • @swisswebmiss Source: Michael Wharley/Rebecca Pitt, Financial Times
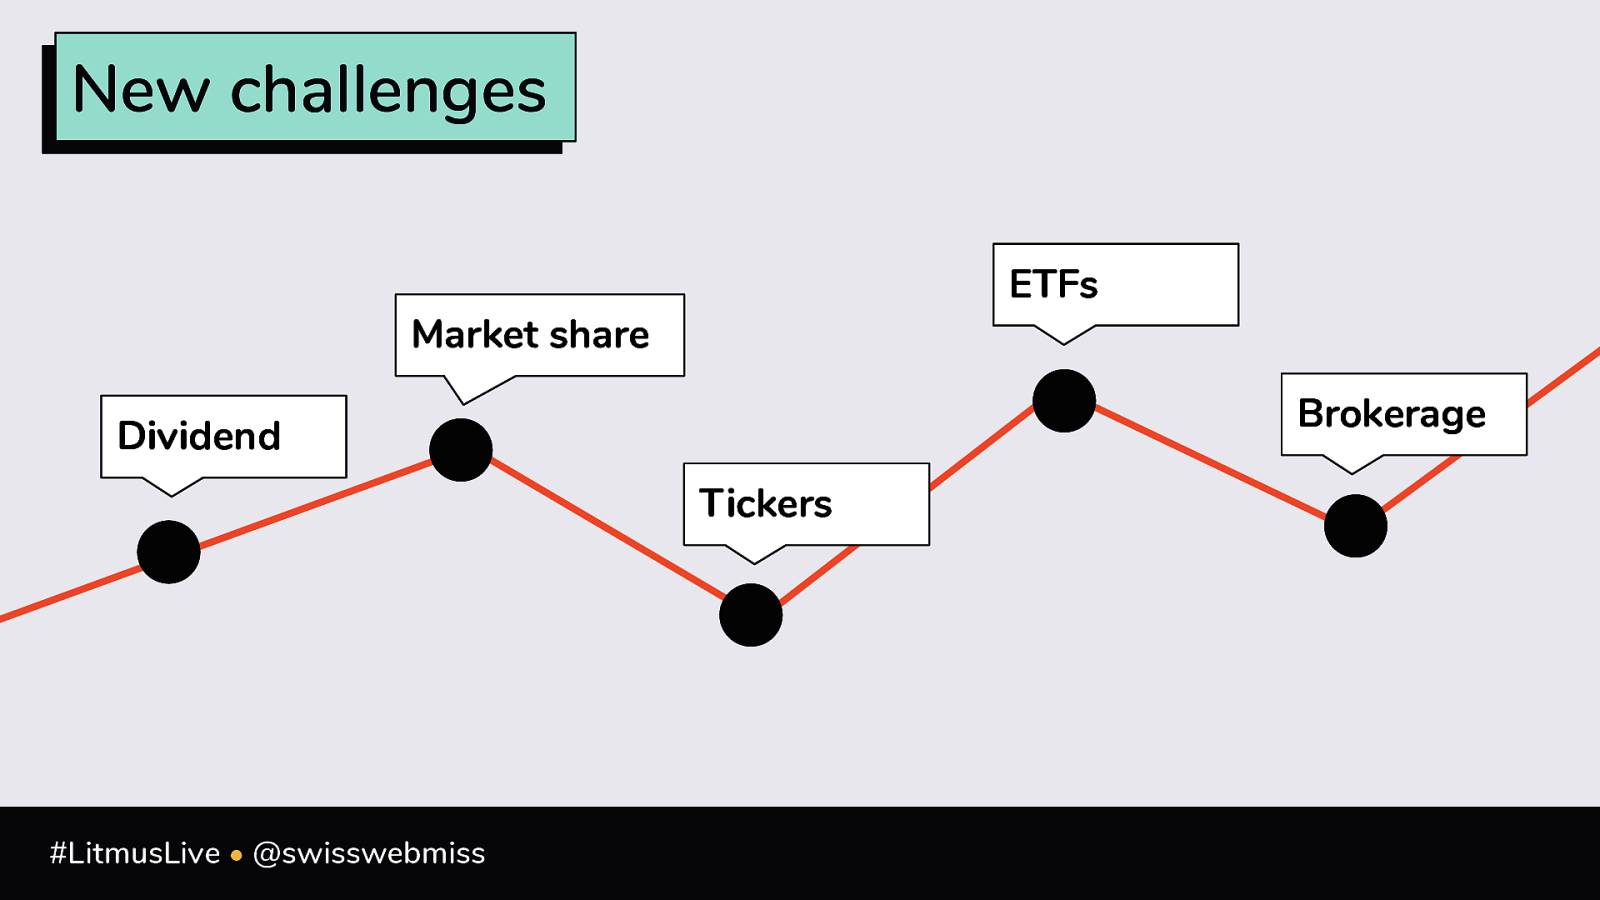
New challenges ETFs Market share Brokerage Dividend Tickers #LitmusLive • @swisswebmiss
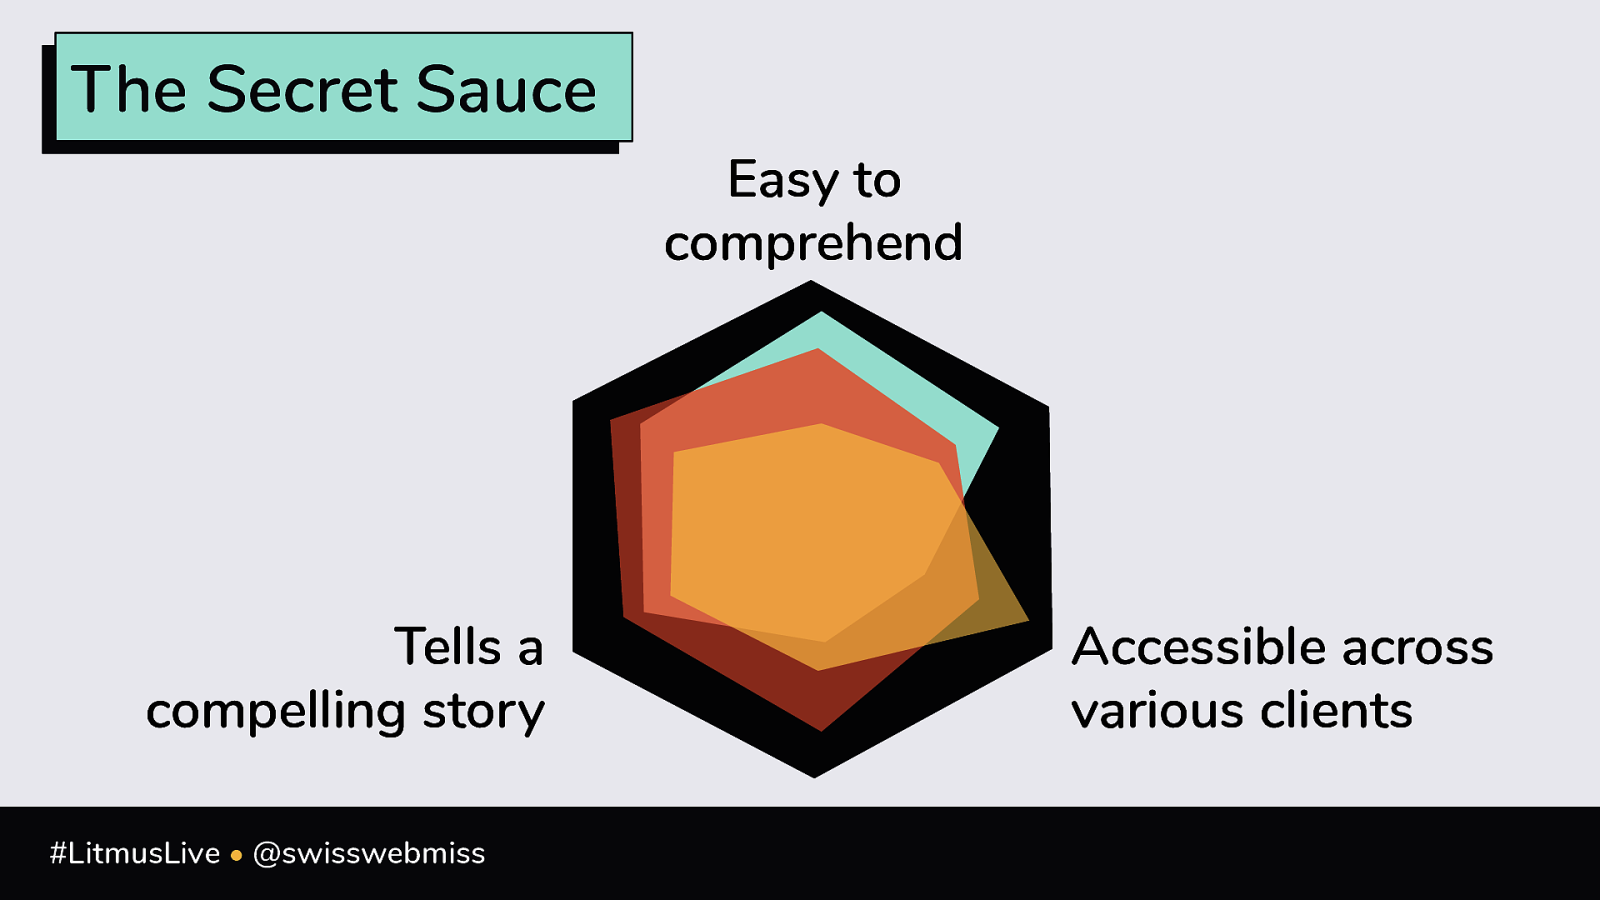
The Secret Sauce Easy to comprehend Tells a compelling story #LitmusLive • @swisswebmiss Accessible across various clients
INCREASE UNDERSTANDING Visual perception + cognitive load #LitmusLive • @swisswebmiss
BRAIIIIIINS! #LitmusLive • @swisswebmiss
Brains. #LitmusLive • @swisswebmiss
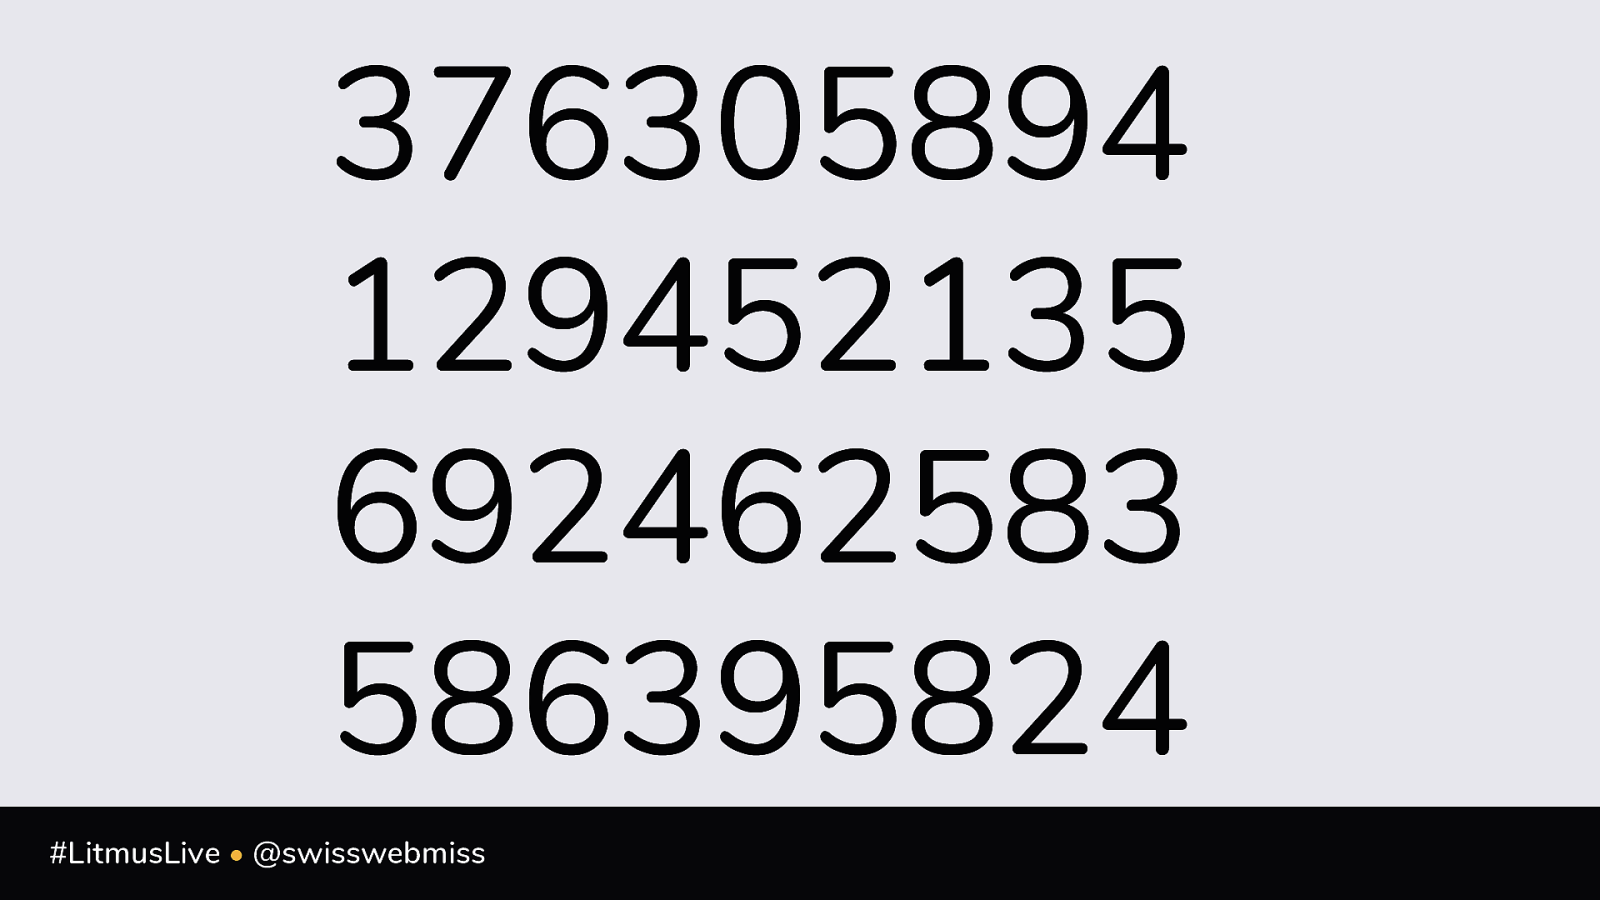
376305894 129452135 692462583 586395824 #LitmusLive • @swisswebmiss
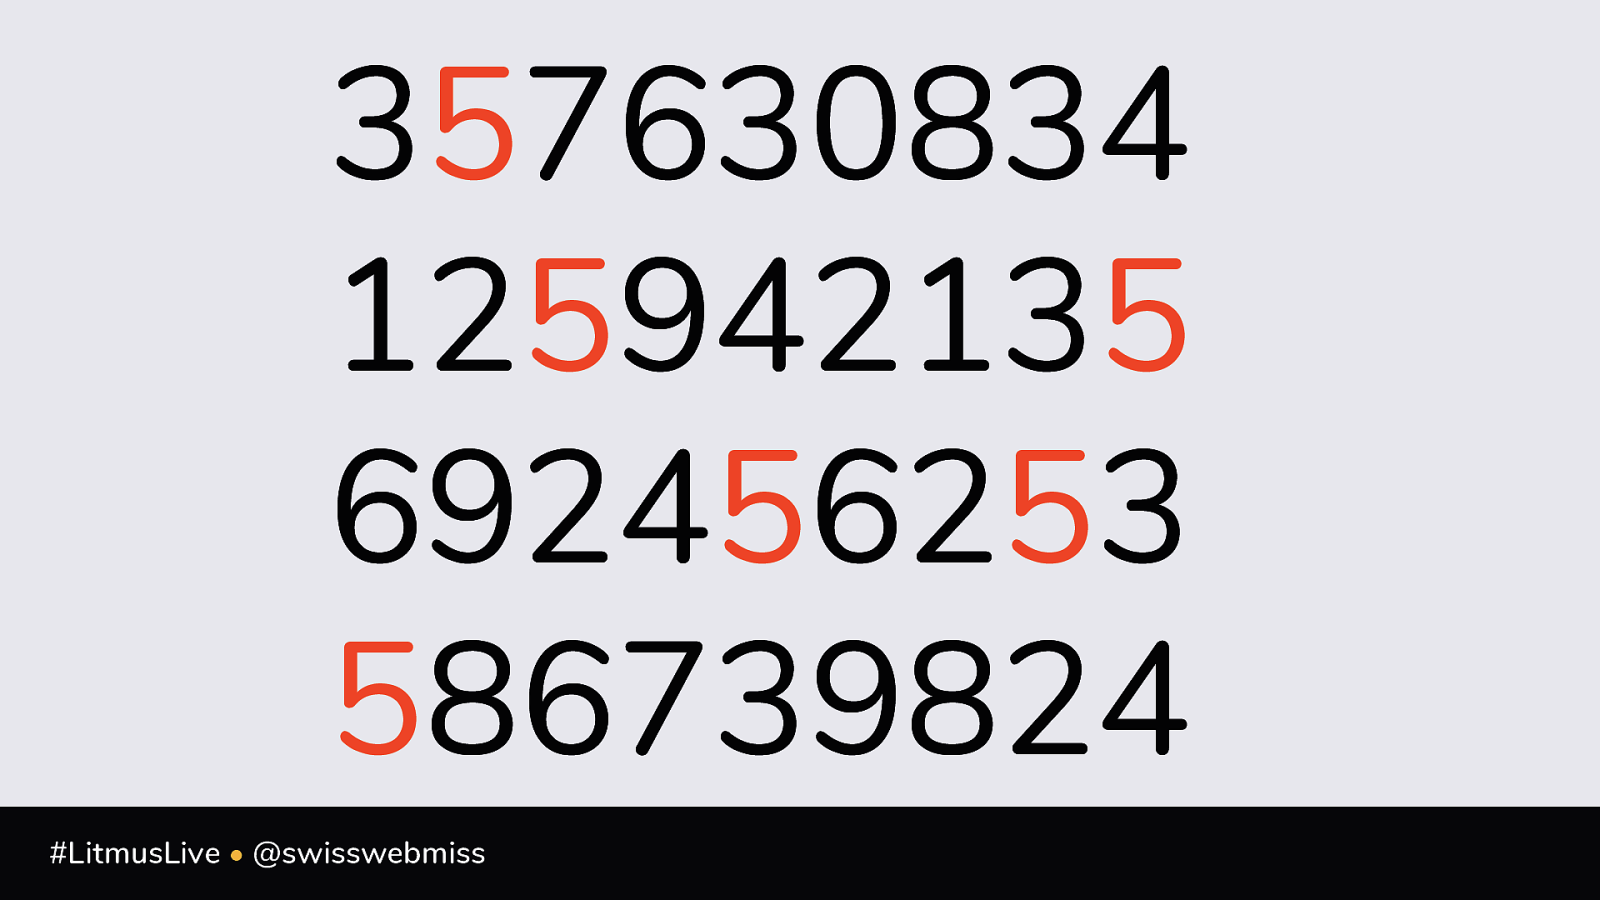
357630834 125942135 692456253 586739824 #LitmusLive • @swisswebmiss
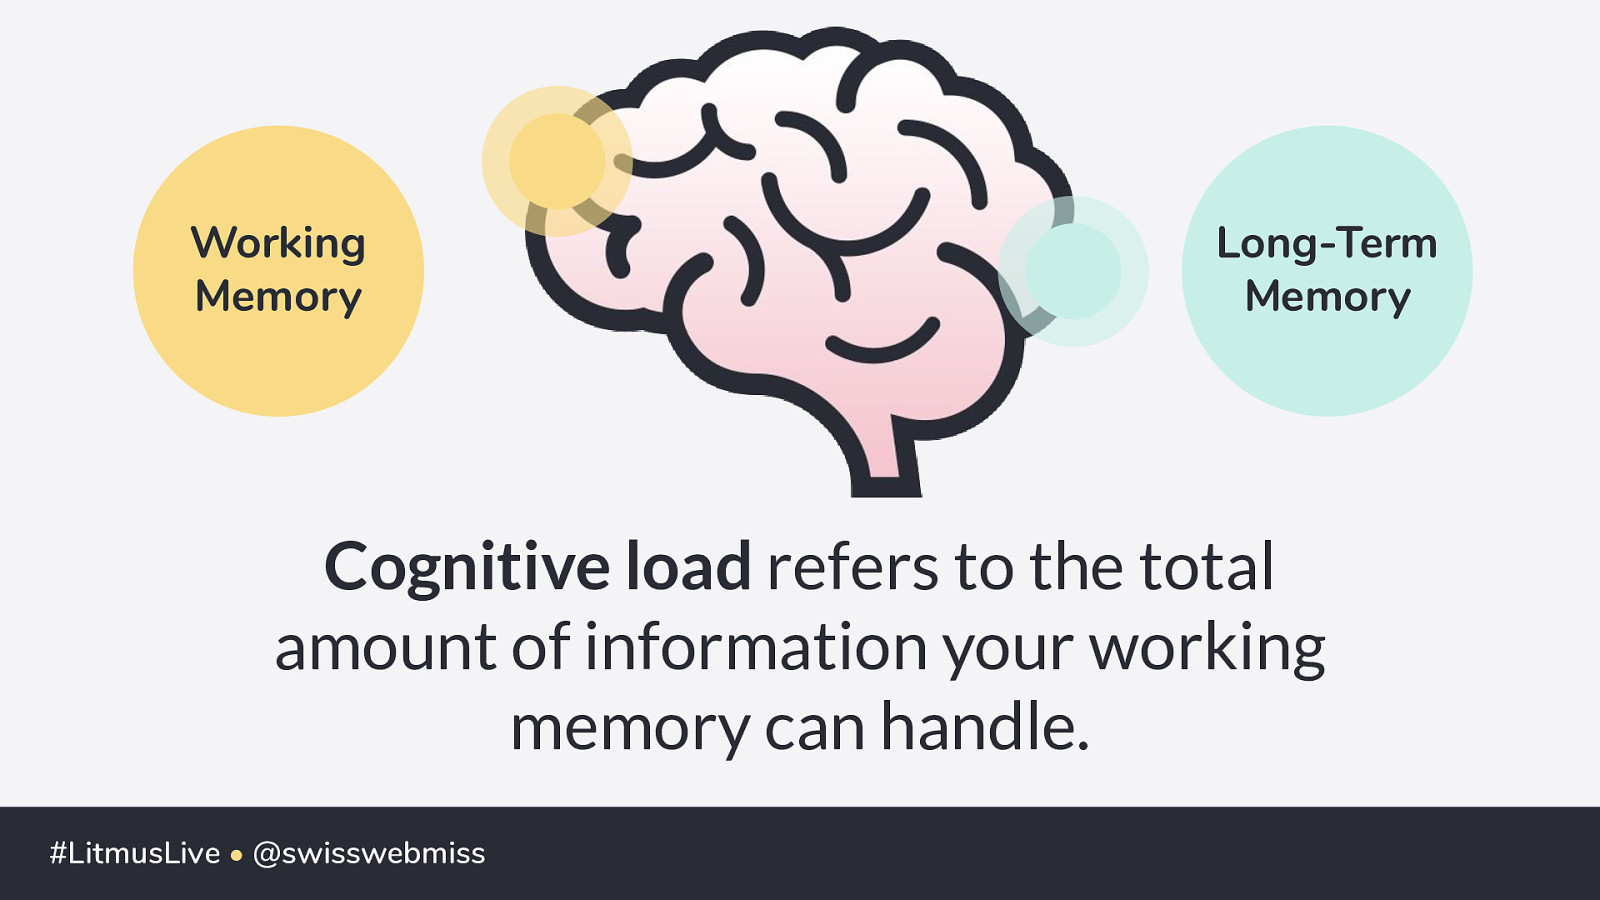
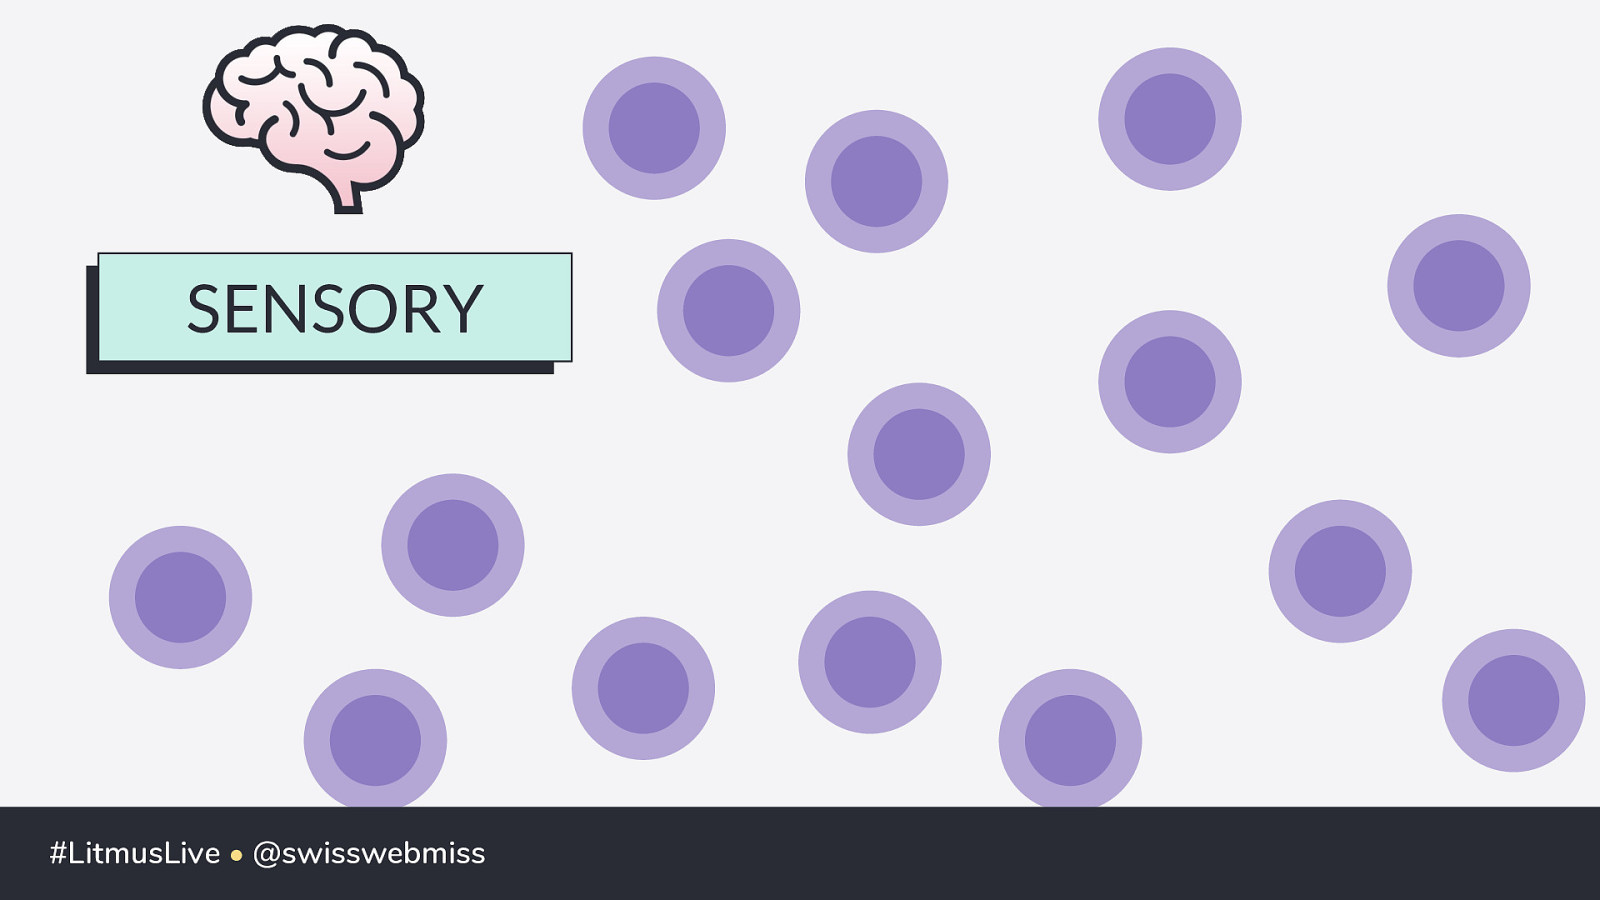
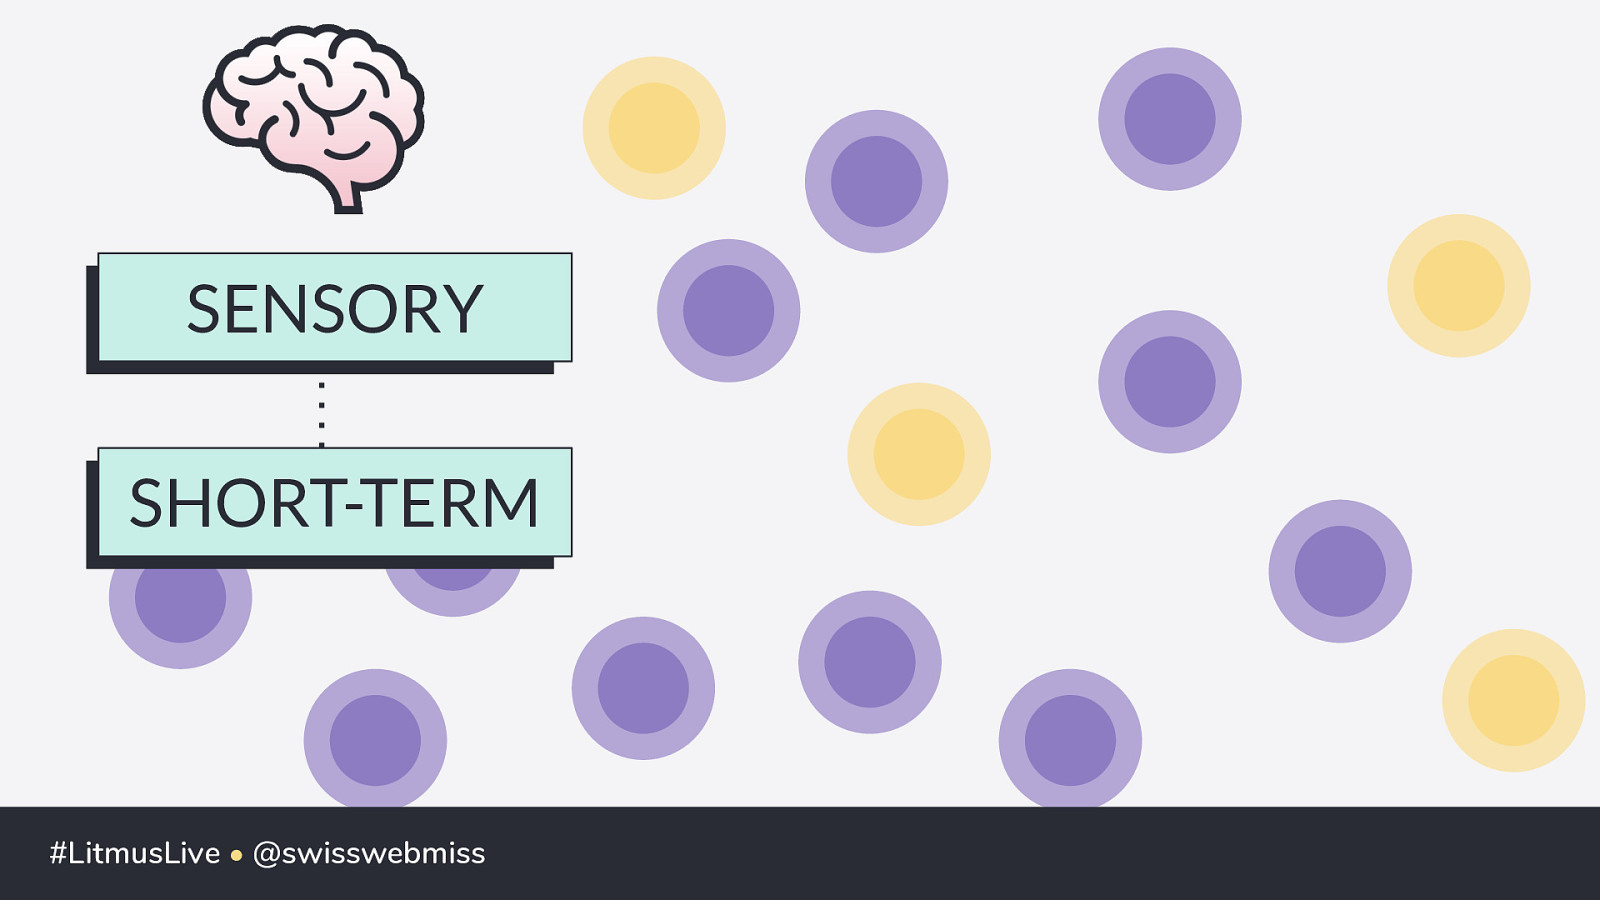
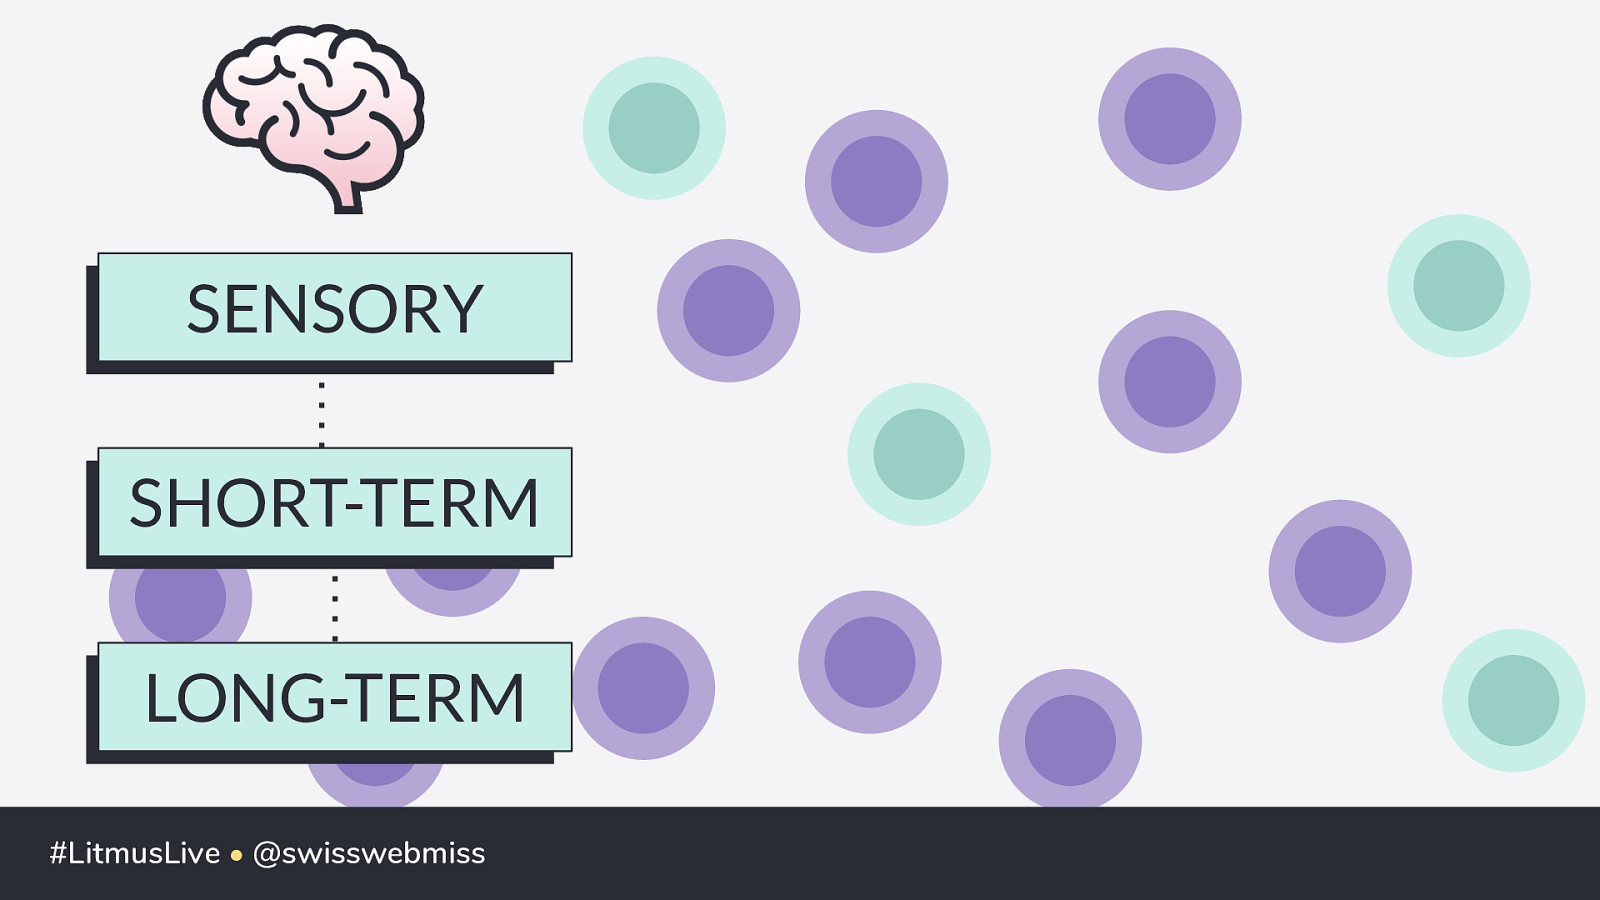
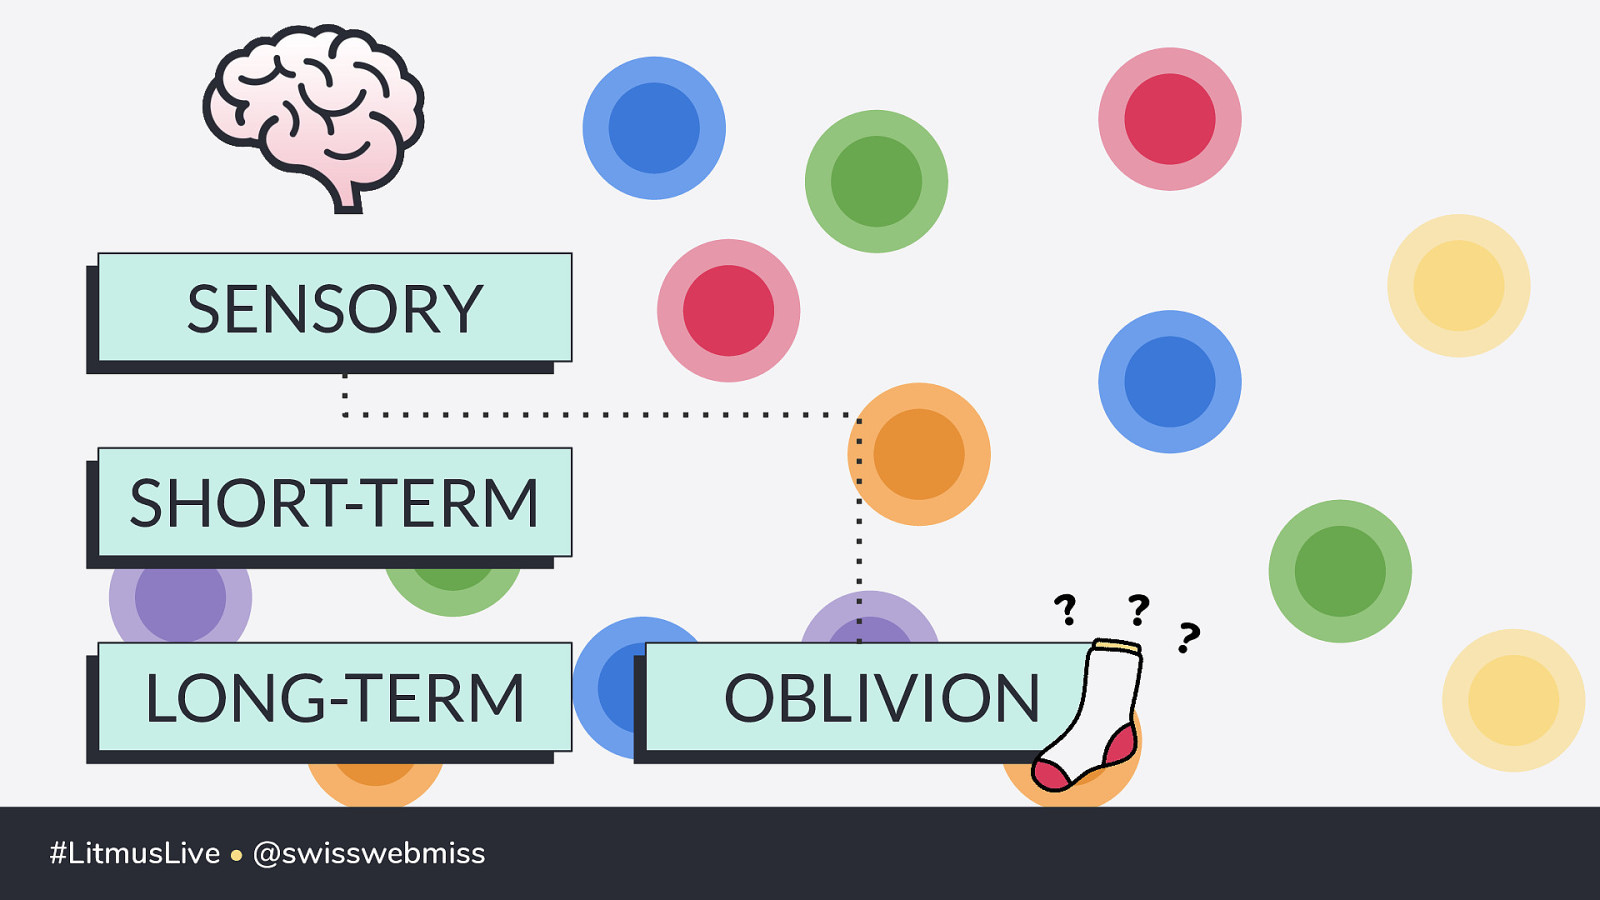
Working Memory Long-Term Memory Cognitive load refers to the total amount of information your working memory can handle. #LitmusLive • @swisswebmiss
SENSORY #LitmusLive • @swisswebmiss
SENSORY SHORT-TERM #LitmusLive • @swisswebmiss
SENSORY SHORT-TERM LONG-TERM #LitmusLive • @swisswebmiss
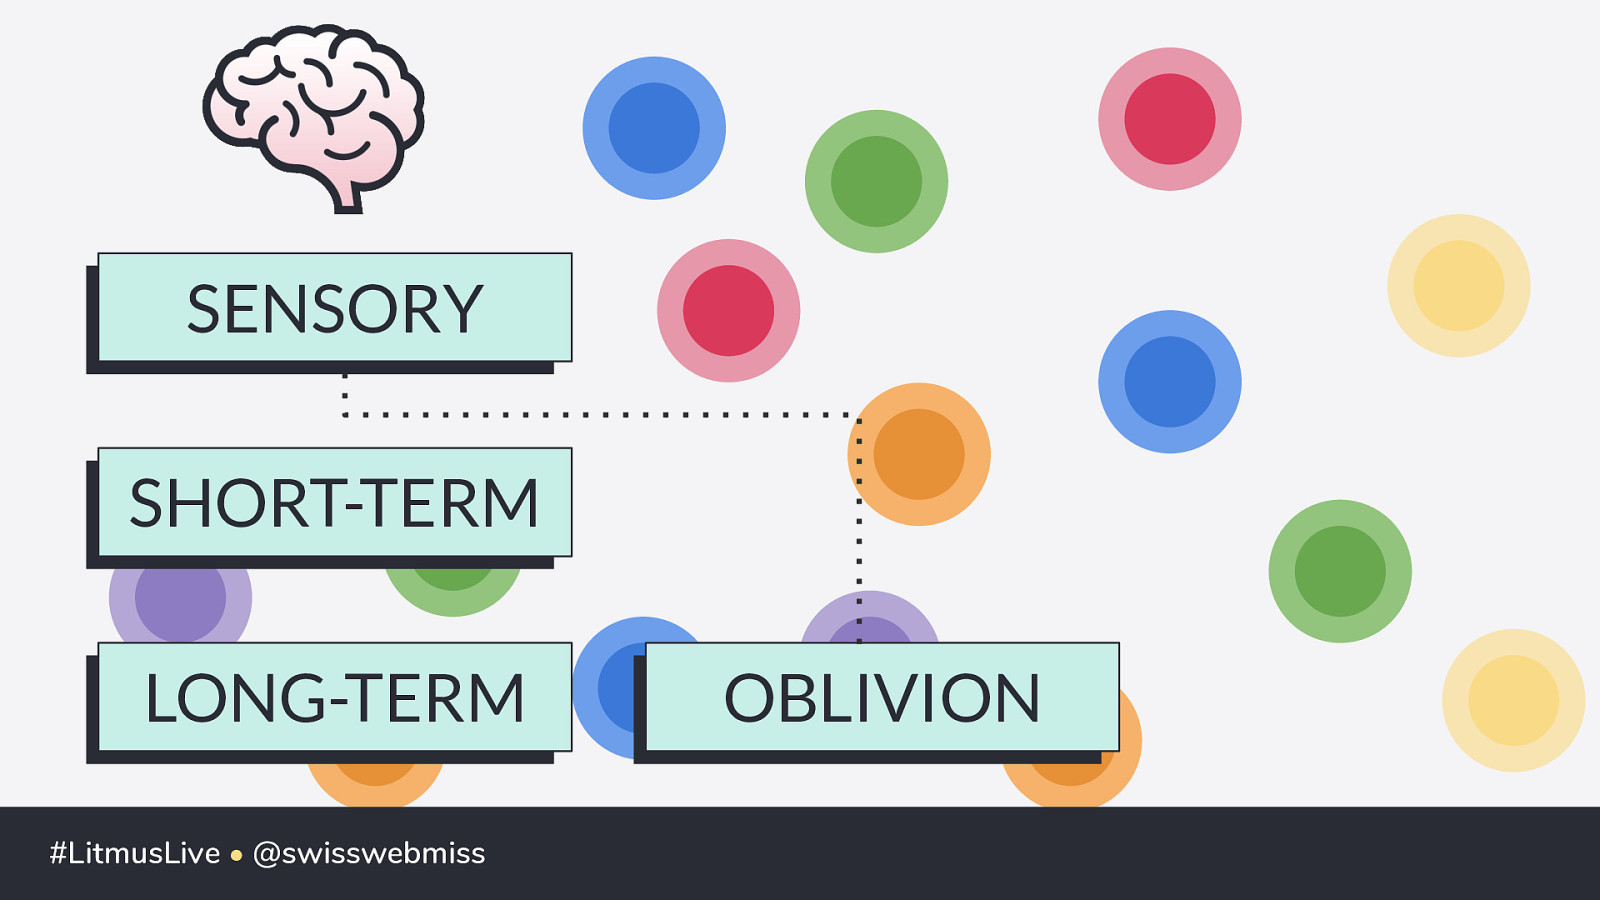
SENSORY SHORT-TERM LONG-TERM #LitmusLive • @swisswebmiss OBLIVION
SENSORY SHORT-TERM ? LONG-TERM #LitmusLive • @swisswebmiss OBLIVION ? ?
“UGH” Moment #LitmusLive • @swisswebmiss
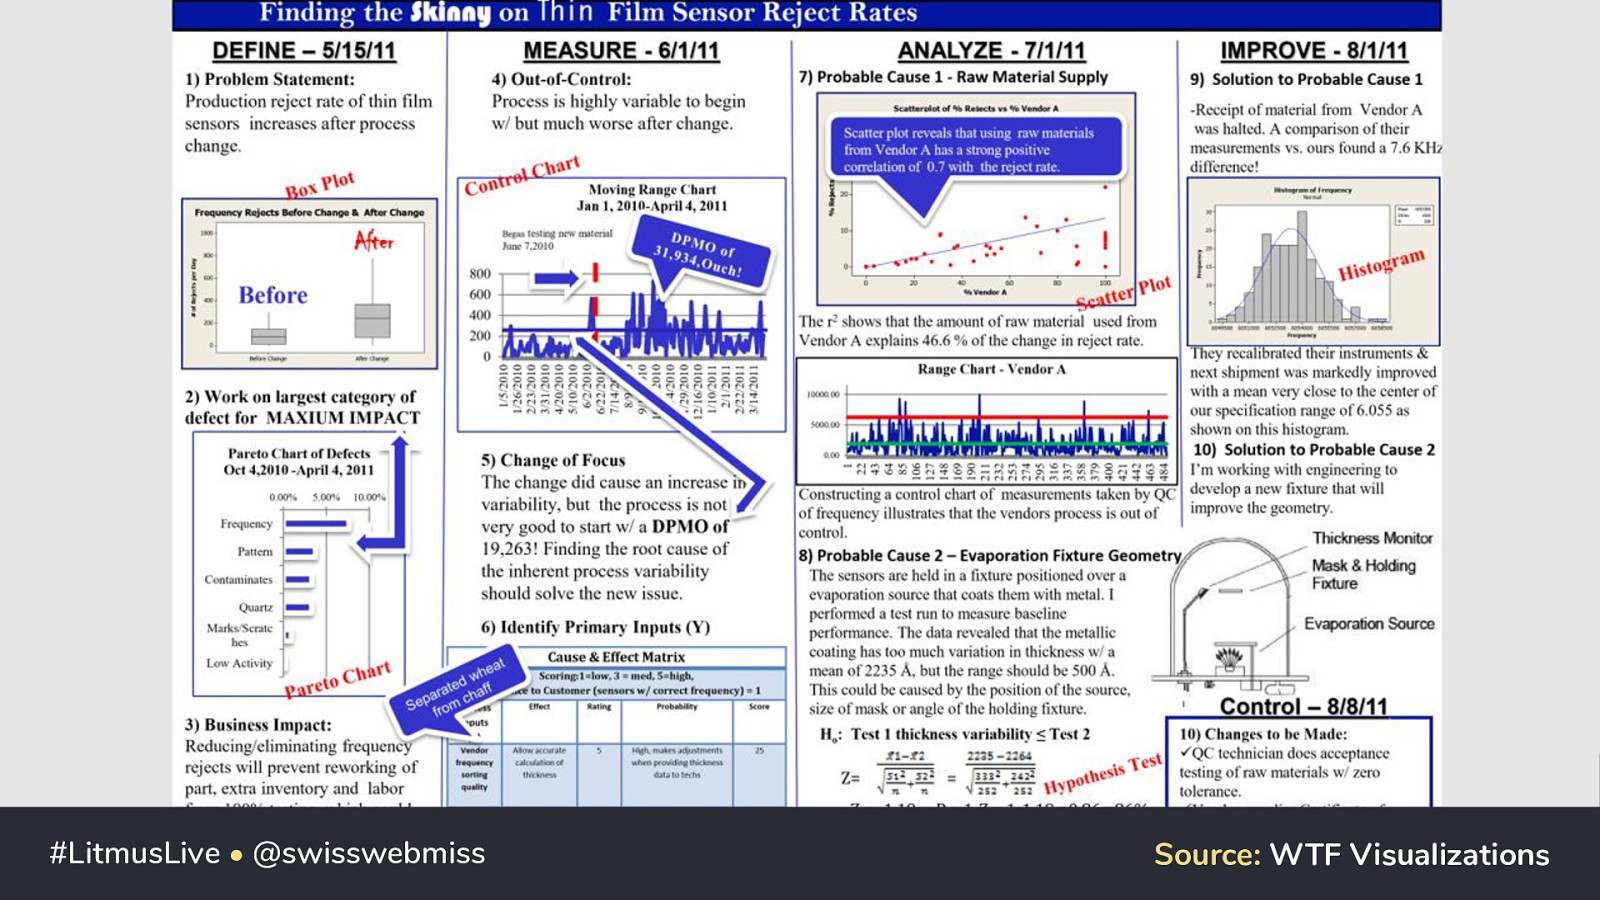
#LitmusLive • @swisswebmiss Source: WTF Visualizations
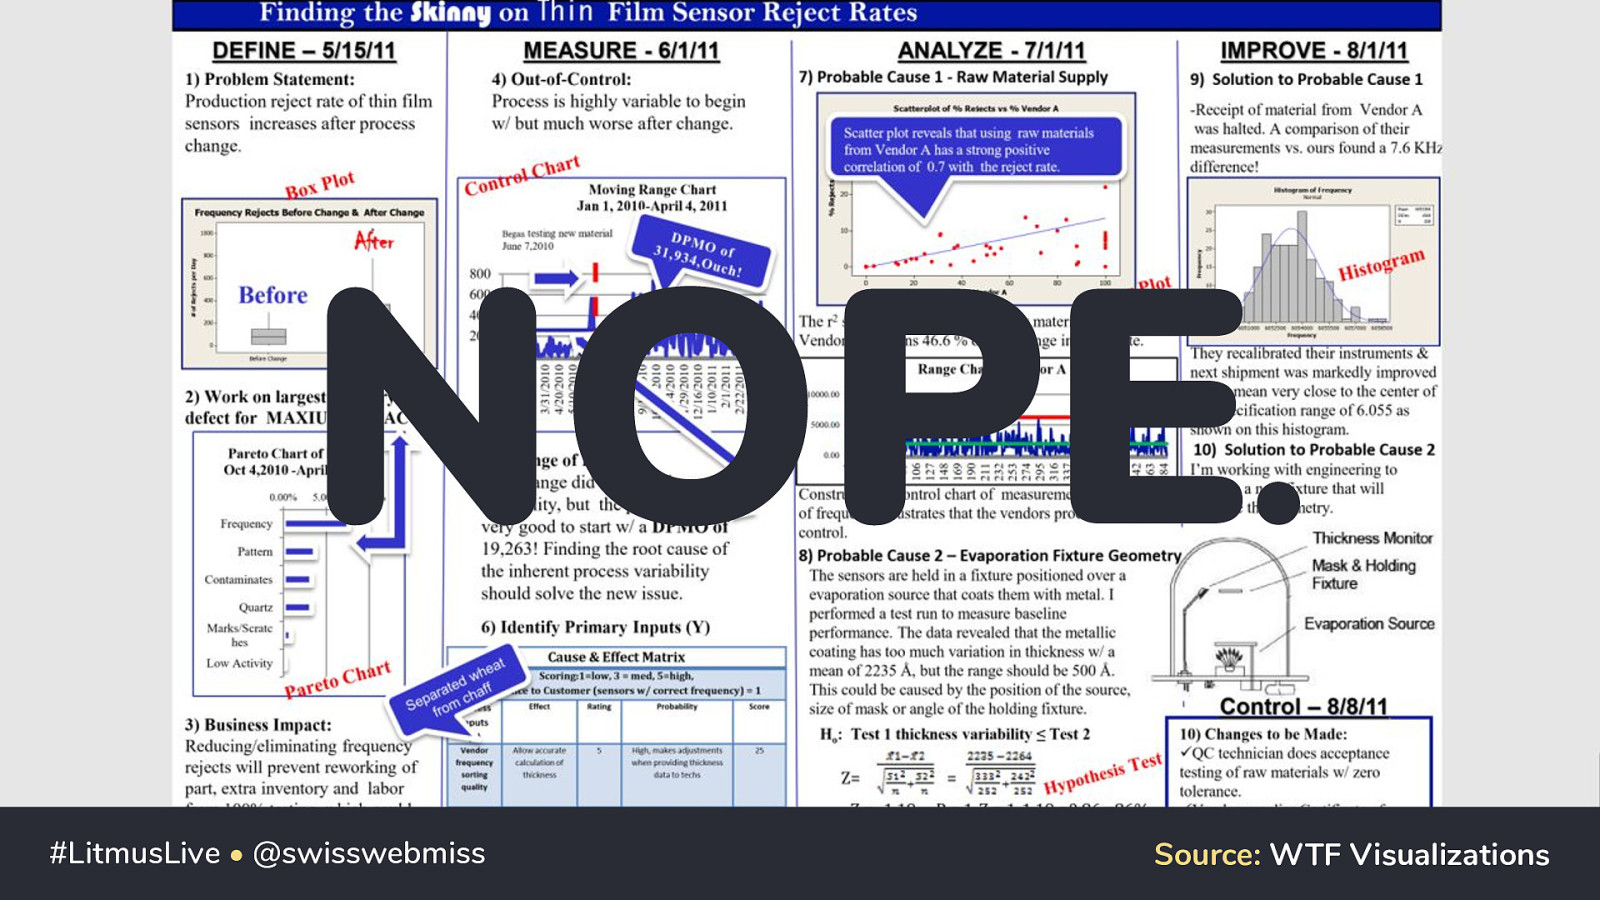
NOPE. #LitmusLive • @swisswebmiss Source: WTF Visualizations
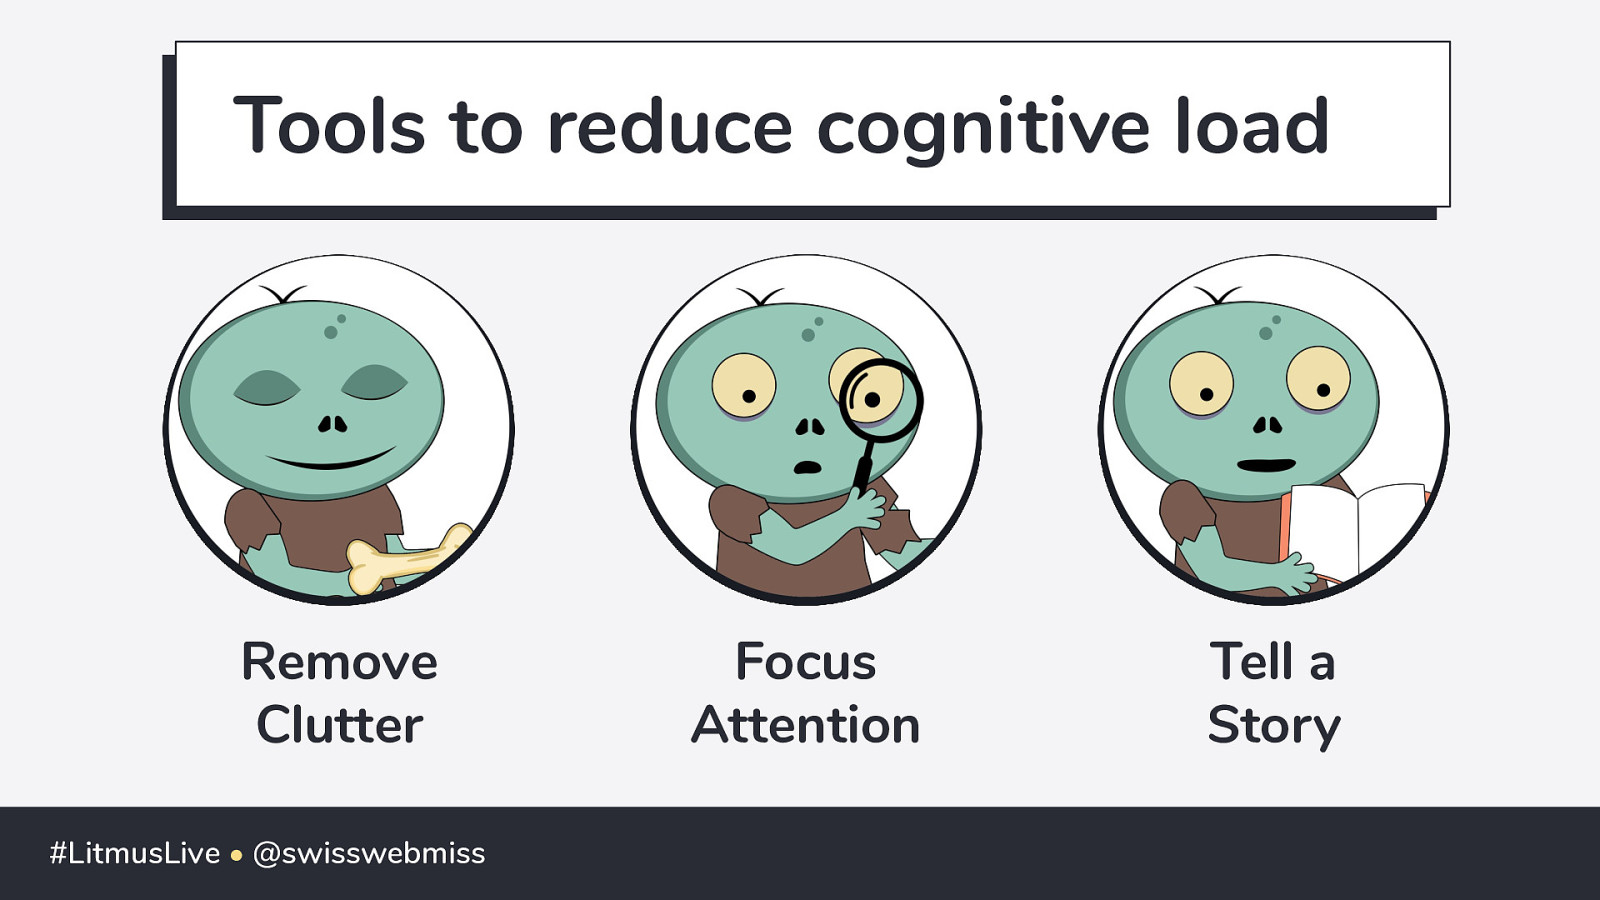
Tools to reduce cognitive load Remove Clutter #LitmusLive • @swisswebmiss Focus Attention Tell a Story
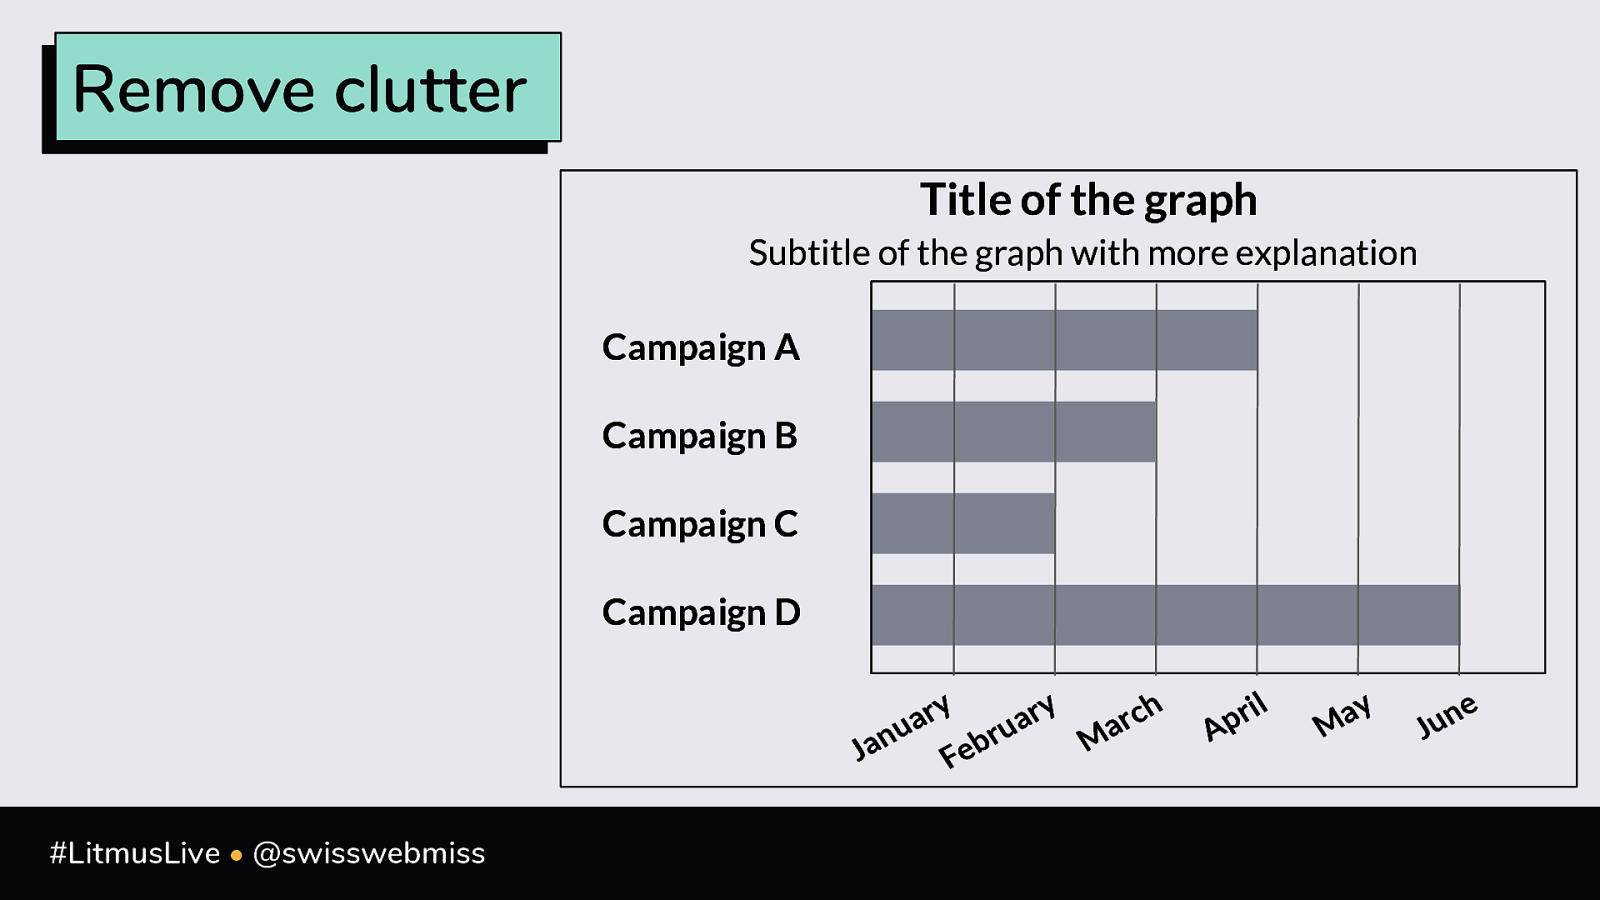
1 Remove Clutter #LitmusLive • @swisswebmiss
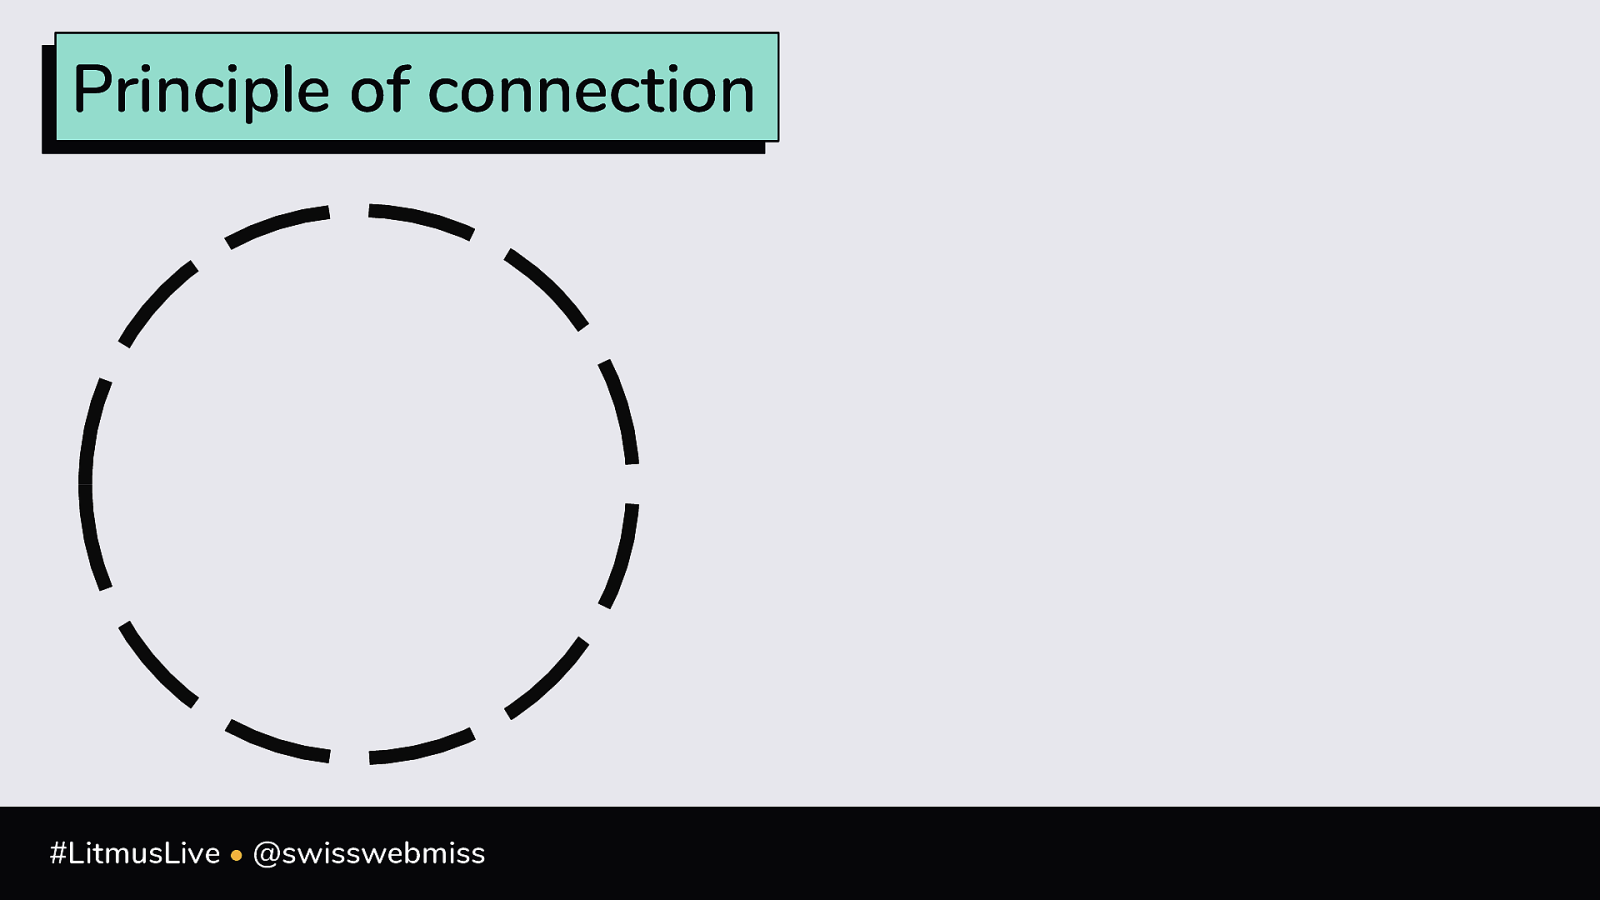
Principle of connection #LitmusLive • @swisswebmiss
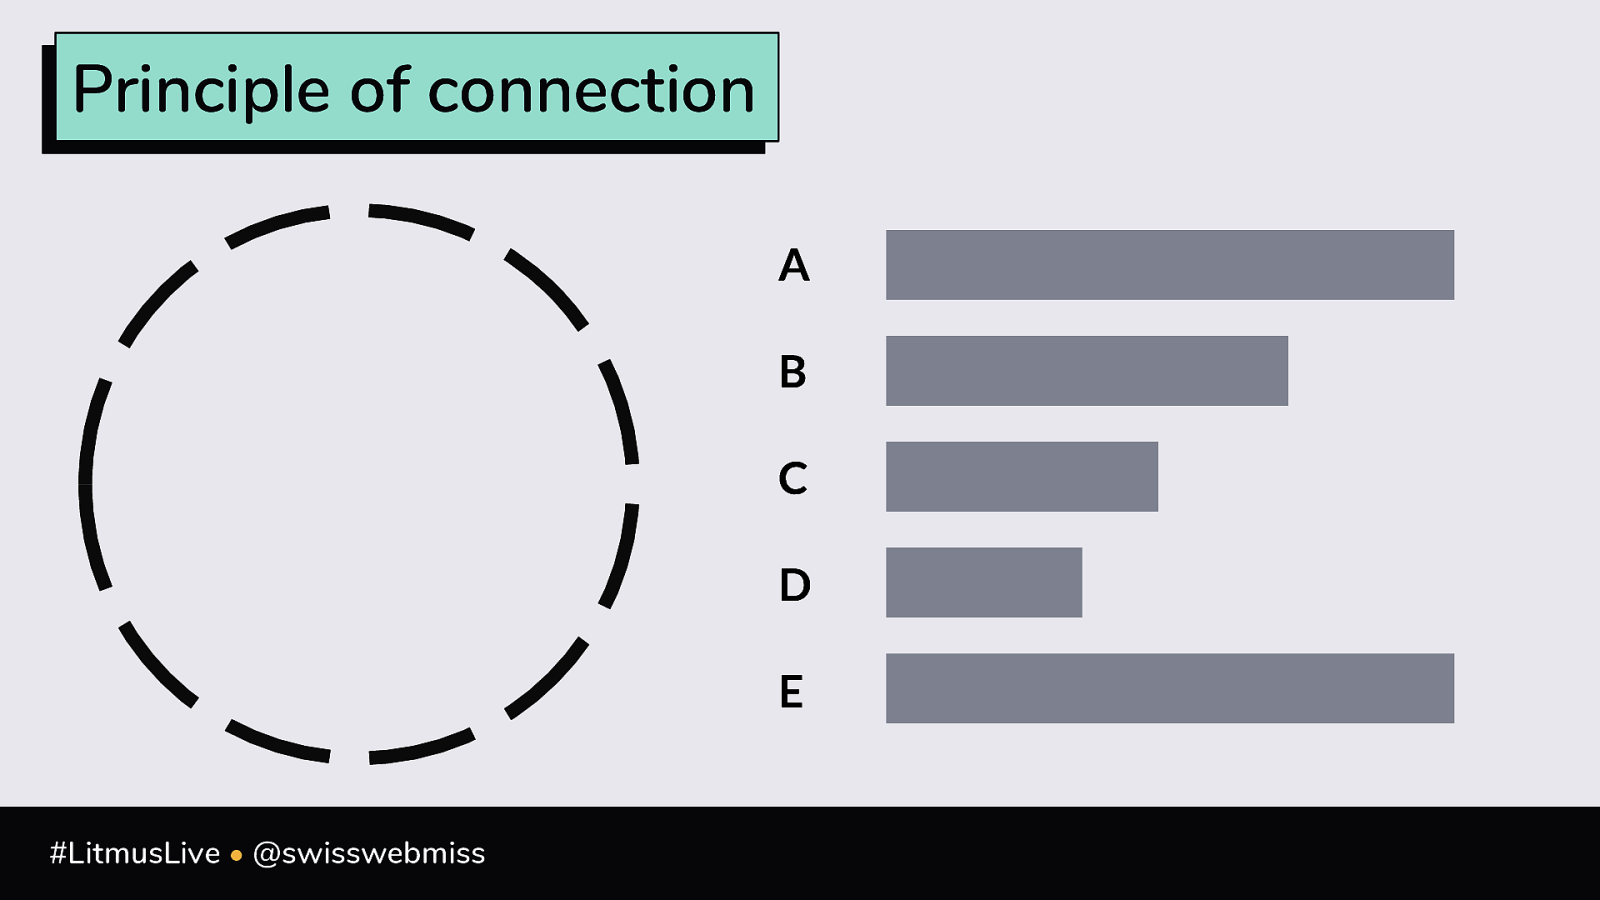
Principle of connection A B C D E #LitmusLive • @swisswebmiss
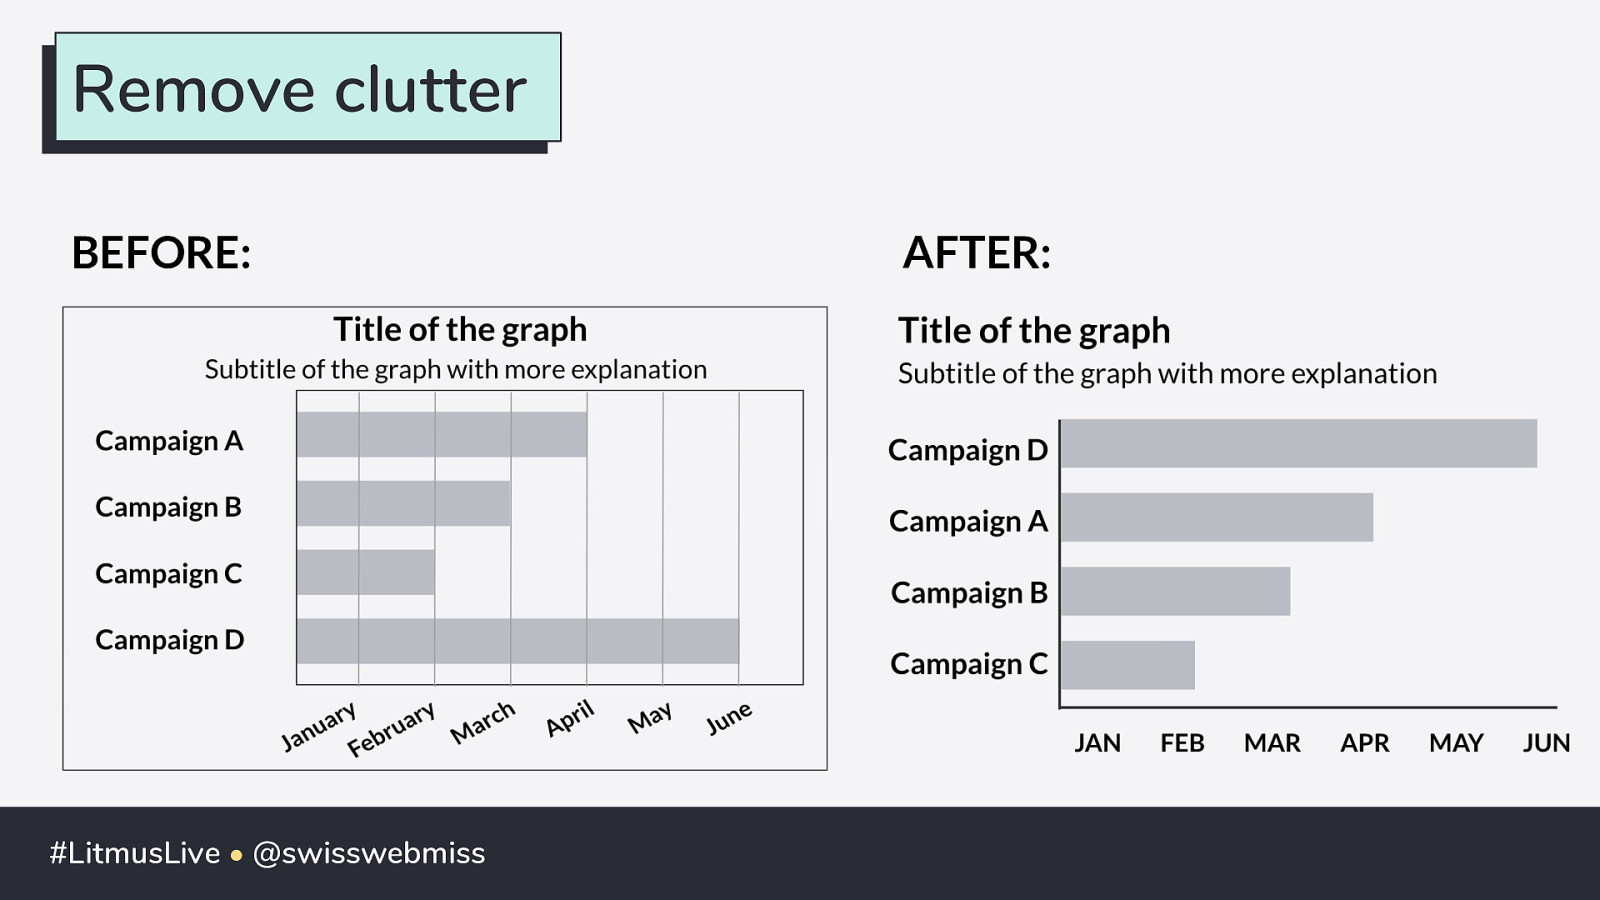
Remove clutter Title of the graph Subtitle of the graph with more explanation Campaign A Campaign B Campaign C Campaign D ua Jan #LitmusLive • @swisswebmiss ry Fe a bru ry h rc Ma ril Ap y Ma e Jun
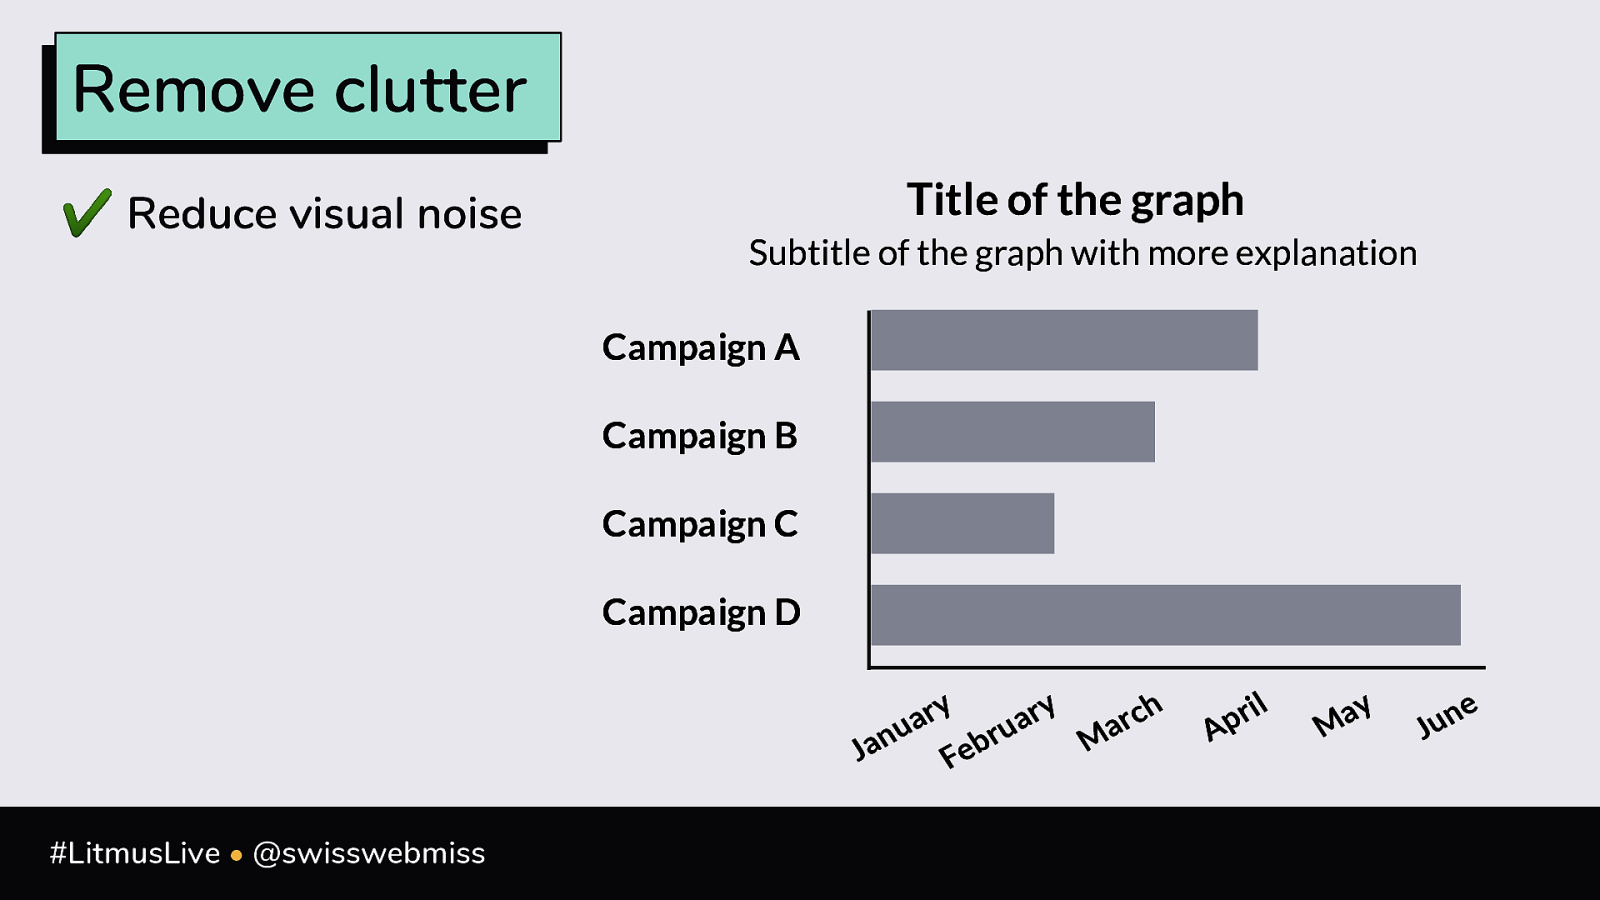
Remove clutter ✔ Reduce visual noise Title of the graph Subtitle of the graph with more explanation Campaign A Campaign B Campaign C Campaign D ua Jan #LitmusLive • @swisswebmiss ry Fe a bru ry h rc Ma ril Ap y Ma e Jun
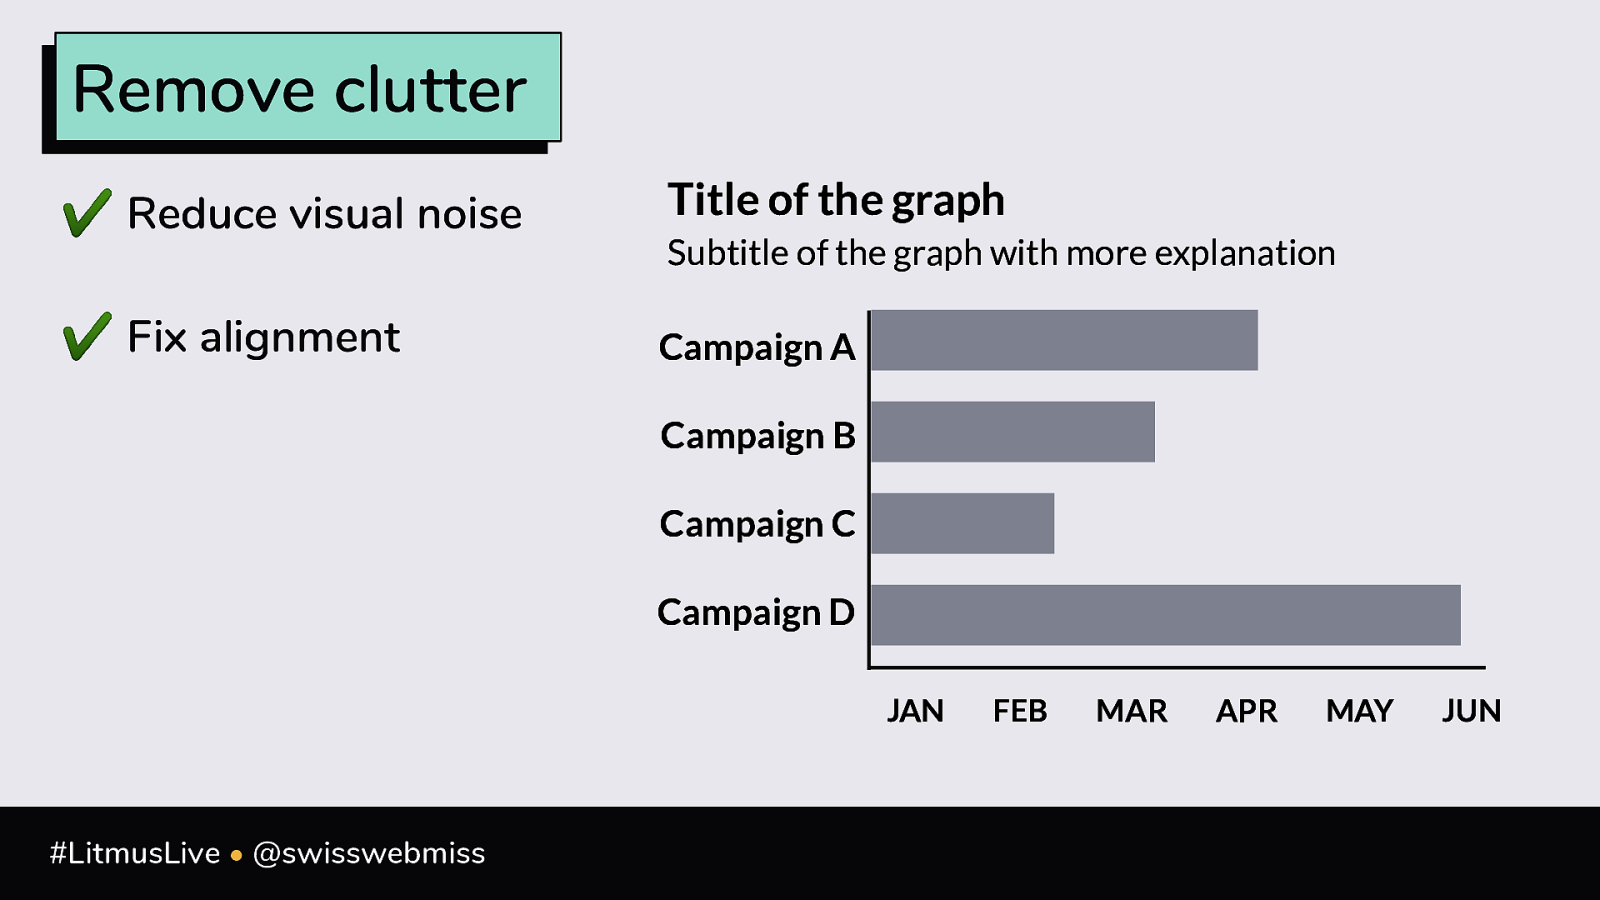
Remove clutter ✔ Reduce visual noise Title of the graph ✔ Fix alignment Campaign A Subtitle of the graph with more explanation Campaign B Campaign C Campaign D JAN #LitmusLive • @swisswebmiss FEB MAR APR MAY JUN
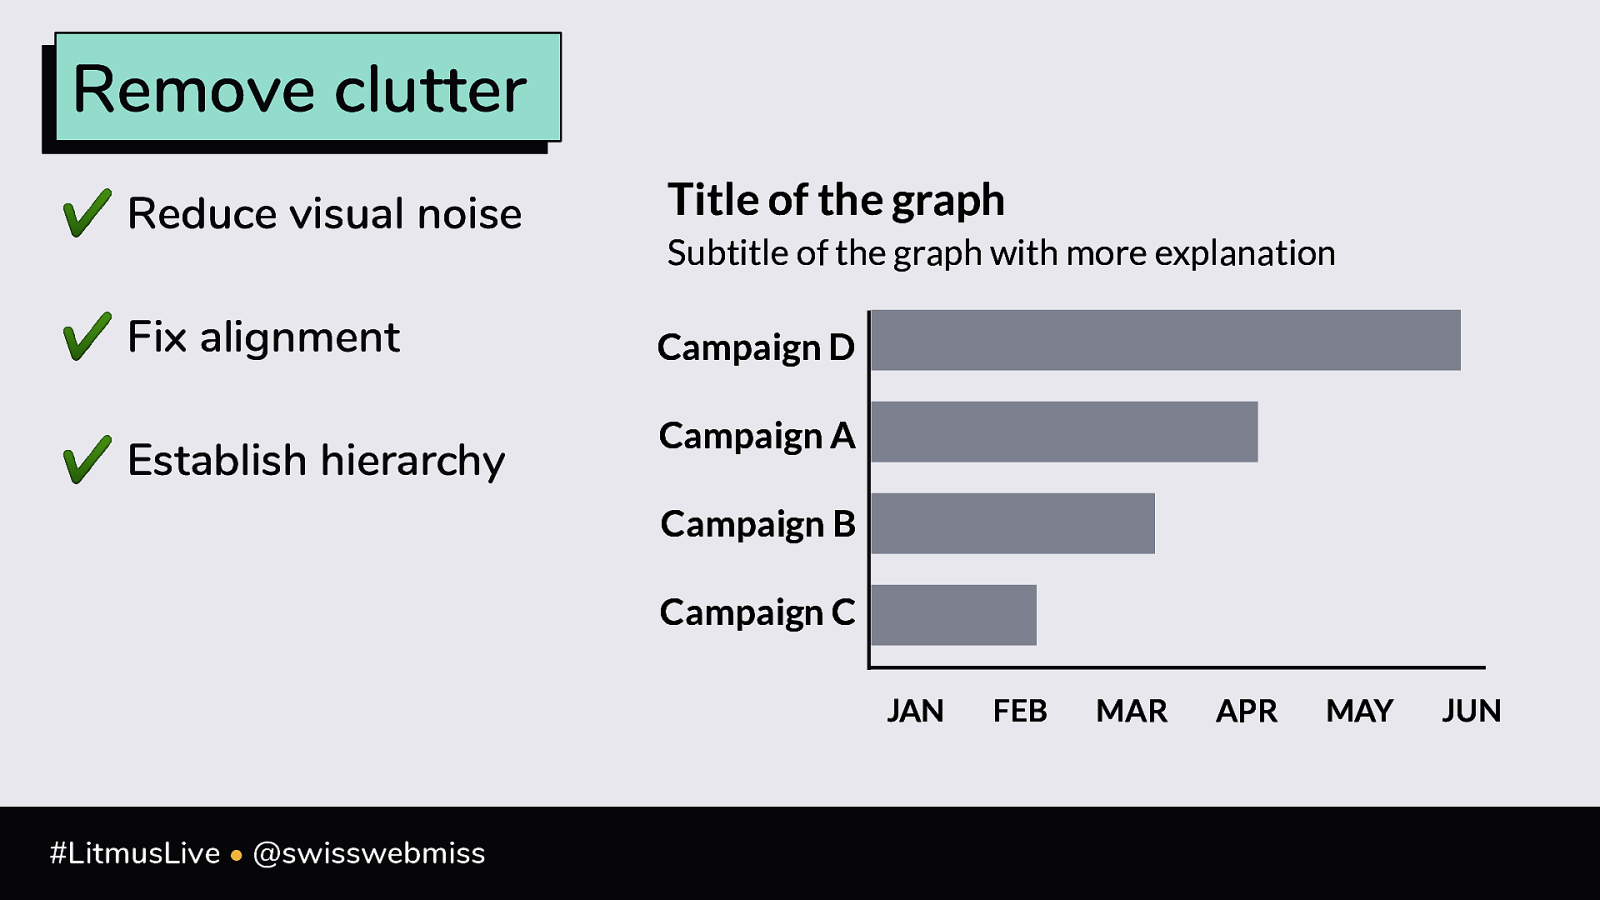
Remove clutter ✔ Reduce visual noise Title of the graph ✔ Fix alignment Campaign D ✔ Establish hierarchy Subtitle of the graph with more explanation Campaign A Campaign B Campaign C JAN #LitmusLive • @swisswebmiss FEB MAR APR MAY JUN
Remove clutter BEFORE: #LitmusLive • @swisswebmiss AFTER:
2 Focus Attention #LitmusLive • @swisswebmiss
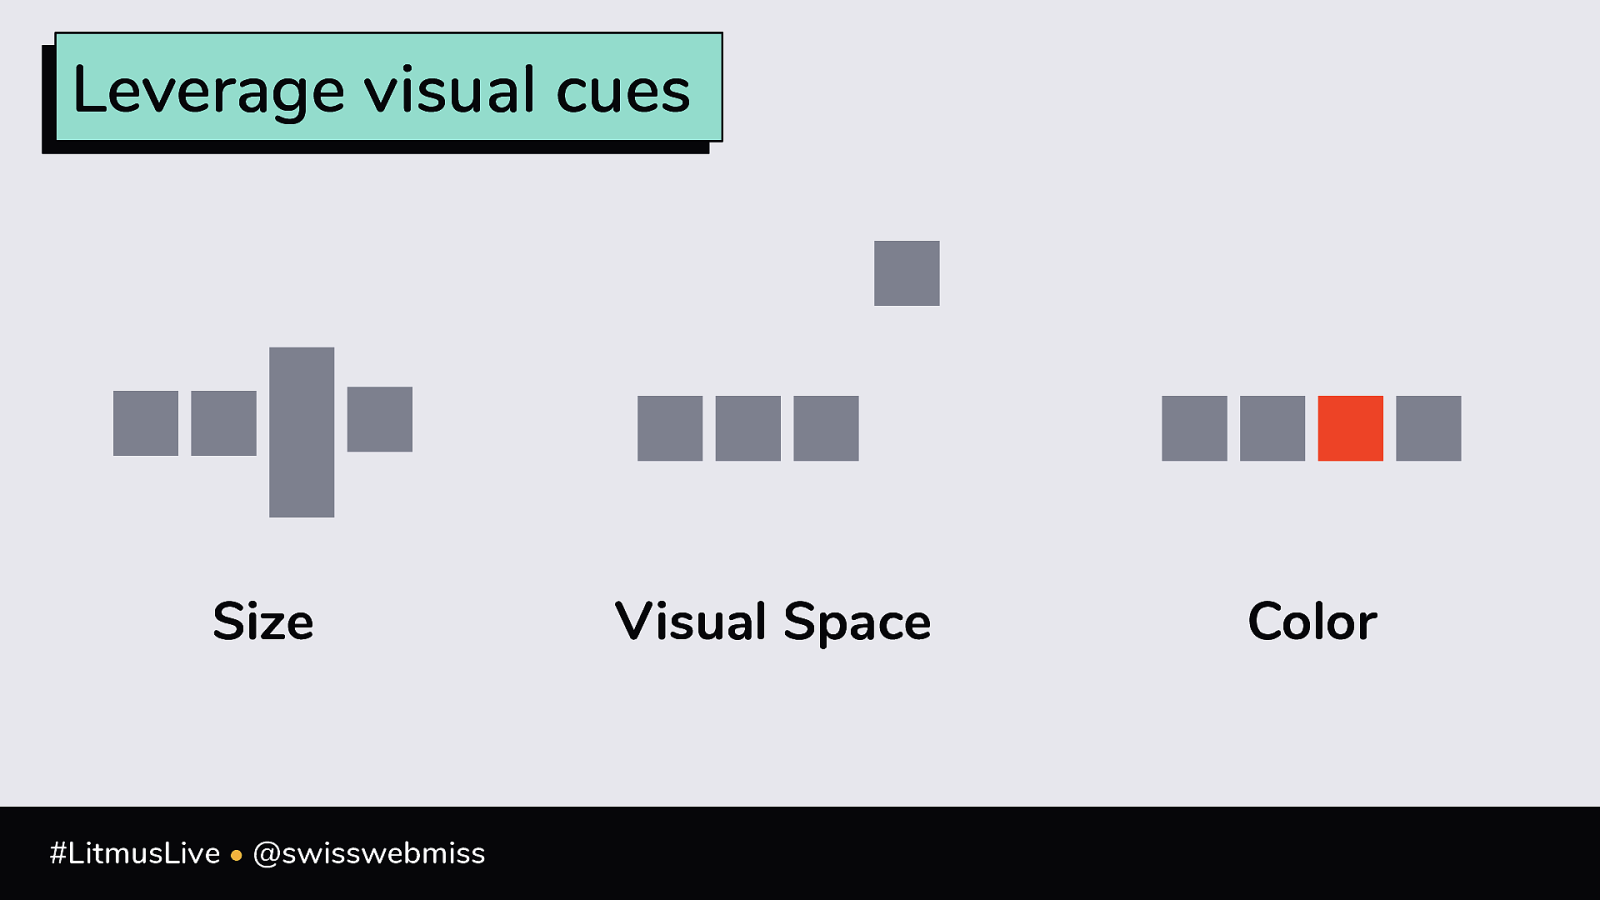
Leverage visual cues Size #LitmusLive • @swisswebmiss Visual Space Color
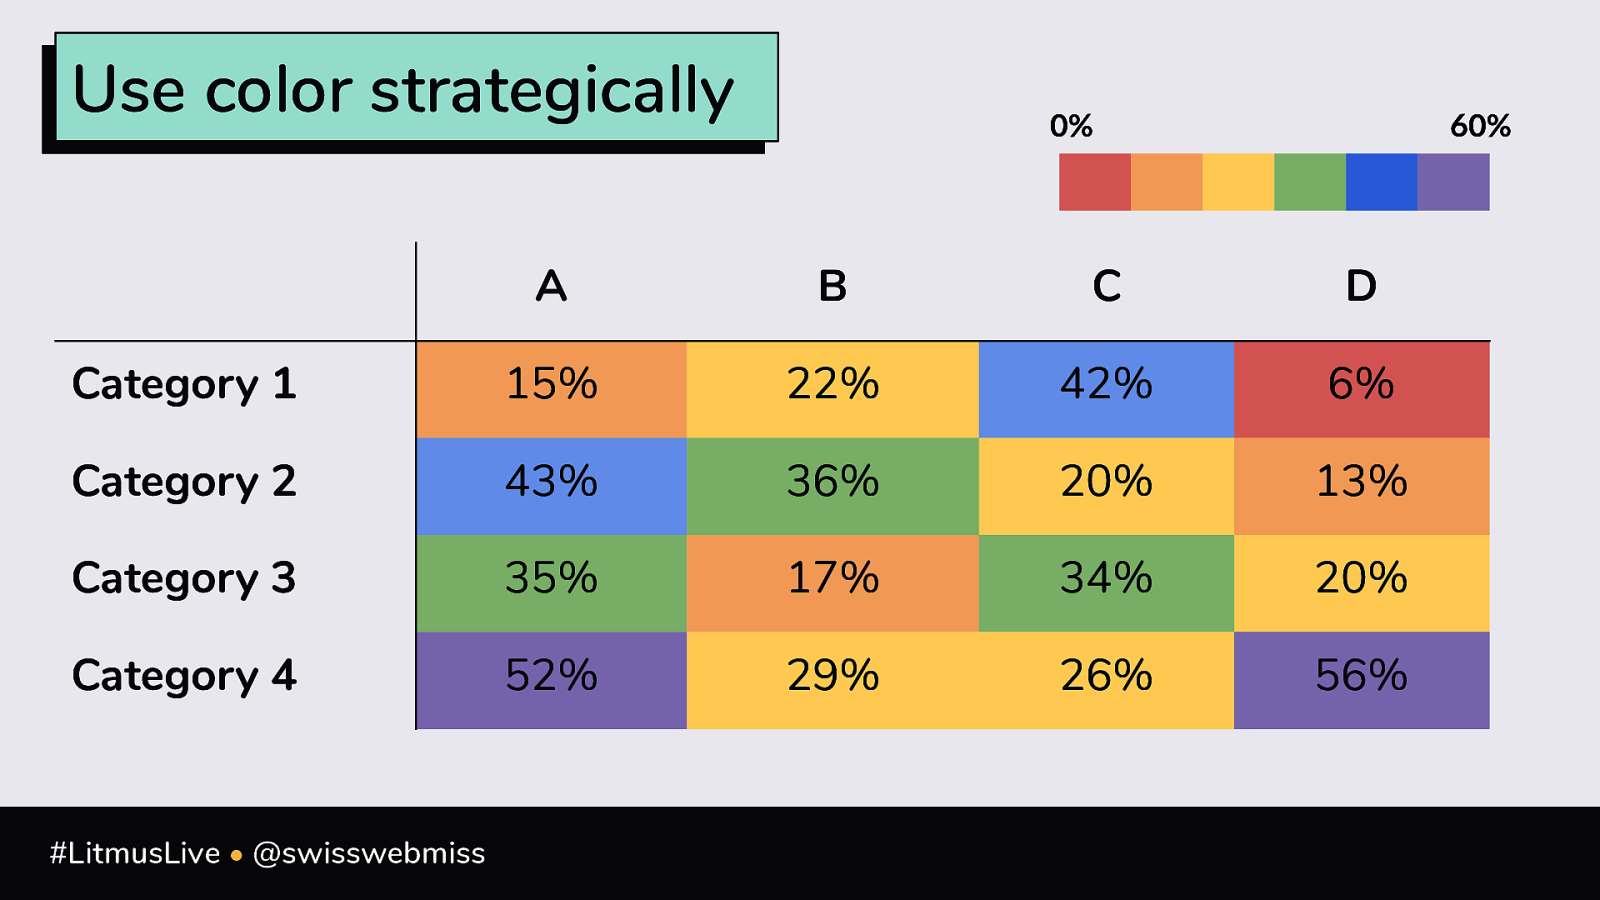
Use color strategically 0% 60% A B C D Category 1 15% 22% 42% 6% Category 2 43% 36% 20% 13% Category 3 35% 17% 34% 20% Category 4 52% 29% 26% 56% #LitmusLive • @swisswebmiss
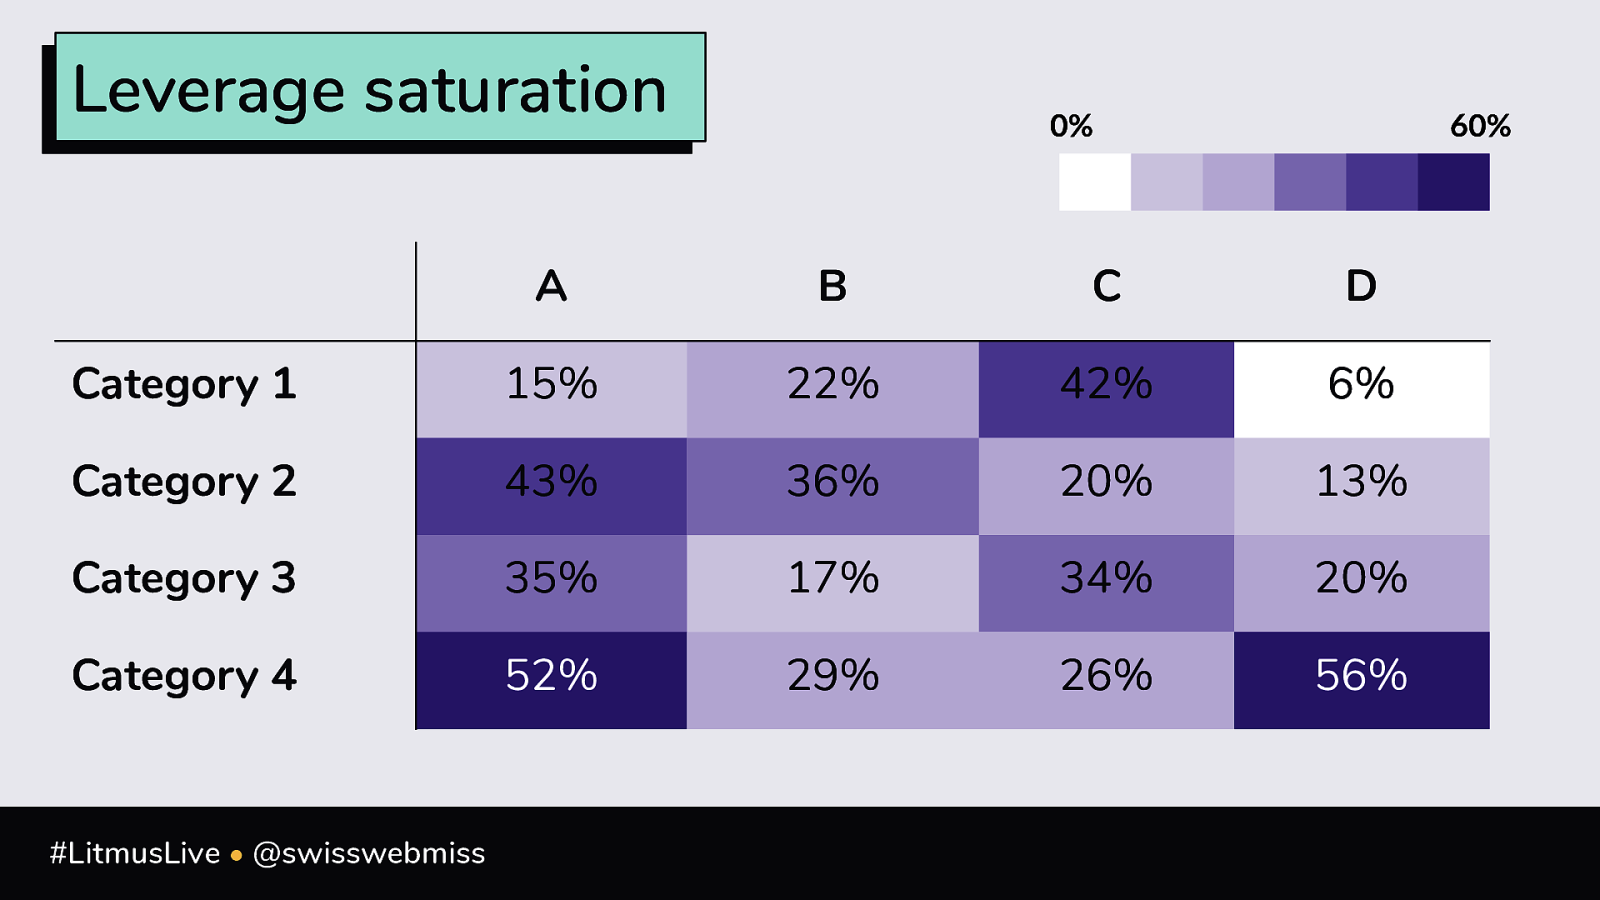
Leverage saturation 0% 60% A B C D Category 1 15% 22% 42% 6% Category 2 43% 36% 20% 13% Category 3 35% 17% 34% 20% Category 4 52% 29% 26% 56% #LitmusLive • @swisswebmiss
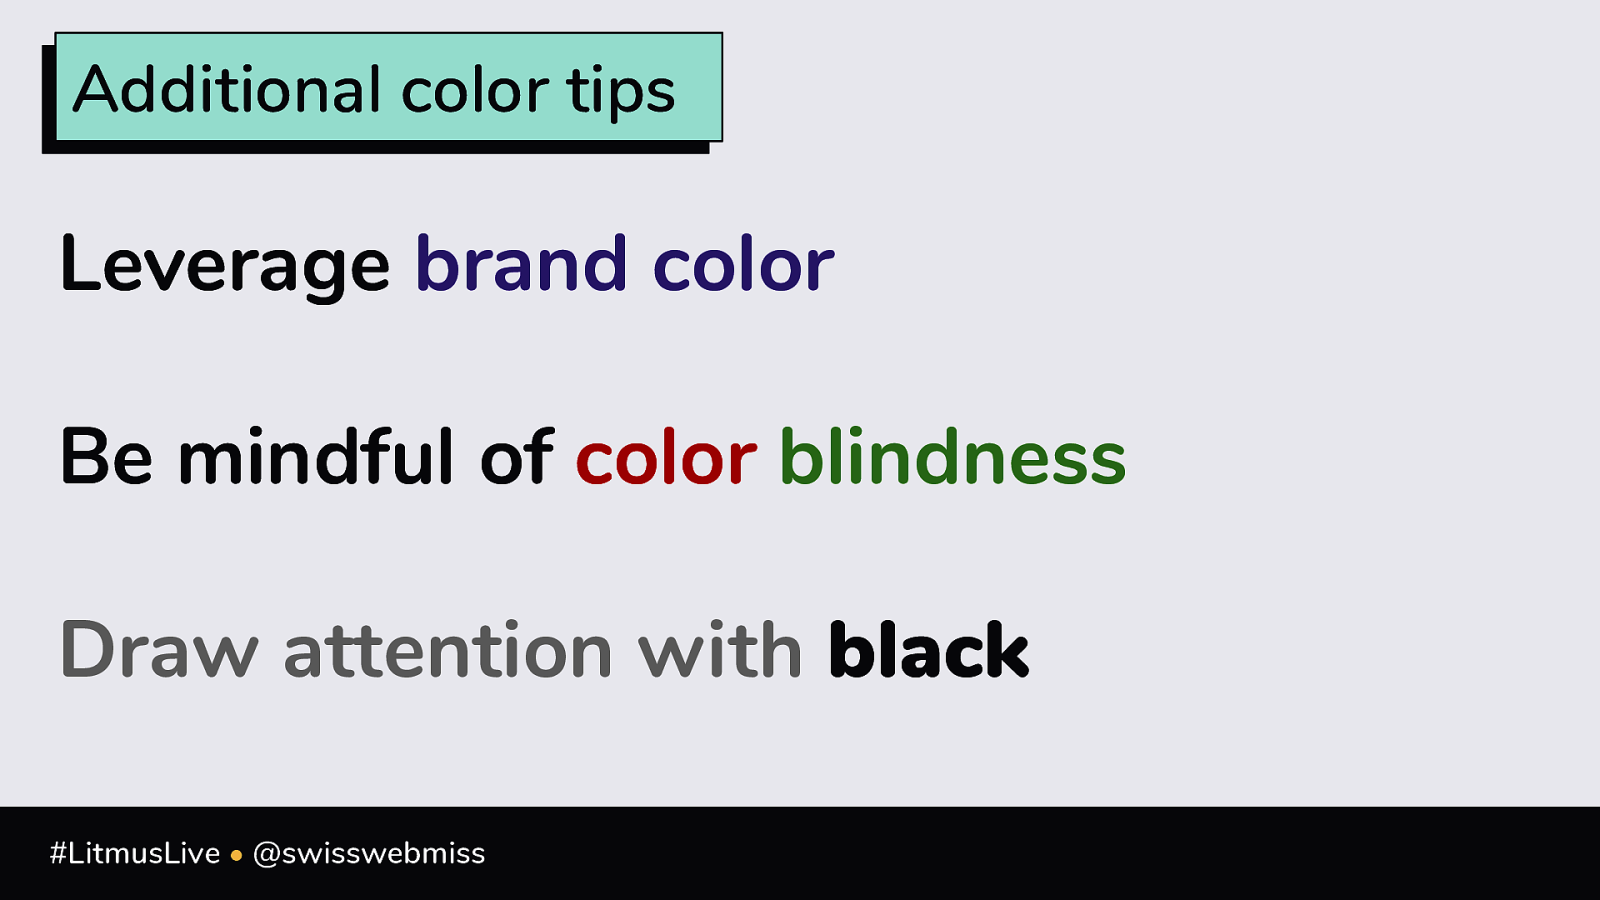
Additional color tips Leverage brand color Be mindful of color blindness Draw attention with black #LitmusLive • @swisswebmiss
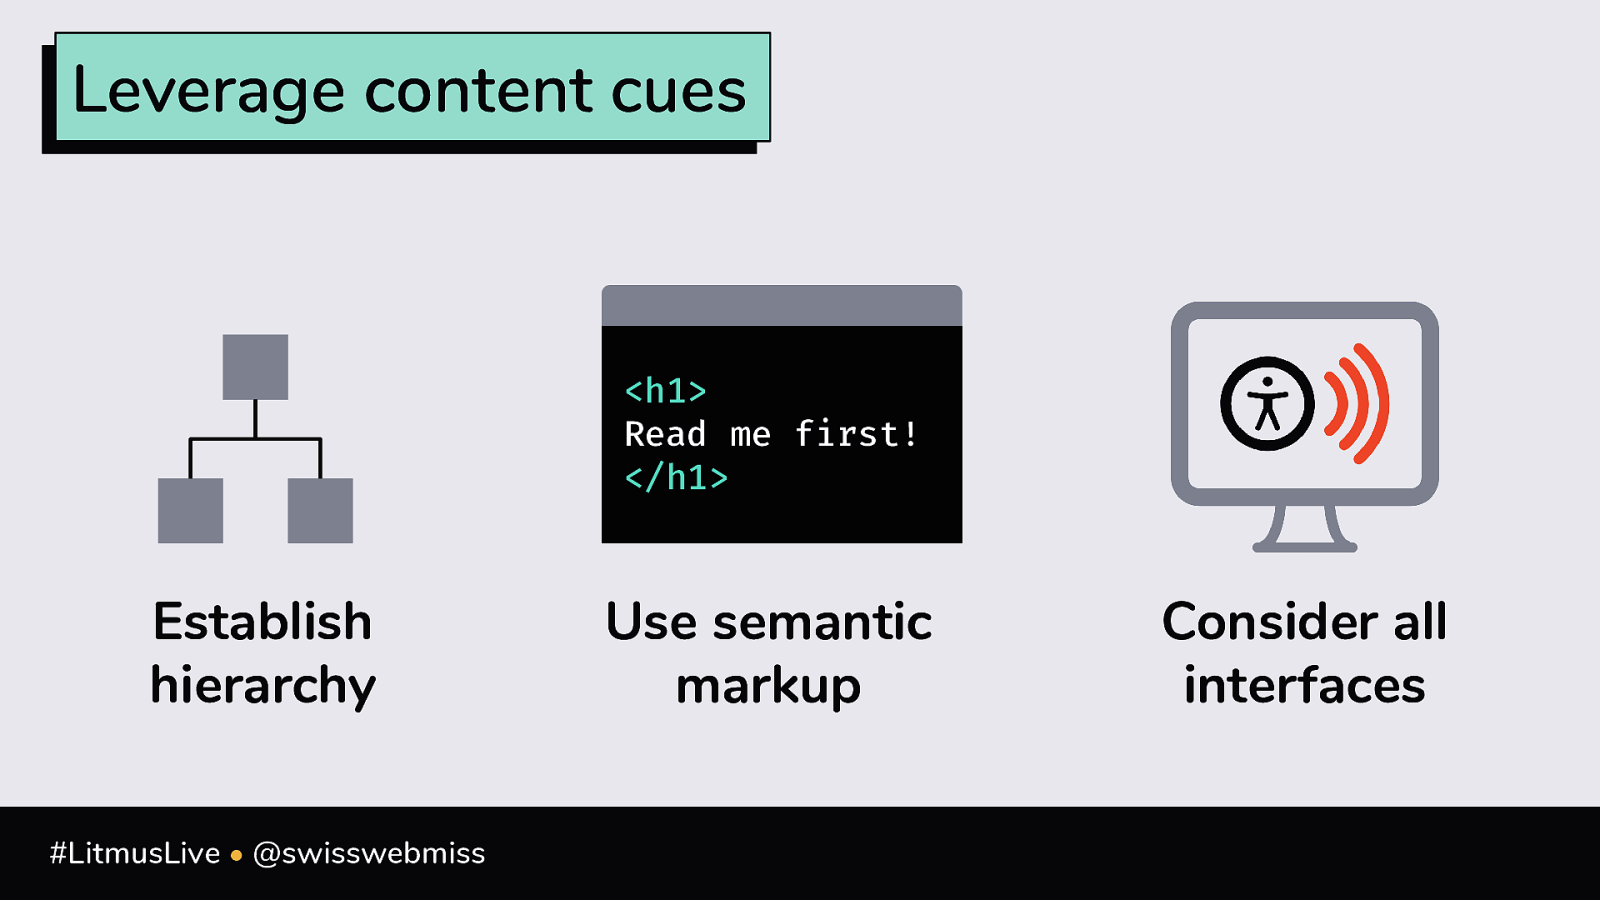
Leverage content cues
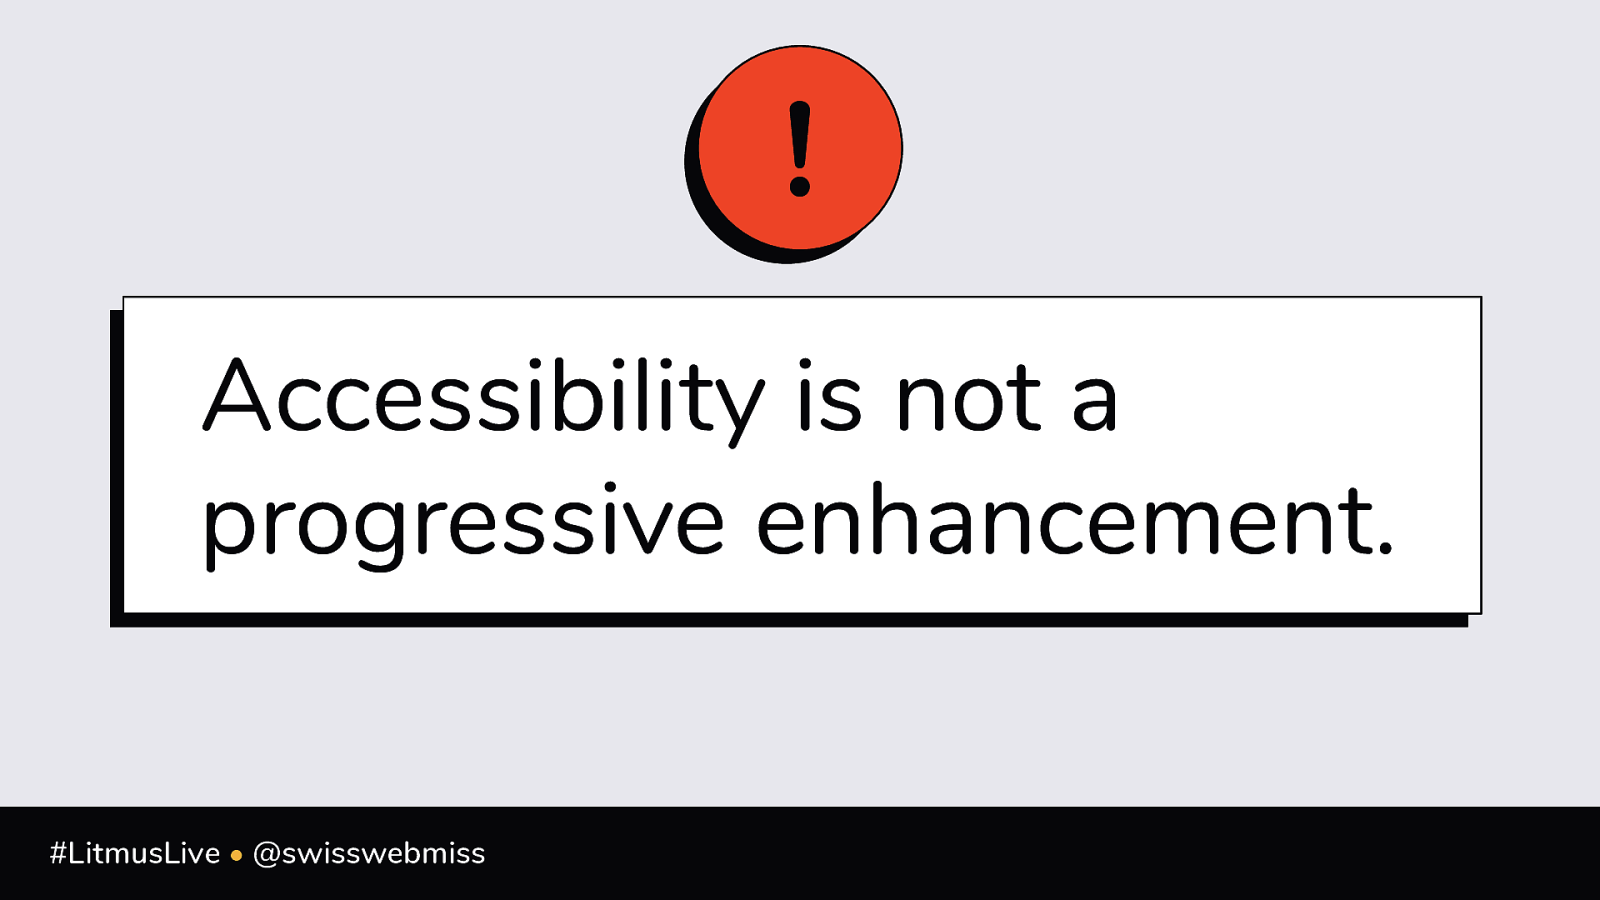
<h1> Read me first! </h1> Establish hierarchy #LitmusLive • @swisswebmiss Use semantic markup Consider all interfaces! Accessibility is not a progressive enhancement. #LitmusLive • @swisswebmiss
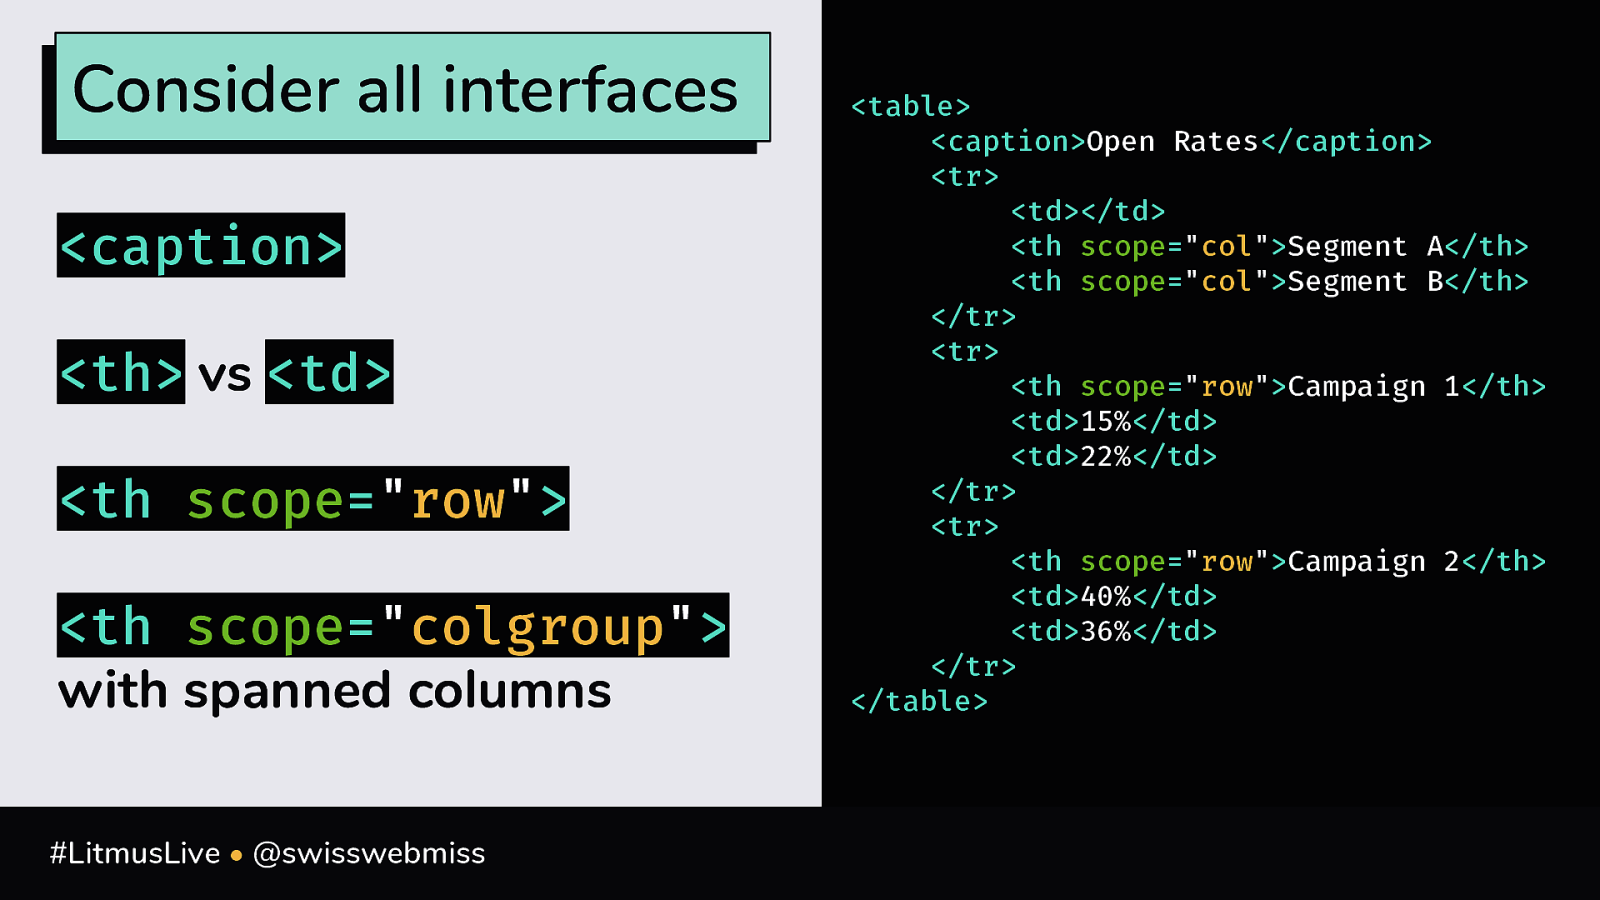
Consider all interfaces <caption> <th> vs <td> <th scope=”row”> <th scope=”colgroup”> with spanned columns #LitmusLive • @swisswebmiss
<table> <caption>Open Rates</caption> <tr> <td></td> <th scope=”col”>Segment A</th> <th scope=”col”>Segment B</th> </tr> <tr> <th scope=”row”>Campaign 1</th> <td>15%</td> <td>22%</td> </tr> <tr> <th scope=”row”>Campaign 2</th> <td>40%</td> <td>36%</td> </tr> </table>3 Tell a Story #LitmusLive • @swisswebmiss
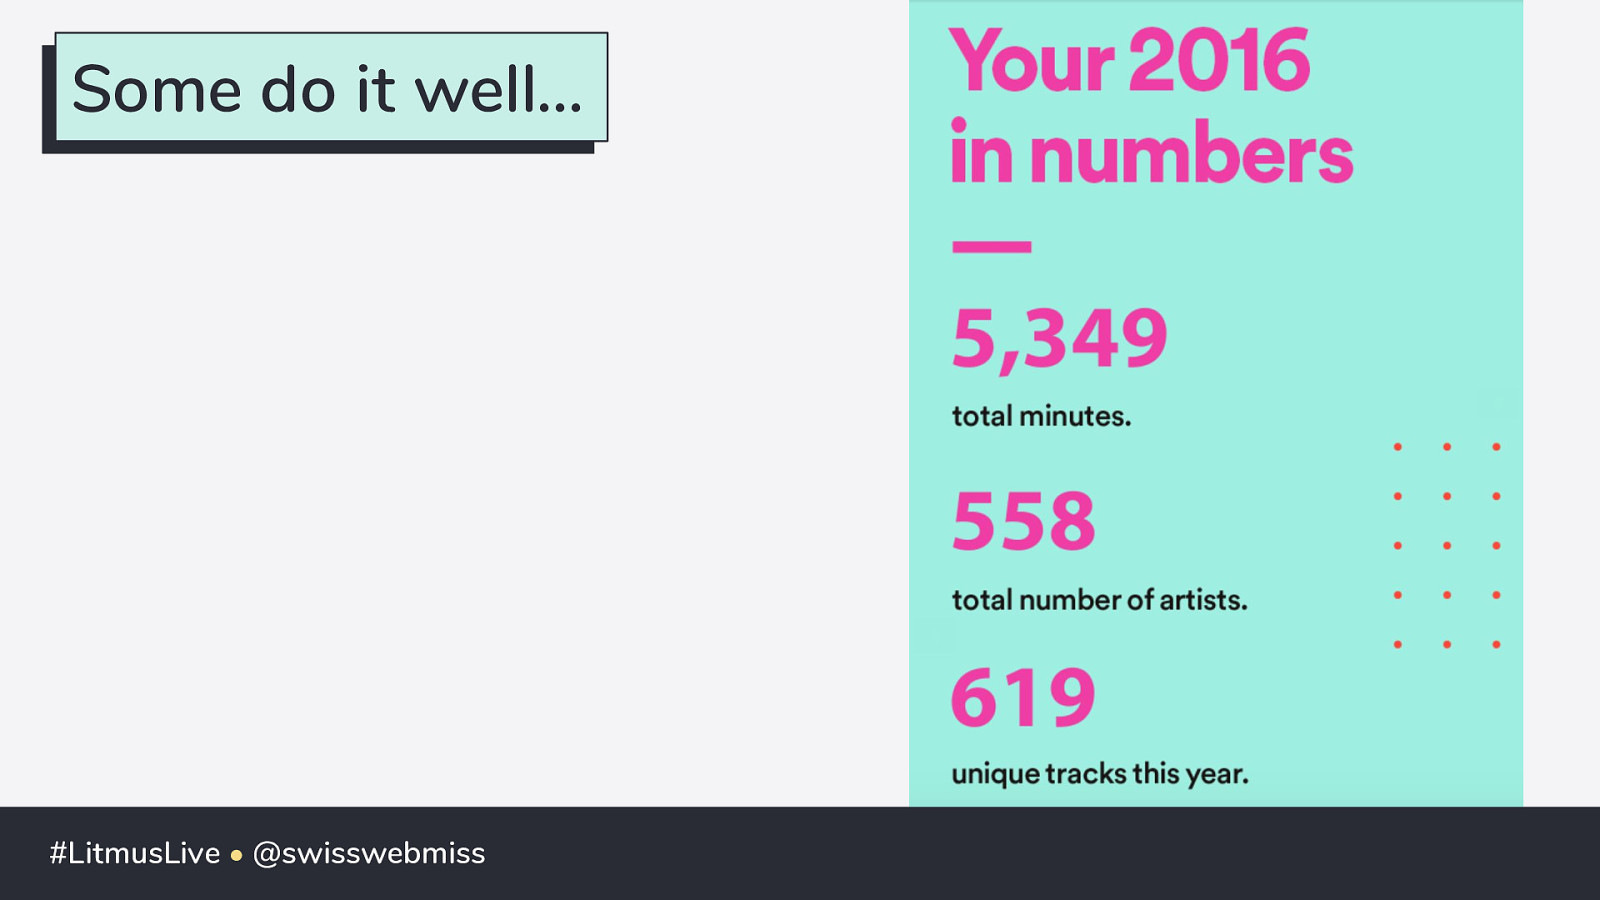
Some do it well… #LitmusLive • @swisswebmiss
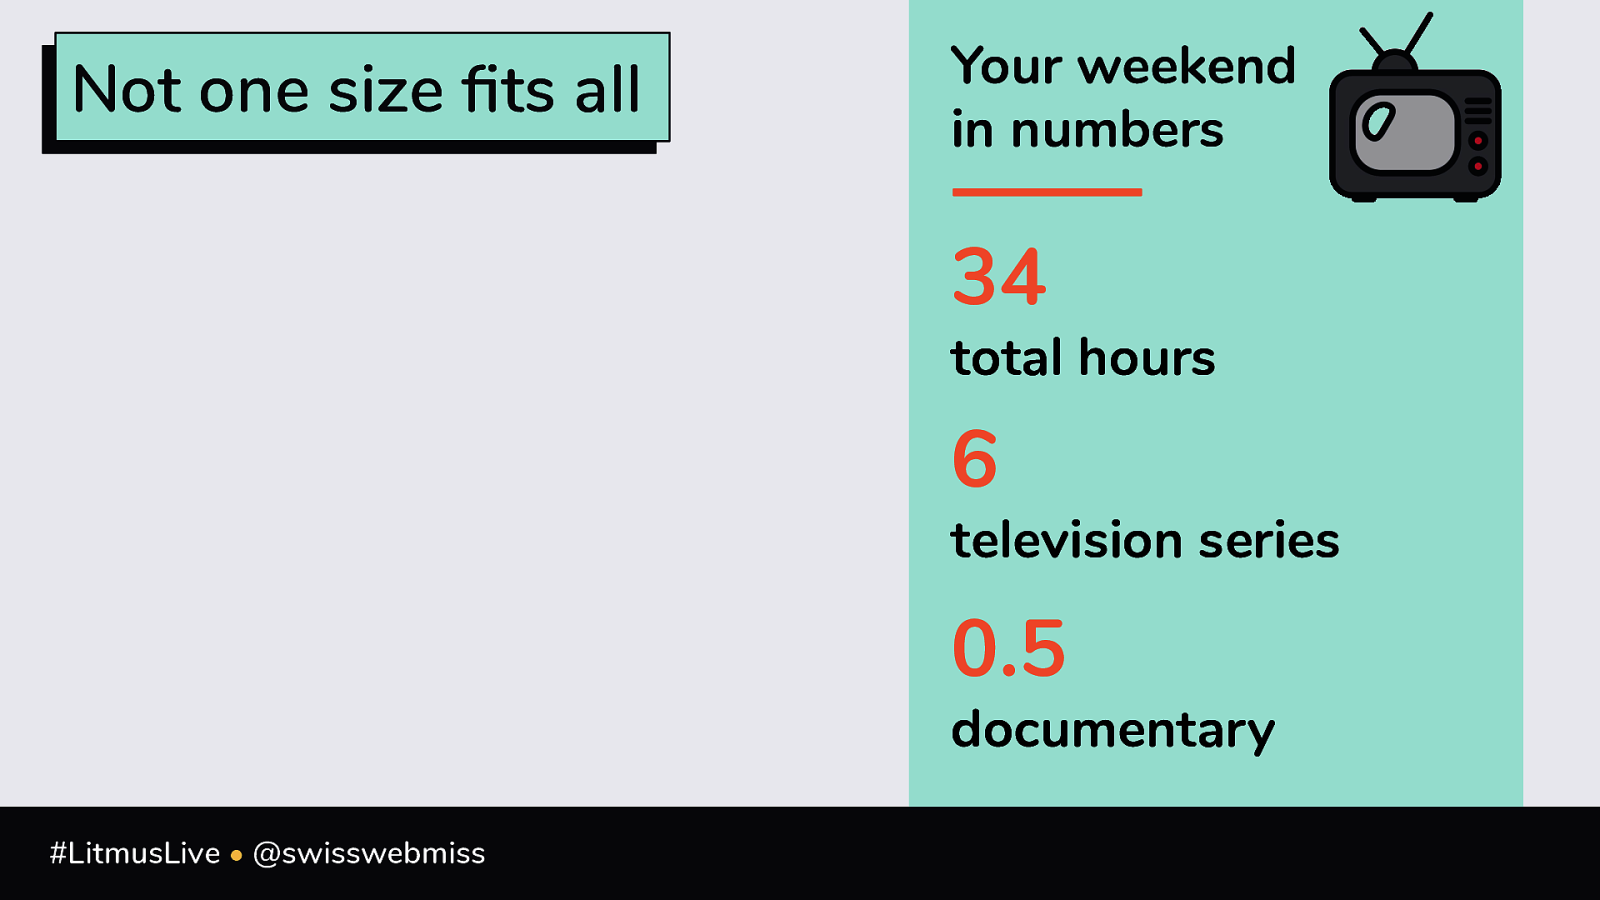
Not one size fits all Your weekend in numbers 34 total hours 6 television series 0.5 documentary #LitmusLive • @swisswebmiss
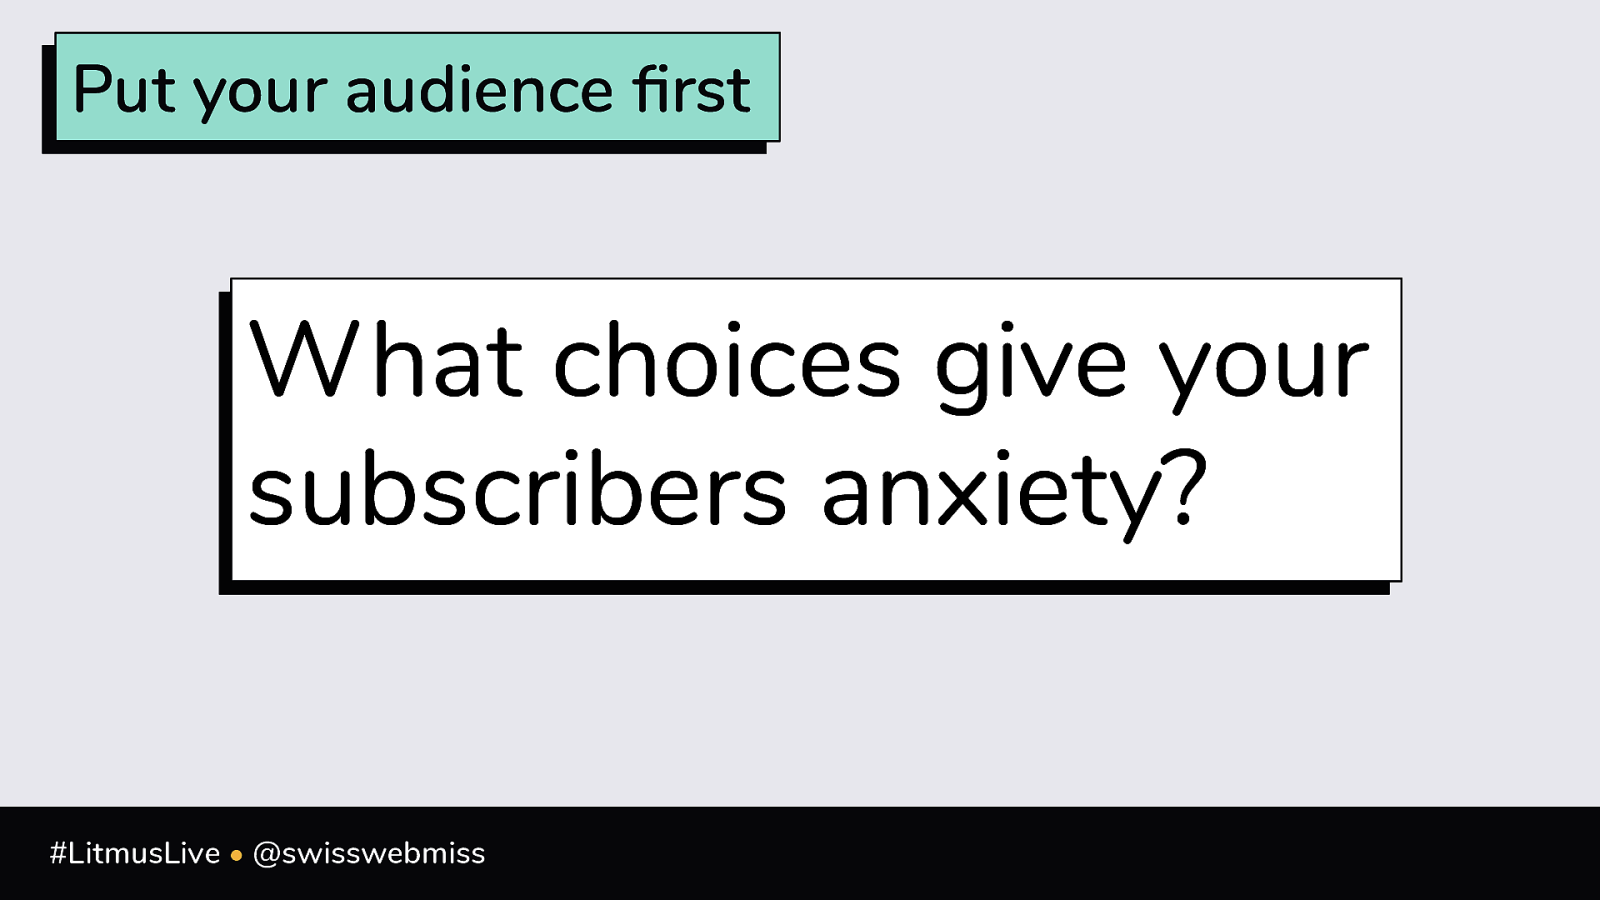
Put your audience first What choices give your subscribers anxiety? #LitmusLive • @swisswebmiss
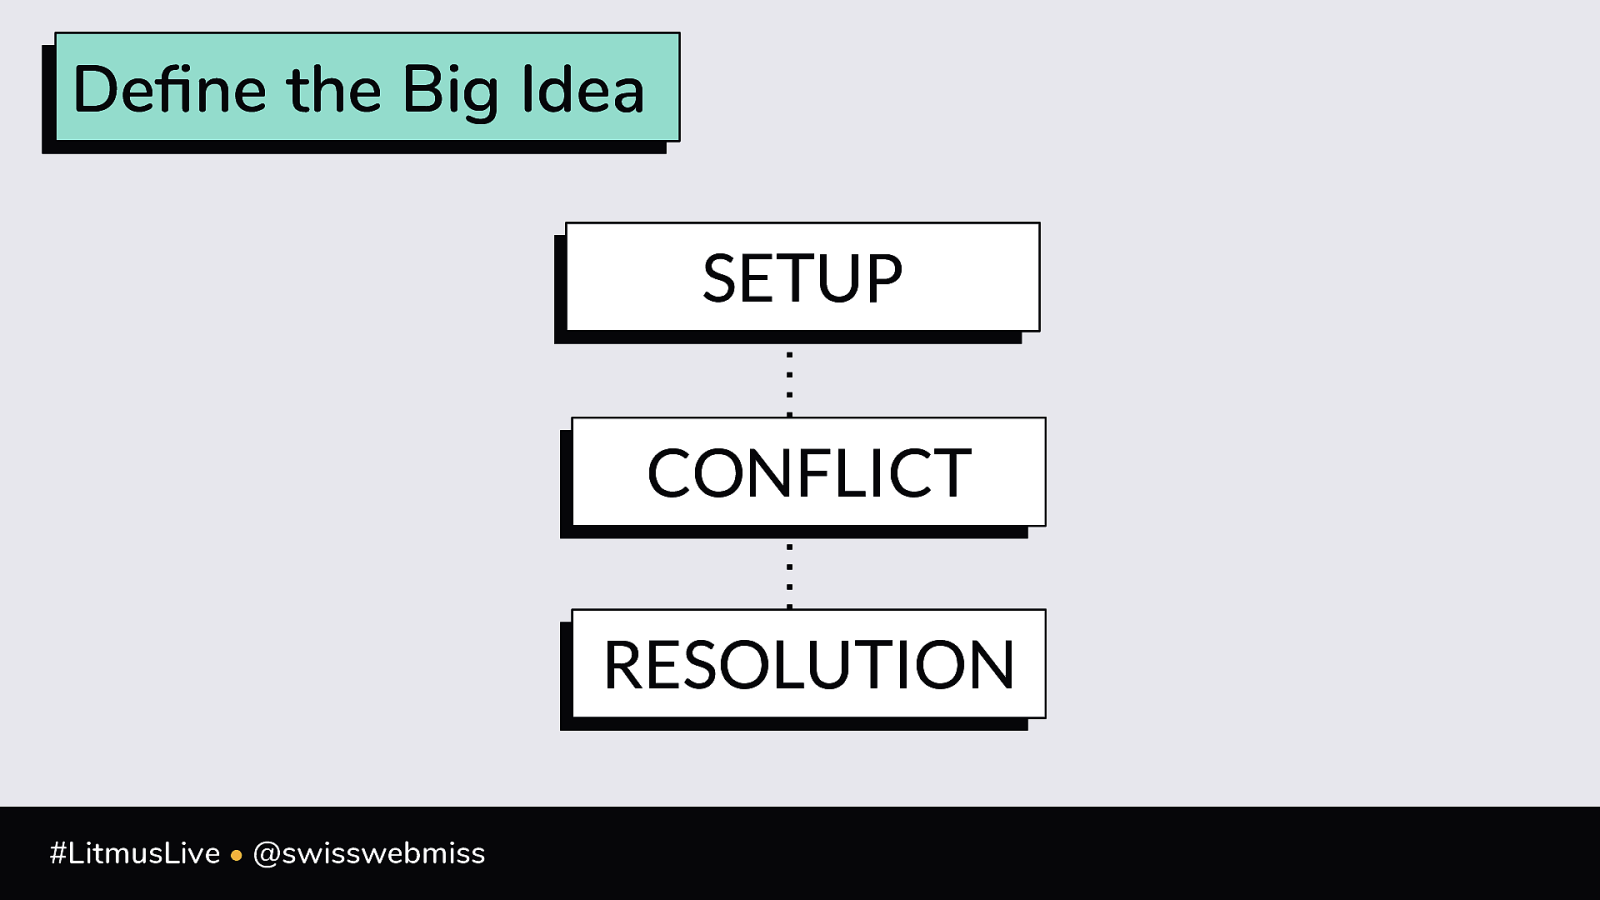
Define the Big Idea SETUP CONFLICT RESOLUTION #LitmusLive • @swisswebmiss
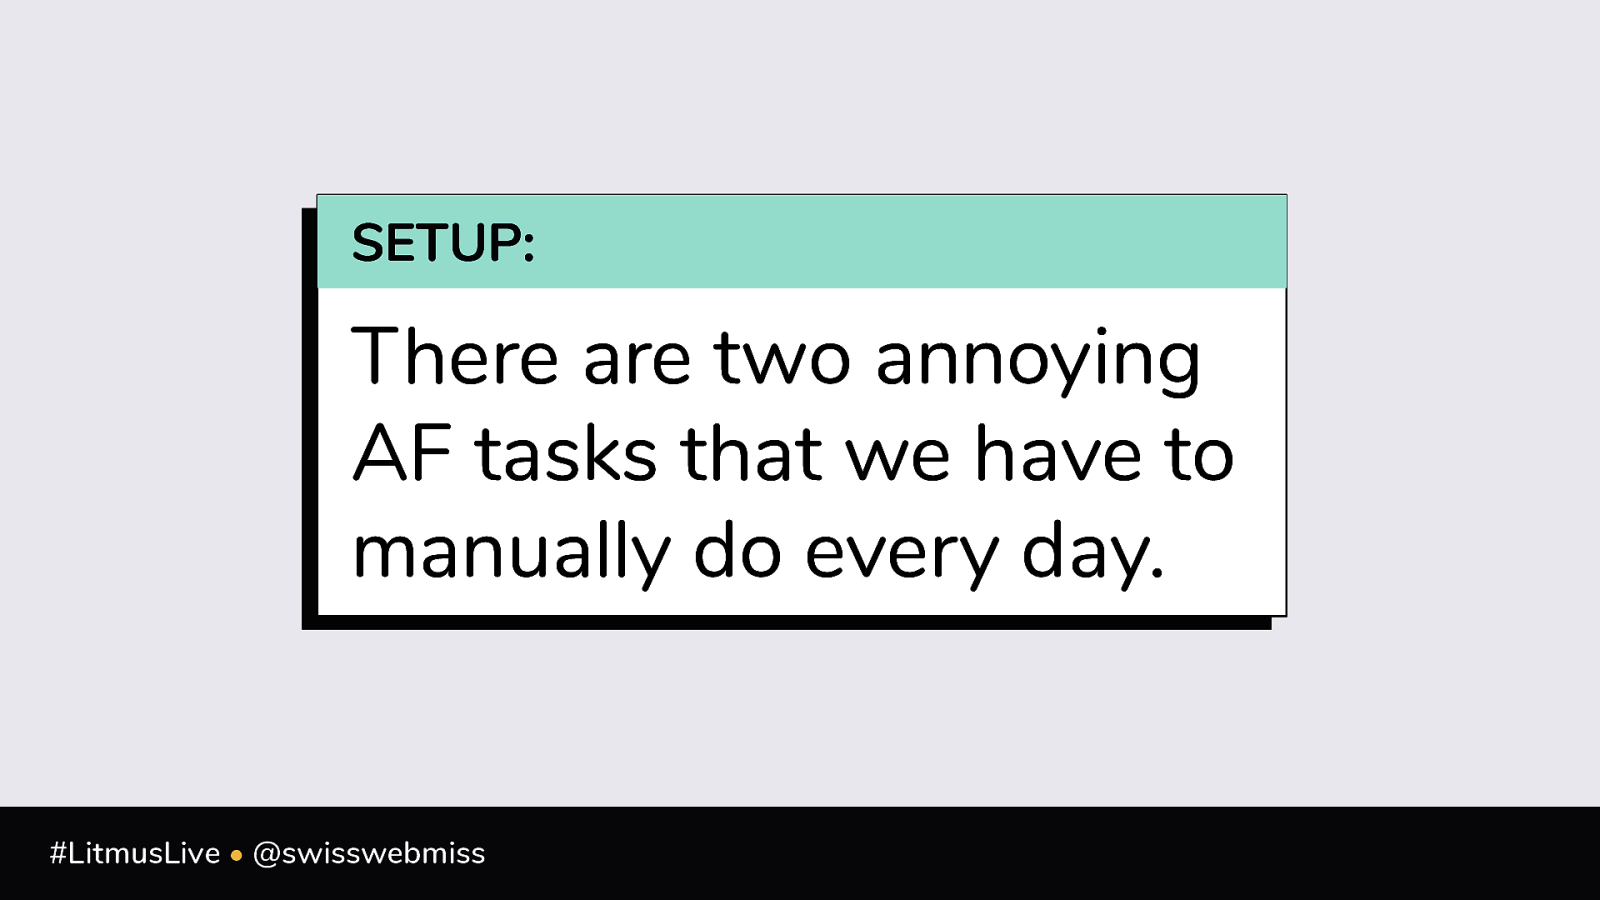
SETUP: There are two annoying AF tasks that we have to manually do every day. #LitmusLive • @swisswebmiss
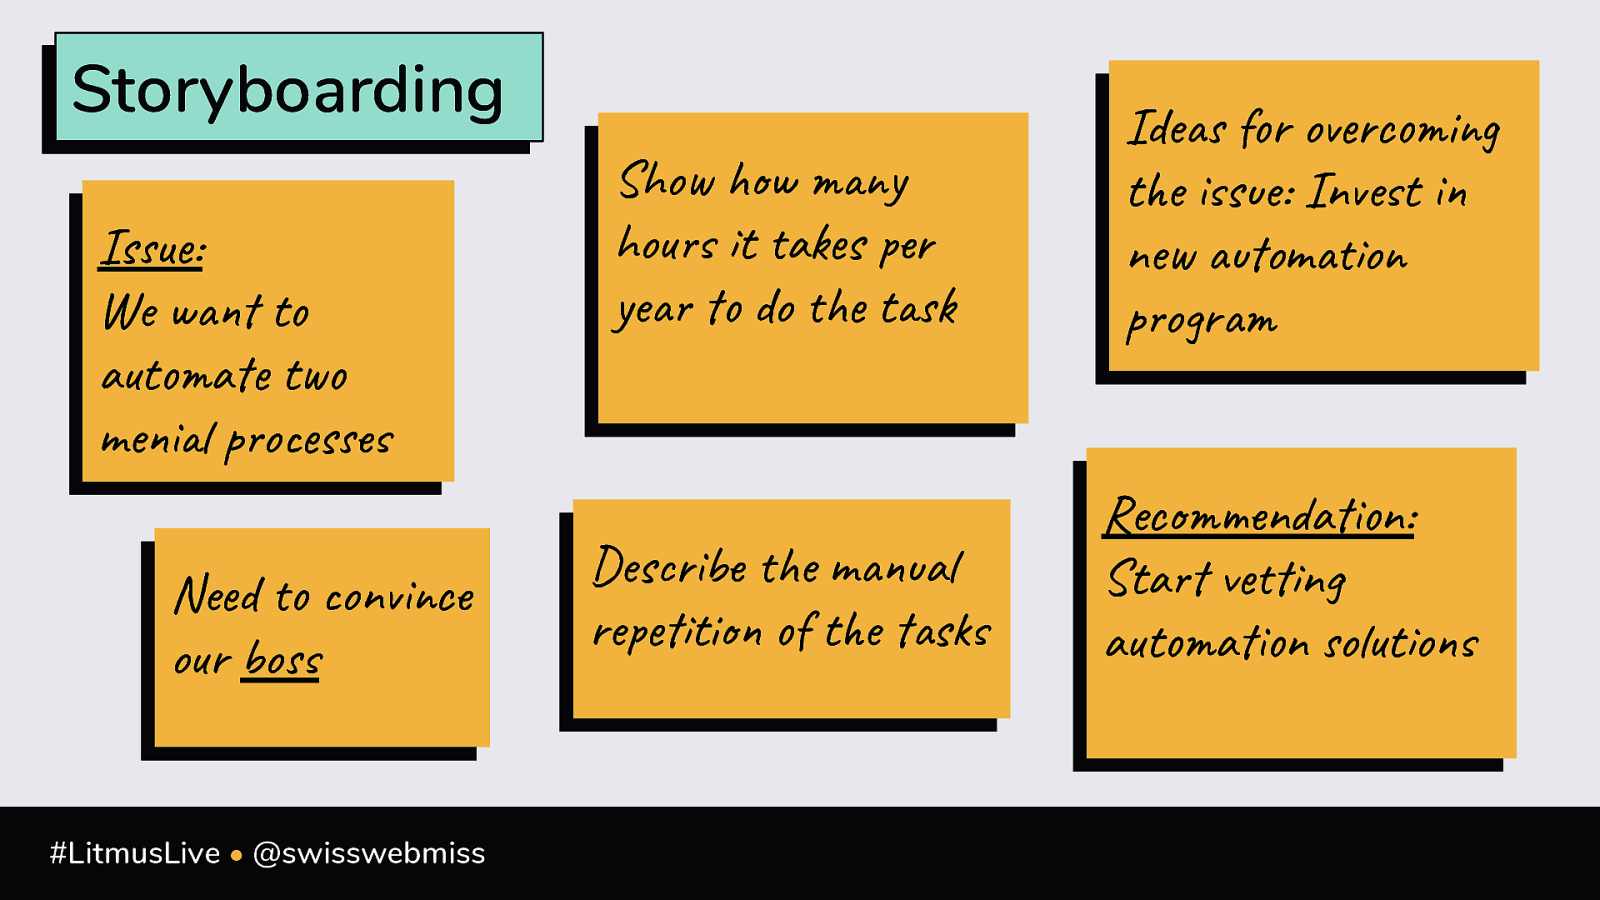
Storyboarding Issue: ISSUE: You We want want to to automate two automate two menial processes Show how many Demonstrate issue: Show many hourshow it takes per hours it takes per year year to dotask the task to do the Ideasfor forovercoming overcoming Ideas the theissue: issue:Invest Investinin new automation new automation program program menial processes Need to convince Describe the consistency our boss of the tasks #LitmusLive • @swisswebmiss Describethe the manual Describe consistency thetasks repetition ofofthe tasks Recommendation: RECOMMENDATION: Start vetting Start vetting automationsolutions solutions automation
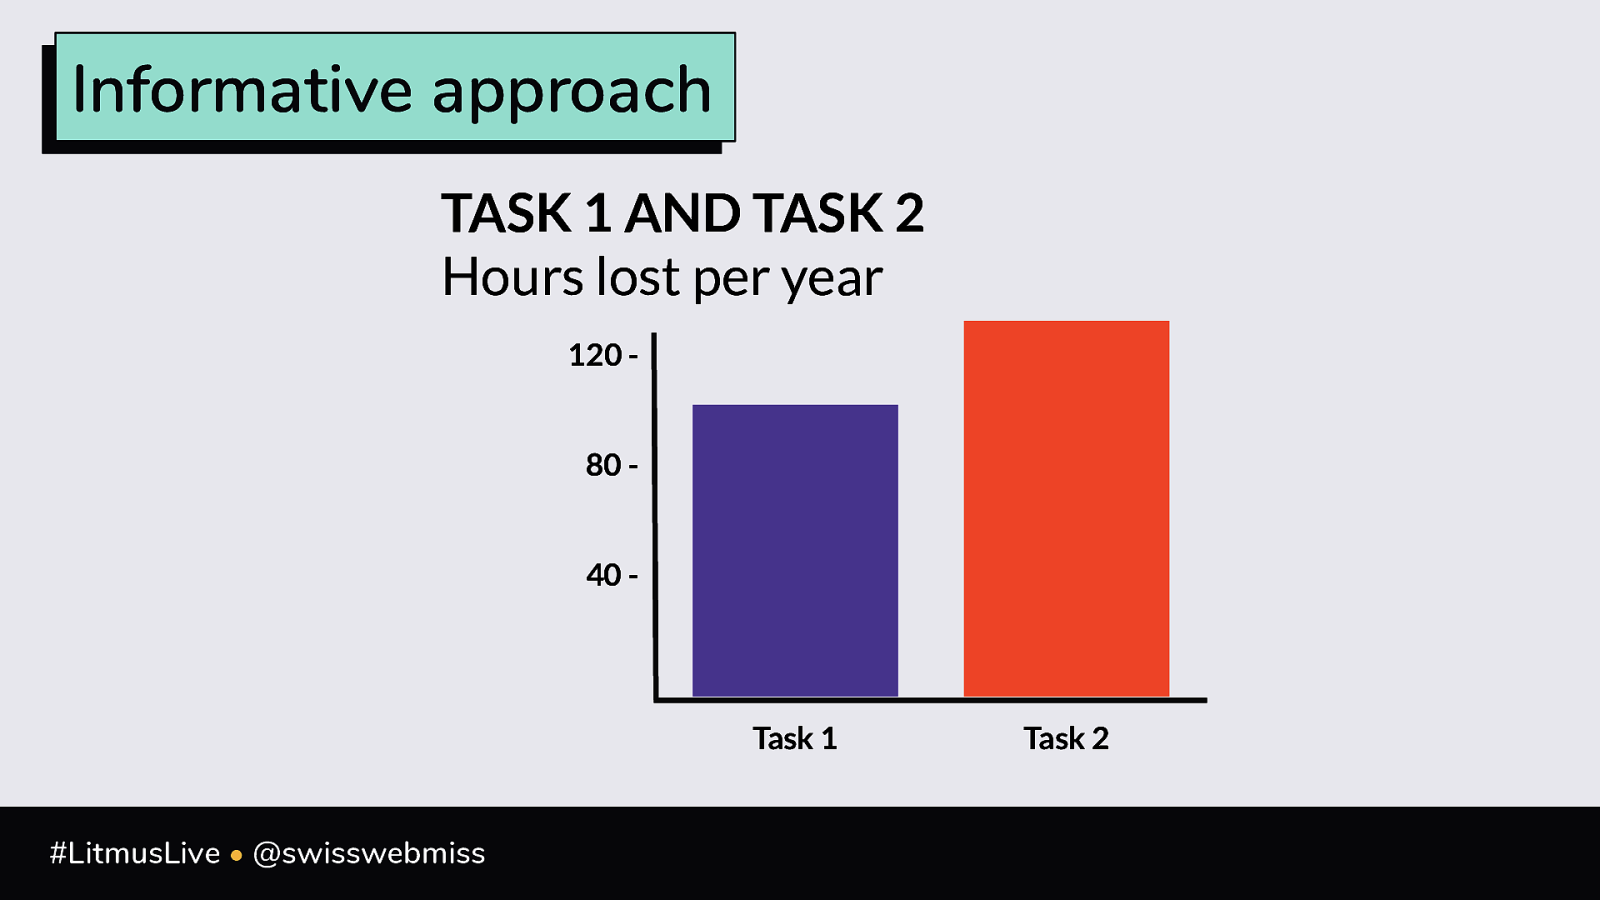
Informative approach TASK 1 AND TASK 2 Hours lost per year 120 - 80 - 40 - Task 1 #LitmusLive • @swisswebmiss Task 2
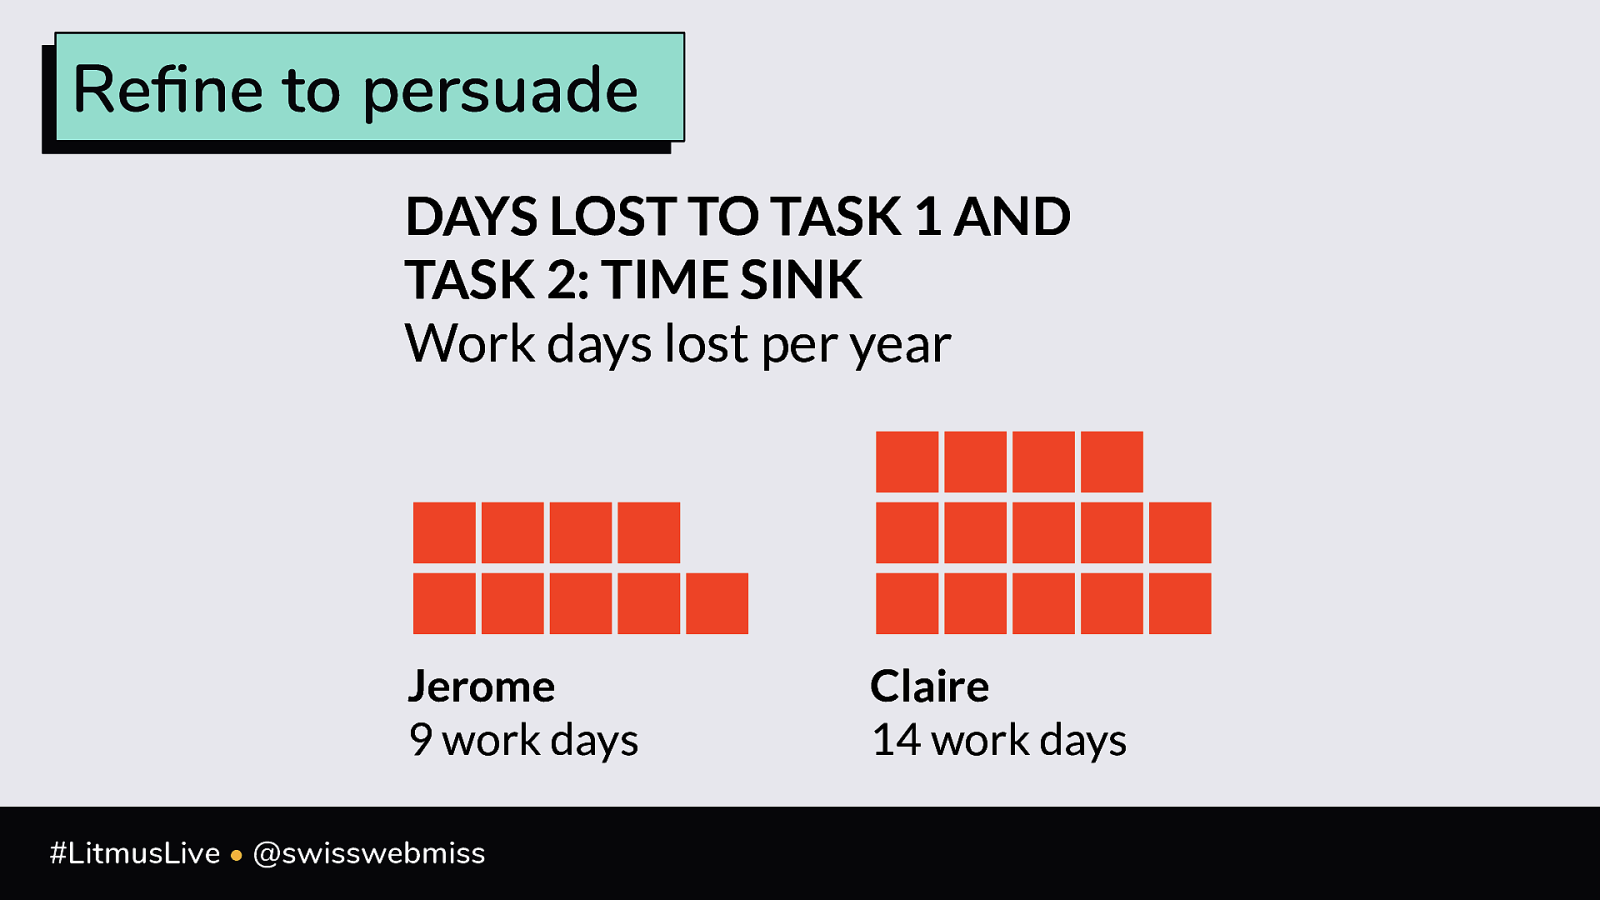
Refine to persuade DAYS LOST TO TASK 1 AND TASK 2: TIME SINK Work days lost per year Jerome 9 work days #LitmusLive • @swisswebmiss Claire 14 work days
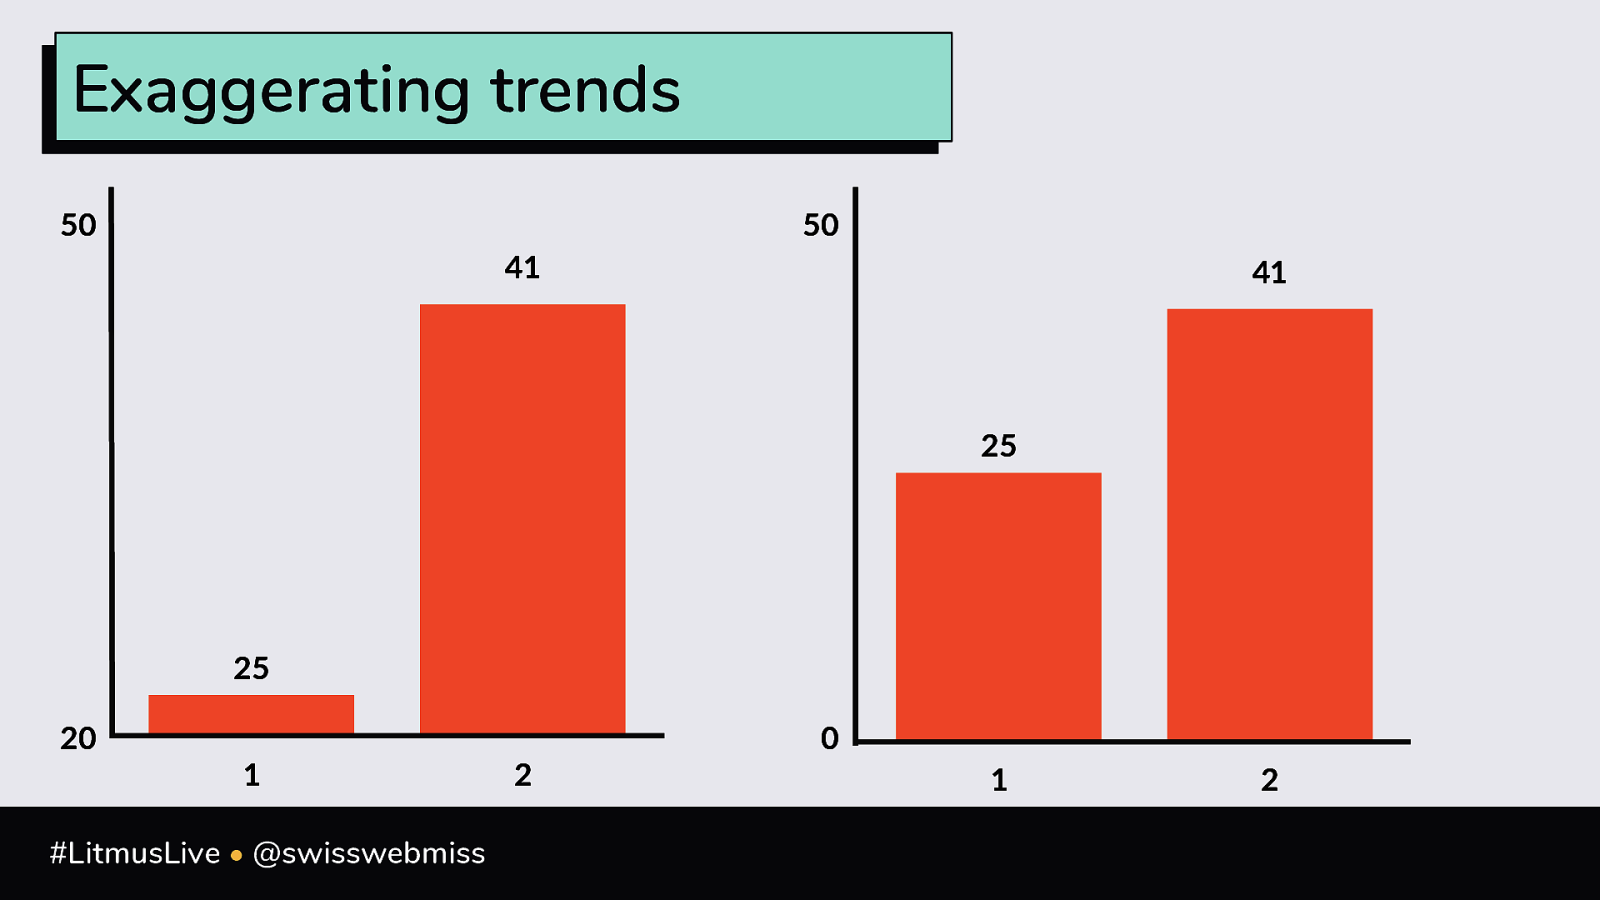
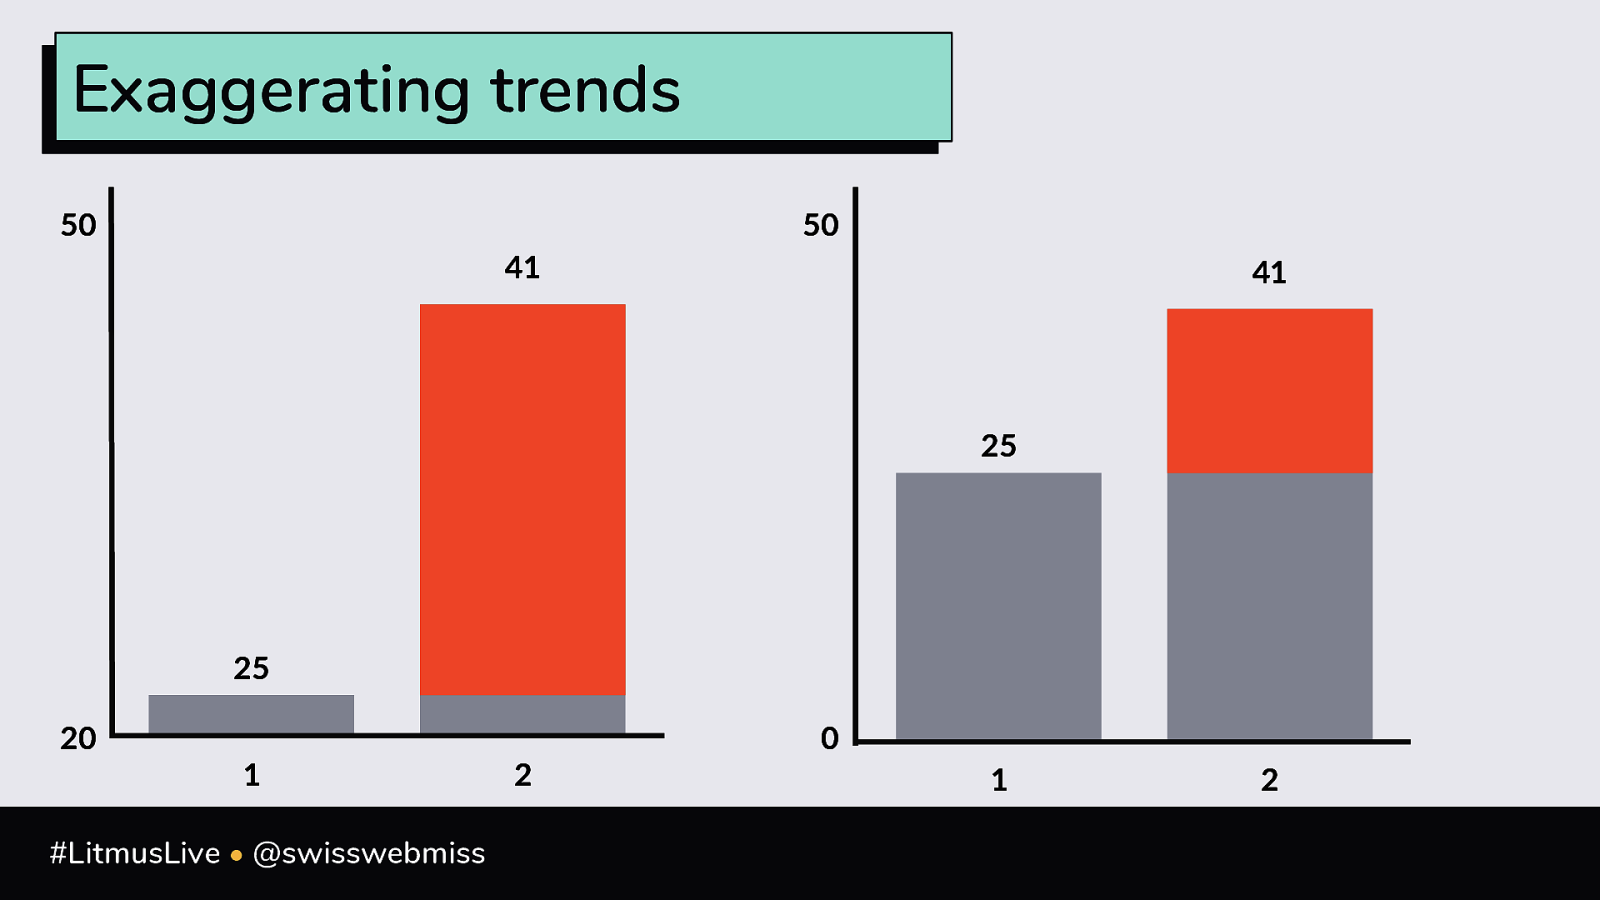
! Persuasion or manipulation? #LitmusLive • @swisswebmiss
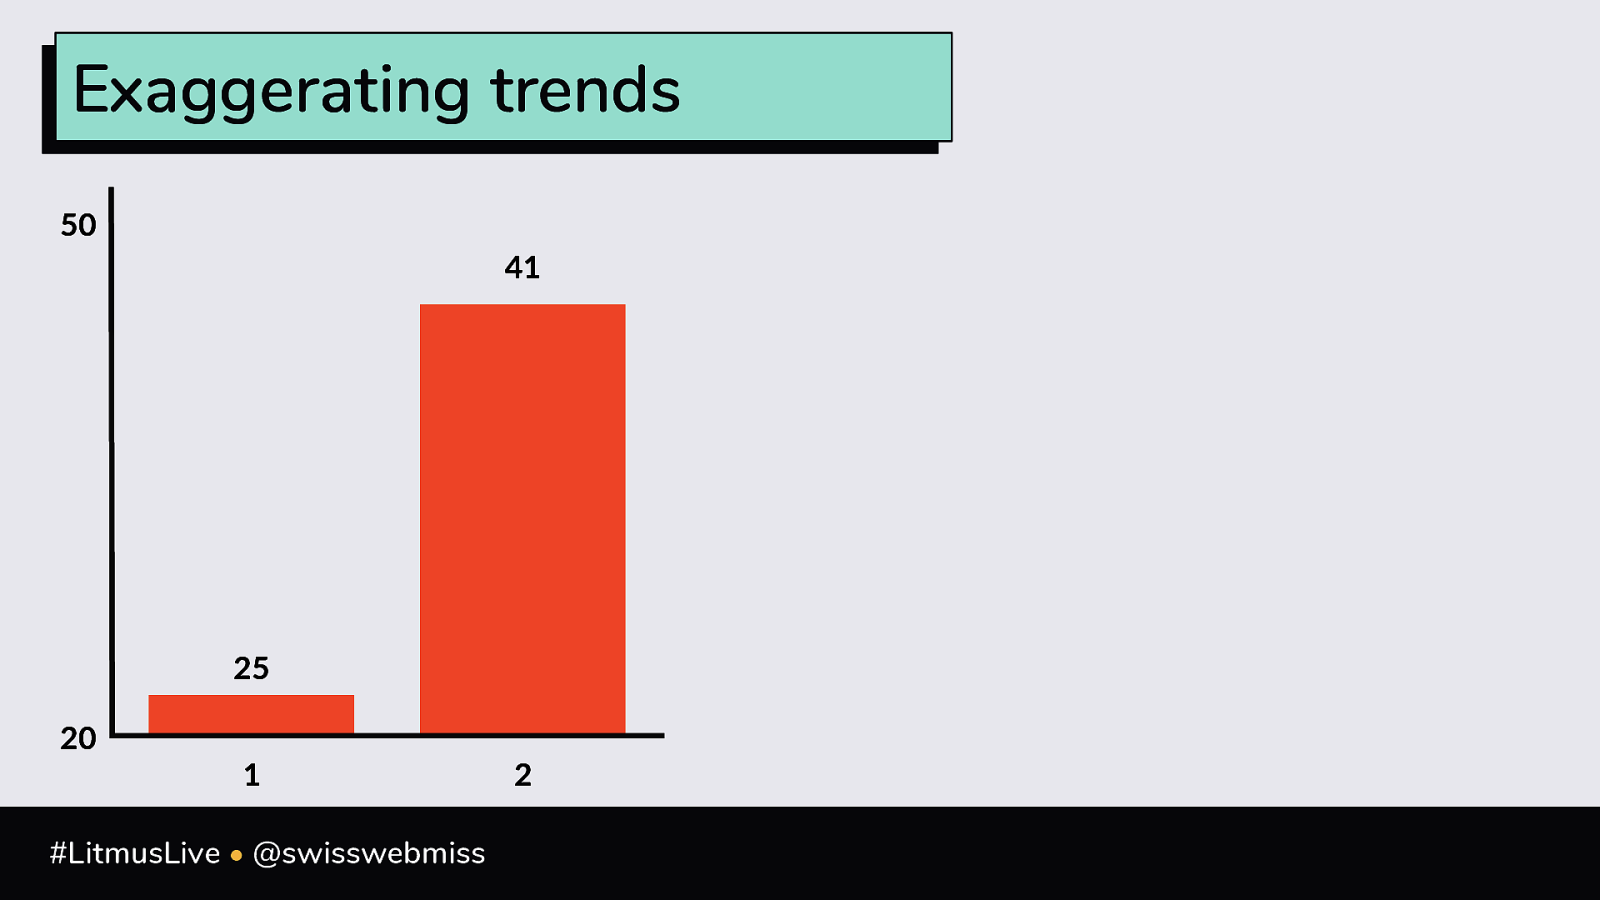
Exaggerating trends 50 41 25 20 1 #LitmusLive • @swisswebmiss 2
Exaggerating trends 50 50 41 41 25 25 20 0 1 #LitmusLive • @swisswebmiss 2 1 2
Exaggerating trends 50 50 41 41 25 25 20 0 1 #LitmusLive • @swisswebmiss 2 1 2
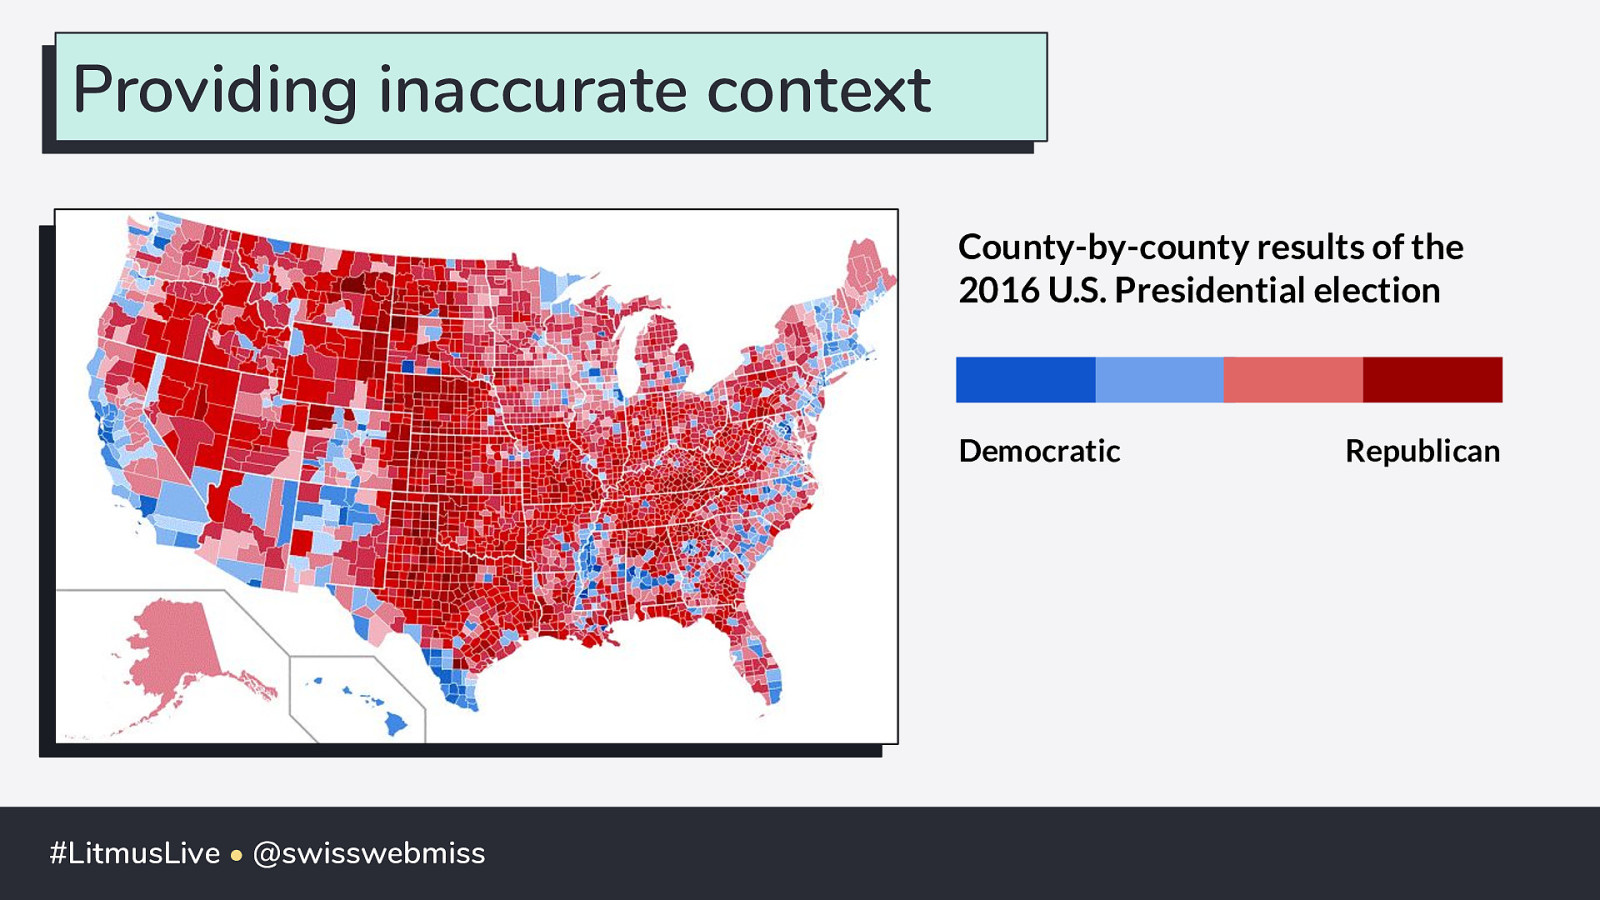
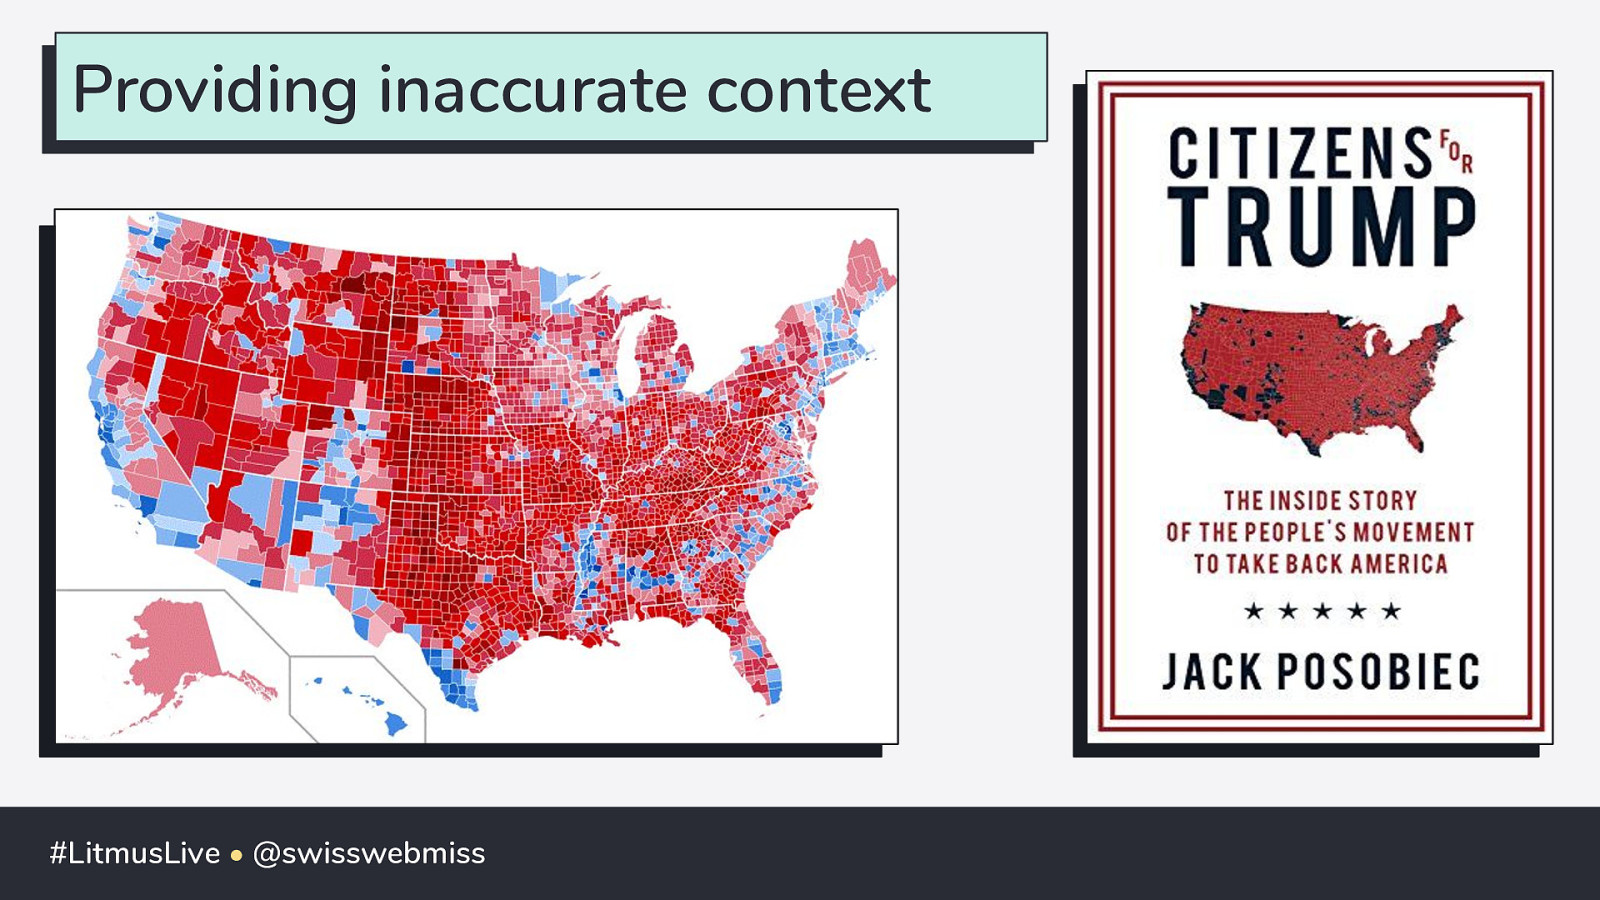
Providing inaccurate context County-by-county results of the 2016 U.S. Presidential election Democratic #LitmusLive • @swisswebmiss Republican
Providing inaccurate context #LitmusLive • @swisswebmiss
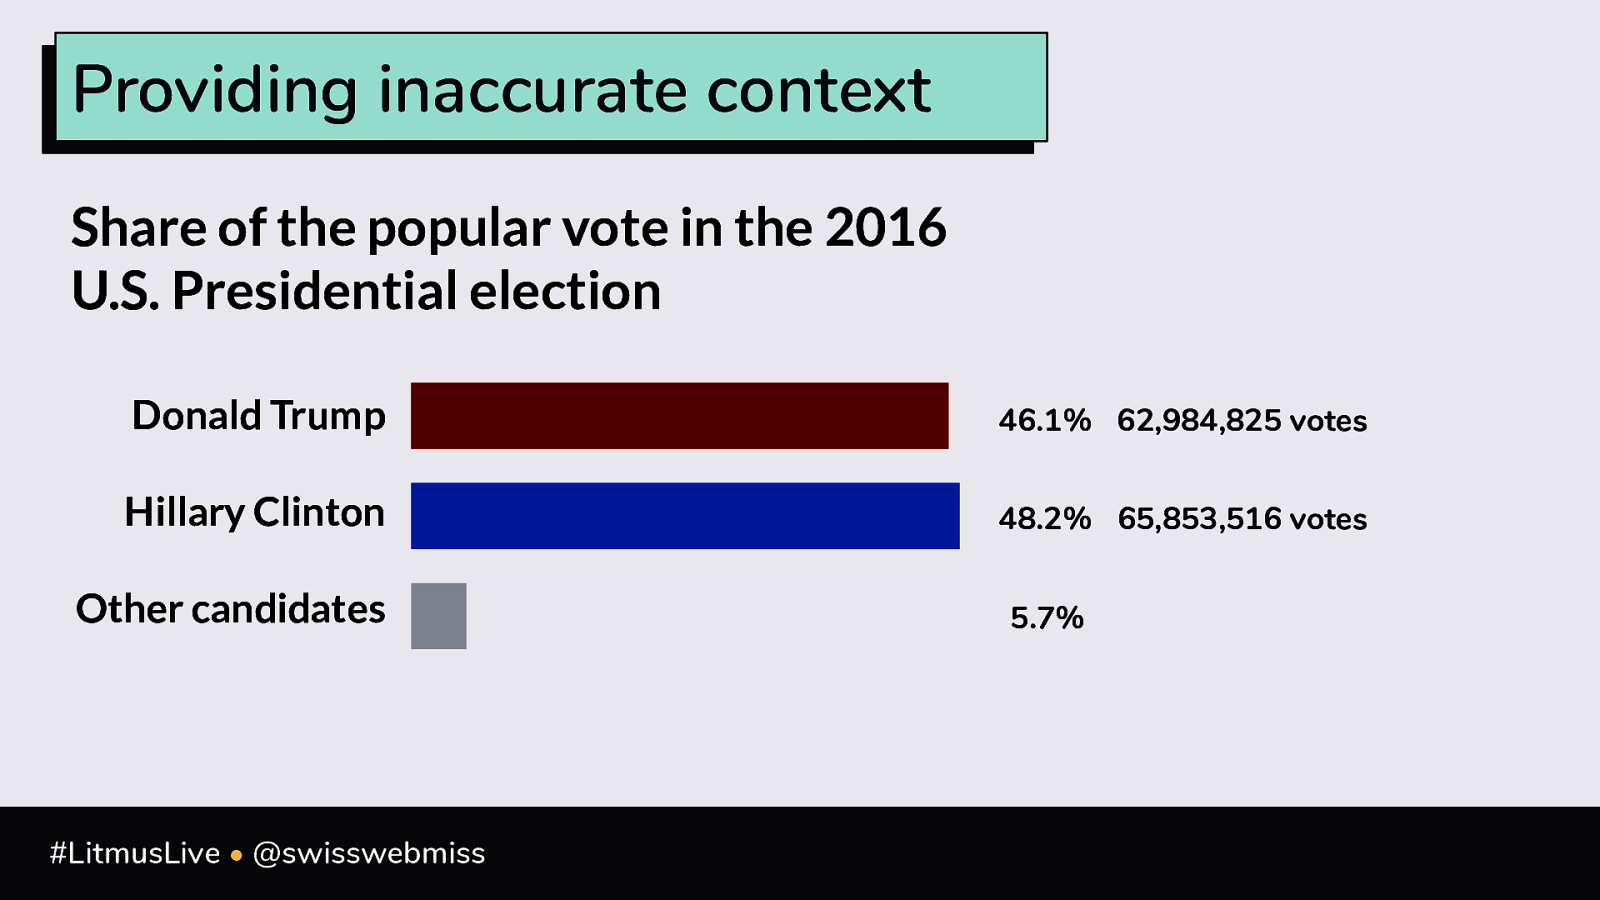
Providing inaccurate context Share of the popular vote in the 2016 U.S. Presidential election Donald Trump 46.1% 62,984,825 votes Hillary Clinton 48.2% 65,853,516 votes Other candidates #LitmusLive • @swisswebmiss 5.7%
METHOD OF COMMUNICATION Choosing an effective visual #LitmusLive • @swisswebmiss
The best solution is the easiest solution. #LitmusLive • @swisswebmiss
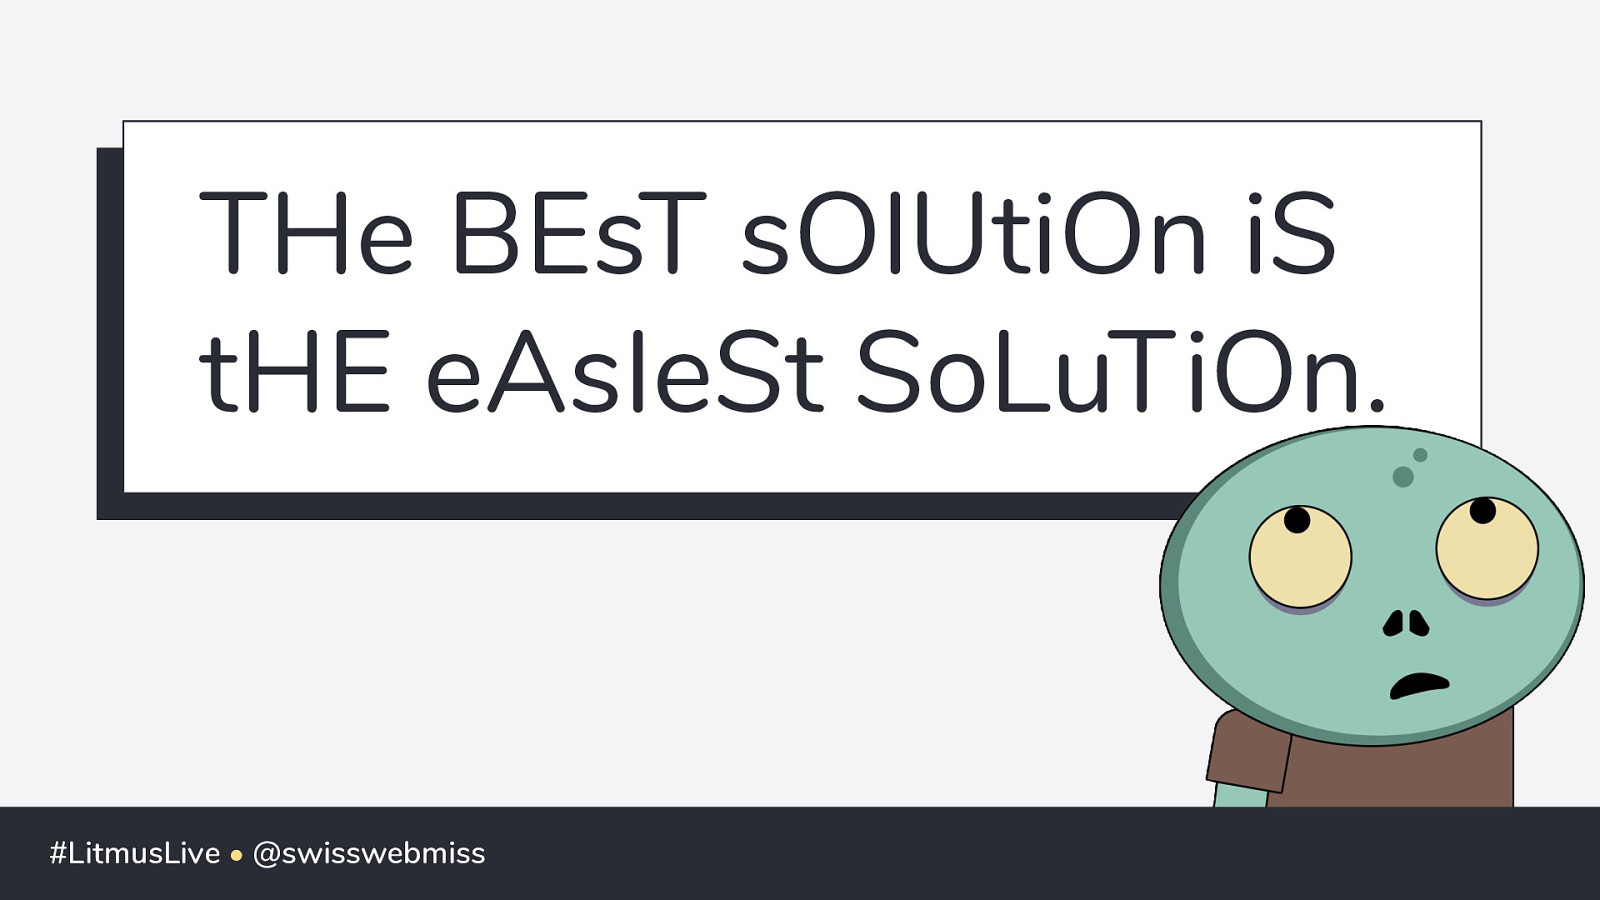
THe BEsT sOlUtiOn iS tHE eAsIeSt SoLuTiOn. #LitmusLive • @swisswebmiss
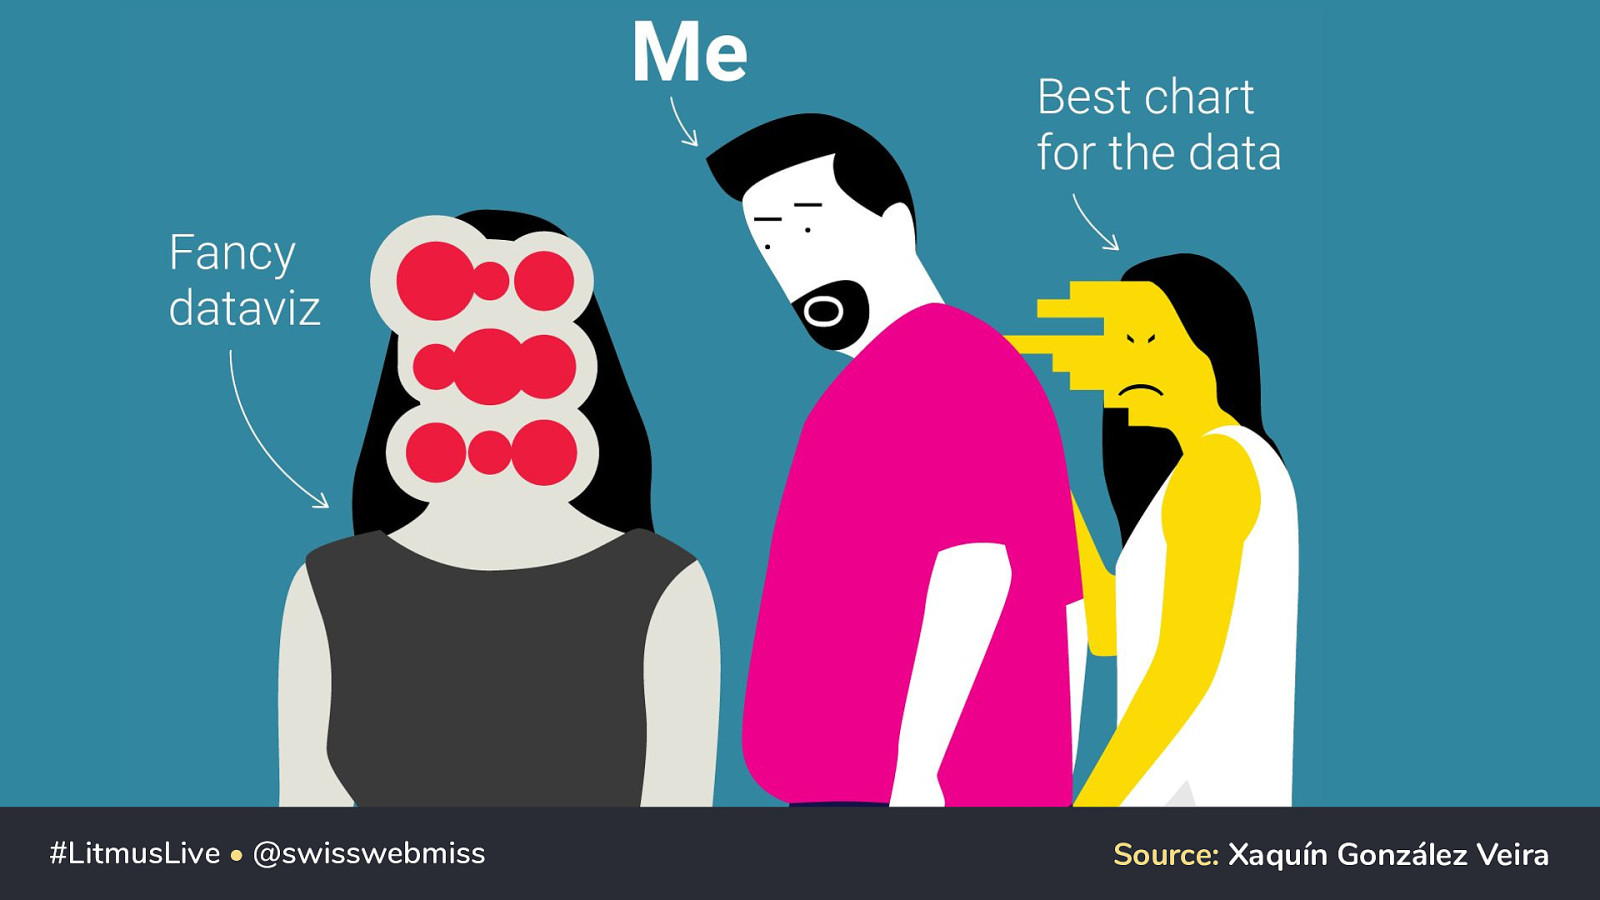
#LitmusLive • @swisswebmiss Source: Xaquín González Veira
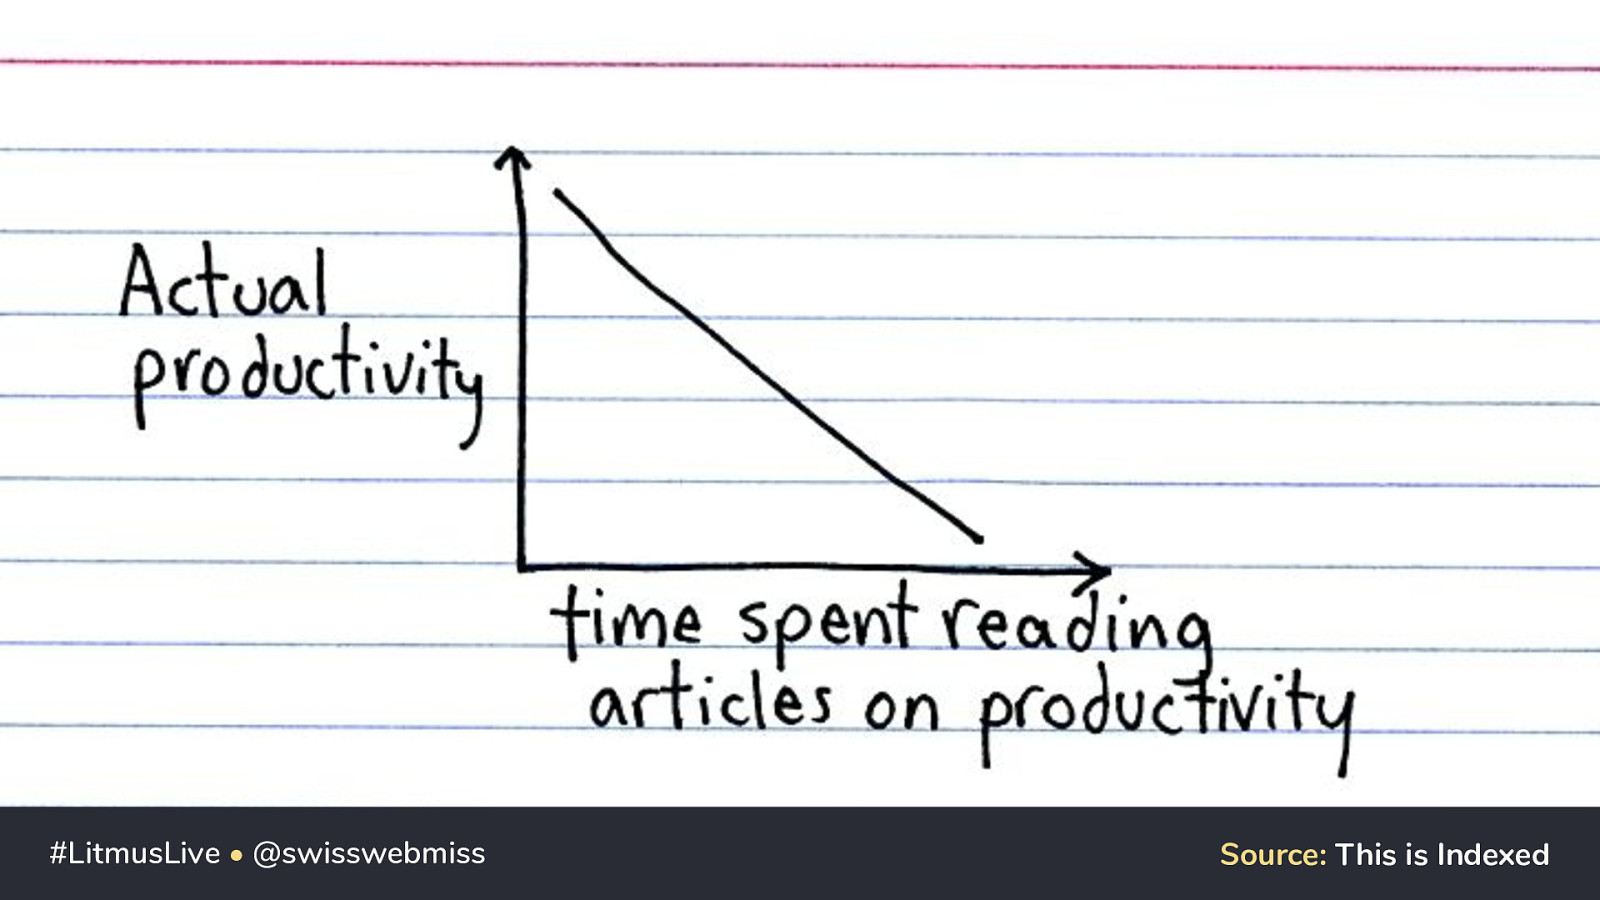
#LitmusLive • @swisswebmiss Source: This is Indexed
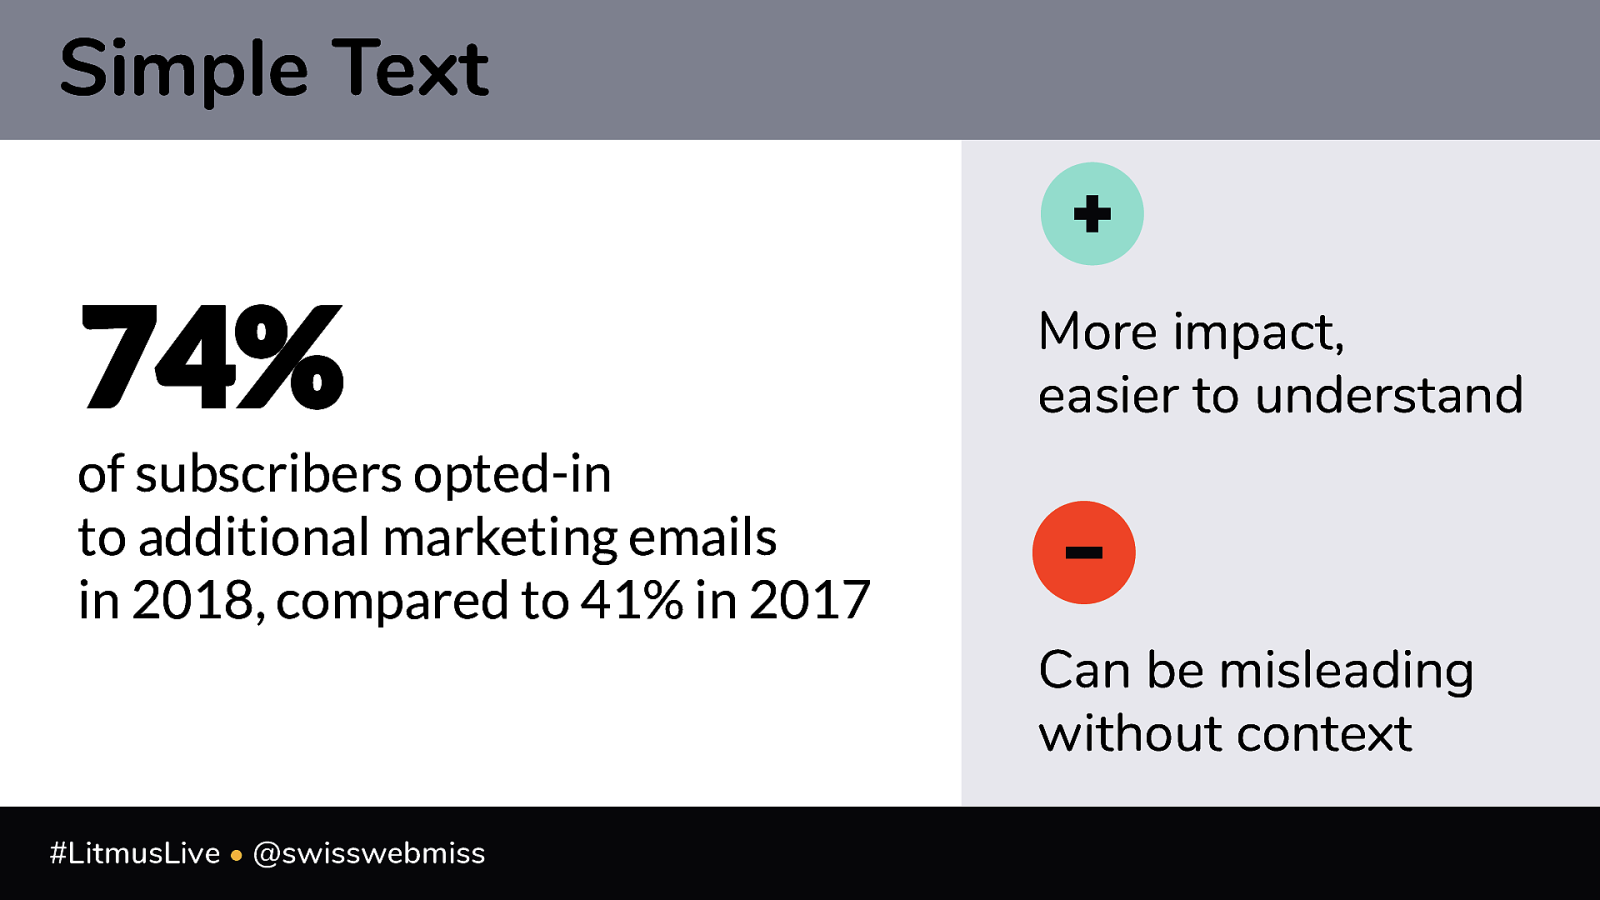
Simple Text More impact, easier to understand of subscribers opted-in to additional marketing emails in 2018, compared to 41% in 2017 Can be misleading without context #LitmusLive • @swisswebmiss
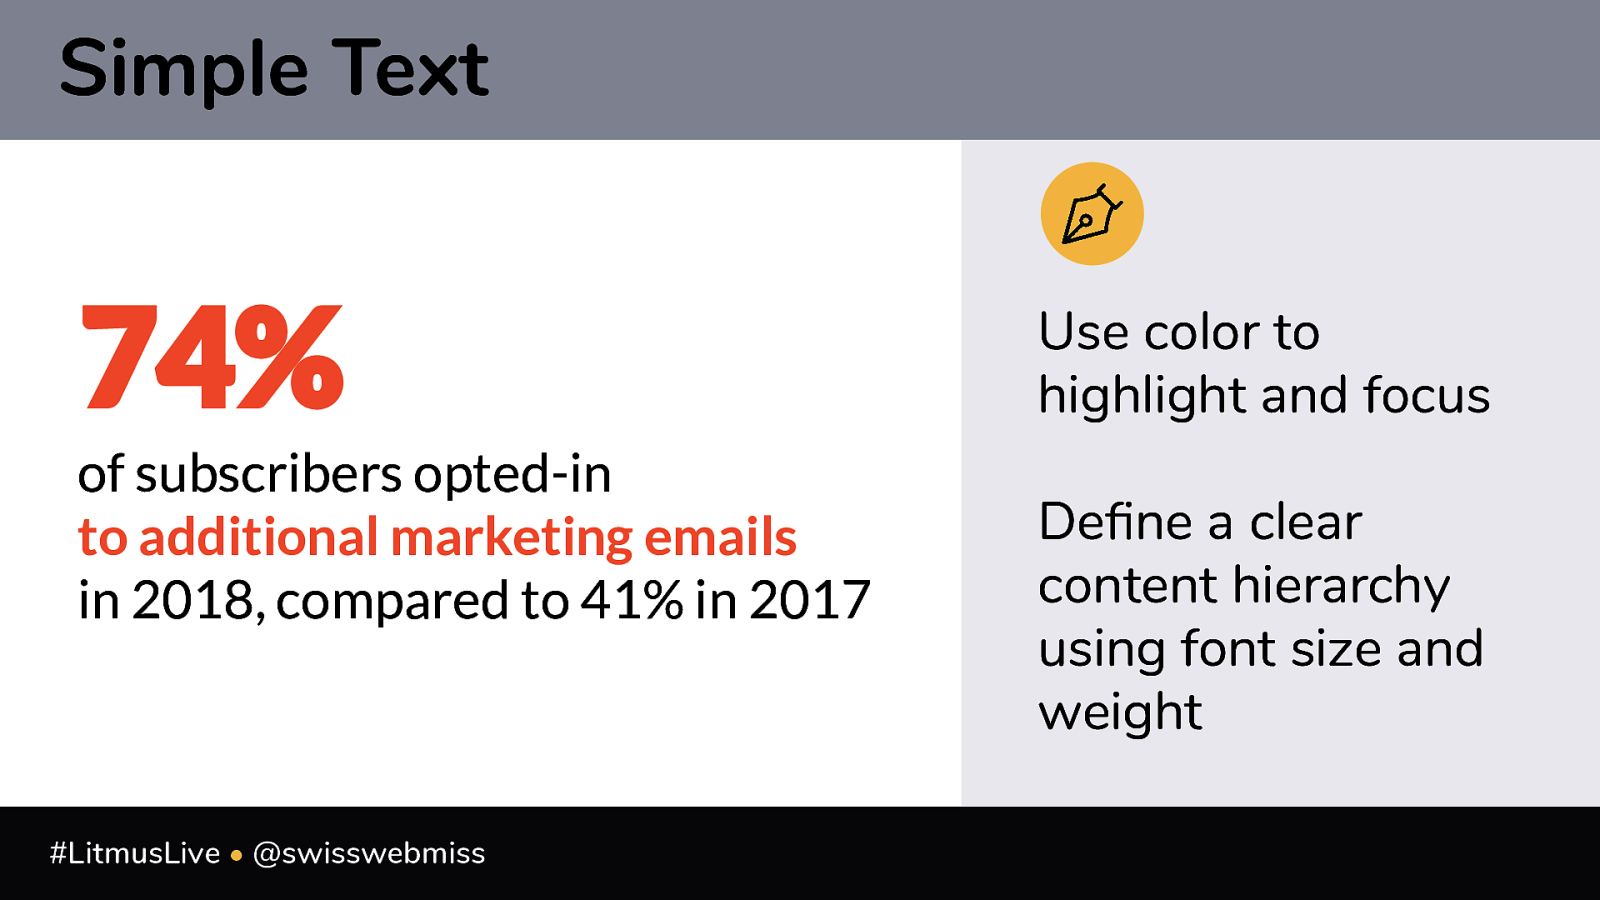
Simple Text Use color to highlight and focus of subscribers opted-in to additional marketing emails in 2018, compared to 41% in 2017 #LitmusLive • @swisswebmiss Define a clear content hierarchy using font size and weight
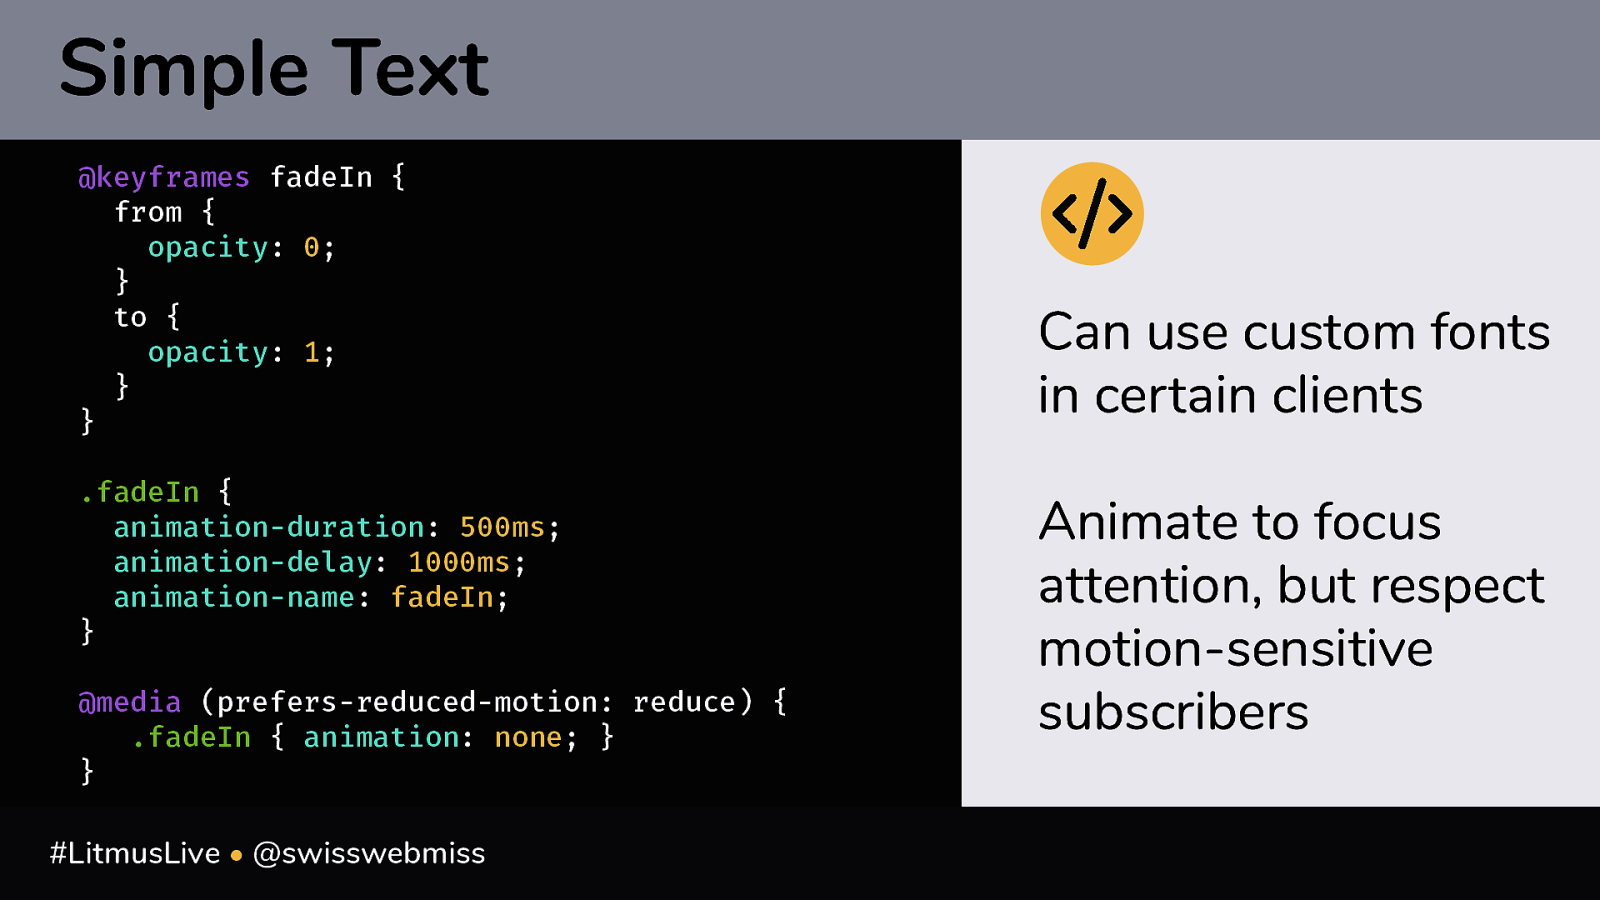
Simple Text @keyframes fadeIn { from { opacity: 0; } to { opacity: 1; } } .fadeIn { animation-duration: 500ms; animation-delay: 1000ms; animation-name: fadeIn; } @media (prefers-reduced-motion: reduce) { .fadeIn { animation: none; } } #LitmusLive • @swisswebmiss Can use custom fonts in certain clients Animate to focus attention, but respect motion-sensitive subscribers
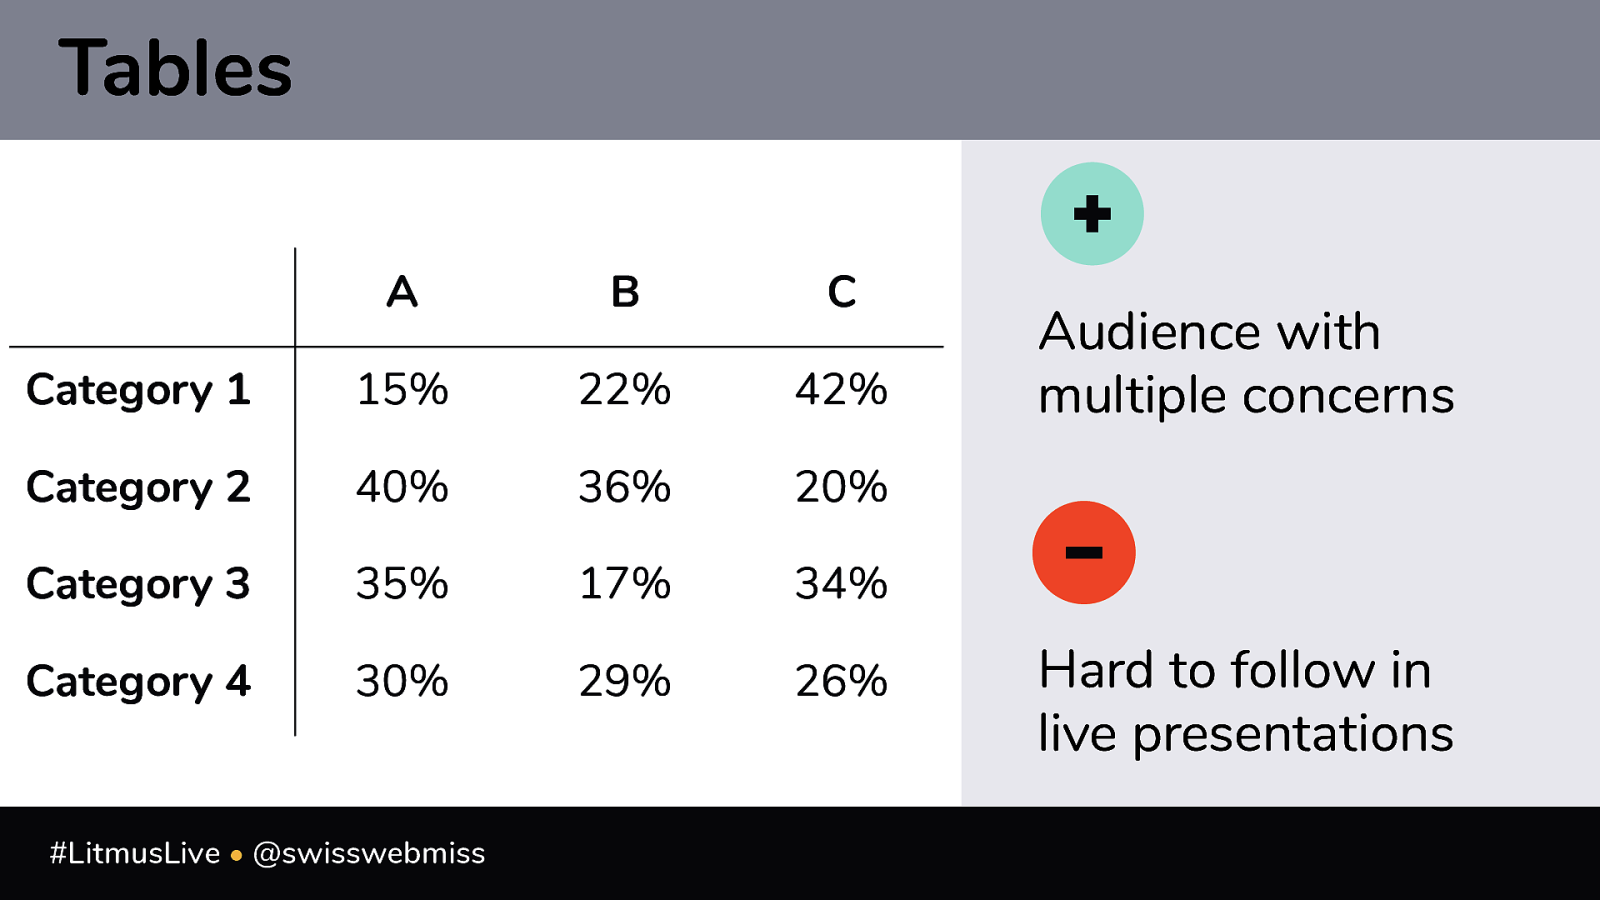
Tables A B C Category 1 15% 22% 42% Category 2 40% 36% 20% Category 3 35% 17% 34% Category 4 30% 29% 26% #LitmusLive • @swisswebmiss Audience with multiple concerns Hard to follow in live presentations
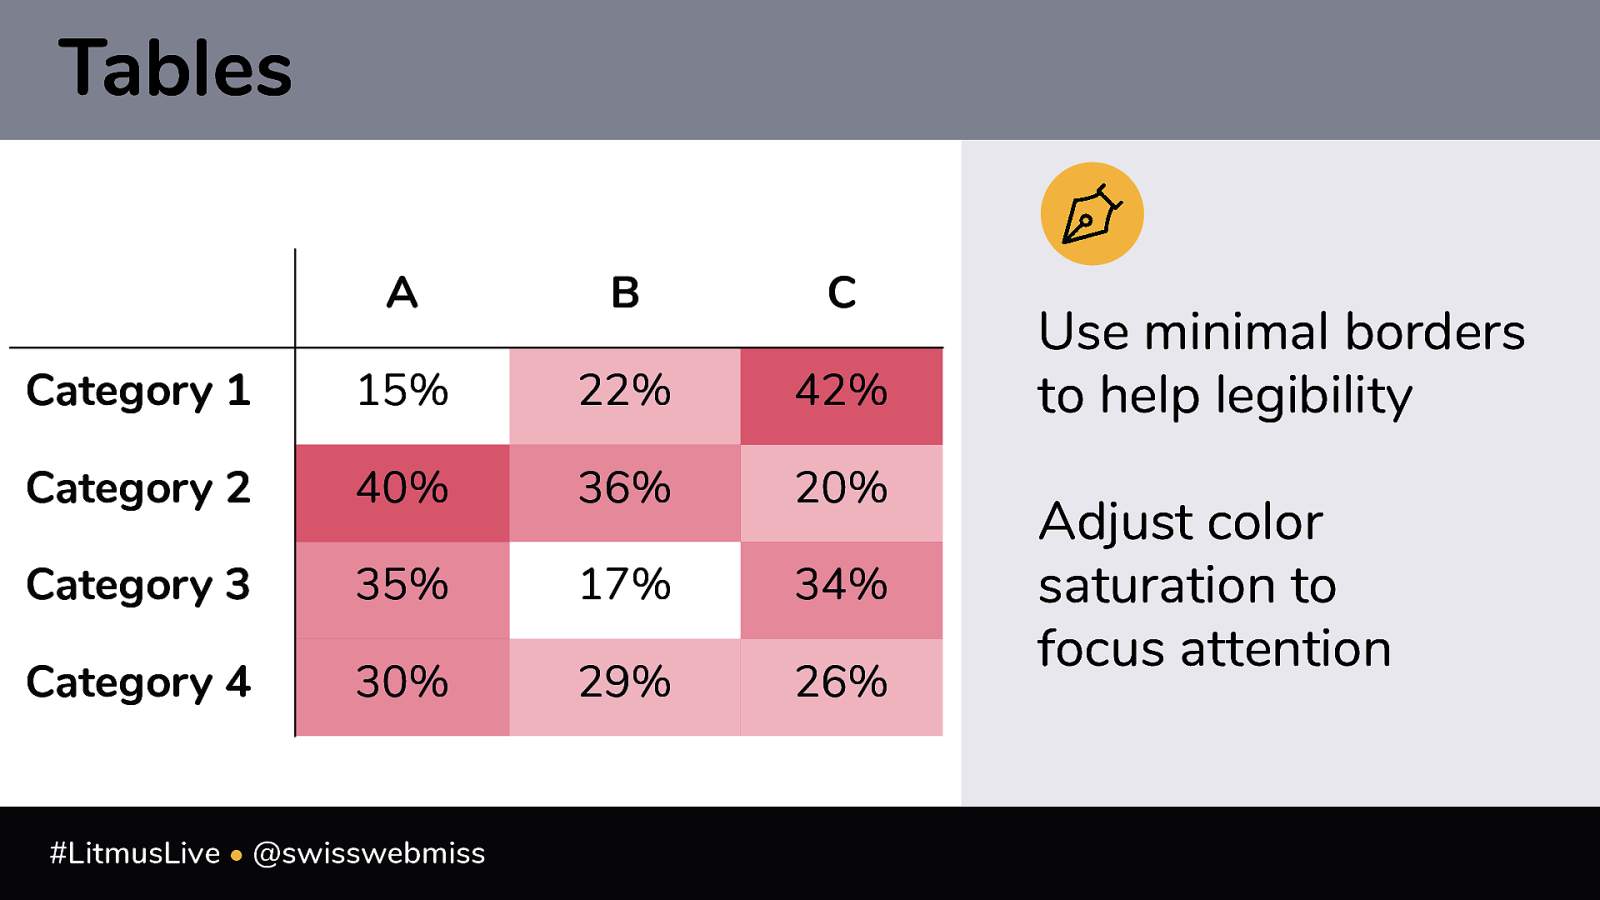
Tables A B C Category 1 15% 22% 42% Category 2 40% 36% 20% Category 3 35% 17% 34% Category 4 30% 29% 26% #LitmusLive • @swisswebmiss Use minimal borders to help legibility Adjust color saturation to focus attention
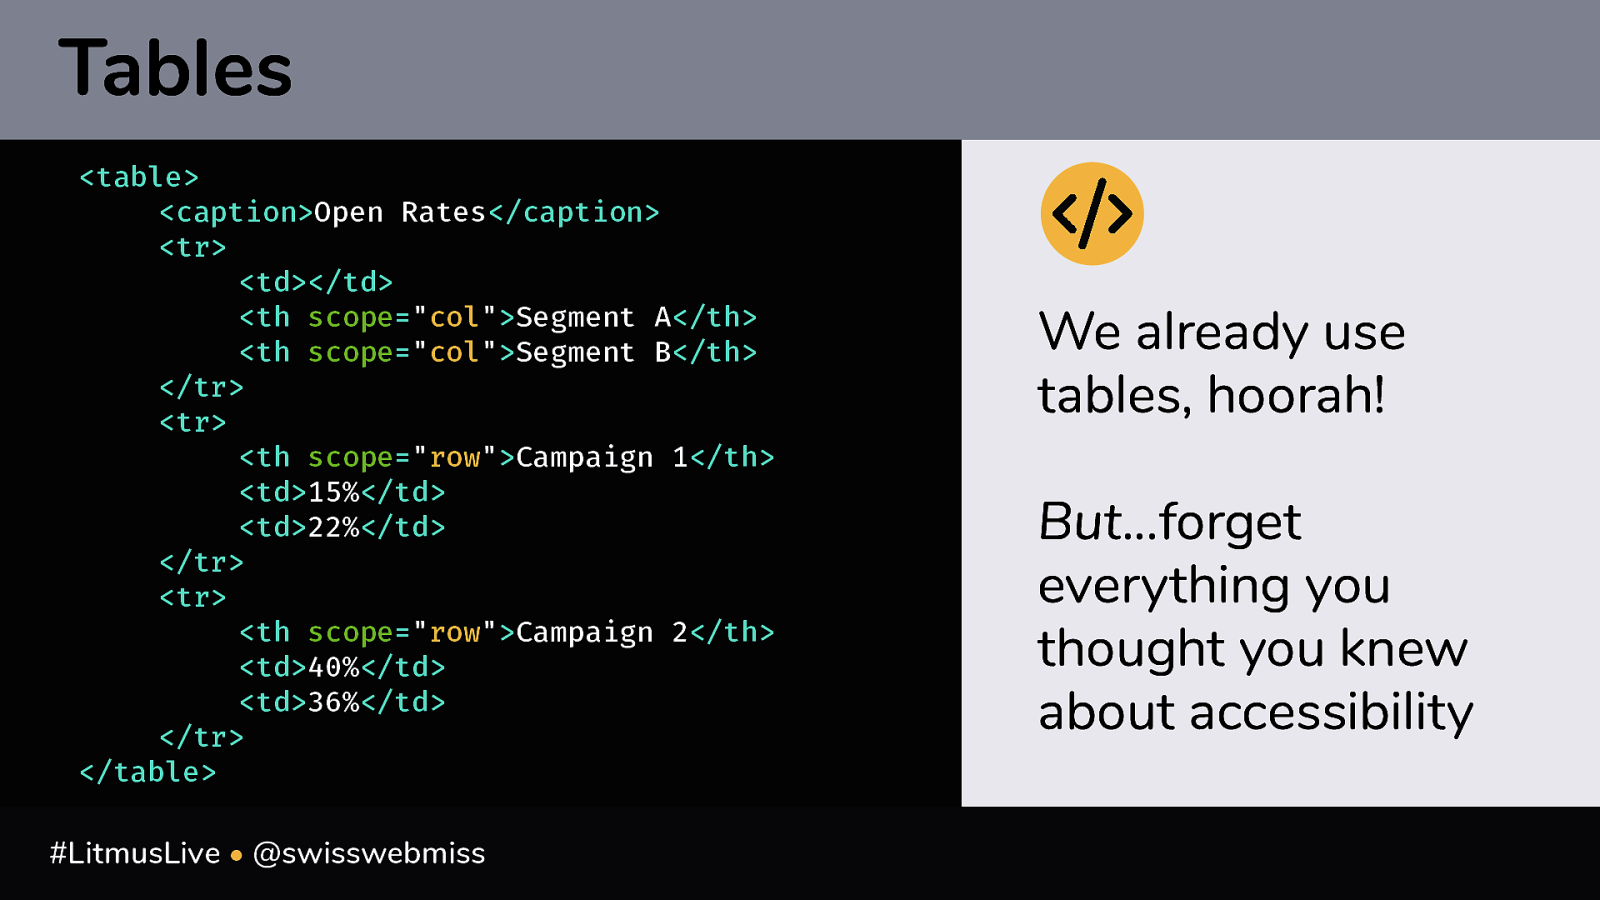
Tables <table> <caption>Open Rates</caption> <tr> <td></td> <th scope=”col”>Segment A</th> <th scope=”col”>Segment B</th> </tr> <tr> <th scope=”row”>Campaign 1</th> <td>15%</td> <td>22%</td> </tr> <tr> <th scope=”row”>Campaign 2</th> <td>40%</td> <td>36%</td> </tr> </table> #LitmusLive • @swisswebmiss We already use tables, hoorah! But…forget everything you thought you knew about accessibility
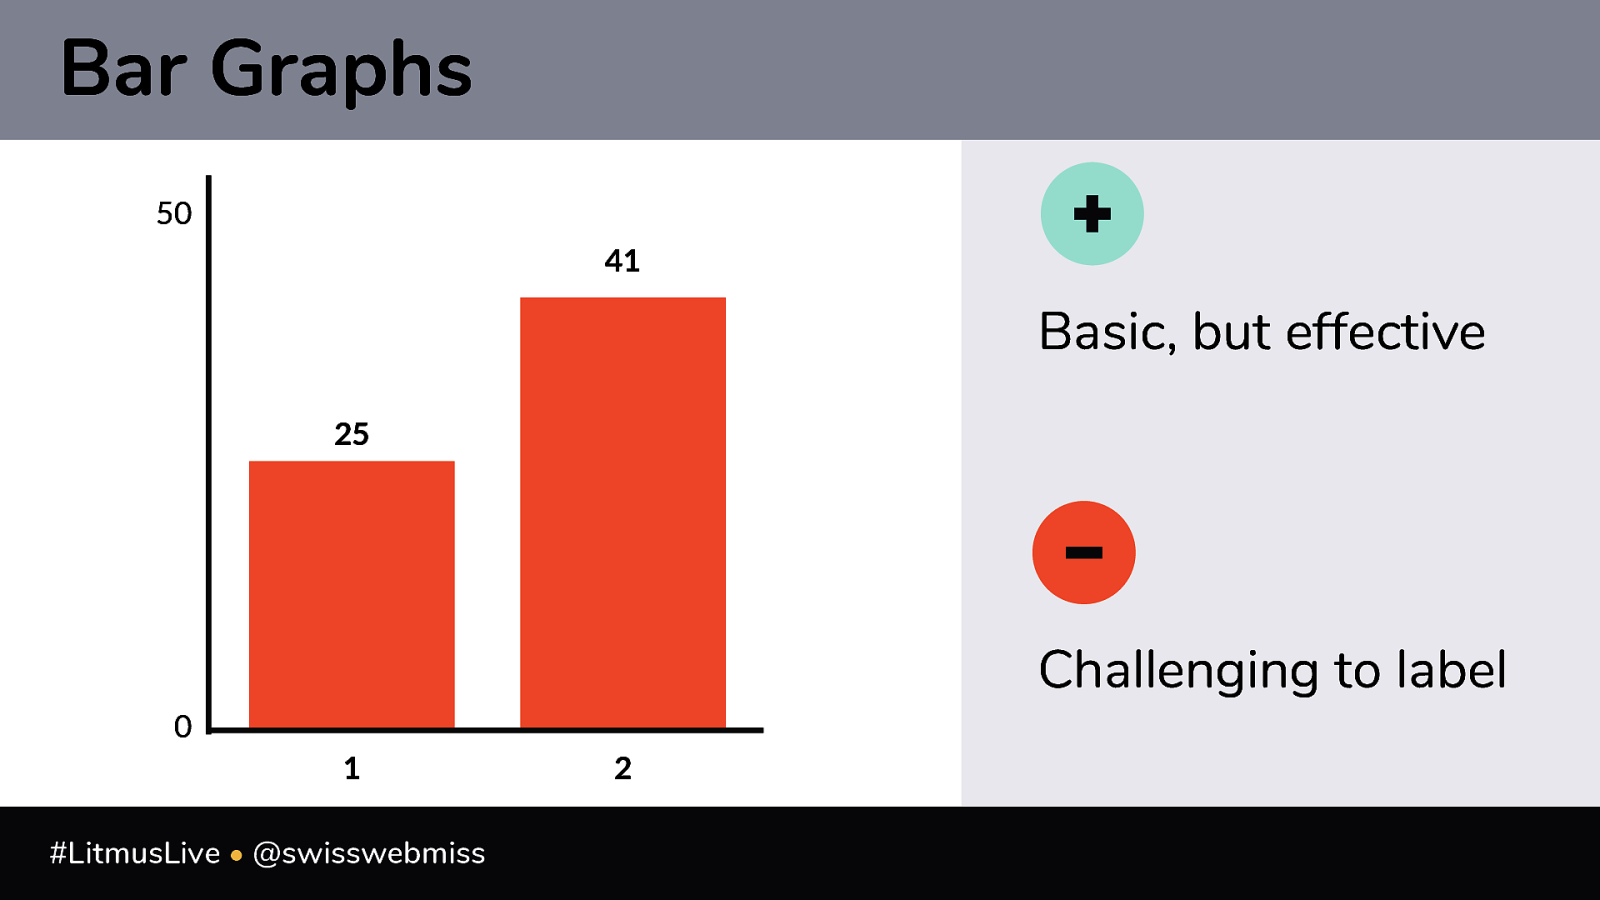
Bar Graphs 50 41 Basic, but effective 25 Challenging to label 0 1 #LitmusLive • @swisswebmiss 2
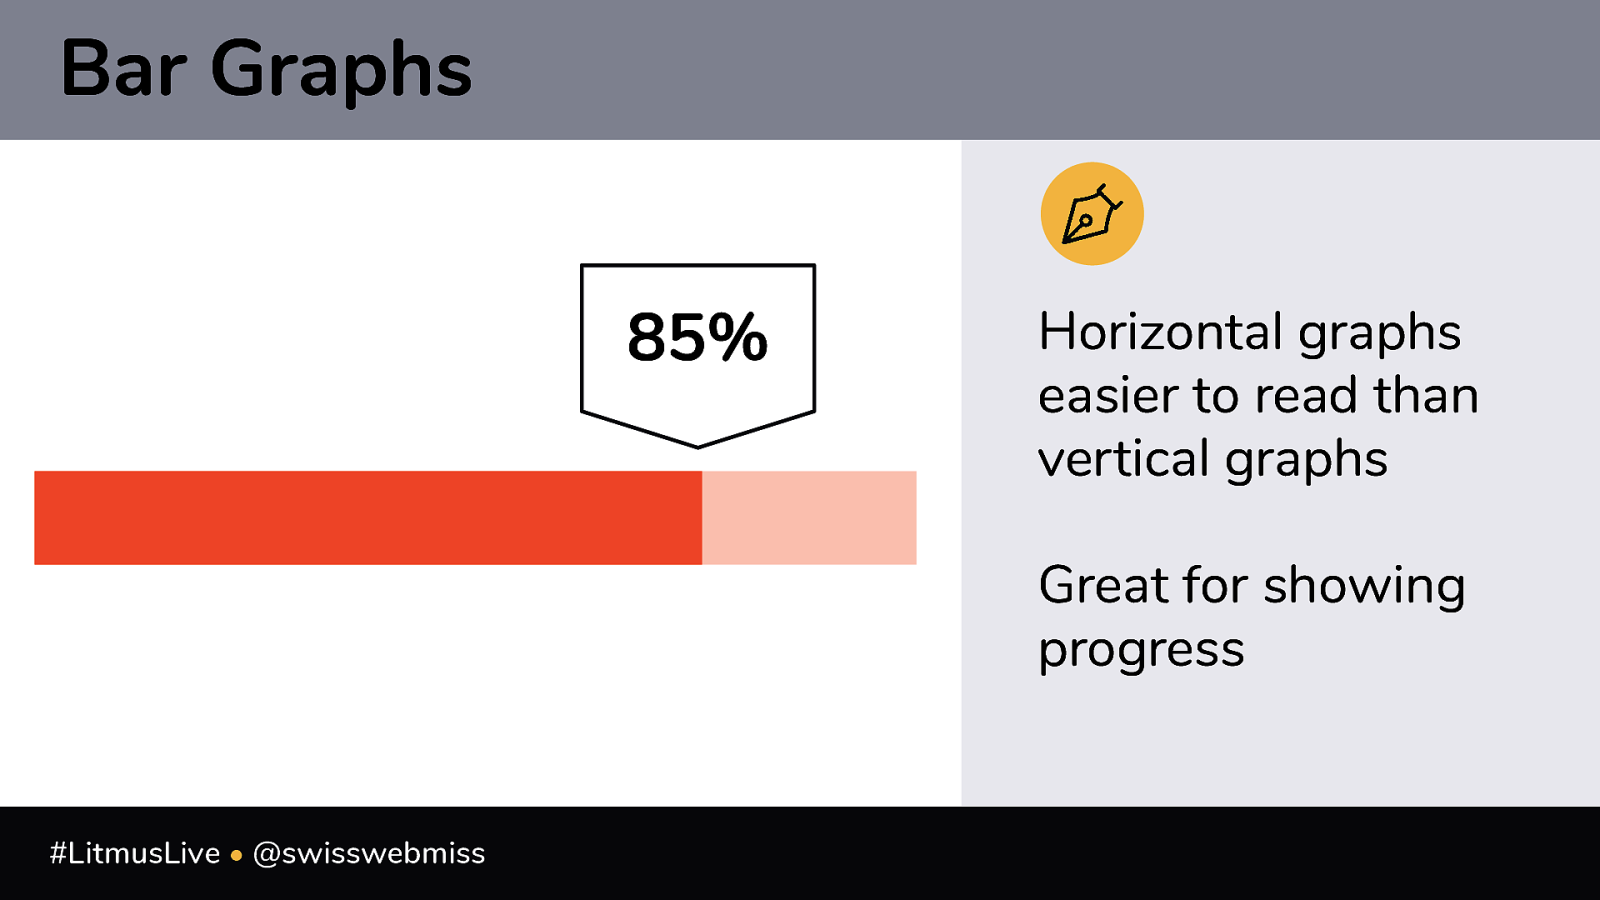
Bar Graphs 85% Horizontal graphs easier to read than vertical graphs Great for showing progress #LitmusLive • @swisswebmiss
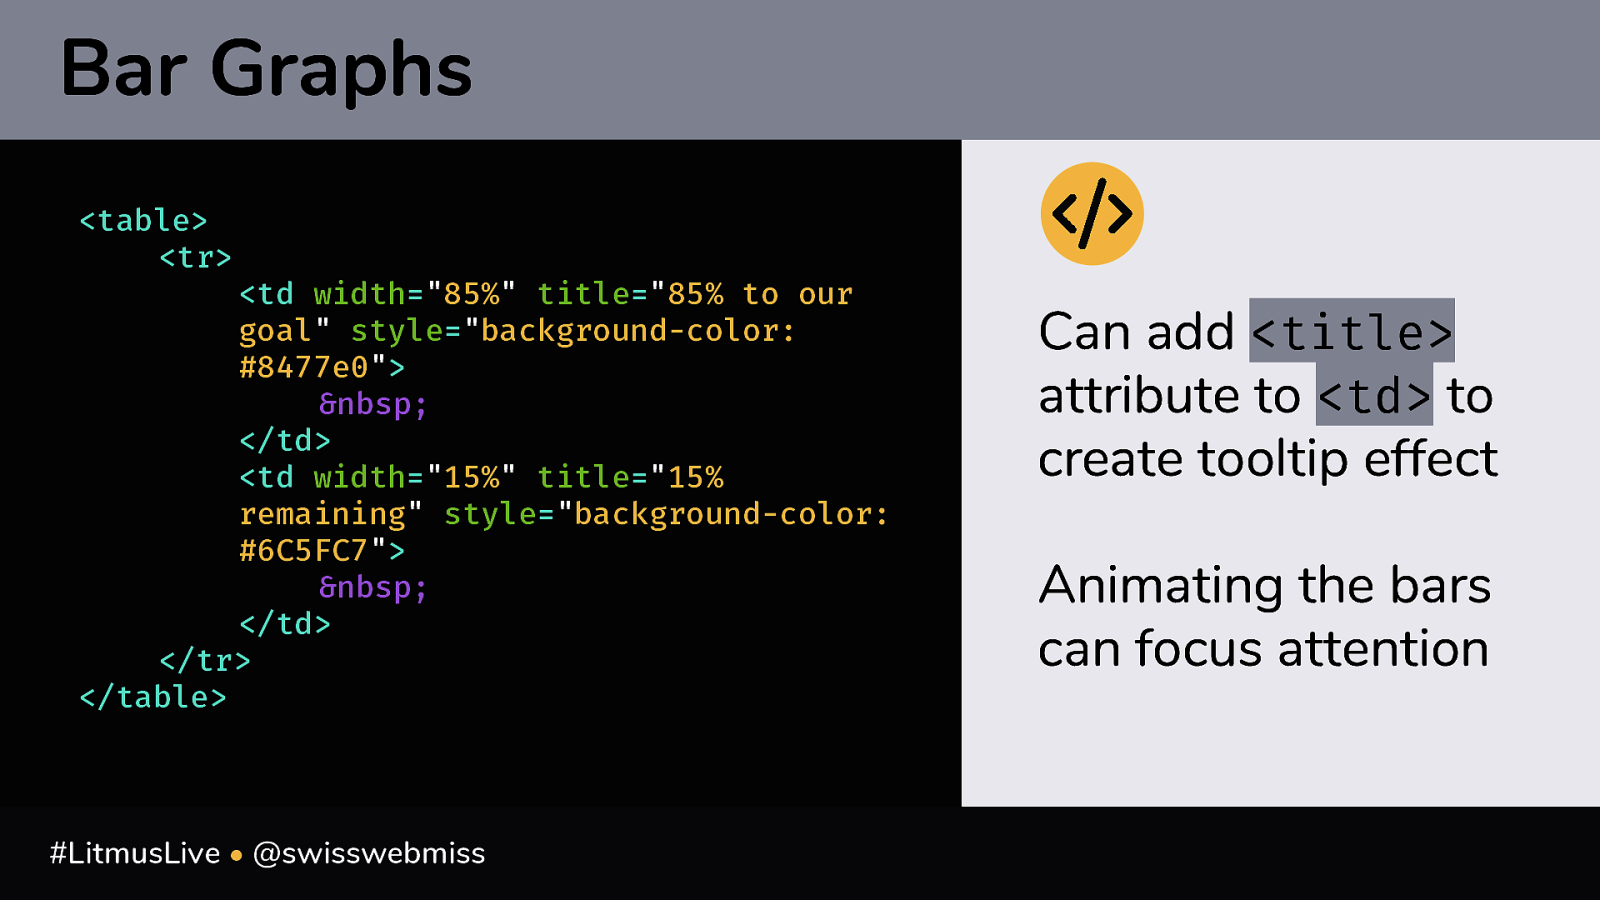
Bar Graphs <table> <tr>
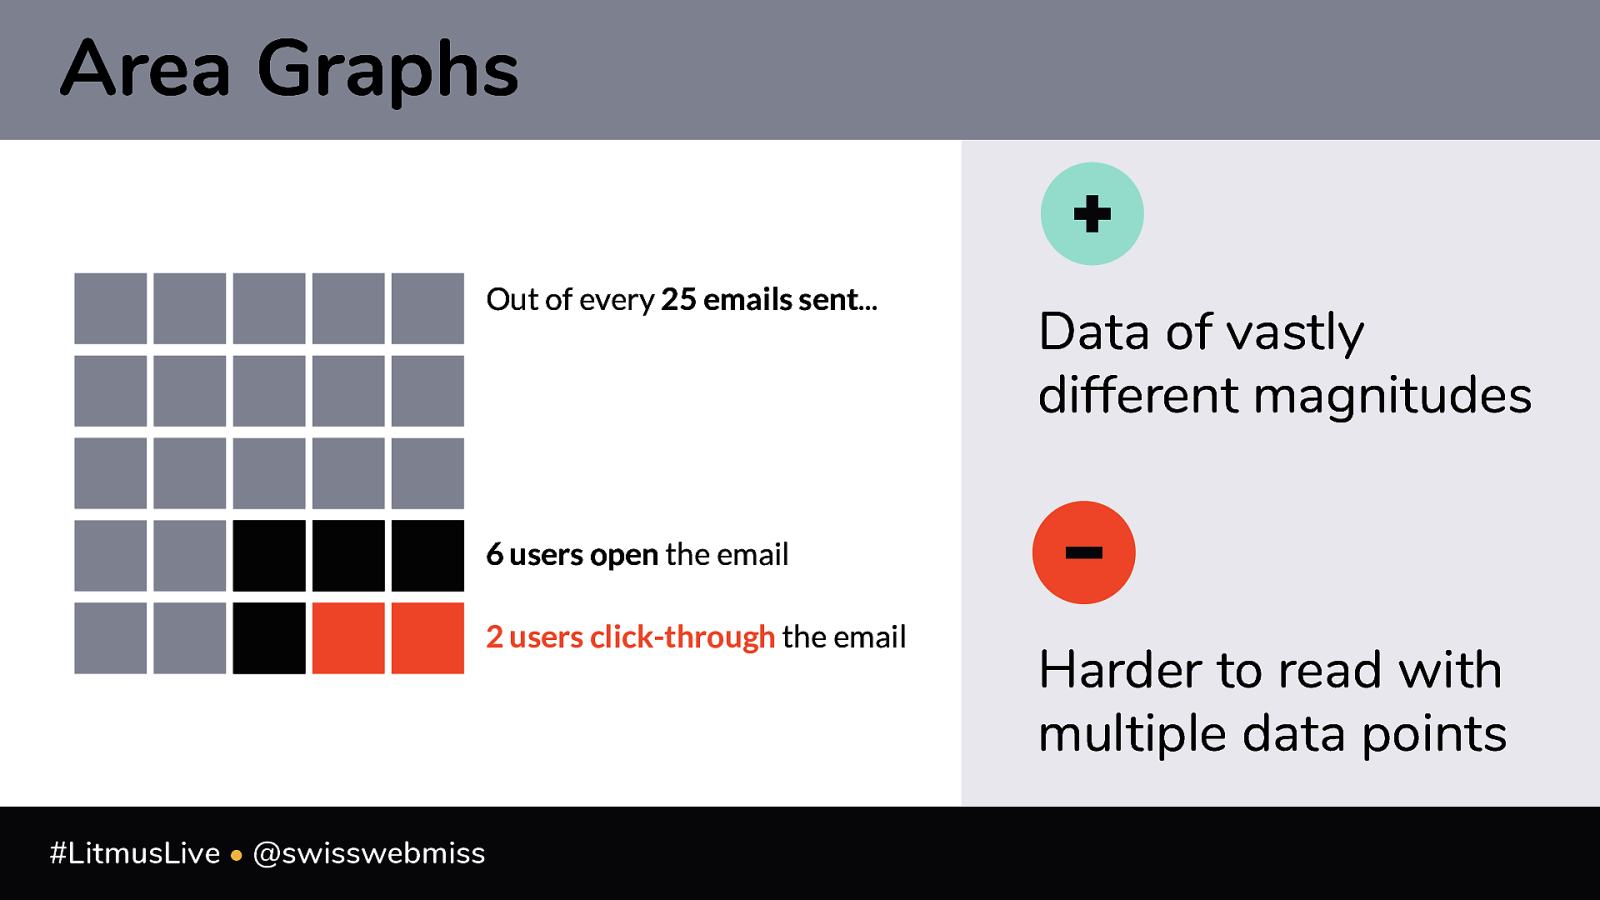
<td width=”85%” title=”85% to our goal” style=”background-color: #8477e0”> </td> <td width=”15%” title=”15% remaining” style=”background-color: #6C5FC7”> </td> </tr> </table> #LitmusLive • @swisswebmiss Can add <title> attribute to <td> to create tooltip effect Animating the bars can focus attentionArea Graphs Out of every 25 emails sent… Data of vastly different magnitudes 6 users open the email 2 users click-through the email #LitmusLive • @swisswebmiss Harder to read with multiple data points
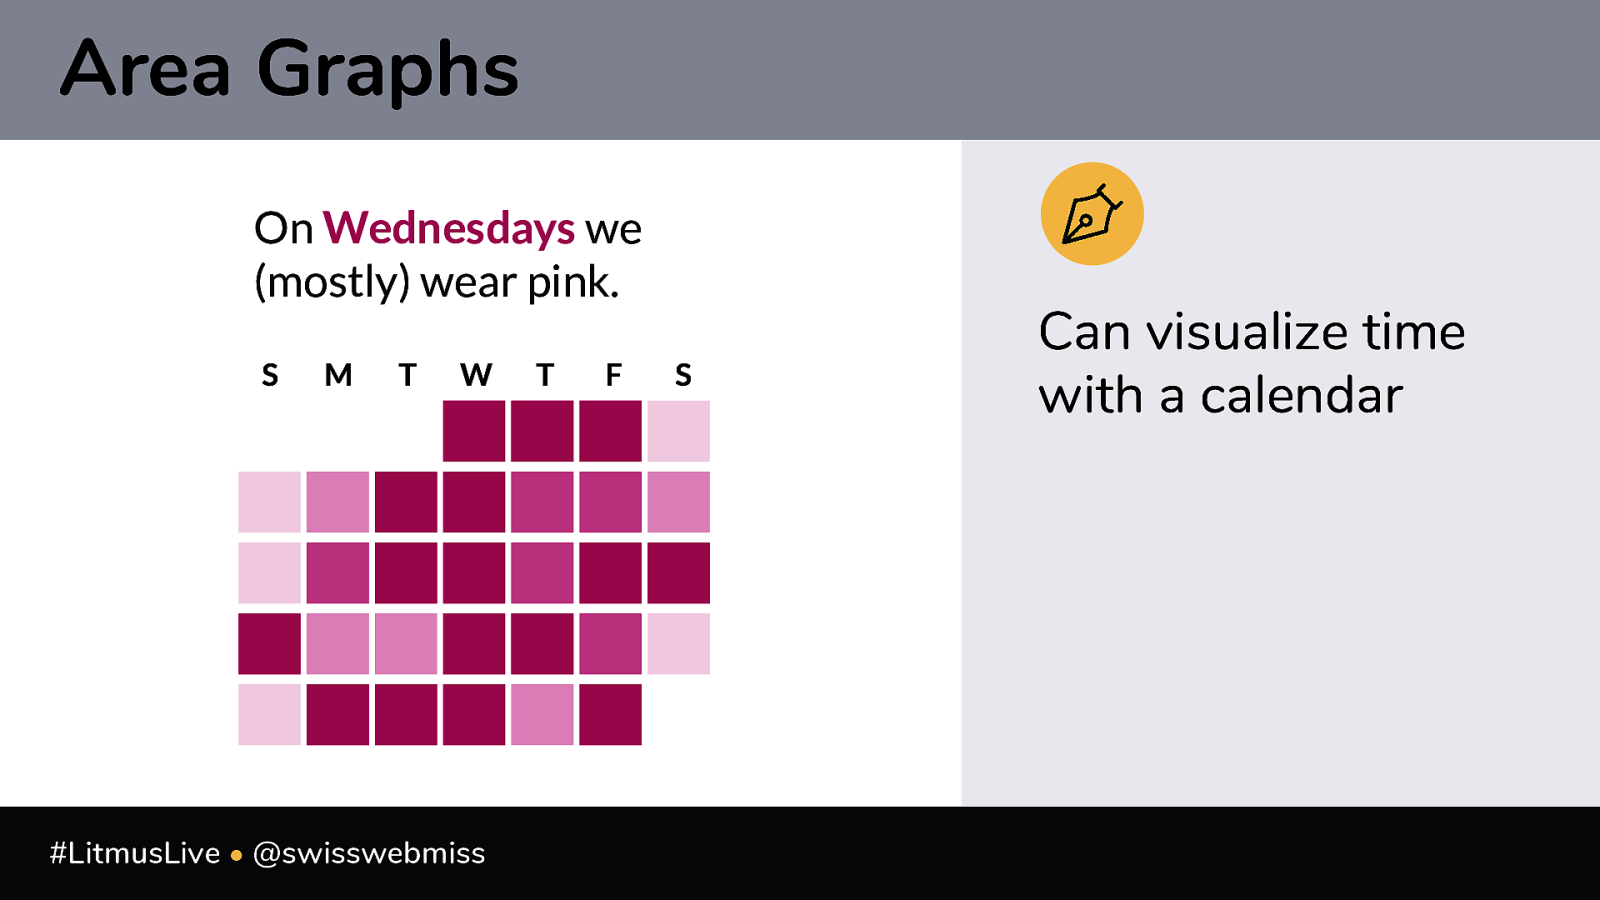
Area Graphs On Wednesdays we (mostly) wear pink. S M T W #LitmusLive • @swisswebmiss T F S Can visualize time with a calendar
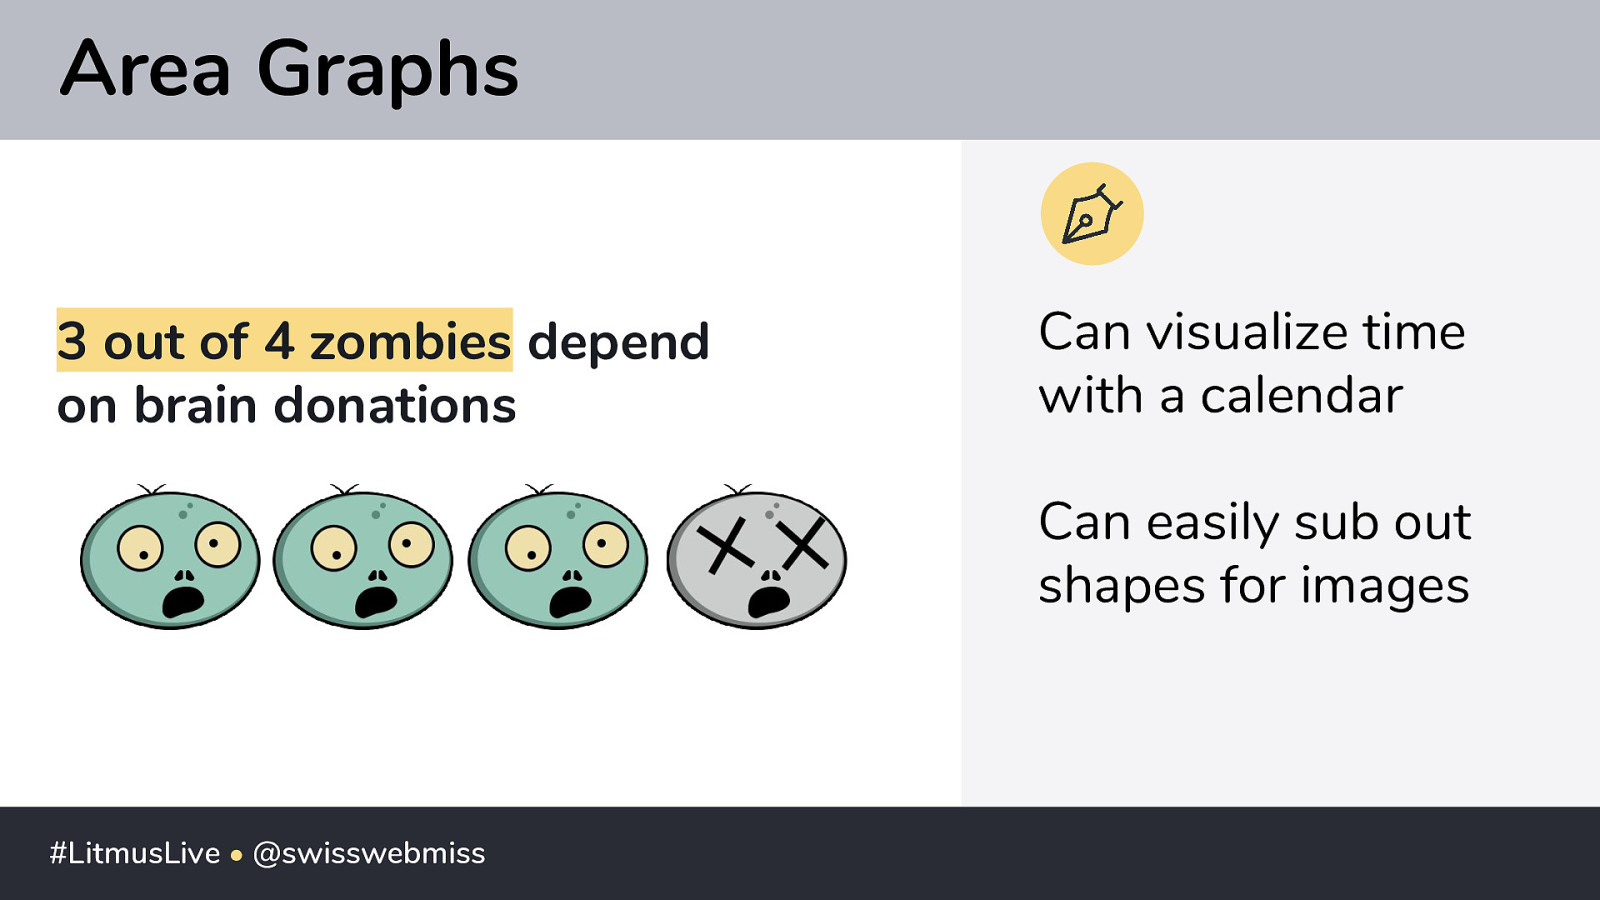
Area Graphs 3 out of 4 zombies depend on brain donations Can visualize time with a calendar Can easily sub out shapes for images #LitmusLive • @swisswebmiss
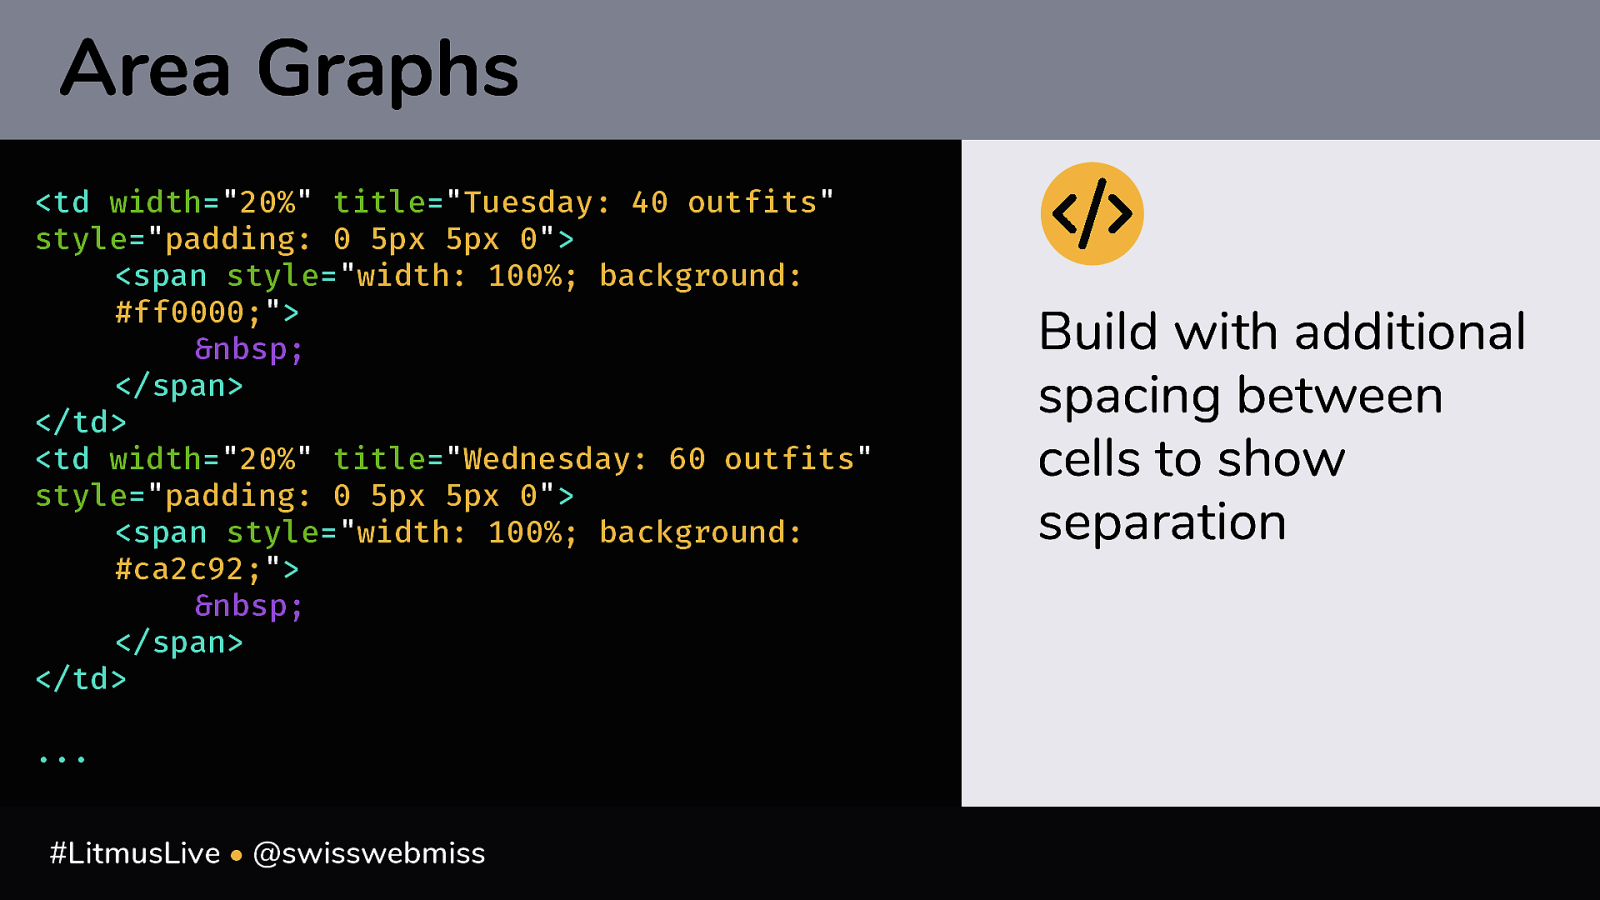
Area Graphs <td width=”20%” title=”Tuesday: 40 outfits” style=”padding: 0 5px 5px 0”> <span style=”width: 100%; background: #ff0000;”> </span> </td> <td width=”20%” title=”Wednesday: 60 outfits” style=”padding: 0 5px 5px 0”> <span style=”width: 100%; background: #ca2c92;”> </span> </td> … #LitmusLive • @swisswebmiss Build with additional spacing between cells to show separation
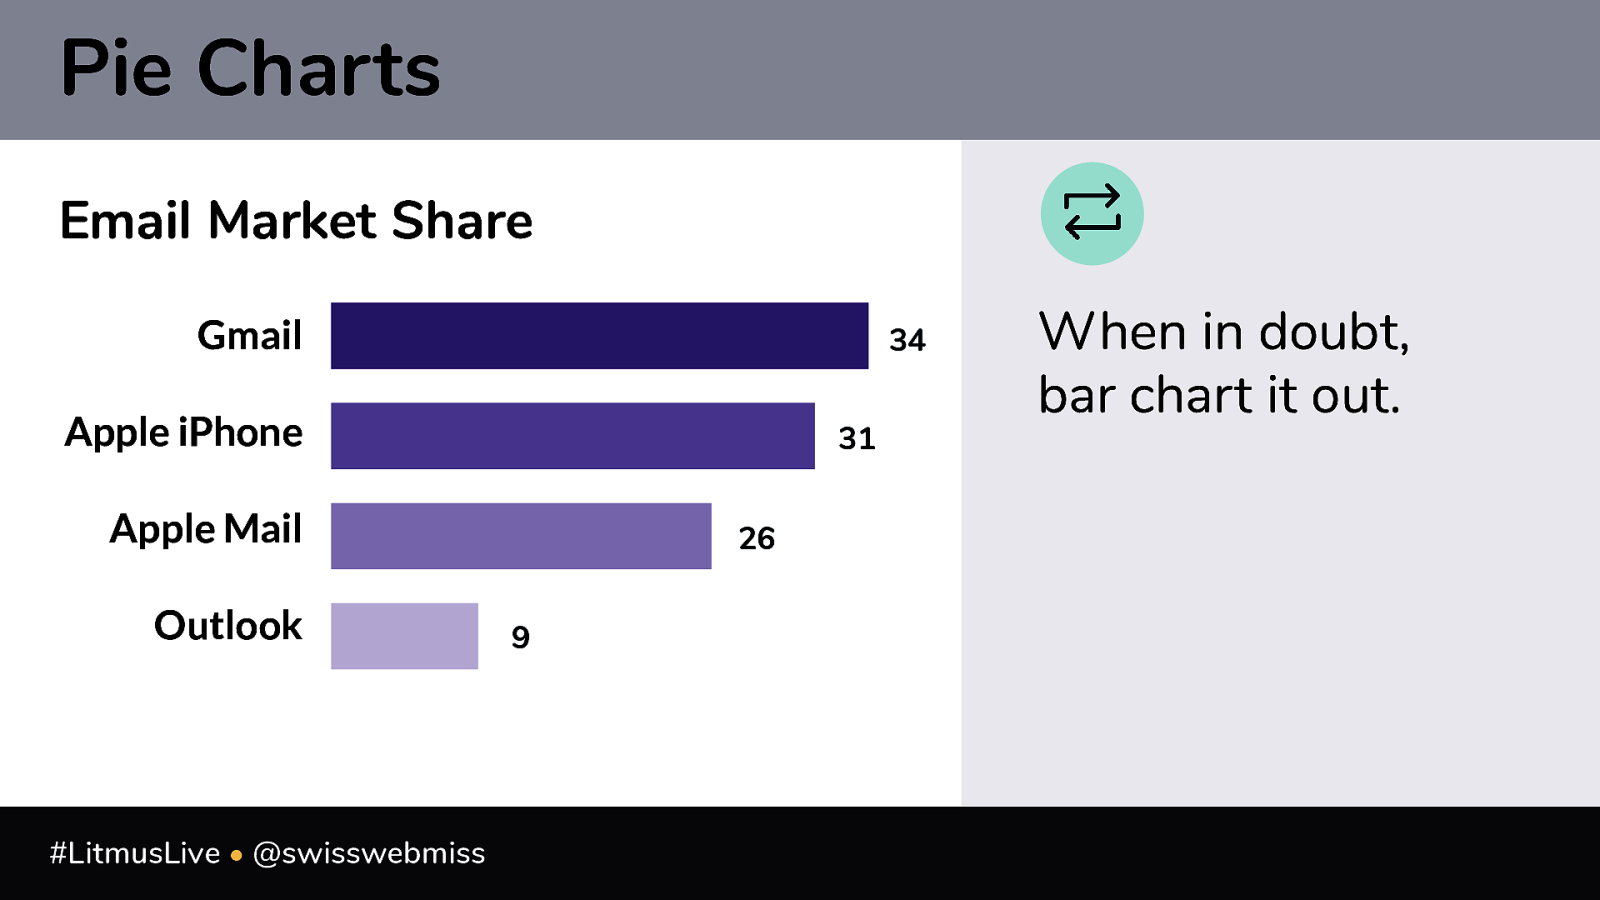
Pies are delicious, but pie charts are garbage. #LitmusLive • @swisswebmiss
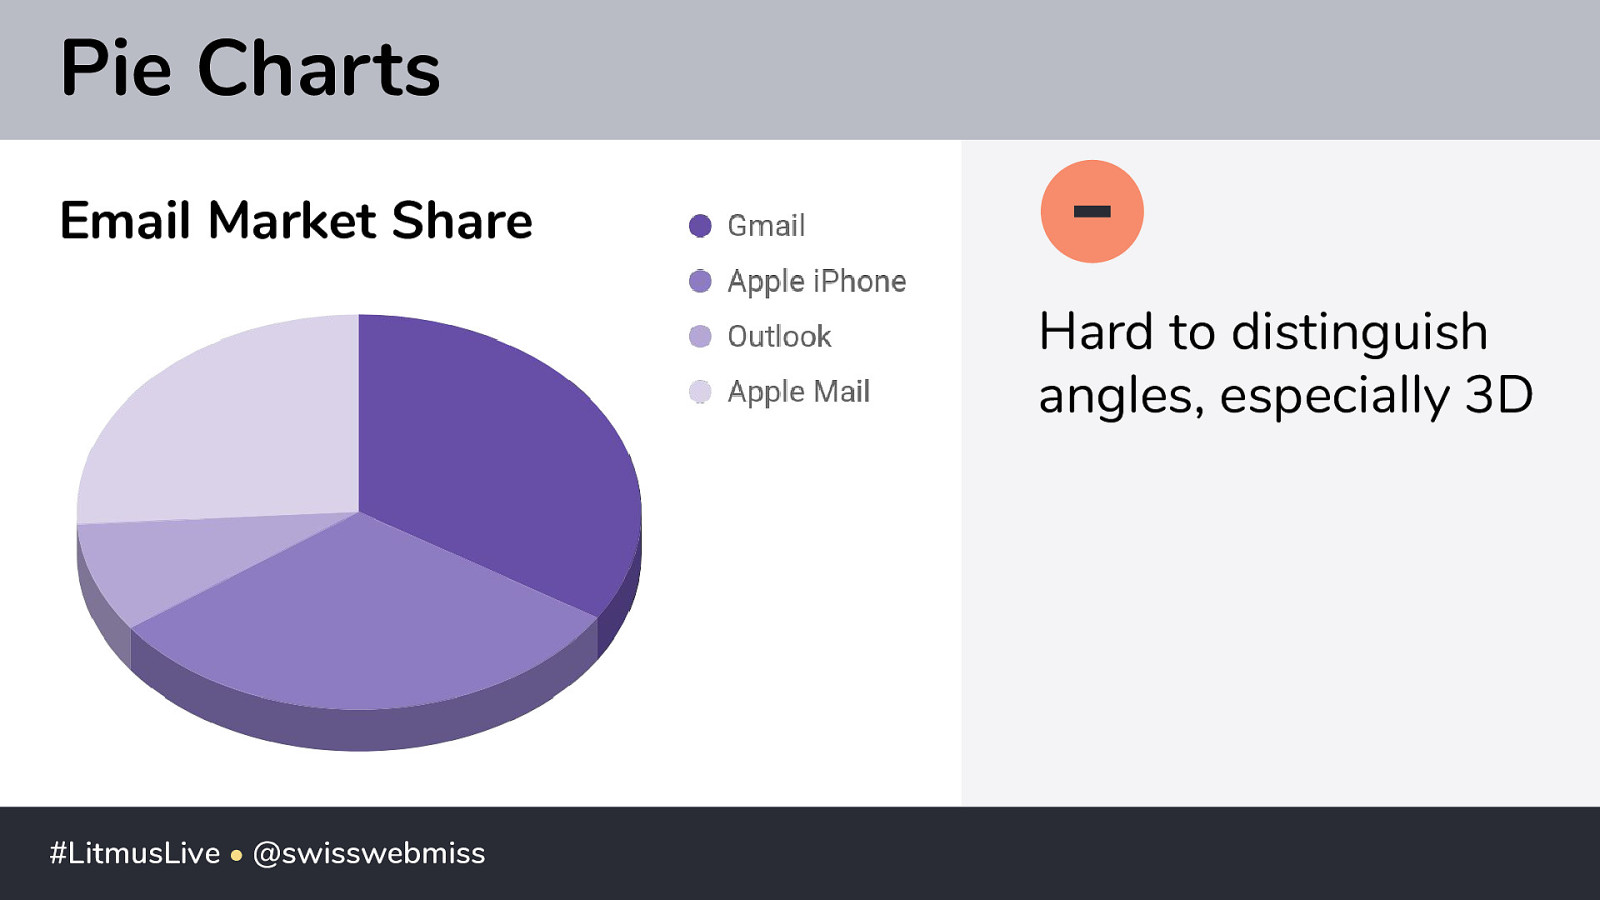
Pie Charts Email Market Share Hard to distinguish angles, especially 3D #LitmusLive • @swisswebmiss
Pie Charts Email Market Share Hard to distinguish angles, especially 3D #LitmusLive • @swisswebmiss
Pie Charts Email Market Share Gmail 34 Apple iPhone 31 Apple Mail Outlook #LitmusLive • @swisswebmiss 26 9 When in doubt, bar chart it out.
REFINEMENT Building accessible data visualization #LitmusLive • @swisswebmiss
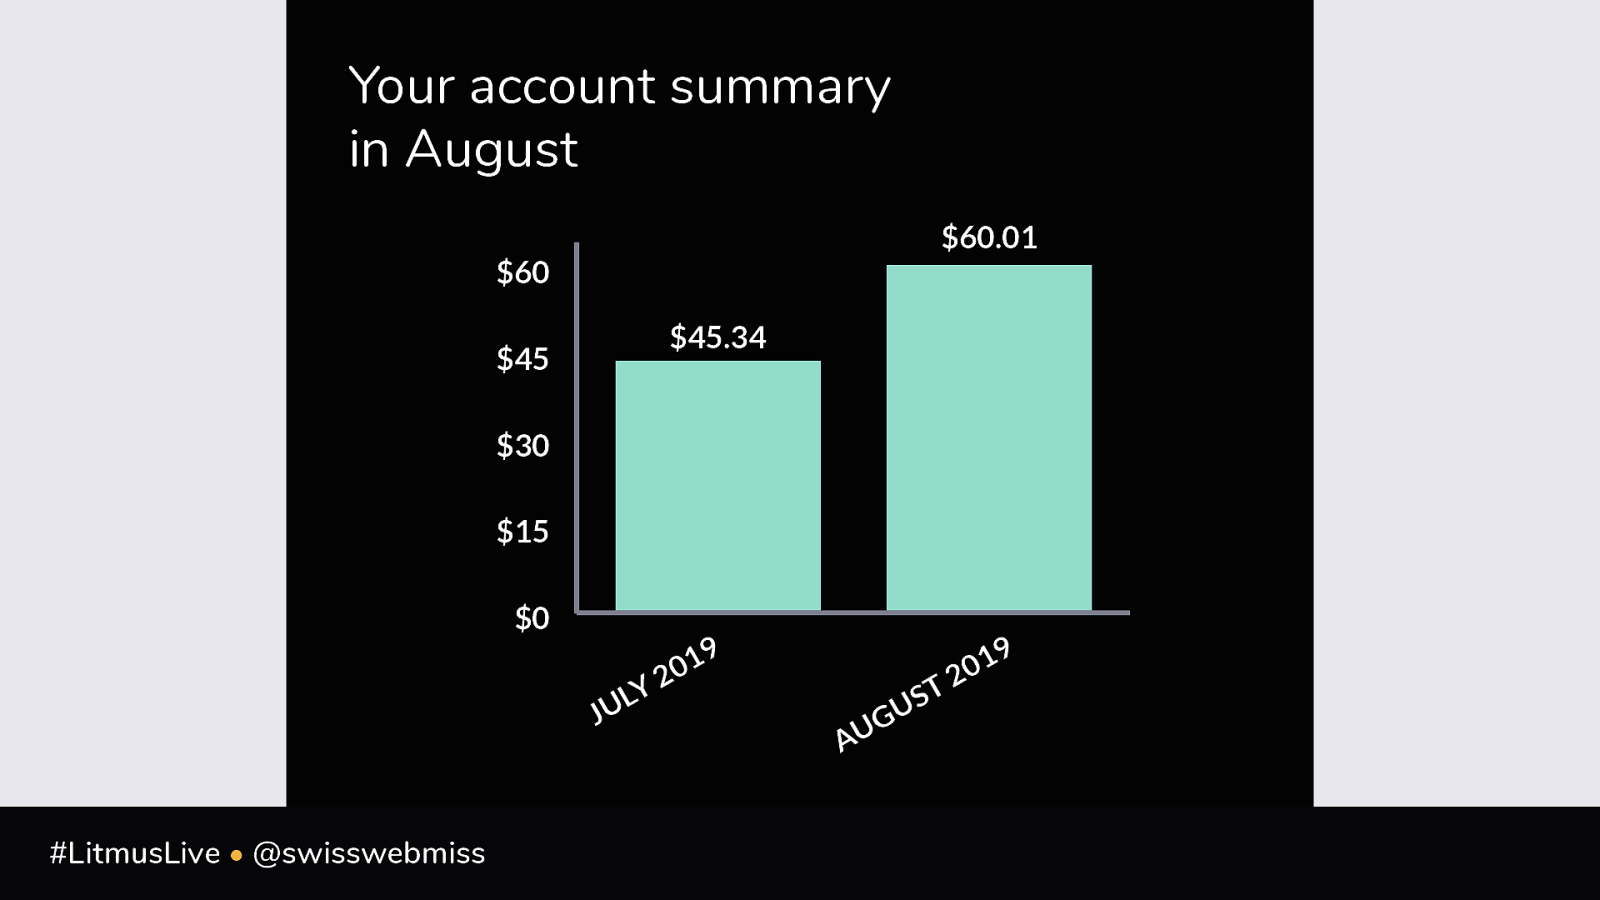
1 Account Dashboard #LitmusLive • @swisswebmiss
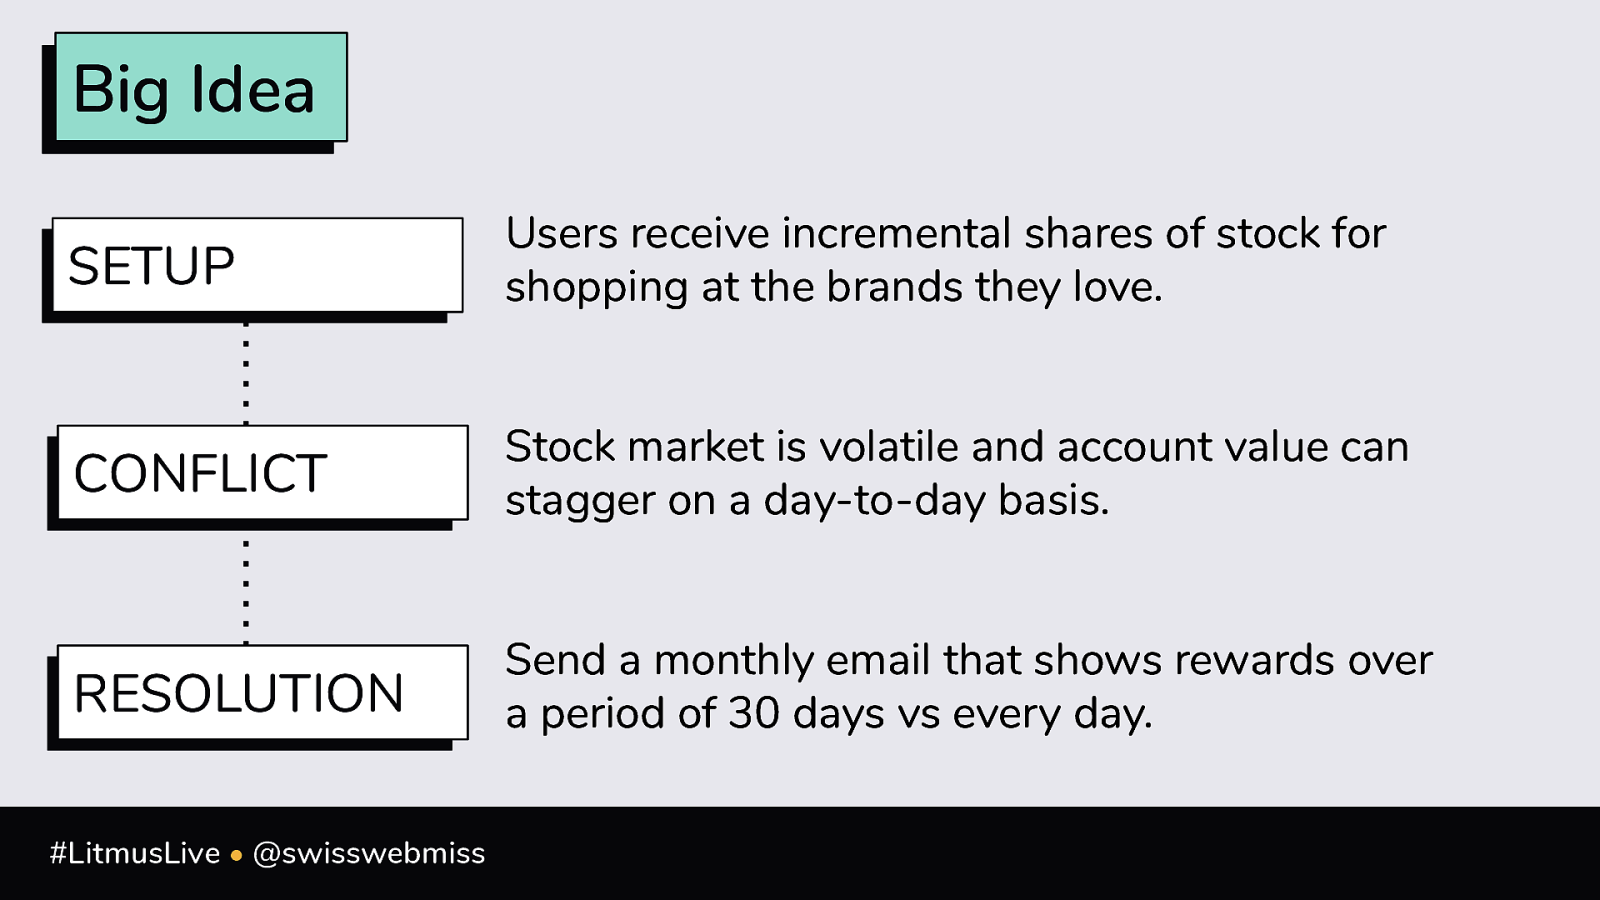
Big Idea SETUP Users receive incremental shares of stock for shopping at the brands they love. CONFLICT Stock market is volatile and account value can stagger on a day-to-day basis. RESOLUTION Send a monthly email that shows rewards over a period of 30 days vs every day. #LitmusLive • @swisswebmiss
Your account summary in August $60.01 $60 $45.34 $45 $30 $15 $0 0 Y2 L U J #LitmusLive • @swisswebmiss 19 19 US G AU 0 T2
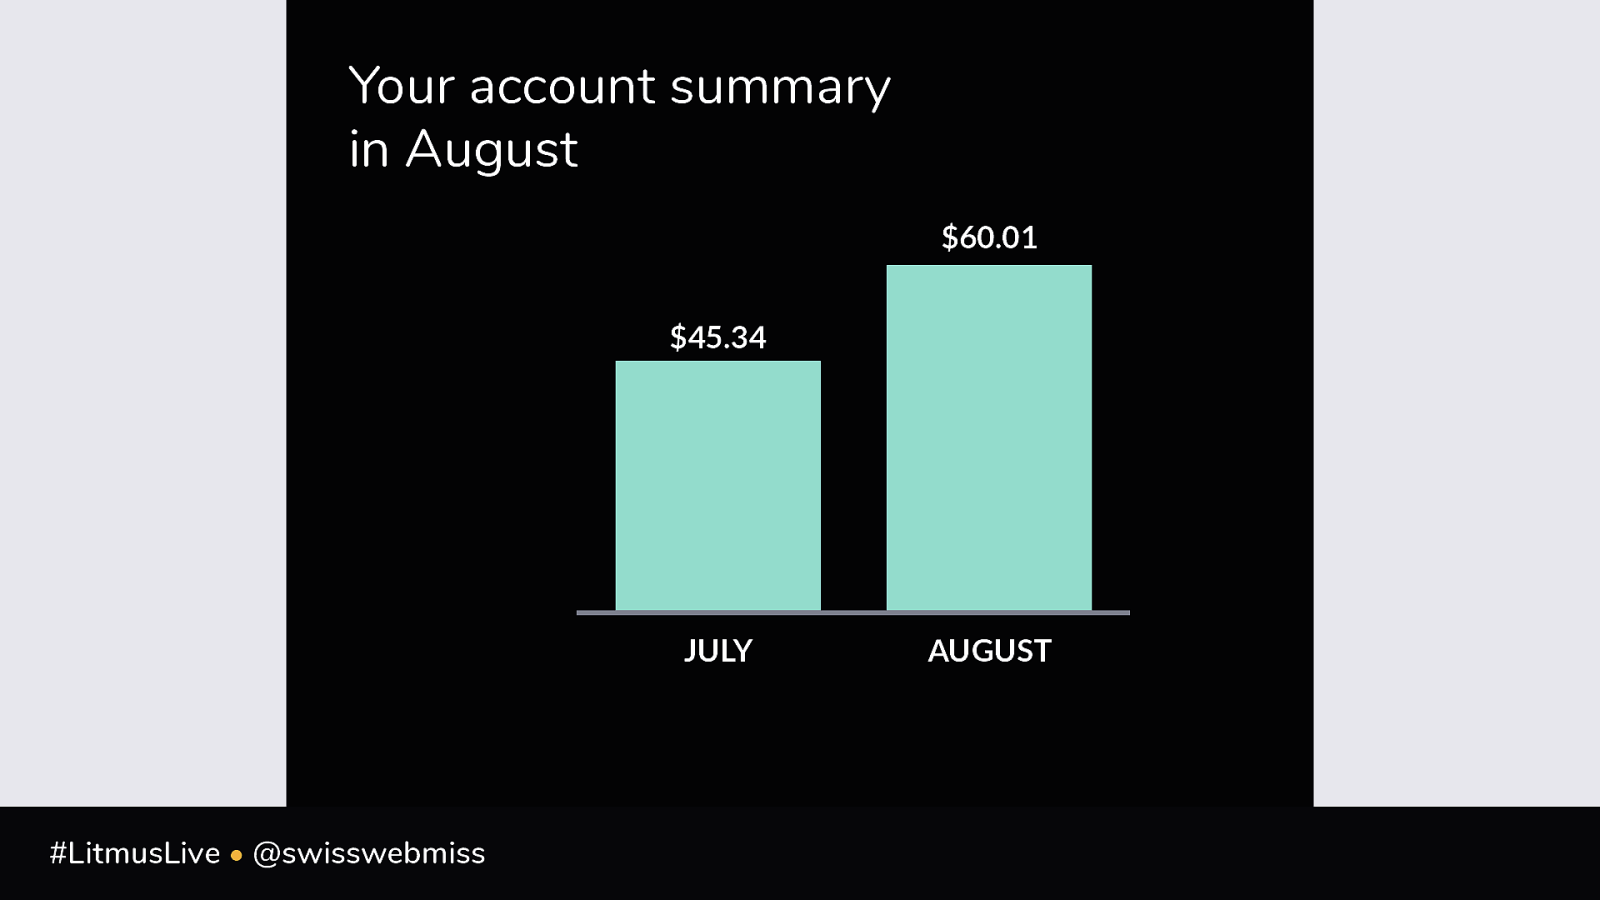
Your account summary in August $60.01 $60 $45 $45.34 $30 $15 $0 JULY #LitmusLive • @swisswebmiss AUGUST
Your account summary in August $60.01 $45.34 JULY #LitmusLive • @swisswebmiss AUGUST
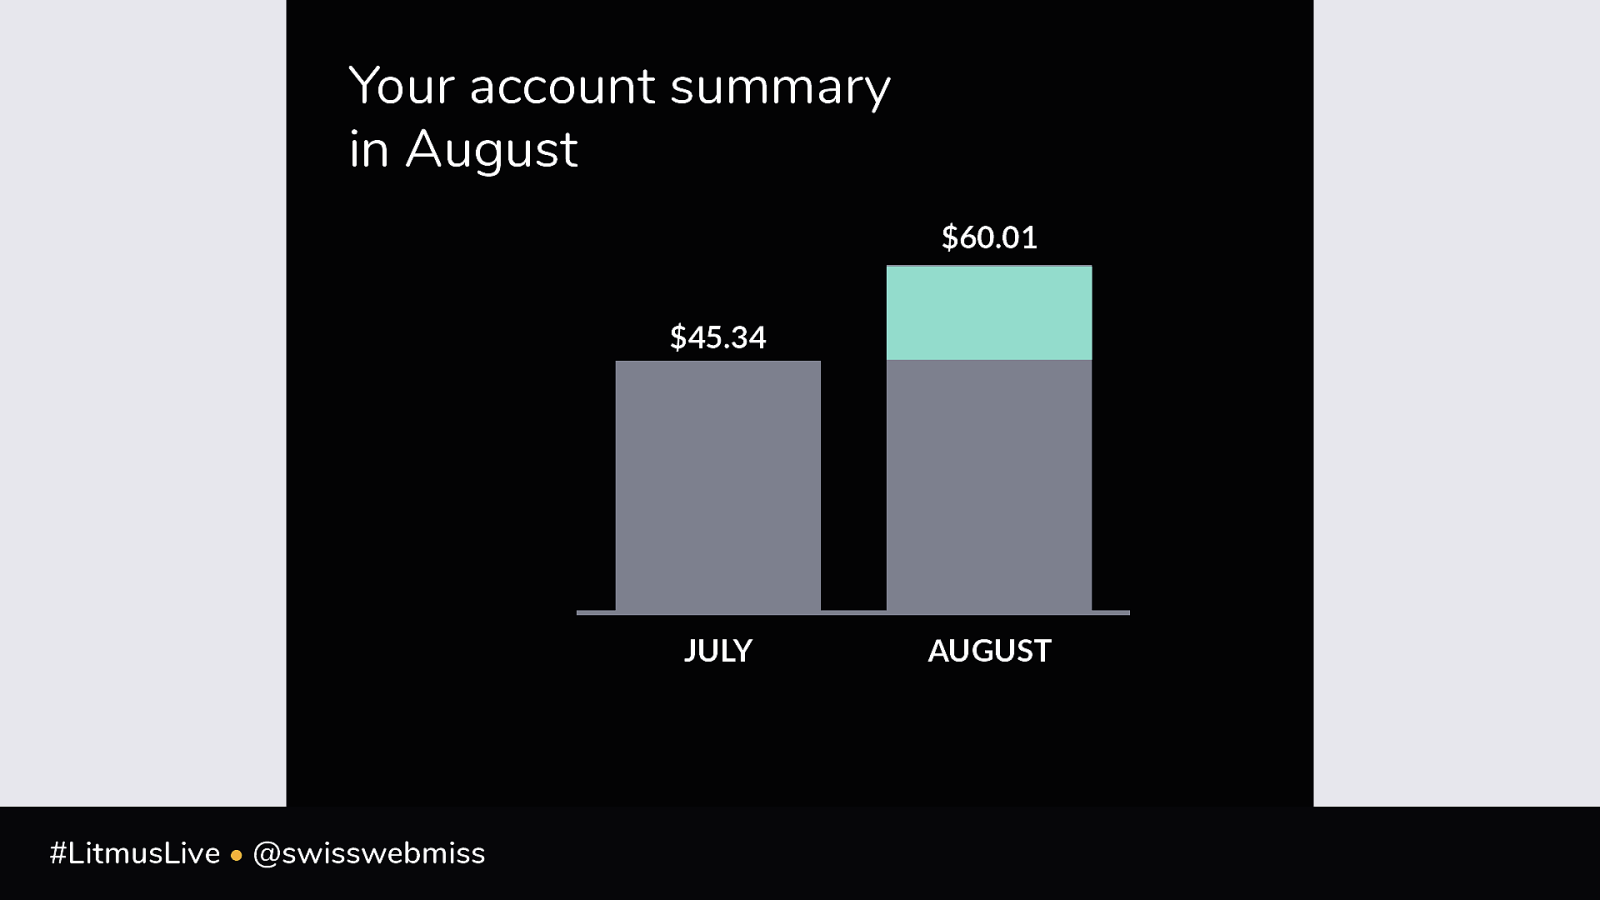
Your account summary in August $60.01 $45.34 JULY #LitmusLive • @swisswebmiss AUGUST
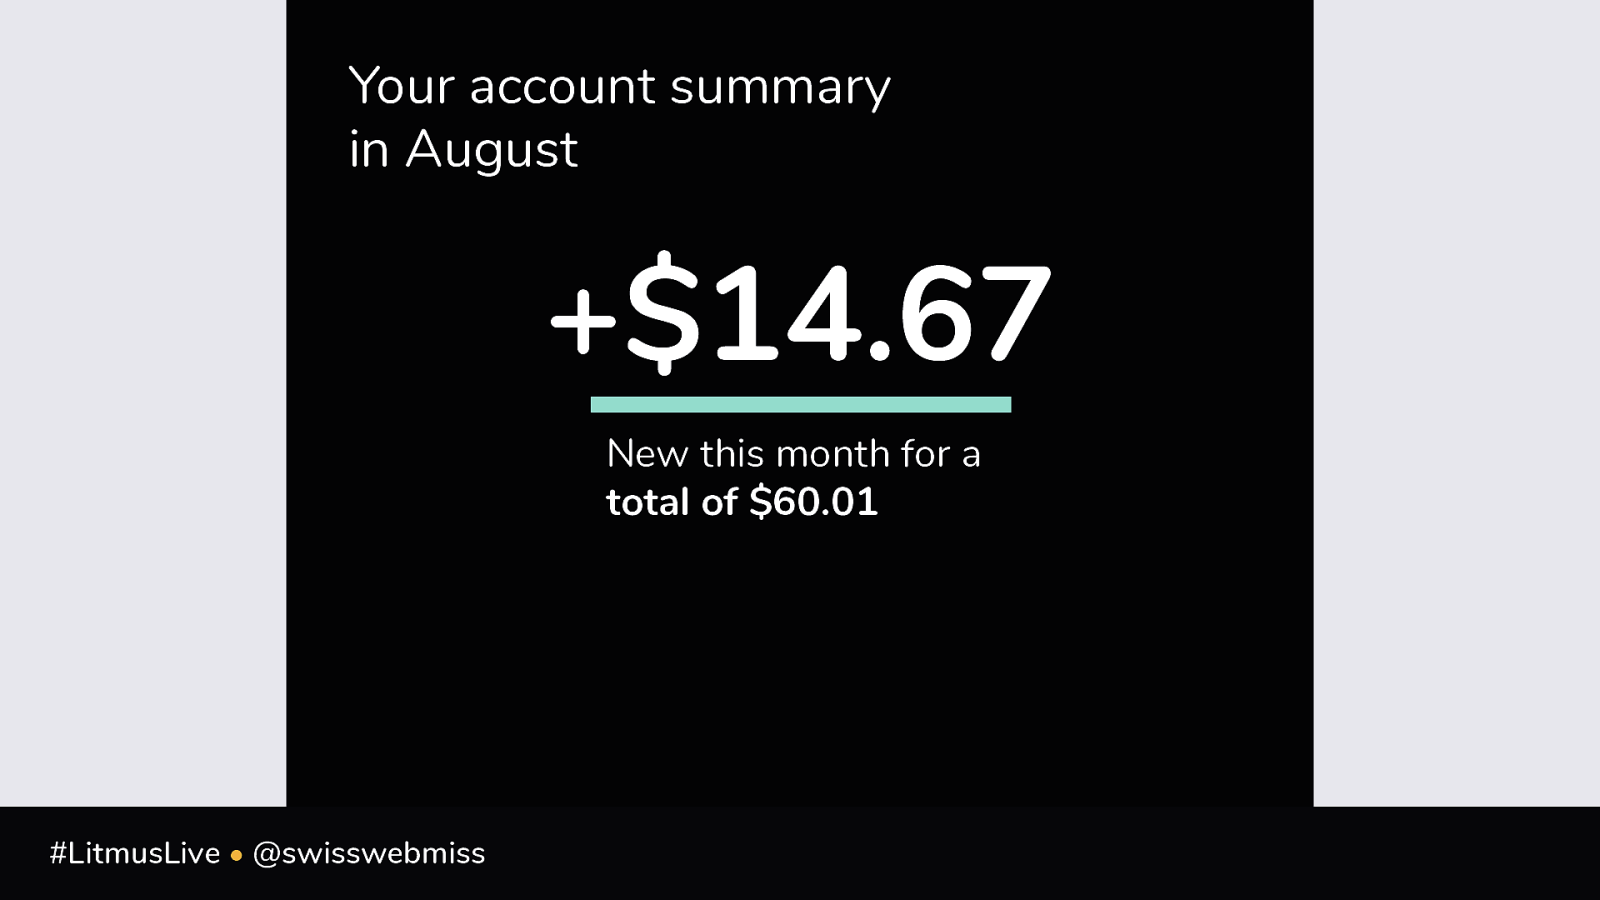
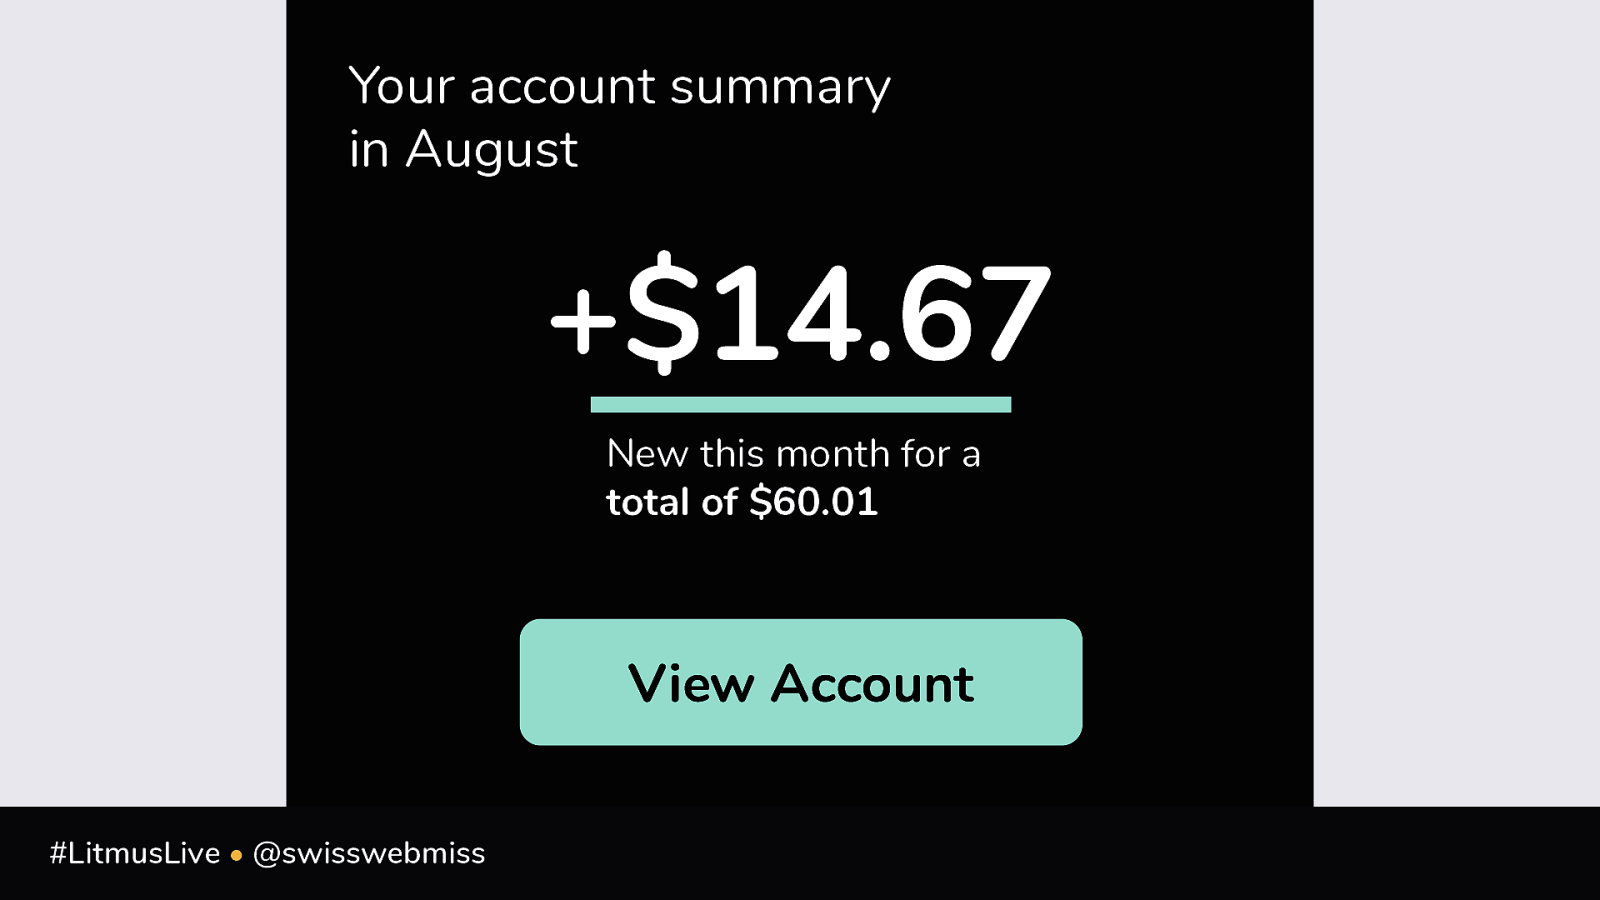
Your account summary in August +$14.67 New this month for a total of $60.01 #LitmusLive • @swisswebmiss
Your account summary in August +$14.67 New this month for a total of $60.01 #LitmusLive • @swisswebmiss
Your account summary in August +$14.67 New this month for a total of $60.01 View Account #LitmusLive • @swisswebmiss
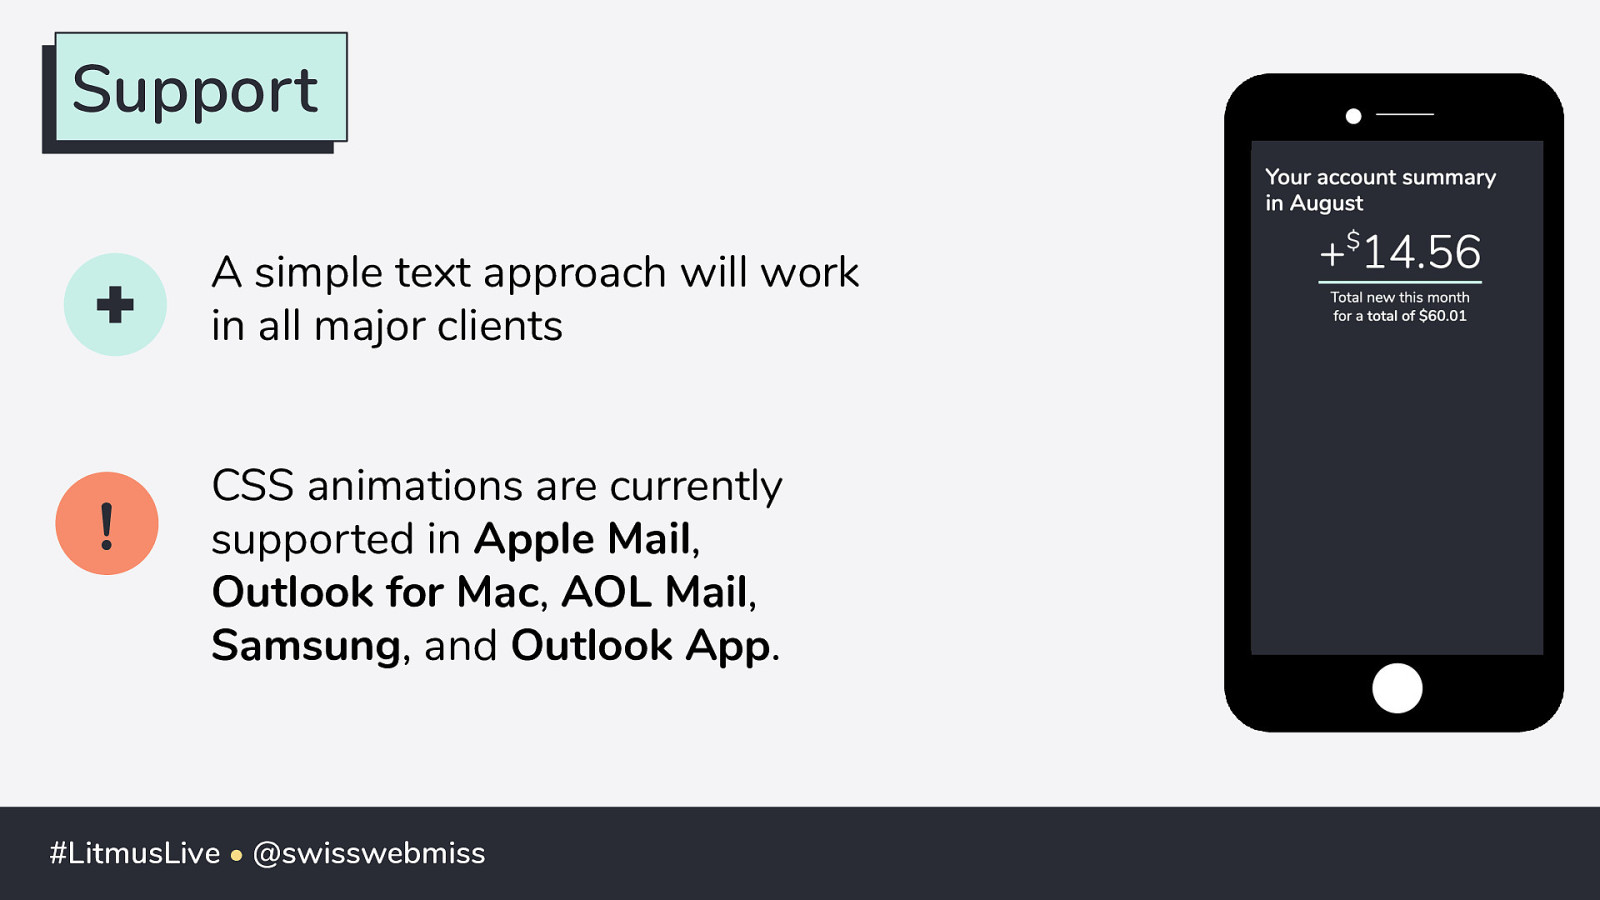
Support A simple text approach will work in all major clients ! CSS animations are currently supported in Apple Mail, Outlook for Mac, AOL Mail, Samsung, and Outlook App. #LitmusLive • @swisswebmiss
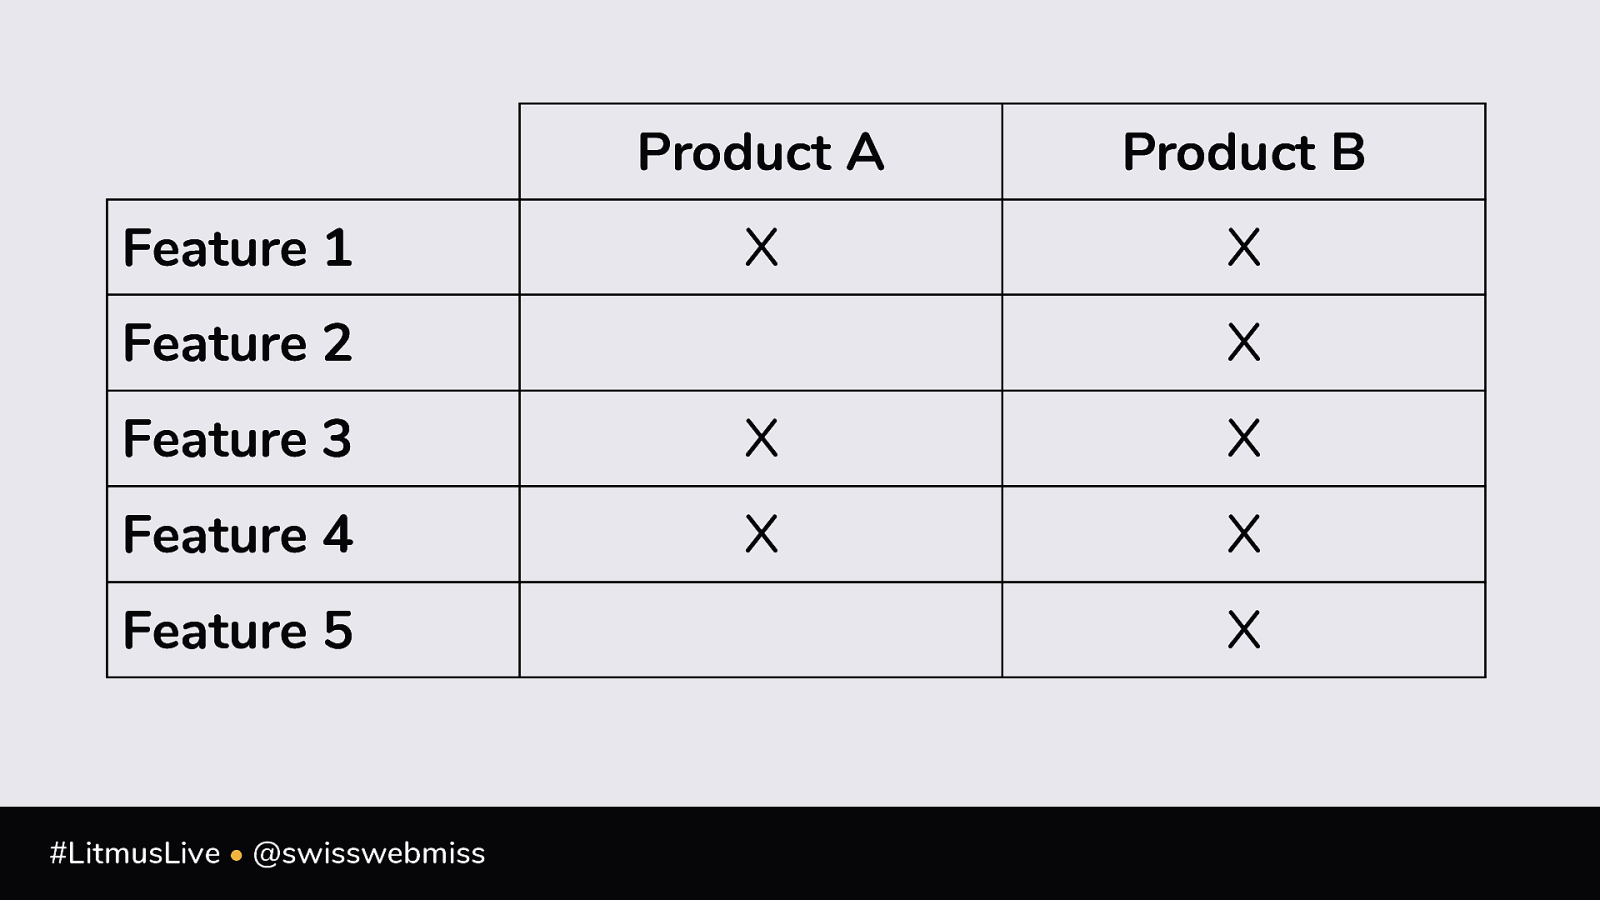
2 Product Comparison #LitmusLive • @swisswebmiss
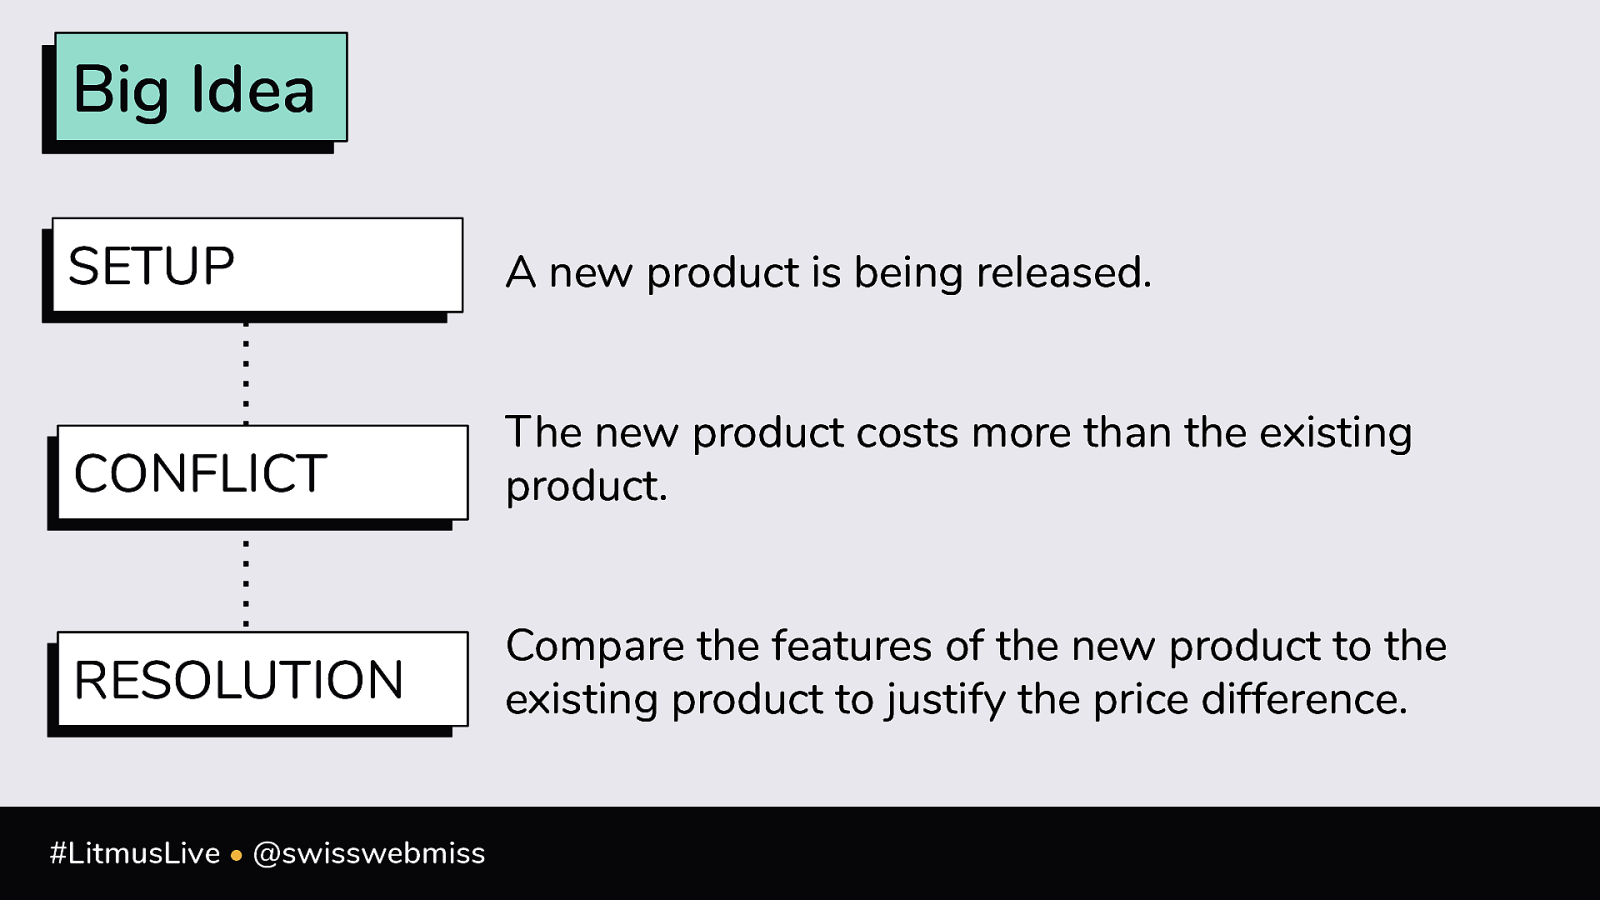
Big Idea SETUP A new product is being released. CONFLICT The new product costs more than the existing product. RESOLUTION Compare the features of the new product to the existing product to justify the price difference. #LitmusLive • @swisswebmiss
Feature 1 Product A Product B X X Feature 2 X Feature 3 X X Feature 4 X X Feature 5 #LitmusLive • @swisswebmiss X
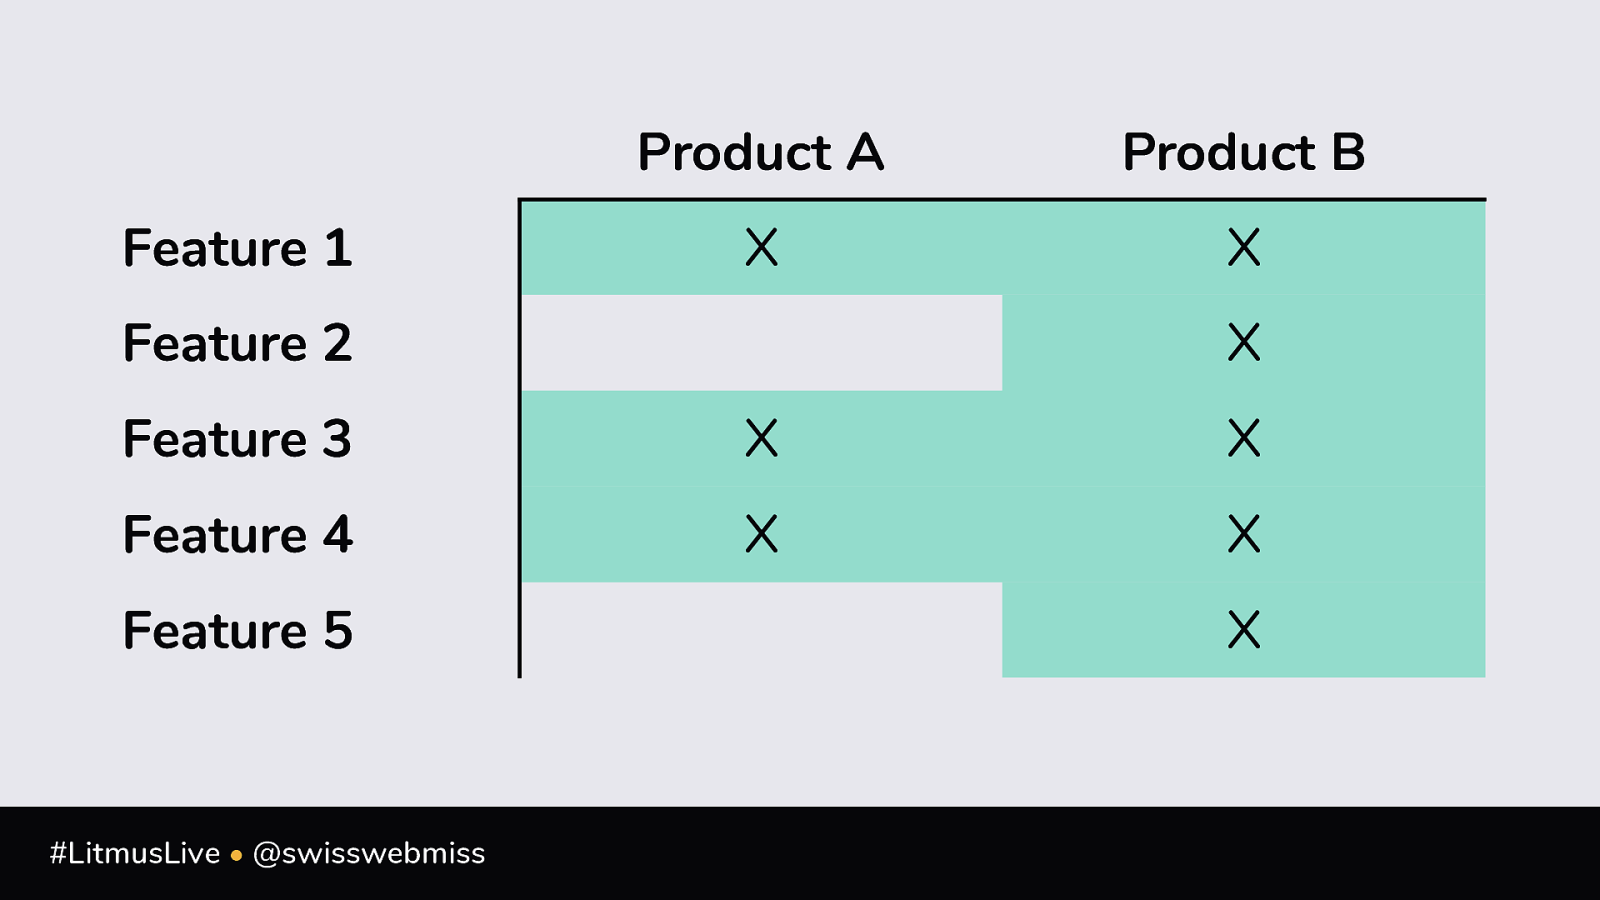
Feature 1 Product A Product B X X Feature 2 X Feature 3 X X Feature 4 X X Feature 5 #LitmusLive • @swisswebmiss X
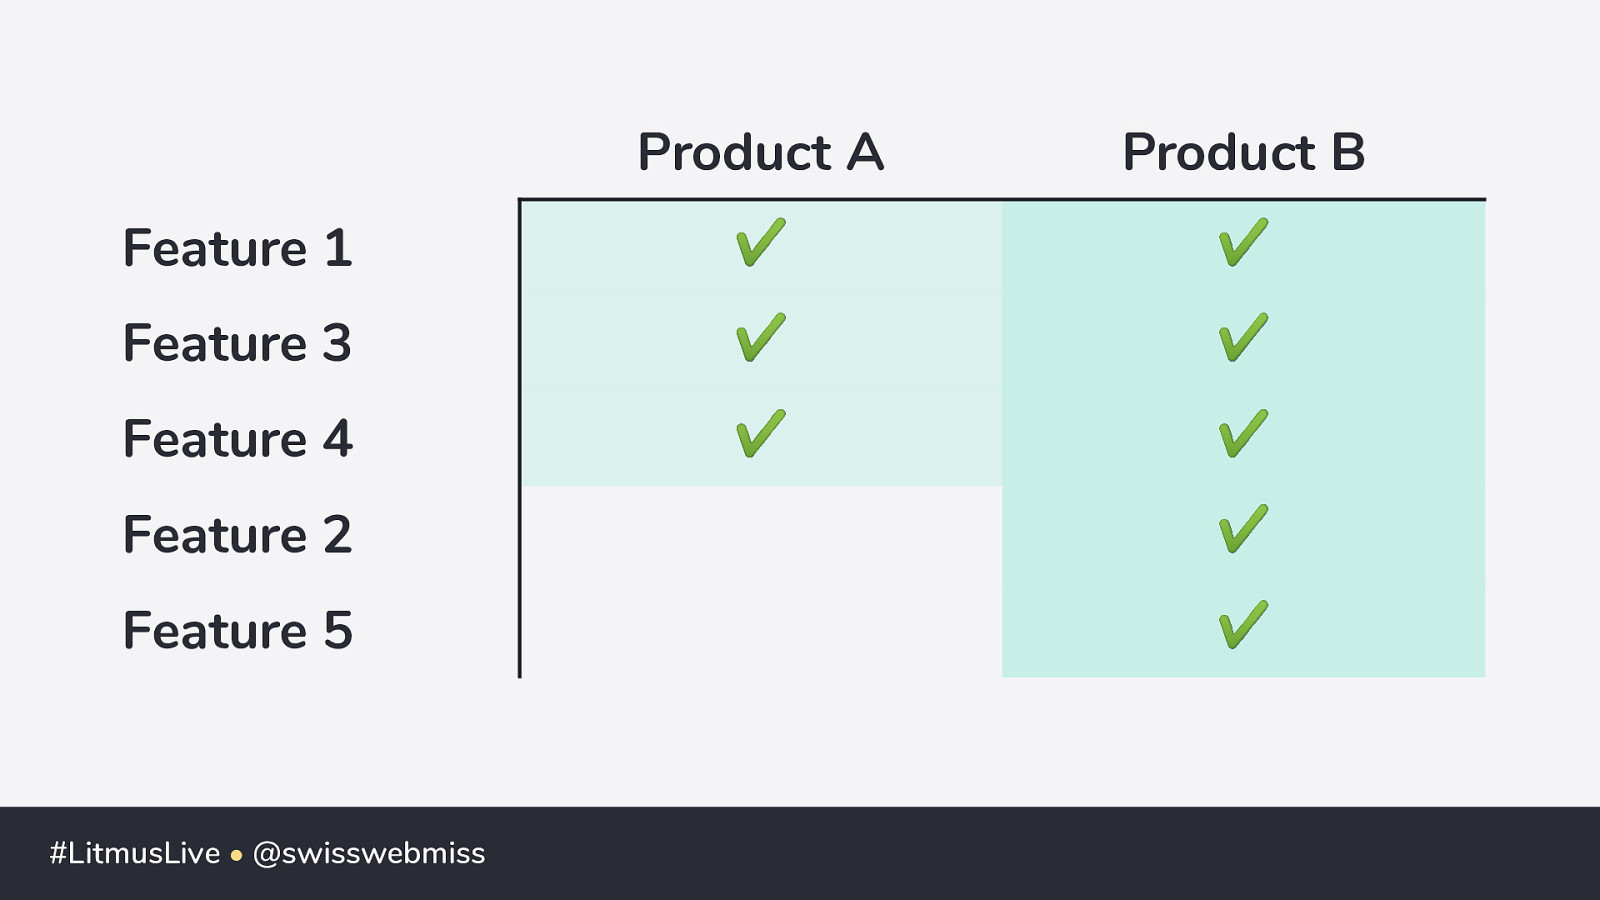
Product A Product B Feature 1 ✔ ✔ Feature 3 ✔ ✔ Feature 4 ✔ ✔ Feature 2 ✔ Feature 5 ✔ #LitmusLive • @swisswebmiss
#LitmusLive • @swisswebmiss
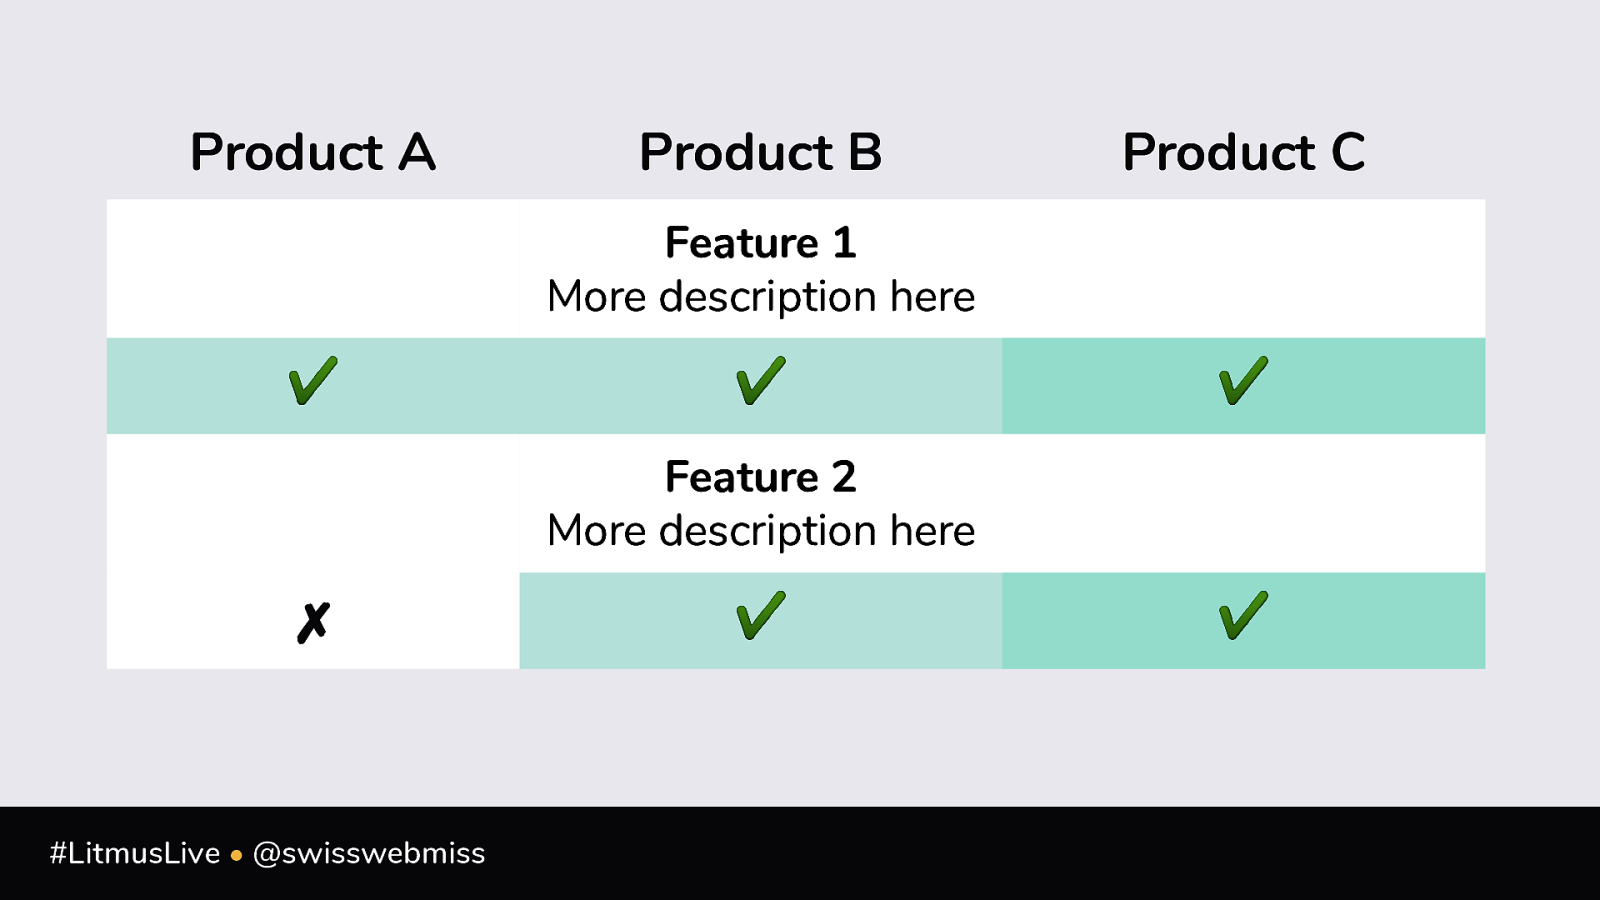
Product A Product B Product C Feature 1 More description here ✔ ✔ ✔ Feature 2 More description here ✗ #LitmusLive • @swisswebmiss ✔ ✔
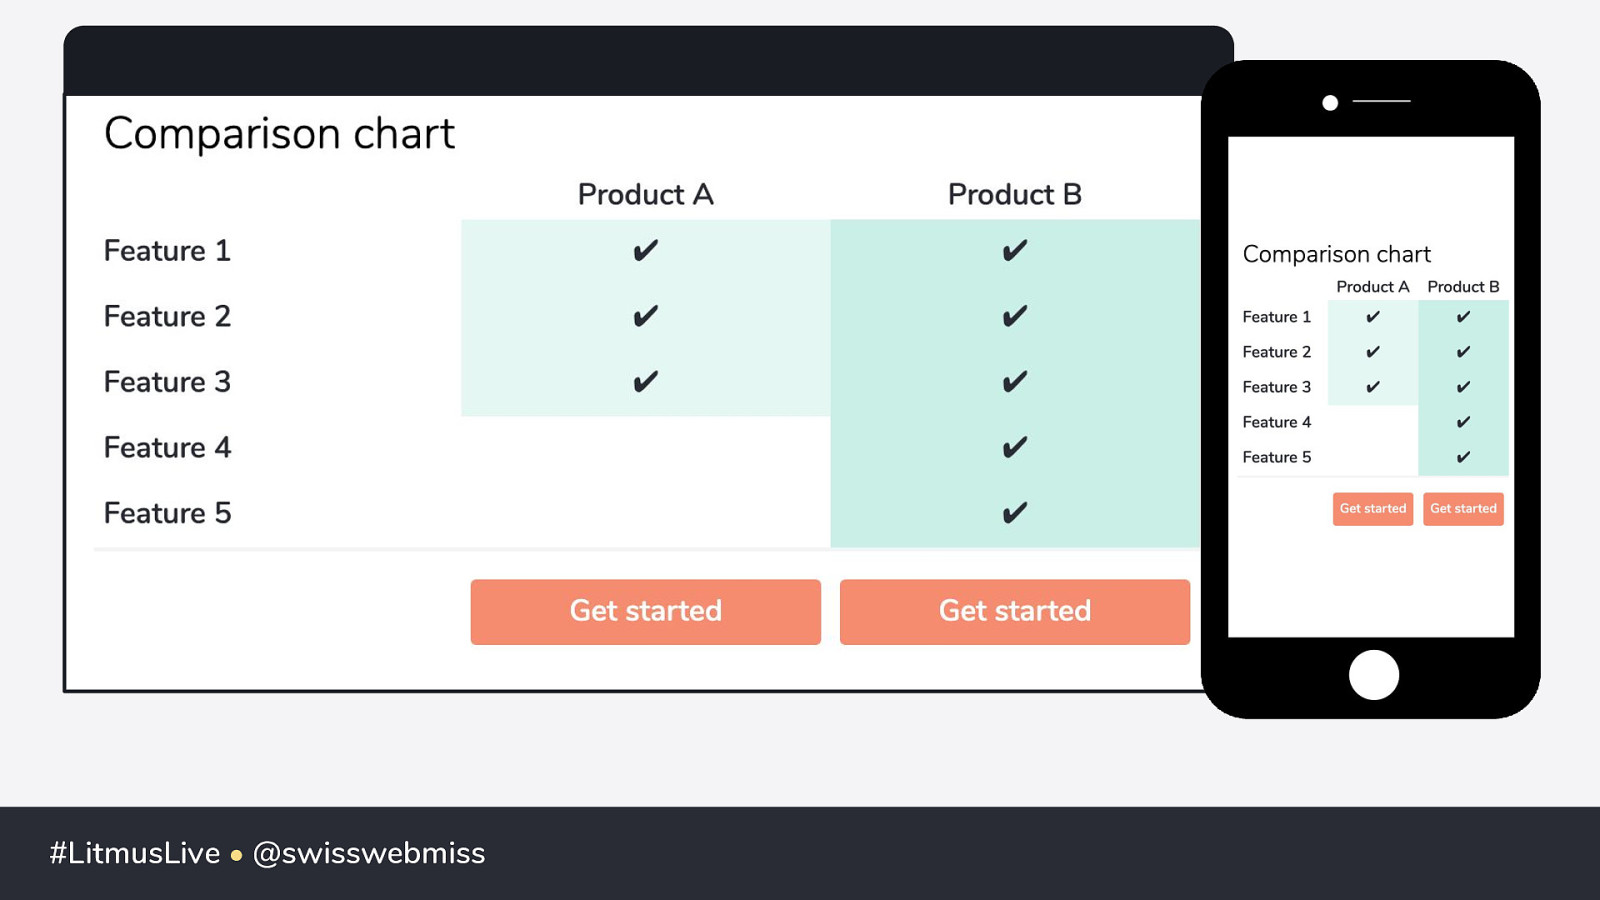
#LitmusLive • @swisswebmiss
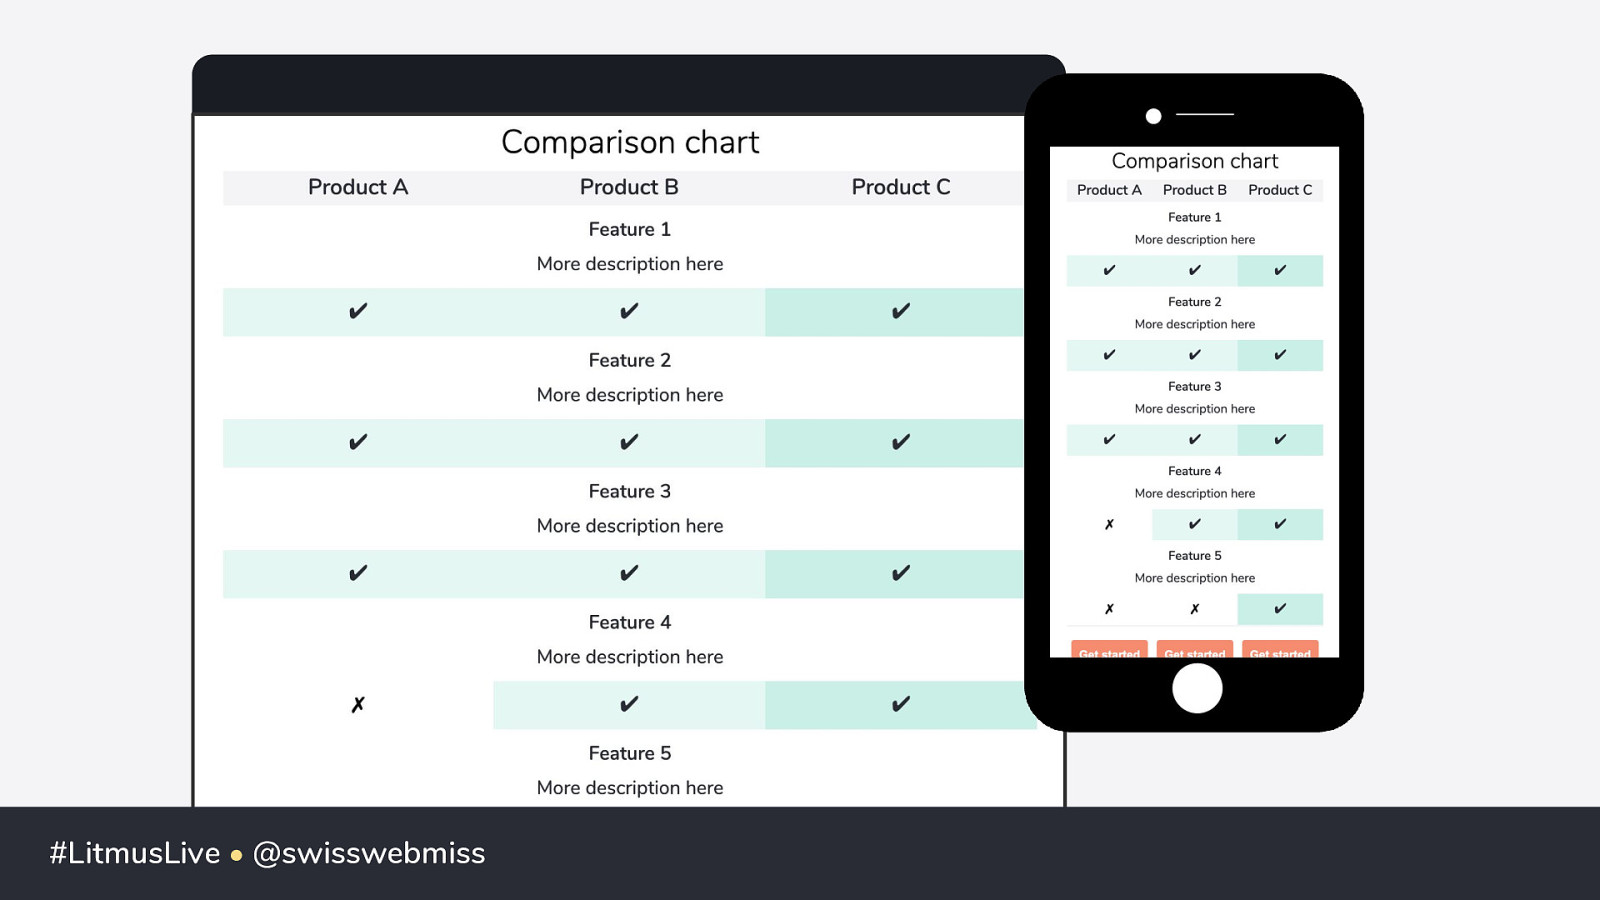
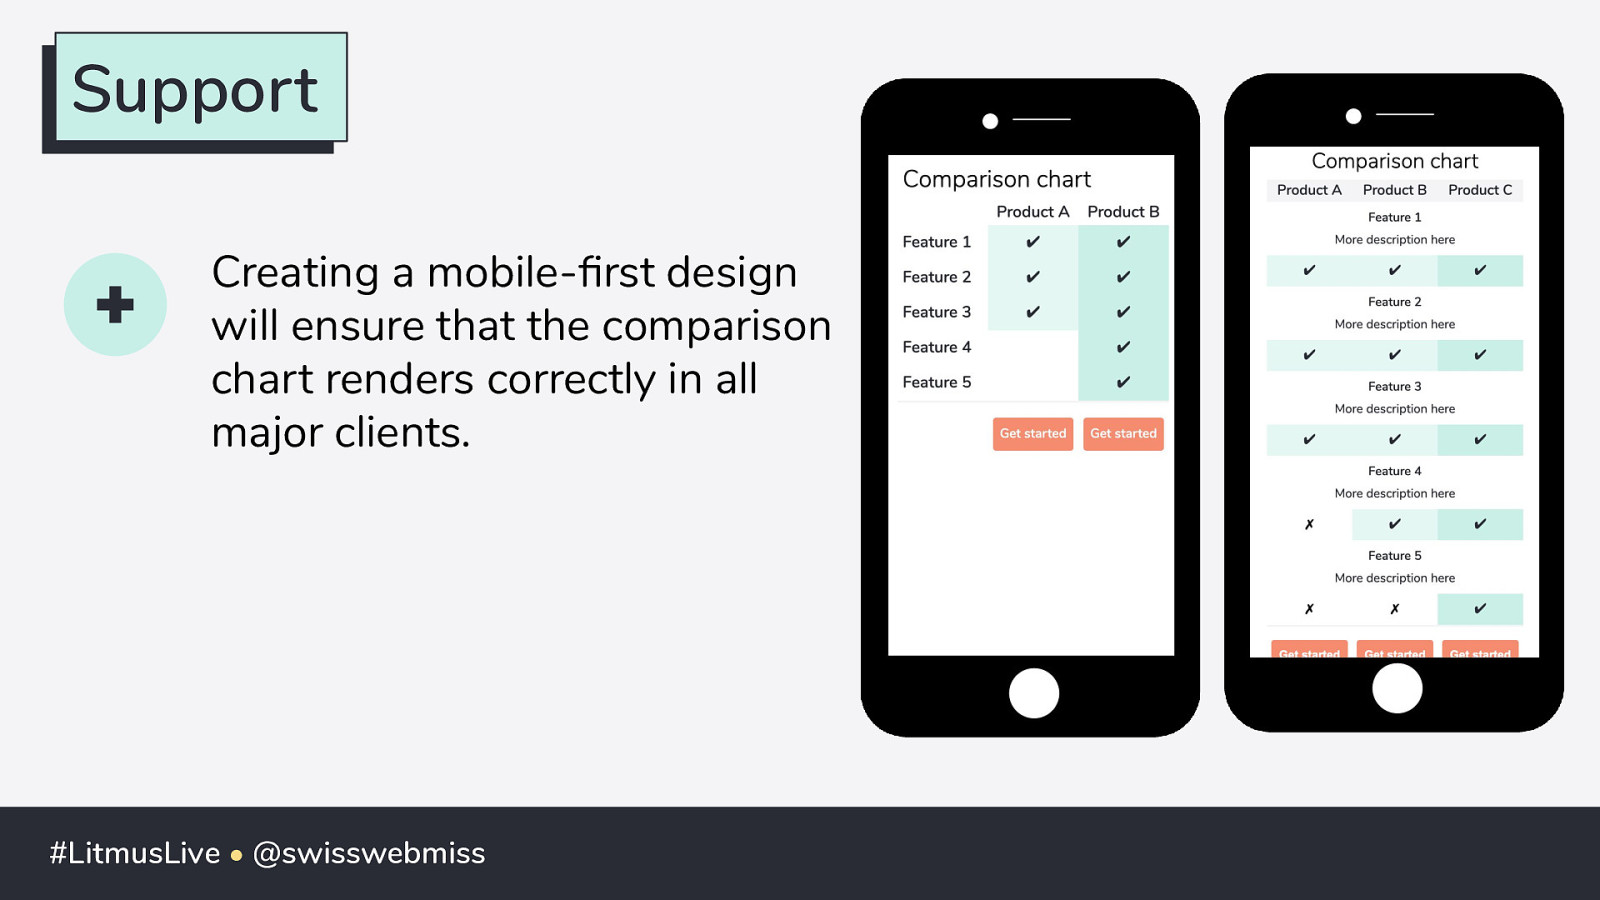
Support Creating a mobile-first design will ensure that the comparison chart renders correctly in all major clients. #LitmusLive • @swisswebmiss
3 Fundraising Effort #LitmusLive • @swisswebmiss
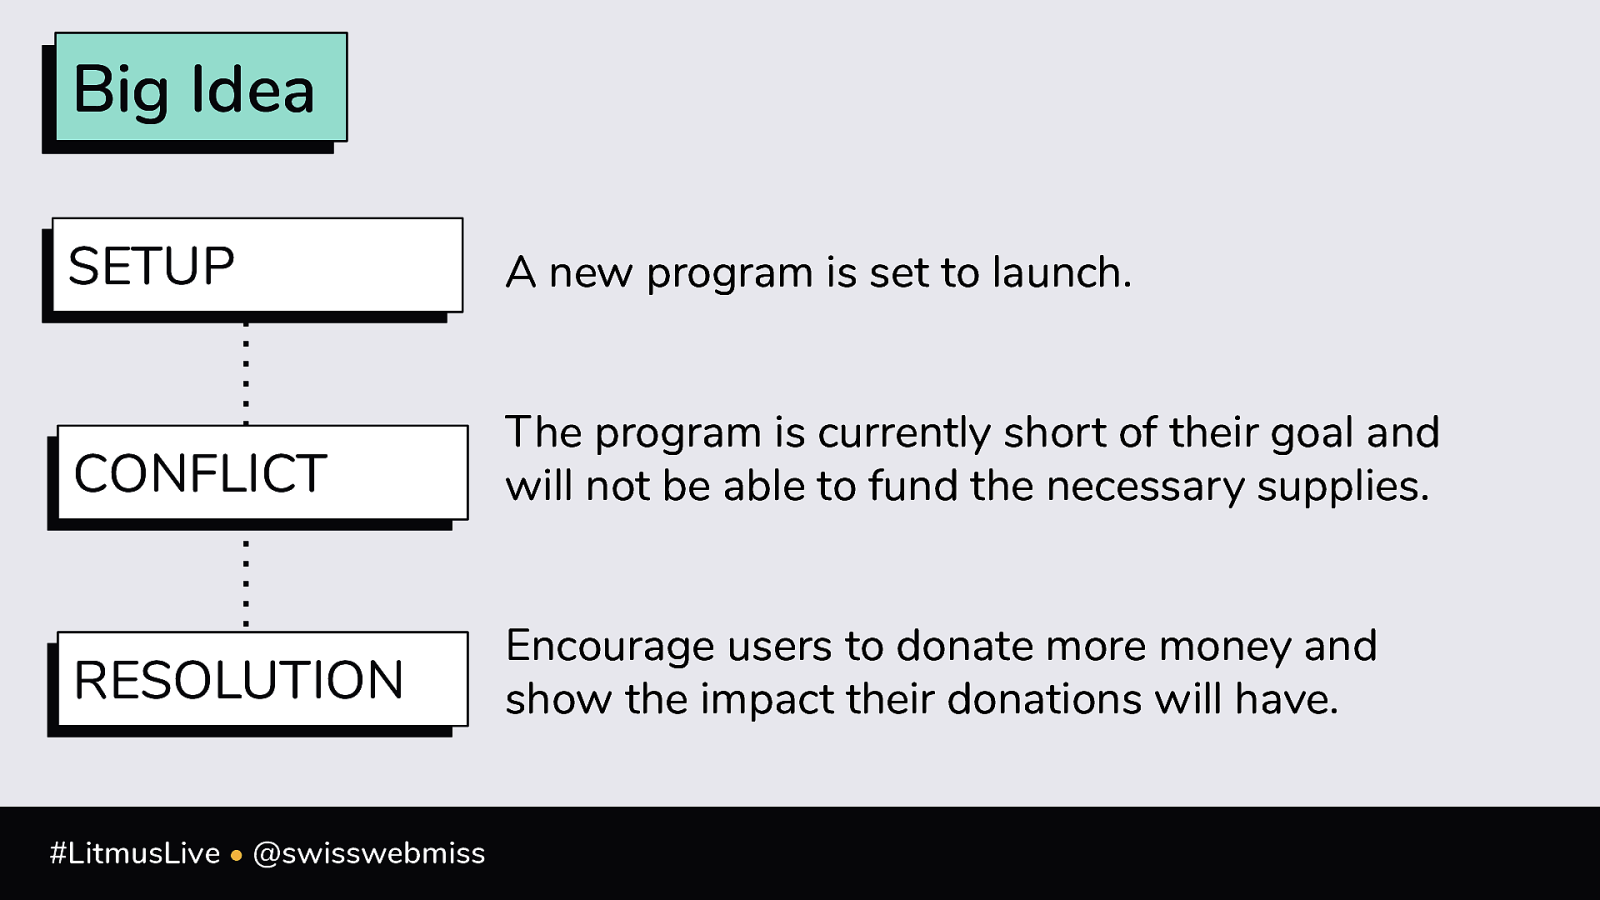
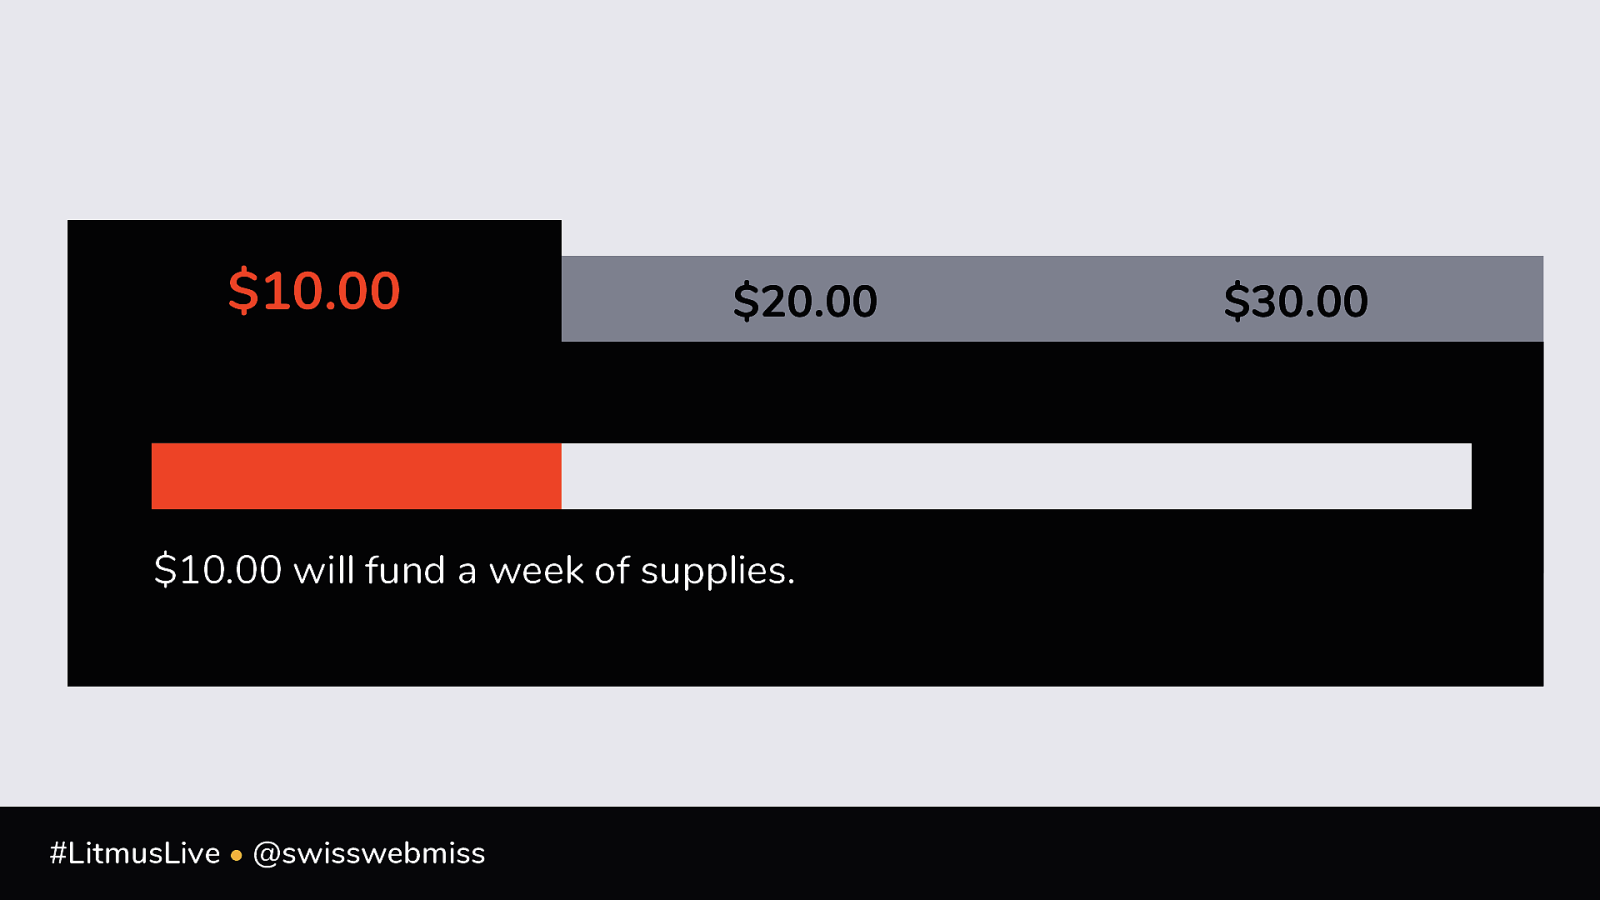
Big Idea SETUP A new program is set to launch. CONFLICT The program is currently short of their goal and will not be able to fund the necessary supplies. RESOLUTION Encourage users to donate more money and show the impact their donations will have. #LitmusLive • @swisswebmiss
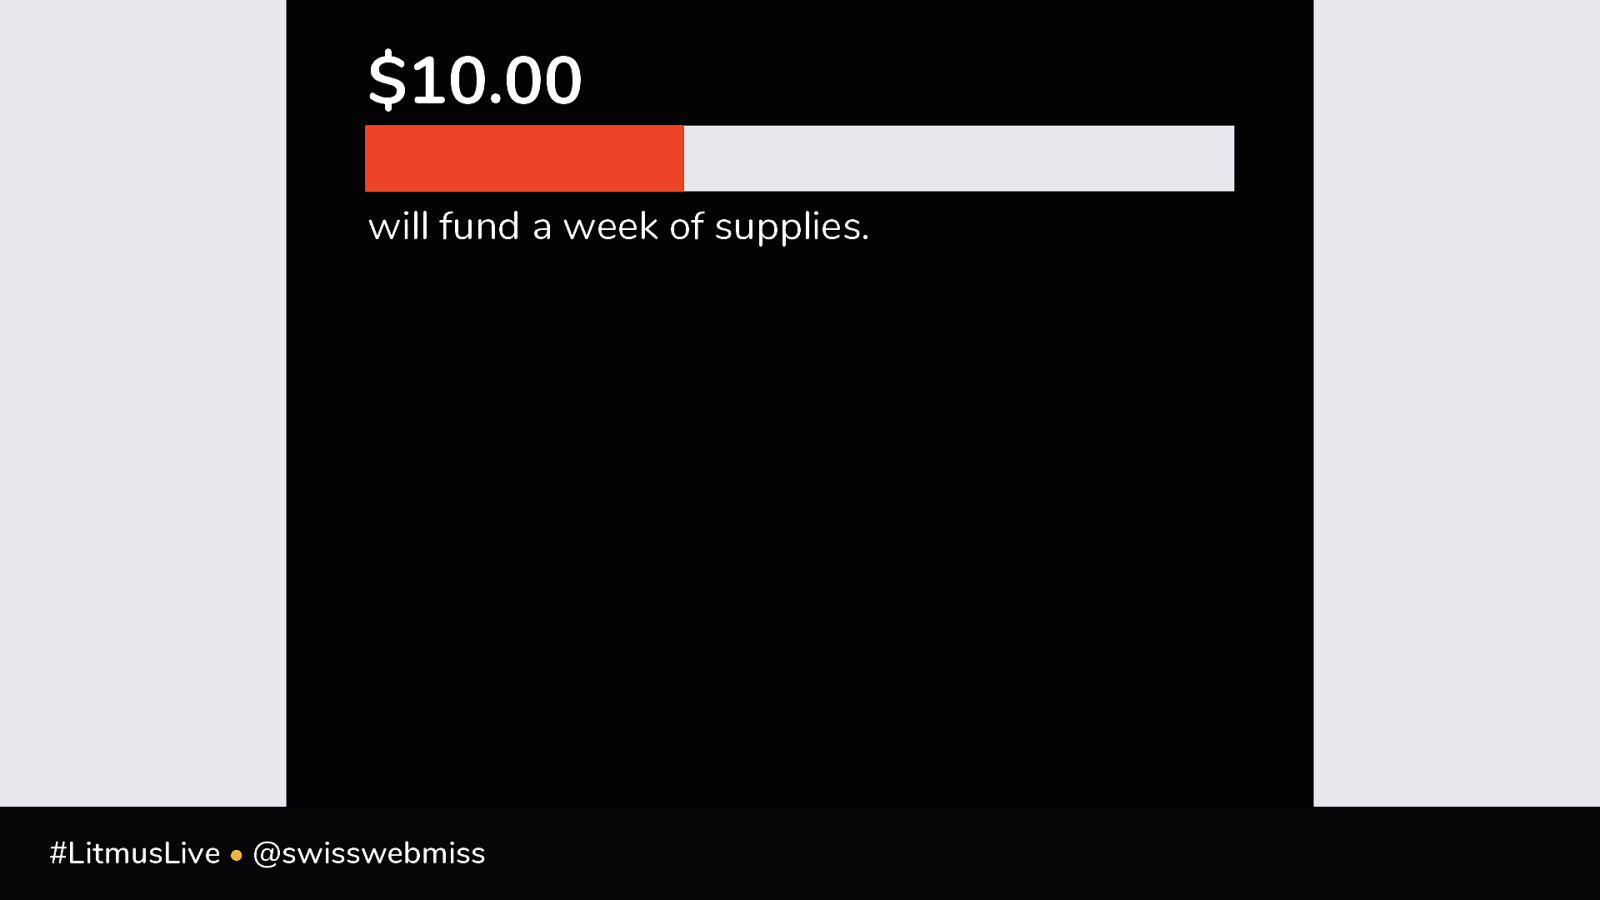
$10.00 will fund a week of supplies. #LitmusLive • @swisswebmiss
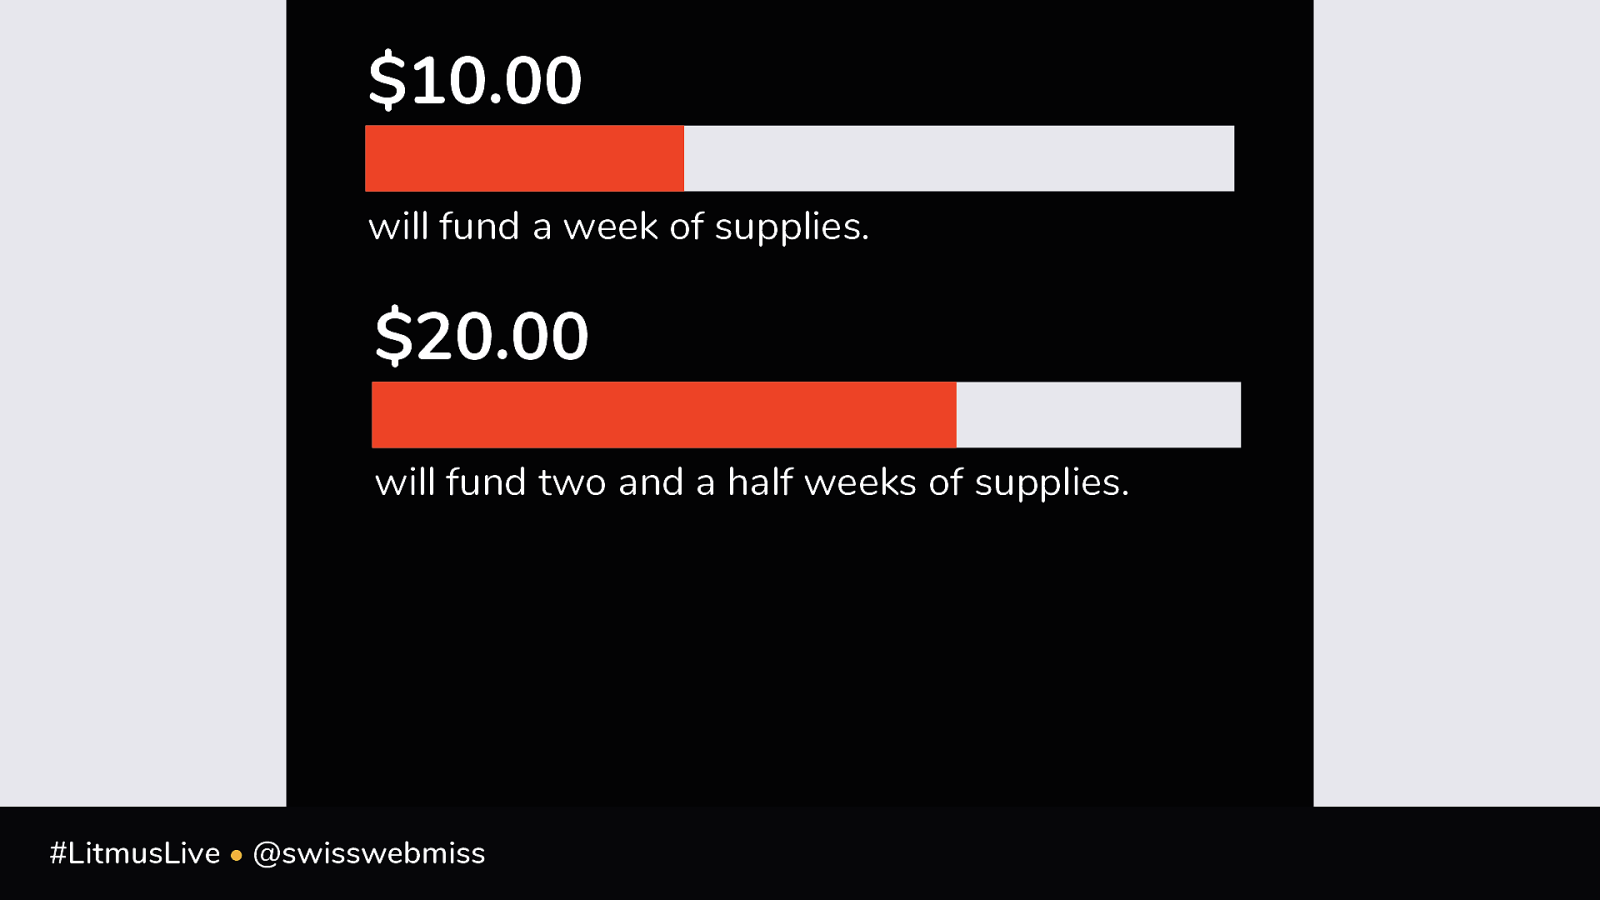
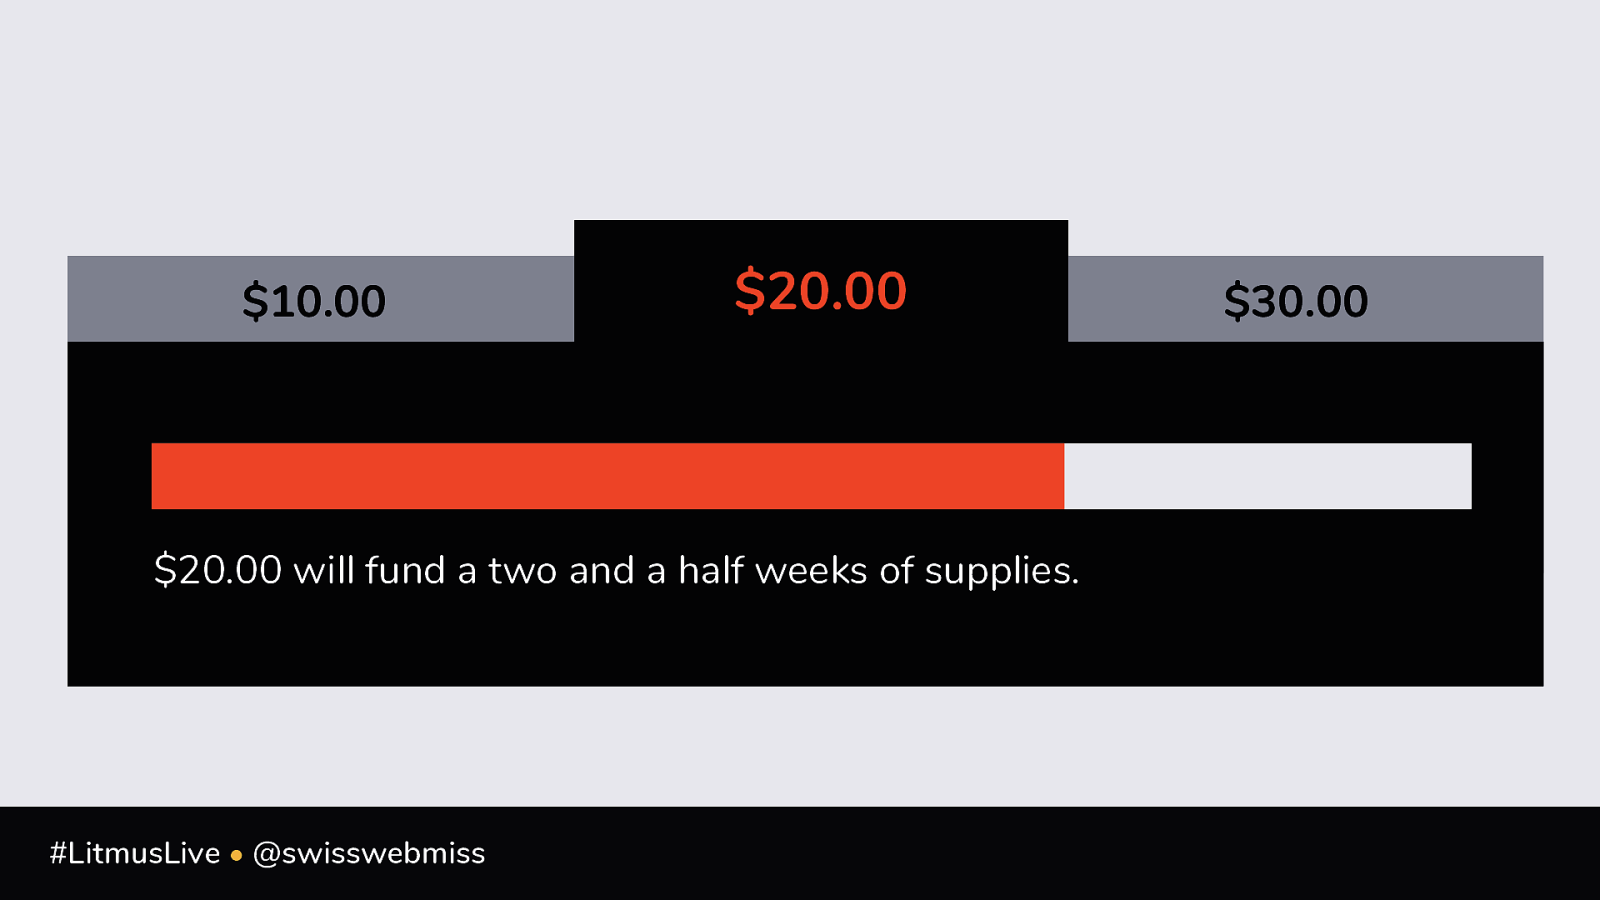
$10.00 will fund a week of supplies. $20.00 will fund two and a half weeks of supplies. #LitmusLive • @swisswebmiss
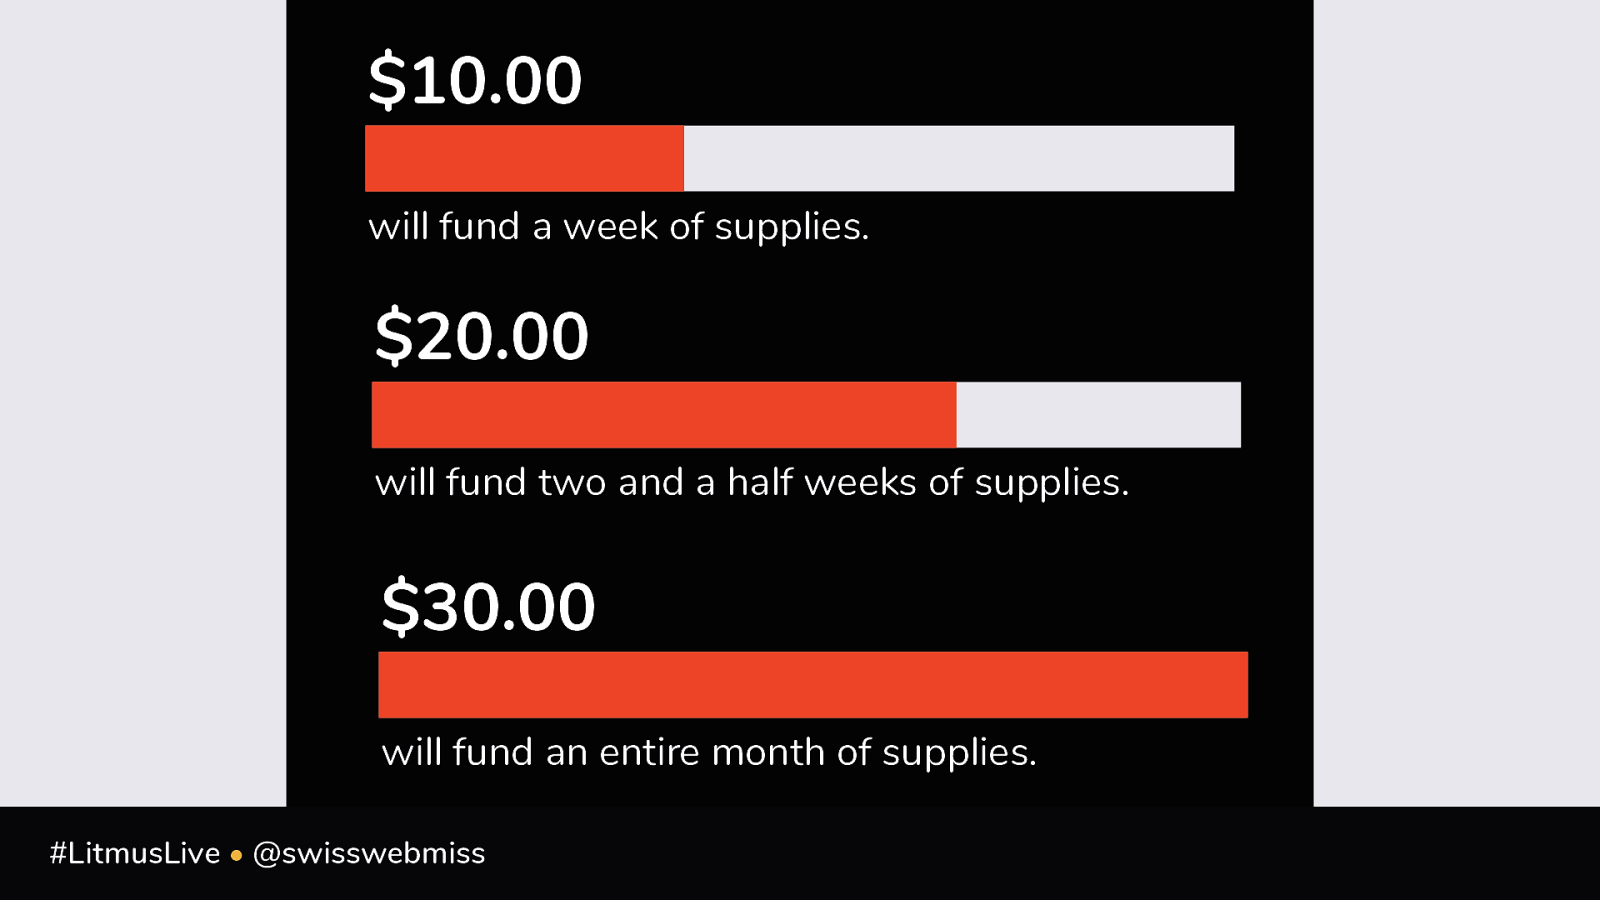
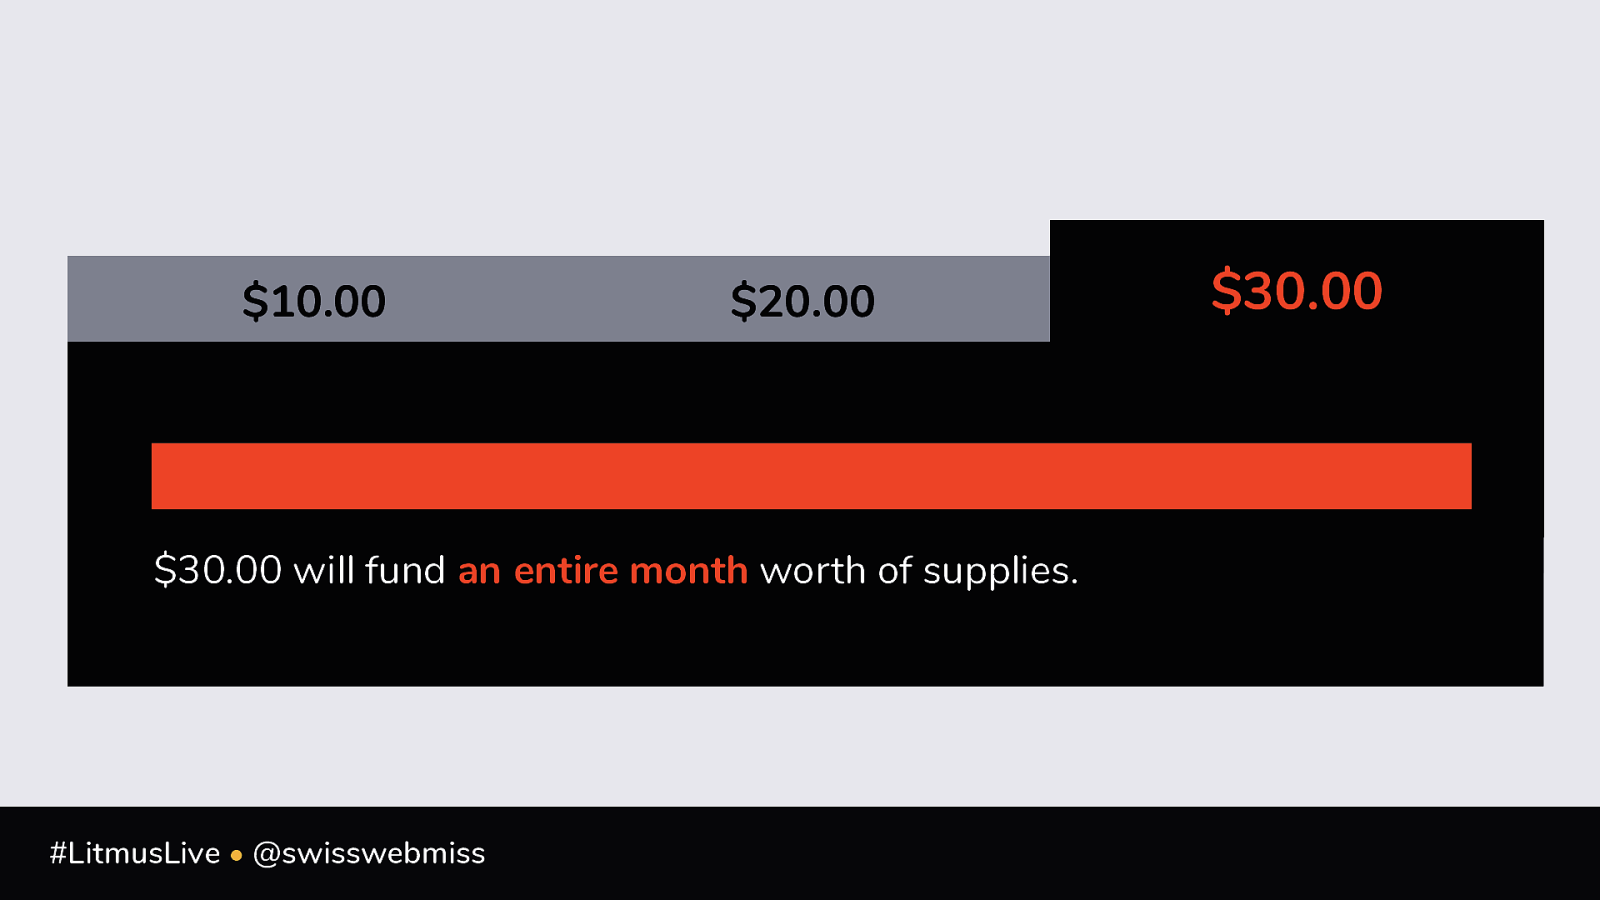
$10.00 will fund a week of supplies. $20.00 will fund two and a half weeks of supplies. $30.00 will fund an entire month of supplies. #LitmusLive • @swisswebmiss
$10.00 $20.00 $10.00 will fund a week of supplies. #LitmusLive • @swisswebmiss $30.00
$10.00 $20.00 $20.00 will fund a two and a half weeks of supplies. #LitmusLive • @swisswebmiss $30.00
$10.00 $20.00 $30.00 will fund an entire month worth of supplies. #LitmusLive • @swisswebmiss $30.00
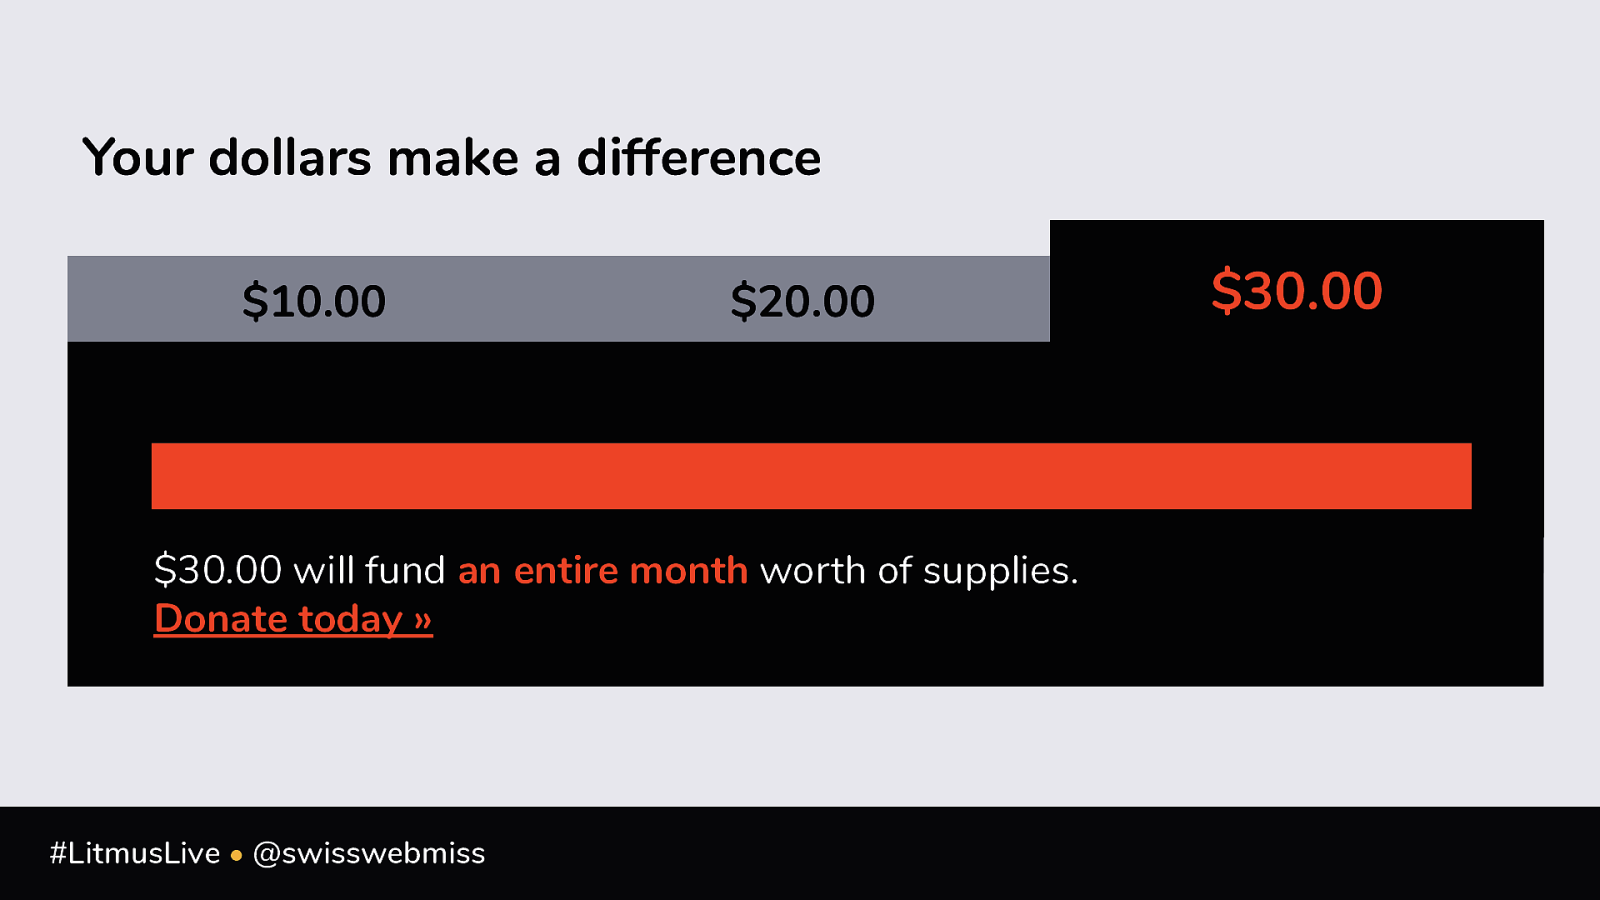
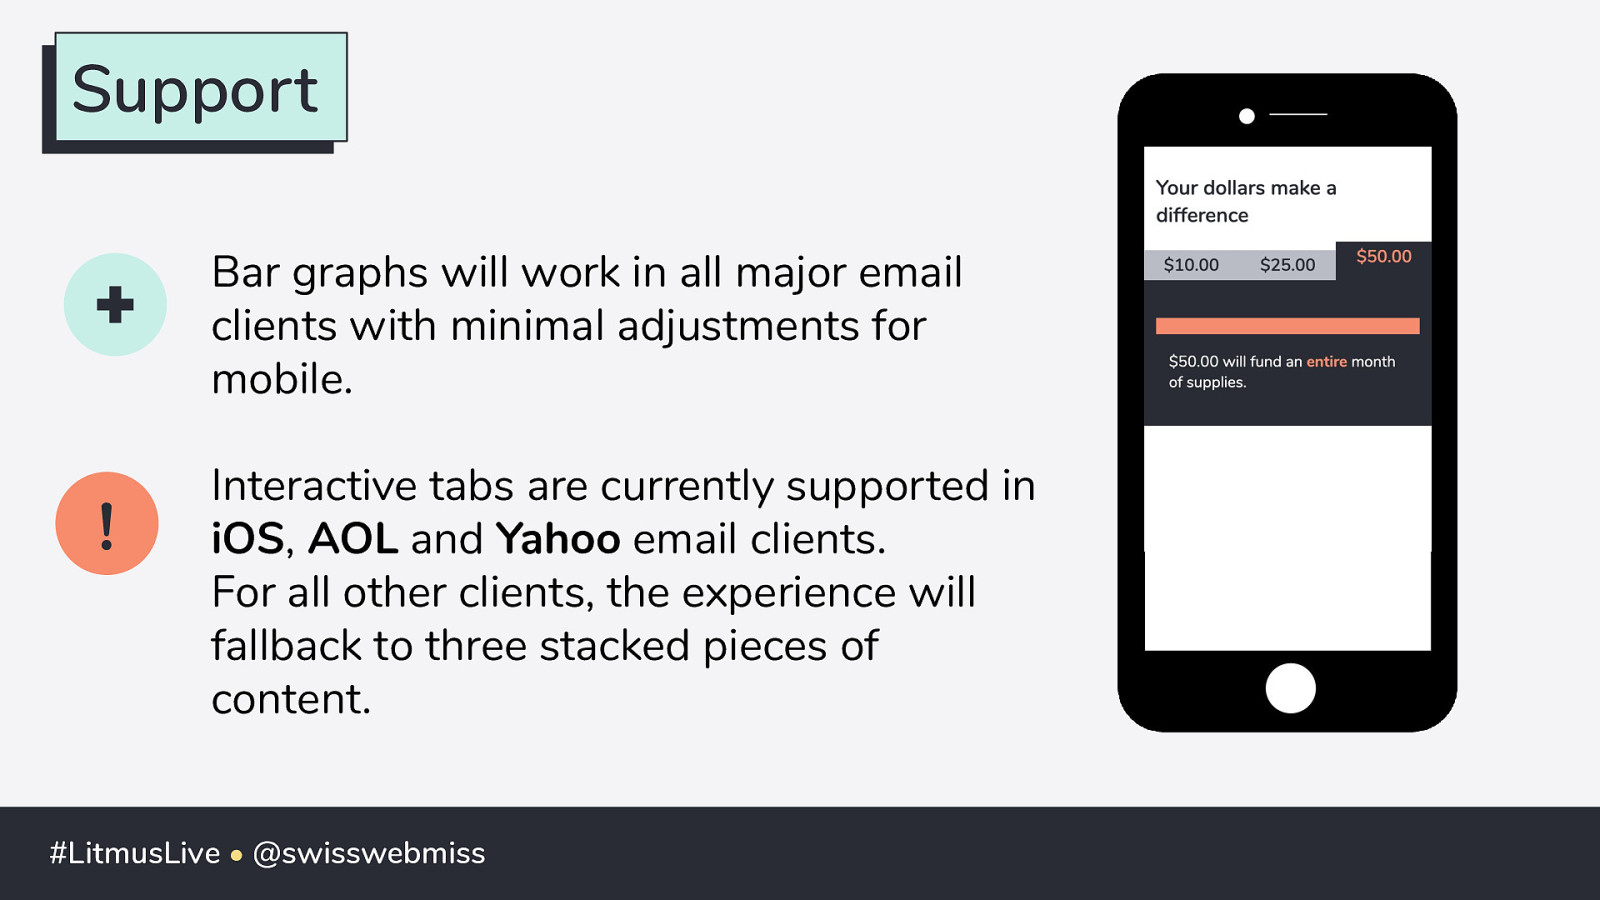
Your dollars make a difference $10.00 $20.00 $30.00 will fund an entire month worth of supplies. Donate today » #LitmusLive • @swisswebmiss $30.00
Support Bar graphs will work in all major email clients with minimal adjustments for mobile. ! Interactive tabs are currently supported in iOS, AOL and Yahoo email clients. For all other clients, the experience will fallback to three stacked pieces of content. #LitmusLive • @swisswebmiss
WRAP UP Effective storytelling with data visualization #LitmusLive • @swisswebmiss
The Secret Sauce Easy to comprehend Tells a compelling story #LitmusLive • @swisswebmiss Accessible across various clients
heidiolsen.com/LL19 Slides • Code Samples • Links to Resources #LitmusLive • @swisswebmiss

Email marketers have more data than ever when it comes to subscribers. That doesn’t mean we’re putting it to work, though. By innovating how we think about data and, more importantly, present that data to subscribers, we can tell effective stories that inspire subscribers to engage with us. In this session, we’ll walk through various datasets and how they can be leveraged through visual design, HTML, and CSS to create more innovative emails for our subscribers.
Here’s what was said about this presentation on social media.


 for free. You
can too.
for free. You
can too.