Java™ Performance Myths Myths, Mysteries, and Paradoxes Dr Holly Cummins Tooling Technical Lead Java Technology Centre IBM cumminsh@uk.ibm.com

A presentation at Great Indian Developer Summit in May 2008 in Bengaluru, Karnataka, India by Holly Cummins
Java™ Performance Myths Myths, Mysteries, and Paradoxes Dr Holly Cummins Tooling Technical Lead Java Technology Centre IBM cumminsh@uk.ibm.com

Outline • • • • • Developing for performance Simple performance pitfalls Garbage collection Compilation Java performance
“I should take perfor mance advice.” form • It seems natural for non-performance-experts to follow the recommendations of performance experts • We’ve all read that X or Y is a best practice and gone away and ‘fixed’ all our code
No universal performance truths • Every application is different – Performance advice which was good a few years ago may be bad now – Performance advice which helps most applications may hurt yours – Virtual machine technologies change – Hardware changes • The only way to be sure is to measure – Measure before – Measure after
“I can measure perfor mance without form defining performance requirements” • Tempting to use performance tools to try and assess performance – – – – After all, they’re called performance tools! Try and infer response times from GC pause times Try and infer throughput from GC overhead Try and infer throughput from profiles
Performance measurement must be based on performance criteria • A performance tool cannot do your performance measurement for you • Performance measurement must be based on your application and your quality of service requirements – Throughput – Response times • Mean response time • 90th percentile response time • Worst-case response time
“Benchmarks can tell me how fast my application will go.” • Sometimes measuring the performance of your own application is difficult • Benchmarks are designed to predict and communicate performance • It is therefore tempting to do some assess performance against a benchmark instead of a real application – “Which JVM is fastest?” – “Which garbage collection policy is fastest?”
Benchmarks can be deceptive • Application performance is sensitive to many factors – Application load – Object size – Patterns of object access • A change which improves the benchmark may worsen the real application • Benchmarks should not be used to guide tuning decisions
“A micro-benchmark can help me choos e the best implementation” ose • We often need to make performance decisions – Should I use normal i/o or nio? – “What’s the impact of this coding style?” – “Which JVM is fastest?” • We learned from Myth 1 and will measure! • We learned from Myth 2 and won’t use a benchmark! • So in order to isolate other effects, we whip up a little test application and compare
Measure what you really care about • Isolating other effects isn’t a good idea – They’re present in the actual application • Performance is complex – JIT – GC – Threading • Micro-benchmarks often completely distort the performance effects of these • Measure your actual application, with a realistic workload
“I should optimise things.” • We want things to go as fast as possible • Seems obvious we should remove inefficiencies when we see them
When optimising doe oessn’t optimise • Sometimes big differences make a small difference • Example: – Method A: Uses 25% of time, 20% improvement possible – Method B: Uses 2% of time, 100% improvement possible – Fixing method A gives a 5% improvement, fixing method B gives a 1% improvement.
When optimising really doesn’t optimise • Sometimes something which is a performance improvement in one version of an application hurts performance in a later version of the application – Recall there are no universal performance truths • Optimisation is best done late in the development cycle • “The First Rule of Program Optimization: Don’t do it. The Second Rule of Program Optimization (for experts only!): Don’t do it yet.” • Michael A. Jackson
Optimise judiciously • Optimised code is often less elegant – Convoluted and unmaintainable – Fragile • Optimising is not worth the effort and risk if it doesn’t make a substantial difference • “We should forget about small efficiencies, say about 97% of the time: premature optimization is the root of all evil.” • Tony Hoare
“Great! I’ll write whatever I like and optimise at the end!” • If premature optimisation is to be avoided, then does this mean performance doesn’t have to be considered at all until the end of the development cycle?
We still need to think about perfo forrmance at all stages • Some inefficient constructs are repeated so widely it’s worth avoiding them if the alternatives are just as clean – Example: HashMap instead of HashTable • Some operations (like I/O) are so often performance bottlenecks their performance should be considered in the design • Fine-tuning pieces of code is not the same as designing a scalable performant architecture – Architecture is very difficult to change at the end
Make perfor mance part of the form process • Set up agreed measures early • Measure constantly to ensure that you’re roughly on track • This will help avoid a last minute panic and validate sound design
Outline • • • • • Developing for performance Simple performance pitfalls Garbage collection Compilation Java performance
“Memory leaks are impossible in Ja v a . ” • Memory leaks are very bad for performance – Long running applications with memory leaks will eventually crash – Short-lived applications with memory leaks may still suffer performance degradations • Memory leaks the bane of C++ developer’s lives • Isn’t it nice Java doesn’t have memory leaks?
Memory leaks in Java • Memory leaks happen when objects which are no longer required still use up memory • Two kinds of memory leak: – Losing a reference to an object which is no longer in use – Holding on to a reference for an object which is no longer in use • Java’s garbage collection eliminates the first kind, but not the second
Solution: Re Refference objects • Garbage collection – keeps objects which are still referenced – collects objects which are no longer referenced • Sometimes this isn’t a sophisticated enough semantics • Java Reference objects allow conditional collection • An under-used but extremely useful feature of Java
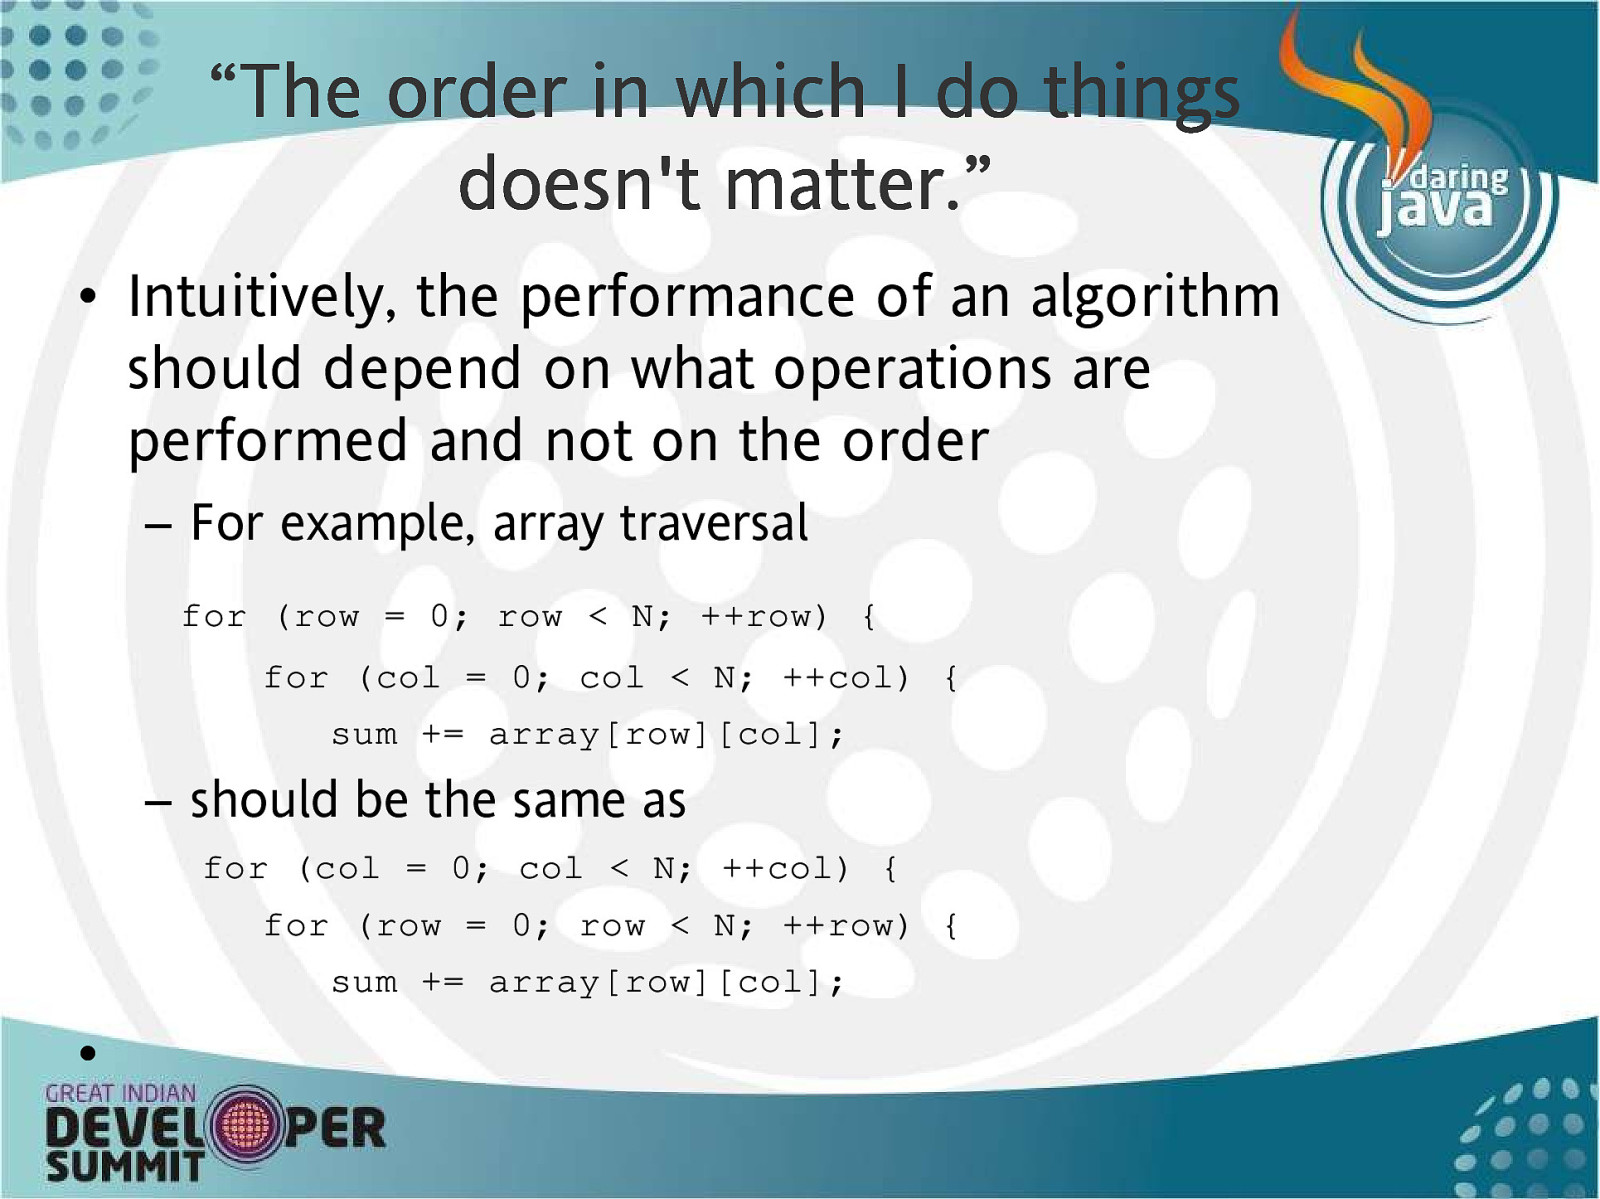
“The order in which I do things doesn’t matter.” • Intuitively, the performance of an algorithm should depend on what operations are performed and not on the order – For example, array traversal for (row = 0; row < N; ++row) { for (col = 0; col < N; ++col) { sum += array[row][col]; – should be the same as for (col = 0; col < N; ++col) { for (row = 0; row < N; ++row) { sum += array[row][col]; •
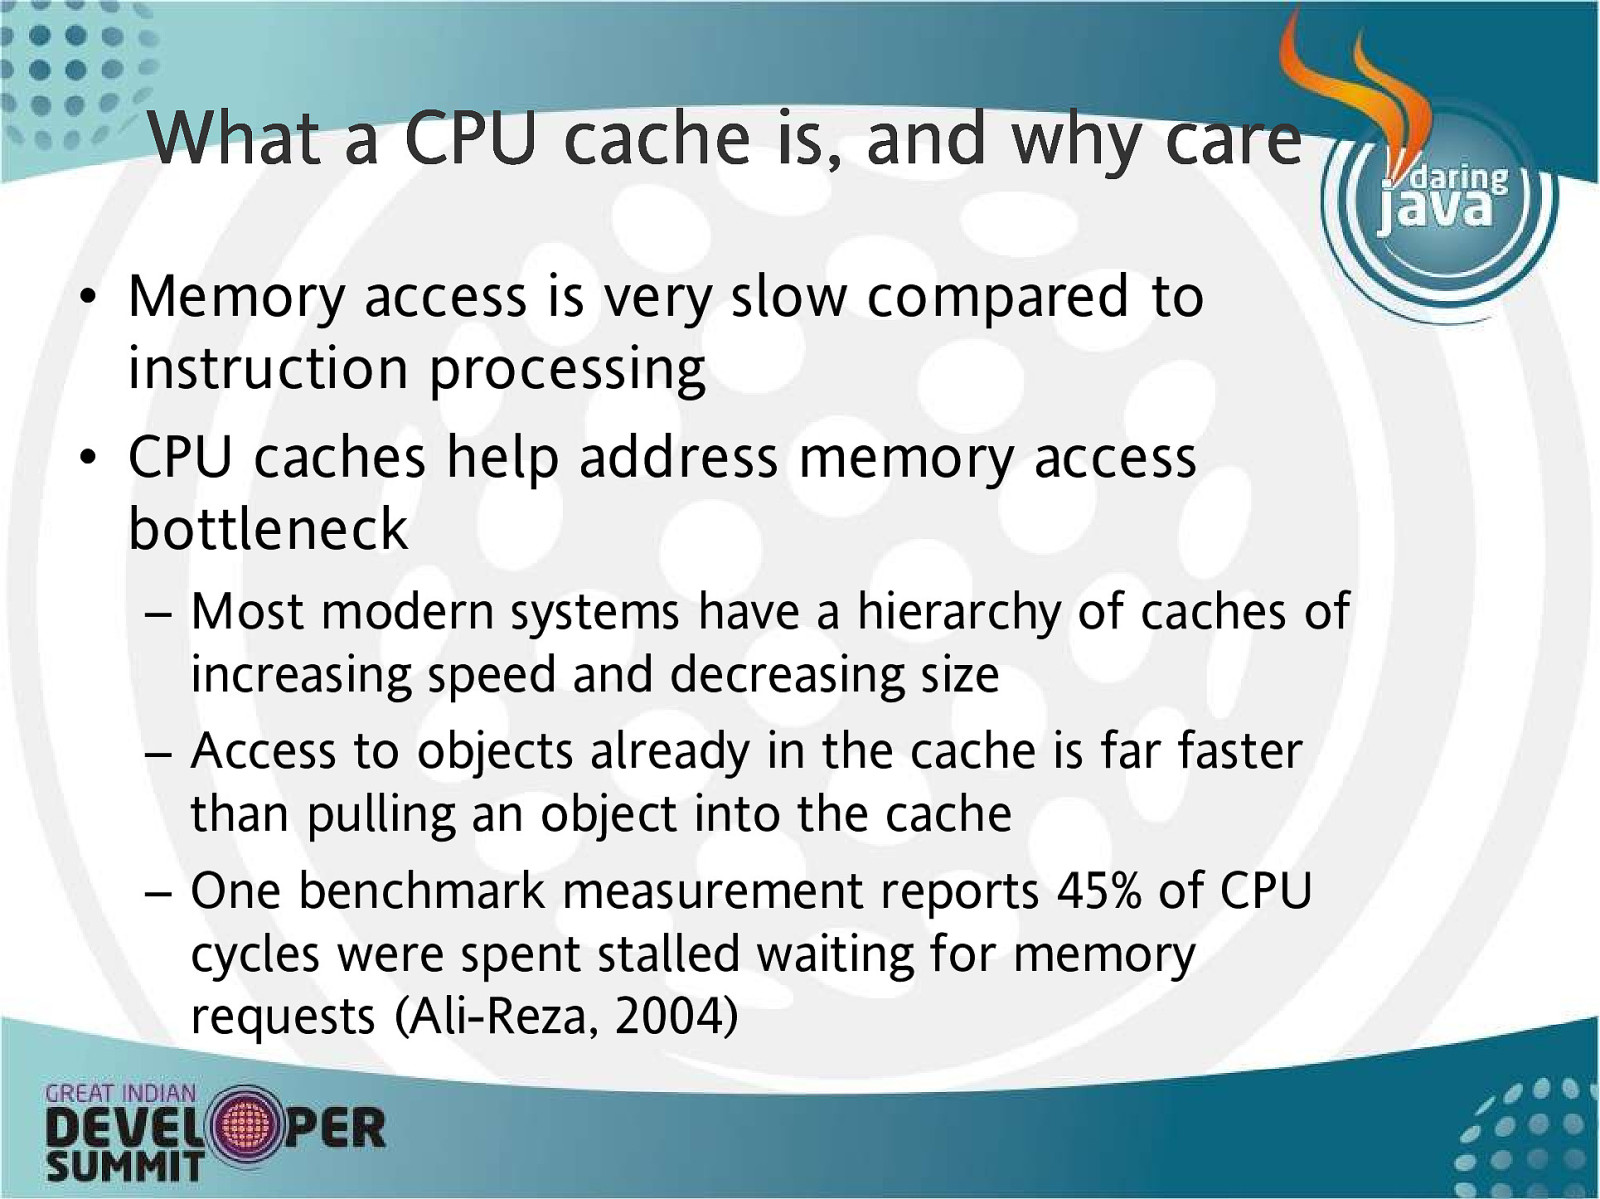
What a CPU cache is, and why care • Memory access is very slow compared to instruction processing • CPU caches help address memory access bottleneck – Most modern systems have a hierarchy of caches of increasing speed and decreasing size – Access to objects already in the cache is far faster than pulling an object into the cache – One benchmark measurement reports 45% of CPU cycles were spent stalled waiting for memory requests (Ali-Reza, 2004)
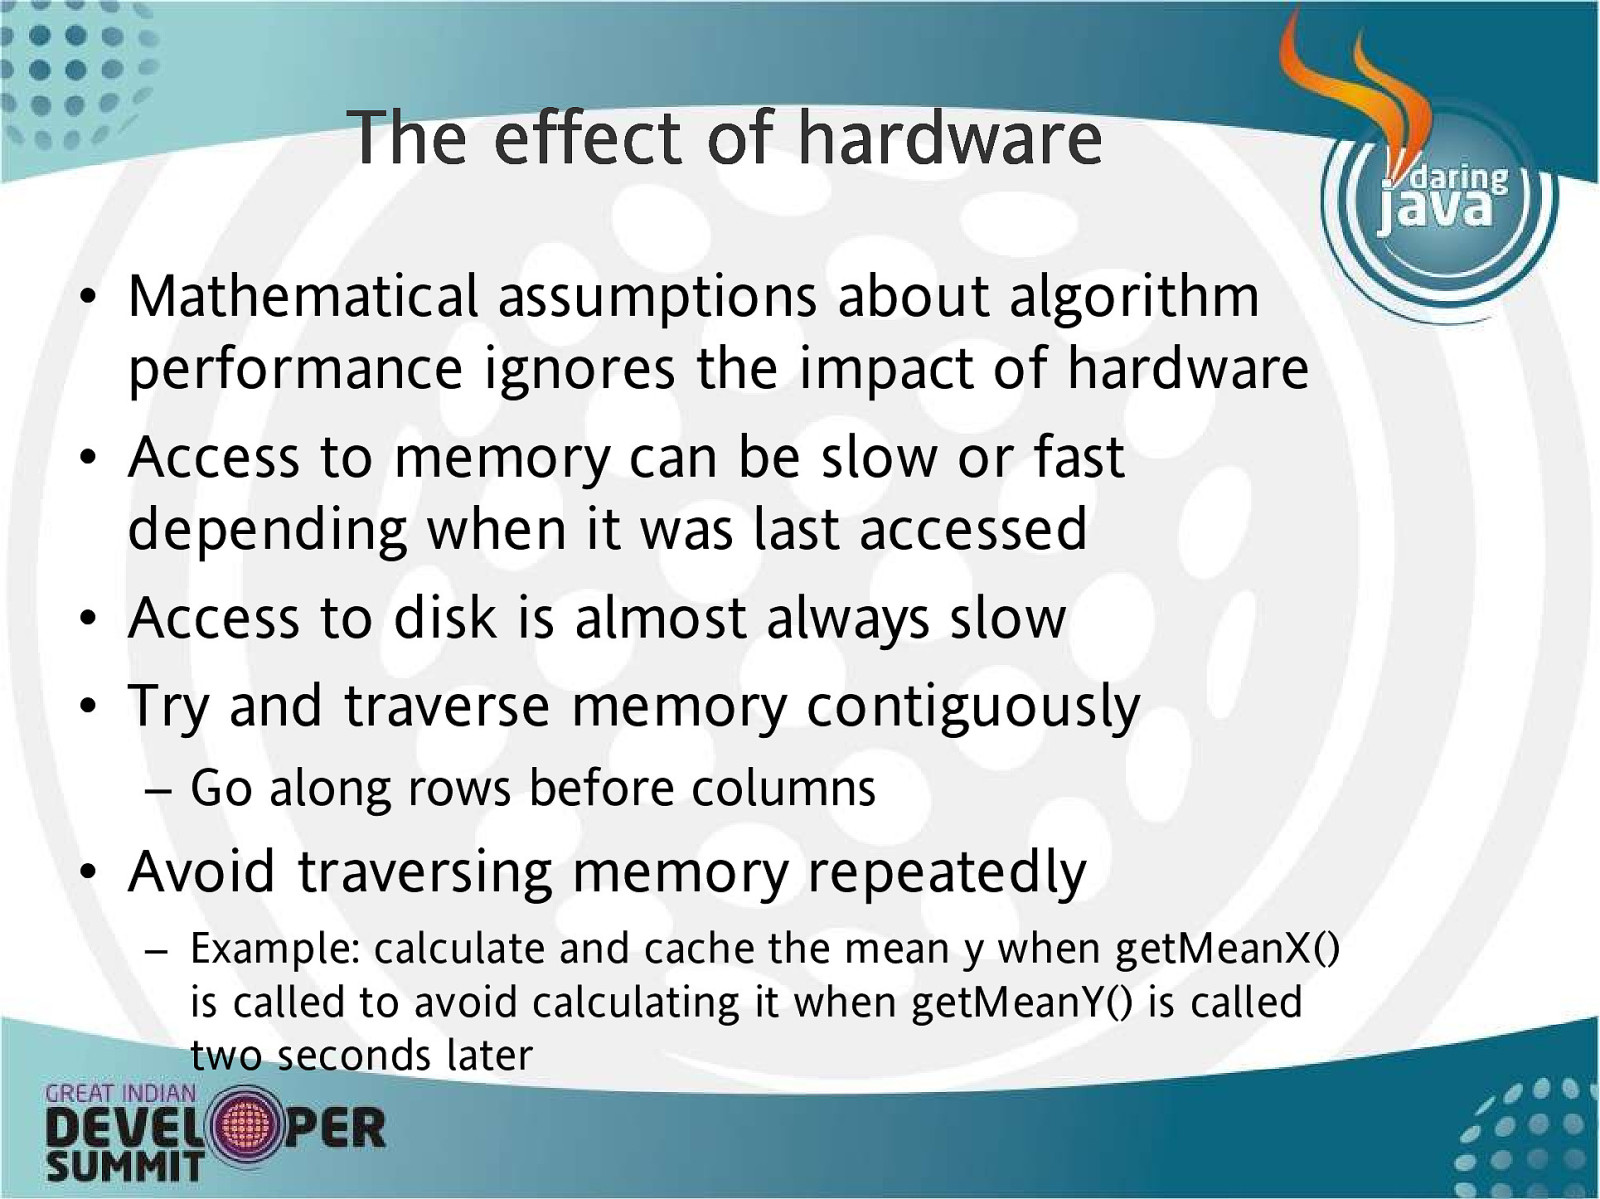
The effect of hardware • Mathematical assumptions about algorithm performance ignores the impact of hardware • Access to memory can be slow or fast depending when it was last accessed • Access to disk is almost always slow • Try and traverse memory contiguously – Go along rows before columns • Avoid traversing memory repeatedly – Example: calculate and cache the mean y when getMeanX() is called to avoid calculating it when getMeanY() is called two seconds later
Outline • • • • • Developing for performance Simple performance pitfalls Garbage collection Compilation Java performance
“Garbage collection is all about collecting garbage” • This is obviously true, isn’t it?
Garbage collection – not just about garbage • Garbage collection is a shorthand for “Memory management” – More than just reclaiming unused memory • Memory management includes – freeing memory – allocating memory – arranging memory • All of these are important and must be considered when choosing and tuning garbage collection policies
“My application would go so much faster without garbage collection” • Garbage collection pauses are easily identifiable pauses when the application is prevented from doing ‘real’ work • Garbage collection is often considered to be a necessary evil of Java in which performance is traded off against coding ease
GC can make applications go faster • GC can provide performance benefits – Faster freeing of memory – Faster memory allocation – Faster memory access • Demonstrated experimentally – Detlefs, Dosser, and Zorn (1994) added GC to C • Performance was 21% worse on average, but 9% better in the best case – Hertz and Berger (2005) took GC out of Java • Performance was the same or sometimes worse by up to 9%
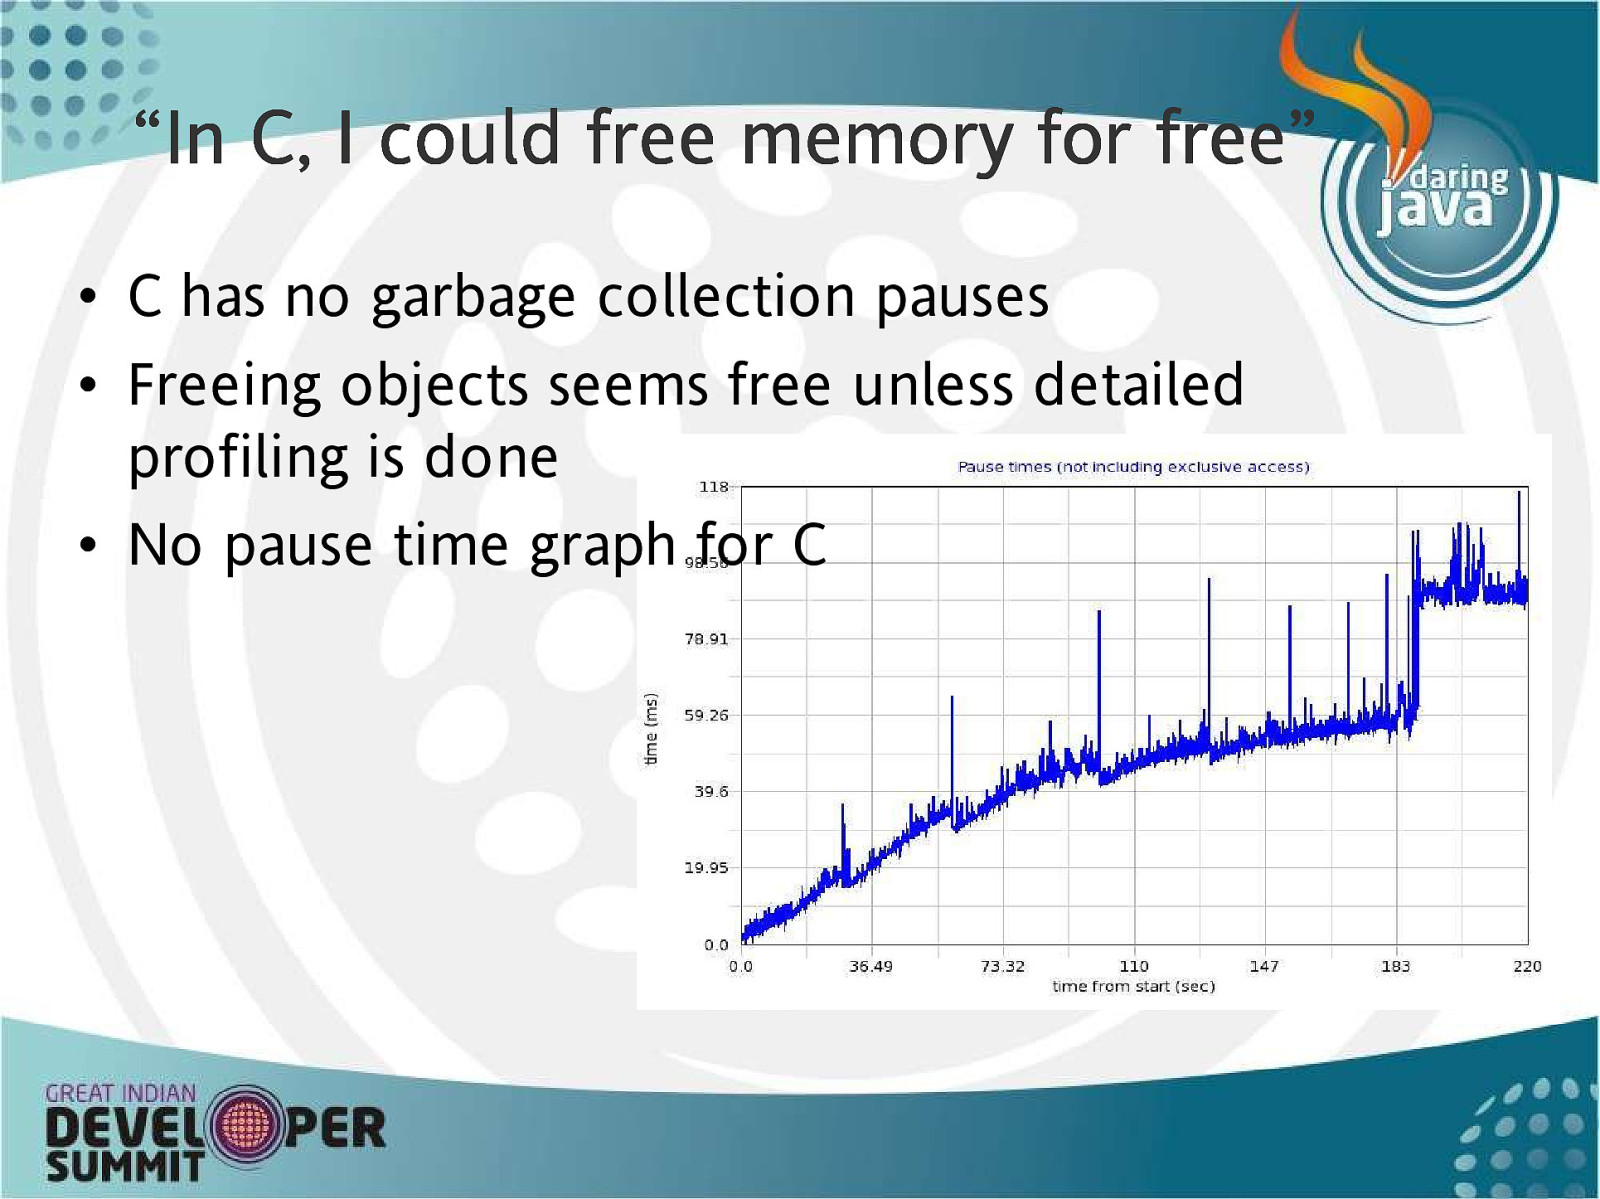
“In C, I could free memory for fr e e” fre • C has no garbage collection pauses • Freeing objects seems free unless detailed profiling is done • No pause time graph for C
Freeing memory manually • Even without garbage collection, freeing memory takes time – The cost of C free() calls ranges between a constant cost of 8 instructions per call and a variable cost with a mean of 113 instructions per object (Detlefs 1994) – The mean malloc/free overhead in C applications ranges between means of 7% and 20%, depending on the allocator. – For one application the overhead of malloc/free was 53%
Freeing memory automatically • Some garbage collectors can free memory much more quickly than free() can – When well tuned, the cost of freeing with a copying collector can be less than 1 instruction per object • The reason is that for some collectors freeing garbage is free and there is only a cost for objects which survive
Allocating memory • Allocating memory takes time • Allocating memory is particularly slow when – The heap is fragmented – Multiple threads are contending for allocation locks on the heap
GC means faster object allocation • Garbage collection can help with both of these problems – Fragmentation • Rearrange objects on contention to ensure no lengthy freelist searches are required – Contention • Batch-allocates chunks of heap to threads so they don’t have to go back to the central allocator for each new request (“thread local heaps”)
Accessing memory • Not all memory access is equally fast • Garbage collection can speed up memory access by rearranging objects in memory • Since memory access is one of the main things an application does, this can make a big performance difference
Locality • When an object is loaded into the cache its neighbours are also loaded into the cache • This makes relative positions of objects important to performance • Spatial locality describes how spatially close objects are to objects which are accessed at similar times • An application will go much faster if objects which tend to be accessed around the same time are located near one another
Improving locality • Locality can be improved by – Allocating in an unfragmented heap – Compacting the heap – Rearranging objects so they are near objects they reference • Garbage collection can help with all of these
Digression: Garbage collection strategies • Most JVMs provide several policies with different collection strategies • The default is not necessarily best in every circumstance • The strategies differ in the following: – When and how is the work done? – What happens to garbage? – How is the heap laid out?
When and how work is don e one • Stop-the-world – All application threads stopped during collection – Most efficient • Incremental – Collections are divided into smaller partial ones – Reduces application pauses • Concurrent – Collection appears to happen concurrently – Often very very finely divided incremental – Usually needs a brief stop-the-world pause to finish up
What happens to garbage • Free-list collectors – The heap is searched for unreachable objects which are added to a list of free space – New objects are allocated from the free list – When the heap becomes fragmented, it is compacted by rearranging objects • Copying collectors – Reachable objects are copied to fresh heap • What’s left is garbage, so collecting garbage is free! – Collecting non-garbage is not-free, especially for large objects
How the heap is laid out • Flat heap – Everything is in one unstructured area • Heap with large object area – Huge objects are kept away from normal objects • Large objects are expensive to allocate and compact • Generational – Divides the heap into generations • Younger generations are collected more frequently • If a copying collector is used, collecting the young generations is very fast since collecting dead objects is free
“I should try and minimise time spent in garbage collection” • Garbage collection does work and causes pauses and the pauses prevent applications from doing work so the shorter the pauses the better • Many books recommend looking at GC overhead and trying to reduce it
Re ported work and hidden work Rep • Two kinds of garbage collection work – Work done while the application is stopped – Work done concurrently with an application • Only the first kind is reported • Concurrent work still impacts the application – Most concurrent algorithms involve • Extra work, such as write barriers • Repeated work, when work is undone by application activity and needs redoing • Reported pause times are only a crude indicator of the actual garbage collection load
Mean pause and total pause • Mean pauses can be short even when the total pause is long, so looking at individual pauses is not enough – Shrinking the heap will generally shorten pause times – However, collection will have to happen much more frequently – The total time will be higher and the application performance will be worse
Pauses can make things go faster • Even if an application spends a lot of time paused for GC, performance may be better • Why? – Garbage collection is not just garbage collection! • Investing more time in collection can give big wins for allocation and access – Example: compacting the heap. • Collectors which compact the heap frequently give longer pauses, but allocation is much faster from a compacted heap and object access is also likely to be faster – Generational collectors usually have a higher overhead even when they give better performance
“Short pause times mean good response times.” • In some cases the application would go faster if we could tolerate long pauses, but response times are critical for my application so the shorter the pause times, the better off I will be
Re Ressponse times and pause times • Response times are not the same as pause times • The two are often confused, even in academic literature
Queues, Throughput and Response Times • Shop customers care how quickly they get done, not how long cashier’s breaks are – Alice takes long breaks to get coffee but works very quickly – Bob takes short breaks to yawn but works slowly • Which queue is better? – If the supermarket is empty and you’ve just got a basket, Bob is usually best – If the supermarket is busy or you have a big trolley • Alice will have a short queue • Bob will have a long queue because he is slow – Joining Bob’s queue will mean a long wait
Why is Bob Slow? • Bob could be slow for two reasons: • Mean pause time isn’t the same as total pause time – If Bob yawns between every item, he will spend most of his time not working even if each yawn only takes ten seconds – Efficiency when not paused – Bob only yawns as often as Alice goes for coffee – But he is sluggish and sleepy and takes one minute to scan each item – Alice has had lots of coffee and takes five seconds – Alice will spend a lot more time on break but get a lot more done
So, for garbage collection … ? • The application work is like the customers queueing in the supermarket • If an application has only a light workload, like an interactive application, shorter pauses will give better response times • If an application has a heavy workload the response time will be dominated by time in the queue for the CPU and so the higher throughput will give better mean response times
“I should help the garbage collector.” • Example: nulling out objects – Sometimes setting large objects to null when they’re no longer required can be beneficial – But … • If objects need to be nulled out it’s an indicator their scope is wrong • Using a finalizer to do the nulling is definitely not helpful to the garbage collector! – Yes, we’ve really seen this done as a performance ‘improvement’
Being normal • The best way to help the garbage collector is to code in a natural style • Garbage collection algorithms are heavily optimised for the most common scenarios – Therefore being normal is good! • Example: The weak generational hypothesis – Founding assumption for all generational collectors: • Most objects die young • Few links from young objects to old objects
“I should avoid generating garbage.” • If the garbage collector is a performance drain, and making garbage causes the collector to run more than it otherwise would, avoiding generating garbage seems like a good idea. • This leads to object pooling – Object pooling is preserving and re-using object instances
Object pools: the hidden costs • Extra implementation work • Even more work required to count references and make sure objects are not prematurely reused – If this isn’t done right then application behaviour can be very incorrect indeed • Badly tuned pool sizes cause unused instances to hang around (a memory leak)
Object pools are not No Norrmal • Object pools totally break the weak generational hypothesis – Pools force objects to live much longer than their natural lifespan – Copying these objects is a big performance cost – (But freeing and allocating them would have been almost free) • Object pools are unwise if the only resource used by the pooled objects is memory
Outline • • • • • Developing for performance Simple performance pitfalls Garbage collection Compilation Java performance
“I should compile ahead-of-time” • Compiled languages run faster than interpreted languages • The JIT can take some time to compile methods to the optimum level • The JIT can introduce some delays while compiling • Easy to assume that platform portability is the only reason to avoid pre-compiling
The power of dynamic compilation • Dynamic compilation can make optimisations not possible with static compilers – Which branch is likely to be taken – Whether an interface has multiple possible implementations – etc. • Dynamic compilers can make optimisations for the exact machine you’re running on – Example: Not all x86 machines are the same – Dynamic compilation can take advantage of machine-specific features
Dynamism allows con ditional ond optimisations • Dynamic compilers can back out optimisations if they become invalid – Example: if an interface only has one implementation it can be invoked much more quickly • If another class which implements that interface is loaded, affected code can be recompiled – Example: code can be inlined (much faster to run) even if a method isn’t declared final • If another class which subclasses the inlined method is loaded, the method can be de-inlined
Outline • • • • • Developing for performance Simple performance pitfalls Garbage collection Compilation Java performance
“Java is slow.” • Common perception that Java trades speed for safety – C++ applications start faster – Comparisons based on micro-benchmarks favour C • Premise is that less low-level control always means worse performance
Java is actually very fa fasst • Java used to be slow – Then the JIT happened • Micro-benchmarks are meaningless for general performance discussions of large scale systems • The JVM can do some very smart things with the control you give it • Just-In-Time compilation can produce more optimum code than pre-compiled code • Garbage collection can make applications run faster than manual memory management
Conclusions • Java performance is complex – Java technology changes and machine technology changes, so advice which was good five years ago may be terrible now – Java’s dynamism means micro-benchmarks are very poor predictors of enterprise application performance – The effect of garbage collection is much broader than just the pauses in verbose GC – Clear elegant code is likely to make sense to the VM (as well as you!) and run very well
F i n al l y … • We’ve covered a lot of myths! • You don’t need to memorize each one • When thinking about performance, focus on the behaviour of your actual application – Don’t get distracted by following ‘best practices’ (which may be outdated or just wrong) unless you can see a real benefit – Don’t be obsessed by ‘performance metrics’ like GC overhead since they may not be correlated to application performance
The following terms are trademarks of International Business Machines Corporation in the United States, other countries, or both: – IBM – z/OS – PowerPC – WebSphere Java and all Java-based trademarks are trademarks of Sun Microsystems, Inc. in the United States, other countries, or both. Solaris is a trademark of Sun Microsystems, Inc. Intel is a trademarks of Intel Corporation or its subsidiaries in the United States, other countries, or both

Any questions?