tradeoffs, bad science, and polar bears: the world of java optimisation Holly Cummins IBM @holly_cummins

tradeoffs, bad science, and polar bears: the world of java optimisation Holly Cummins IBM @holly_cummins
pulse check hi! have you tried optimising your code? #IBM @holly_cummins

why optimise? #IBM @holly_cummins

why optimise? #IBM @holly_cummins

0.5s extra search page time why optimise? #IBM @holly_cummins
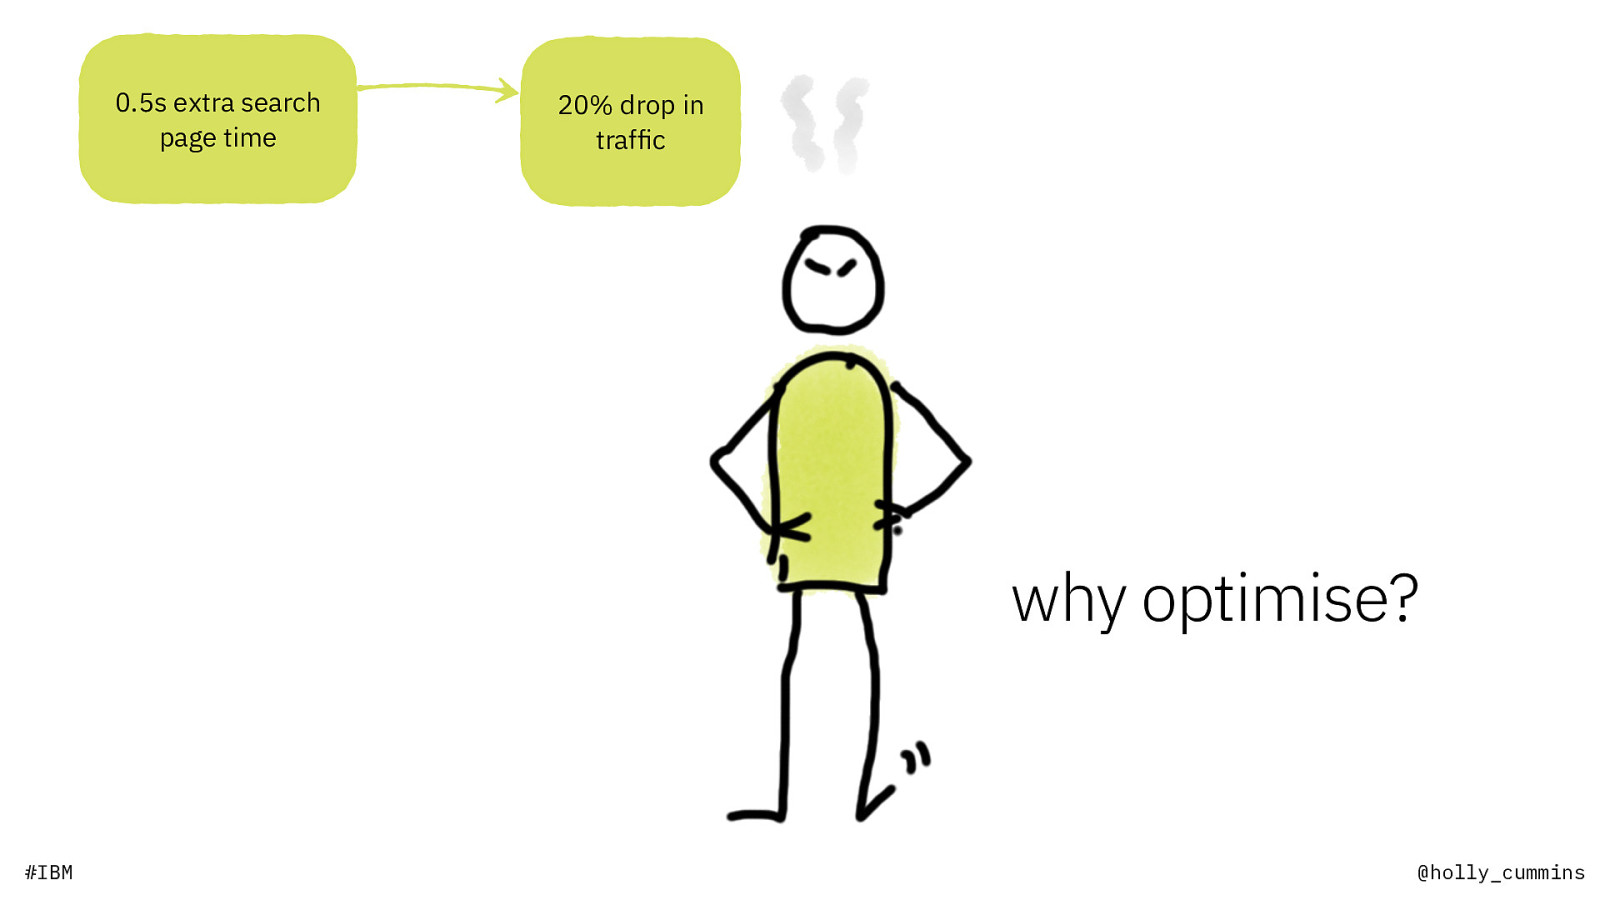
0.5s extra search page time 20% drop in traf c why optimise? fi #IBM @holly_cummins
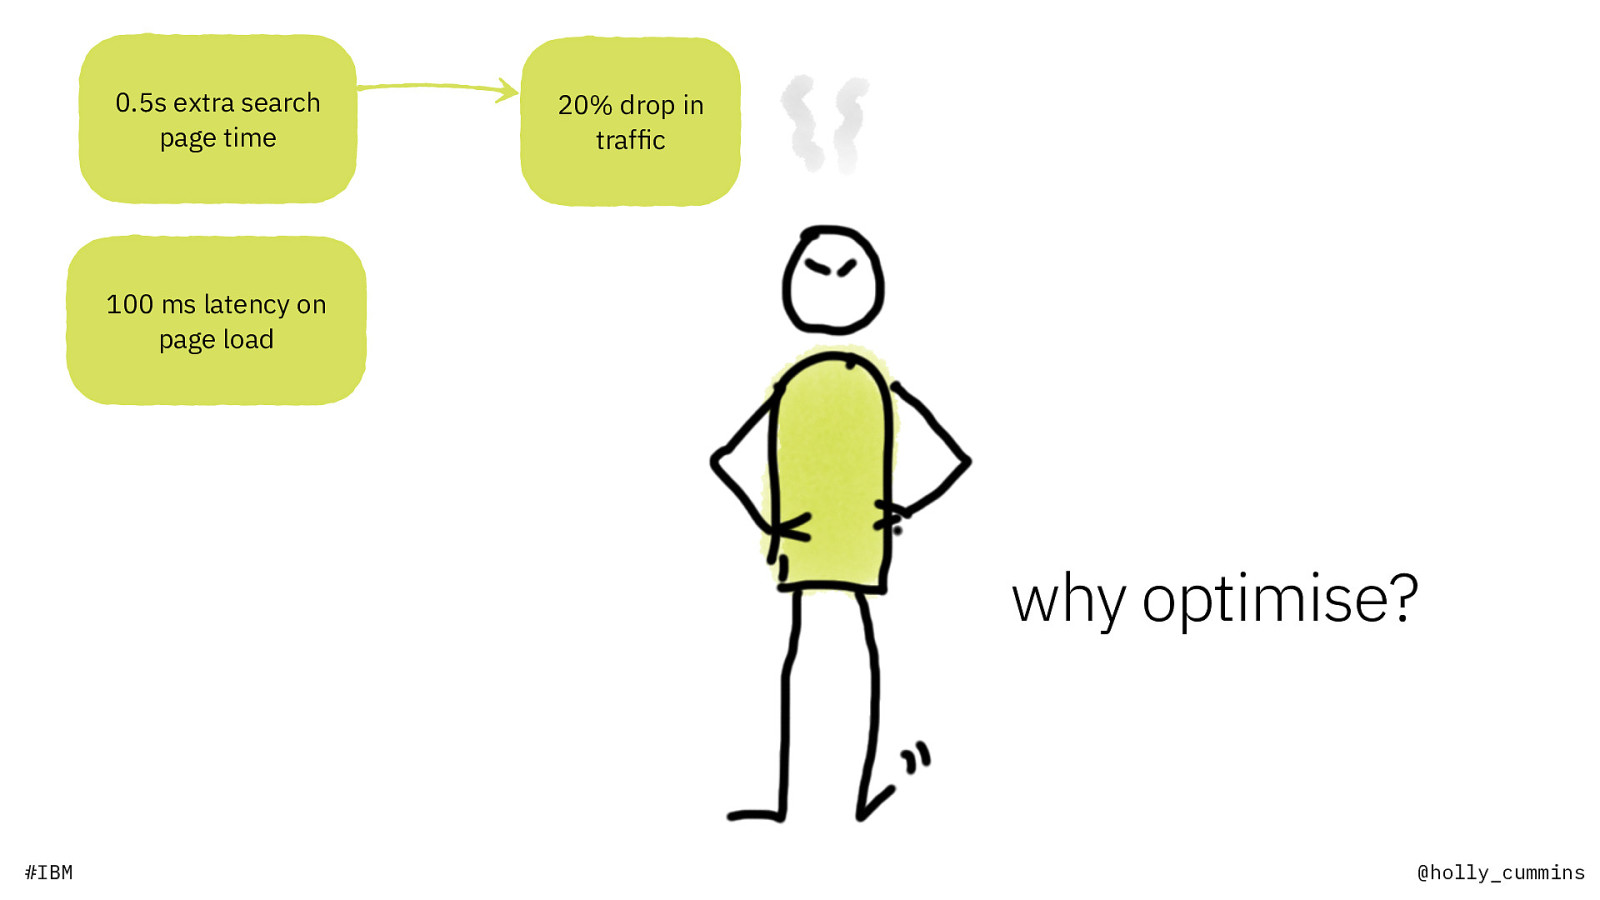
0.5s extra search page time 20% drop in traf c 100 ms latency on page load why optimise? fi #IBM @holly_cummins
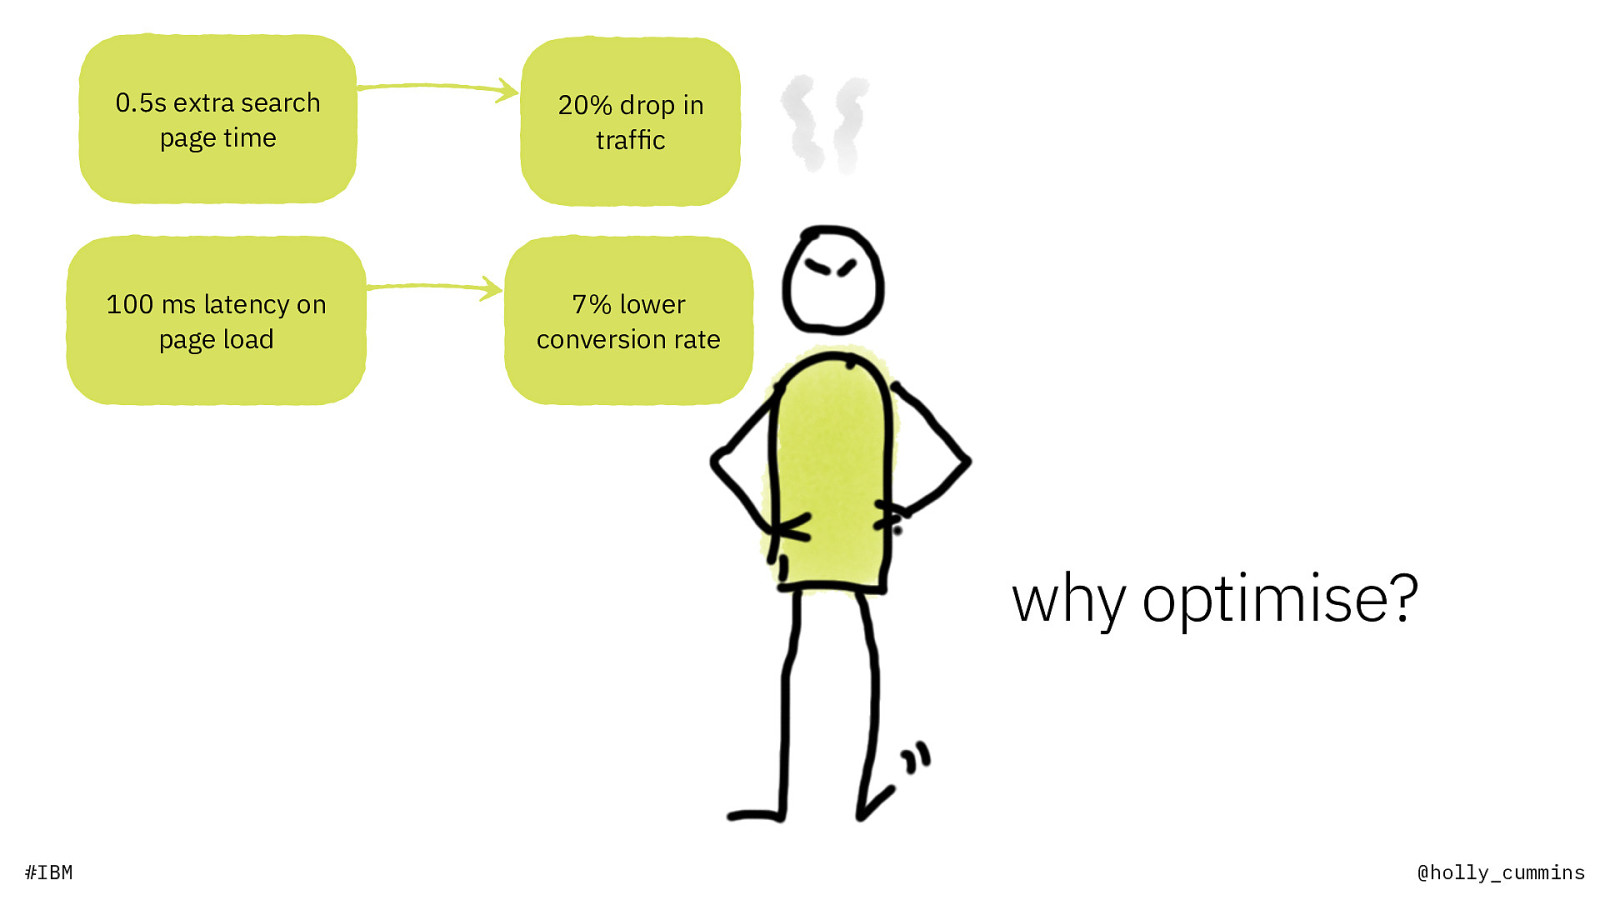
0.5s extra search page time 20% drop in traf c 100 ms latency on page load 7% lower conversion rate why optimise? fi #IBM @holly_cummins
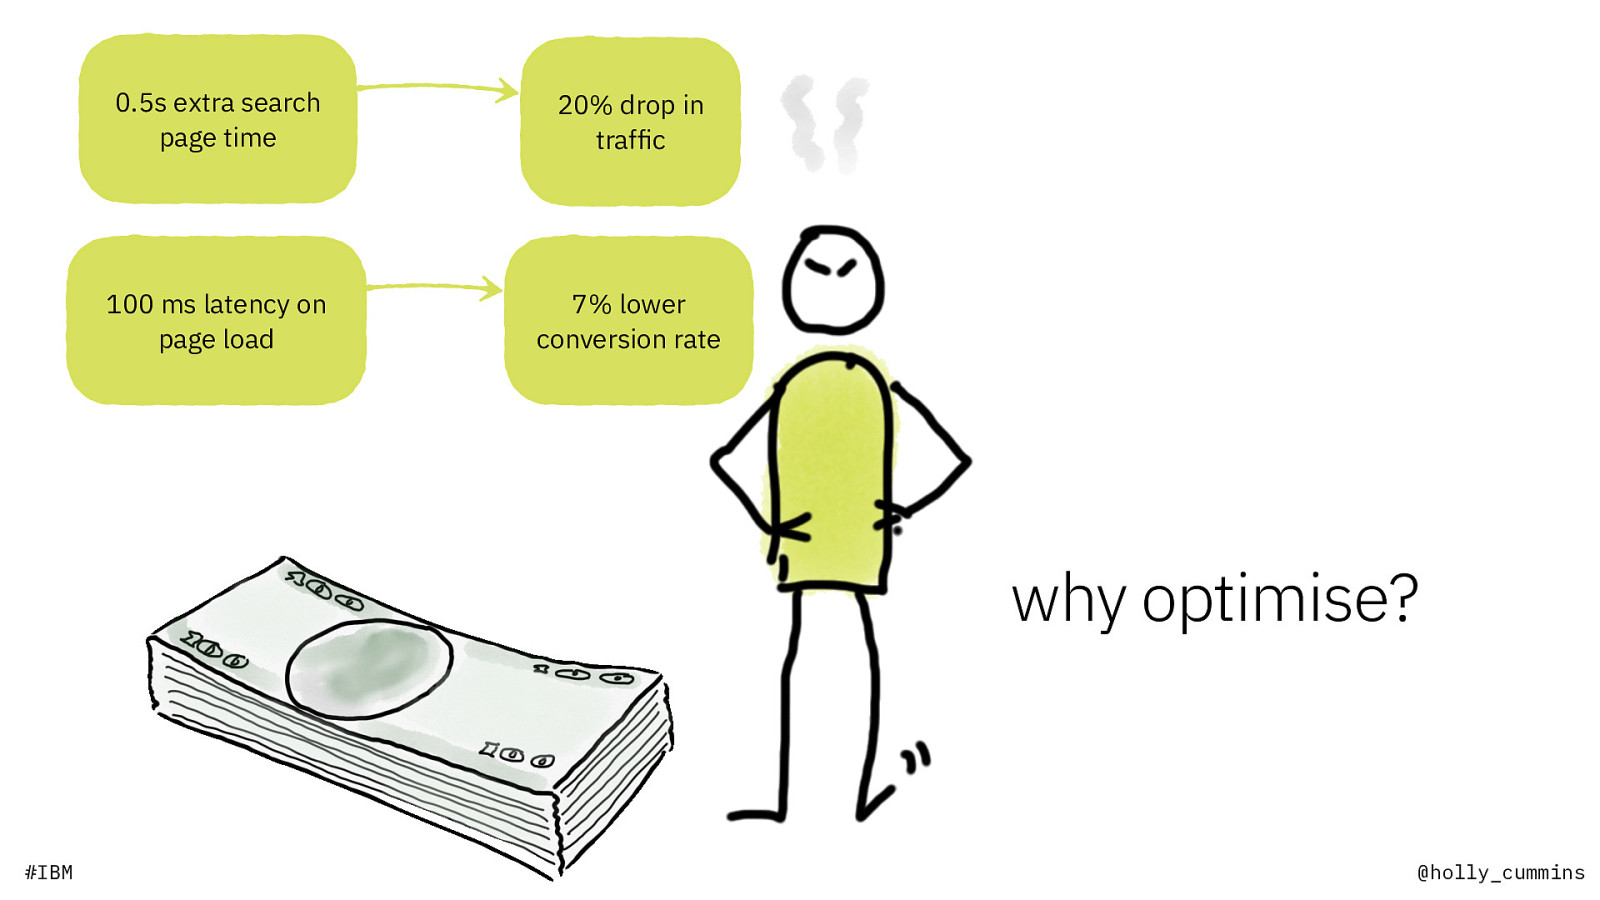
0.5s extra search page time 20% drop in traf c 100 ms latency on page load 7% lower conversion rate why optimise? fi #IBM @holly_cummins
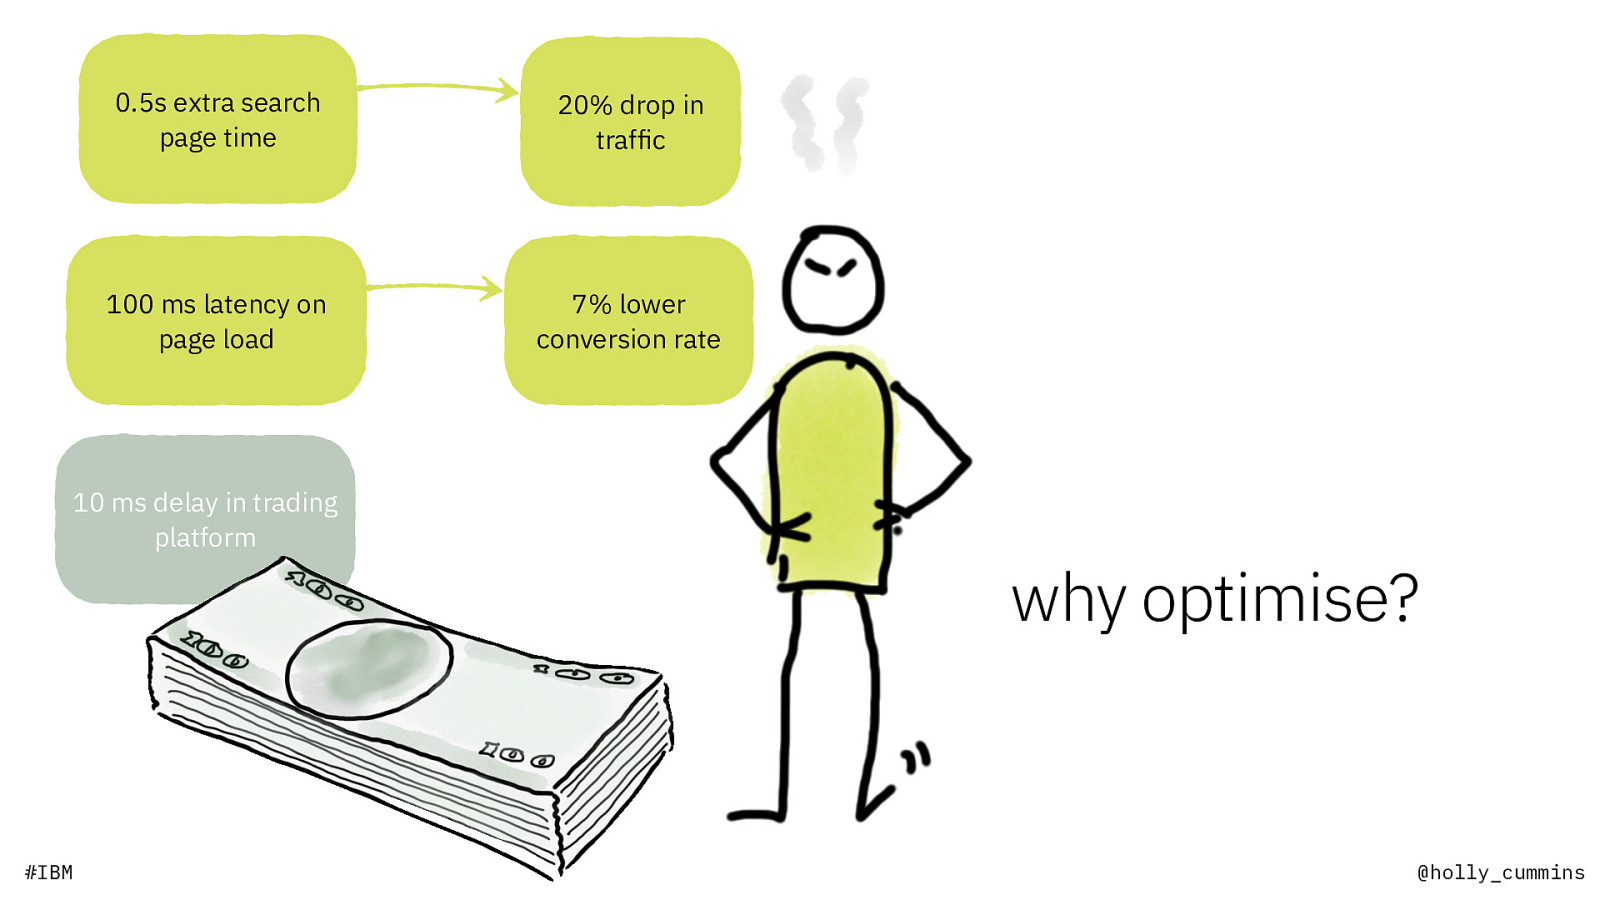
0.5s extra search page time 20% drop in traf c 100 ms latency on page load 7% lower conversion rate 10 ms delay in trading platform fi #IBM why optimise? @holly_cummins
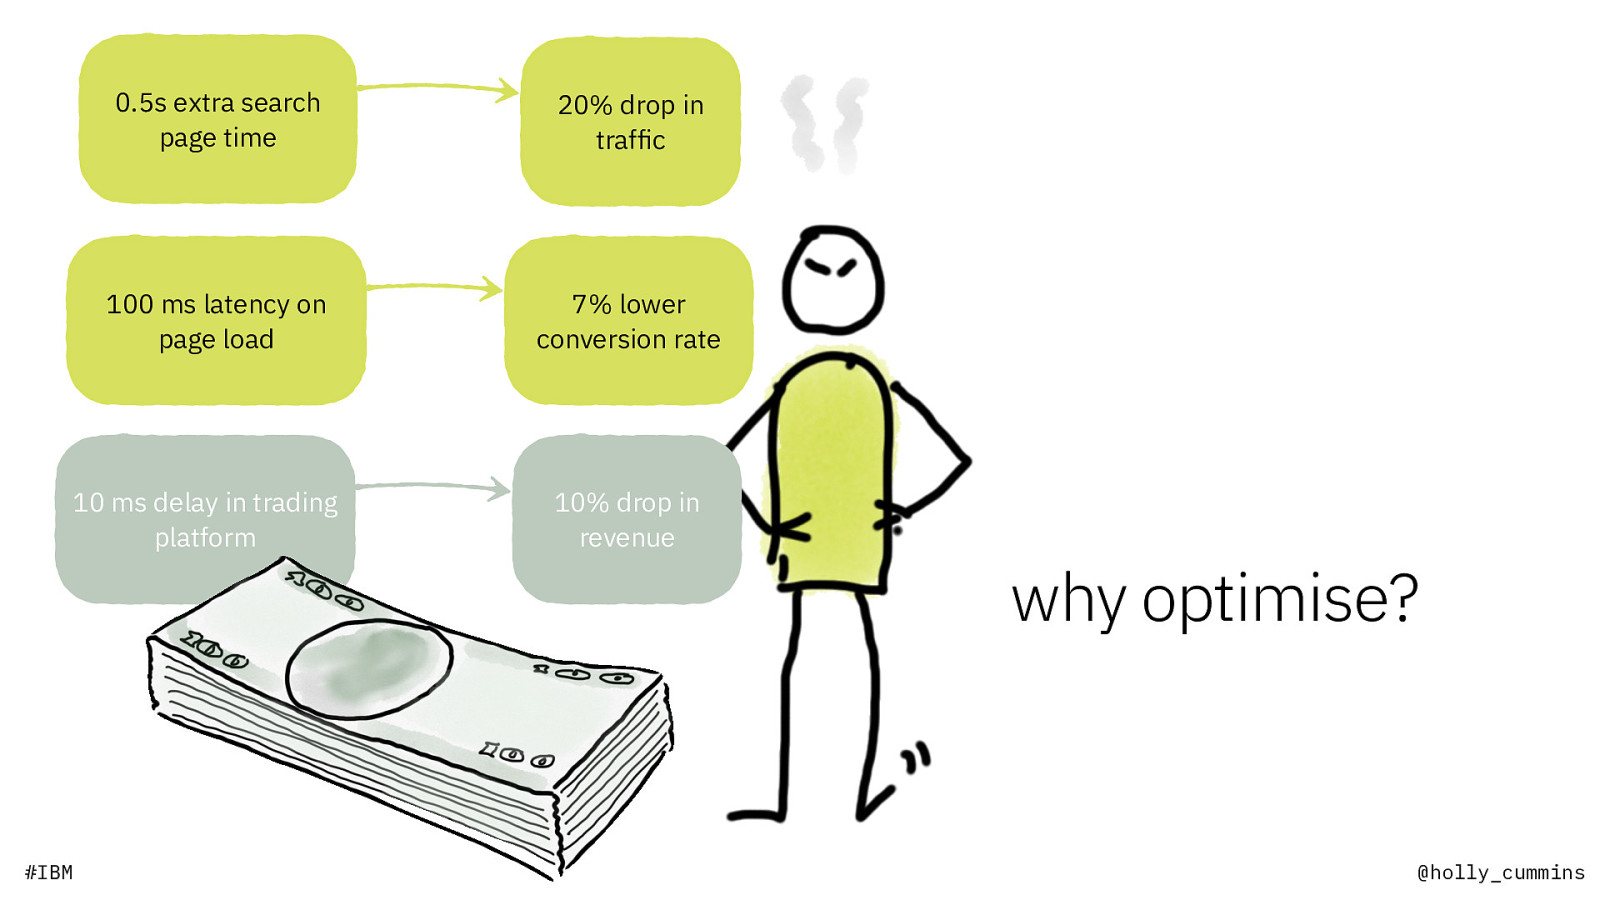
0.5s extra search page time 20% drop in traf c 100 ms latency on page load 7% lower conversion rate 10 ms delay in trading platform fi #IBM 10% drop in revenue why optimise? @holly_cummins

what is optimising? #IBM @holly_cummins
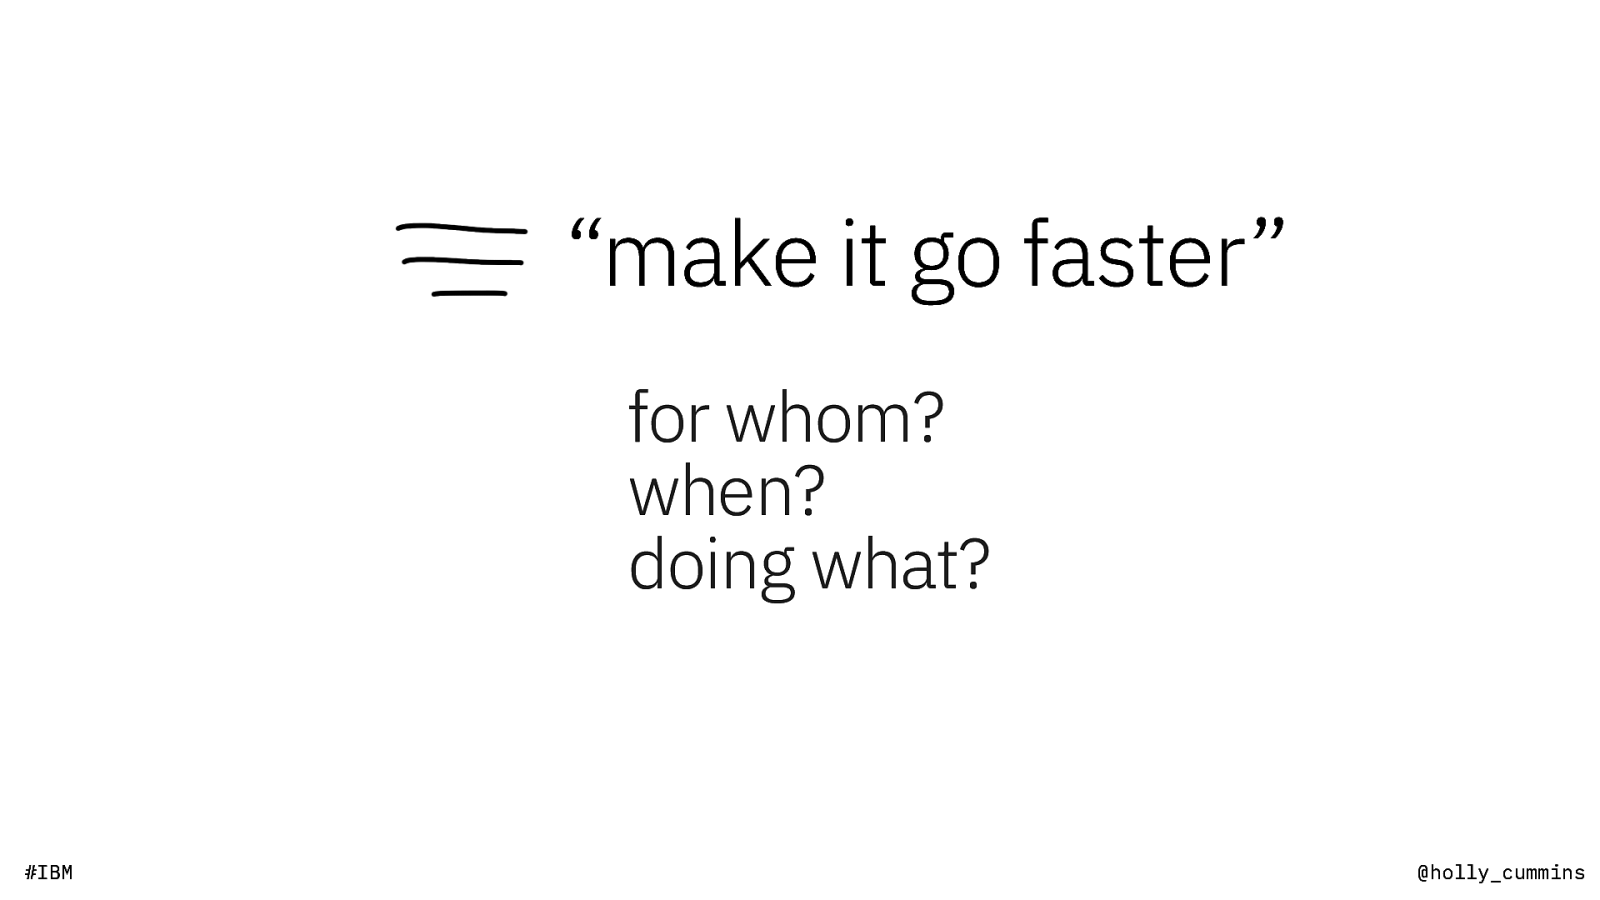
“make it go faster” for whom? when? doing what? #IBM @holly_cummins

design thinking #IBM @holly_cummins

#IBM @holly_cummins

performance can be: #IBM @holly_cummins
performance can be: throughput #IBM @holly_cummins

performance can be: throughput #IBM transactions per second @holly_cummins
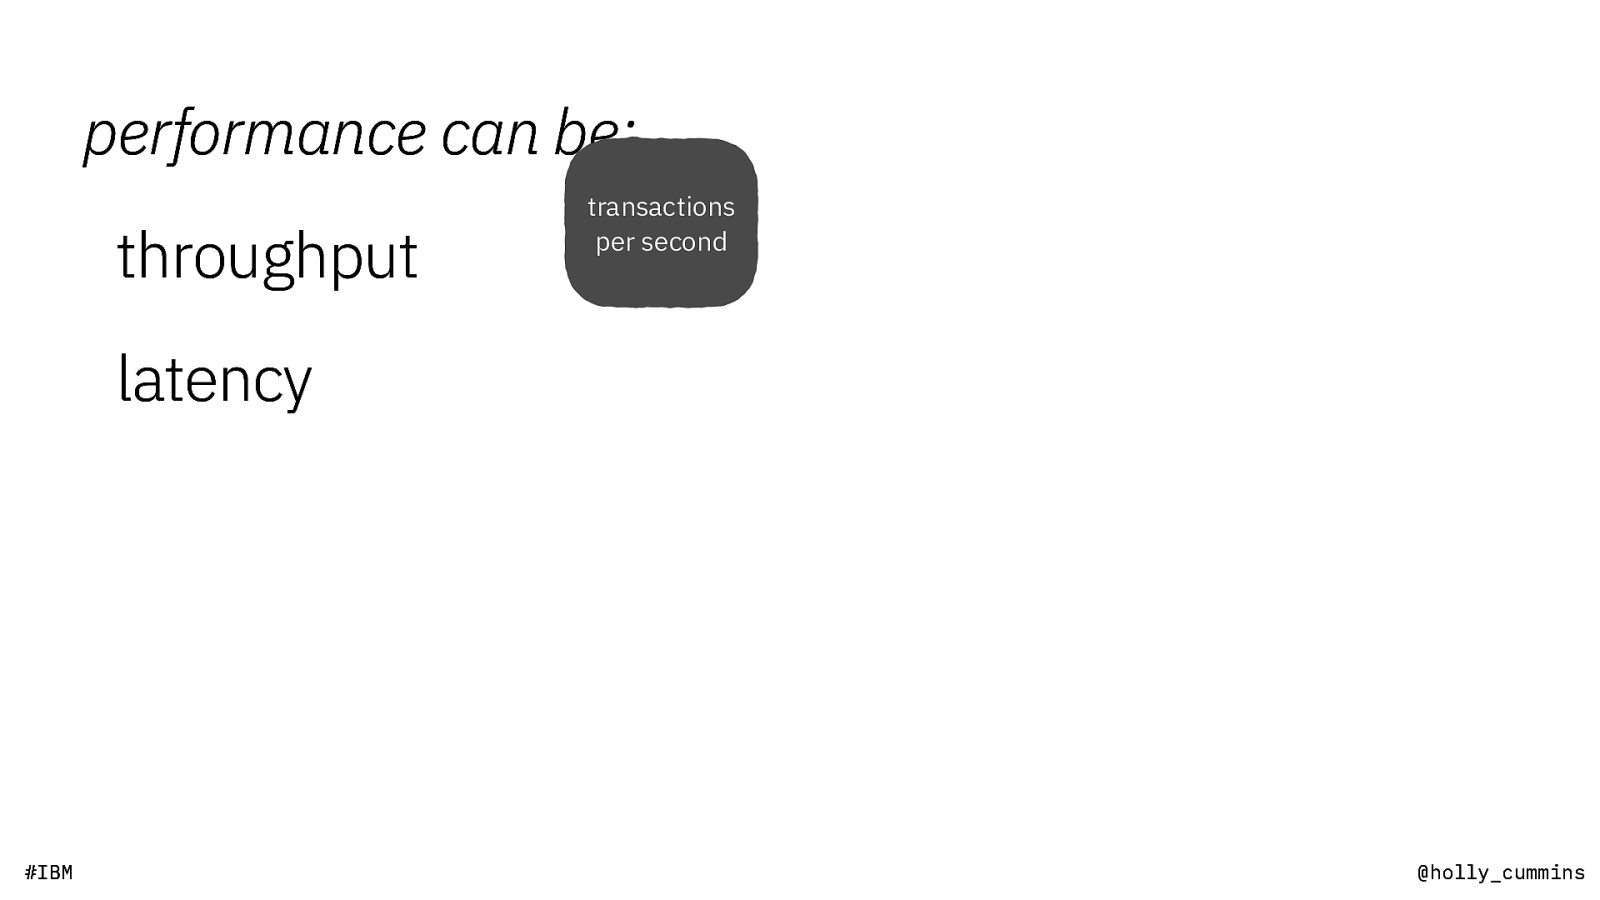
performance can be: throughput transactions per second latency #IBM @holly_cummins

performance can be: throughput latency #IBM transactions per second start-up time @holly_cummins

performance can be: transactions per second throughput latency #IBM response time start-up time @holly_cummins

performance can be: transactions per second throughput latency #IBM response time ramp-up time start-up time @holly_cummins

performance can be: transactions per second throughput latency response time ramp-up time start-up time capacity #IBM @holly_cummins
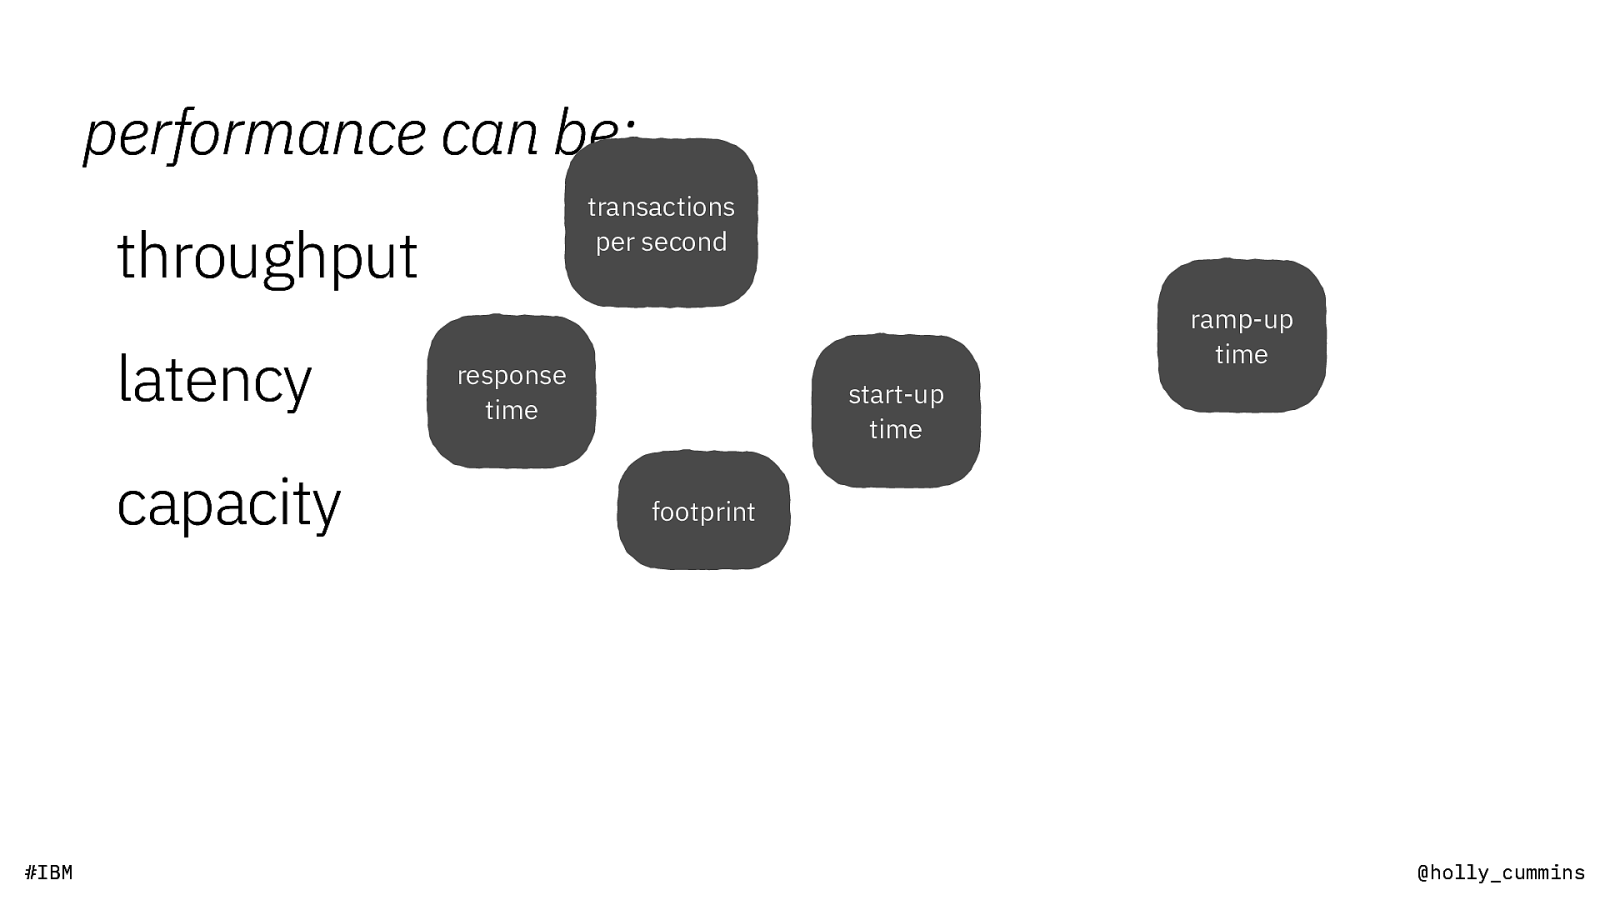
performance can be: transactions per second throughput latency capacity #IBM ramp-up time response time start-up time footprint @holly_cummins

performance can be: transactions per second throughput latency capacity ramp-up time response time start-up time footprint CPU usage #IBM @holly_cummins
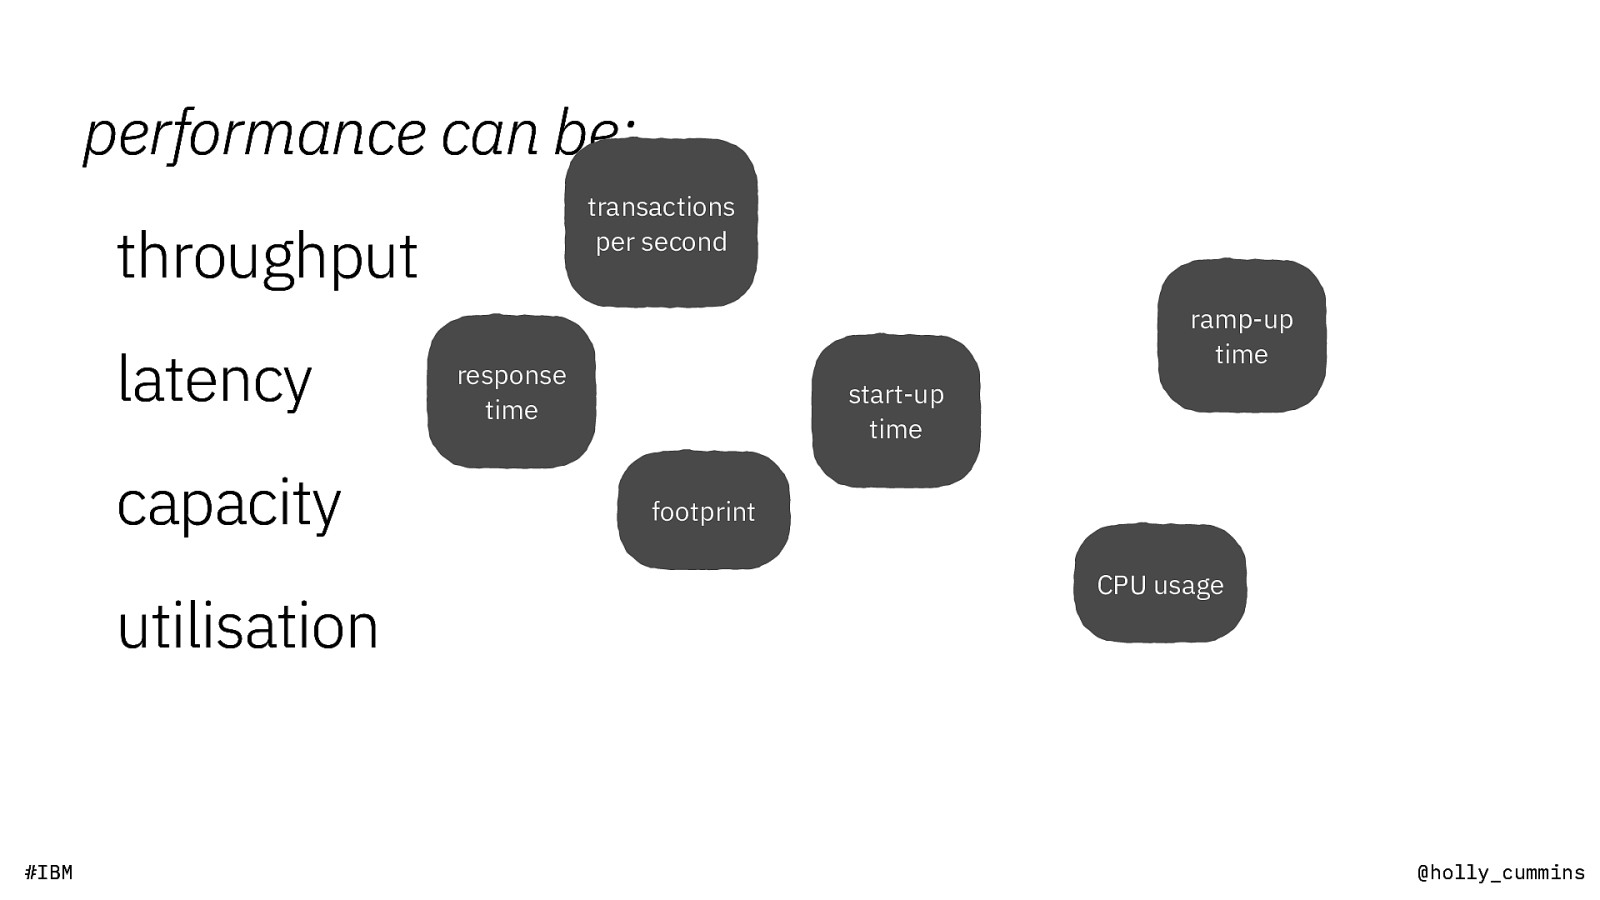
performance can be: transactions per second throughput latency capacity utilisation #IBM ramp-up time response time start-up time footprint CPU usage @holly_cummins

performance can be: transactions per second throughput latency capacity utilisation ramp-up time response time start-up time footprint CPU usage … #IBM @holly_cummins
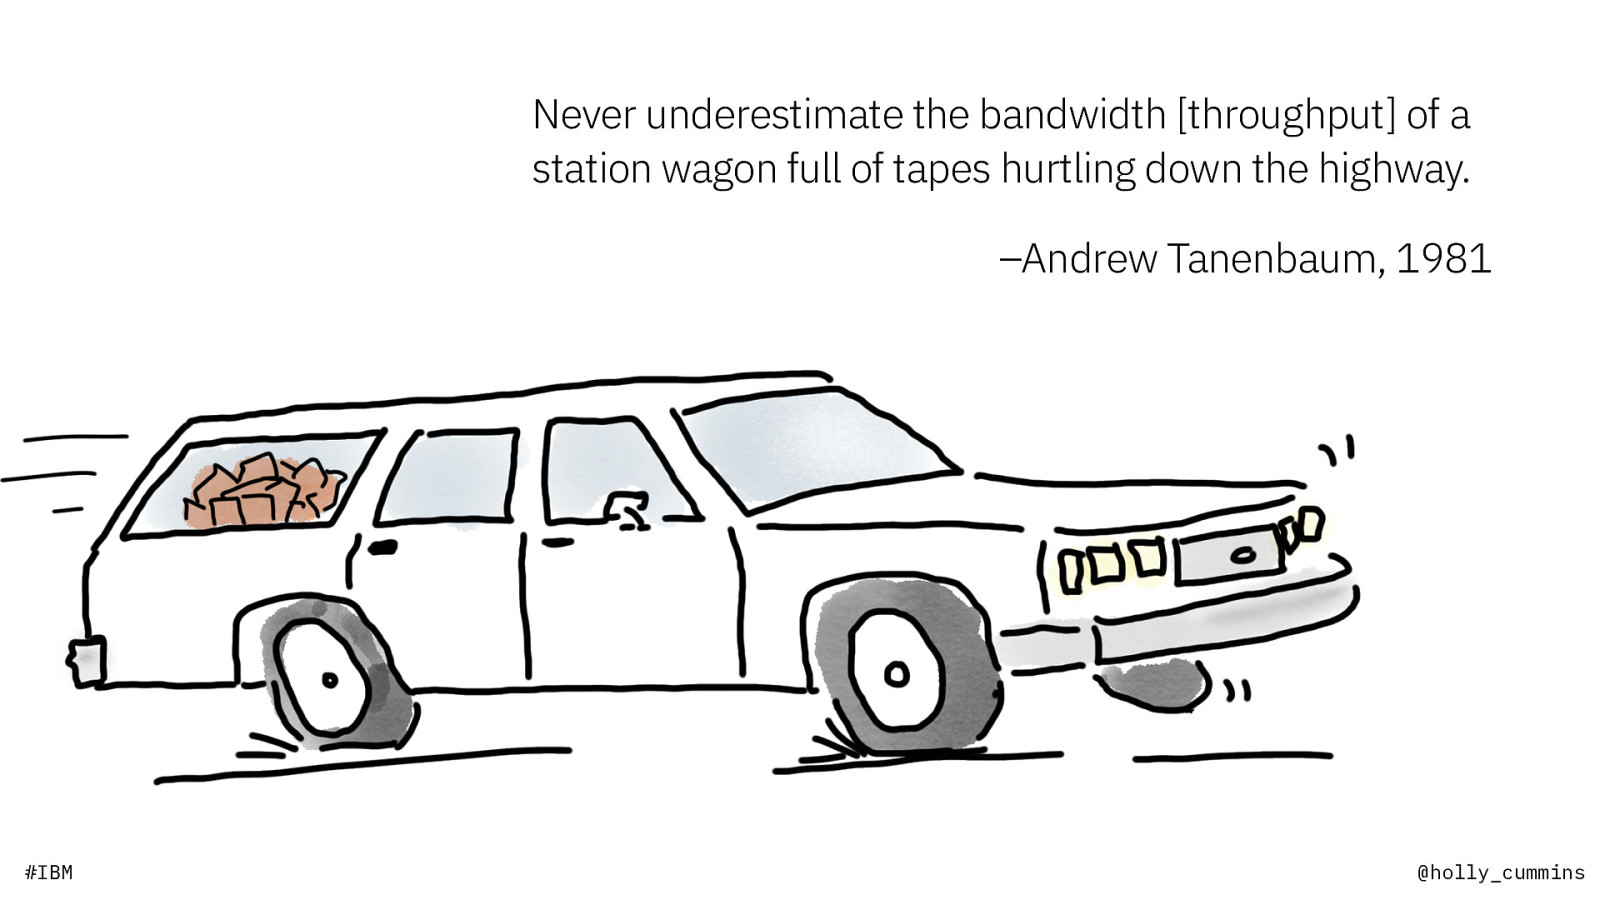
Never underestimate the bandwidth [throughput] of a station wagon full of tapes hurtling down the highway. –Andrew Tanenbaum, 1981 #IBM @holly_cummins
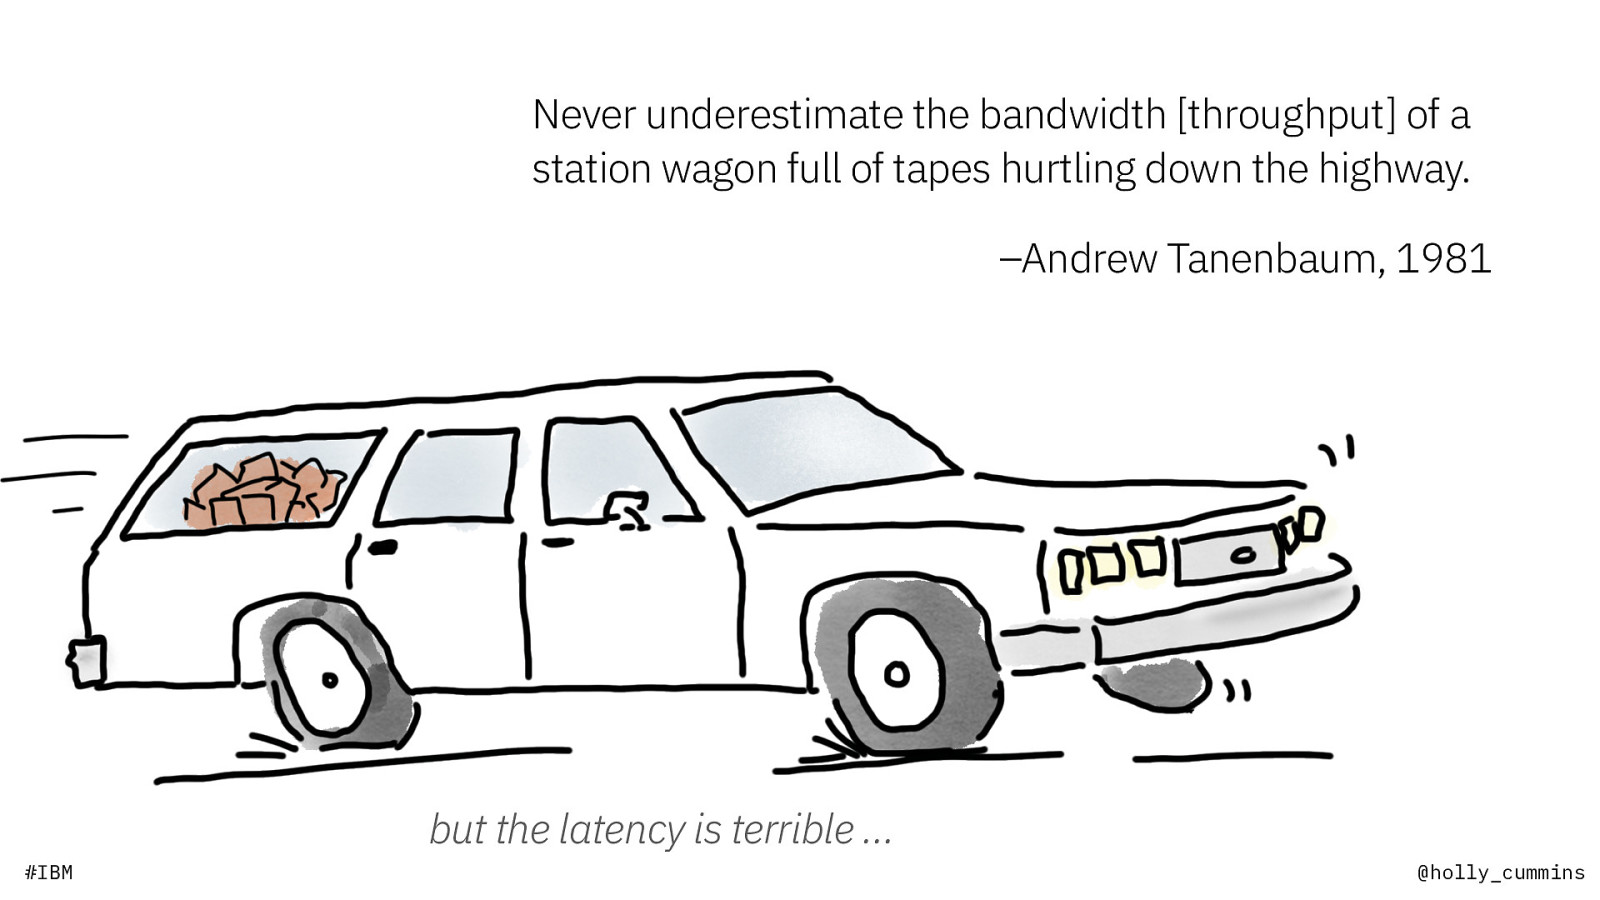
Never underestimate the bandwidth [throughput] of a station wagon full of tapes hurtling down the highway. –Andrew Tanenbaum, 1981 but the latency is terrible … #IBM @holly_cummins

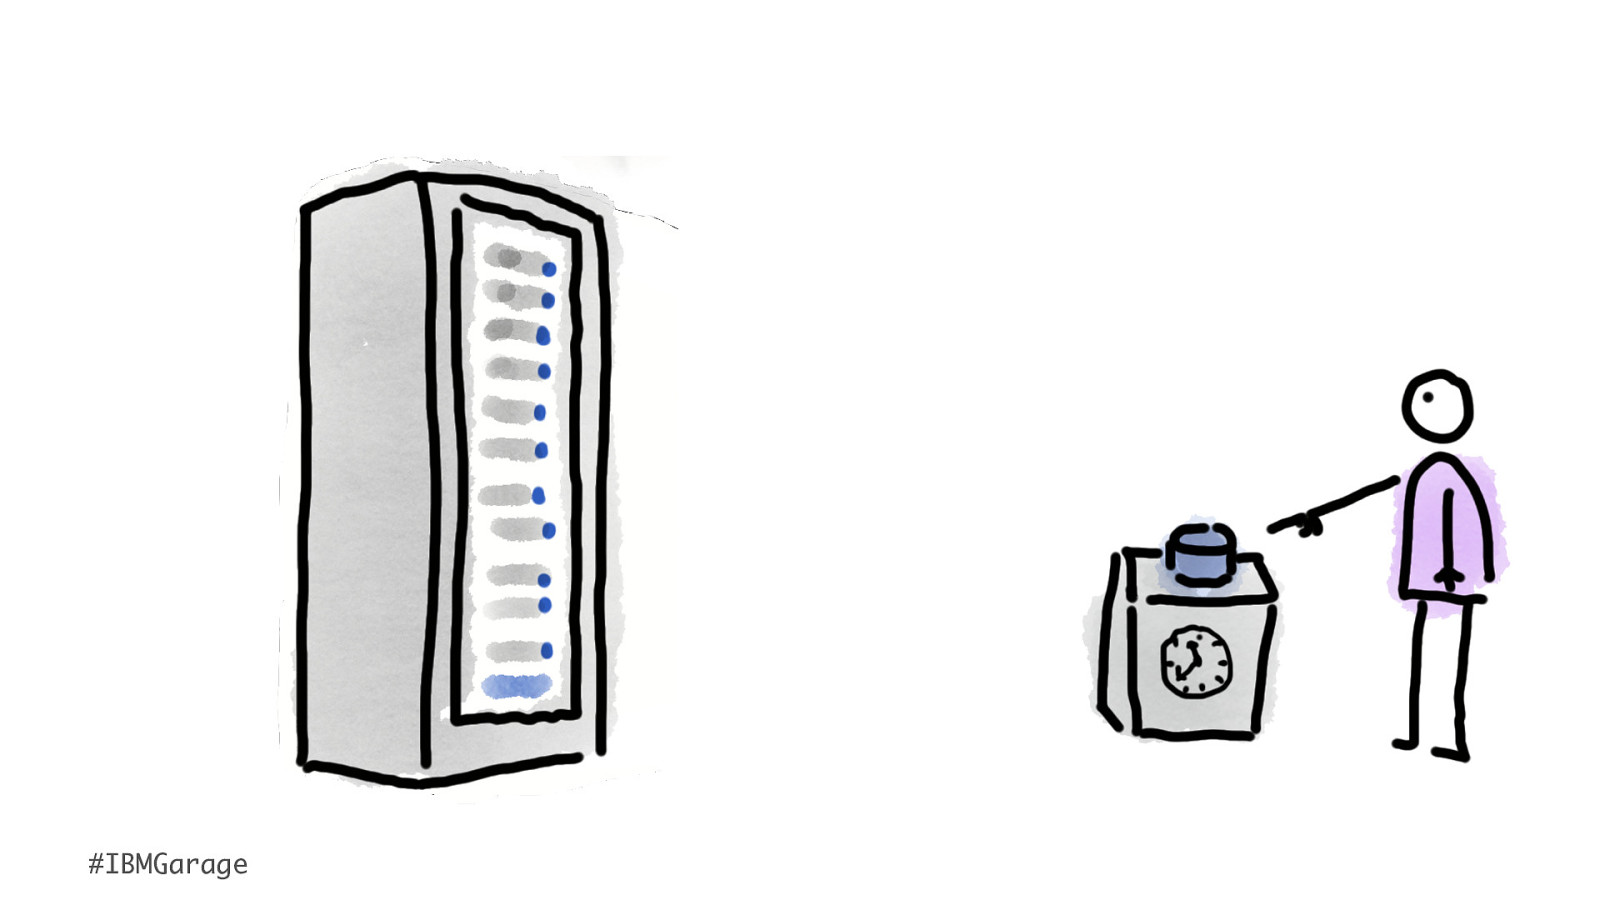
requirements change #IBMGarage @holly_cummins

#IBMGarage @holly_cummins
#IBMGarage @holly_cummins

#IBMGarage @holly_cummins

#IBMGarage @holly_cummins

I am not designed for this. #IBMGarage @holly_cummins

the world changes #IBMGarage @holly_cummins

#IBM @holly_cummins

-Xmx == $ #IBM @holly_cummins
-Xmx == $ footprint #IBM @holly_cummins
#IBM @holly_cummins

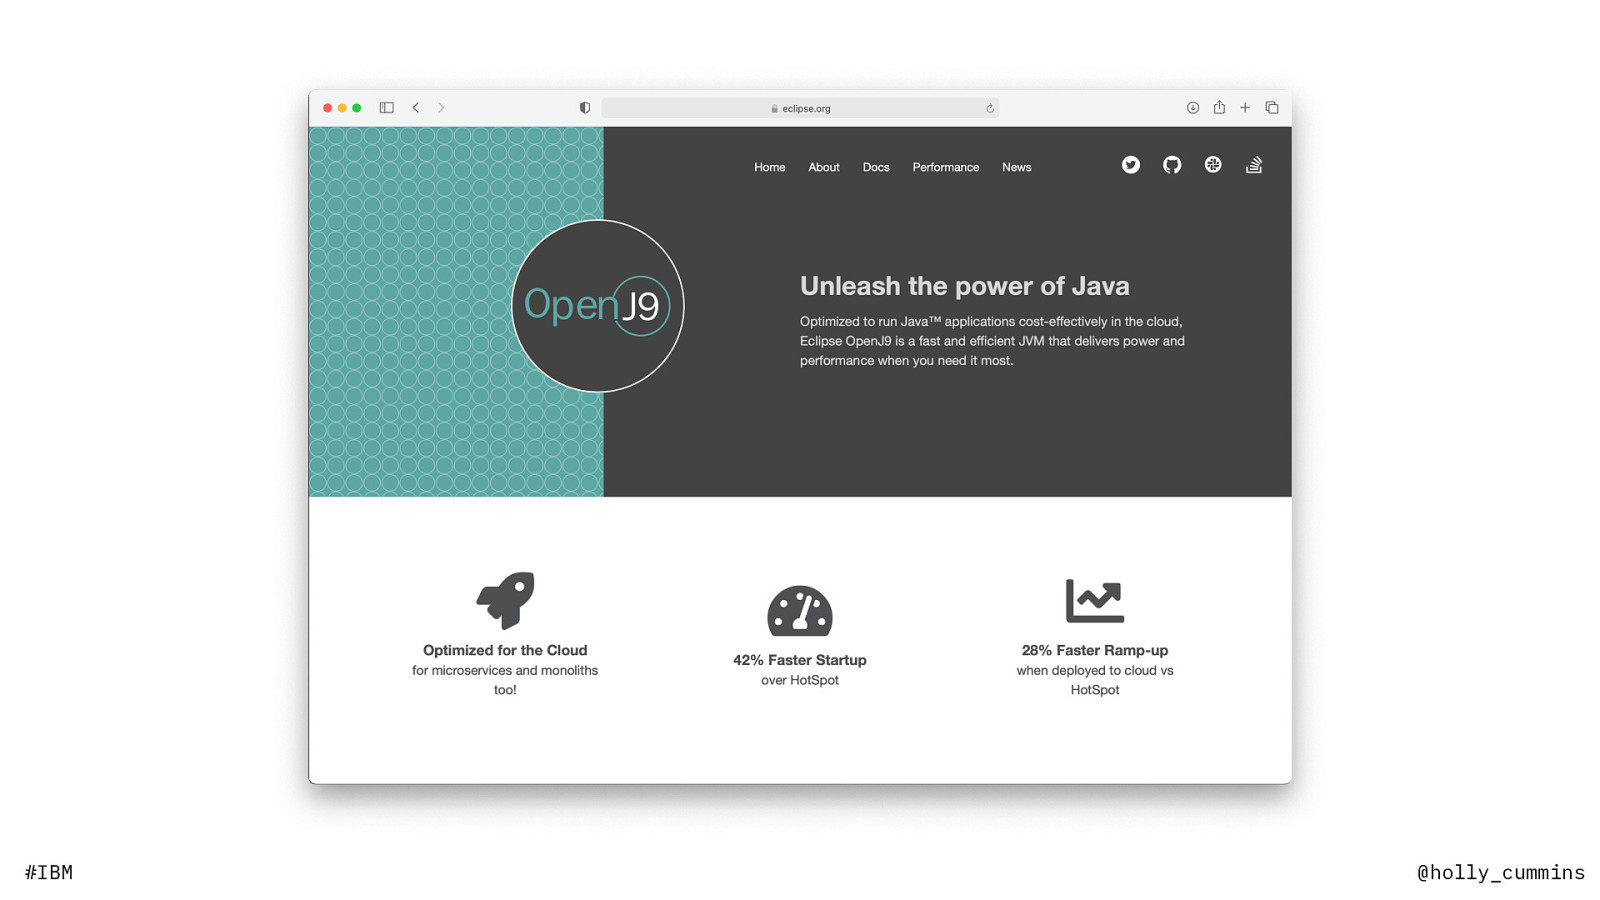
pulse check who’s tried openj9? #IBM @holly_cummins
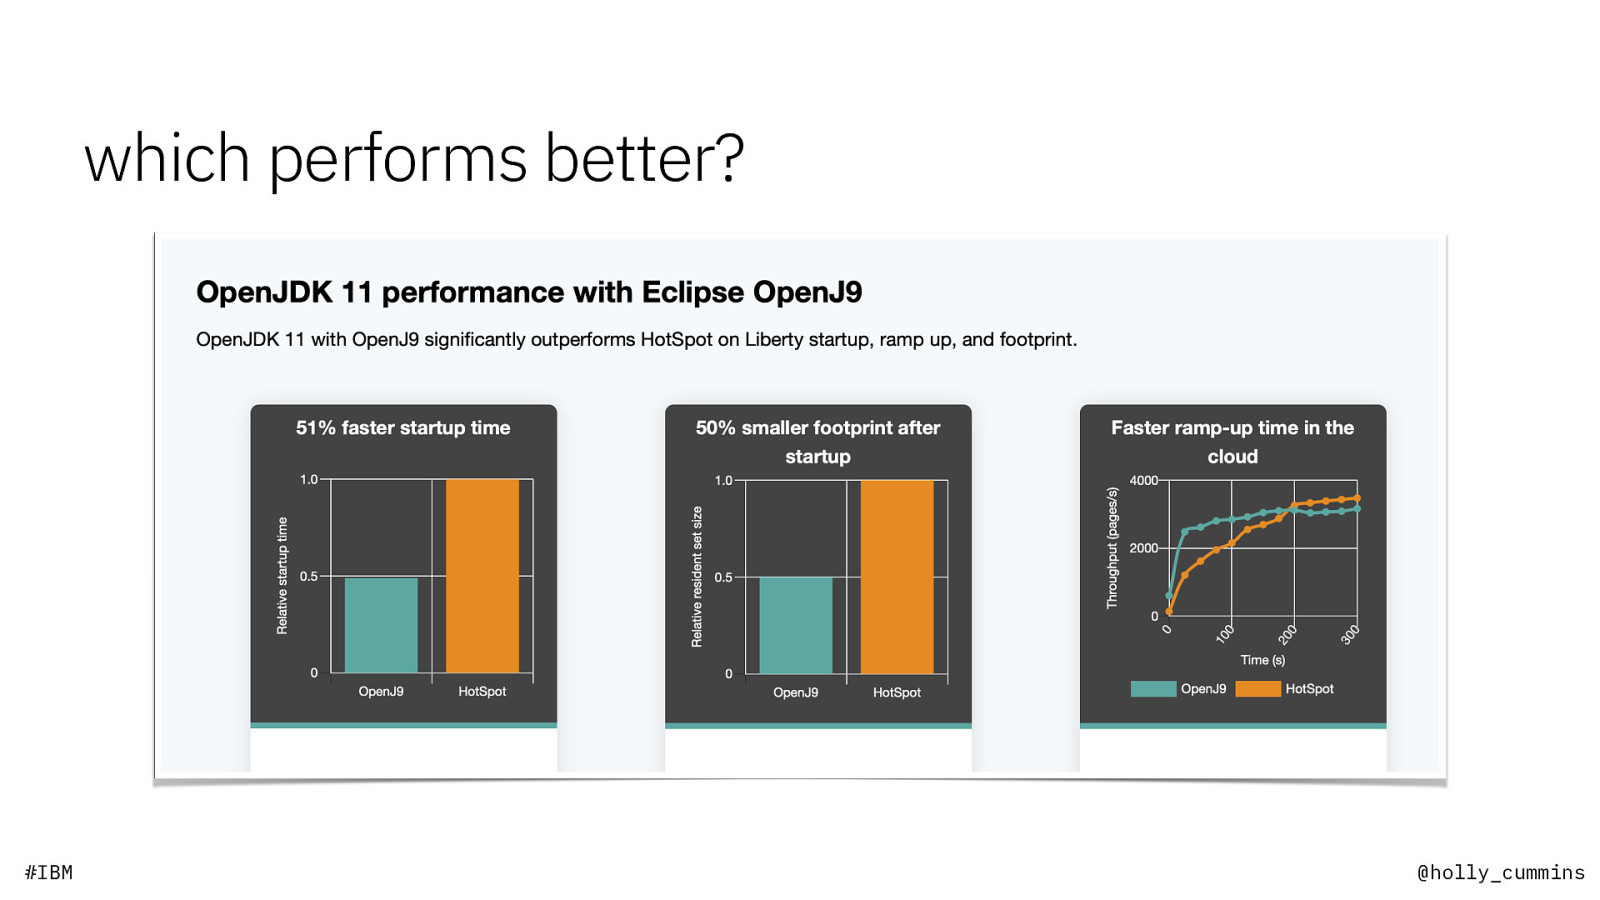
which performs better? #IBM @holly_cummins

pulse check did it perform “better”? #IBM @holly_cummins
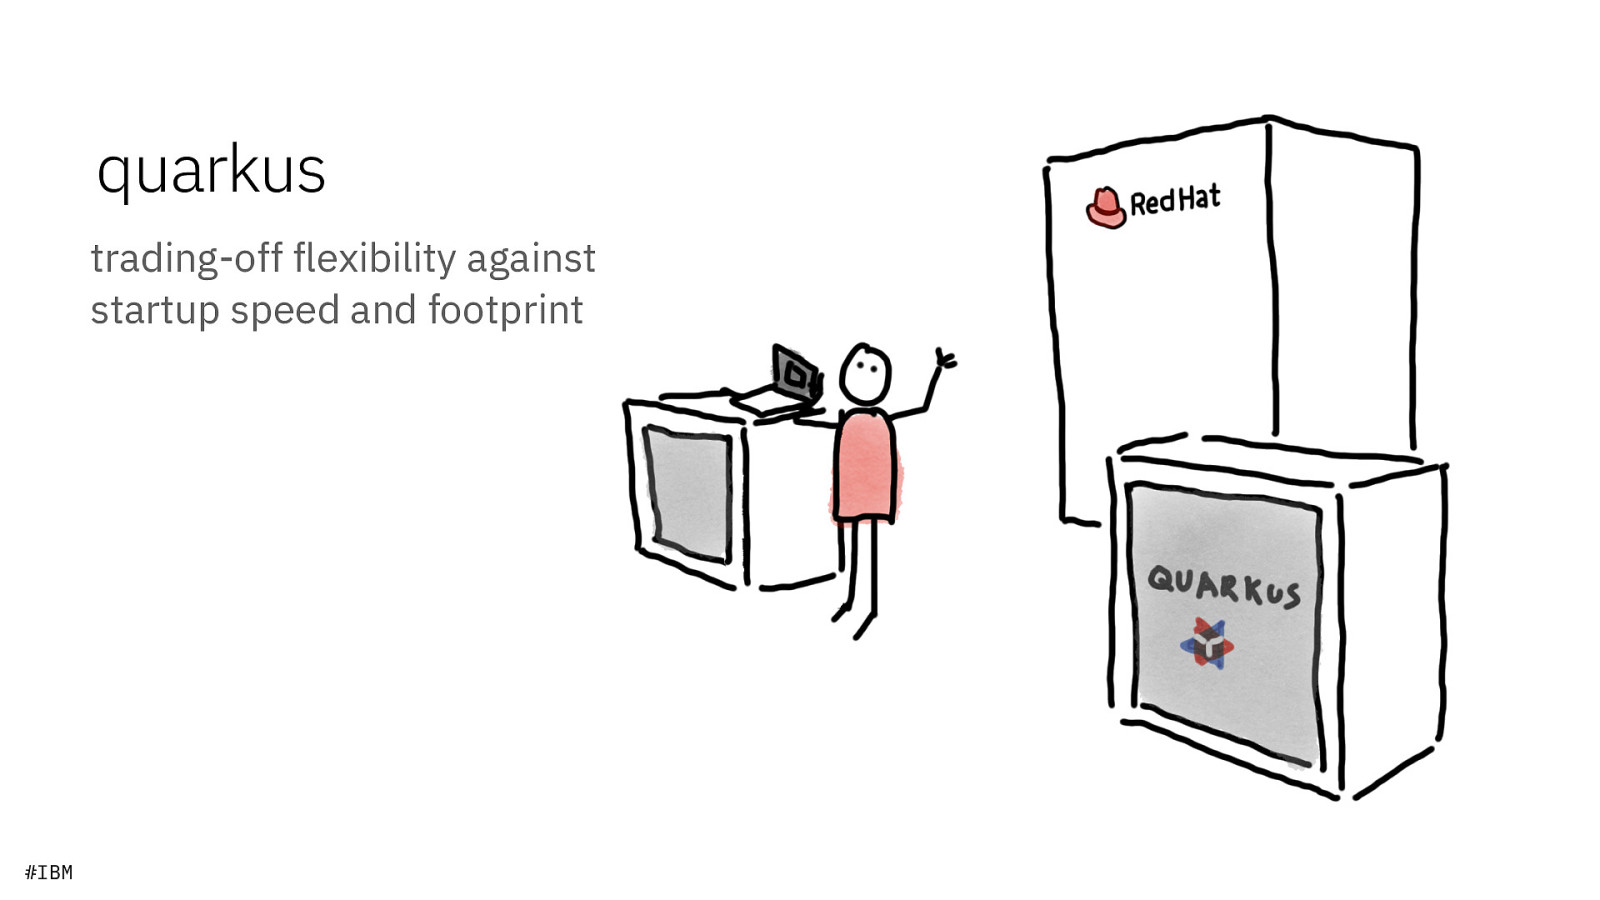
quarkus trading-off flexibility against startup speed and footprint #IBM @holly_cummins
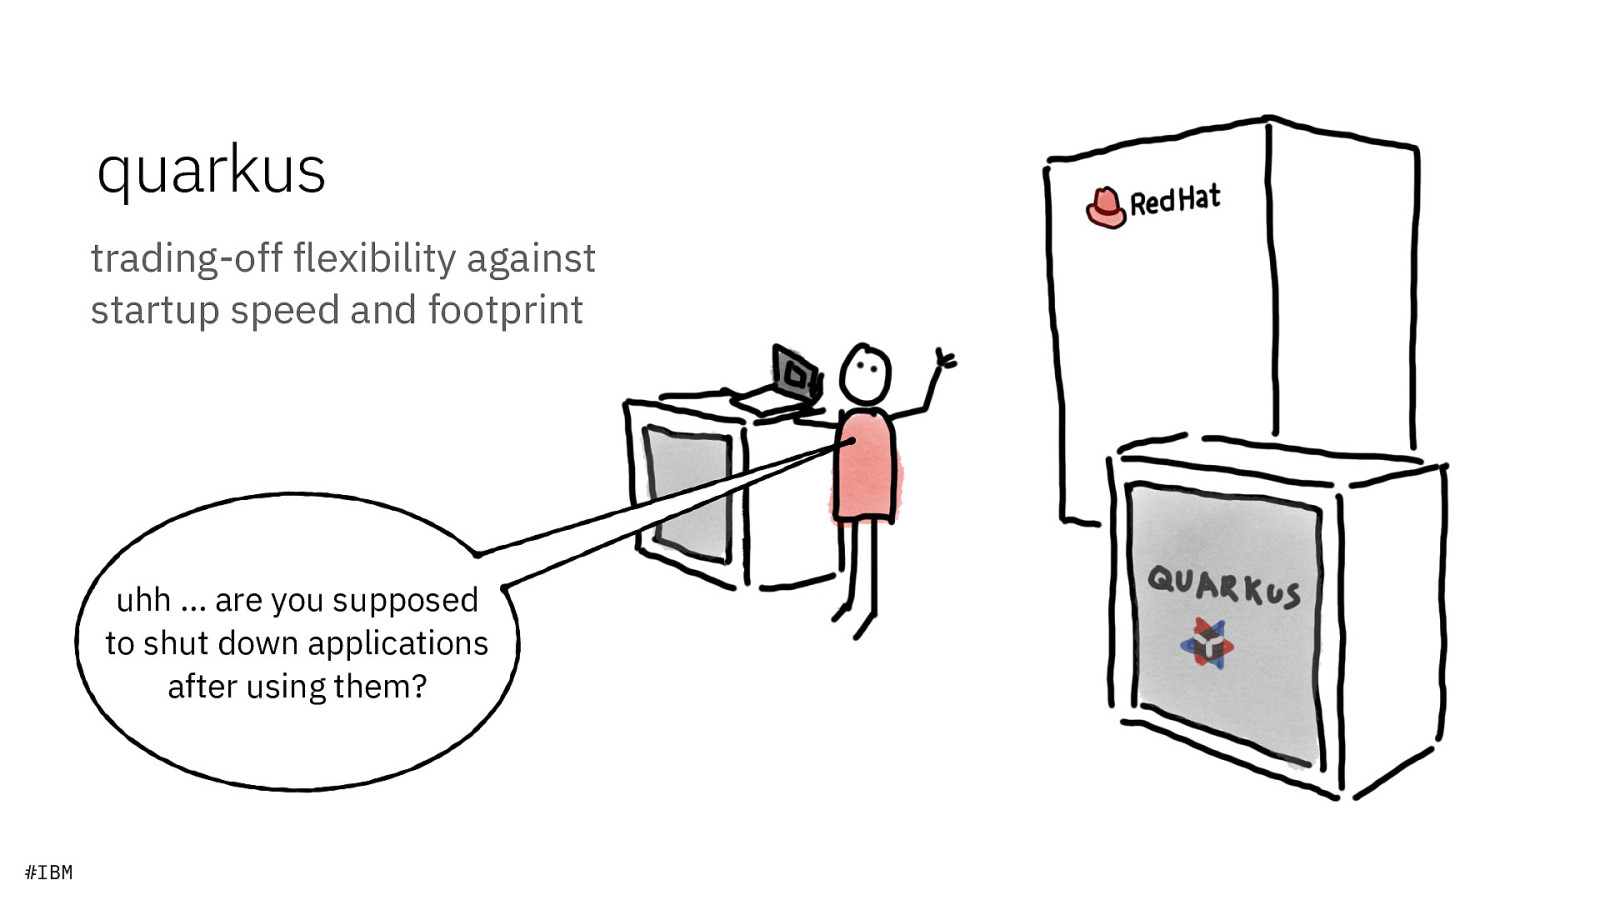
quarkus trading-off flexibility against startup speed and footprint uhh … are you supposed to shut down applications after using them? #IBM @holly_cummins

pulse check who’s tried quarkus? #IBM @holly_cummins
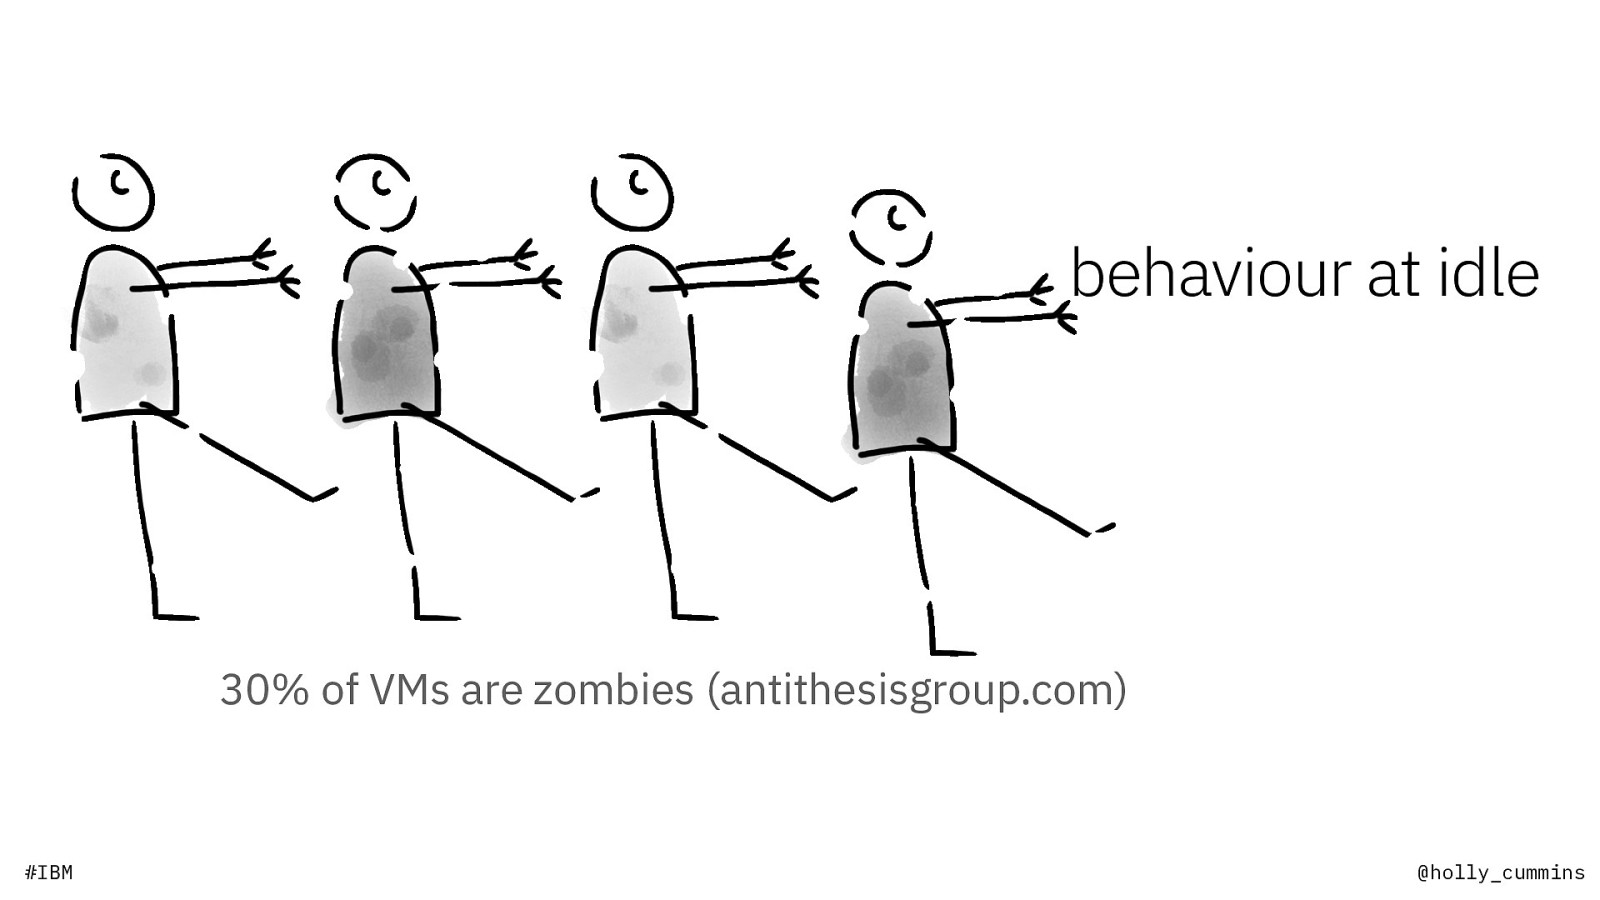
behaviour at idle 30% of VMs are zombies (antithesisgroup.com) #IBM @holly_cummins

how to optimise? #IBM @holly_cummins

fi find the bottleneck. x it. #IBM @holly_cummins

pitfall 1 intuition #IBM @holly_cummins

this is not the place for ideas #IBM @holly_cummins

measure, don’t guess. #IBM @holly_cummins

measure the right thing #IBM @holly_cummins

measure the right thing what do your users care about? #IBM @holly_cummins
pitfall 2 numbers #IBM @holly_cummins

#IBM @holly_cummins

leading indicators #IBM @holly_cummins

leading indicators #IBM lagging indicators @holly_cummins
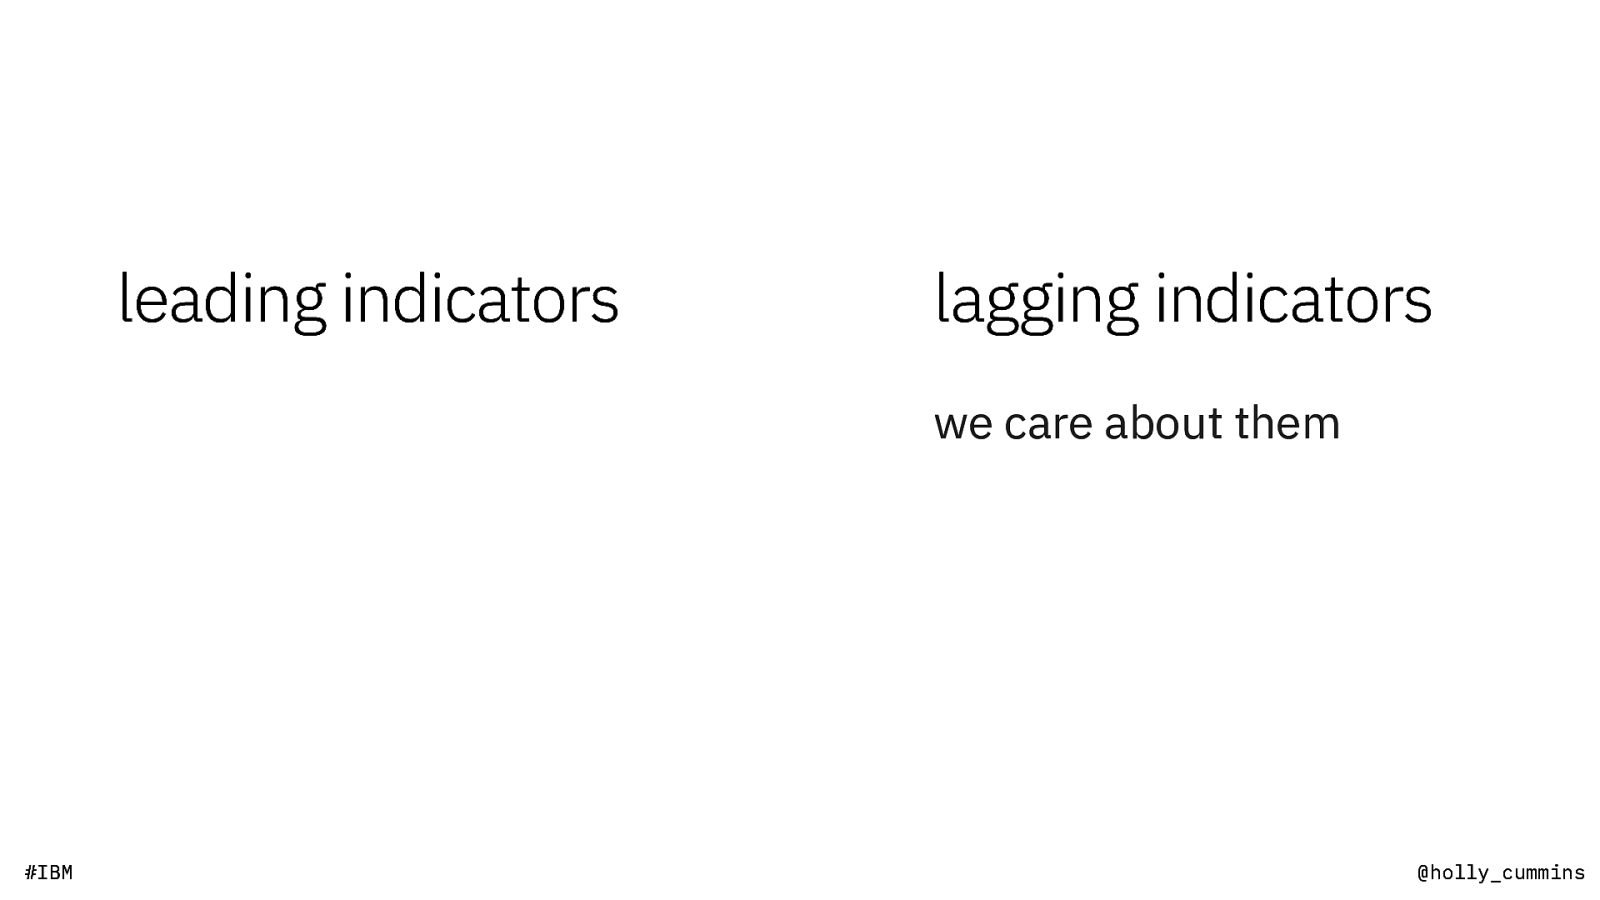
leading indicators lagging indicators we care about them #IBM @holly_cummins

leading indicators lagging indicators we care about them easy to measure #IBM @holly_cummins

leading indicators lagging indicators we care about them easy to measure hard to change #IBM @holly_cummins

#IBM leading indicators lagging indicators easy to change we care about them easy to measure hard to change @holly_cummins

leading indicators lagging indicators predictive of a thing we care about we care about them easy to measure hard to change easy to change #IBM @holly_cummins

#IBM leading indicators lagging indicators predictive of a thing we care about hard to identify easy to change we care about them easy to measure hard to change @holly_cummins

#IBM leading indicators lagging indicators predictive of a thing we care about hard to identify easy to change we care about them easy to measure hard to change @holly_cummins
caution: performance experiments for entertainment purposes only. do not try these at home. #IBM @holly_cummins
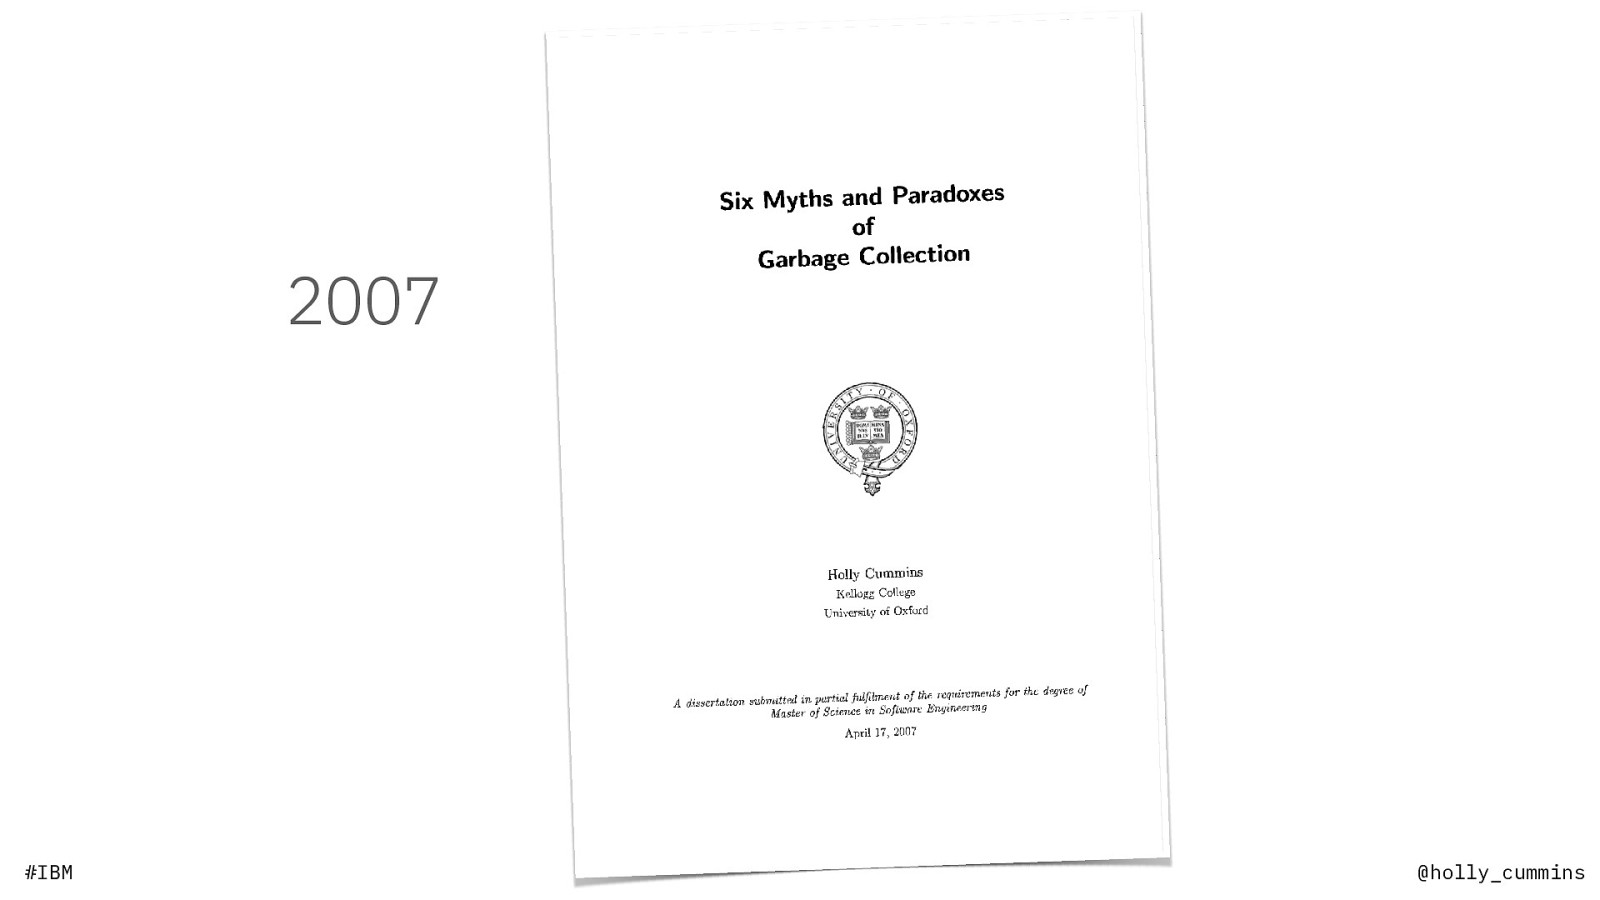
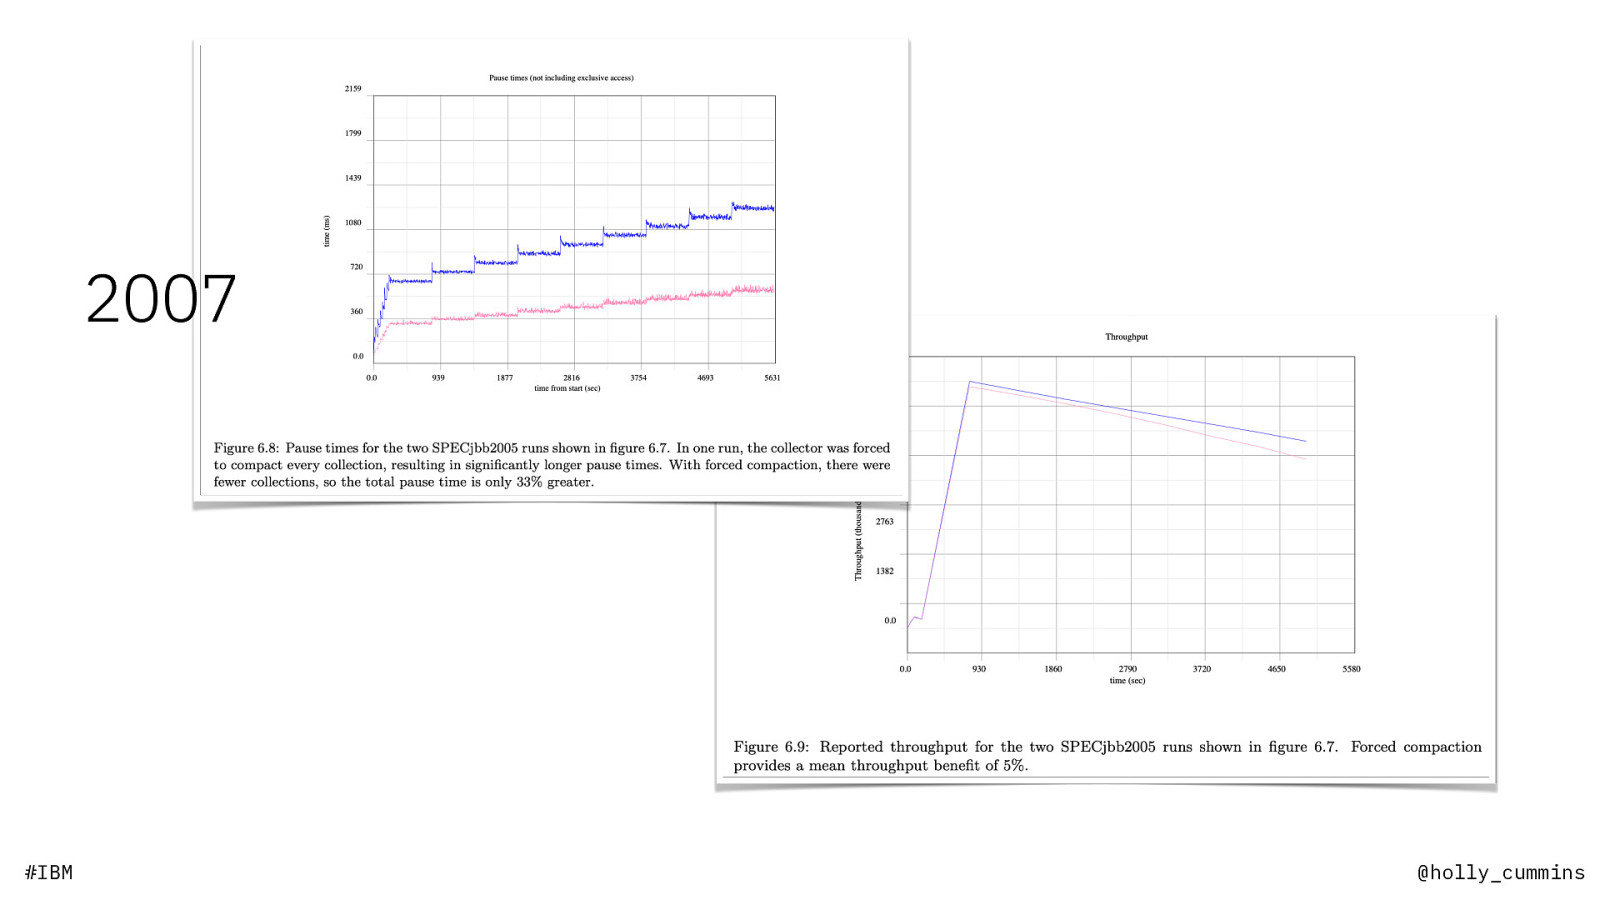
2007 #IBM @holly_cummins
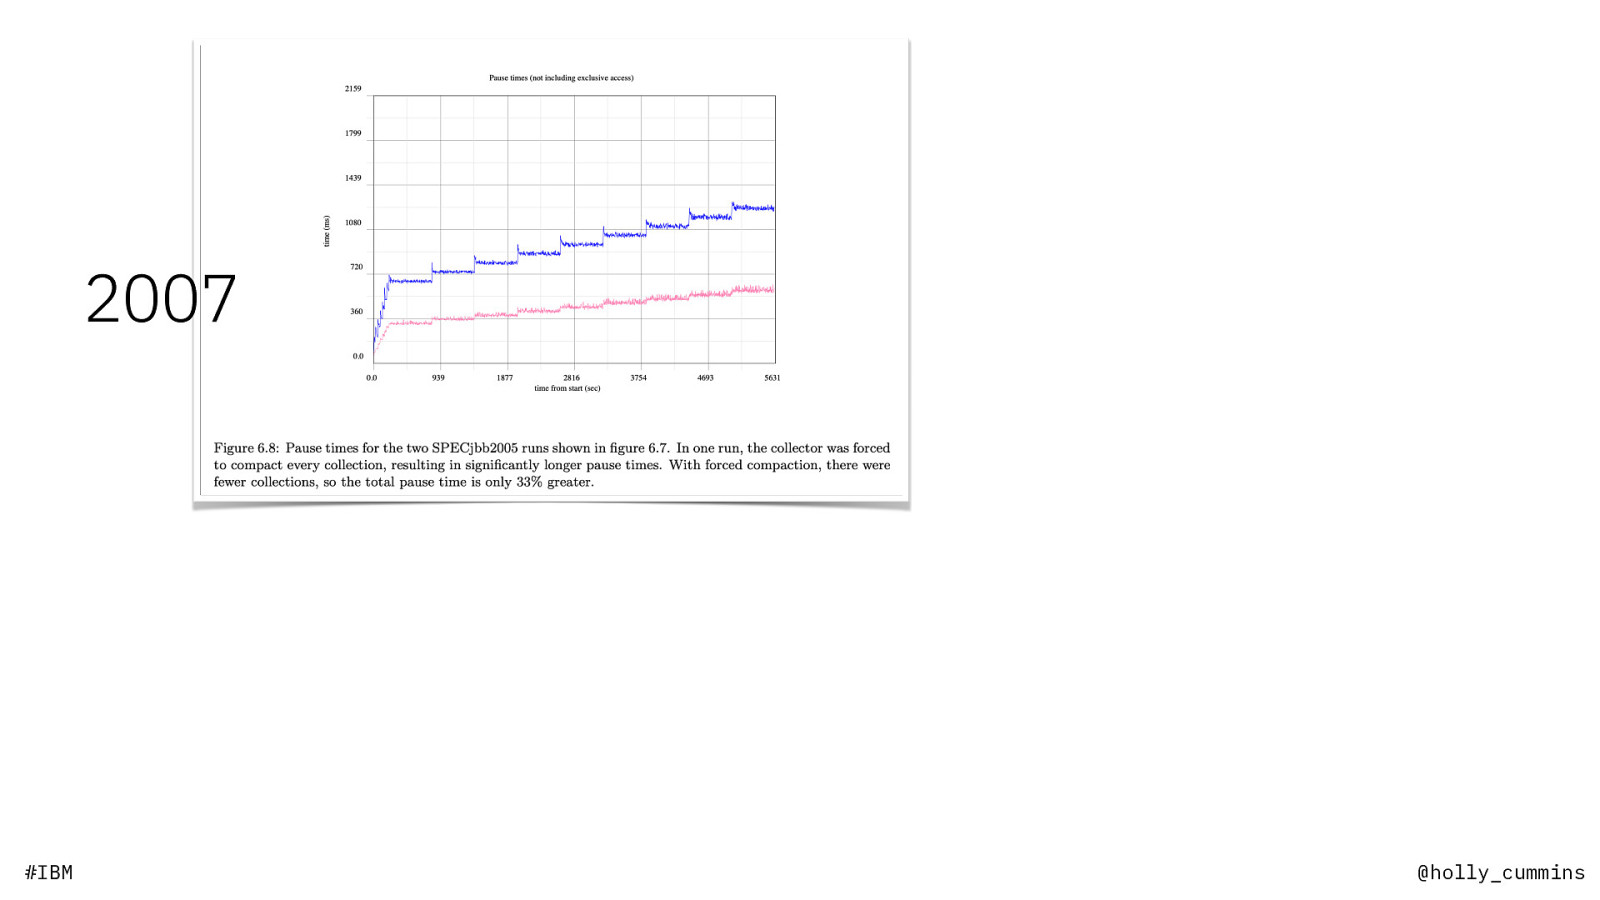
bad-ish advice: “reduce time spent in garbage collection” #IBM @holly_cummins

bad-ish advice: “reduce time spent in garbage collection” actually, garbage collection can make your application go faster #IBM @holly_cummins
2007 #IBM @holly_cummins
2007 #IBM @holly_cummins
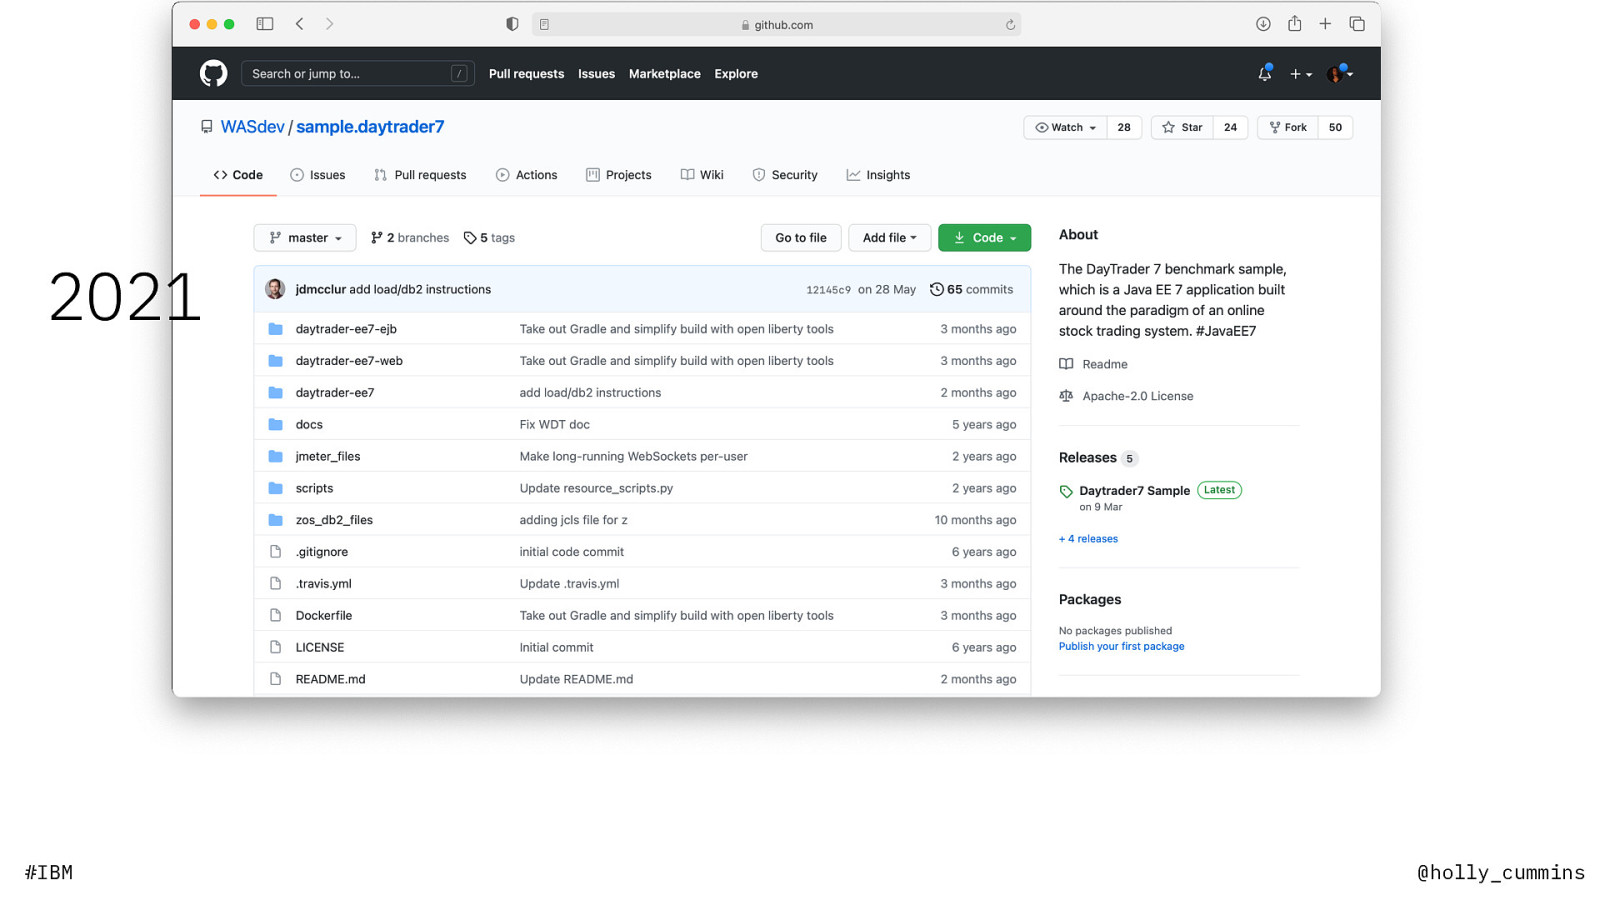
2021 #IBM @holly_cummins
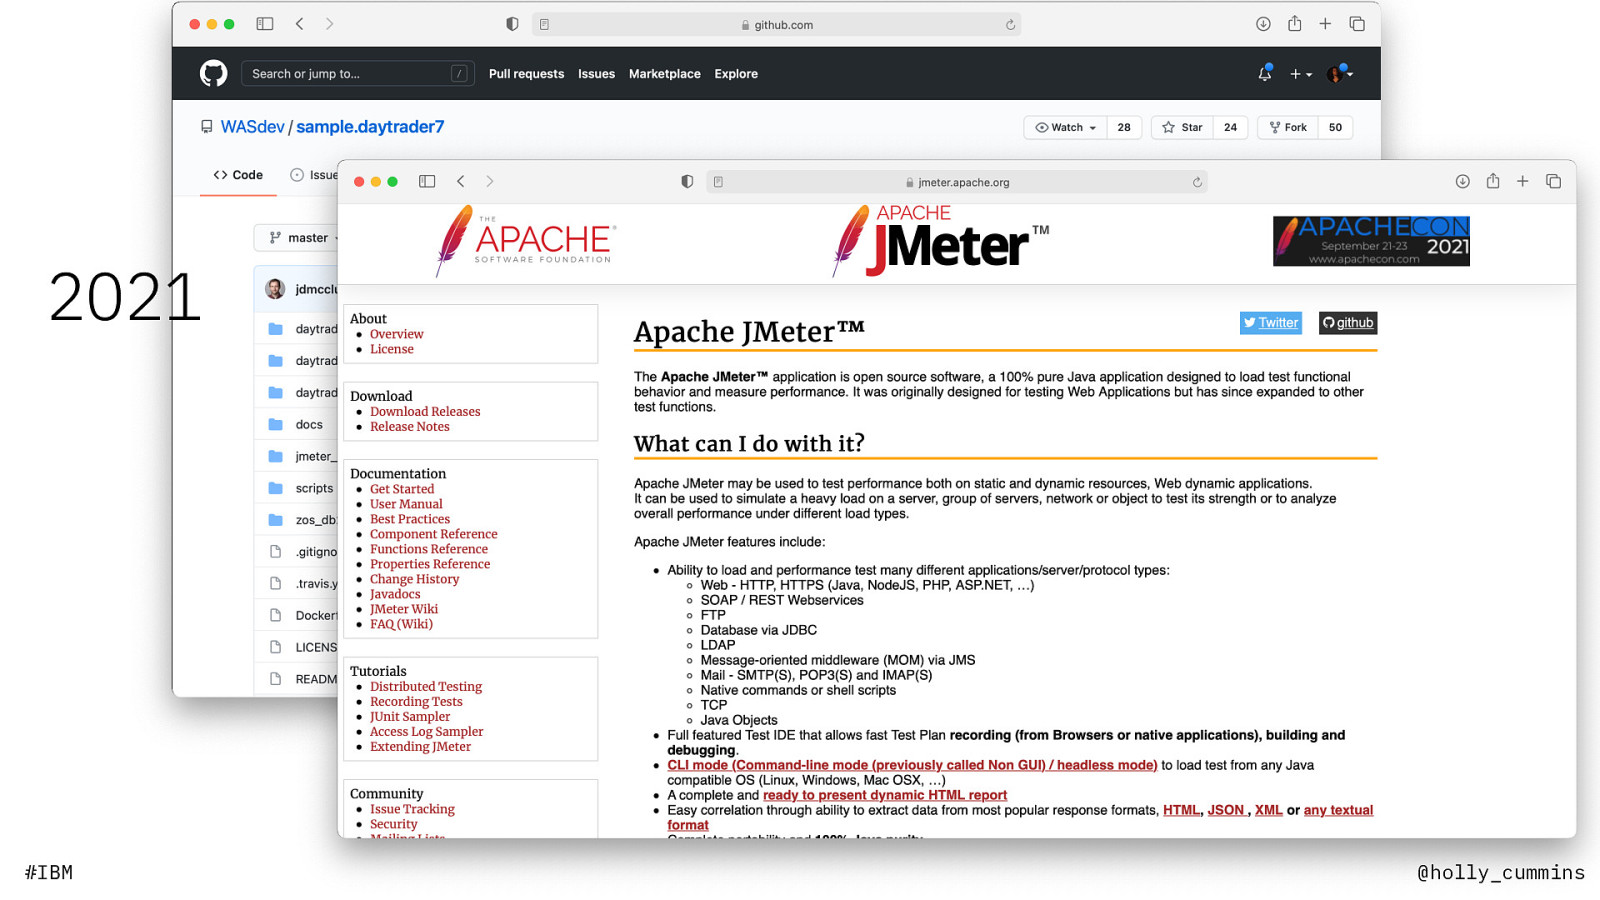
2021 #IBM @holly_cummins
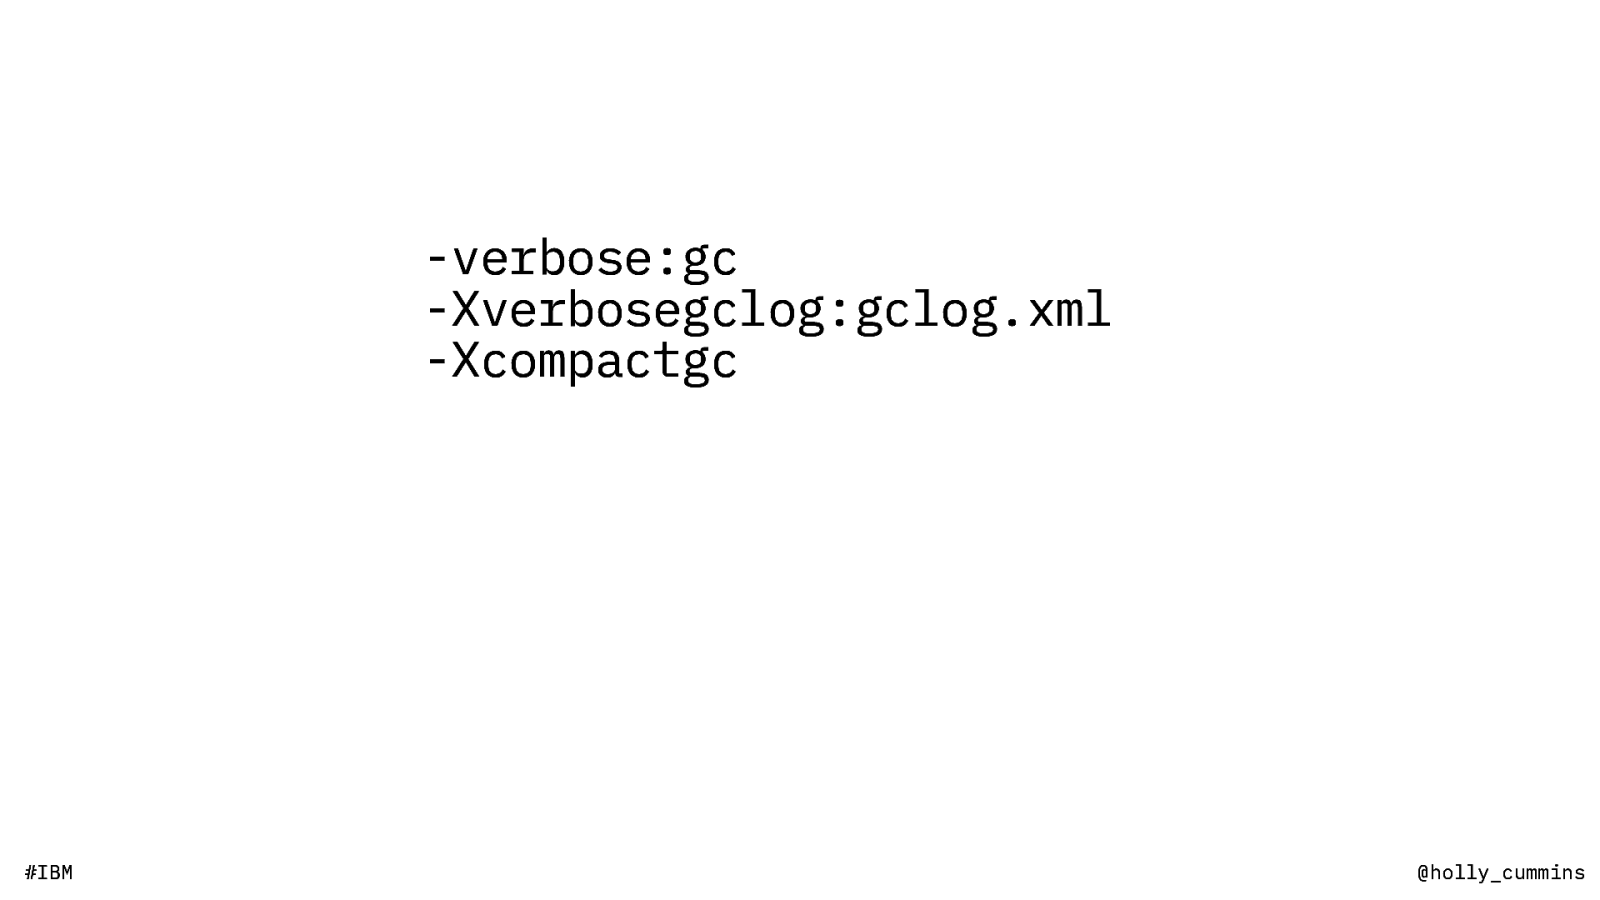
-verbose:gc -Xverbosegclog:gclog.xml -Xcompactgc #IBM @holly_cummins
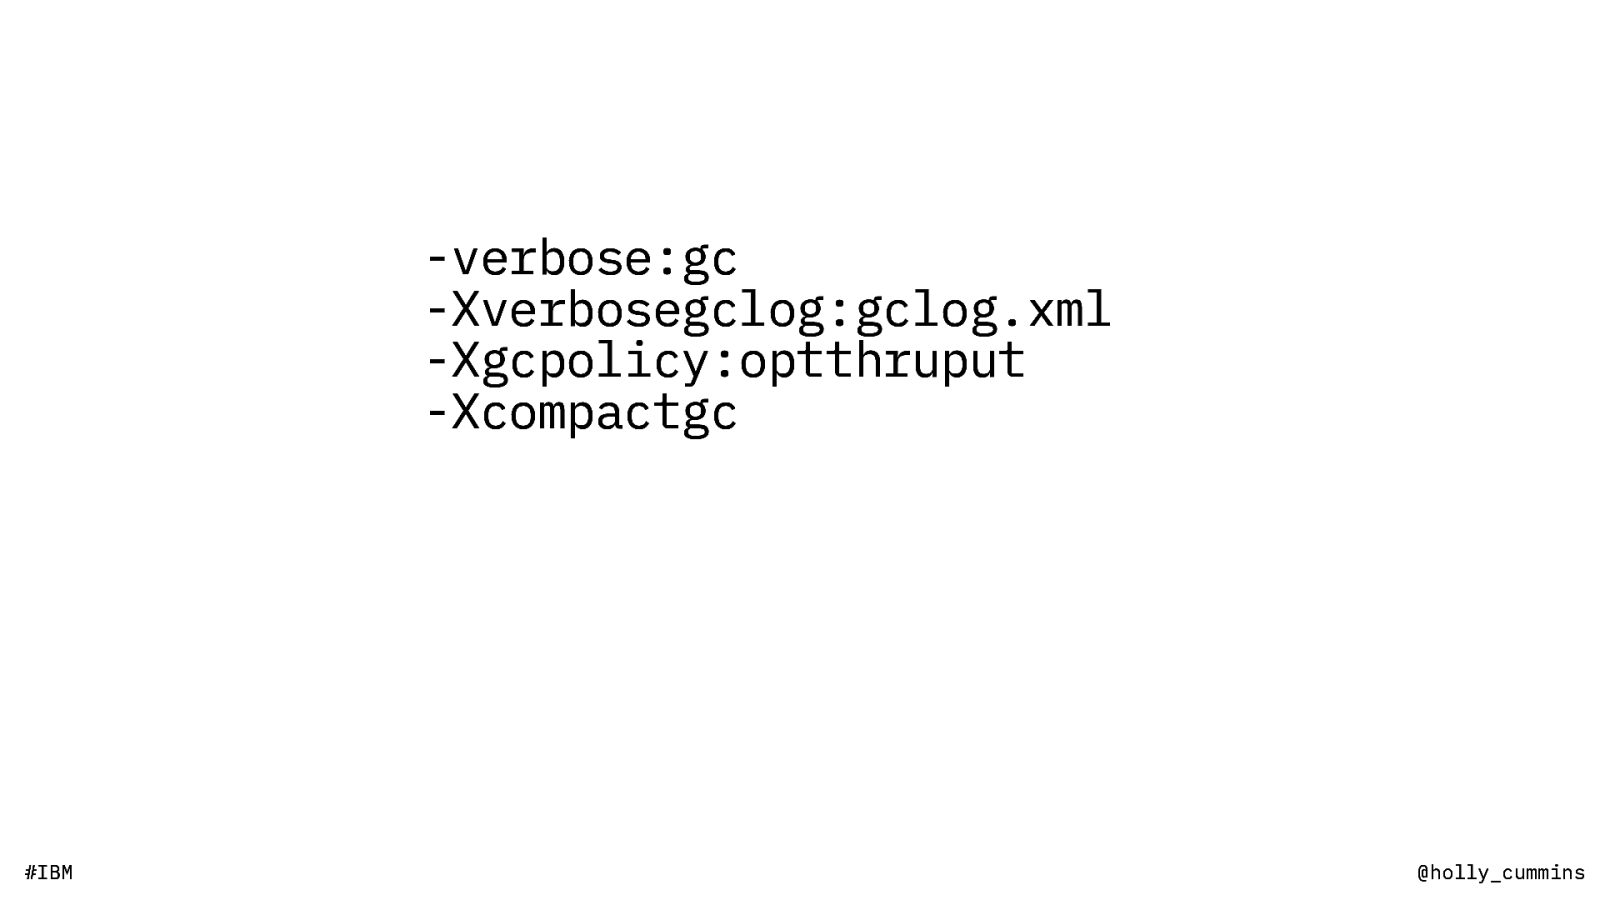
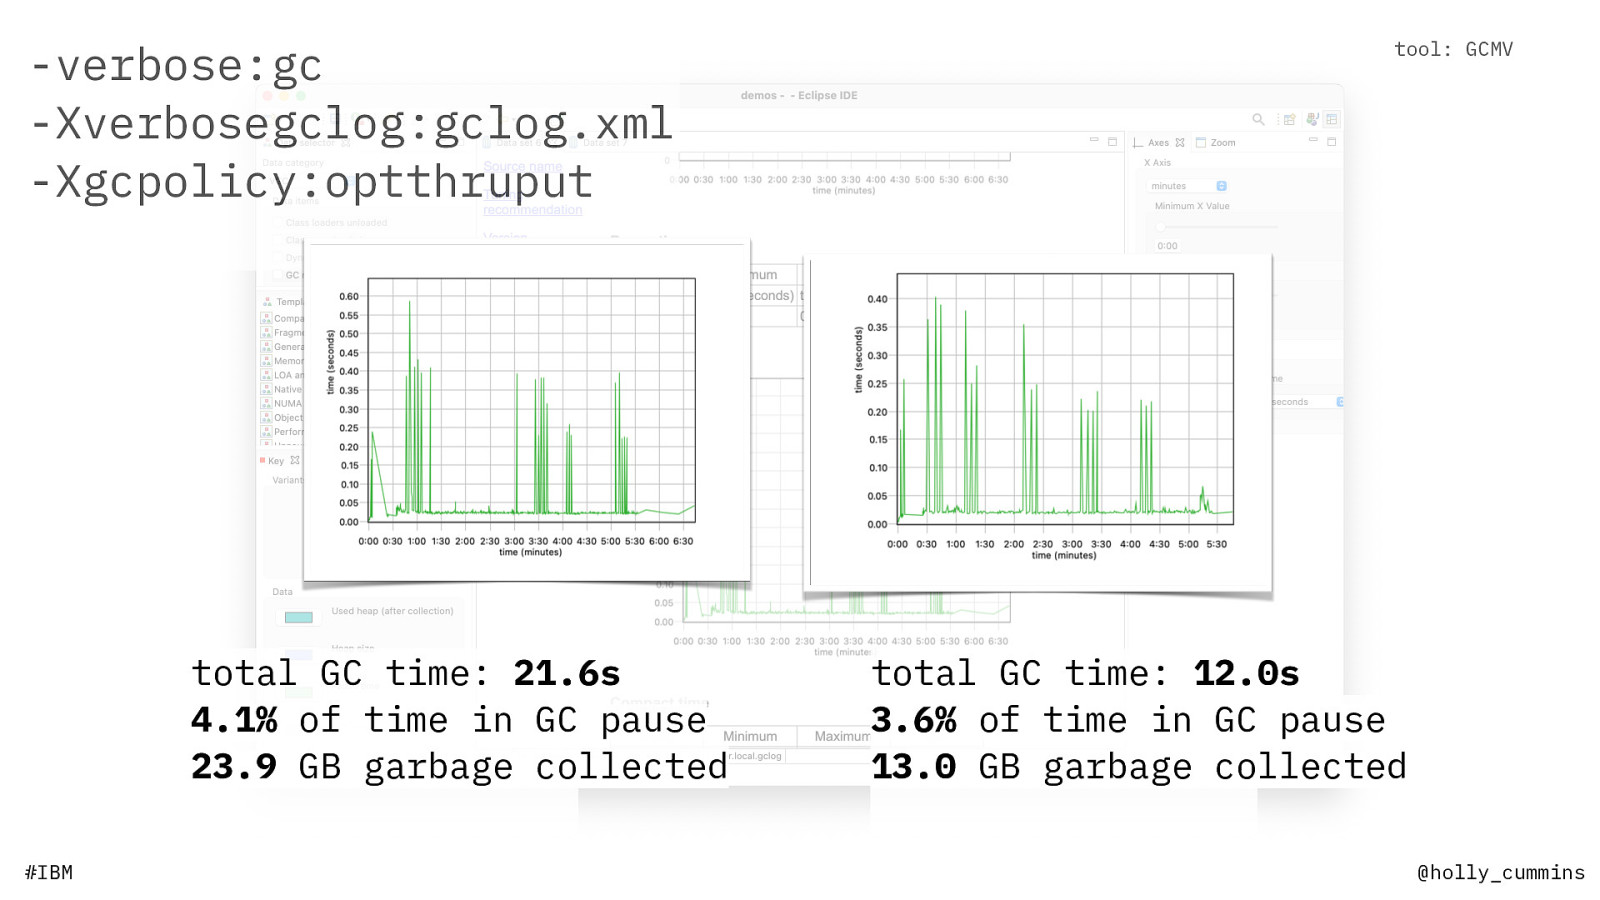
-verbose:gc -Xverbosegclog:gclog.xml -Xgcpolicy:optthruput -Xcompactgc #IBM @holly_cummins

-verbose:gc -Xverbosegclog:gclog.xml -Xgcpolicy:optthruput -Xmx110m -Xms110m -Xnocompactgc #IBM @holly_cummins
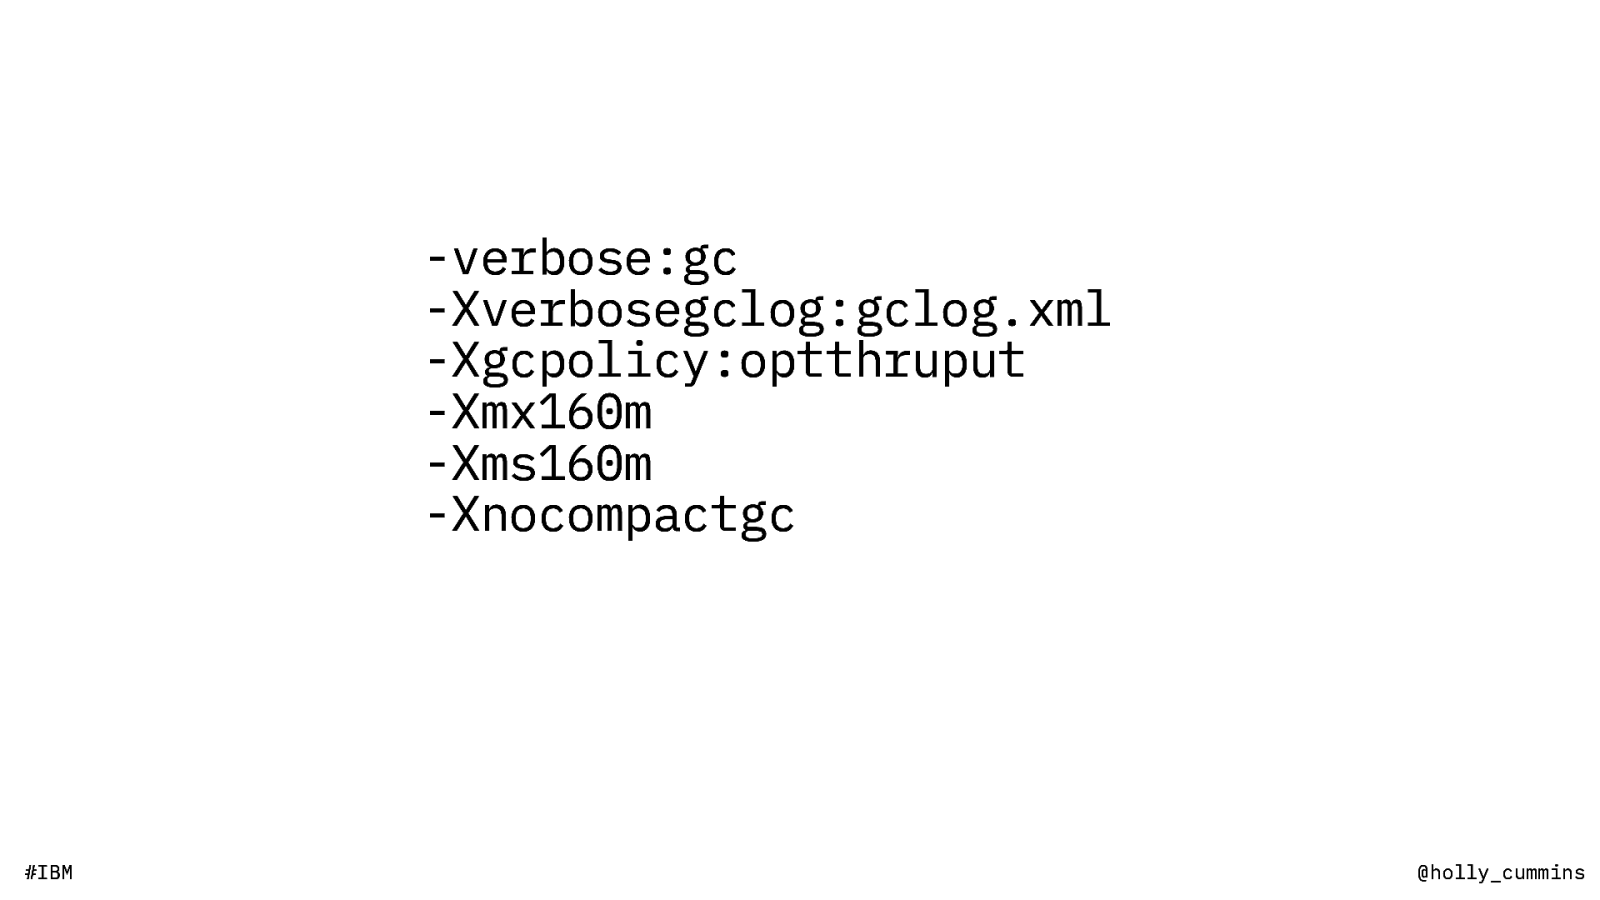
-verbose:gc -Xverbosegclog:gclog.xml -Xgcpolicy:optthruput -Xmx160m -Xms160m -Xnocompactgc #IBM @holly_cummins
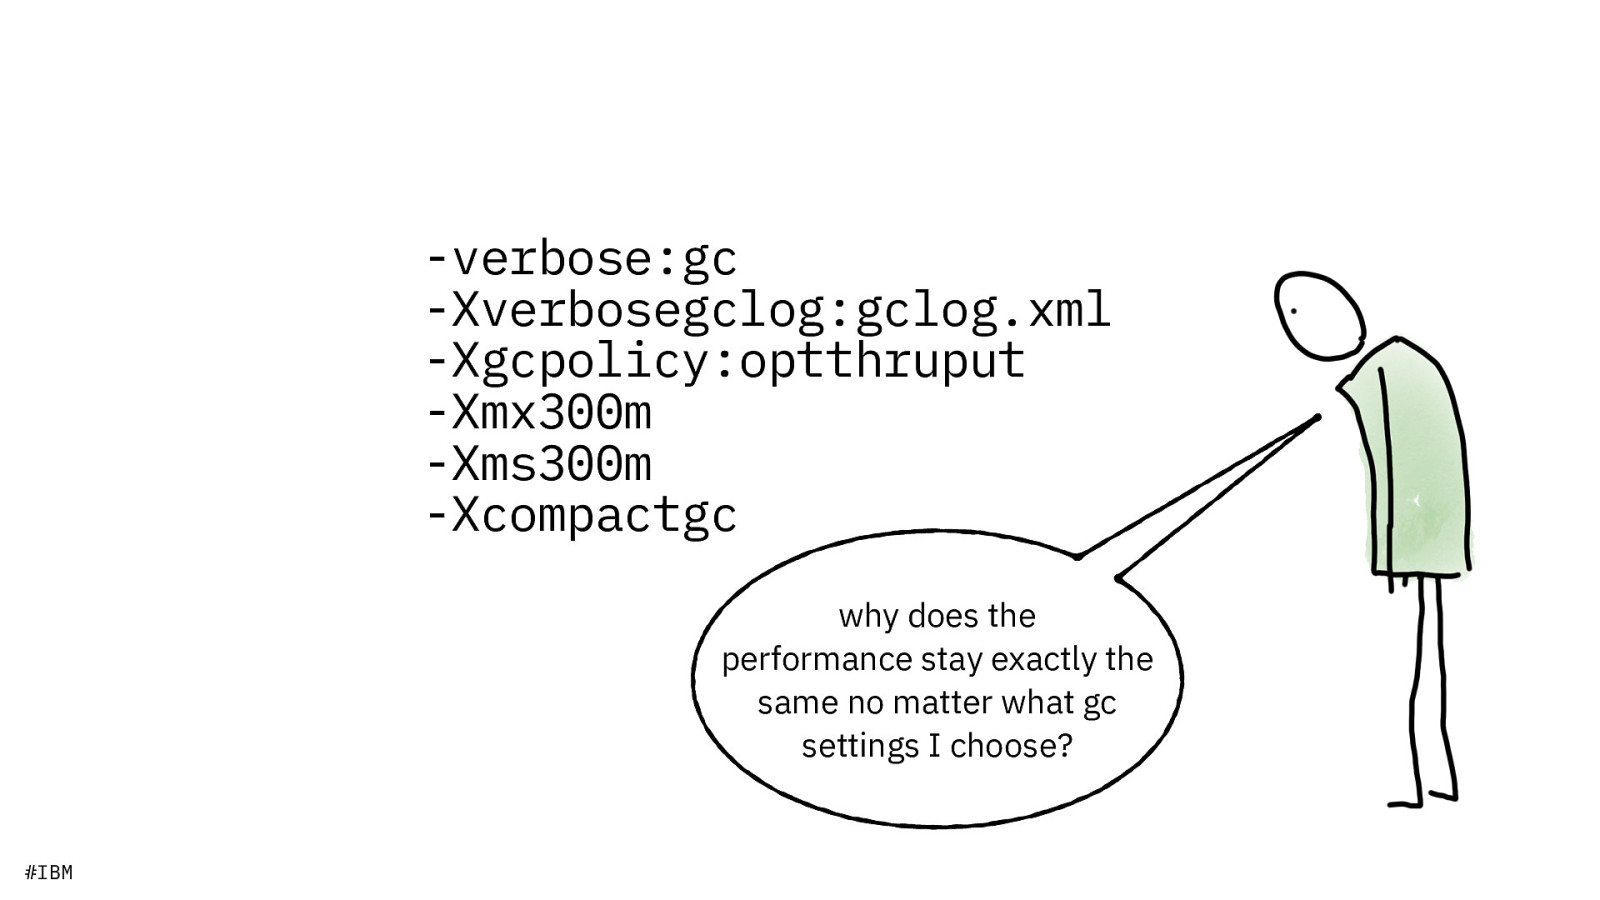
-verbose:gc -Xverbosegclog:gclog.xml -Xgcpolicy:optthruput -Xmx300m -Xms300m -Xcompactgc why does the performance stay exactly the same no matter what gc settings I choose? #IBM @holly_cummins

by the way, this is cheating. (remember the ‘bad science’?) #IBM @holly_cummins

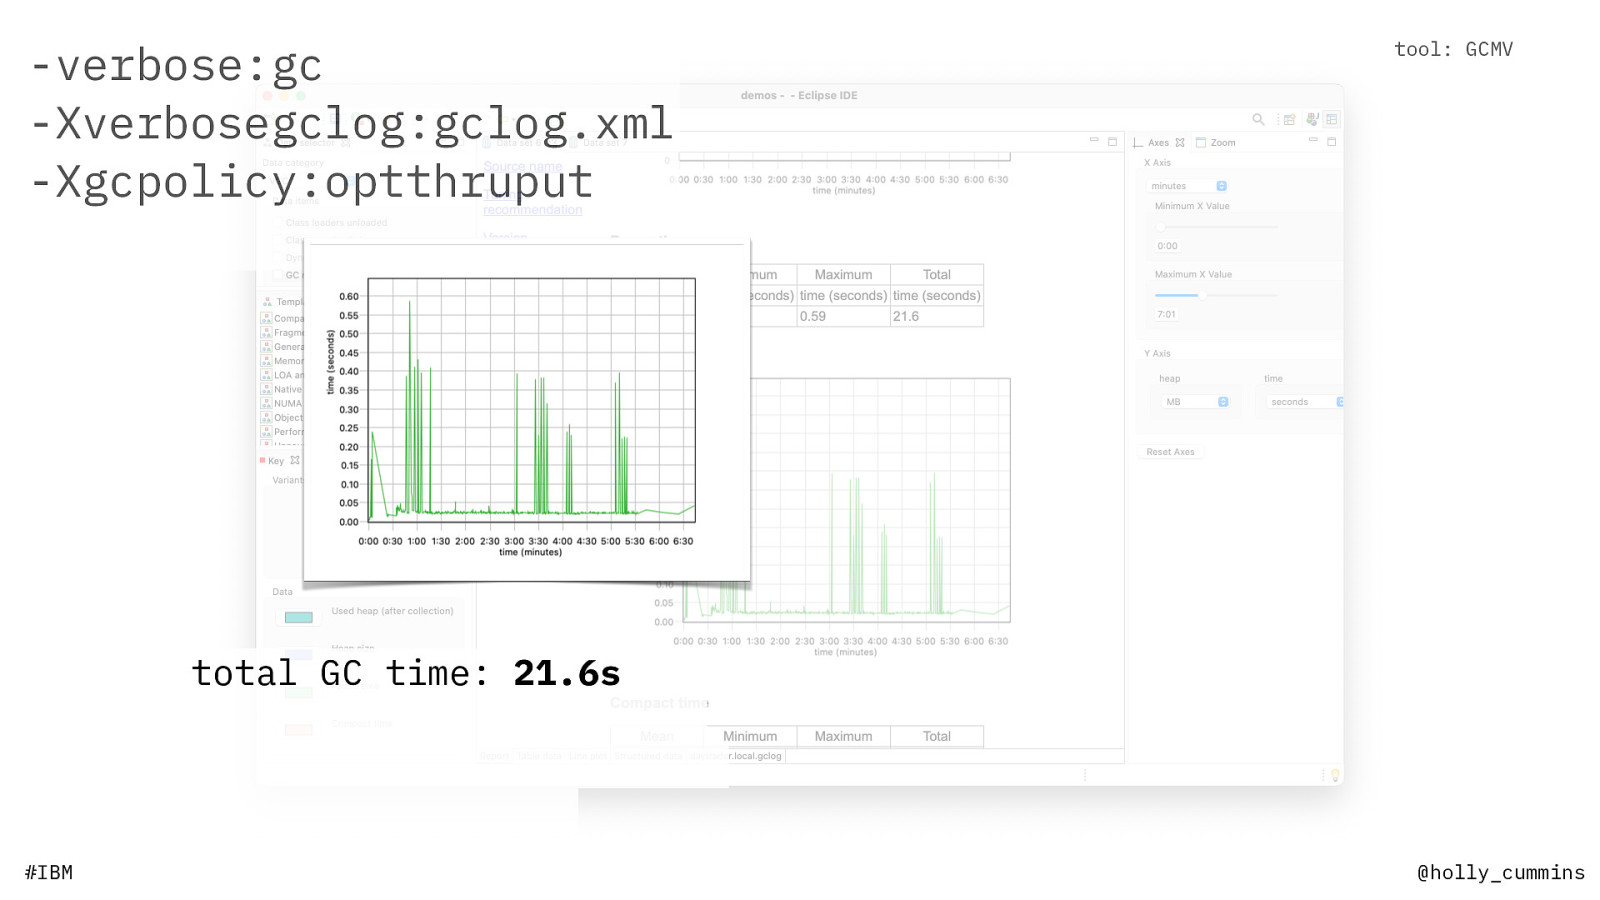
-verbose:gc #IBM @holly_cummins
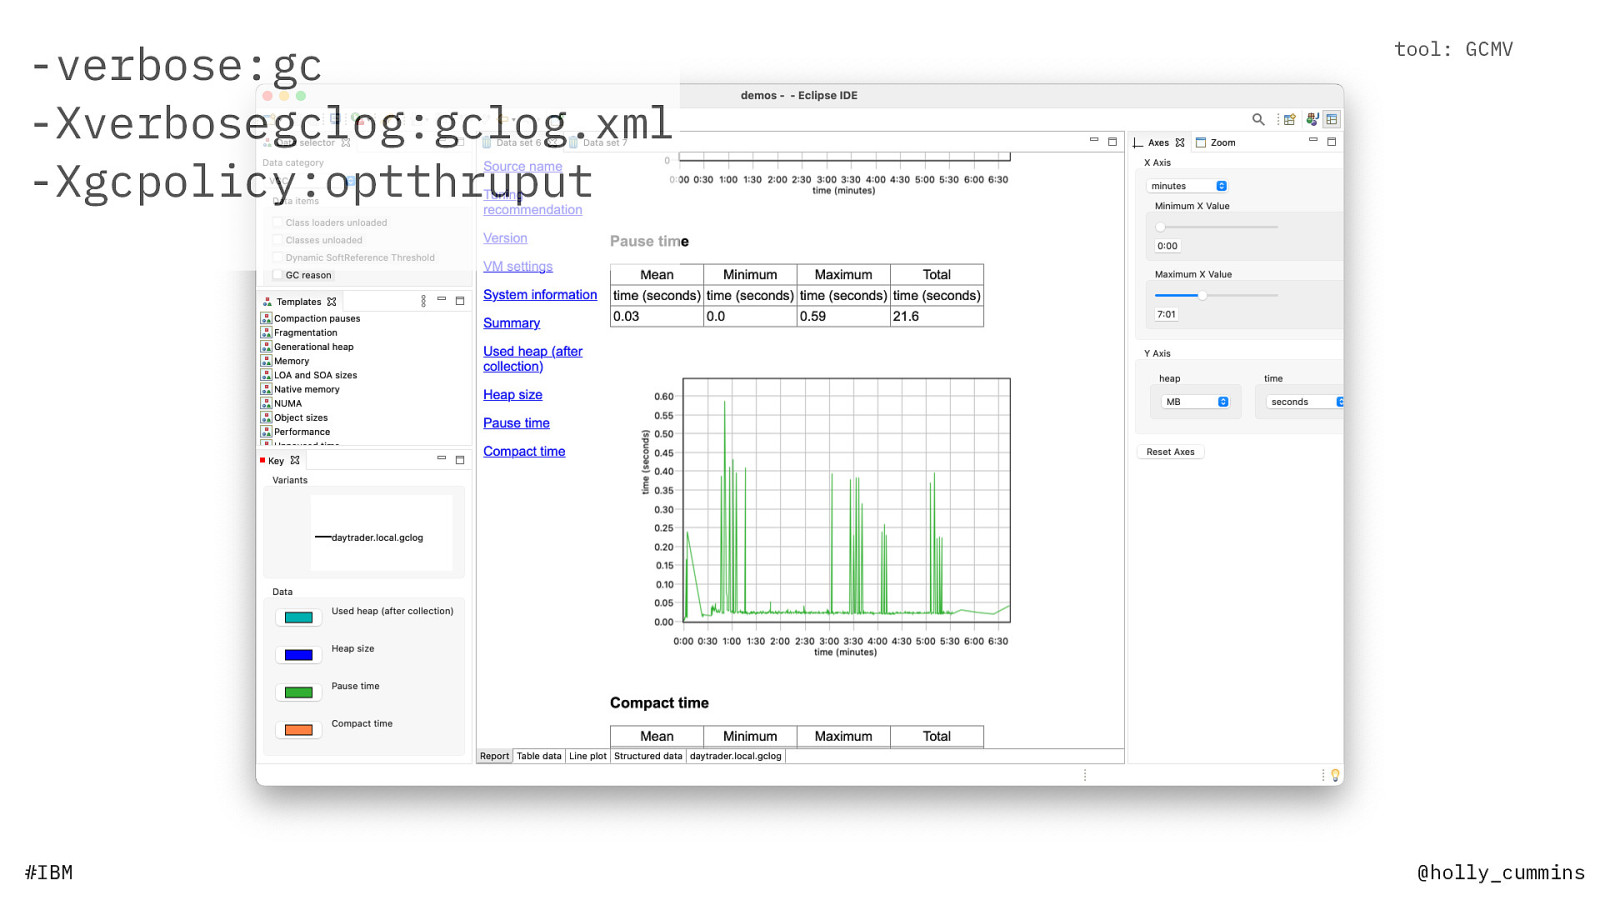
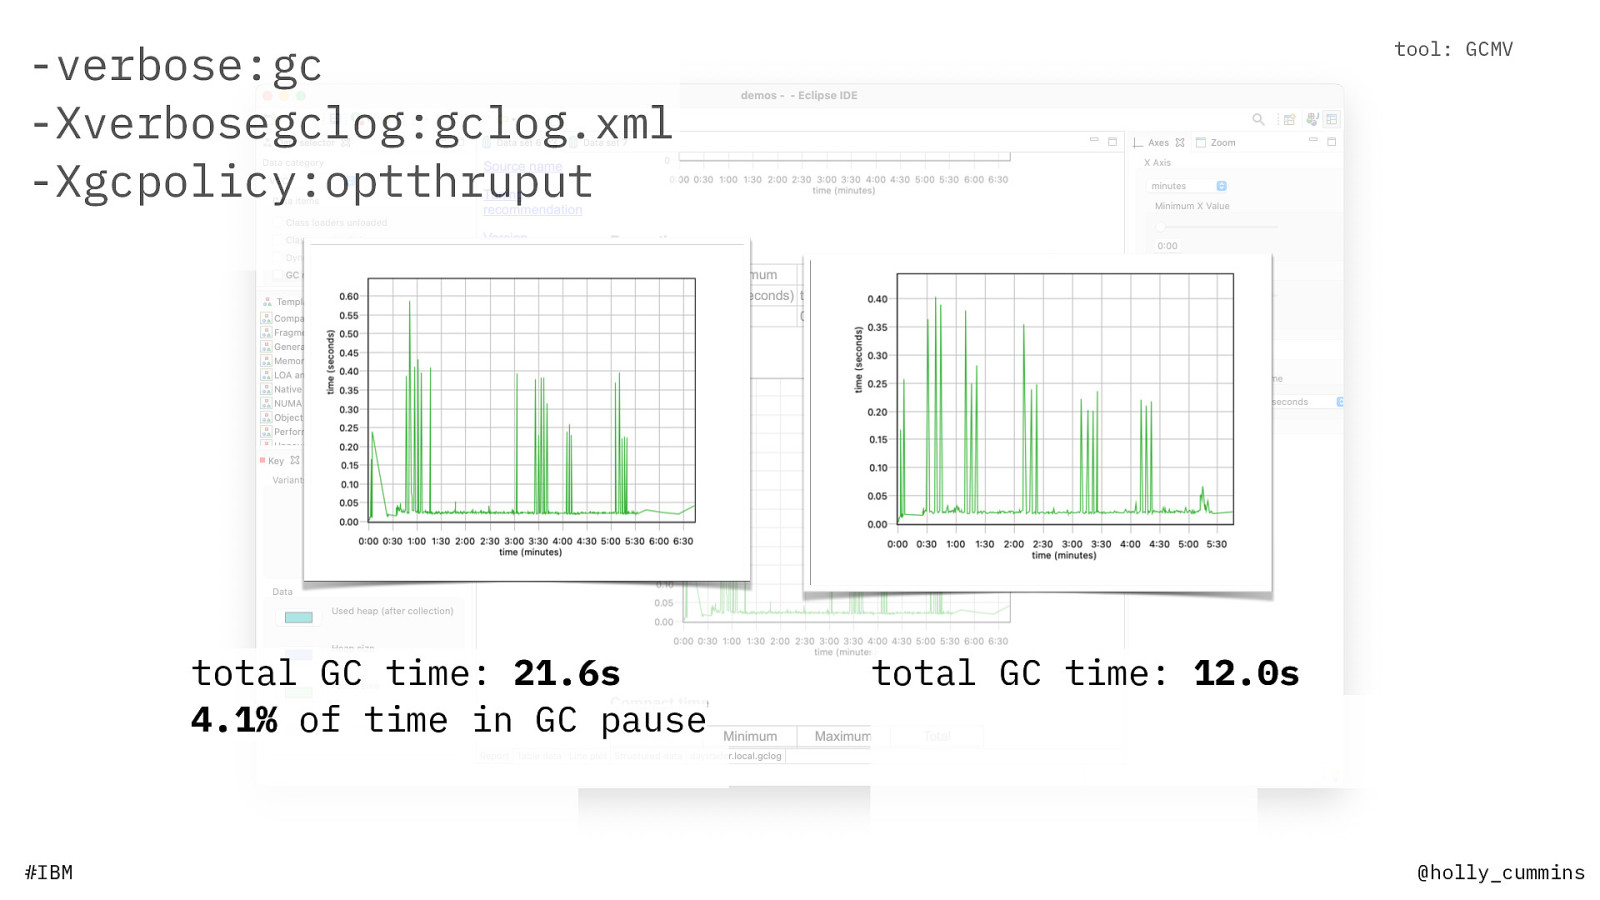
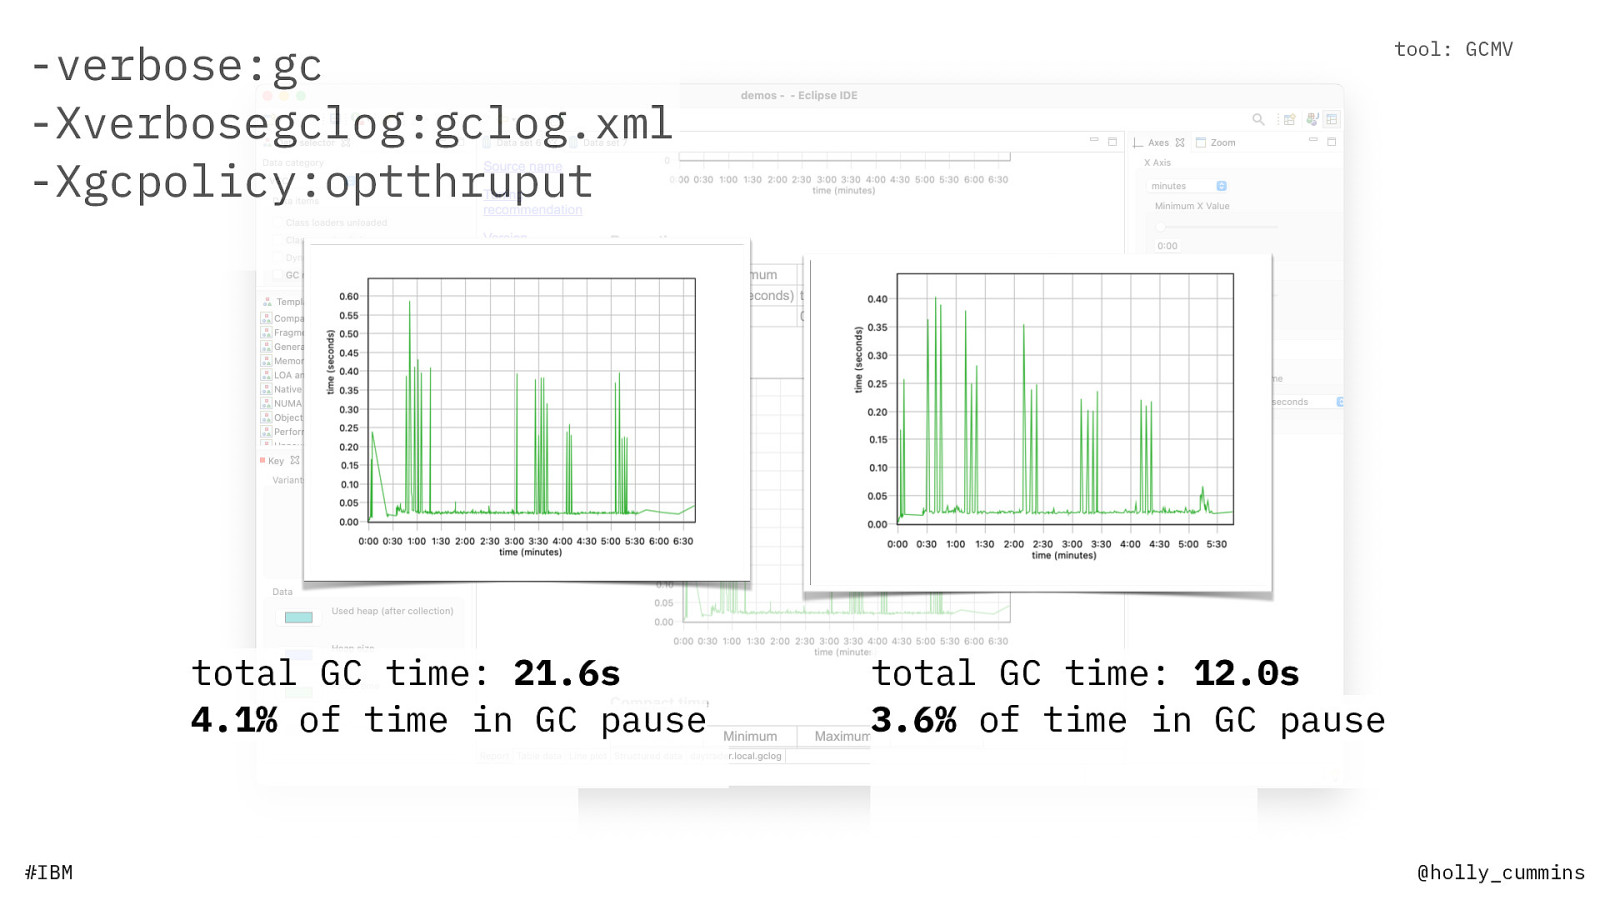


4.1% of time in GC pause 23.9 GB garbage collected 493 transactions/s total GC time: 12.0s 3.6% of time in GC pause 13.0 GB garbage collected 260 transactions/s
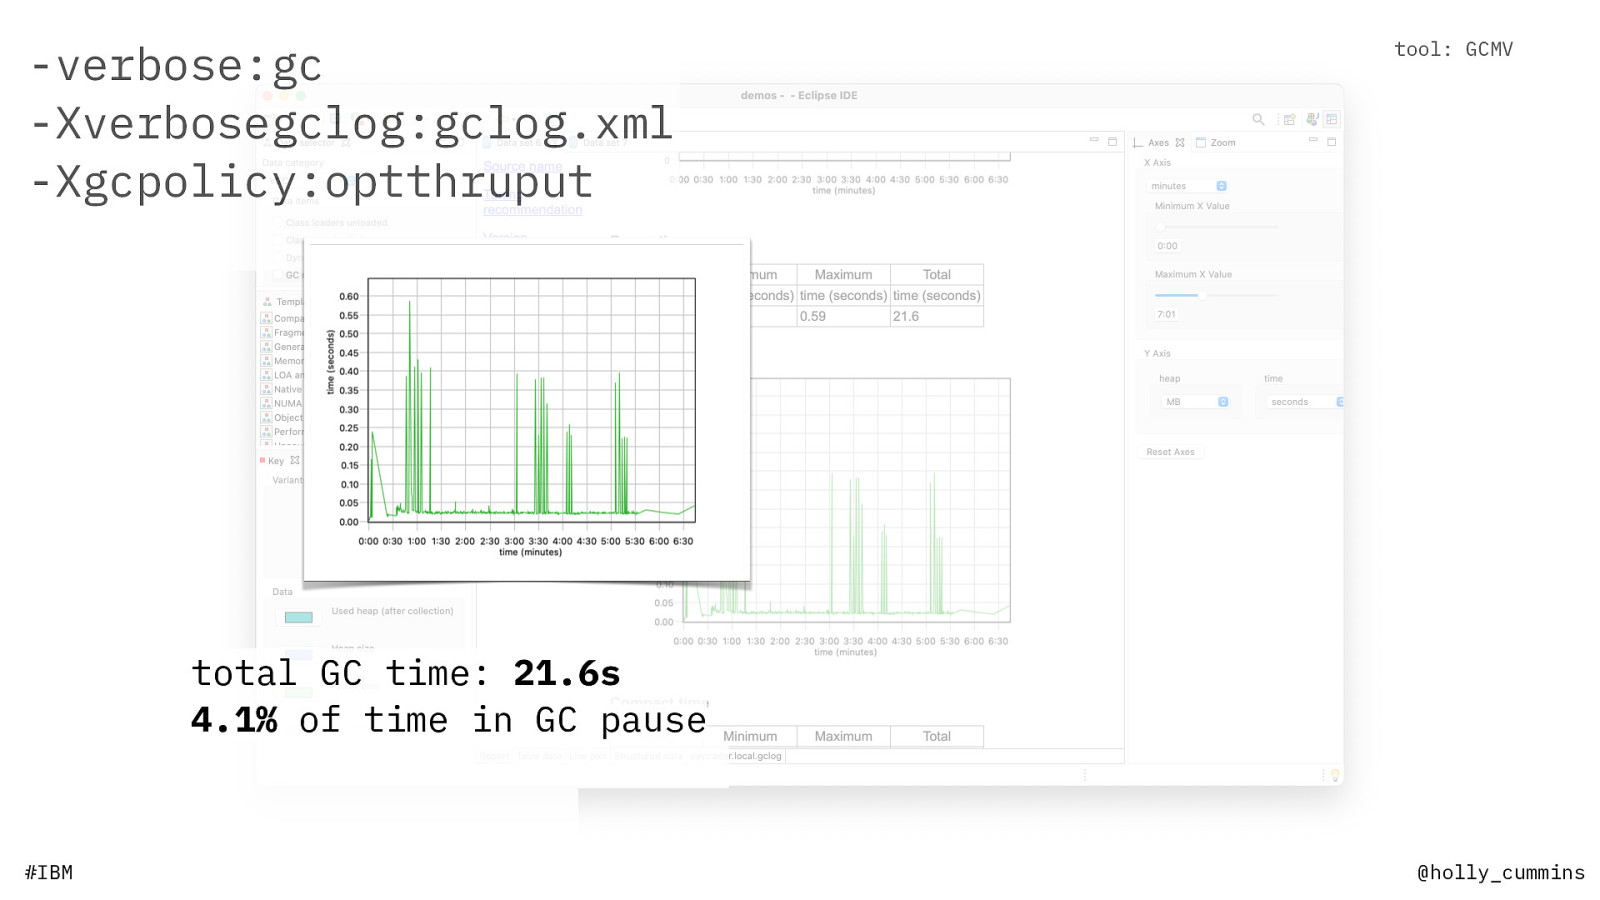
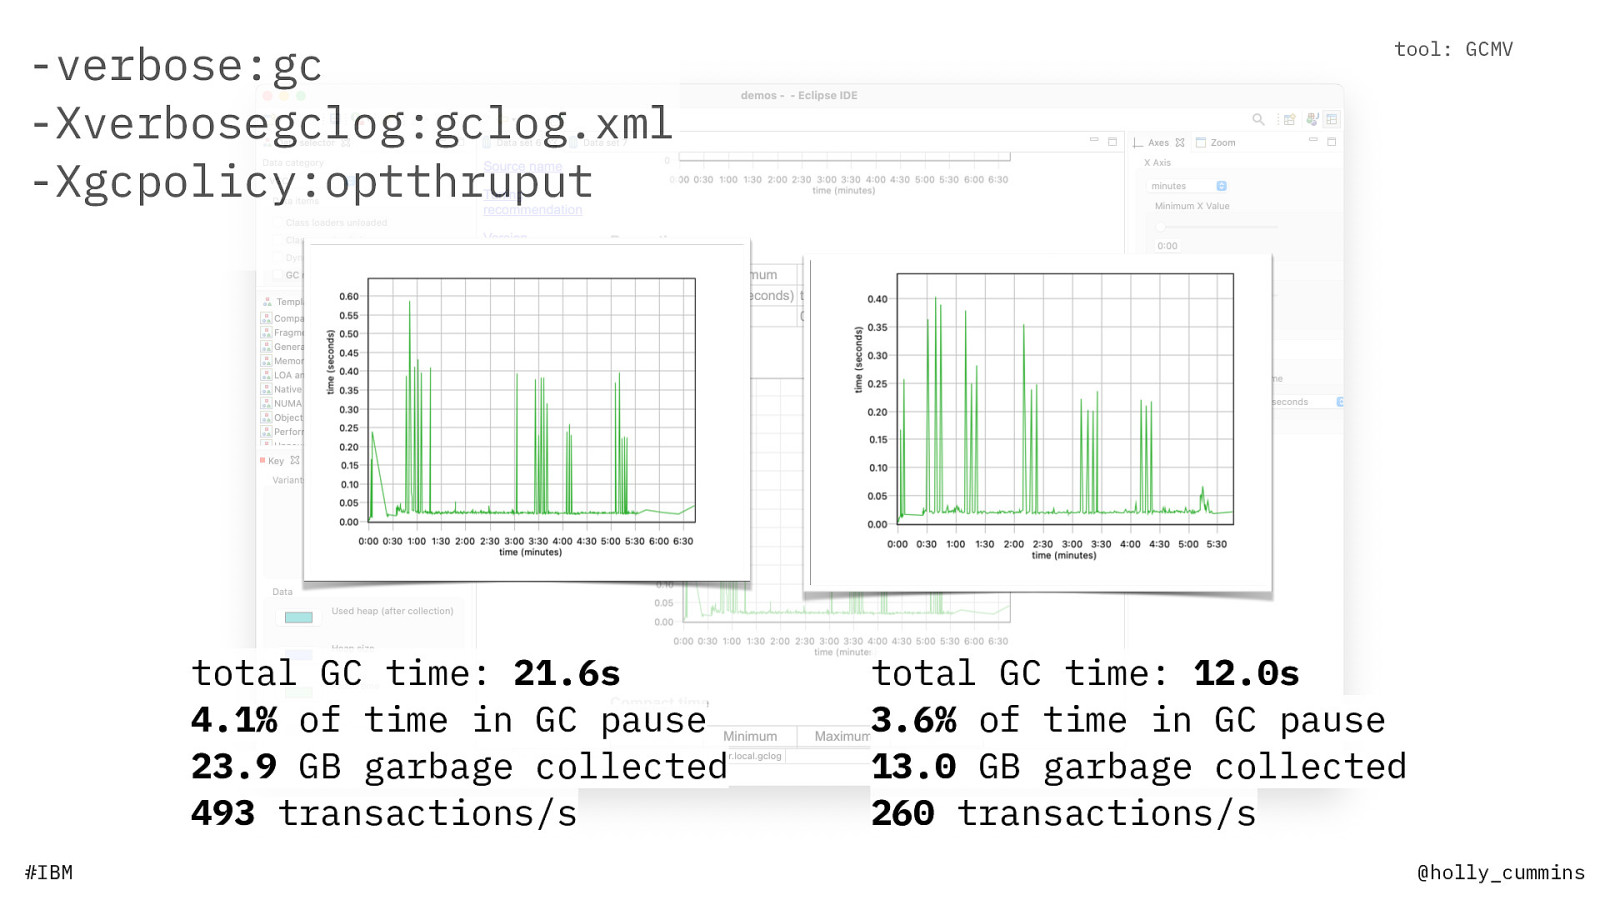
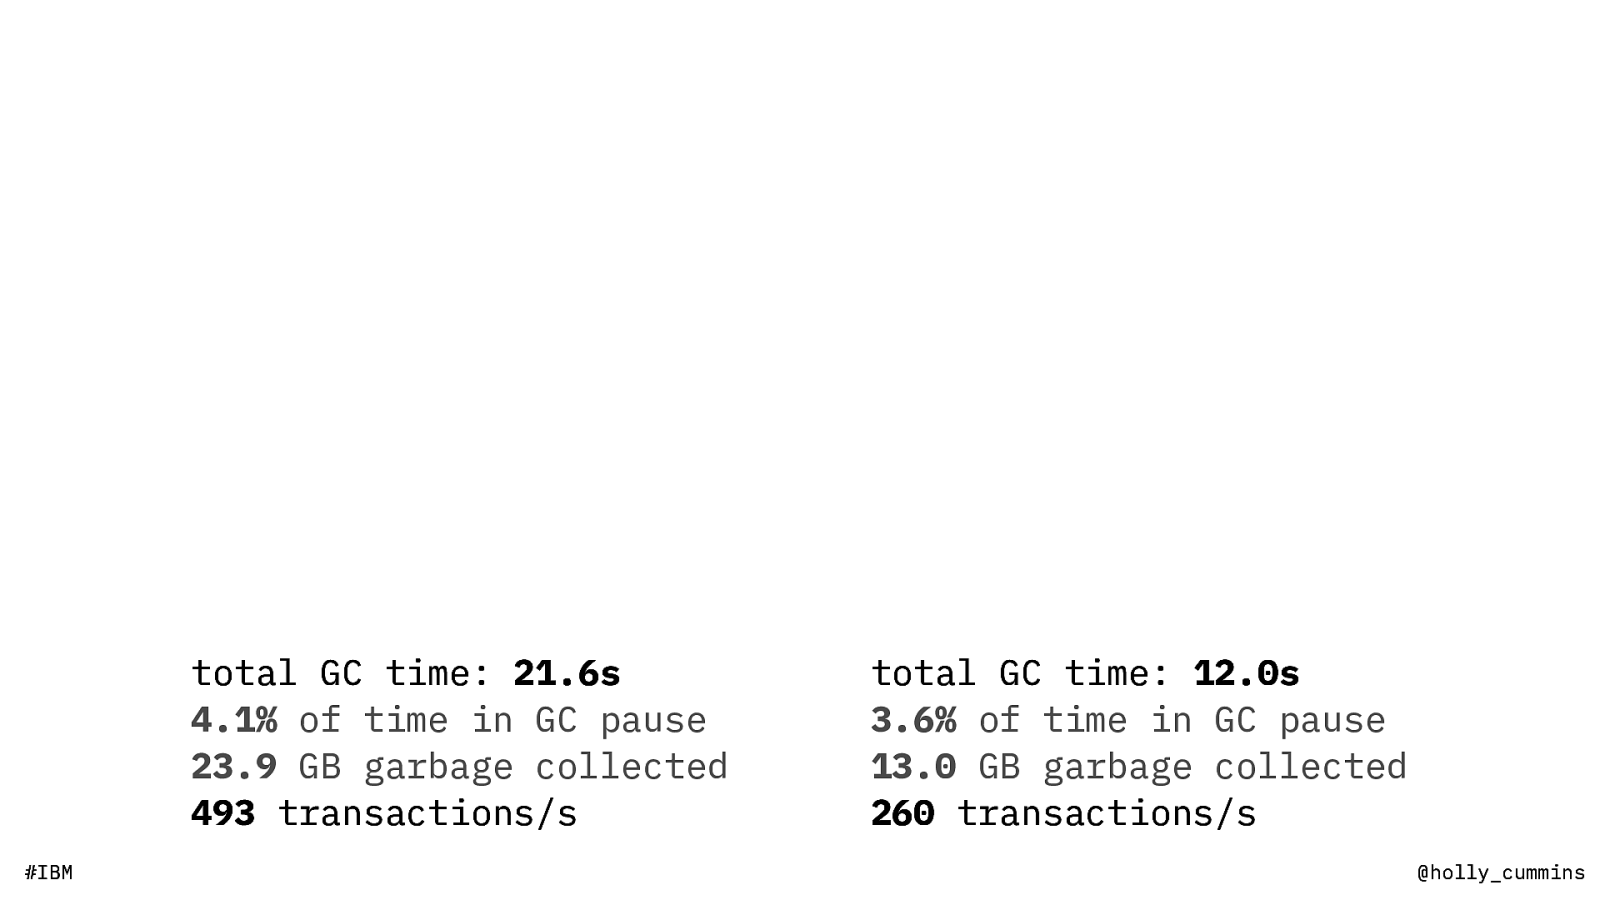
total GC time: 21.6s 4.1% of time in GC pause 23.9 GB garbage collected 493 transactions/s #IBM total GC time: 12.0s 3.6% of time in GC pause 13.0 GB garbage collected 260 transactions/s @holly_cummins
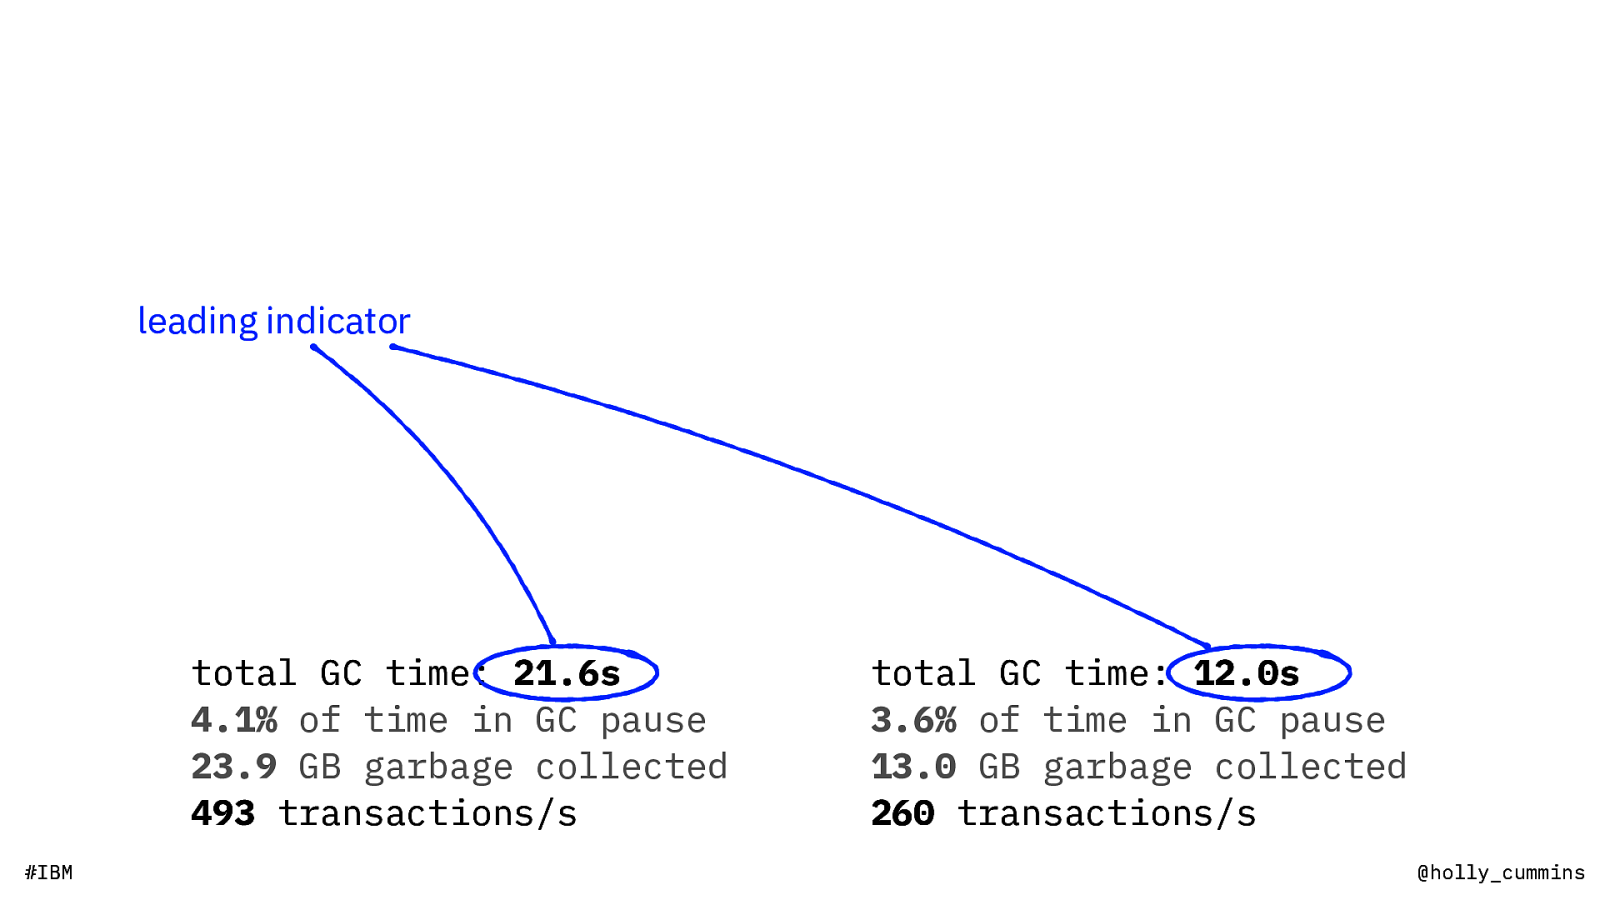
leading indicator total GC time: 21.6s 4.1% of time in GC pause 23.9 GB garbage collected 493 transactions/s #IBM total GC time: 12.0s 3.6% of time in GC pause 13.0 GB garbage collected 260 transactions/s @holly_cummins
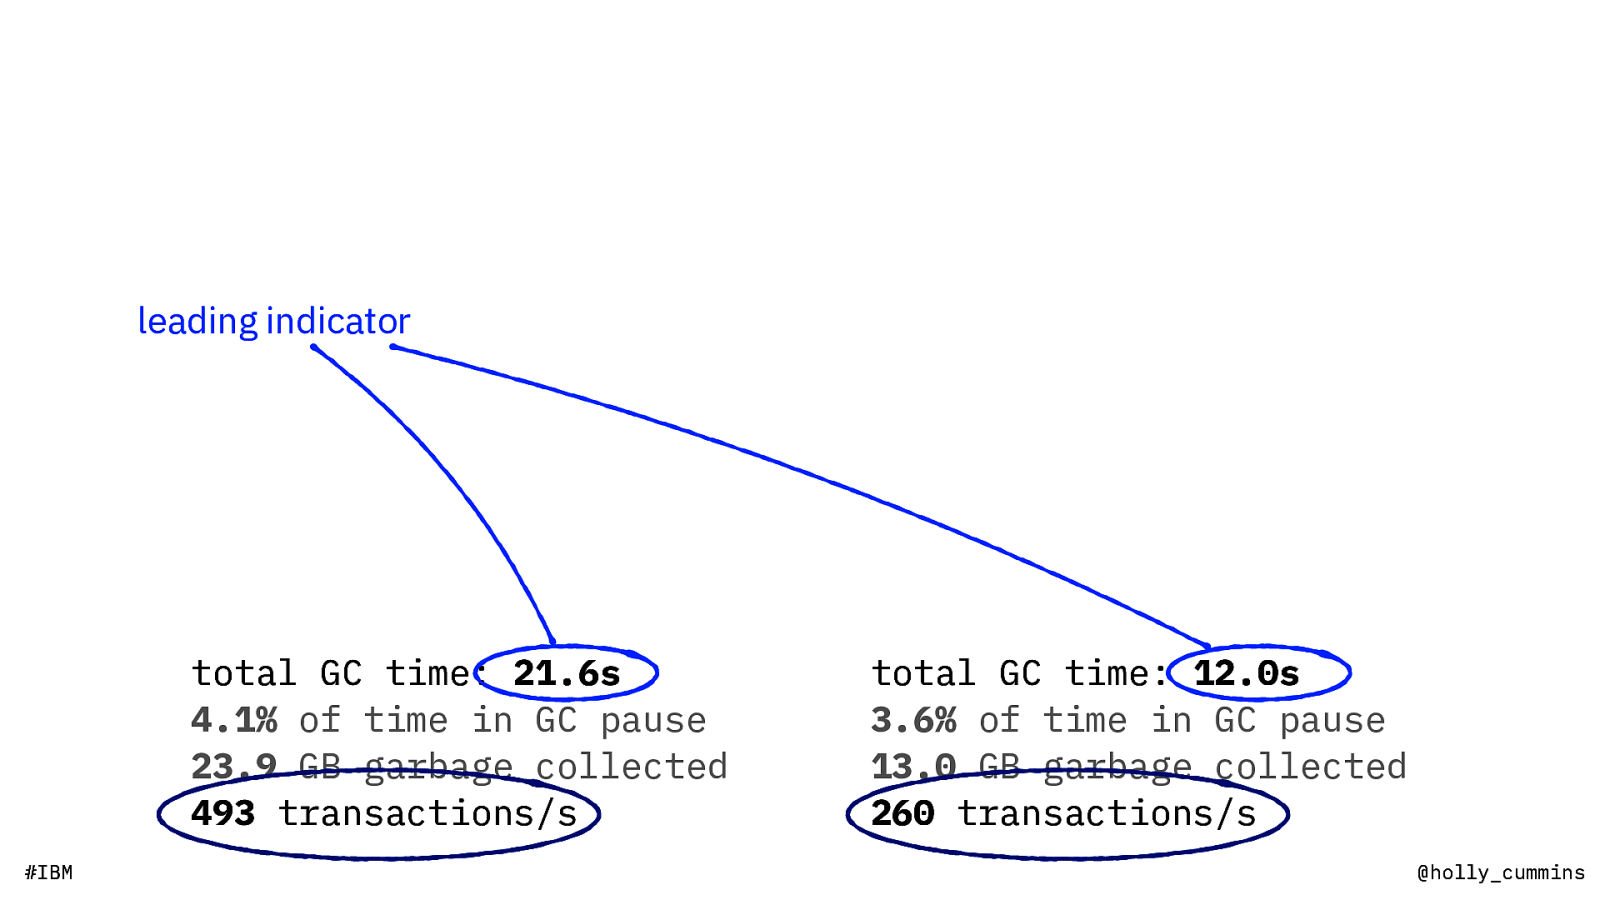
leading indicator total GC time: 21.6s 4.1% of time in GC pause 23.9 GB garbage collected 493 transactions/s #IBM total GC time: 12.0s 3.6% of time in GC pause 13.0 GB garbage collected 260 transactions/s @holly_cummins
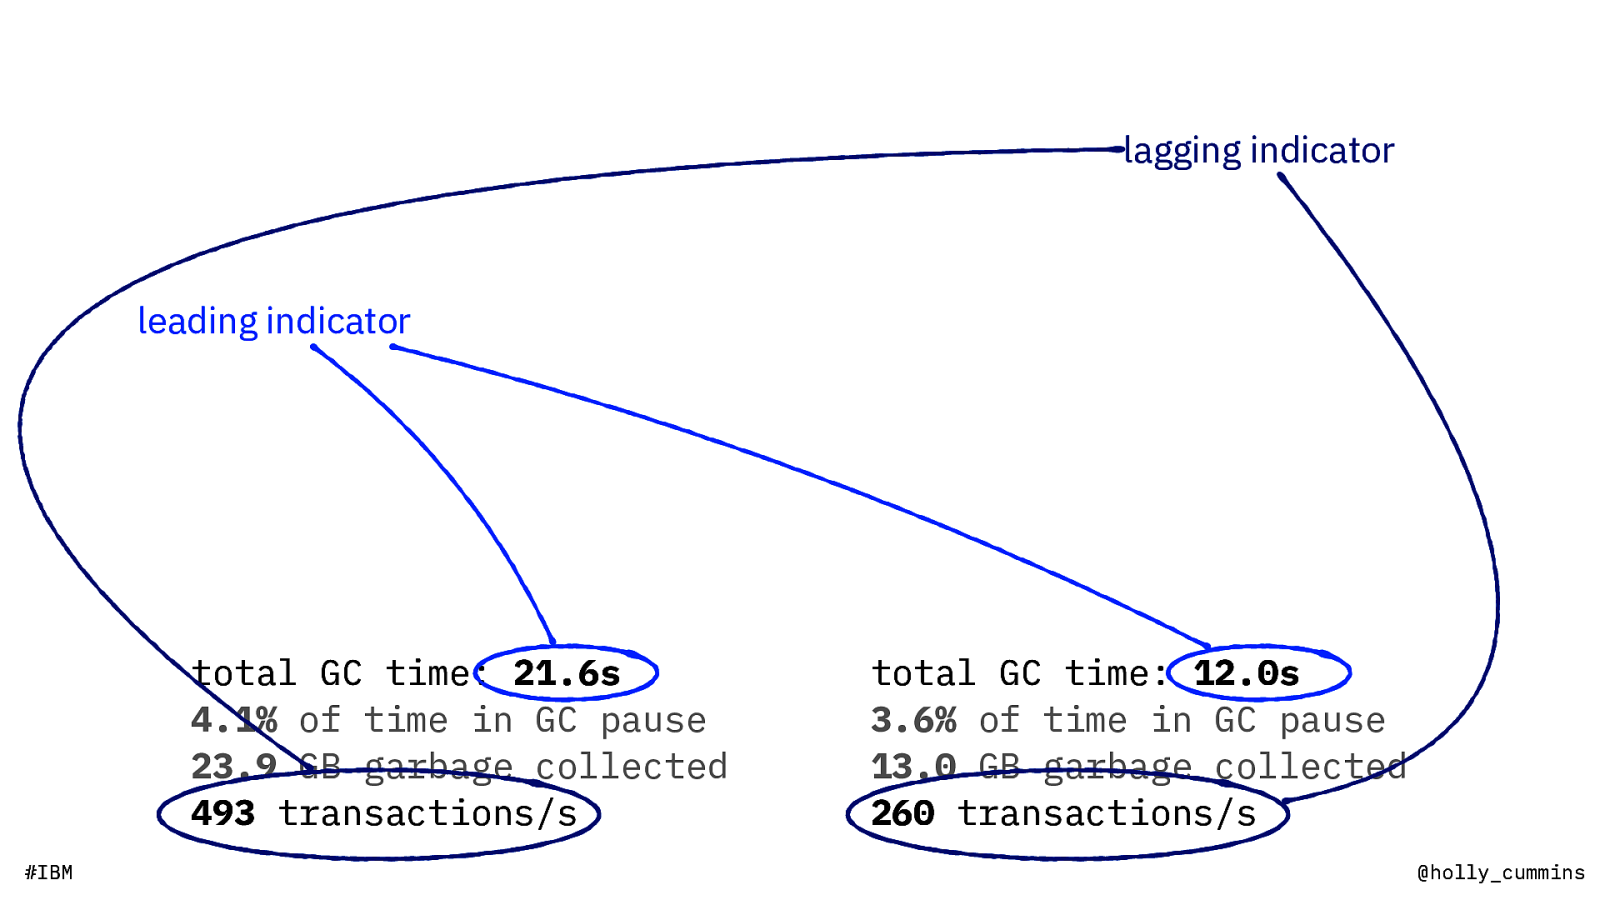
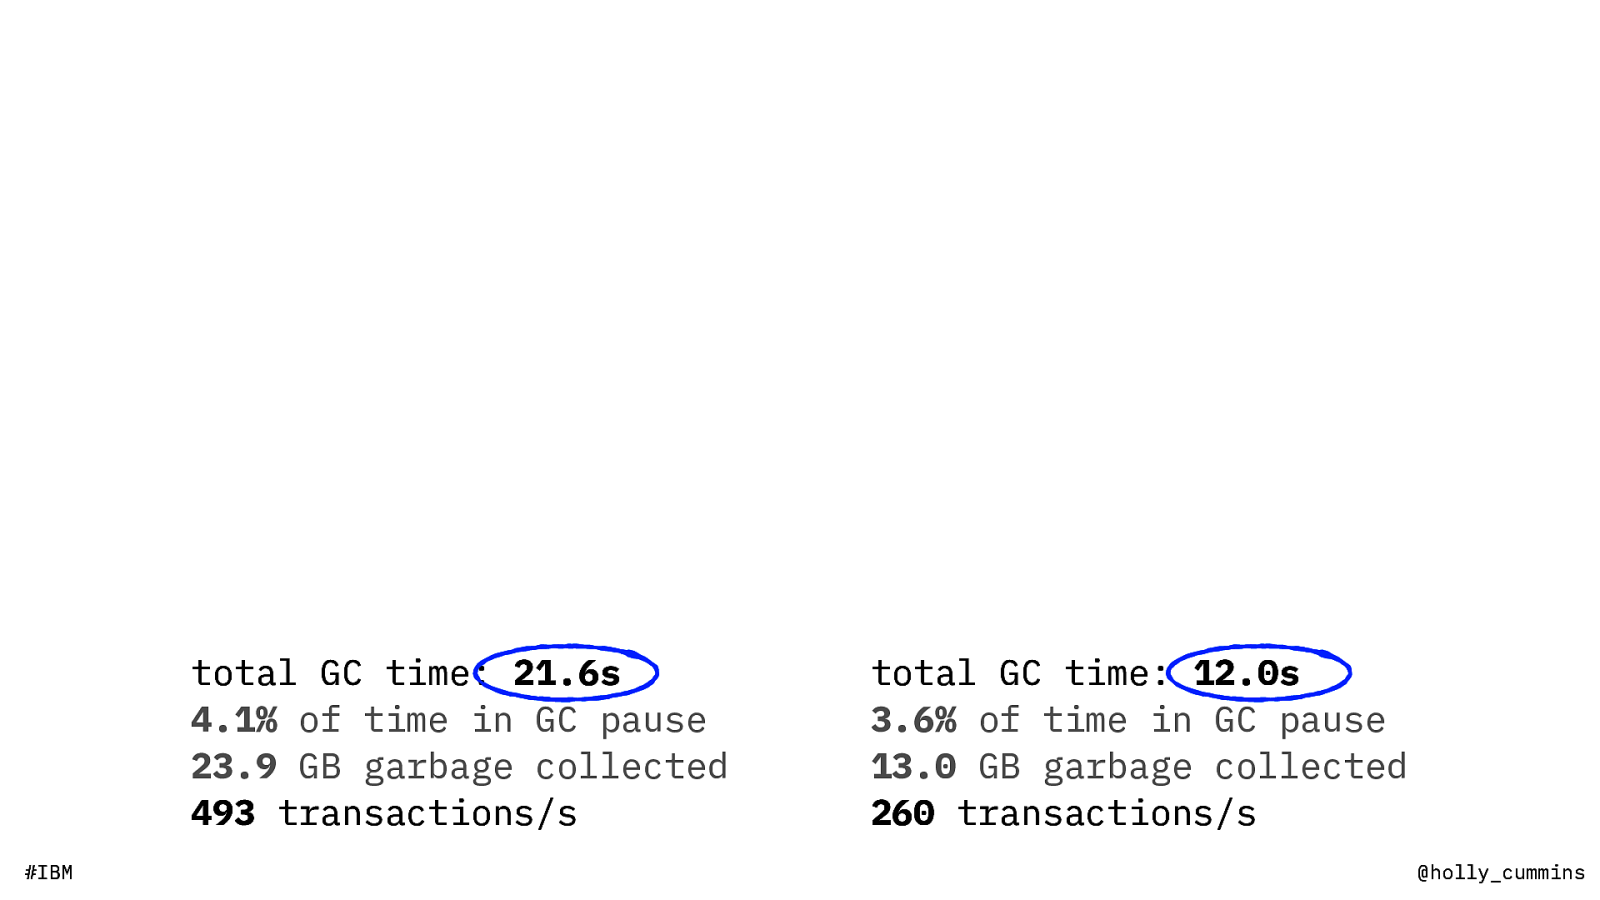
lagging indicator leading indicator total GC time: 21.6s 4.1% of time in GC pause 23.9 GB garbage collected 493 transactions/s #IBM total GC time: 12.0s 3.6% of time in GC pause 13.0 GB garbage collected 260 transactions/s @holly_cummins

lagging indicator leading indicator ? total GC time: 21.6s 4.1% of time in GC pause 23.9 GB garbage collected 493 transactions/s #IBM total GC time: 12.0s 3.6% of time in GC pause 13.0 GB garbage collected 260 transactions/s @holly_cummins
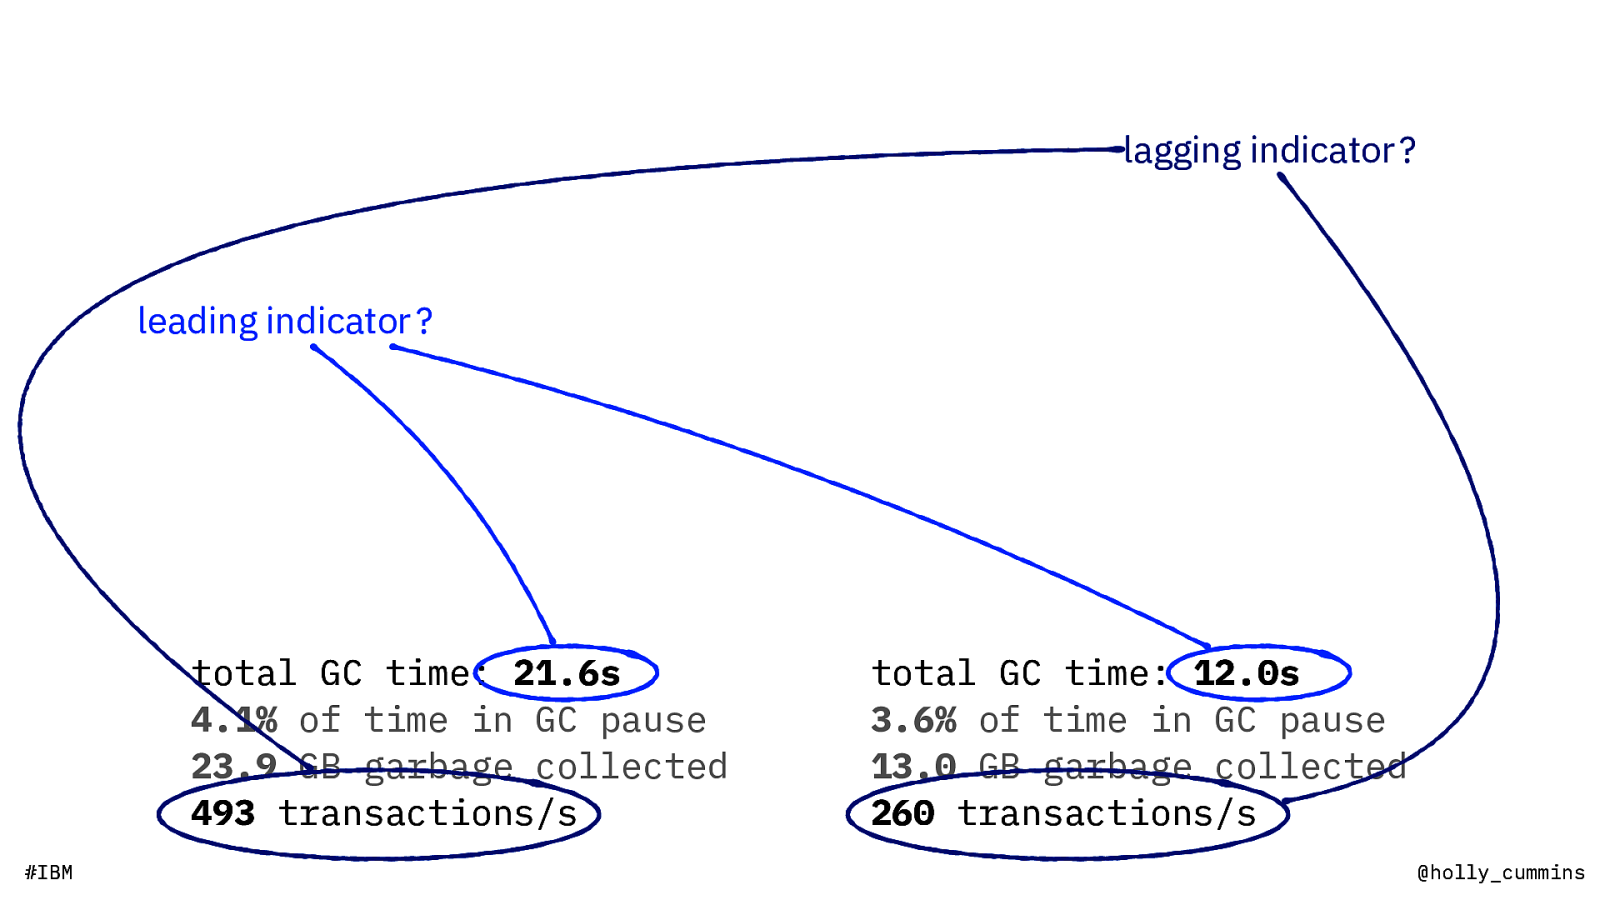
lagging indicator ? leading indicator ? total GC time: 21.6s 4.1% of time in GC pause 23.9 GB garbage collected 493 transactions/s #IBM total GC time: 12.0s 3.6% of time in GC pause 13.0 GB garbage collected 260 transactions/s @holly_cummins

“Any improvements made anywhere besides the bottleneck are an illusion.” – Gene Kim #IBM @holly_cummins
time kills all performance advice (even mine) #IBM @holly_cummins
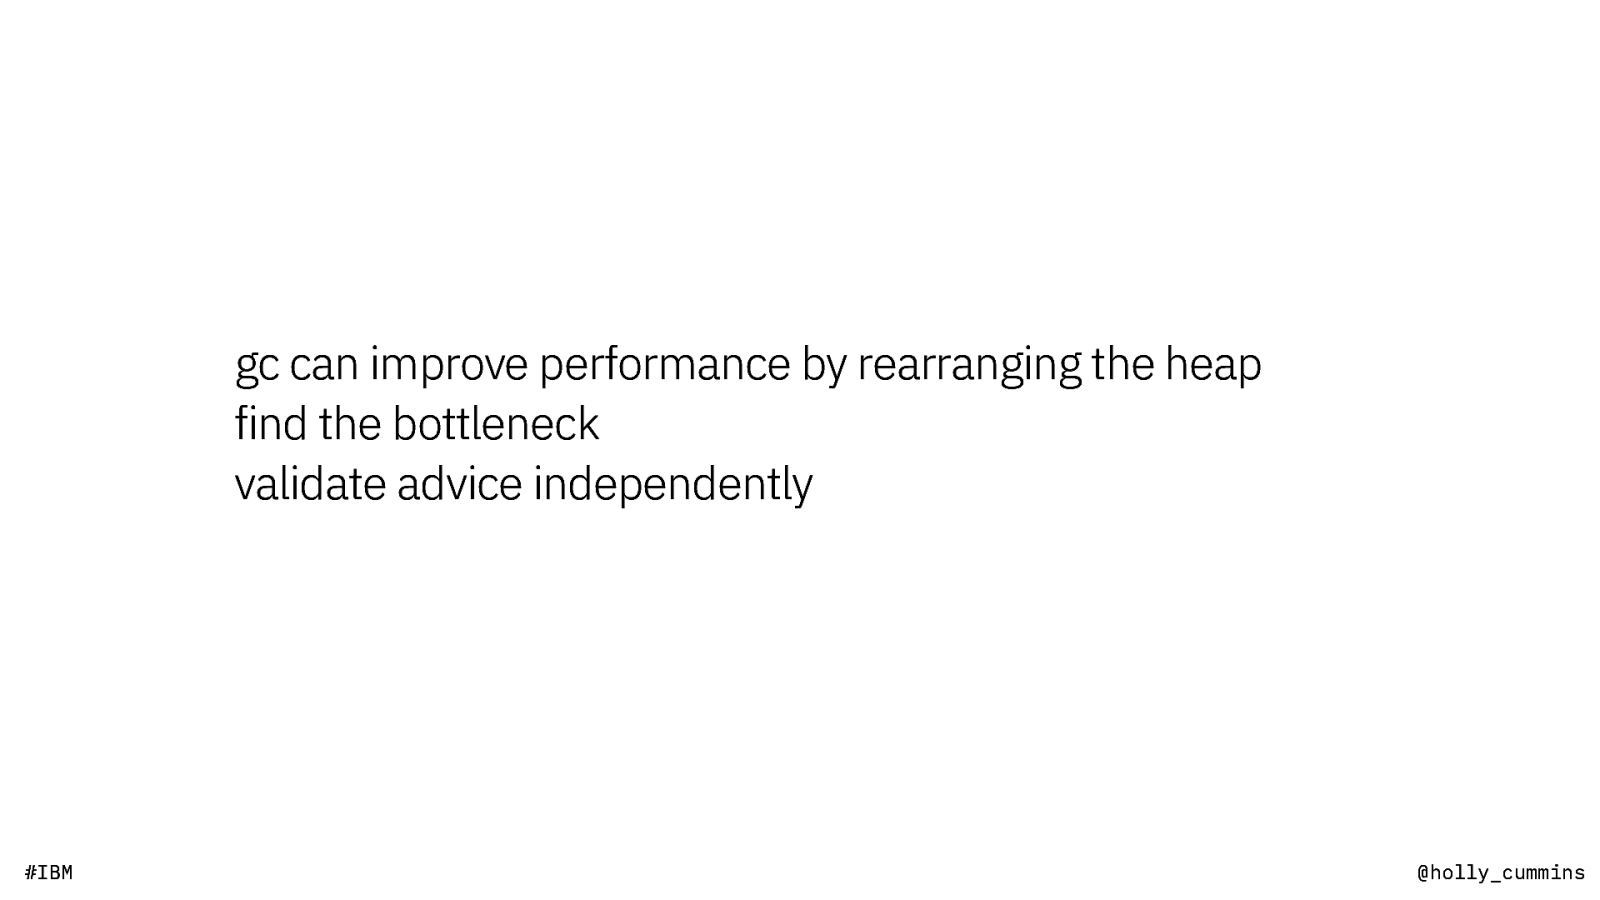
gc can improve performance by rearranging the heap find the bottleneck validate advice independently #IBM @holly_cummins
pitfall 3 advice #IBM @holly_cummins

I read it on the internet! #IBM @holly_cummins
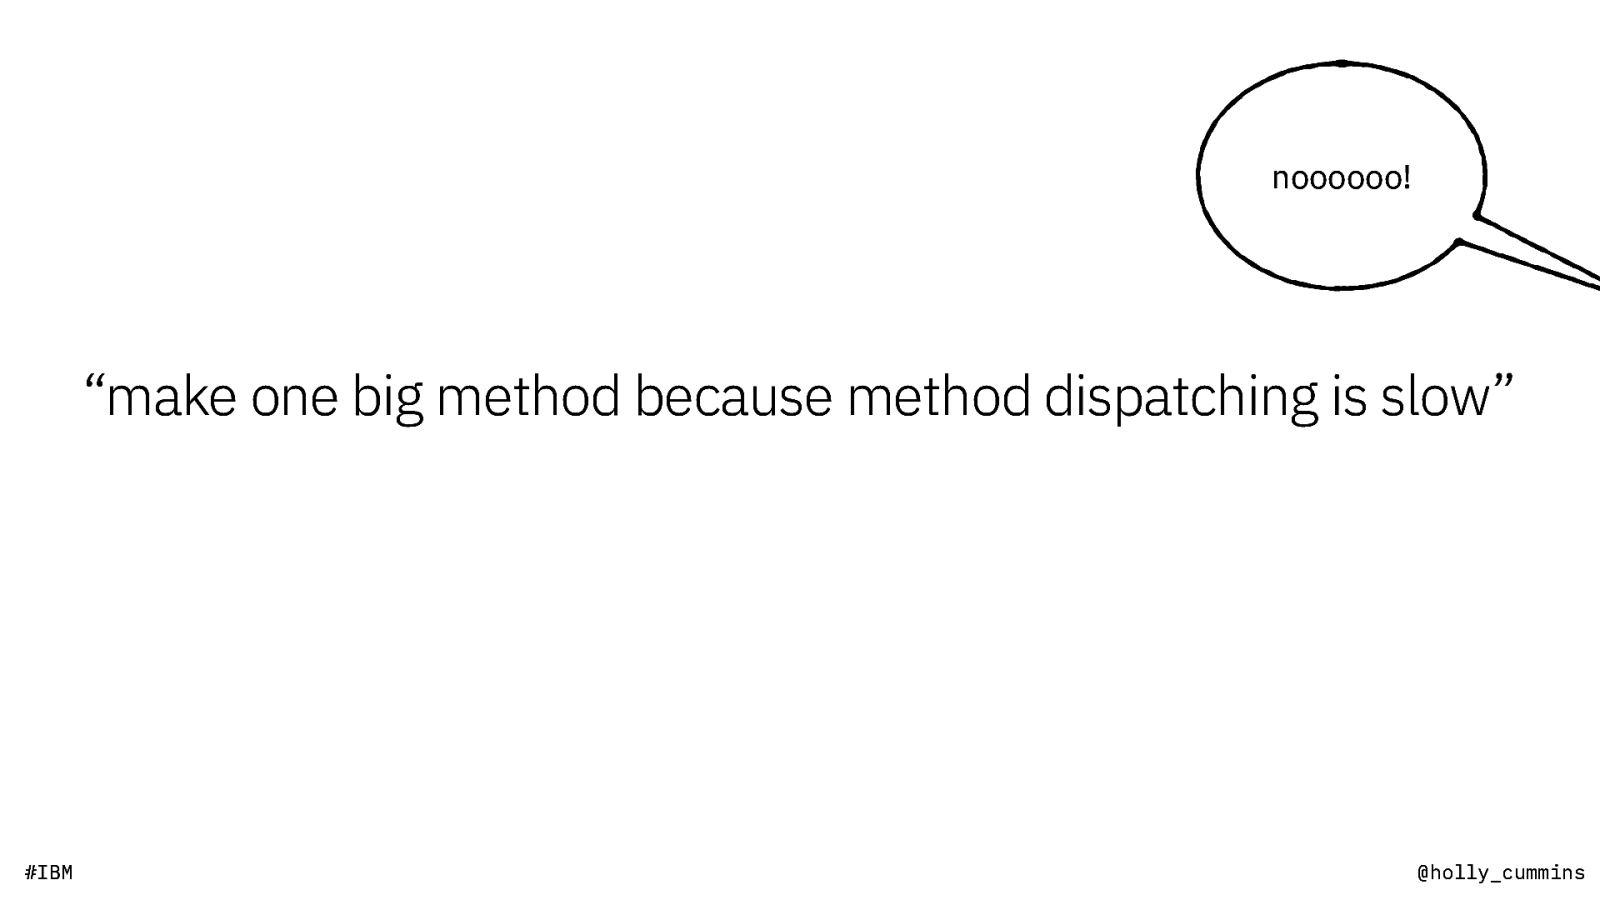
noooooo! “make one big method because method dispatching is slow” #IBM @holly_cummins
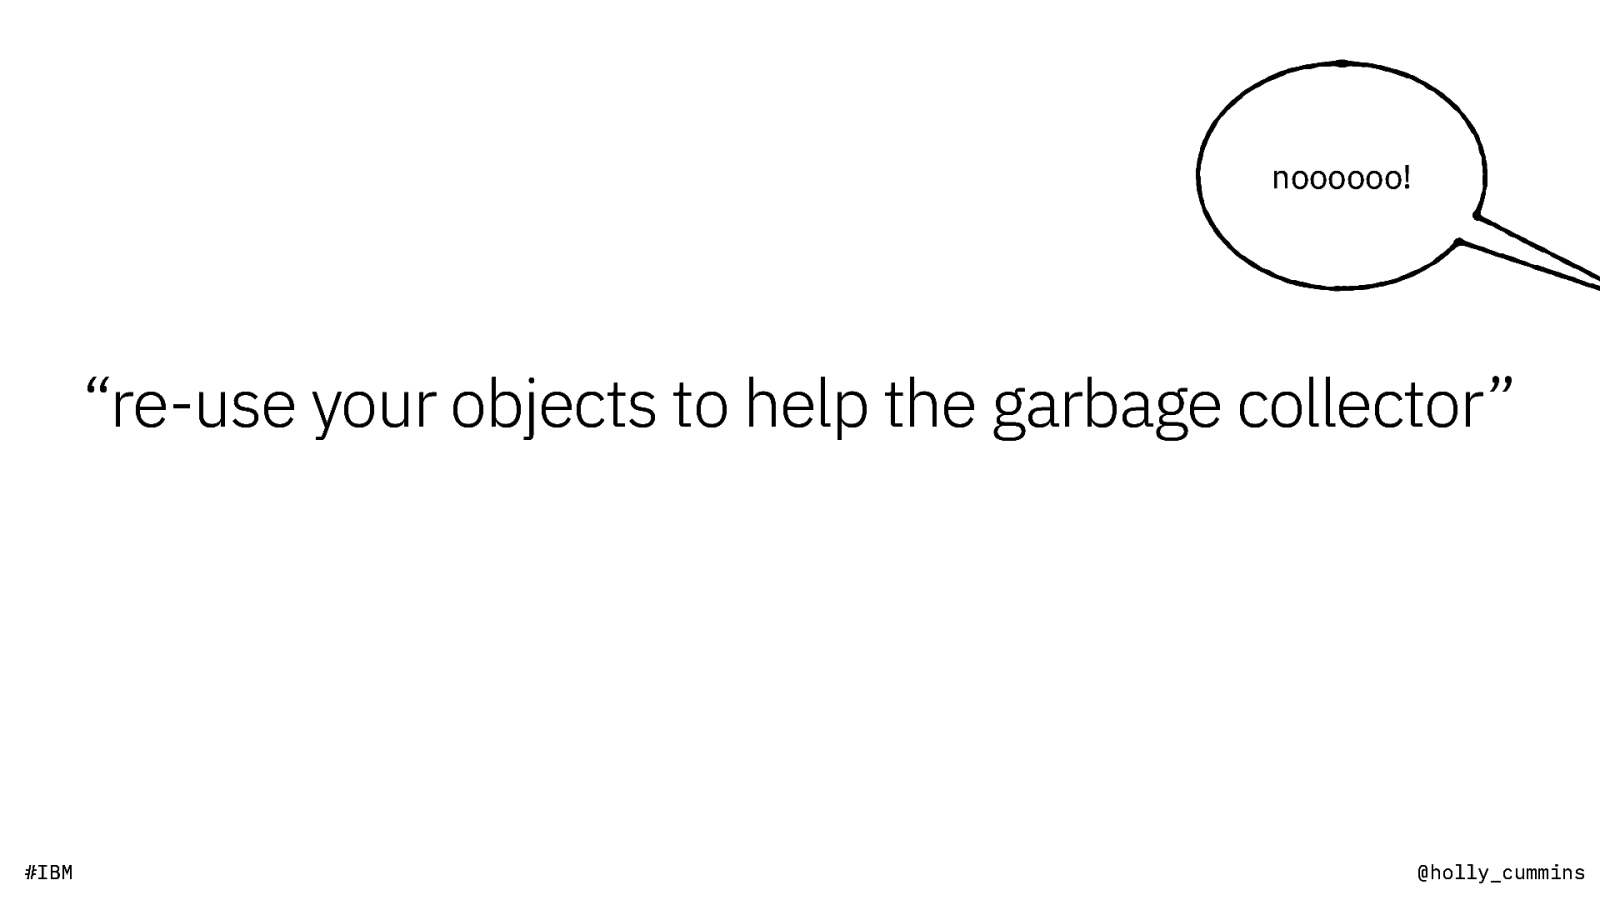
noooooo! “re-use your objects to help the garbage collector” #IBM @holly_cummins
noooooo!
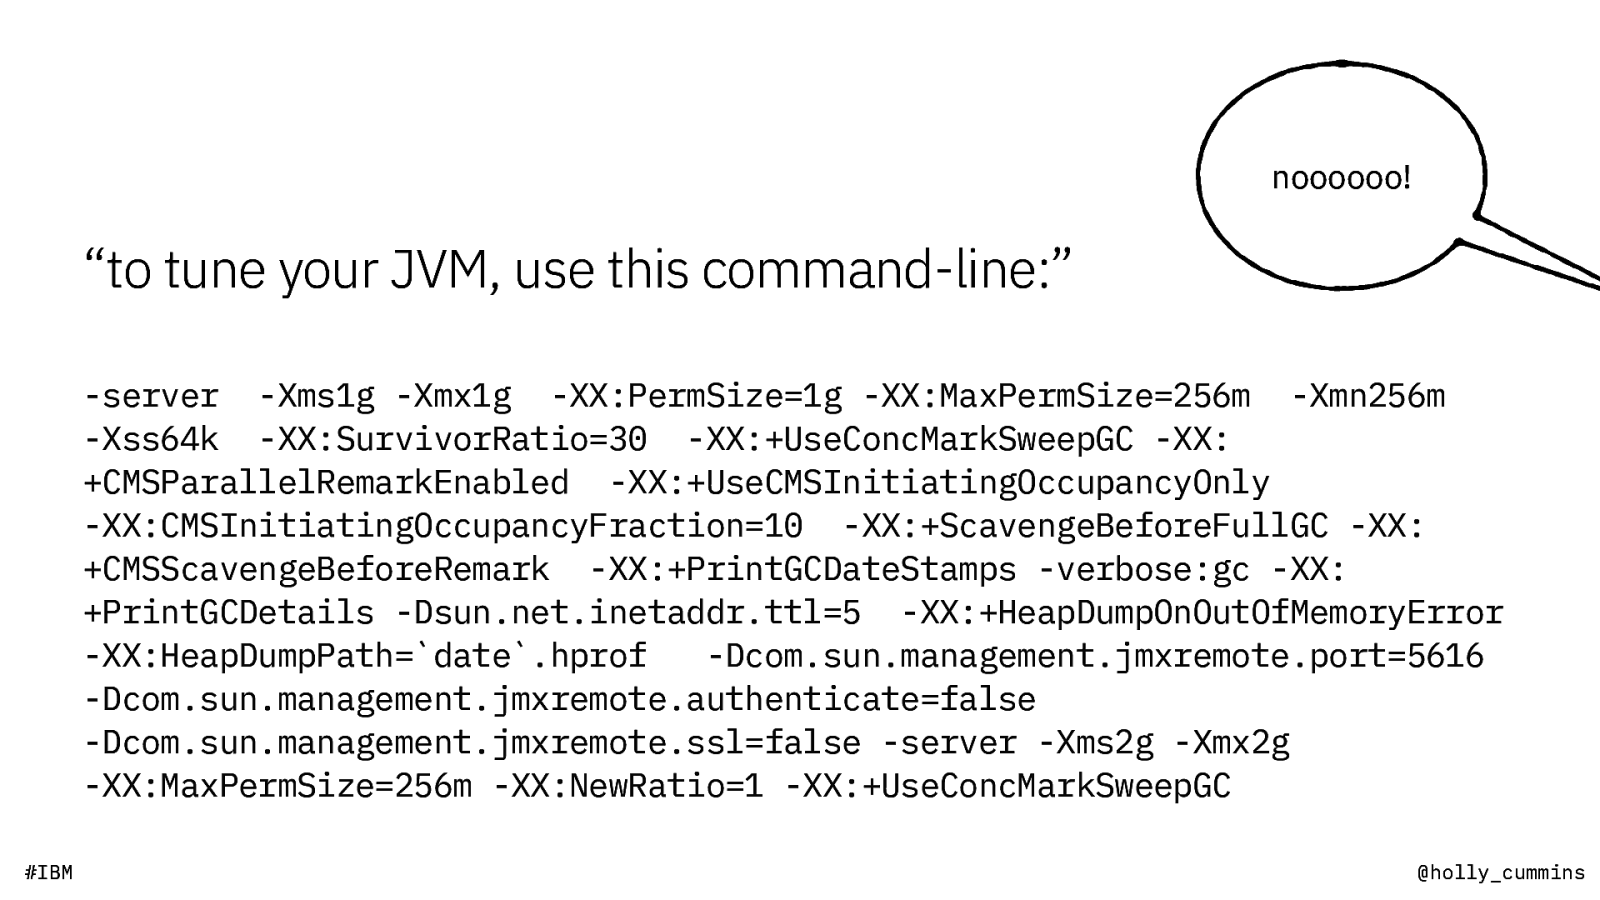
“to tune your JVM, use this command-line:” -server -Xms1g -Xmx1g -XX:PermSize=1g -XX:MaxPermSize=256m -Xmn256m -Xss64k -XX:SurvivorRatio=30 -XX:+UseConcMarkSweepGC -XX: +CMSParallelRemarkEnabled -XX:+UseCMSInitiatingOccupancyOnly -XX:CMSInitiatingOccupancyFraction=10 -XX:+ScavengeBeforeFullGC -XX: +CMSScavengeBeforeRemark -XX:+PrintGCDateStamps -verbose:gc -XX: +PrintGCDetails -Dsun.net.inetaddr.ttl=5 -XX:+HeapDumpOnOutOfMemoryError -XX:HeapDumpPath=date.hprof -Dcom.sun.management.jmxremote.port=5616 -Dcom.sun.management.jmxremote.authenticate=false -Dcom.sun.management.jmxremote.ssl=false -server -Xms2g -Xmx2g -XX:MaxPermSize=256m -XX:NewRatio=1 -XX:+UseConcMarkSweepGC #IBM
@holly_cummins
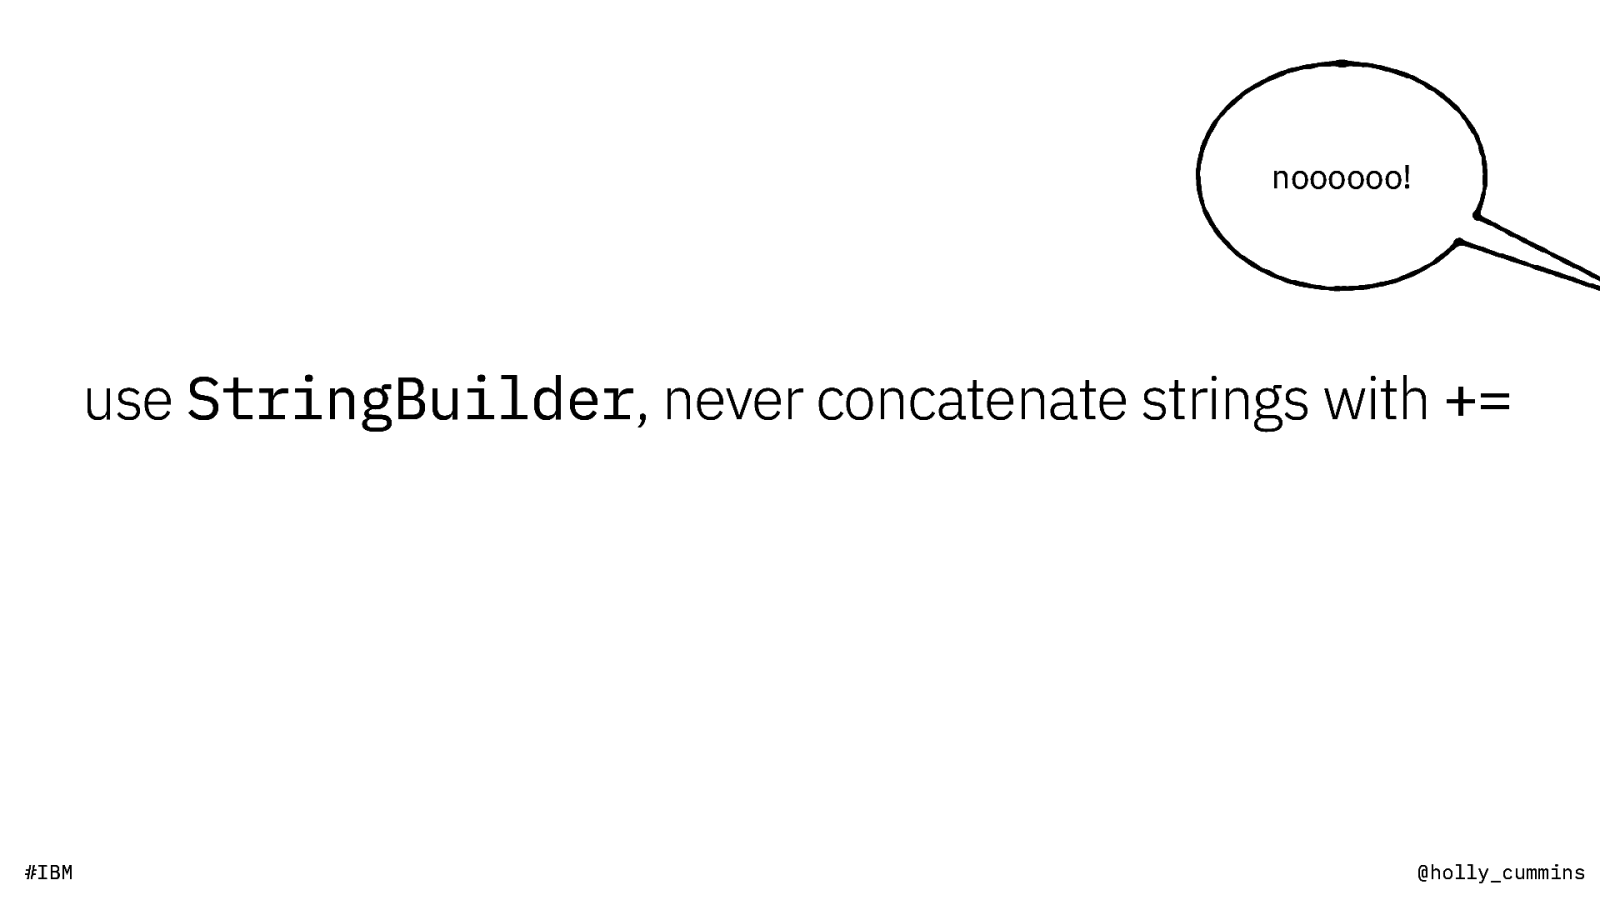
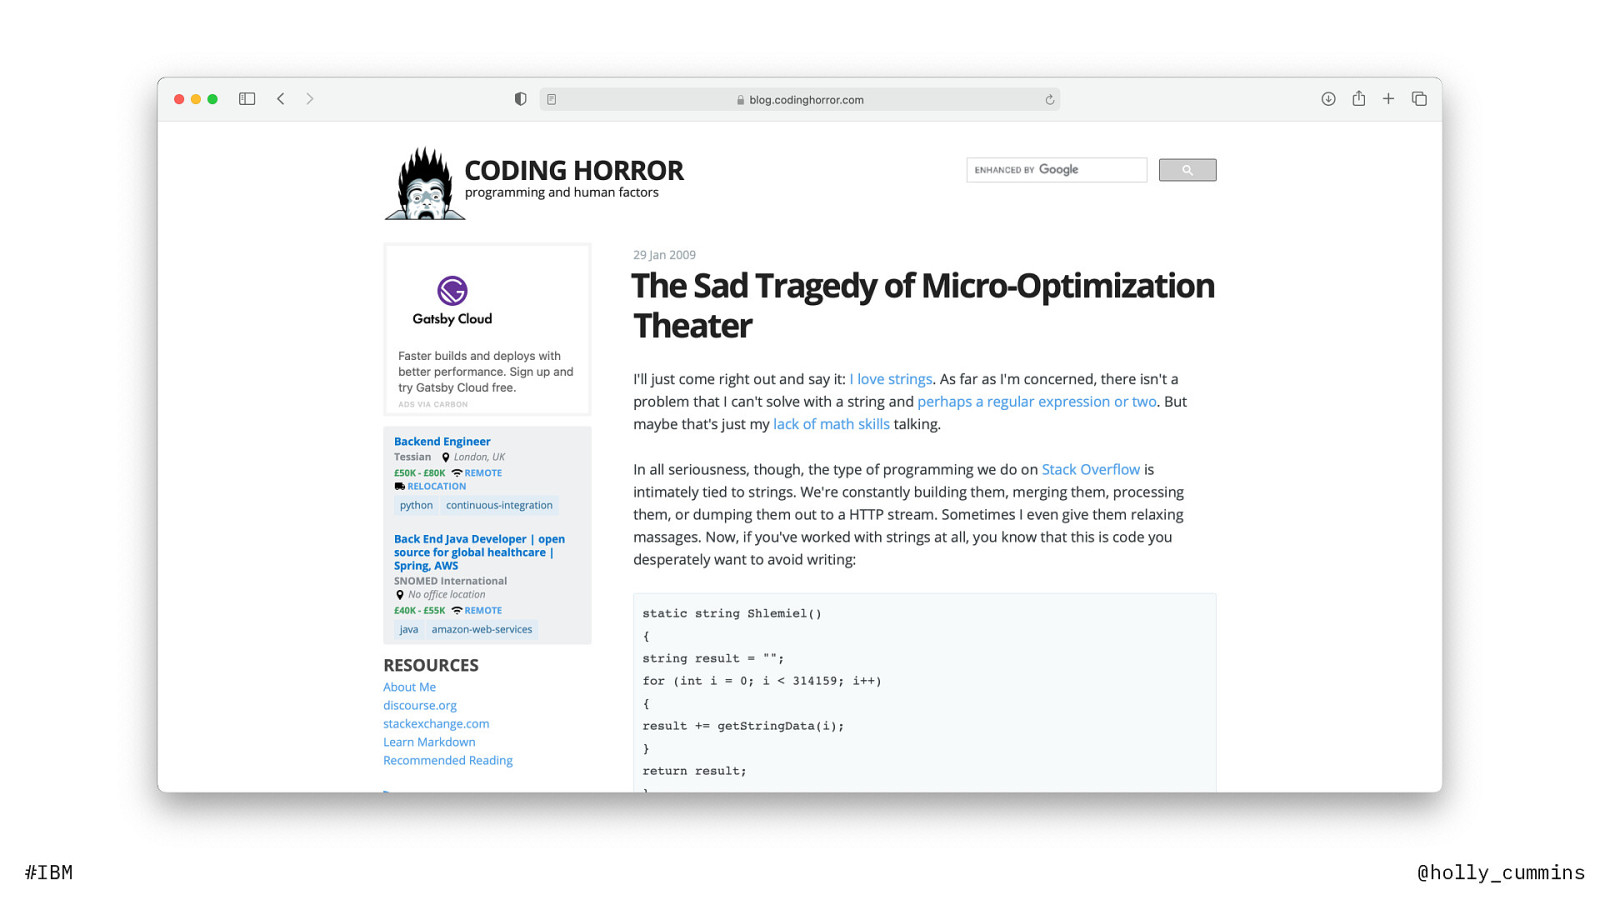
noooooo! use StringBuilder, never concatenate strings with += #IBM @holly_cummins
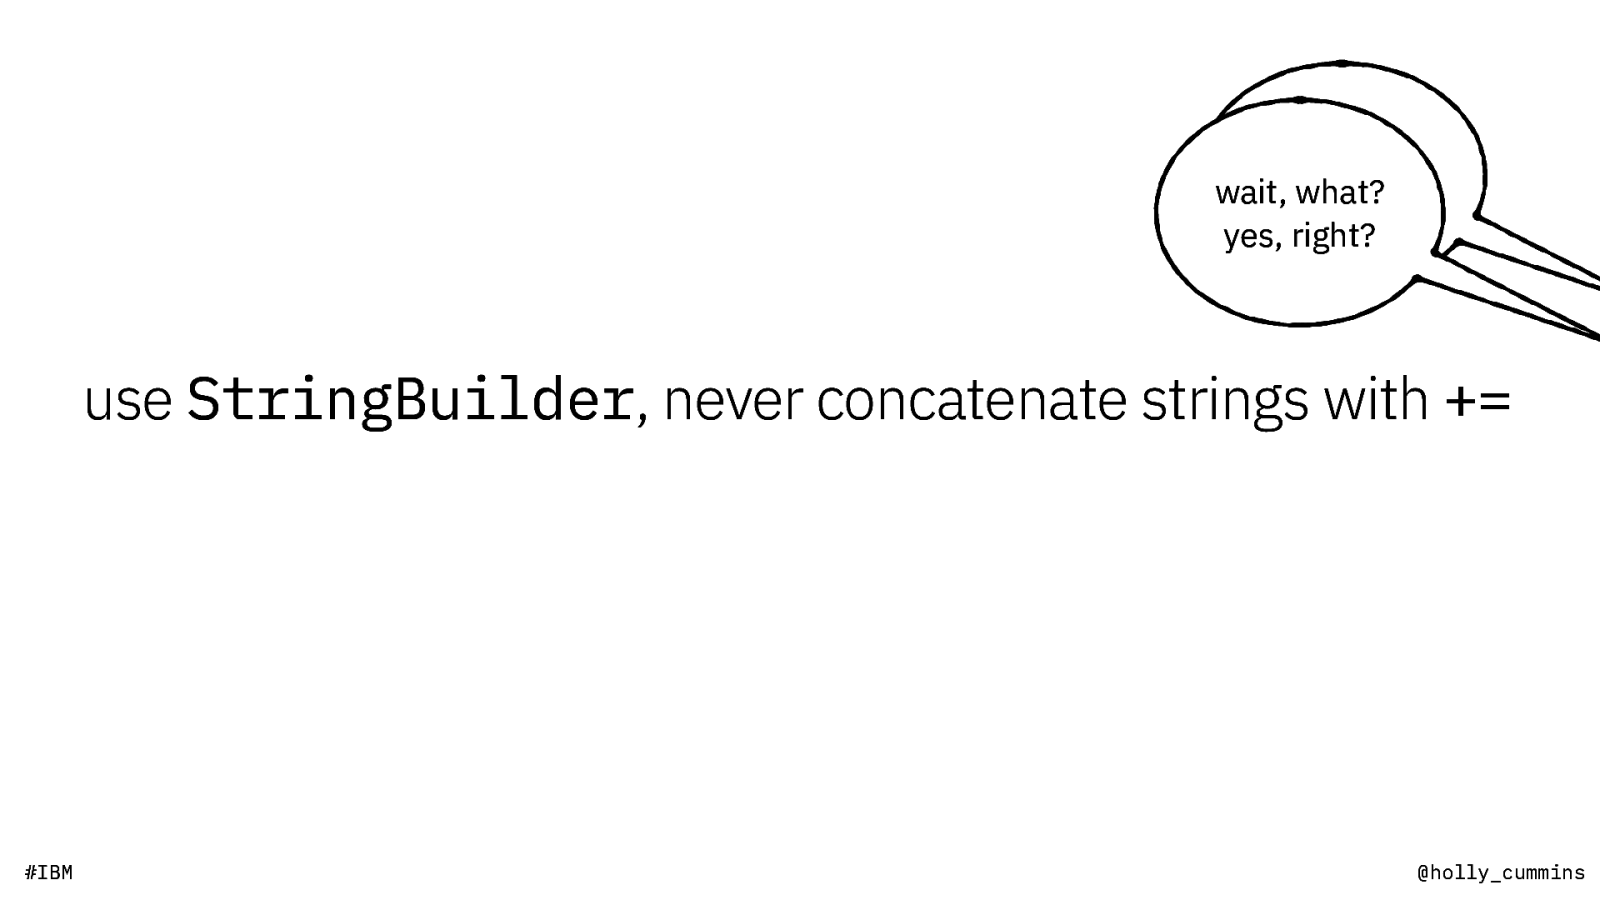
noooooo! wait, what? yes, right? use StringBuilder, never concatenate strings with += #IBM @holly_cummins

2 things ruin advice: context time #IBM @holly_cummins
pitfall 4 micro-optimisation #IBM @holly_cummins
#IBM @holly_cummins
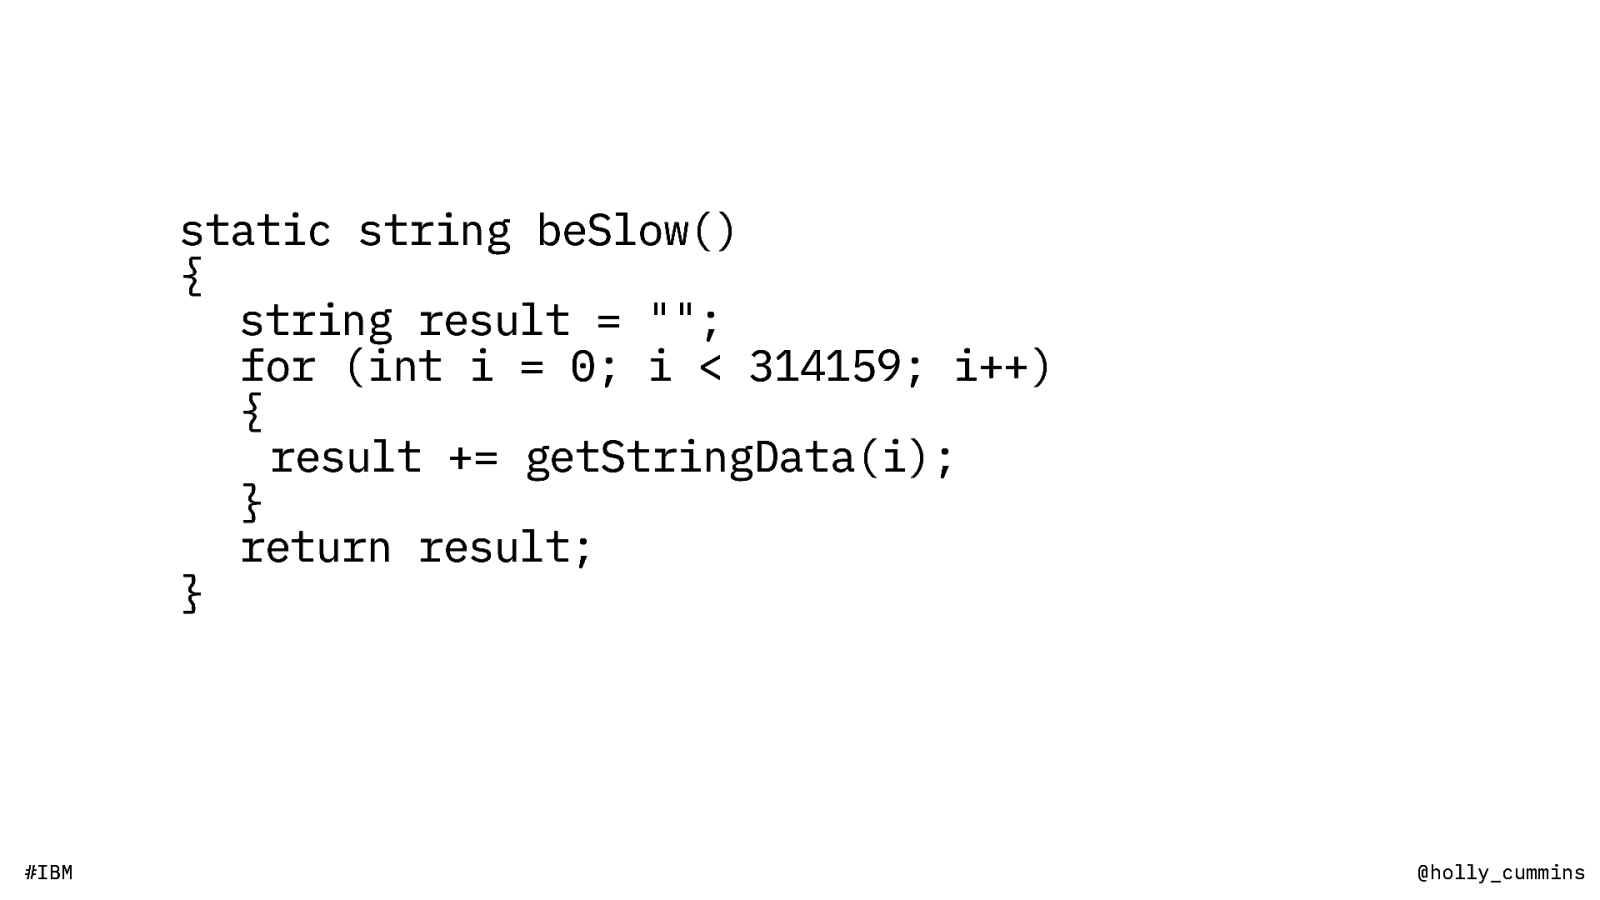
static string beSlow() { string result = “”; for (int i = 0; i < 314159; i++) { result += getStringData(i); } return result; } #IBM @holly_cummins
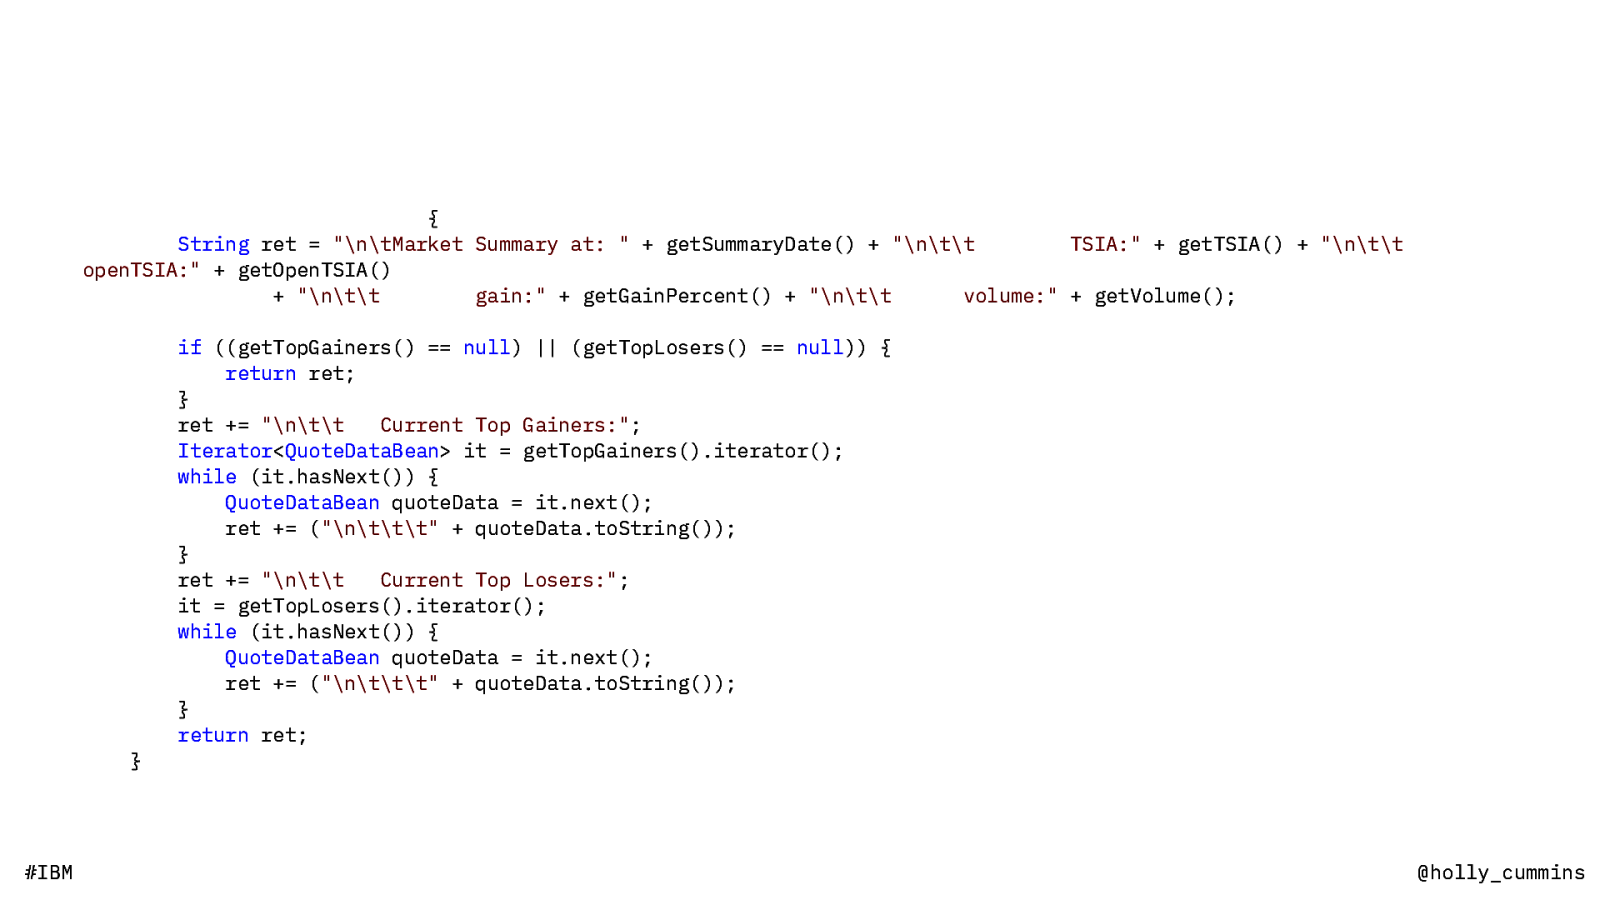
@Override public String toString() { String ret = “\n\tMarket Summary at: ” + getSummaryDate() + “\n\t\t TSIA:” + getTSIA() + “\n\t\t openTSIA:” + getOpenTSIA() + “\n\t\t gain:” + getGainPercent() + “\n\t\t volume:” + getVolume(); if ((getTopGainers() == null) || (getTopLosers() == null)) { return ret; } ret += “\n\t\t Current Top Gainers:”; Iterator<QuoteDataBean> it = getTopGainers().iterator(); while (it.hasNext()) { QuoteDataBean quoteData = it.next(); ret += (“\n\t\t\t” + quoteData.toString()); } ret += “\n\t\t Current Top Losers:”; it = getTopLosers().iterator(); while (it.hasNext()) { QuoteDataBean quoteData = it.next(); ret += (“\n\t\t\t” + quoteData.toString()); } return ret; } #IBM @holly_cummins
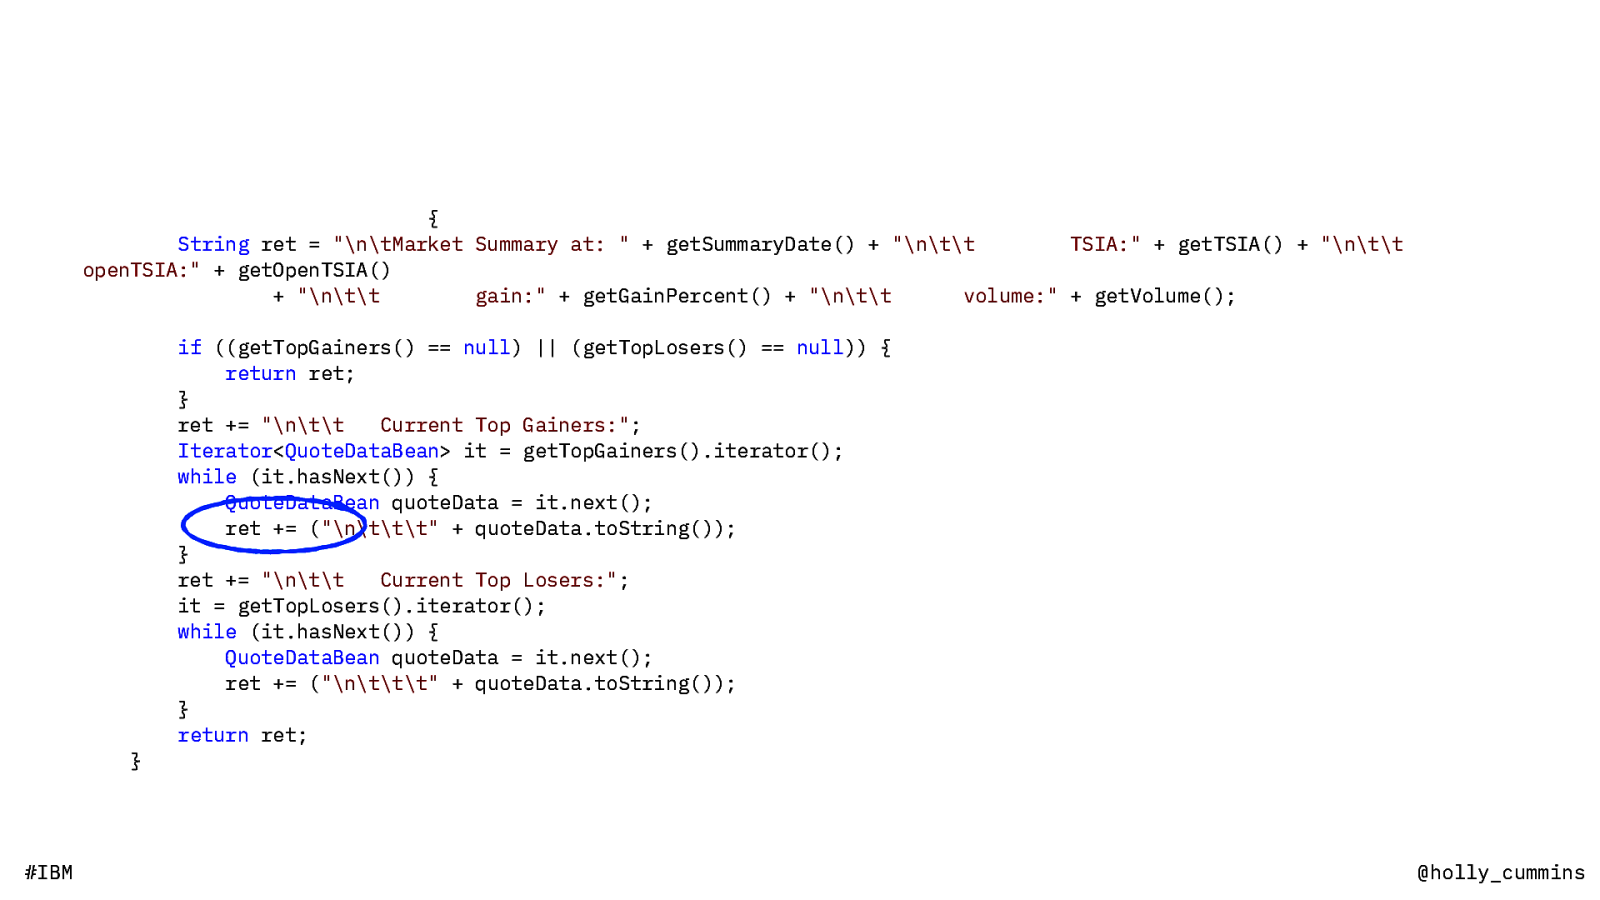
@Override public String toString() { String ret = “\n\tMarket Summary at: ” + getSummaryDate() + “\n\t\t TSIA:” + getTSIA() + “\n\t\t openTSIA:” + getOpenTSIA() + “\n\t\t gain:” + getGainPercent() + “\n\t\t volume:” + getVolume(); if ((getTopGainers() == null) || (getTopLosers() == null)) { return ret; } ret += “\n\t\t Current Top Gainers:”; Iterator<QuoteDataBean> it = getTopGainers().iterator(); while (it.hasNext()) { QuoteDataBean quoteData = it.next(); ret += (“\n\t\t\t” + quoteData.toString()); } ret += “\n\t\t Current Top Losers:”; it = getTopLosers().iterator(); while (it.hasNext()) { QuoteDataBean quoteData = it.next(); ret += (“\n\t\t\t” + quoteData.toString()); } return ret; } #IBM @holly_cummins
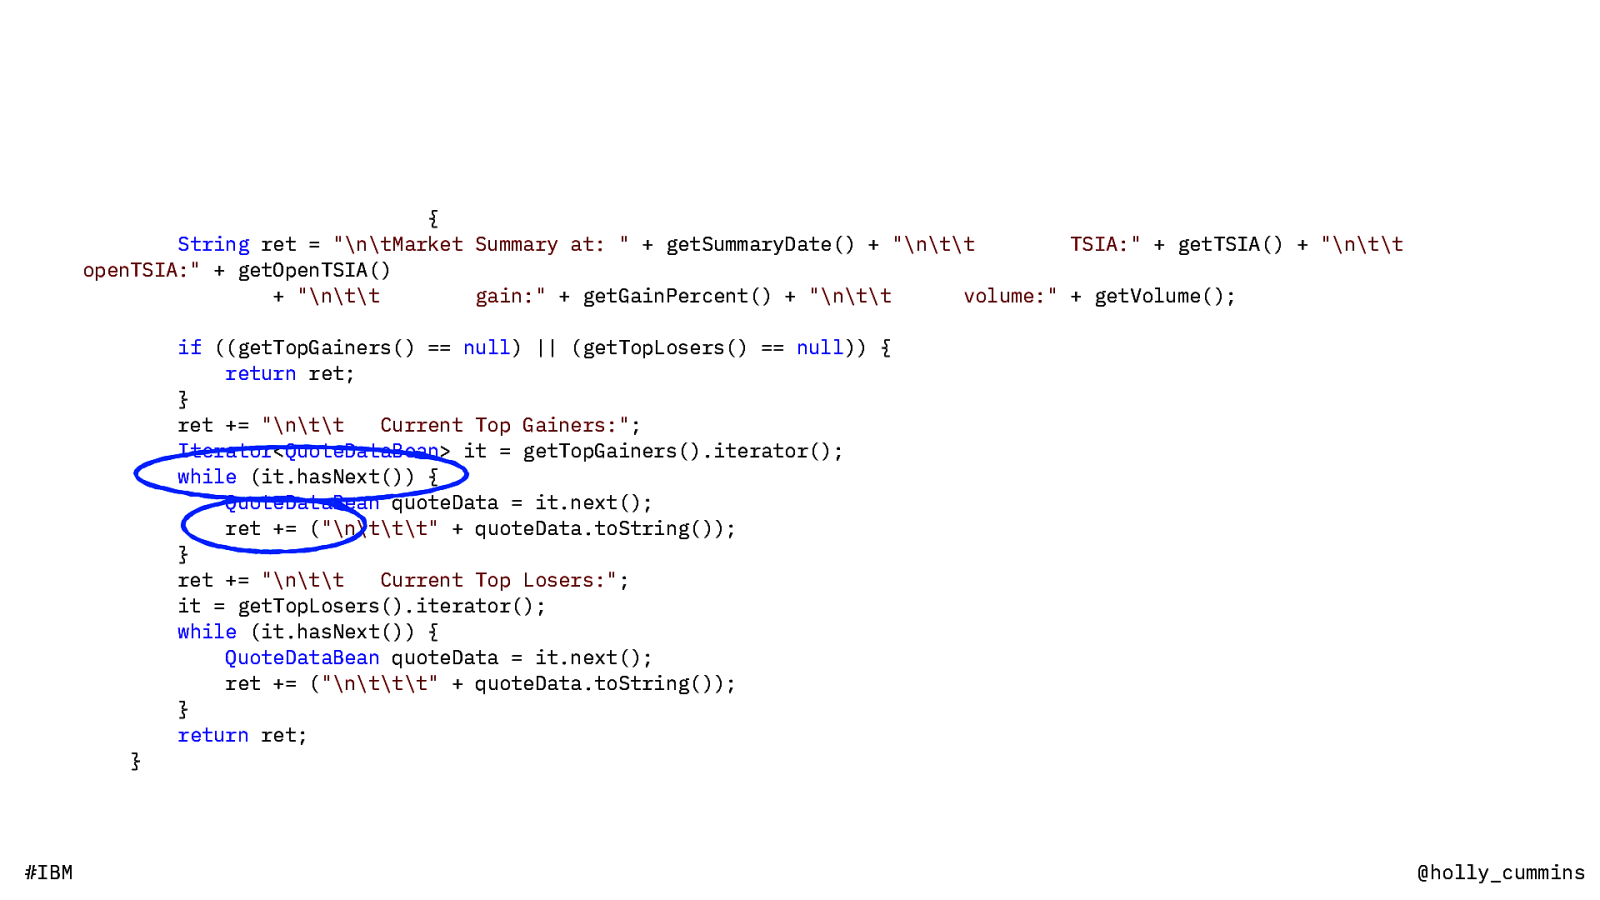
@Override public String toString() { String ret = “\n\tMarket Summary at: ” + getSummaryDate() + “\n\t\t TSIA:” + getTSIA() + “\n\t\t openTSIA:” + getOpenTSIA() + “\n\t\t gain:” + getGainPercent() + “\n\t\t volume:” + getVolume(); if ((getTopGainers() == null) || (getTopLosers() == null)) { return ret; } ret += “\n\t\t Current Top Gainers:”; Iterator<QuoteDataBean> it = getTopGainers().iterator(); while (it.hasNext()) { QuoteDataBean quoteData = it.next(); ret += (“\n\t\t\t” + quoteData.toString()); } ret += “\n\t\t Current Top Losers:”; it = getTopLosers().iterator(); while (it.hasNext()) { QuoteDataBean quoteData = it.next(); ret += (“\n\t\t\t” + quoteData.toString()); } return ret; } #IBM @holly_cummins
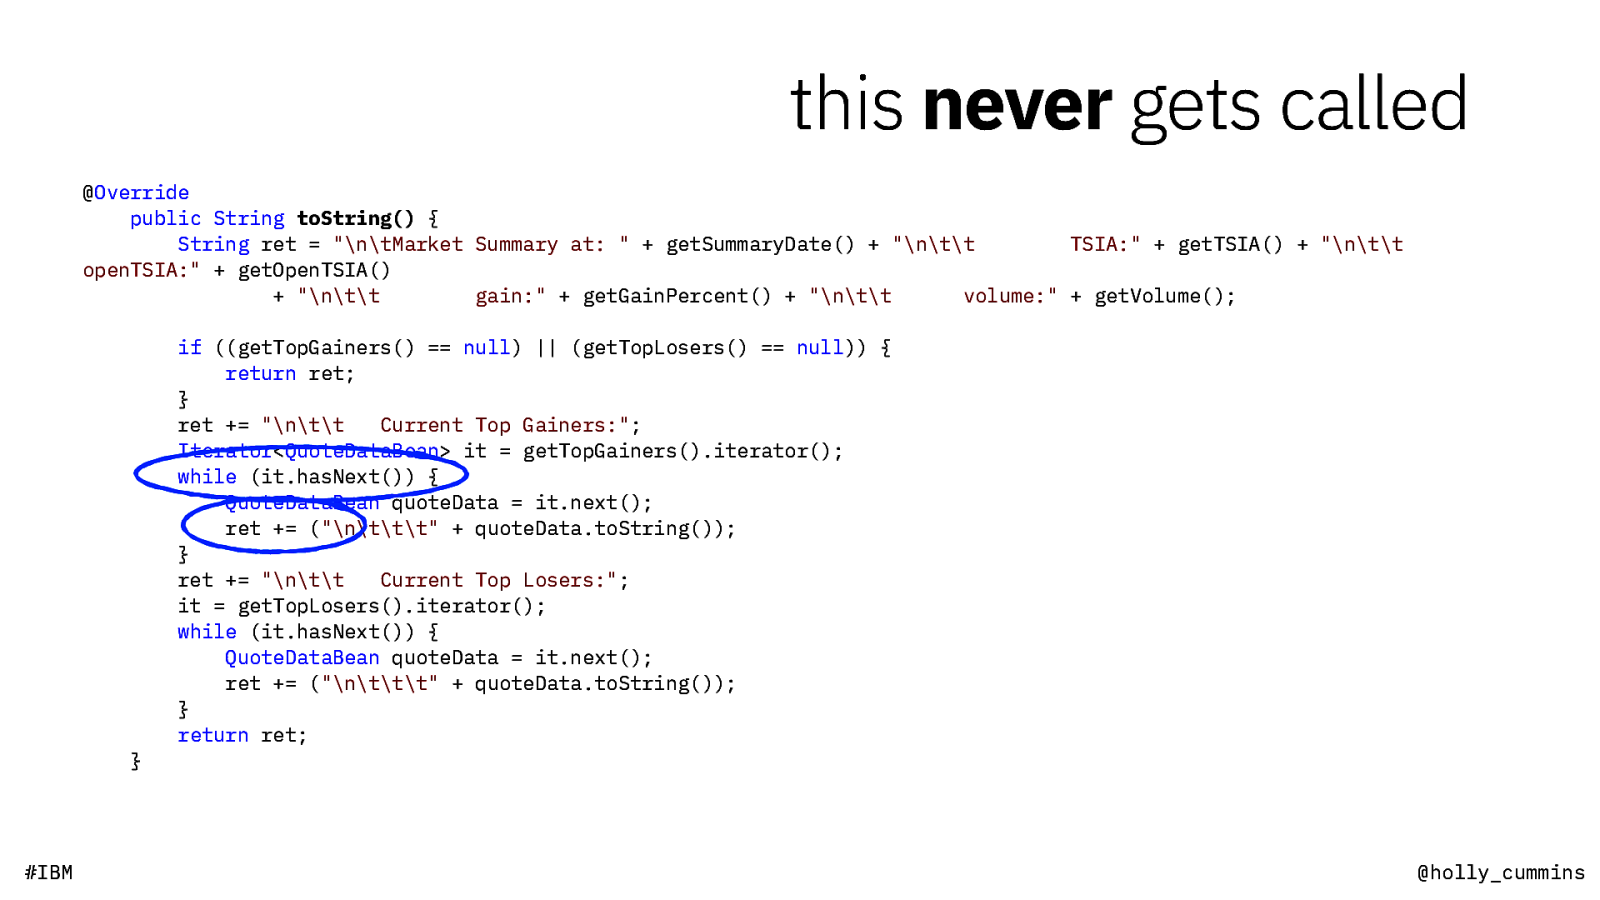
this never gets called @Override public String toString() { String ret = “\n\tMarket Summary at: ” + getSummaryDate() + “\n\t\t TSIA:” + getTSIA() + “\n\t\t openTSIA:” + getOpenTSIA() + “\n\t\t gain:” + getGainPercent() + “\n\t\t volume:” + getVolume(); if ((getTopGainers() == null) || (getTopLosers() == null)) { return ret; } ret += “\n\t\t Current Top Gainers:”; Iterator<QuoteDataBean> it = getTopGainers().iterator(); while (it.hasNext()) { QuoteDataBean quoteData = it.next(); ret += (“\n\t\t\t” + quoteData.toString()); } ret += “\n\t\t Current Top Losers:”; it = getTopLosers().iterator(); while (it.hasNext()) { QuoteDataBean quoteData = it.next(); ret += (“\n\t\t\t” + quoteData.toString()); } return ret; } #IBM @holly_cummins

let’s make travel energy-efficient? #IBM @holly_cummins

every little helps? #IBM @holly_cummins

every little helps? every optimisation is another optimisation you aren’t doing #IBM @holly_cummins

our platforms help #IBM @holly_cummins

static string beSlow() { string result = “”; for (int i = 0; i < 314159; i++) { result += getStringData(i); } return result; } #IBM @holly_cummins
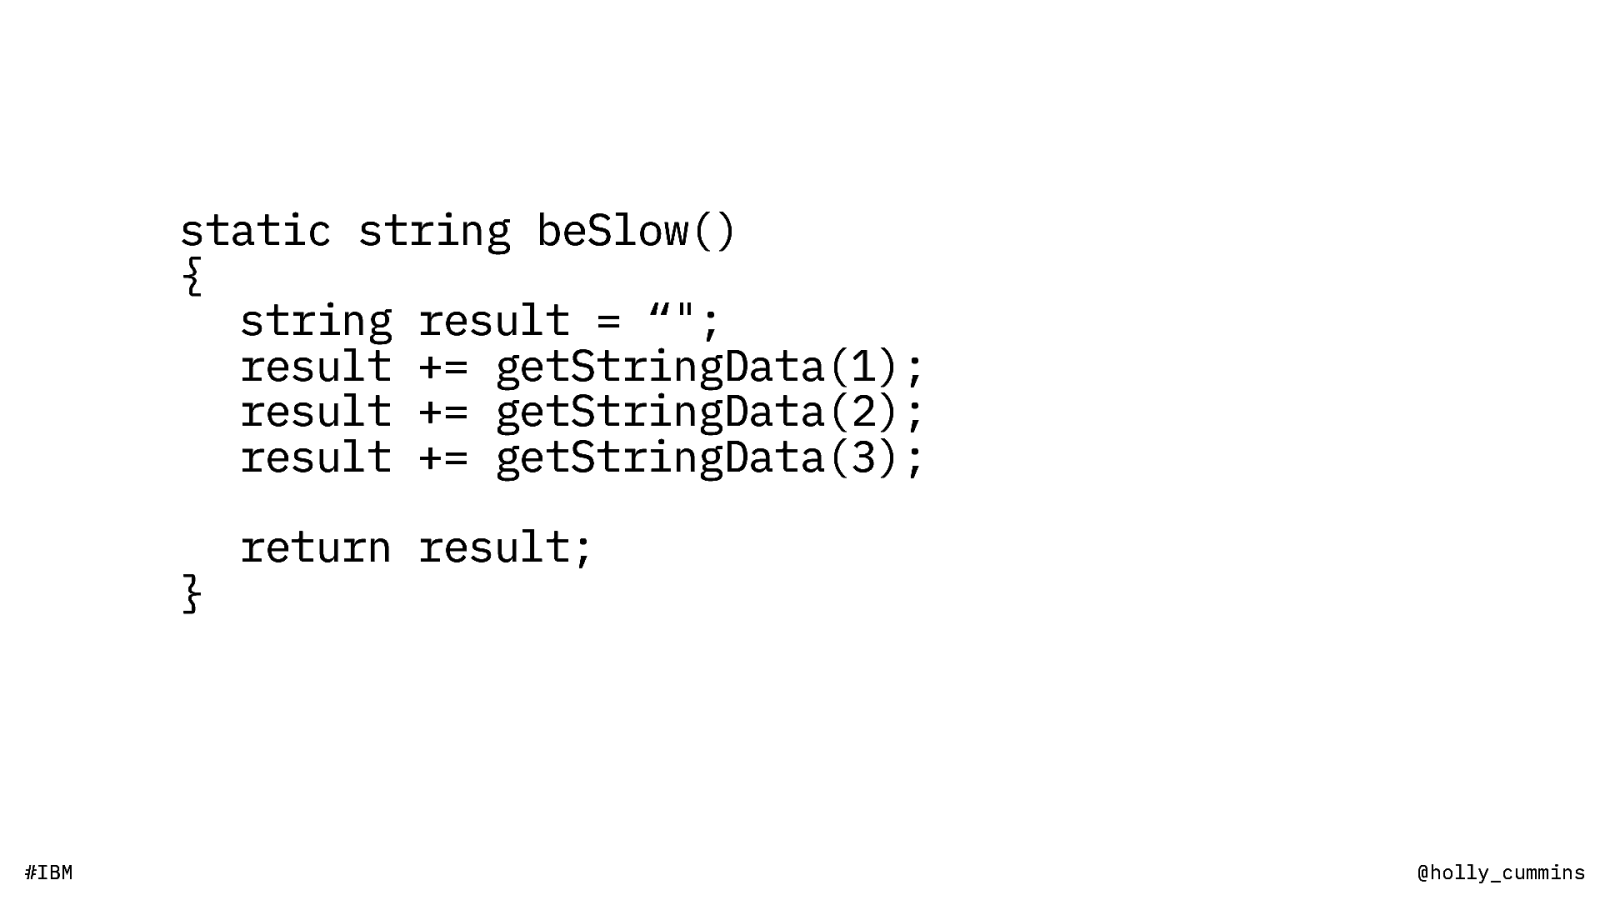
static string beSlow() { string result = “”; result += getStringData(1); result += getStringData(2); result += getStringData(3); } #IBM return result; @holly_cummins
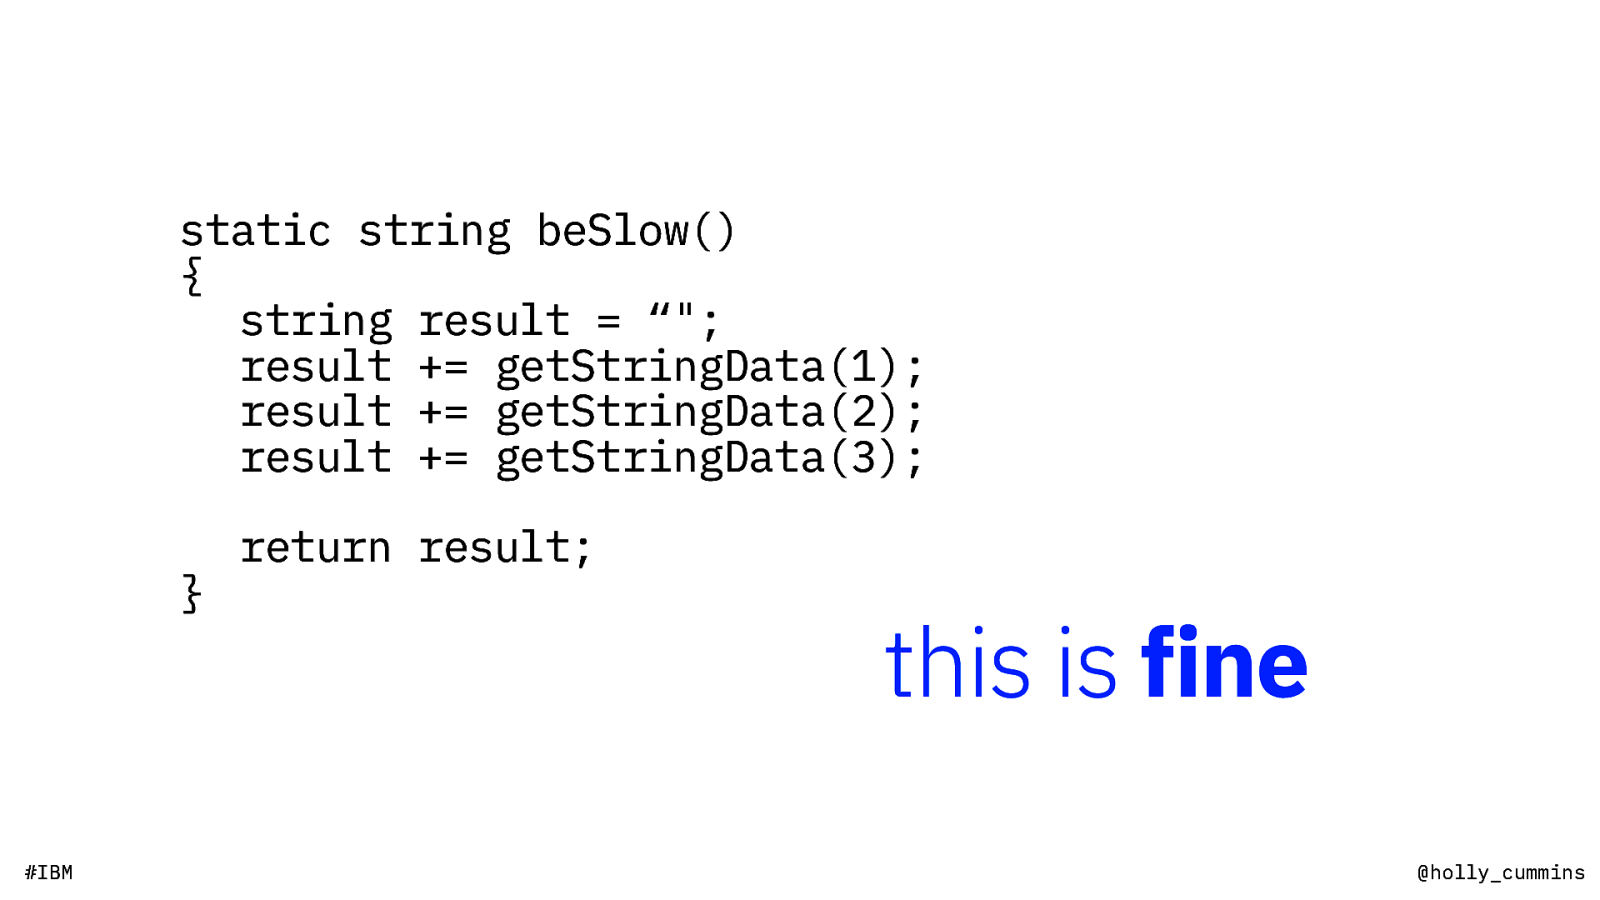
static string beSlow() { string result = “”; result += getStringData(1); result += getStringData(2); result += getStringData(3); } #IBM return result; this is fine @holly_cummins
the JVM writers have far more time for optimising than you do clean, typical, code runs best #IBM @holly_cummins

ok, but how to optimise? #IBM @holly_cummins
tools #IBM @holly_cummins
“What you can optimize is limited to what you can observe.” -Susie Xia, Netflix #IBM @holly_cummins

observability #IBM @holly_cummins

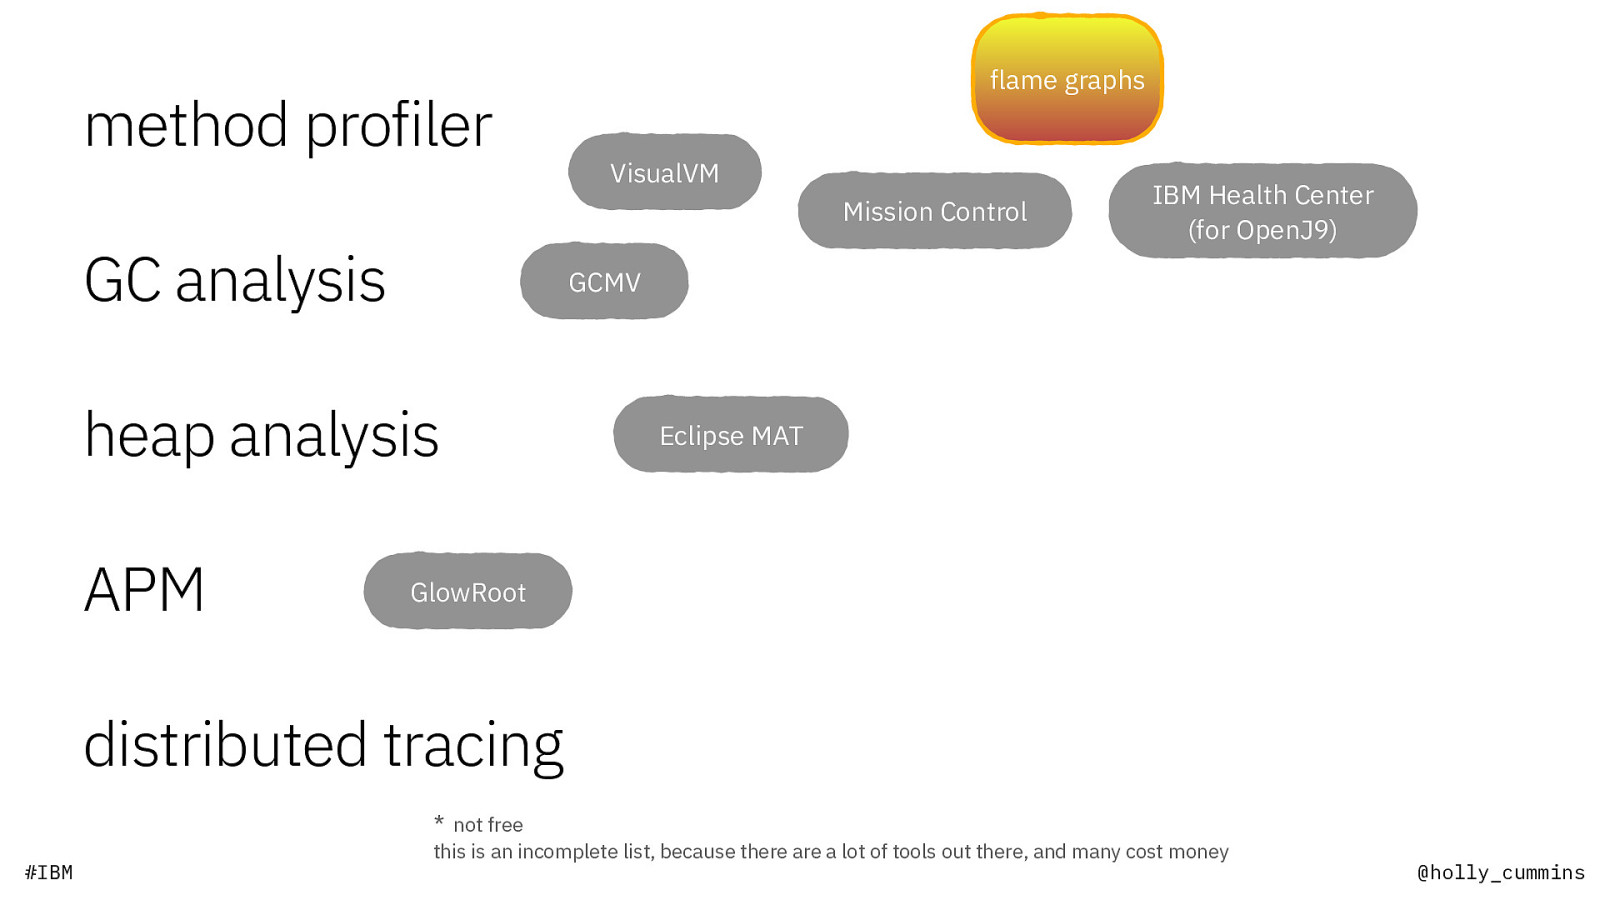
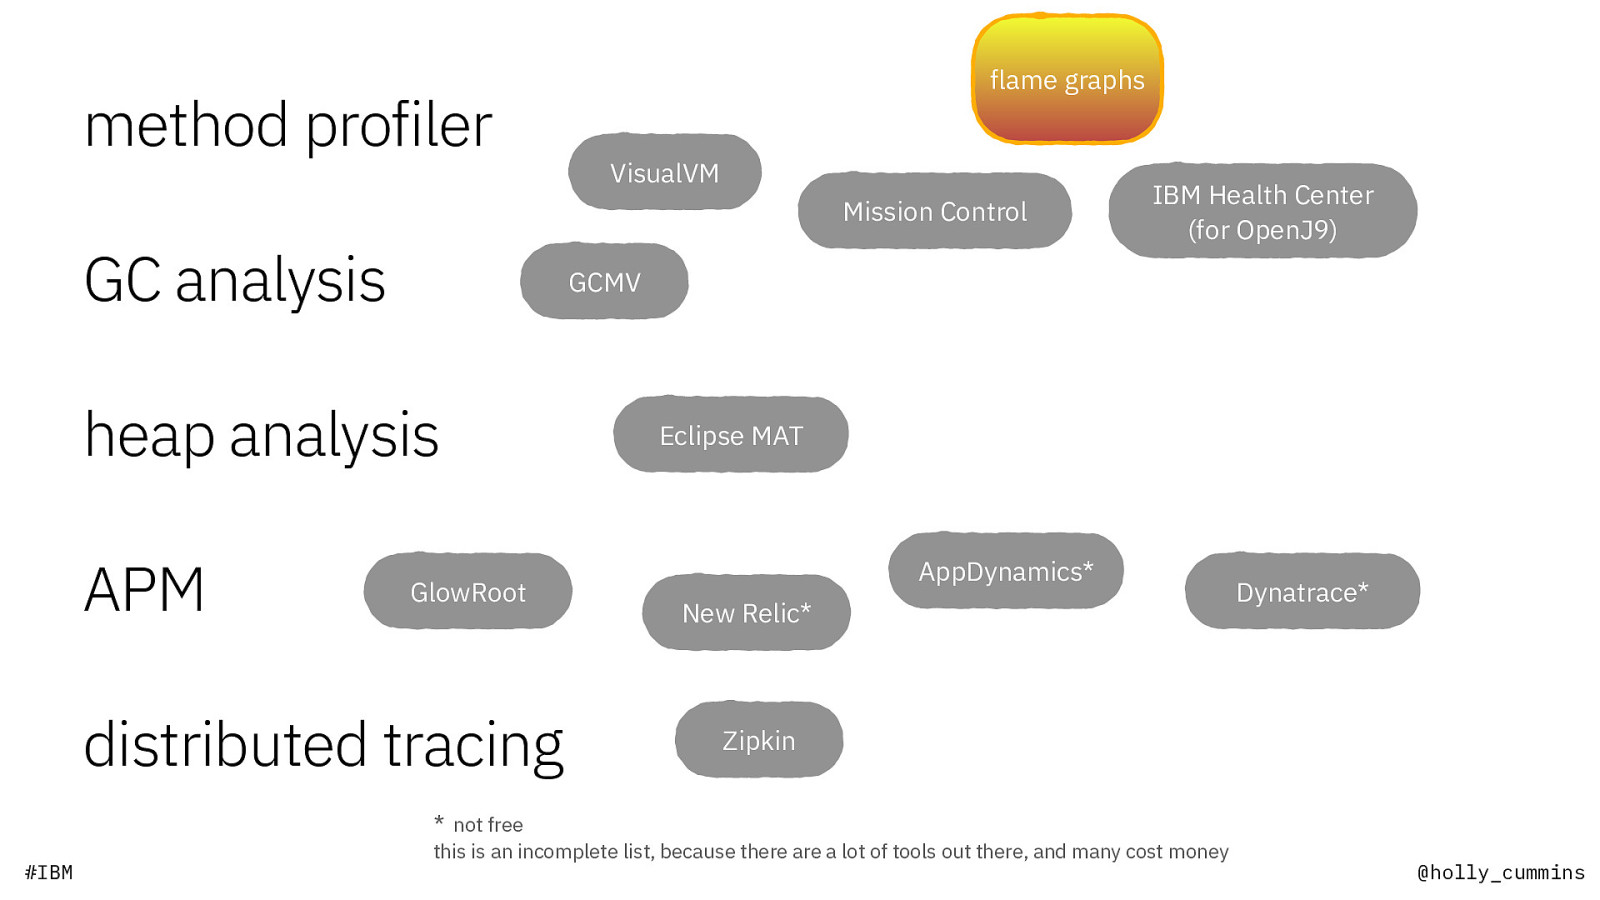
method profiler GC analysis heap analysis APM distributed tracing * not free #IBM this is an incomplete list, because there are a lot of tools out there, and many cost money @holly_cummins

method profiler VisualVM GC analysis heap analysis APM distributed tracing * not free #IBM this is an incomplete list, because there are a lot of tools out there, and many cost money @holly_cummins
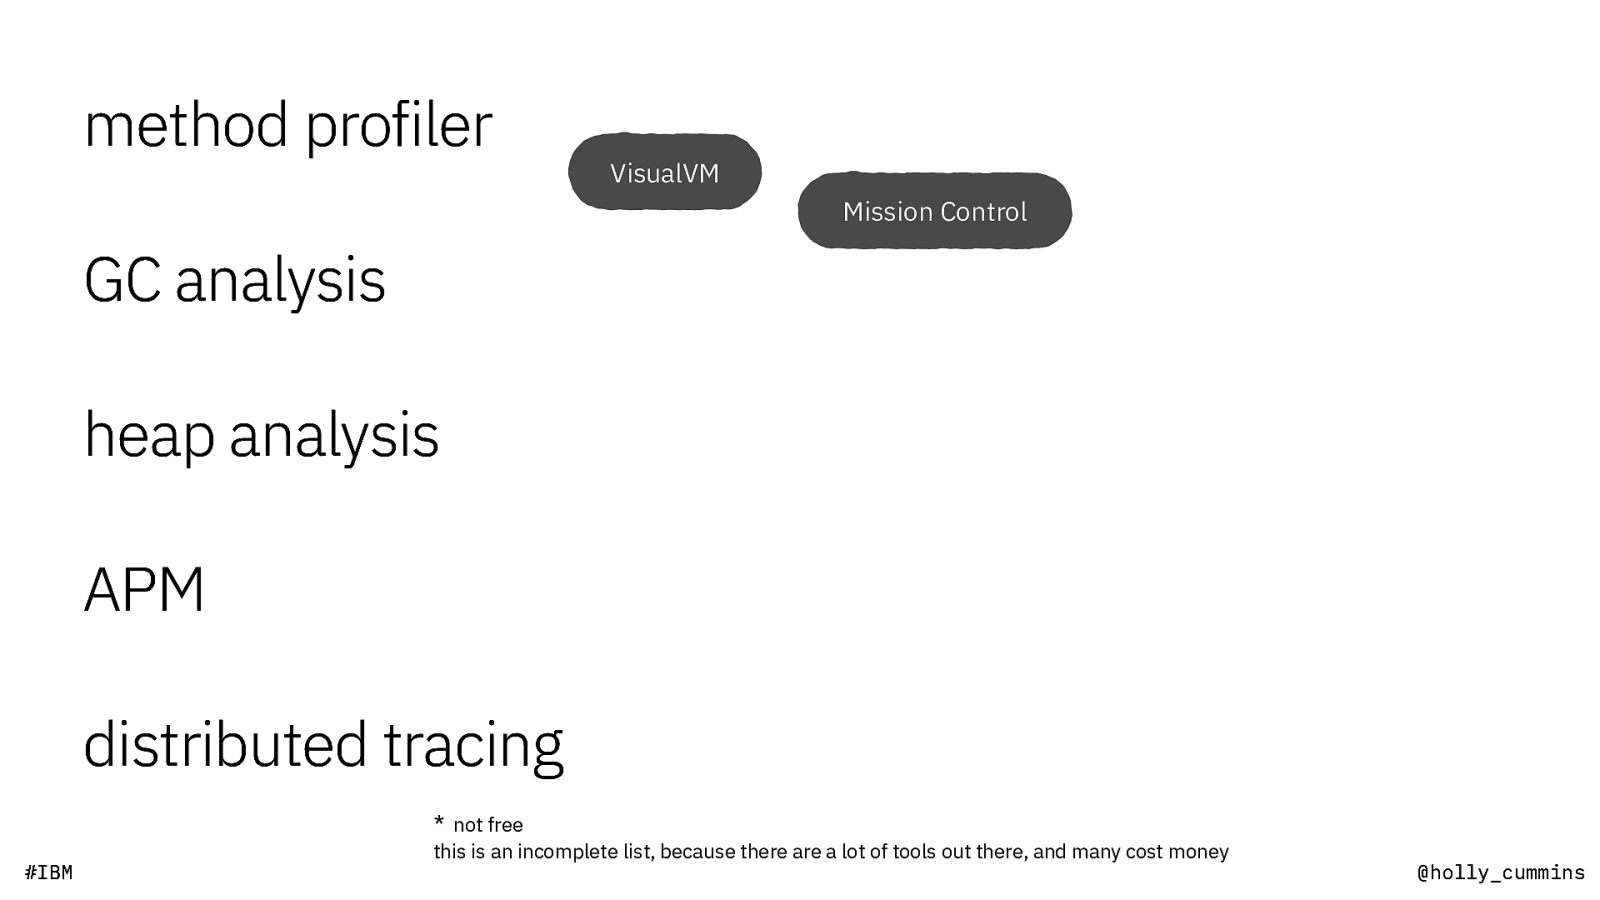
method profiler VisualVM Mission Control GC analysis heap analysis APM distributed tracing * not free #IBM this is an incomplete list, because there are a lot of tools out there, and many cost money @holly_cummins

method profiler VisualVM Mission Control GC analysis IBM Health Center (for OpenJ9) heap analysis APM distributed tracing * not free #IBM this is an incomplete list, because there are a lot of tools out there, and many cost money @holly_cummins
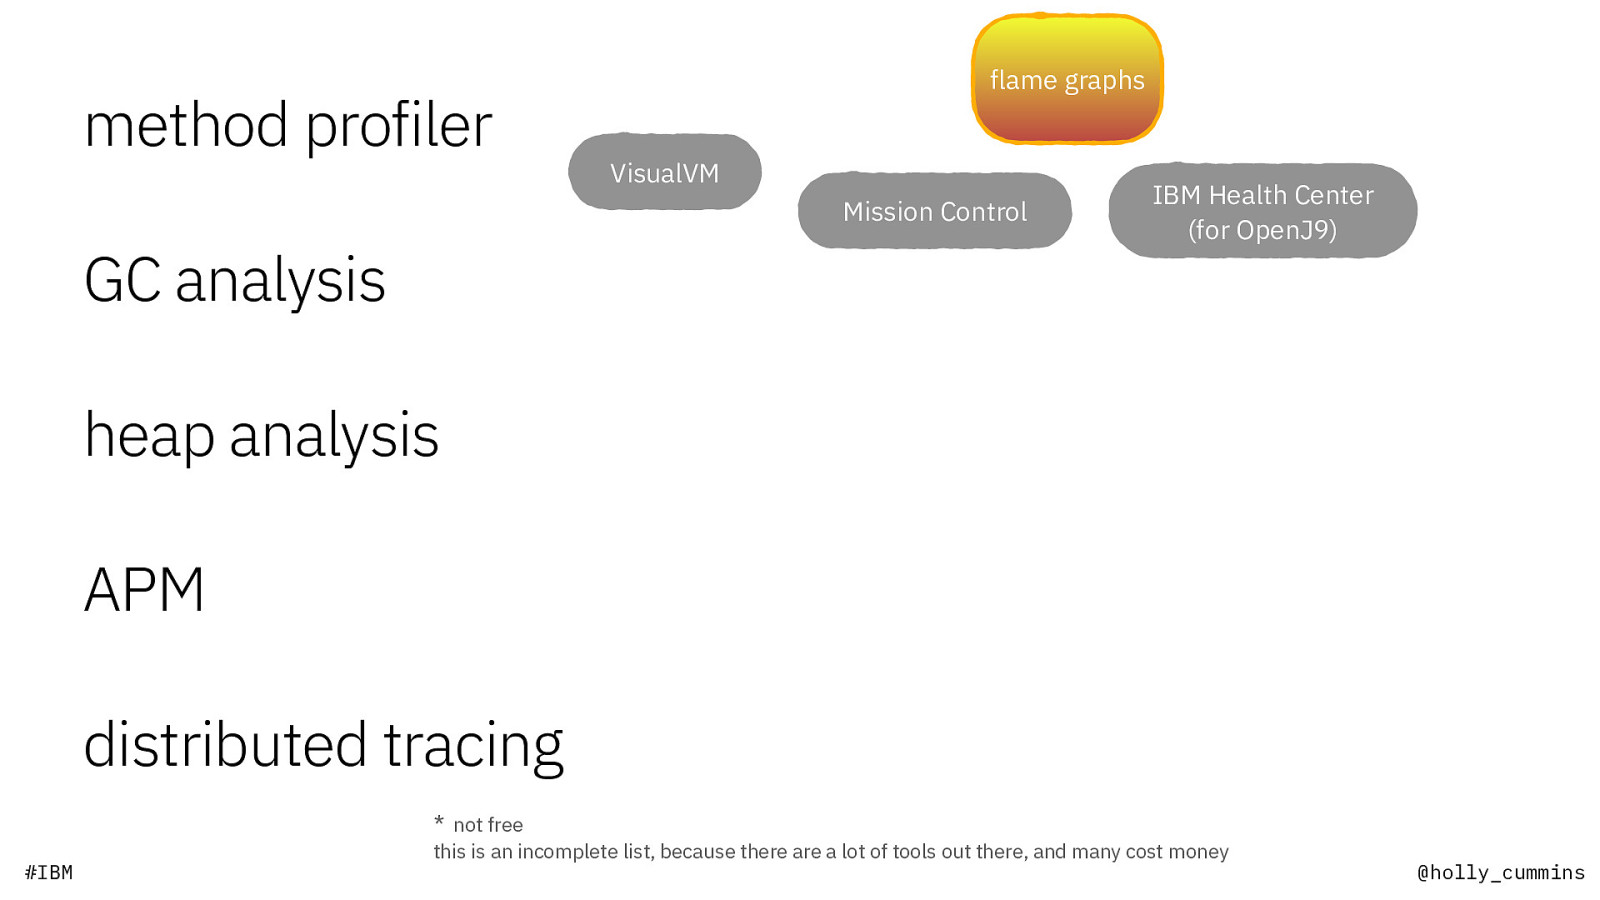
method profiler flame graphs VisualVM Mission Control GC analysis IBM Health Center (for OpenJ9) heap analysis APM distributed tracing * not free #IBM this is an incomplete list, because there are a lot of tools out there, and many cost money @holly_cummins
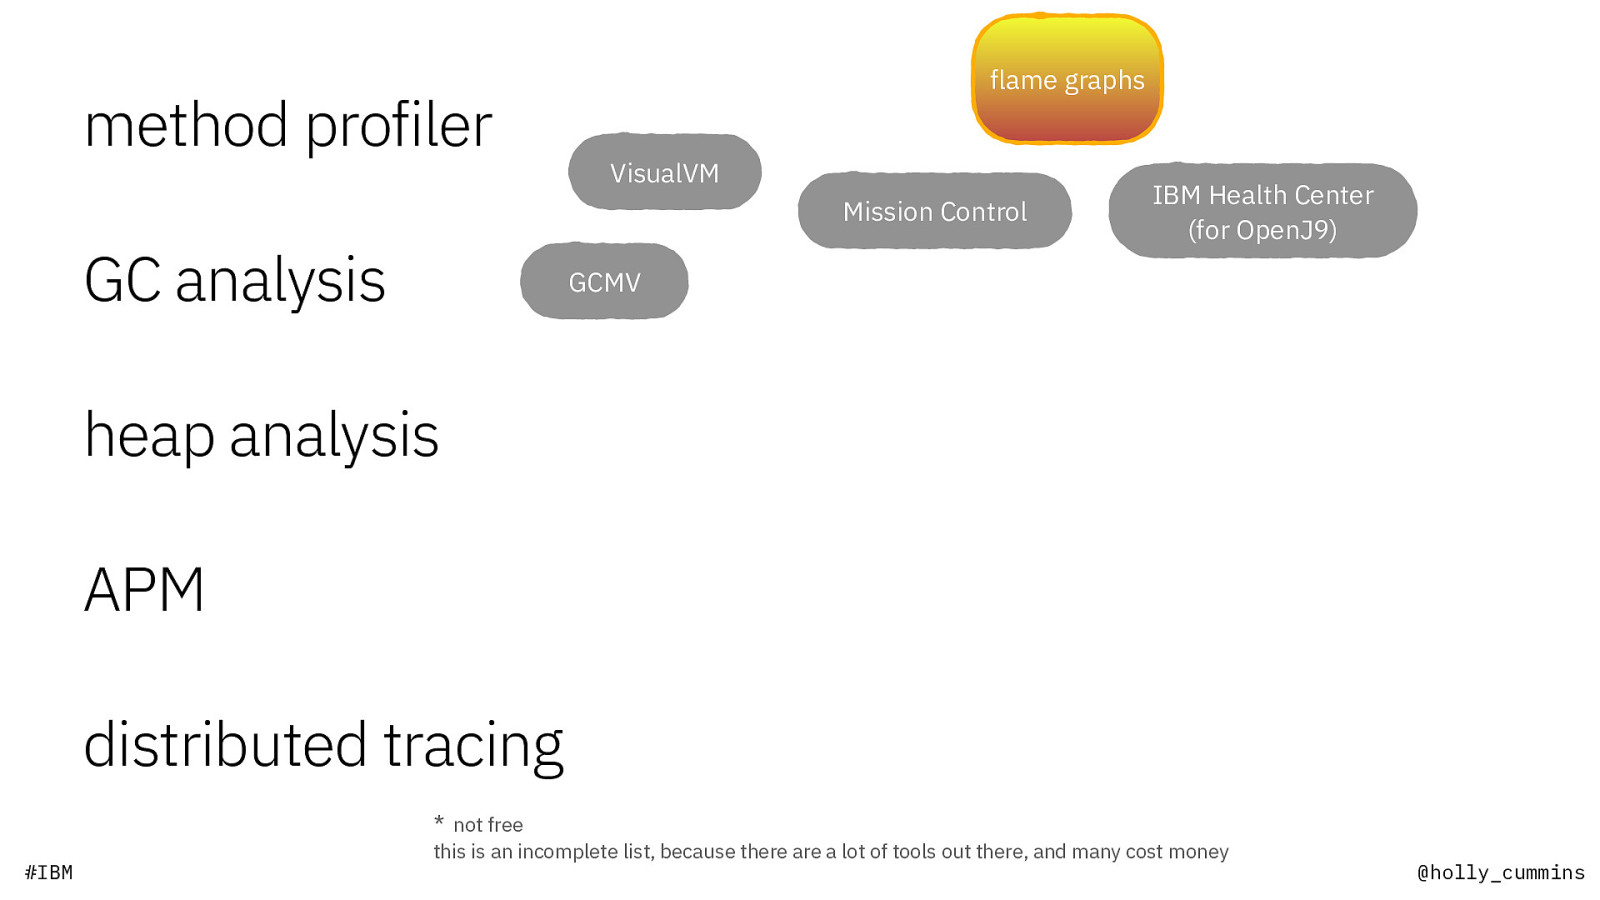
method profiler flame graphs VisualVM Mission Control GC analysis IBM Health Center (for OpenJ9) GCMV heap analysis APM distributed tracing * not free #IBM this is an incomplete list, because there are a lot of tools out there, and many cost money @holly_cummins
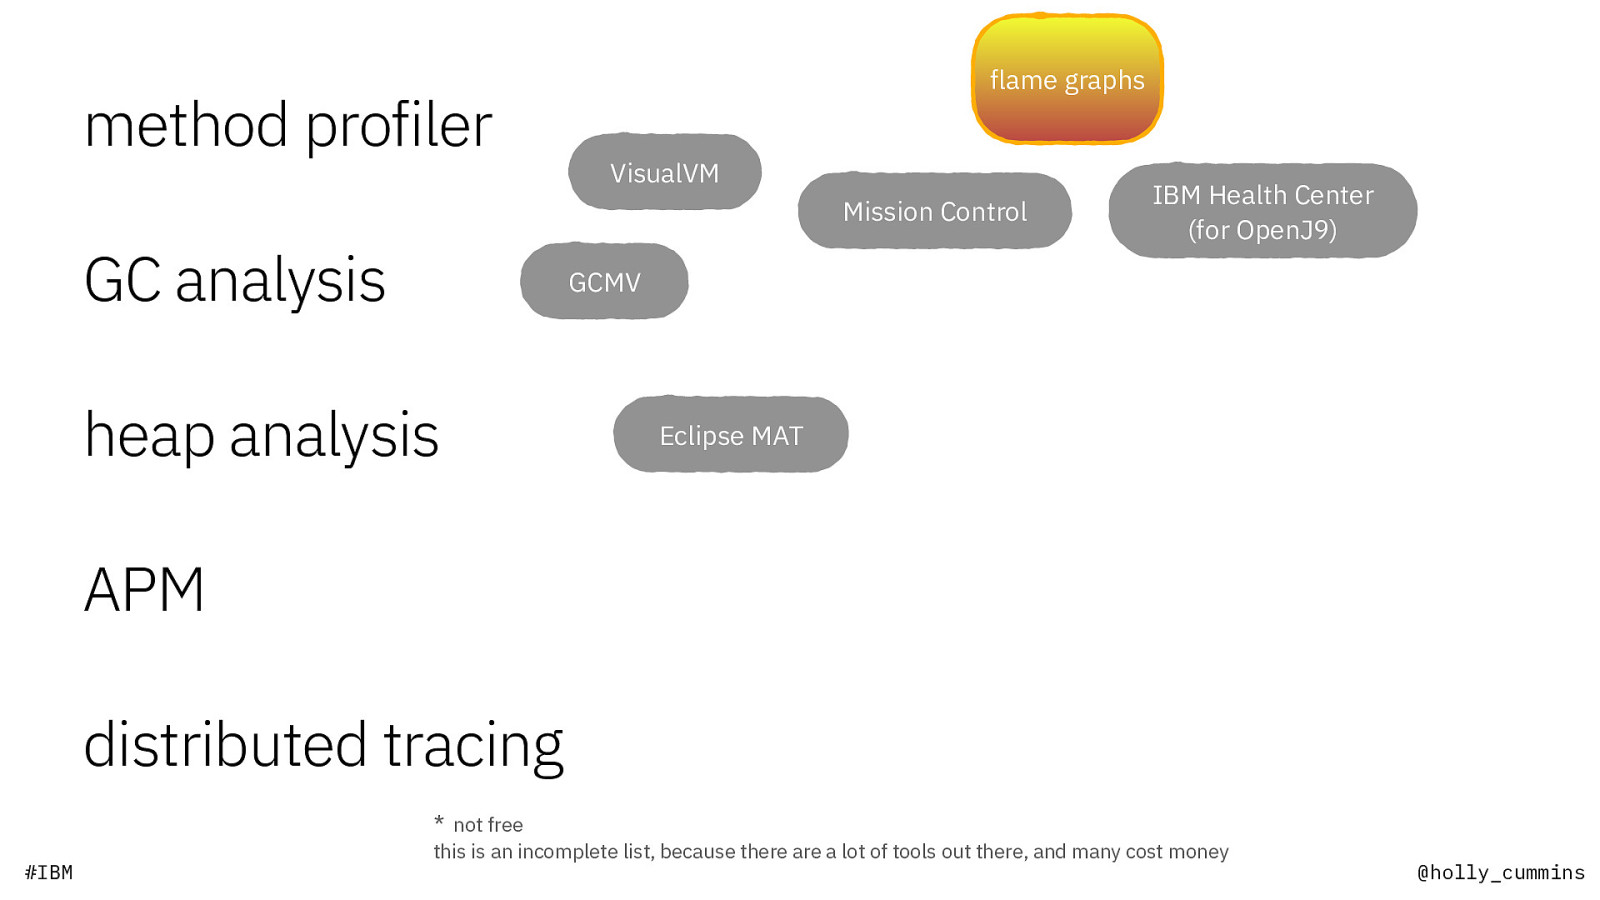
method profiler flame graphs VisualVM Mission Control GC analysis IBM Health Center (for OpenJ9) GCMV heap analysis Eclipse MAT APM distributed tracing * not free #IBM this is an incomplete list, because there are a lot of tools out there, and many cost money @holly_cummins
method profiler flame graphs VisualVM Mission Control GC analysis GCMV heap analysis APM IBM Health Center (for OpenJ9) Eclipse MAT GlowRoot distributed tracing * not free #IBM this is an incomplete list, because there are a lot of tools out there, and many cost money @holly_cummins
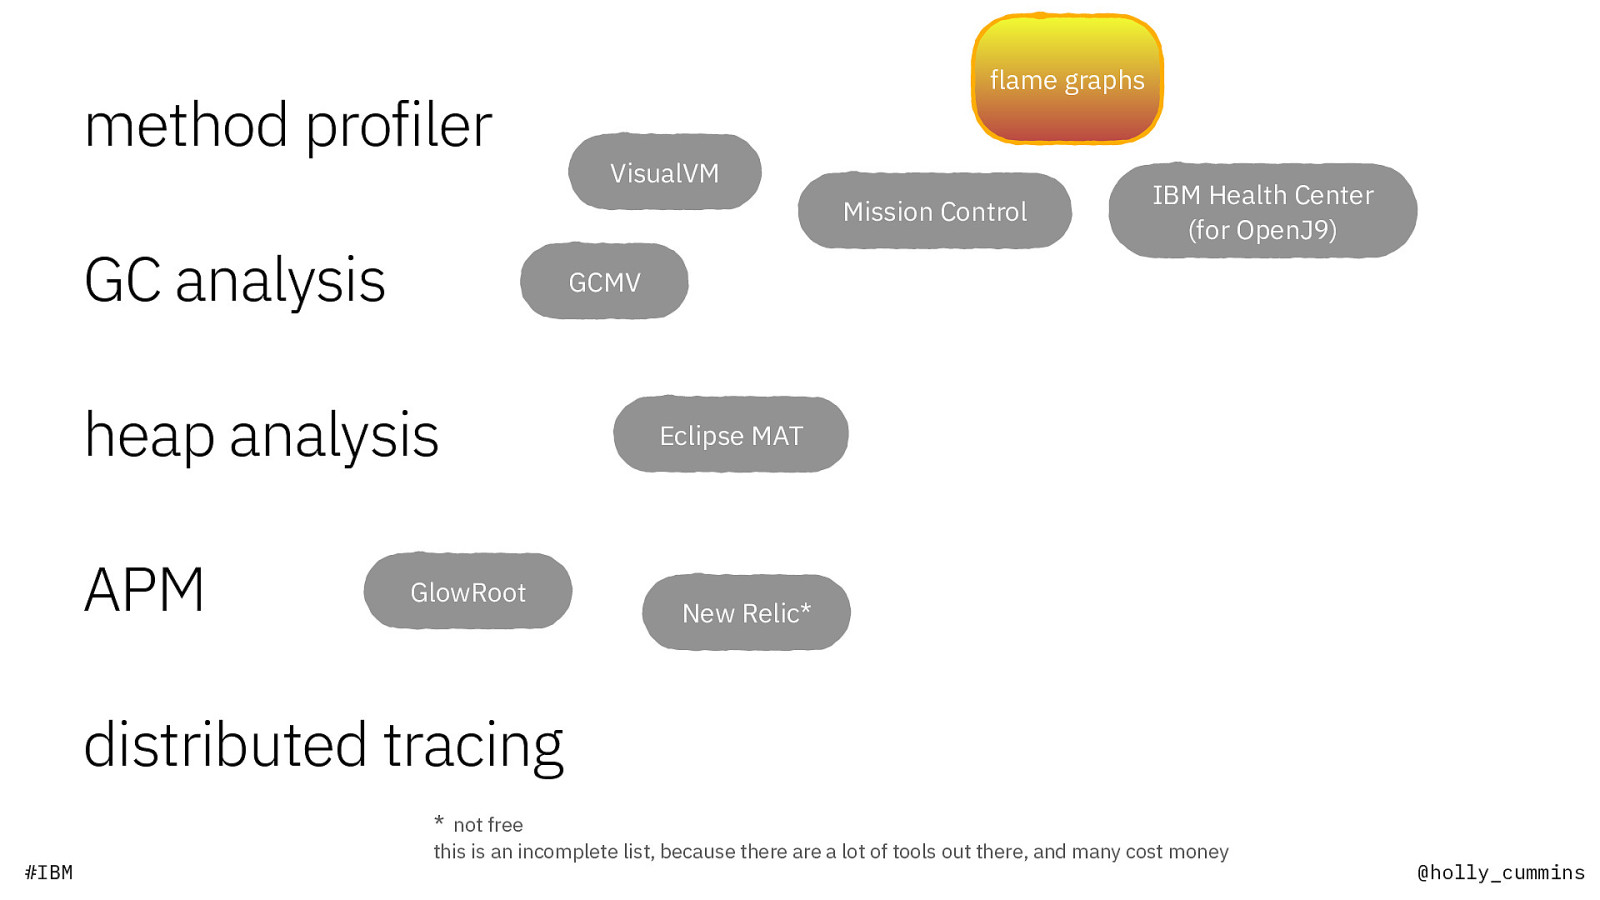
method profiler flame graphs VisualVM Mission Control GC analysis GCMV heap analysis APM IBM Health Center (for OpenJ9) GlowRoot Eclipse MAT New Relic* distributed tracing * not free #IBM this is an incomplete list, because there are a lot of tools out there, and many cost money @holly_cummins
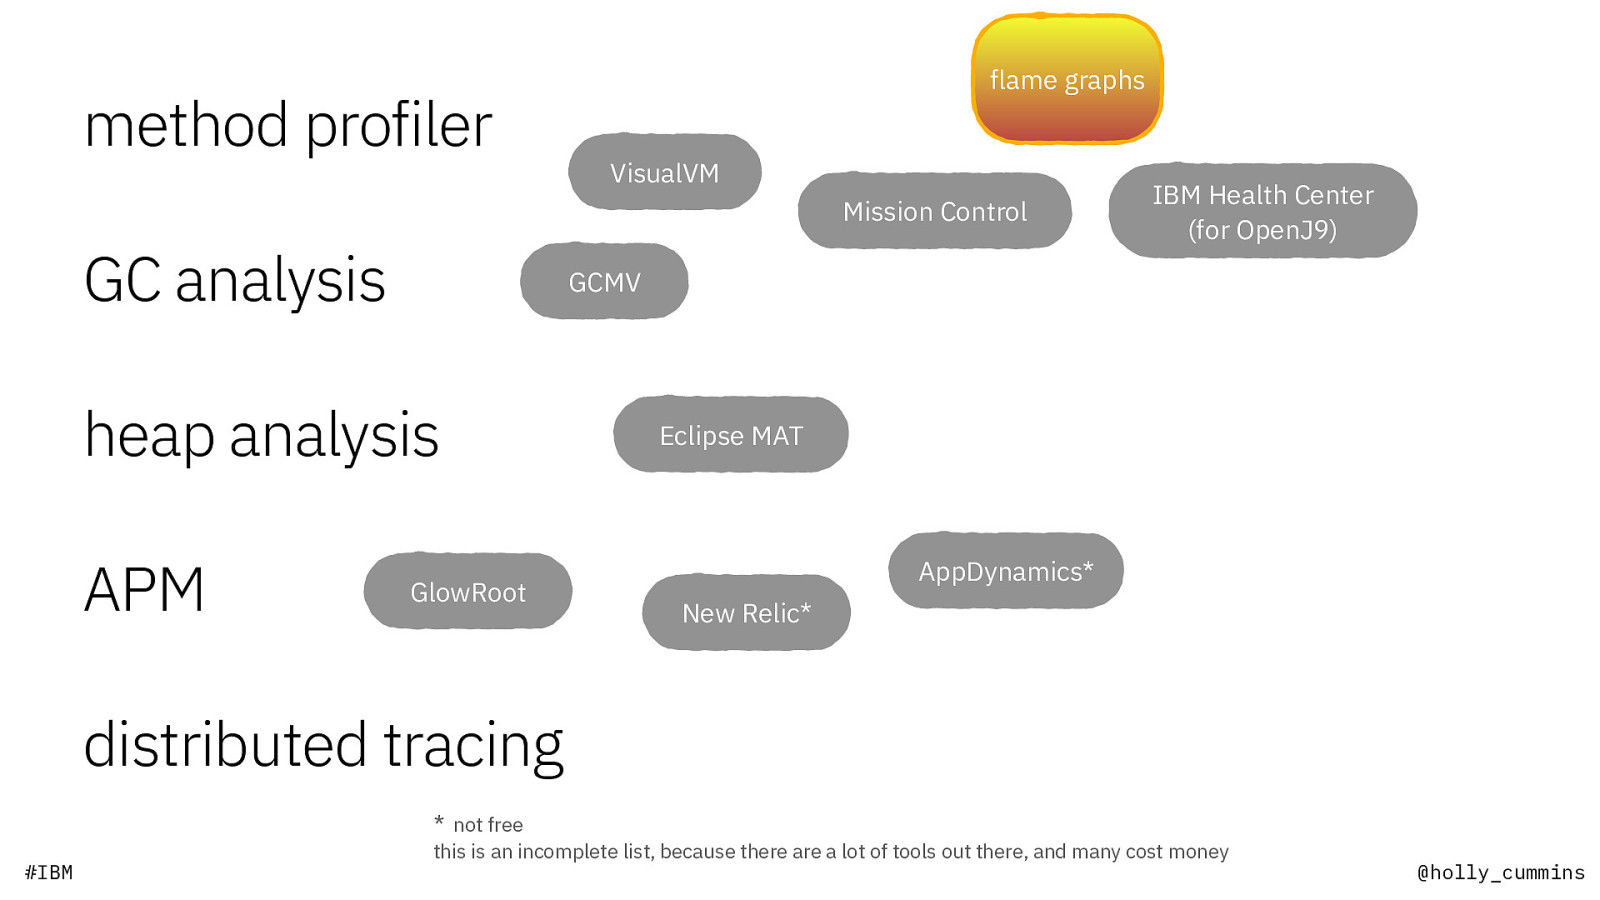
method profiler flame graphs VisualVM Mission Control GC analysis GCMV heap analysis APM IBM Health Center (for OpenJ9) GlowRoot Eclipse MAT AppDynamics* New Relic* distributed tracing * not free #IBM this is an incomplete list, because there are a lot of tools out there, and many cost money @holly_cummins
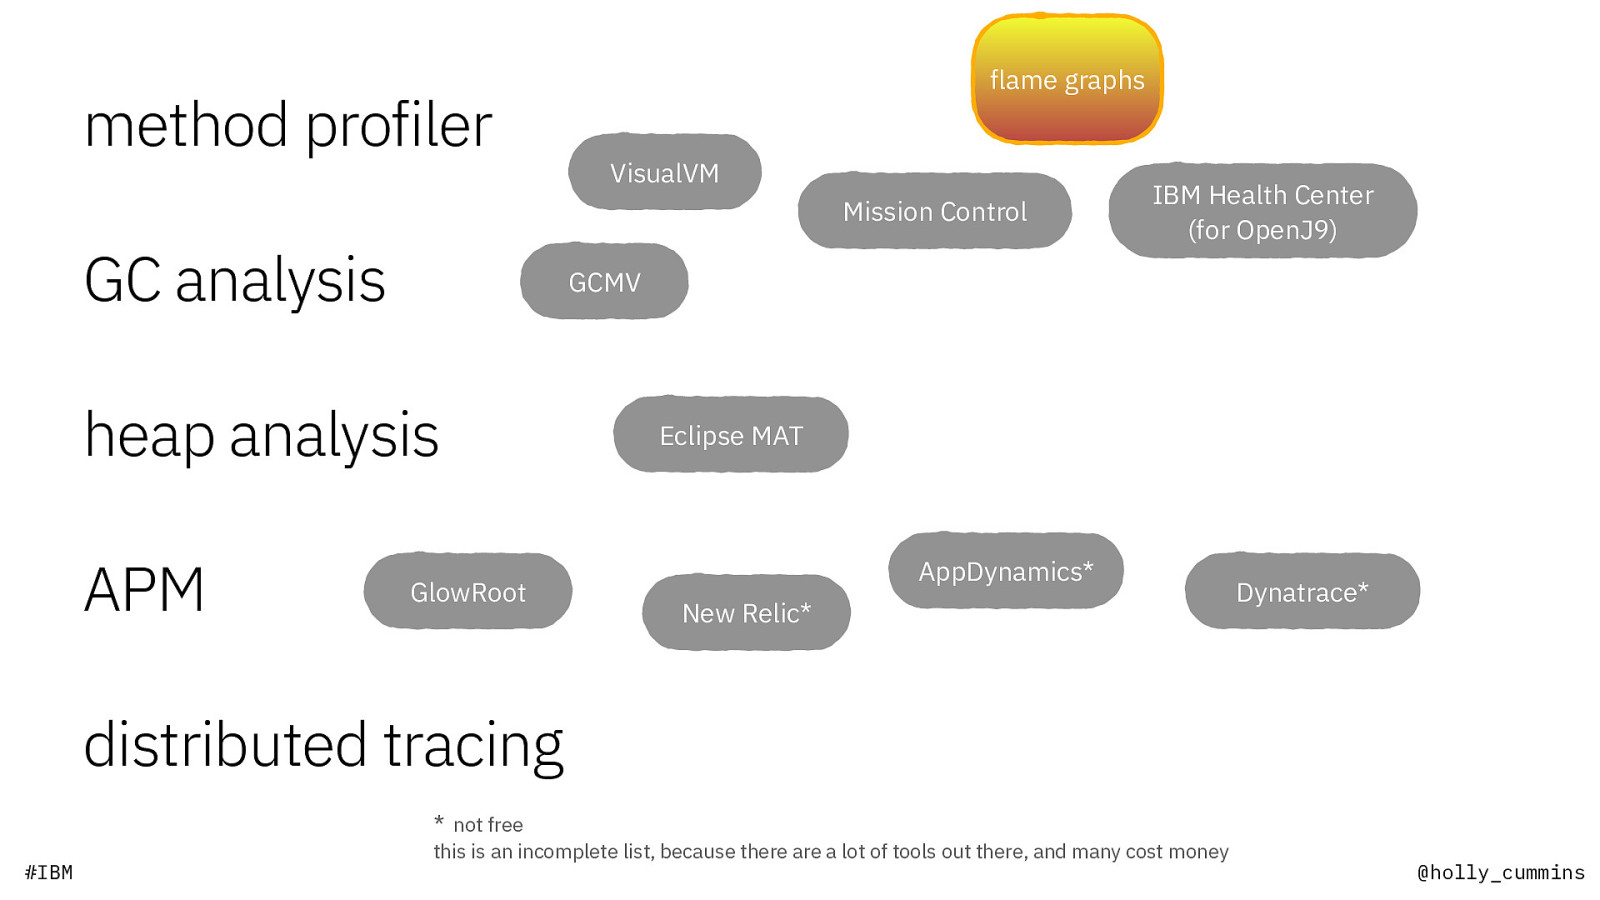
method profiler flame graphs VisualVM Mission Control GC analysis GCMV heap analysis APM IBM Health Center (for OpenJ9) GlowRoot Eclipse MAT AppDynamics* New Relic* Dynatrace* distributed tracing * not free #IBM this is an incomplete list, because there are a lot of tools out there, and many cost money @holly_cummins
method profiler flame graphs VisualVM Mission Control GC analysis GCMV heap analysis APM IBM Health Center (for OpenJ9) GlowRoot distributed tracing Eclipse MAT AppDynamics* New Relic* Dynatrace* Zipkin
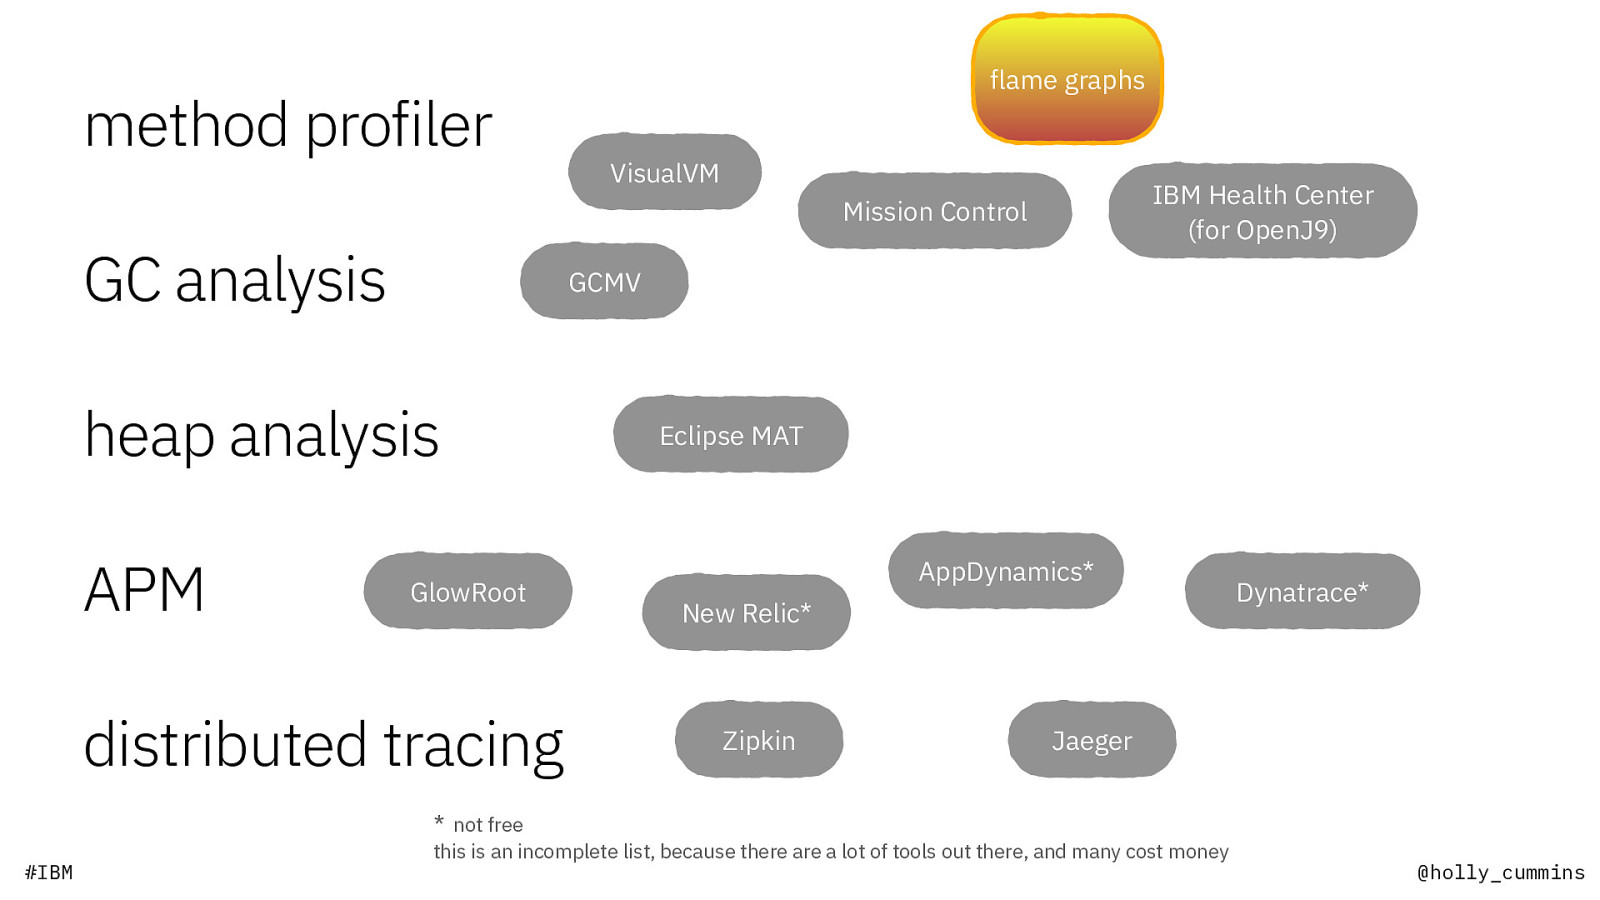
method profiler flame graphs VisualVM IBM Health Center (for OpenJ9) Mission Control GC analysis GCMV heap analysis APM GlowRoot distributed tracing Eclipse MAT AppDynamics* New Relic* Zipkin Dynatrace* Jaeger
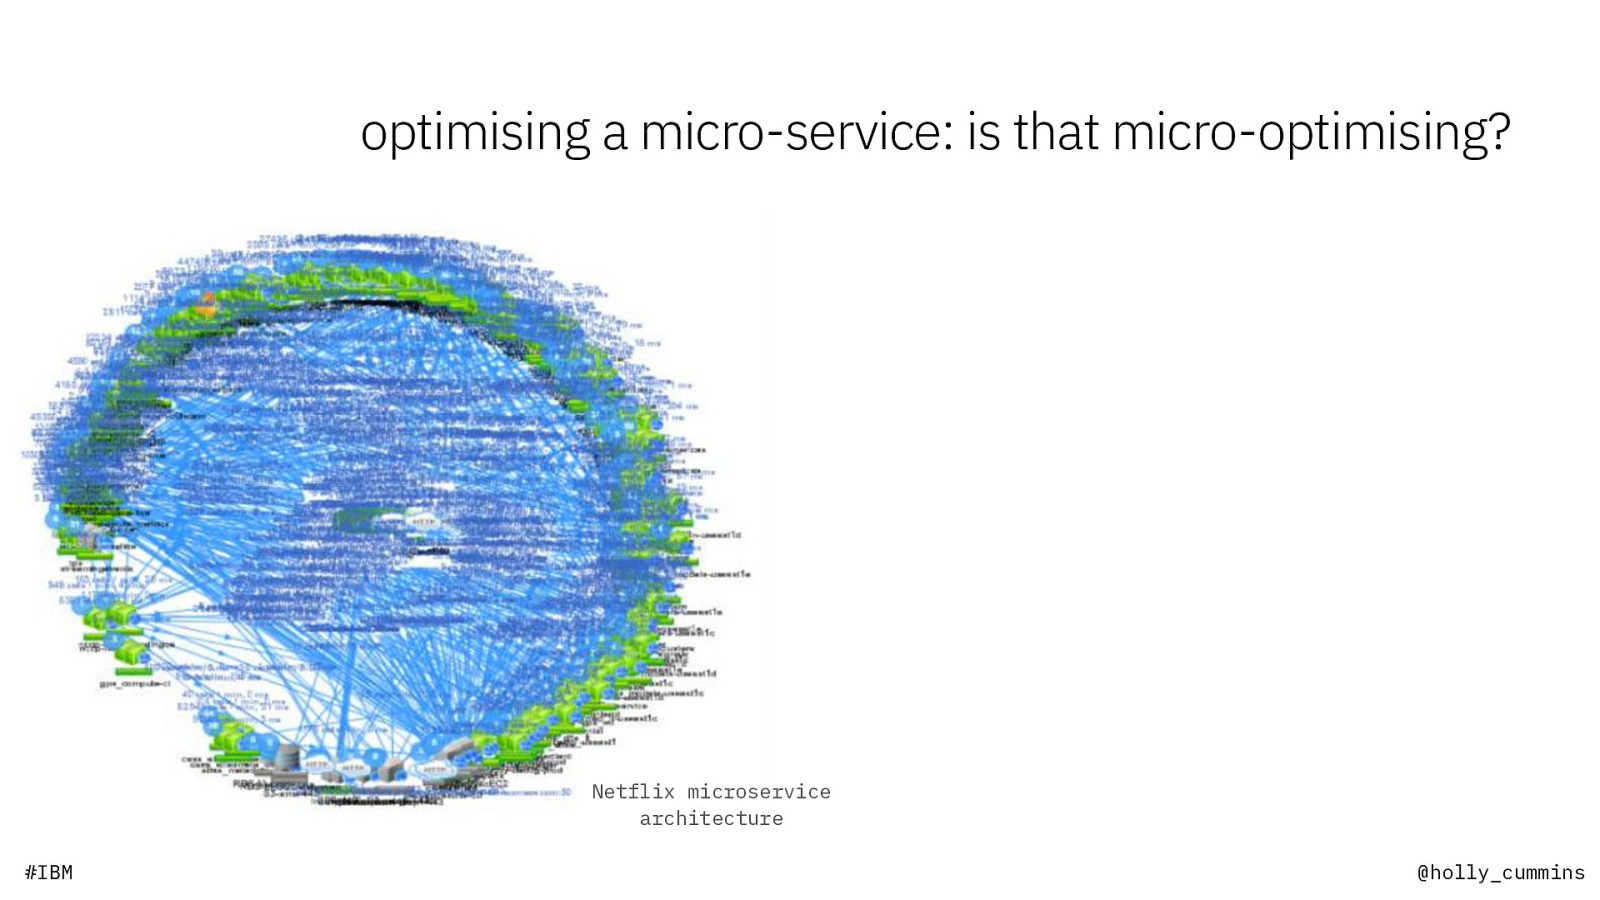
optimising a micro-service: is that micro-optimising? Netflix microservice architecture #IBM @holly_cummins
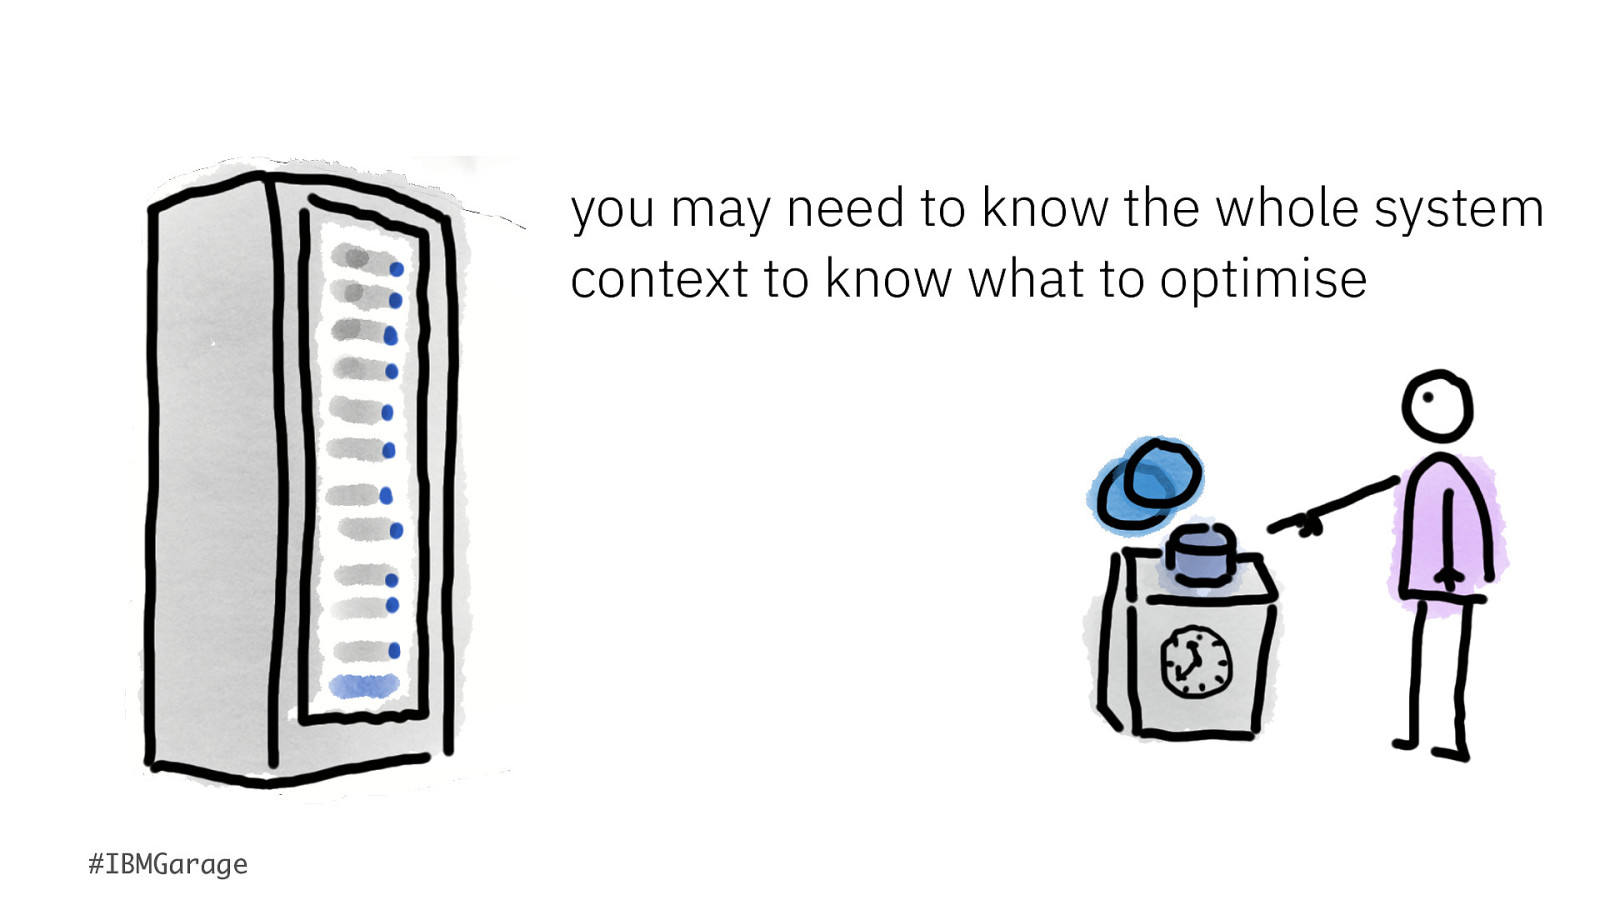
you may need to know the whole system context to know what to optimise #IBMGarage @holly_cummins
“Nines don’t matter if your users aren’t happy.” – Charity Majors #IBM @holly_cummins
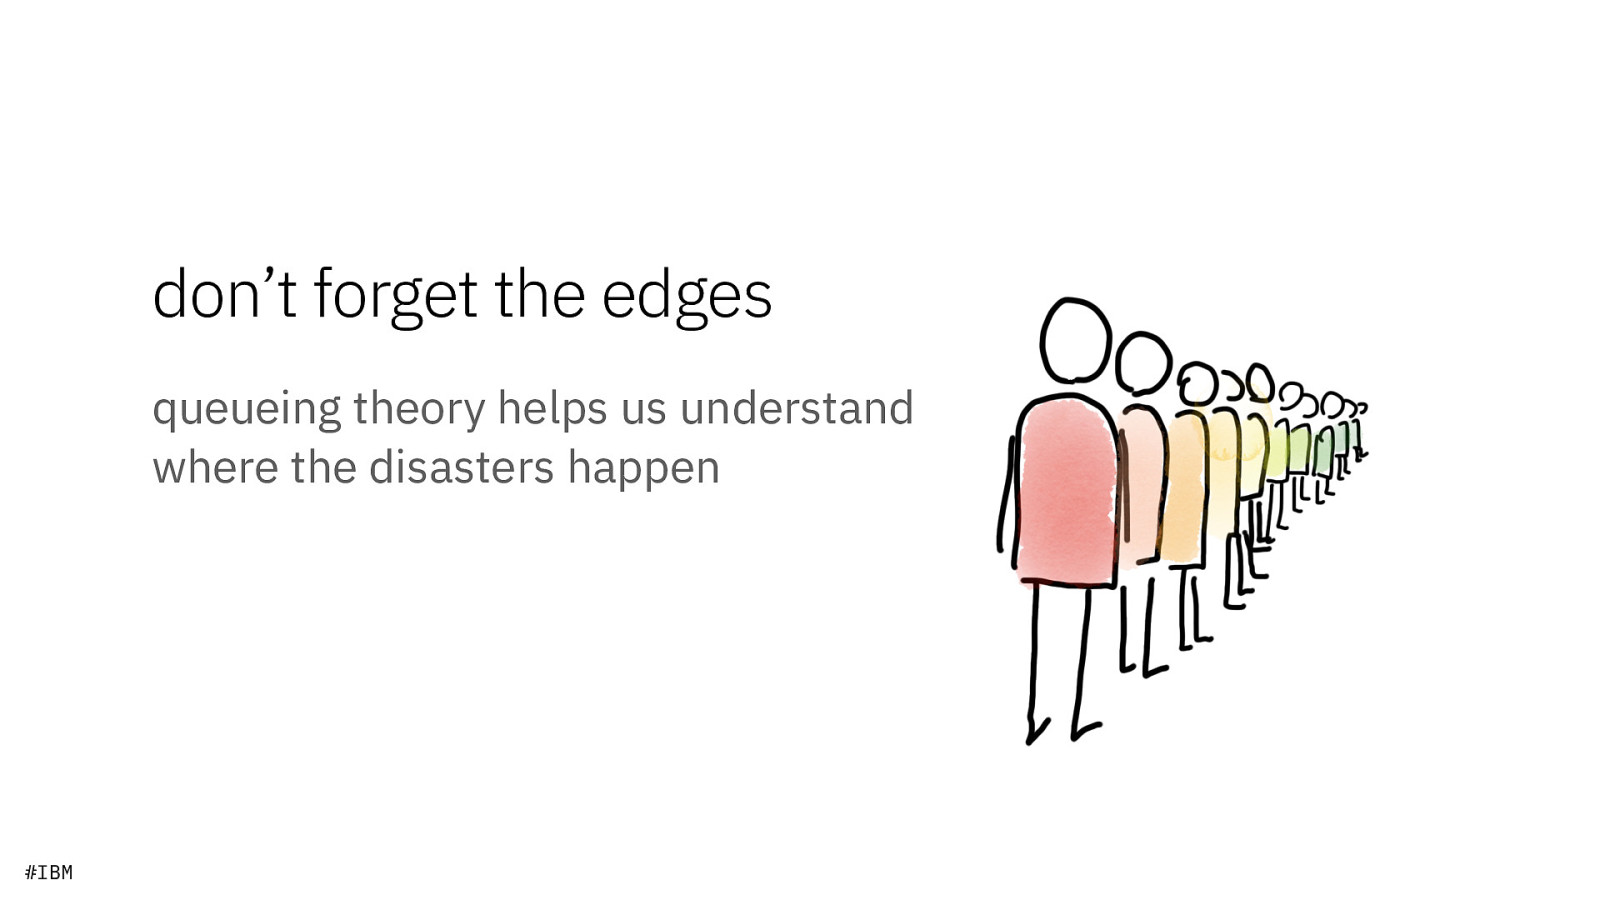
don’t forget the edges queueing theory helps us understand where the disasters happen #IBM @holly_cummins
“When it comes to IT performance, amateurs look at averages. Professionals look at distributions.” – Avishai Ish-Shalom #IBM @holly_cummins
slow performance can turn into big cloud bills make cloud costs visible to engineers #IBM @holly_cummins

ok, but you promised bears #IBM @holly_cummins

if you leave the TV on when you’re not using it, you’re a polar bear murderer #IBM @holly_cummins
there is a moral imperative to avoid waste #IBM @holly_cummins
there is a moral imperative to avoid waste electricity hardware #IBM @holly_cummins
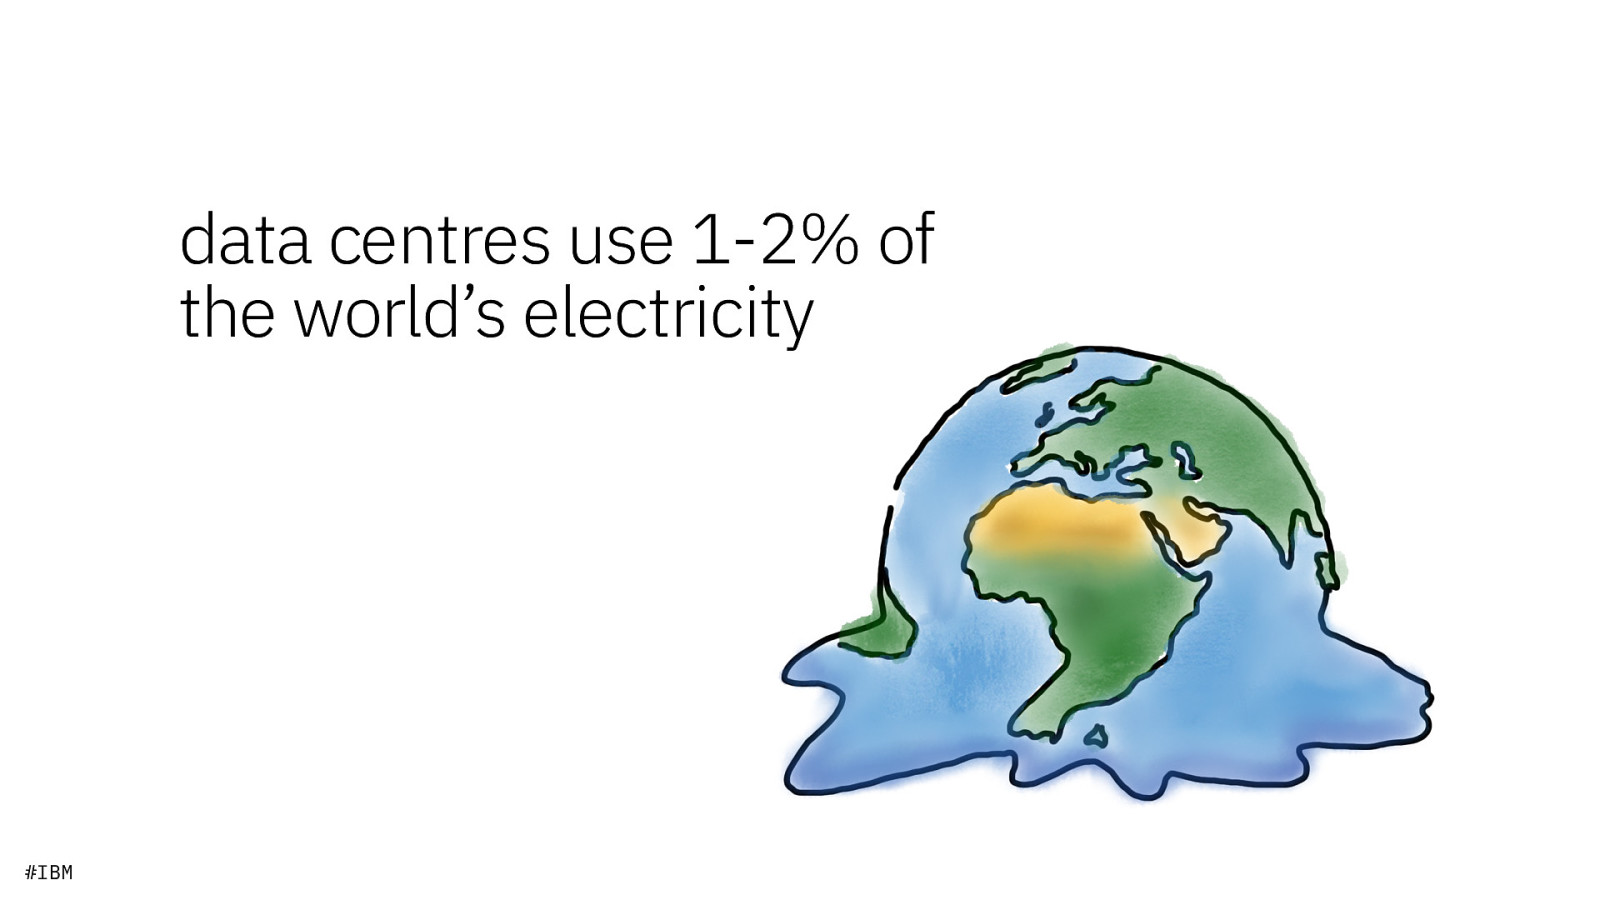
data centres use 1-2% of the world’s electricity #IBM @holly_cummins

fewer devices longer lifetime #IBM @holly_cummins

higher ef ciency fewer devices longer lifetime @holly_cummins fi #IBM

higher ef ciency fewer devices lower footprint longer lifetime @holly_cummins fi #IBM

higher ef ciency fewer devices lower footprint more multitenancy longer lifetime @holly_cummins fi #IBM

higher ef ciency fewer devices lower footprint more multitenancy longer lifetime @holly_cummins fi #IBM optimise for longevity

higher ef ciency fewer devices lower footprint more multitenancy longer lifetime the end of planned obsolescence? @holly_cummins fi #IBM optimise for longevity

sooo … you can optimise, and it can be fun measure, don’t guess only optimise what matters now for questions! #IBM @holly_cummins