Holly Cummins IBM Hursley Labs Java performance not so scary after all

A presentation at GeeCON in May 2010 in Poznań, Poland by Holly Cummins
Holly Cummins IBM Hursley Labs Java performance not so scary after all
So … You have a performance problem. What next?

Goals After this talk you will: – Not feel abject terror when confronted with a performance problem – Understand when and why to use performance tools – Have a toolkit of performance tools and techniques – Get to know your Java application better 4
Speaker’s qualifications Holly is a software developer at IBM’s UK lab – Technical lead for the Health Center – Developed the Garbage Collection and Memory Visualizer Holly speaks regularly on performance and garbage collection Holly has authored several articles for developerWorks 5
Agenda Performance – why it’s actually cool and fun Performance tuning techniques Tools for identifying bottlenecks – – – – Memory CPU I/O Synchronization 6
Agenda Performance – why it’s actually cool and fun Performance tuning techniques Tools for identifying bottlenecks – – – – Memory CPU I/O Synchronization 7
Who cares about performance? We all do – – – – Sluggish web pages Annoying programs Hangs Crashes
Hardware and performance Moore’s law predicts exponential growth in hardware speed – Software development corollary: • How to double application performance? Wait 18 months before releasing it!
Hardware and performance Moore’s law predicts exponential growth in hardware speed – Software development corollary: • How to double application performance? Wait 18 months before releasing it! Clock speeds aren’t going up at the same rates anymore – Software development corollary: • Uh oh.
Bad performance costs “Poor application performance costs 1 in 3 enterprises over £1 million per year” » (http://www.morse.com/press_9.htm)
Bad performance is costing you … Electricity Employee productivity Lost business – Example: unresponsive web pages Hard cash – Example: Arbitrage trading • Delays in reacting to fluctuating prices can cost millions
Agenda Performance – why it’s actually cool and fun Performance tuning techniques Tools for identifying bottlenecks – – – – Memory CPU I/O Synchronization 13
Fixing performance problems Where to start? 14

15
16
A general methodology Performance problems are caused by limited resources Which resource is limited?
Finding the bottleneck

Finding the bottleneck
Resources to consider Applications may be – – – – CPU bound I/O bound Space bound “Lock bound” (contended)
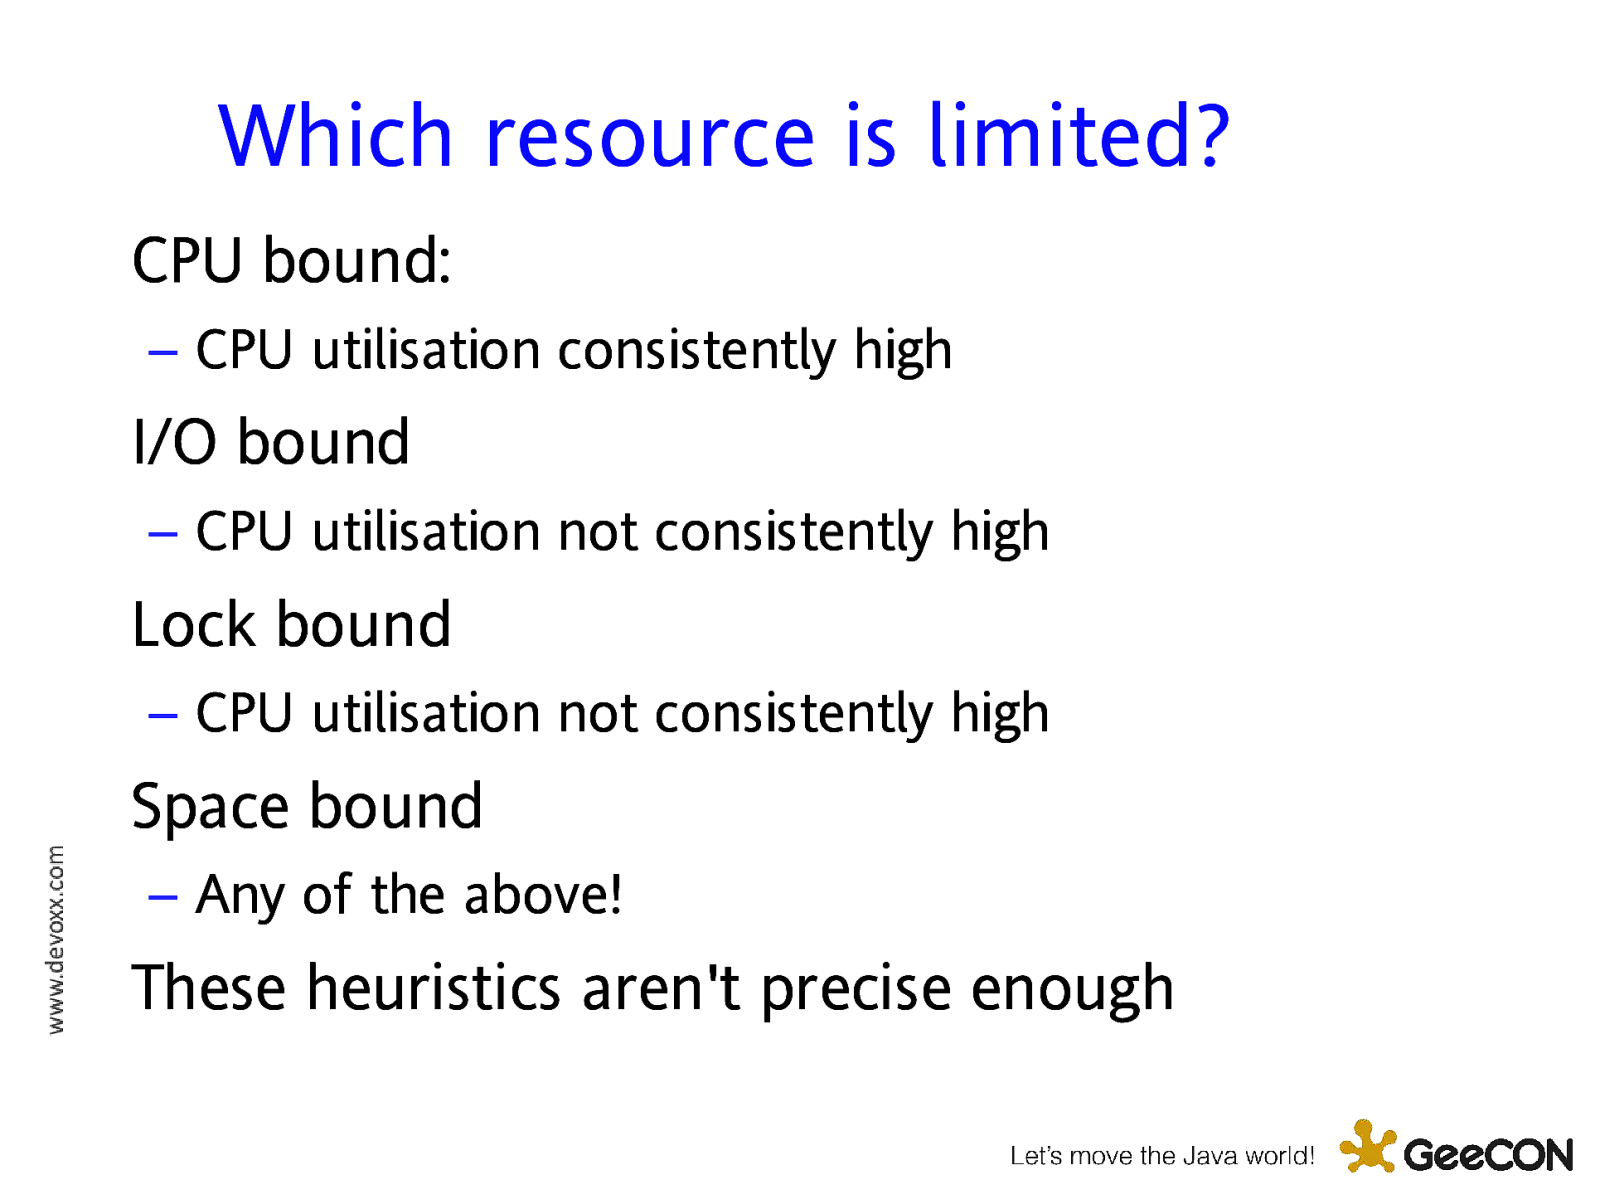
Which resource is limited? CPU bound: – CPU utilisation consistently high I/O bound – CPU utilisation not consistently high Lock bound – CPU utilisation not consistently high Space bound – Any of the above! These heuristics aren’t precise enough
What is the JVM doing?
Tools can help
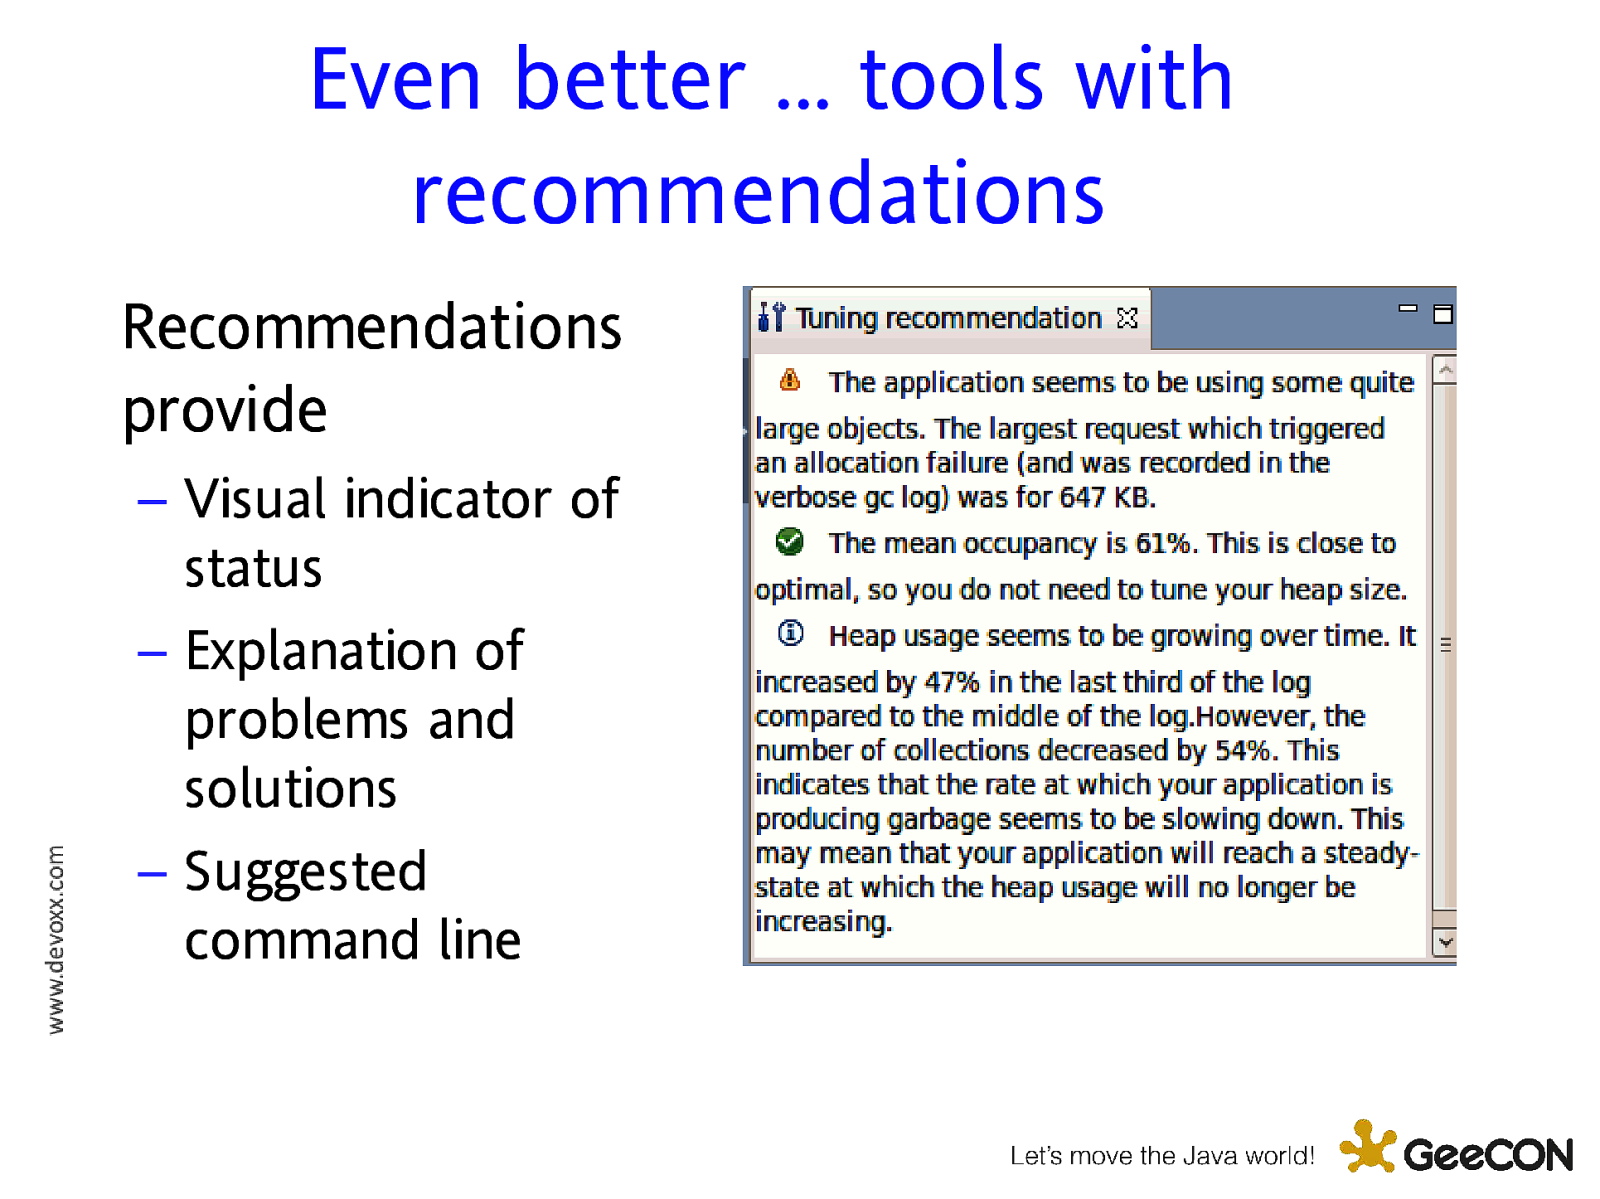
Even better … tools with recommendations Recommendations provide – Visual indicator of status – Explanation of problems and solutions – Suggested command line
A word of caution Performance must be measured before problems can be fixed – Otherwise you risk making things worse with a clever fix Performance measurement must be based on your application and your quality of service requirements Measurements must be made in a system as similar as possible to the production one
How well is your application performing? The simplest way to measure performance is System.currentTimeMillis() in a test harness Performance can be very variable, so measurements must be repeated Allow unmeasured warm-up period – (If that’s how the application will run) – Allows caches to be populated and methods to be compiled
Agenda Performance – why it’s actually cool and fun Performance tuning techniques Tools for identifying bottlenecks – – – – Memory CPU I/O Synchronization 27
IBM Performance Tools IBM provides a number of tools to identify and fix performance bottlenecks The tools are all free Most – but not all – are for IBM JVMs only Tools available from IBM Support Assistant
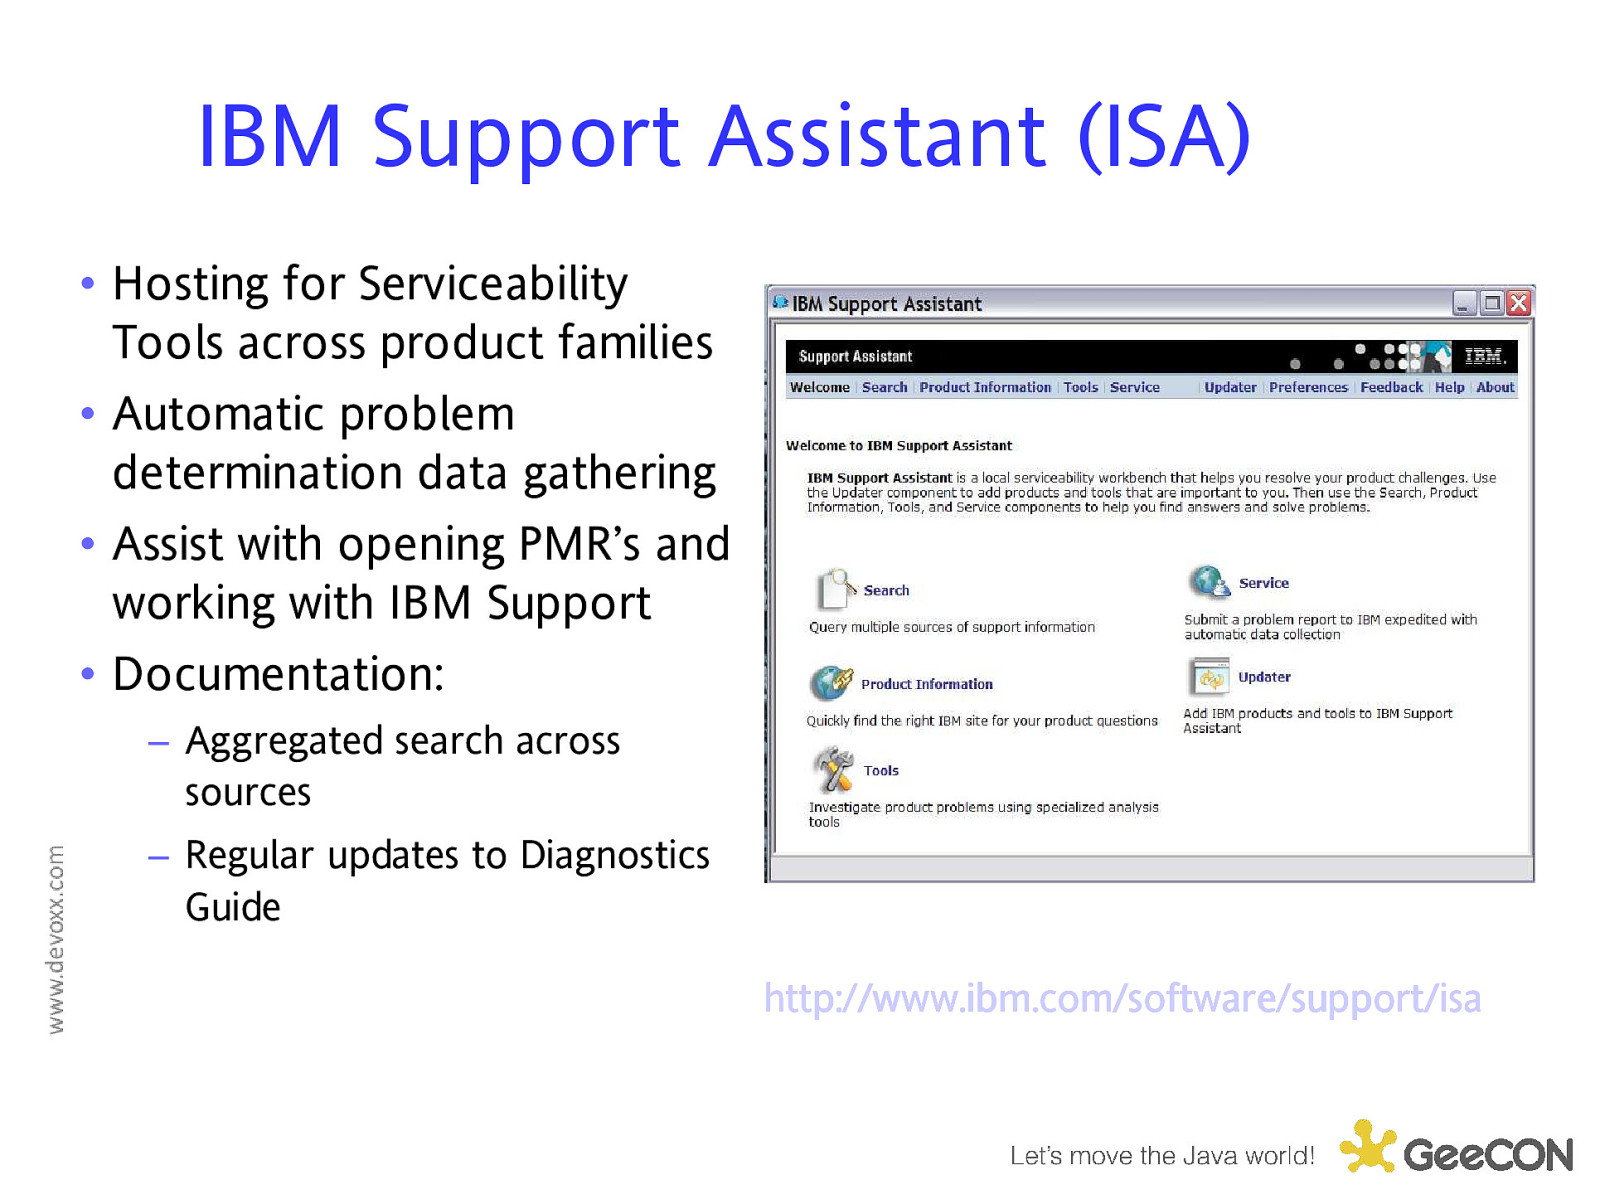
IBM Support Assistant (ISA) • Hosting for Serviceability Tools across product families • Automatic problem determination data gathering • Assist with opening PMR’s and working with IBM Support • Documentation: – Aggregated search across sources – Regular updates to Diagnostics Guide http: // www.ibm uppor p:// //w bm..com om//sof ofttware/s /su portt/i /issa
Agenda Performance – why it’s actually cool and fun Performance tuning techniques Tools for identifying bottlenecks – – – – Memory CPU I/O Synchronization 30
Space-bound applications Memory is a crucial resource Excessive memory usage can cause: – – – – Poor throughput Unresponsive applications Unpredictable program behavior Crashes in the application 31
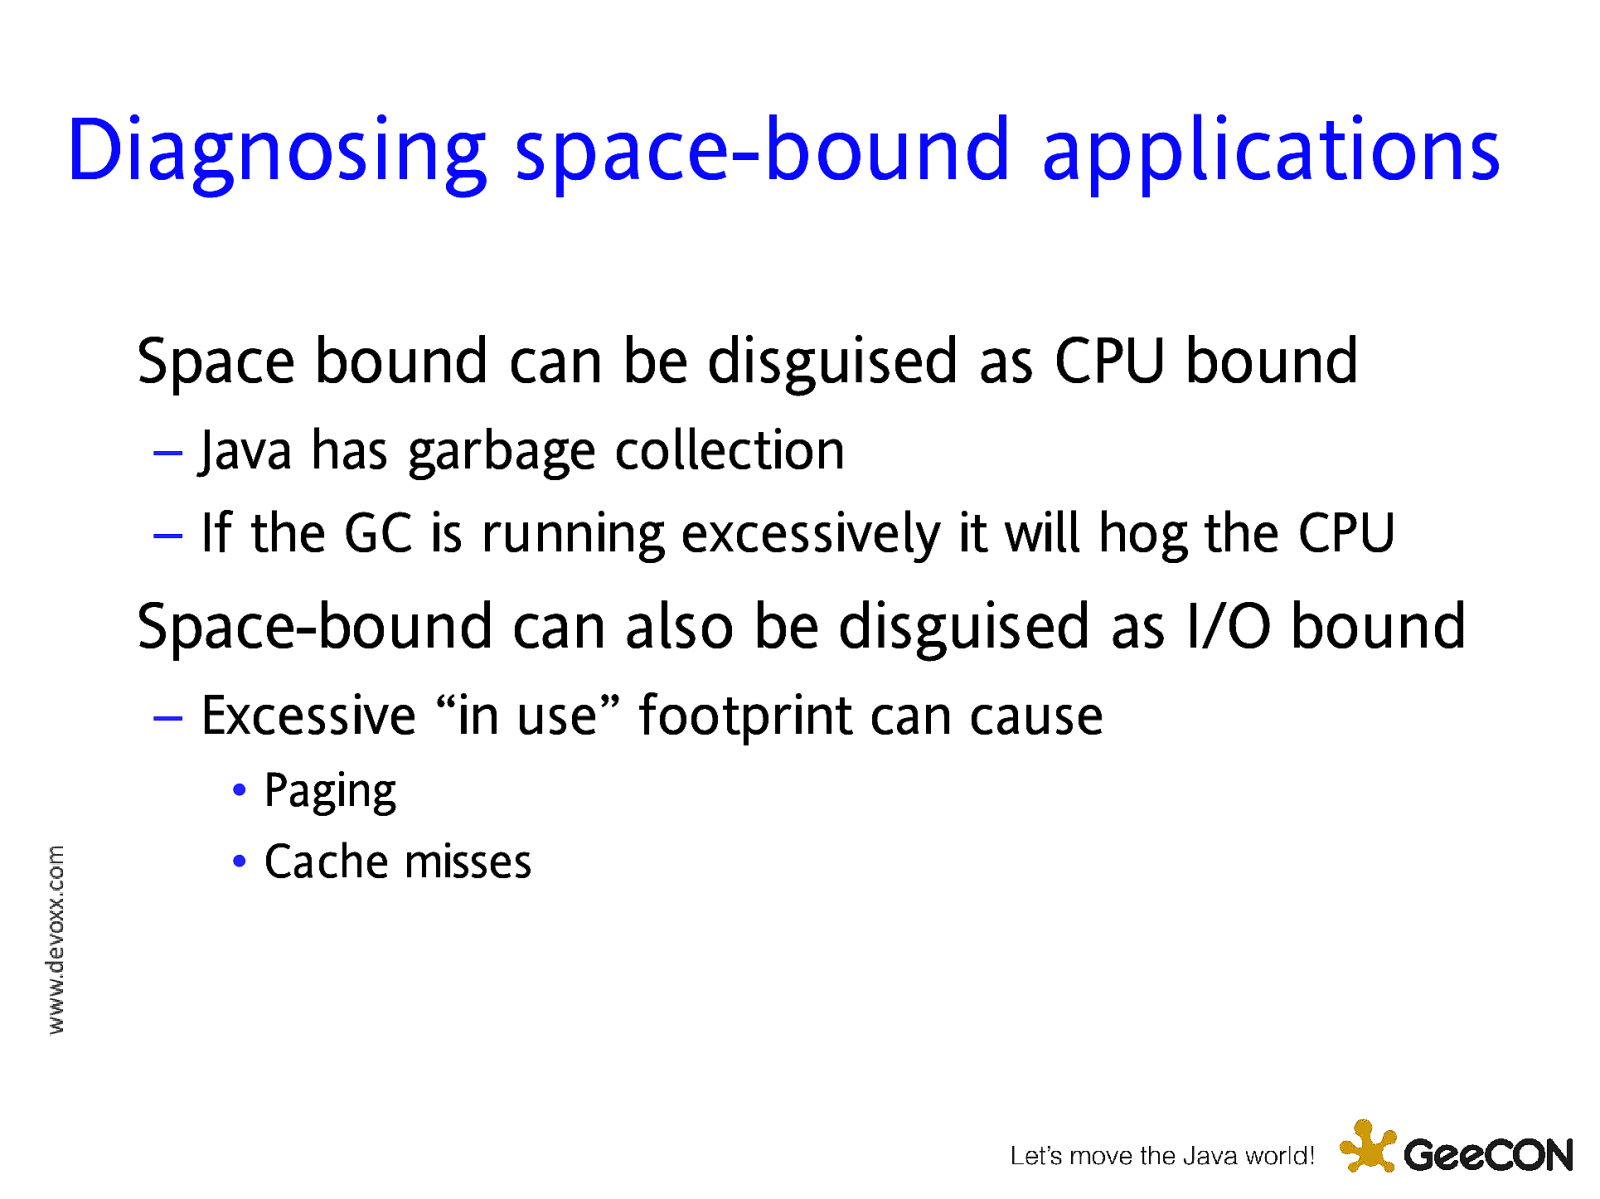
Diagnosing space-bound applications Space bound can be disguised as CPU bound – Java has garbage collection – If the GC is running excessively it will hog the CPU Space-bound can also be disguised as I/O bound – Excessive “in use” footprint can cause • Paging • Cache misses
Checking memory usage in Java
Two approaches Verbose GC – On IBM platforms, use -Xverbose:gc or Xverbosegclog:$file to write directly to a file – Logs may be analyzed with a verbose gc analysis tool Live memory monitoring – Requires specialized tools
IBM Monitoring and Diagnostic tools for Java – GC and Memory Visualizer Handles verbose GC from all versions of IBM JVMs – – – – 1.4.2 through 1.6.0 zSeries iSeries WebSphere real time … and Solaris platforms … and HP-UX platforms 35
GC and Memory Visualizer capabilities Analyses – – – – heap usage heap size pause times many other properties Provides tuning recommendations Compares multiple logs in the same reports
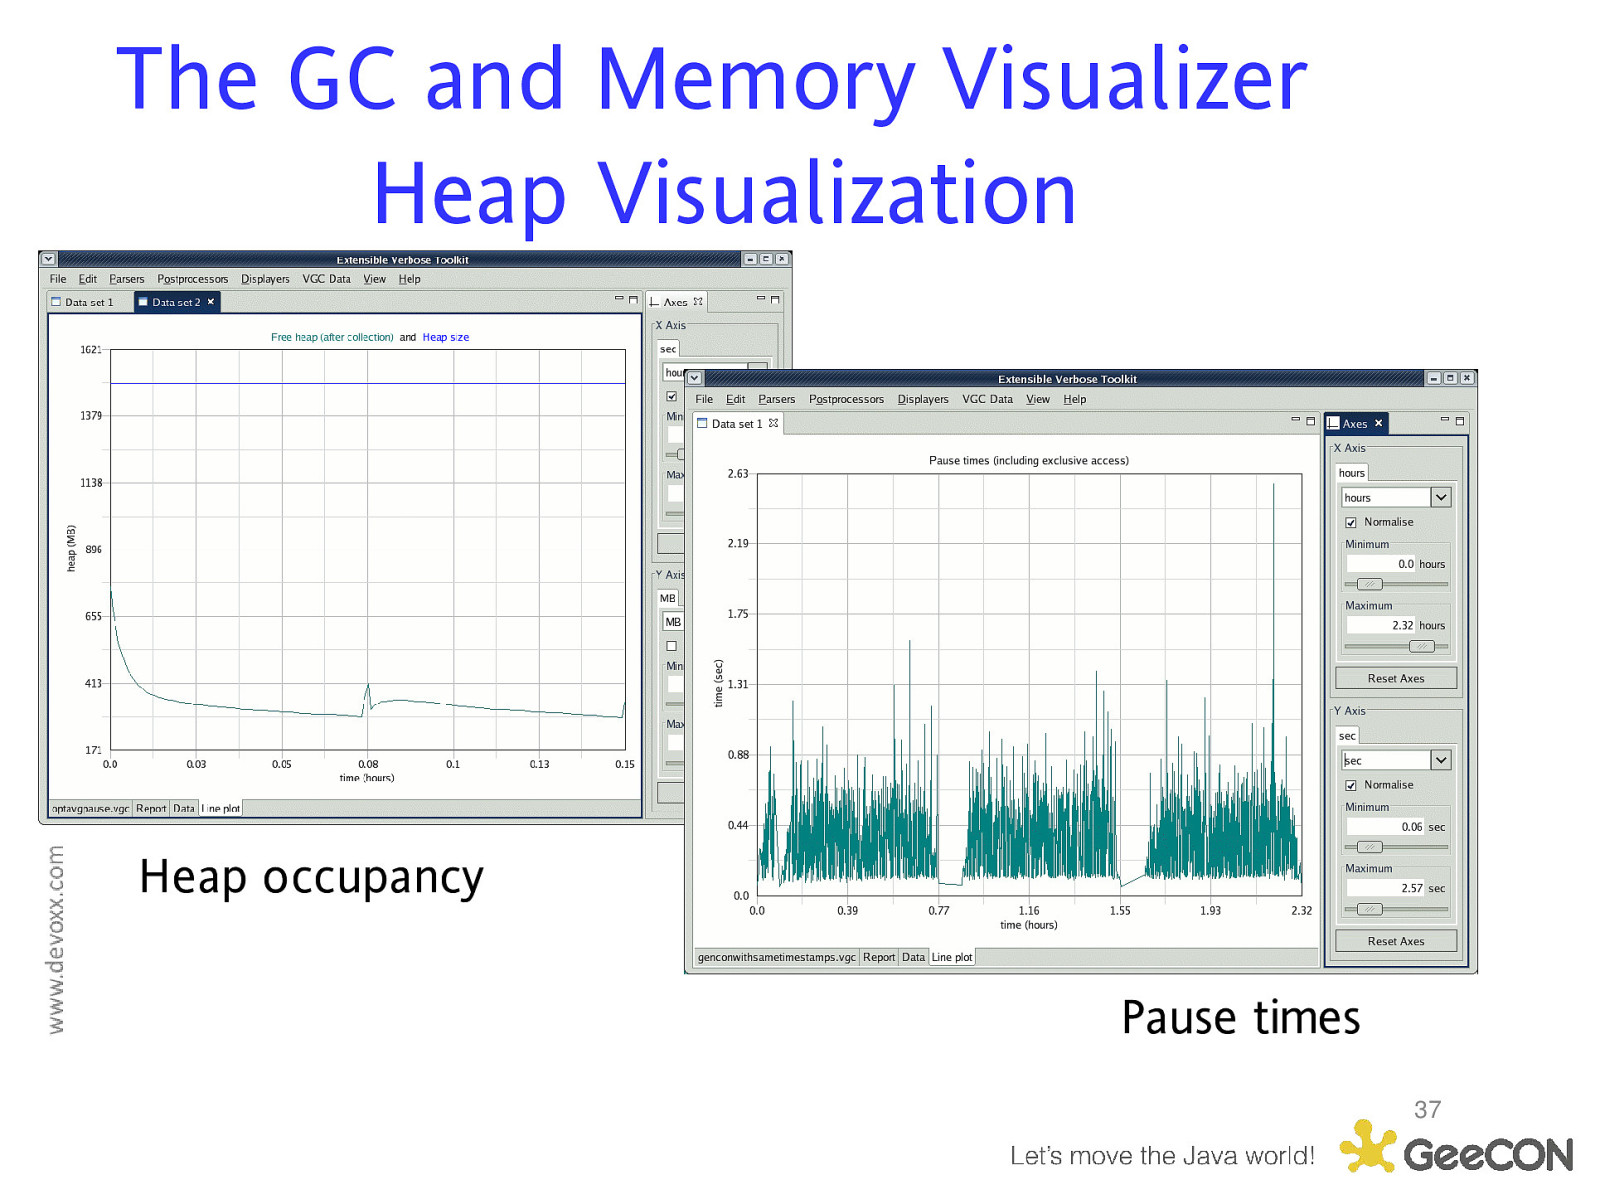
The GC and Memory Visualizer Heap Visualization Heap occupancy Pause times 37
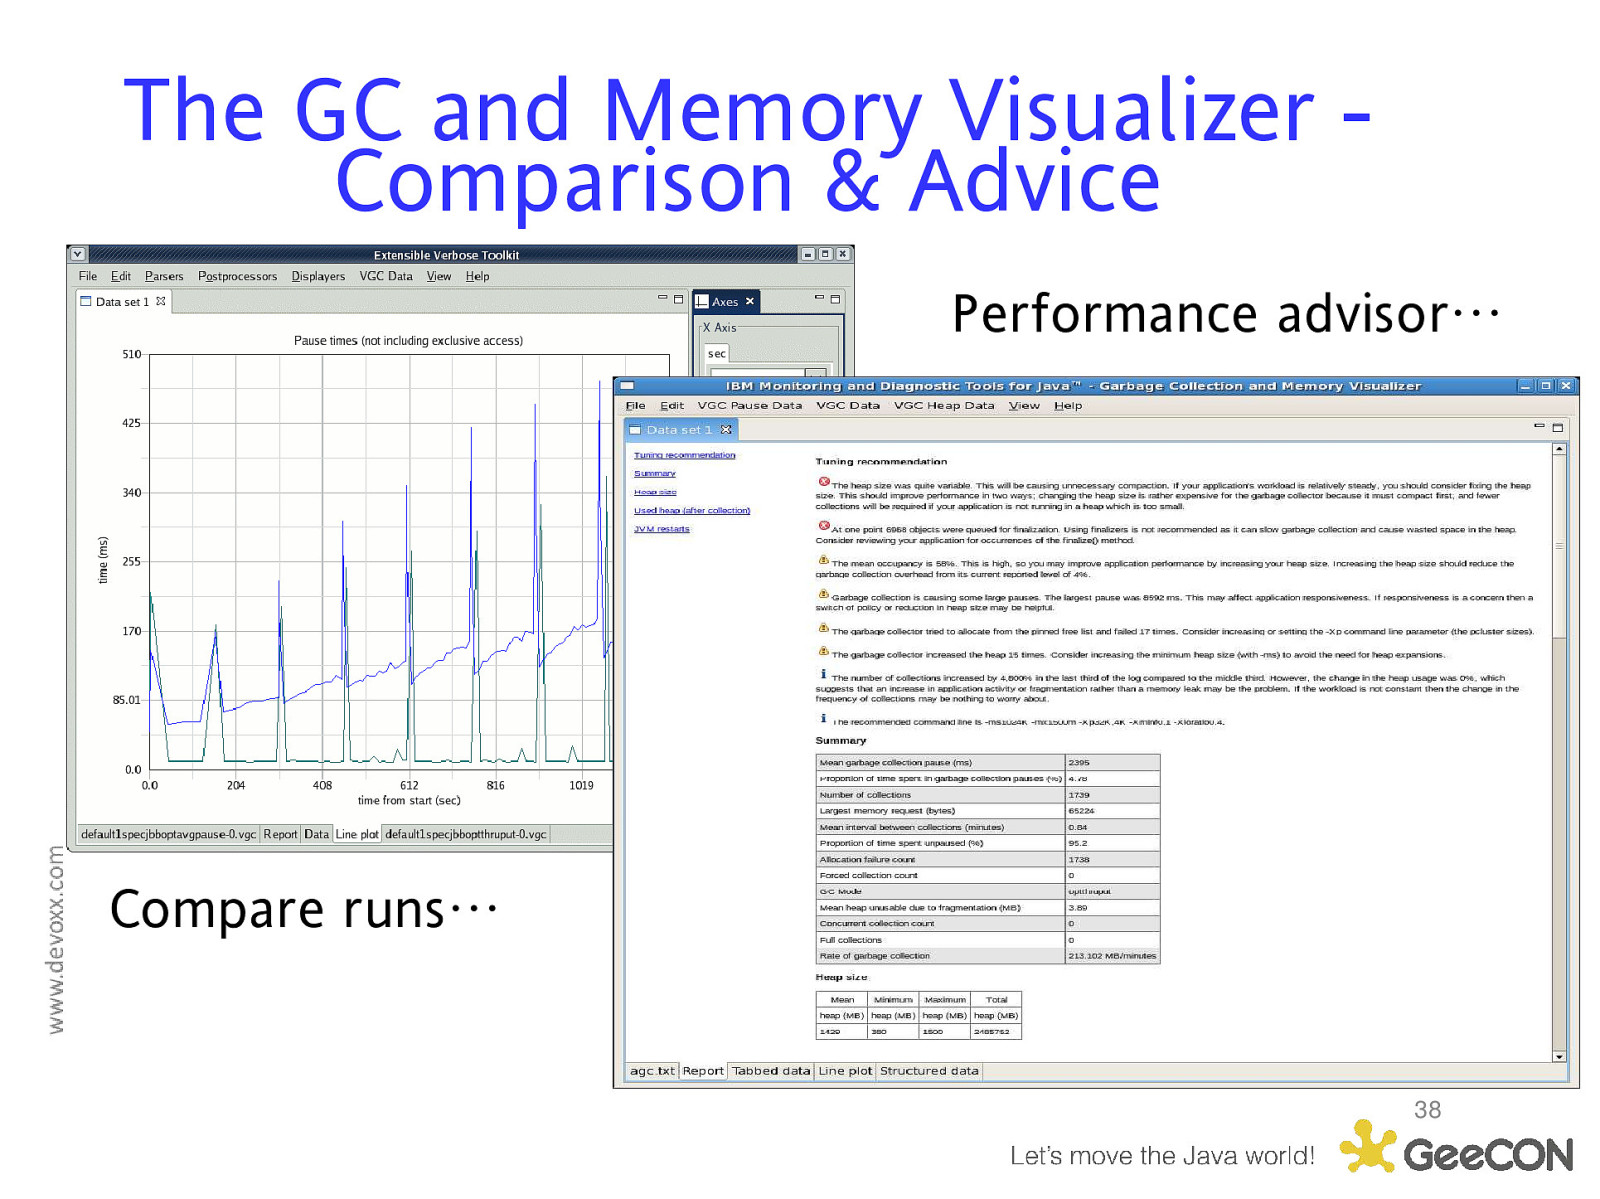
The GC and Memory Visualizer Comparison & Advice Performance advisor… Compare runs… 38
What does GC tell you? High heap occupancy indicates an application is likely space bound – Increase heap size or lower application footprint If GC is using more than 10% or 20% of the CPU action may be required – Alternate choice of policy – GC tuning
IBM Monitoring and Diagnostic Tools for Java - Health Center Live monitoring tool with very low overhead for IBM® Java™ 5.0 and 6.0 – 2.6% overhead against WebSphere benchmark (full set of data being collected) Gives insight into how your application is behaving Delivers set-up and tuning recommendations to help avoid application problems 40
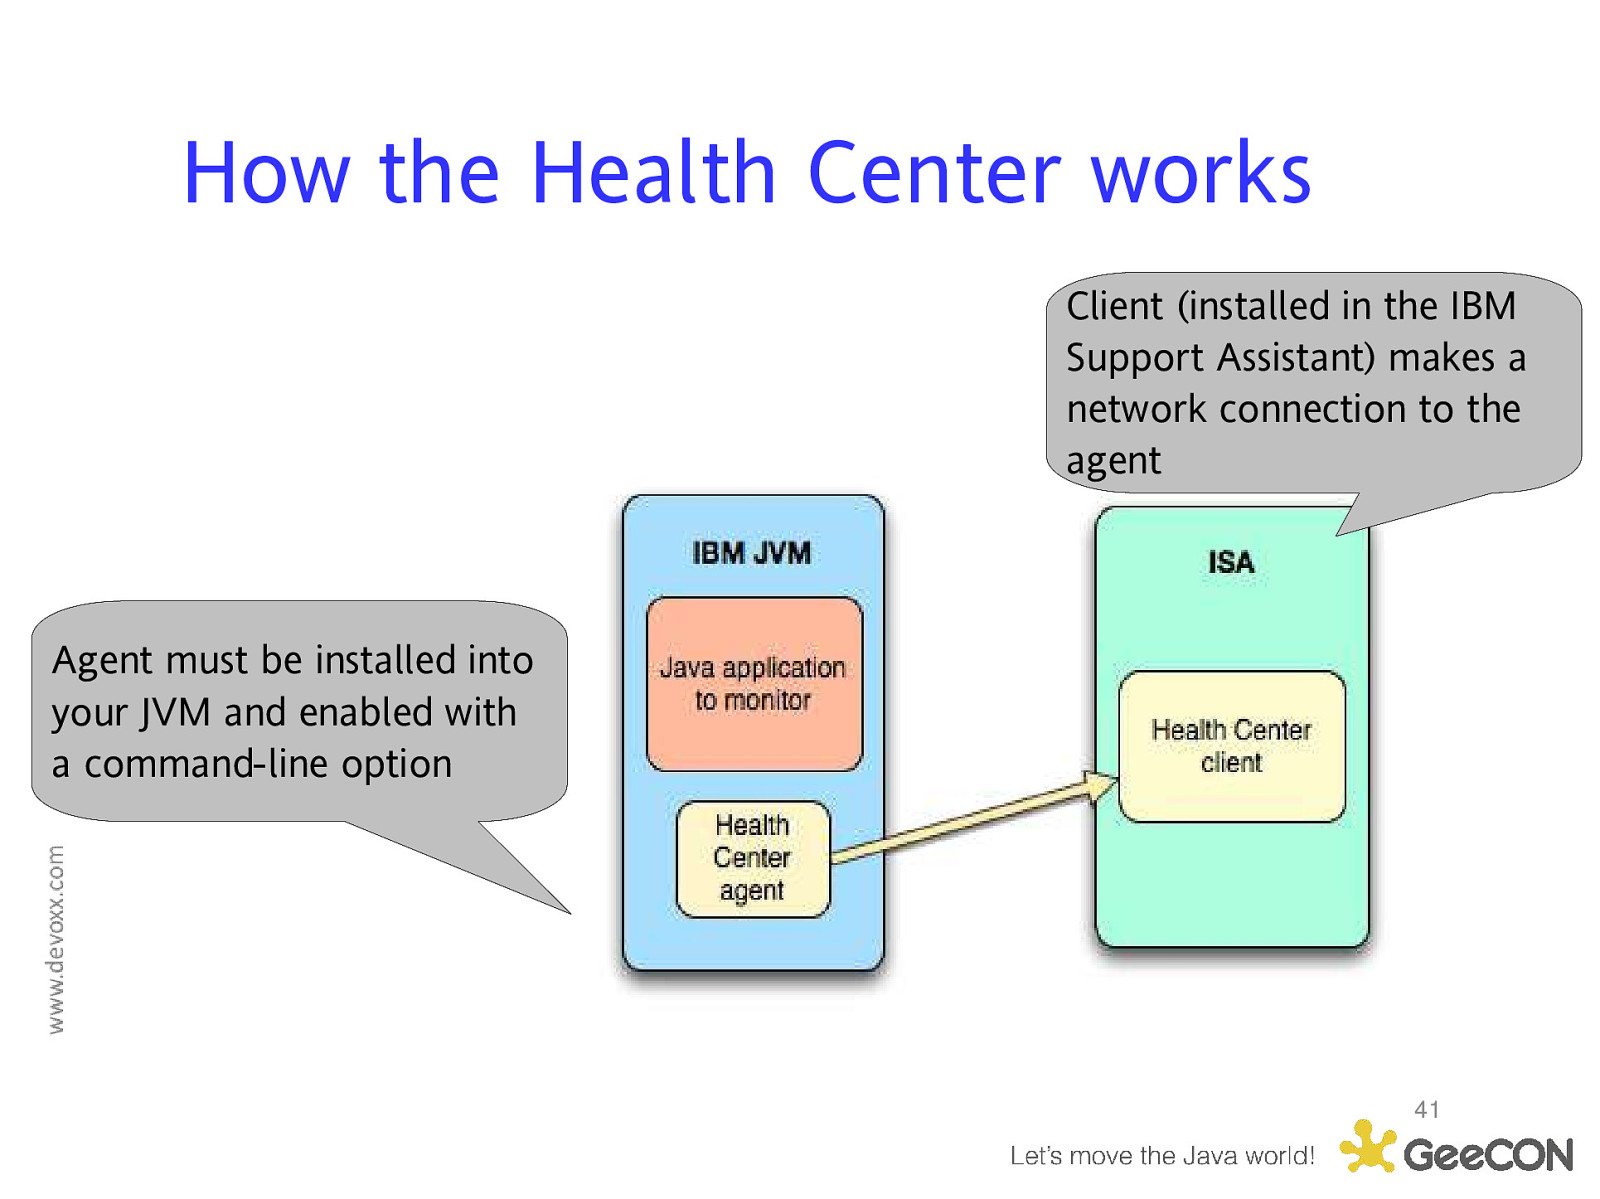
How the Health Center works Client (installed in the IBM Support Assistant) makes a network connection to the agent Agent must be installed into your JVM and enabled with a command-line option 41
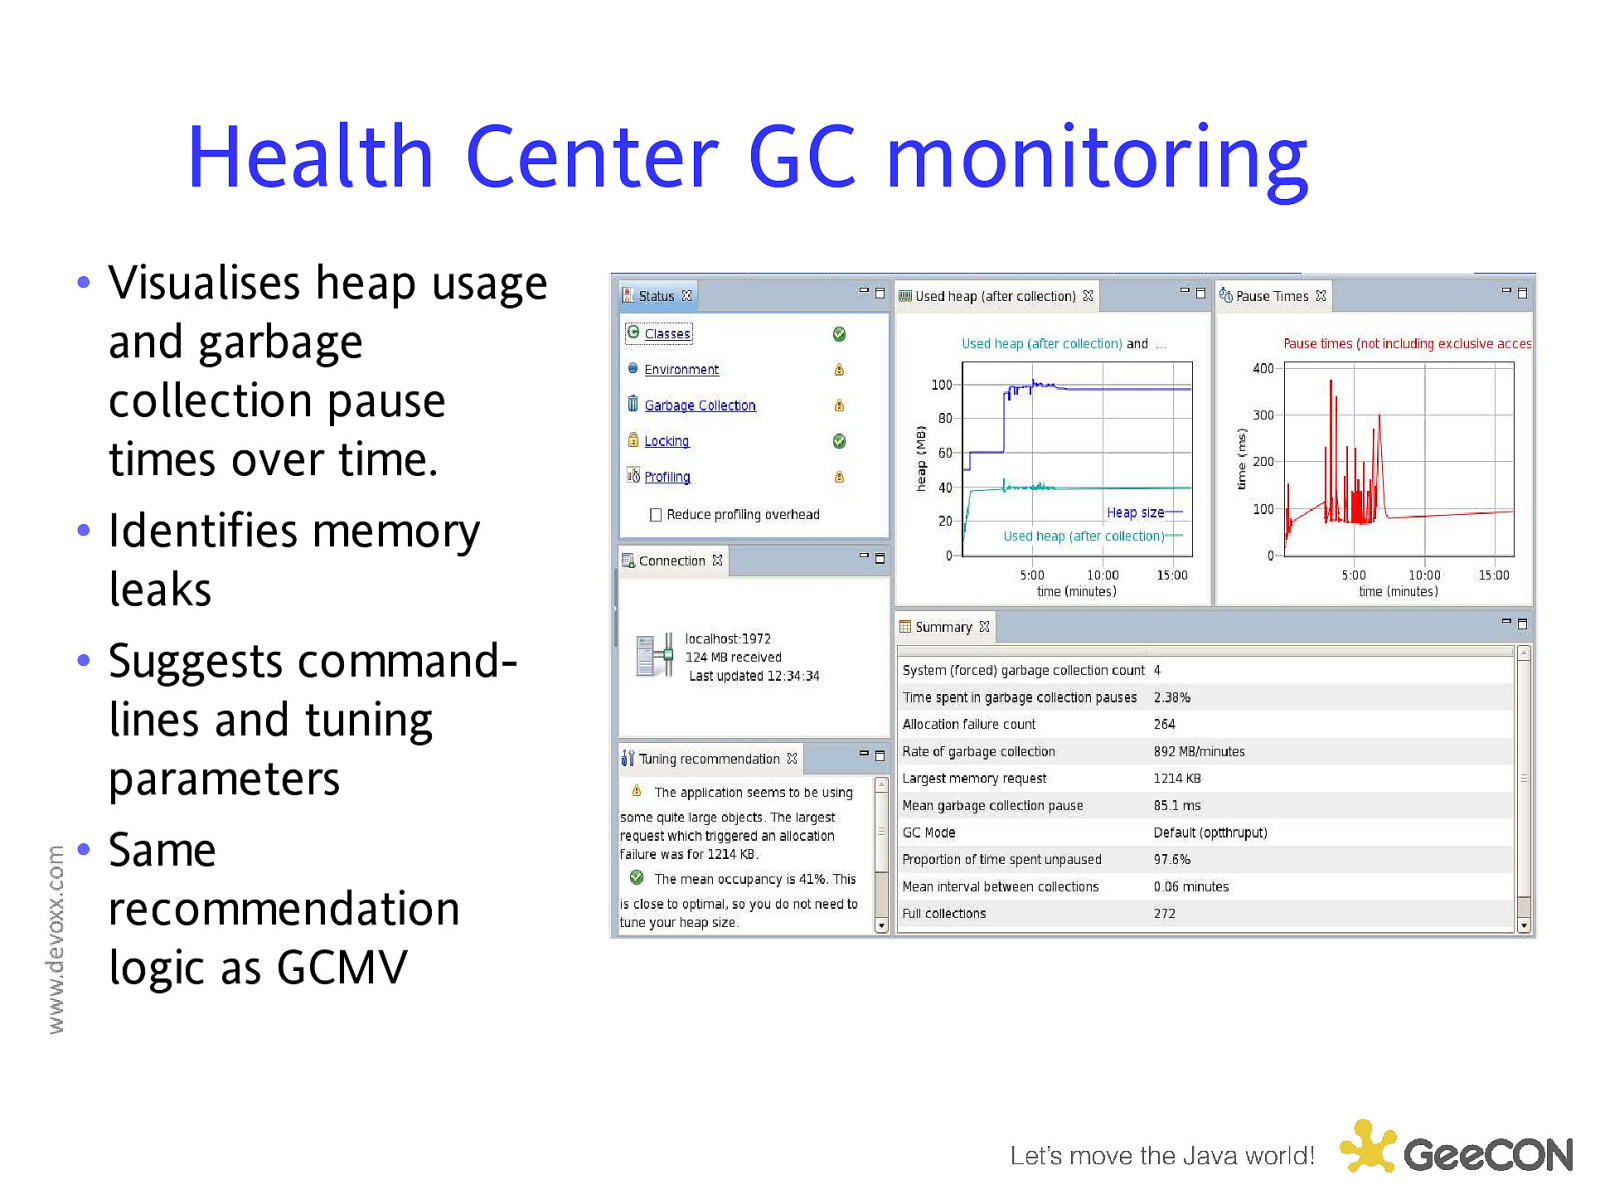
Health Center GC monitoring • Visualises heap usage and garbage collection pause times over time. • Identifies memory leaks • Suggests commandlines and tuning parameters • Same recommendation logic as GCMV
DEMO Using the Health Center to check memory usage 43
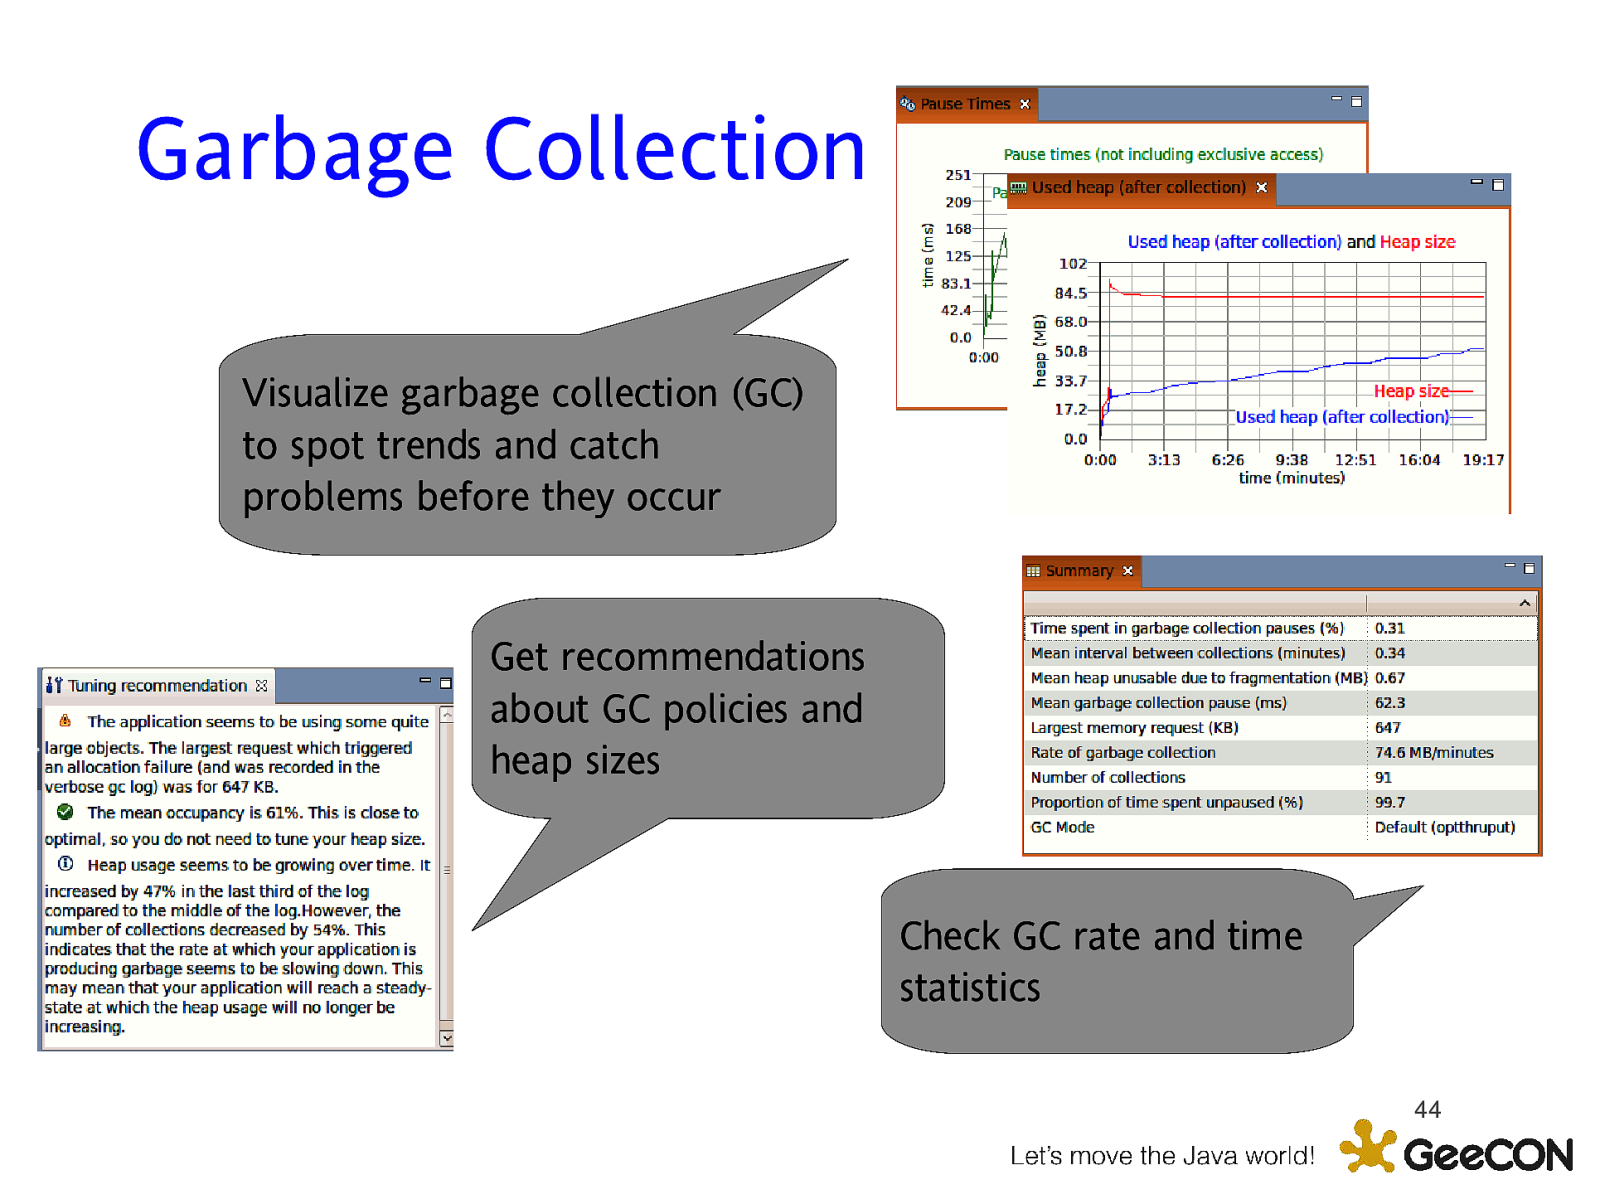
Garbage Collection Visualize garbage collection (GC) to spot trends and catch problems before they occur Get recommendations about GC policies and heap sizes Check GC rate and time statistics 44
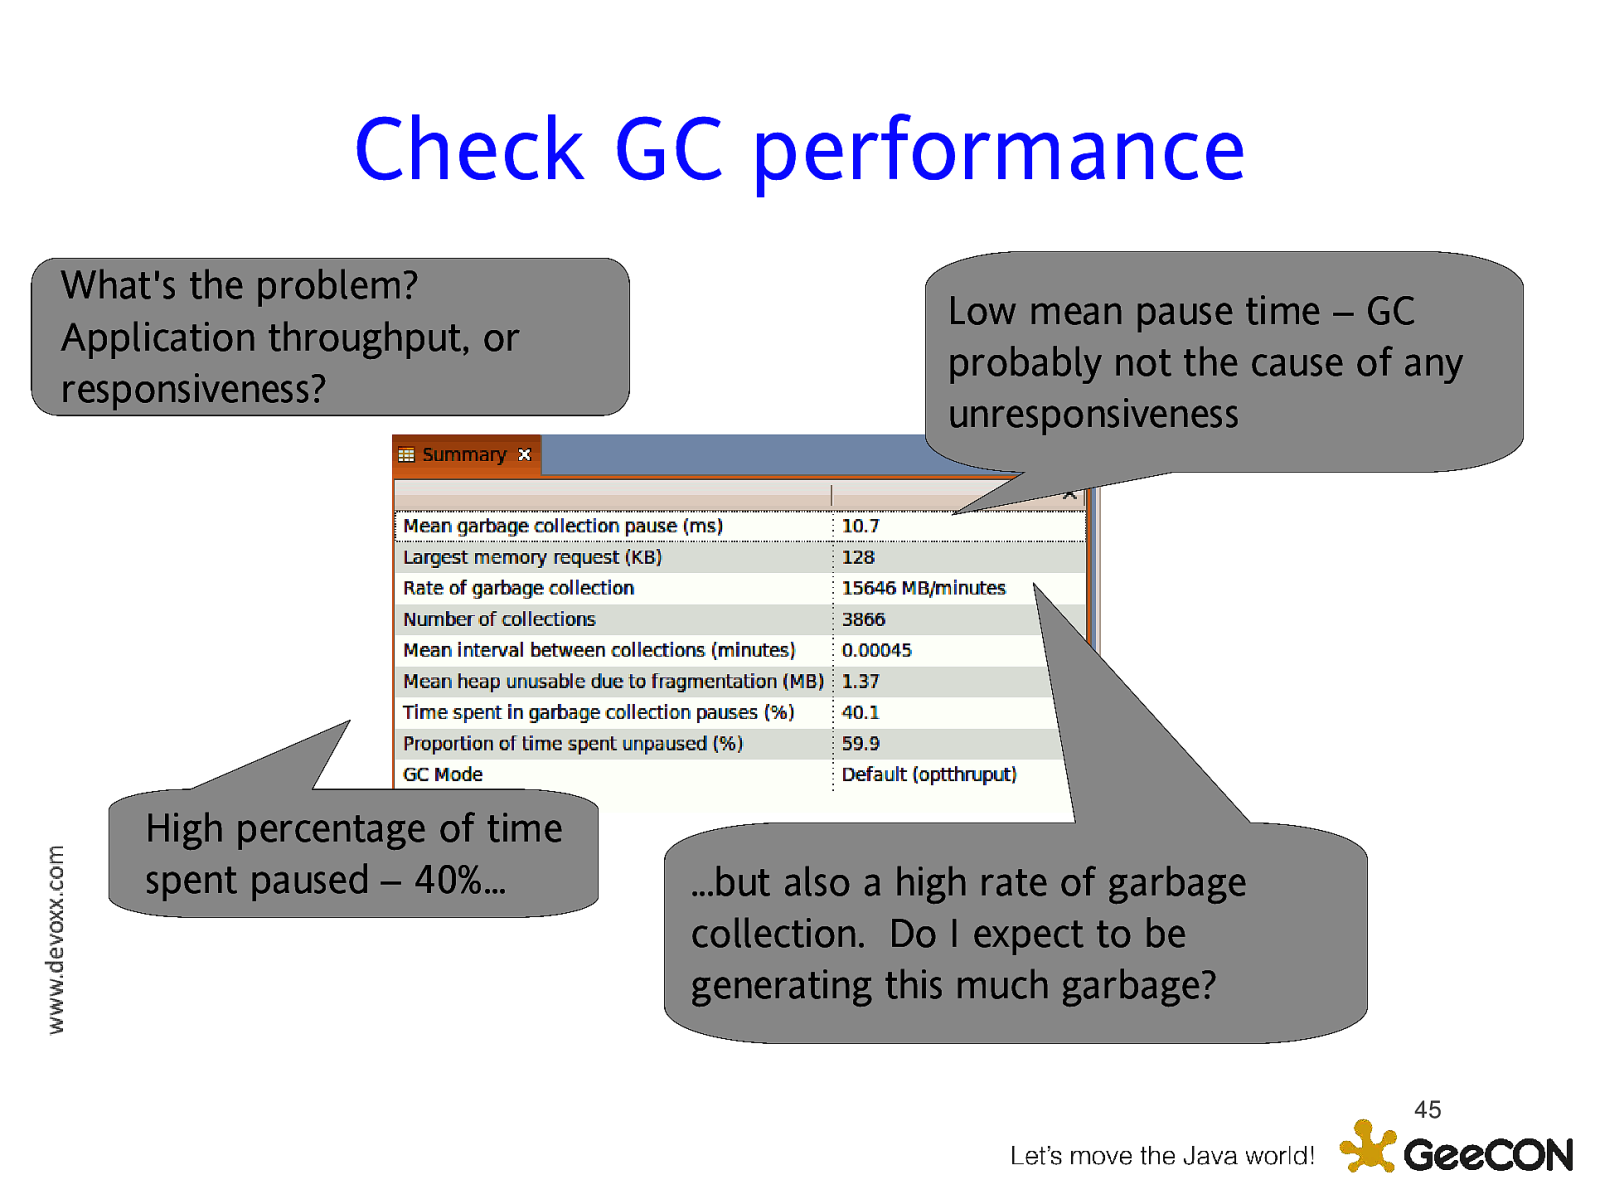
Check GC performance What’s the problem? Application throughput, or responsiveness? High percentage of time spent paused – 40%… Low mean pause time – GC probably not the cause of any unresponsiveness …but also a high rate of garbage collection. Do I expect to be generating this much garbage? 45
Assessing Footprint Is the footprint too big?
Assessing Footprint Is the footprint too big? Is the footprint growing? – Bad bad news
Assessing Footprint Is the footprint too big? Is the footprint growing? – Bad bad news If left unchecked, a memory leak will eventually cause a crash
Memory leaks in Java? Memory leaks happen when objects which are no longer required still use up memory Two kinds of memory leak: – Losing a reference to an object which is no longer in use – Holding on to a reference for an object which is no longer in use Garbage collection eliminates the first kind, but not the second
Diagnosing footprint issues You need to know what objects are on the heap Heap dumps are a record of every object on the heap – Automatically produced on OutOfMemoryErrors – Can be triggered programatically Extremely useful for problem solving, but tooling support is essential
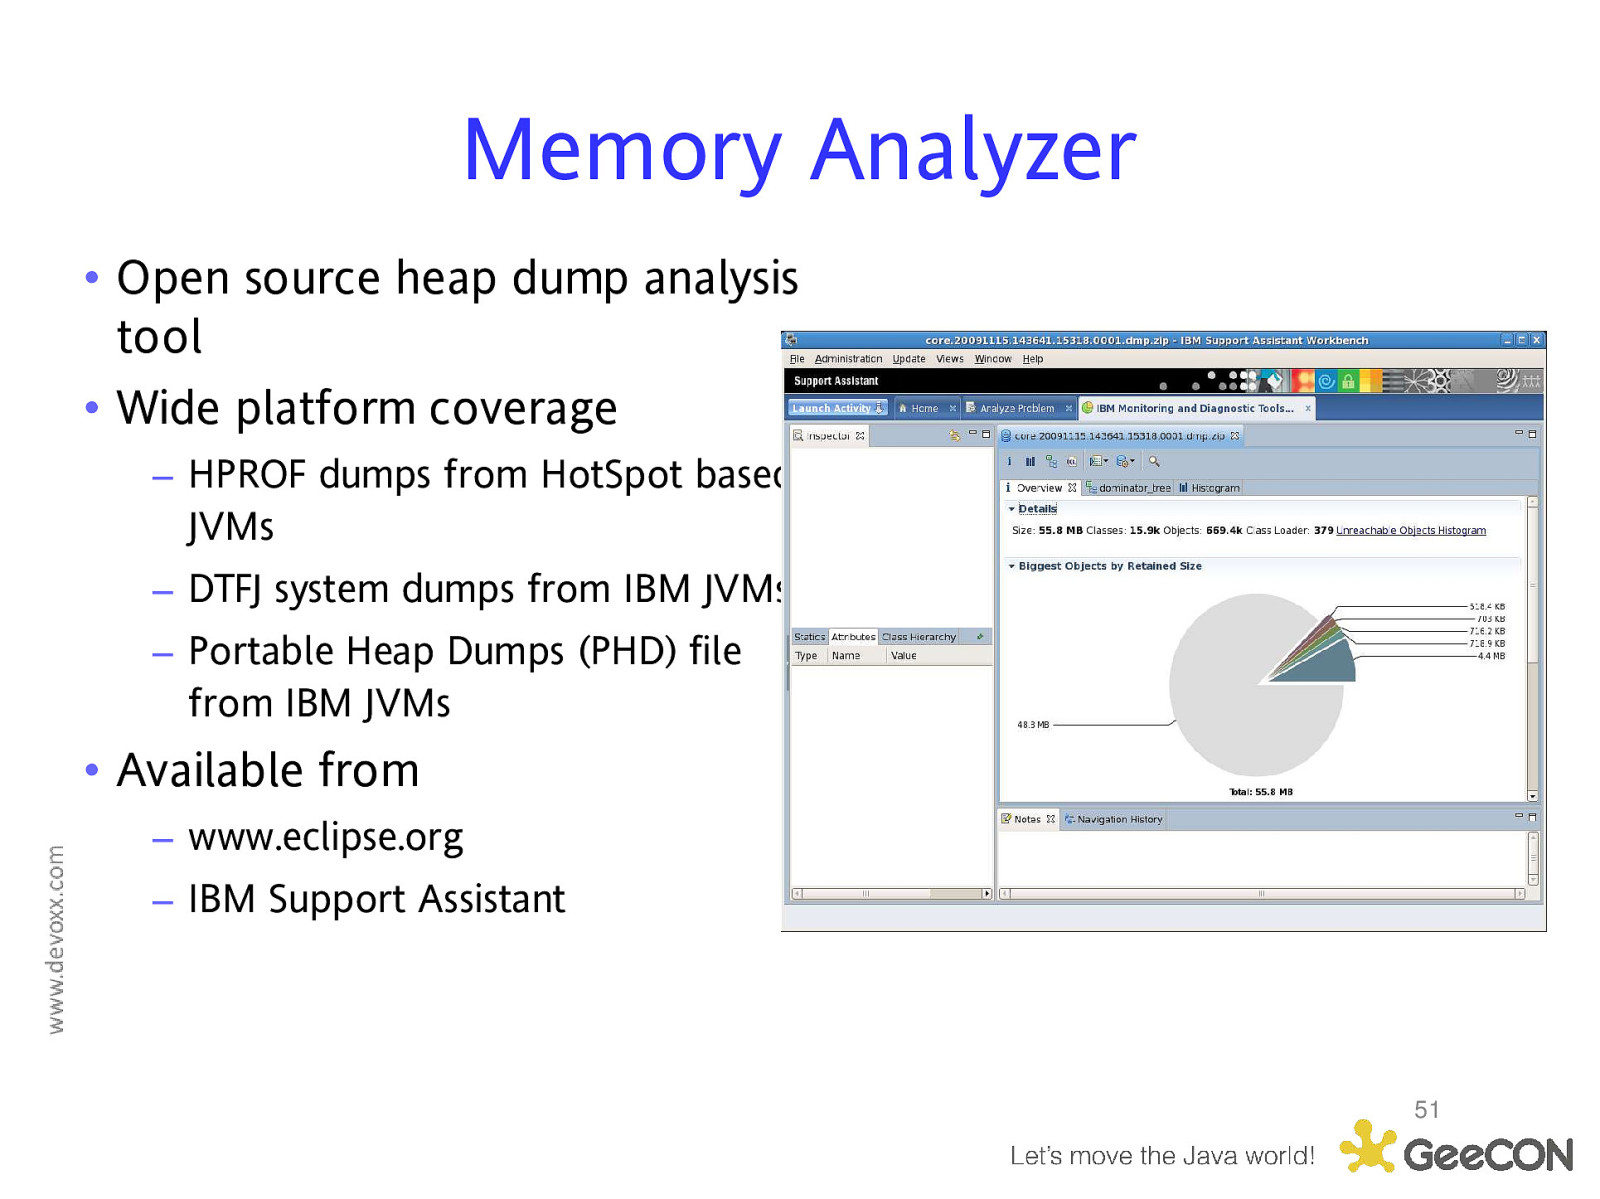
Memory Analyzer • Open source heap dump analysis tool • Wide platform coverage – HPROF dumps from HotSpot based JVMs – DTFJ system dumps from IBM JVMs – Portable Heap Dumps (PHD) file from IBM JVMs • Available from – www.eclipse.org – IBM Support Assistant 51

Detailed view of heap contents 52
DEMO Using the Memory Analyzer to identify memory consumers 53
Optimizing footprint Inspect the set of retained objects – Use dominator tree – Use histogram Search for inefficiently used data structures Look for redundant data – Use “Group by Value” 54
Don’t forget native memory Java applications use – and may leak - native memory Low occupancy is no guarantee an application is not space bound. Native memory use is not logged in verbose GC OutOfMemory errors may occur even though there is lots of room in the heap
Tracking native memory usage Use platform-specific tools – Windows perfmon tool – Linux ps – AIX vmstat
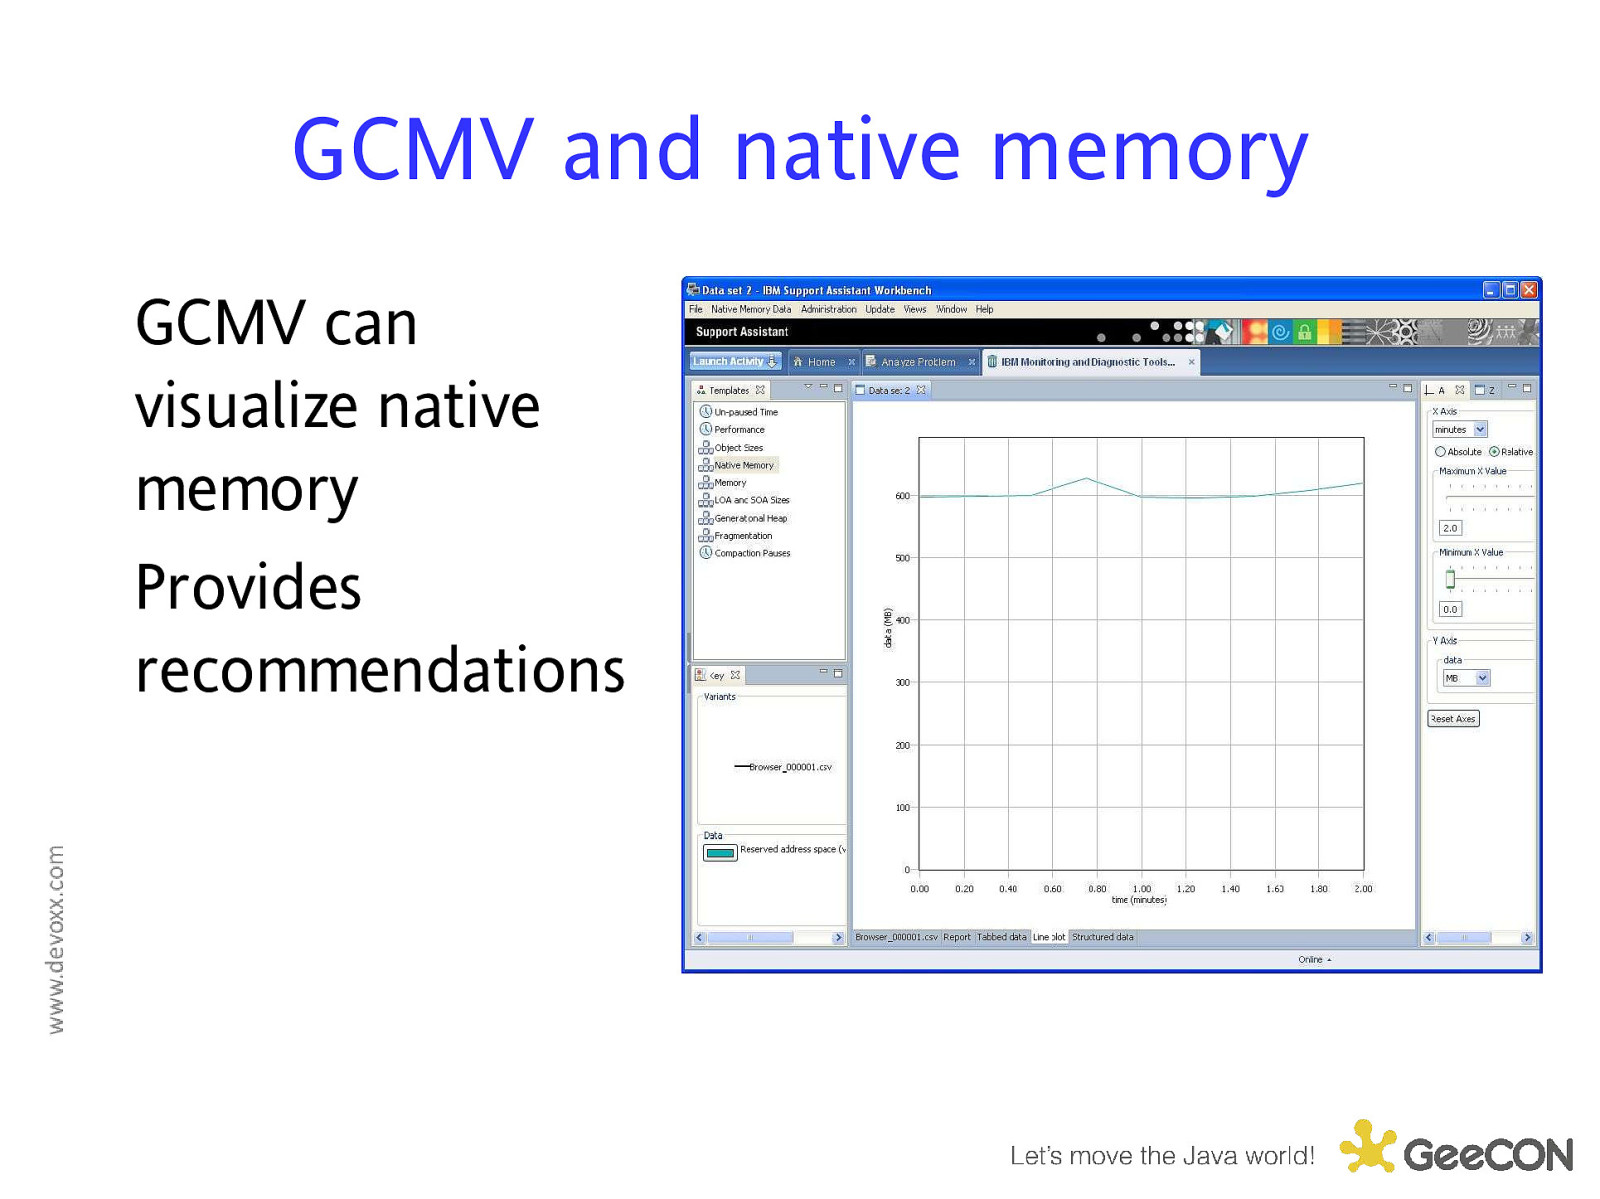
GCMV and native memory GCMV can visualize native memory Provides recommendations
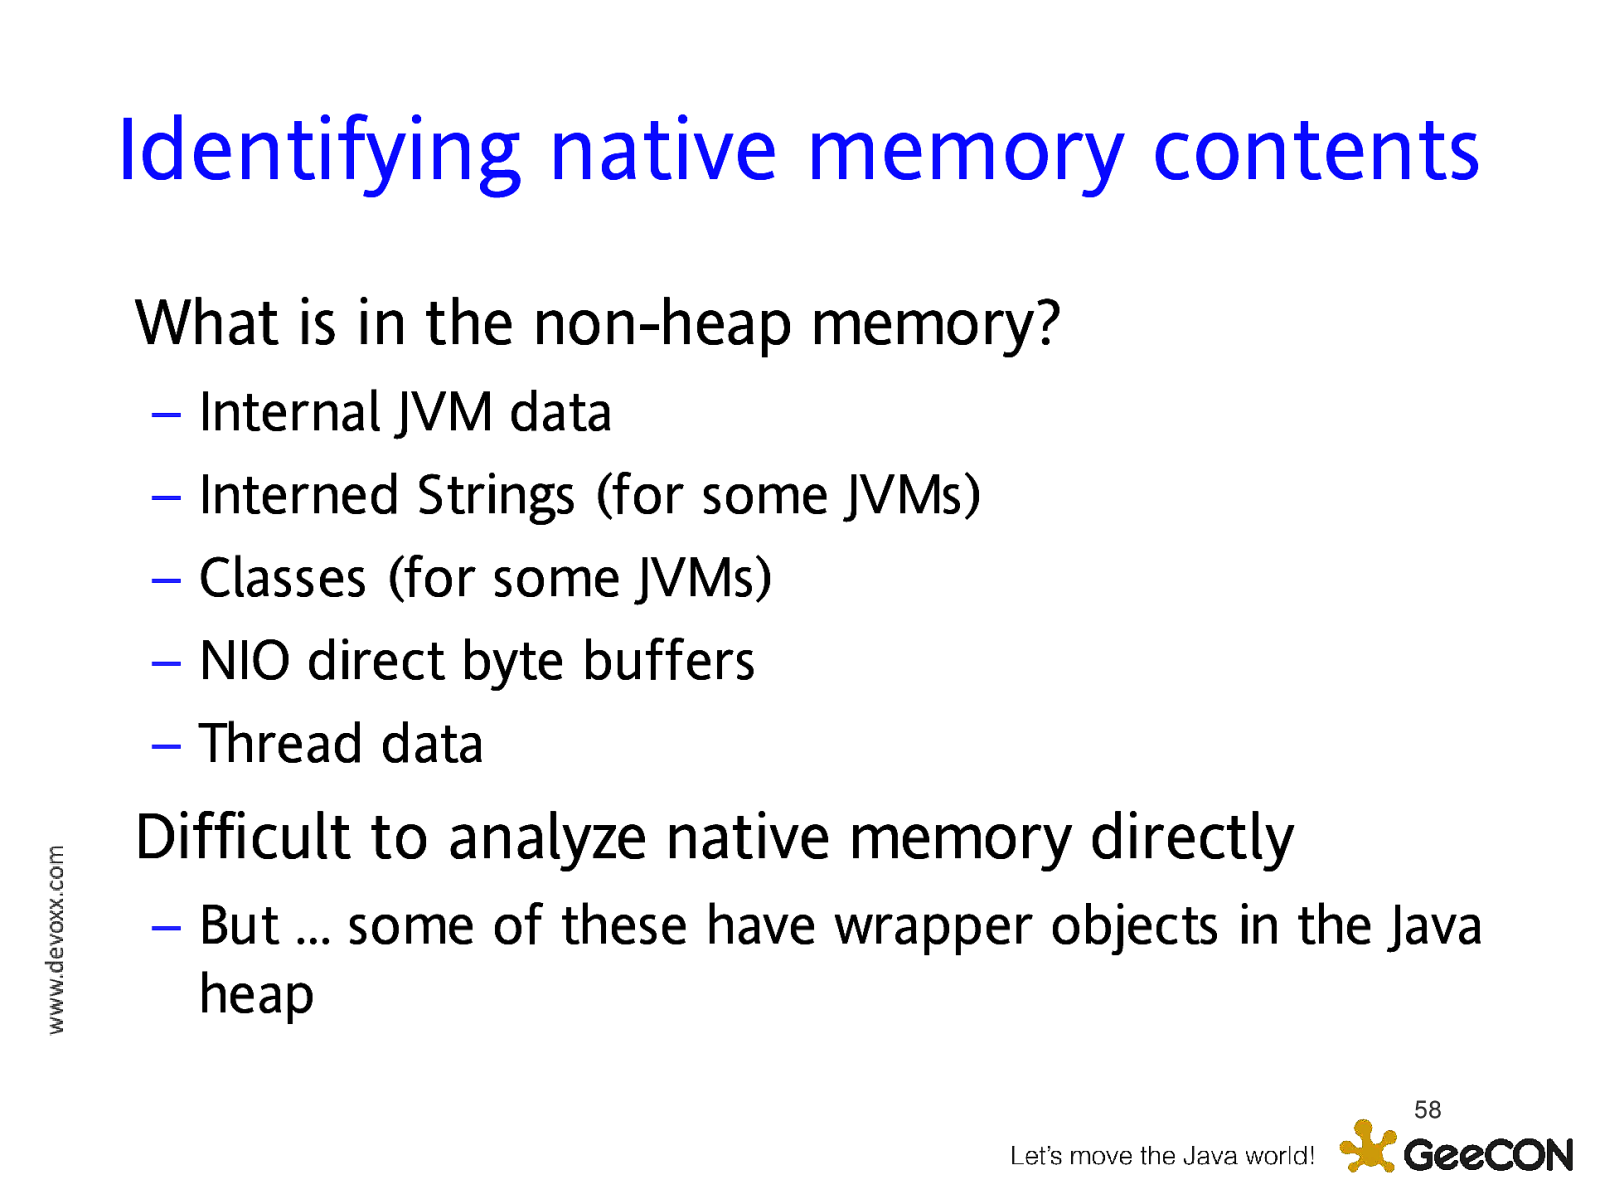
Identifying native memory contents What is in the non-heap memory? – – – – – Internal JVM data Interned Strings (for some JVMs) Classes (for some JVMs) NIO direct byte buffers Thread data Difficult to analyze native memory directly – But … some of these have wrapper objects in the Java heap 58
Using Memory Analyzer Heap dump analysis can be used to identify some native memory issues – Are there a lot of Thread objects? – Are there a lot of NIO direct byte buffers? 59
Agenda Performance – why it’s actually cool and fun Performance tuning techniques Tools for identifying bottlenecks – Memory – CPU – I/O – Synchronization 60
CPU bound applications Code is being invoked more than it needs to be – Easily done with event-driven models An algorithm is not the most efficient – Easily done without algorithms research!
Diagnosing CPU bound applications Fixing CPU bound applications requires knowledge of what code is being run – Identify methods which are suitable for optimisation • Optimising methods which the application doesn’t spend time in is a waste of your time – Identify methods where more time is being spent than you expect • “Why is so much of my profile in calls to this trivial little method?”
Method trace and profiling There are two ways to work out what code your application is doing – Trace – Sampling profiling
Method trace Tracing – Does not require specialist tools (but is better with them) – Records every invocation of a subset of methods – Gives insight into sequence of events – In the simplest case, System.out.println – Usually focussed on targeted packages or methods
Method profiling Profiling – Requires specialist tools – Samples all methods and provides statistics – Can give a broad picture of application activity
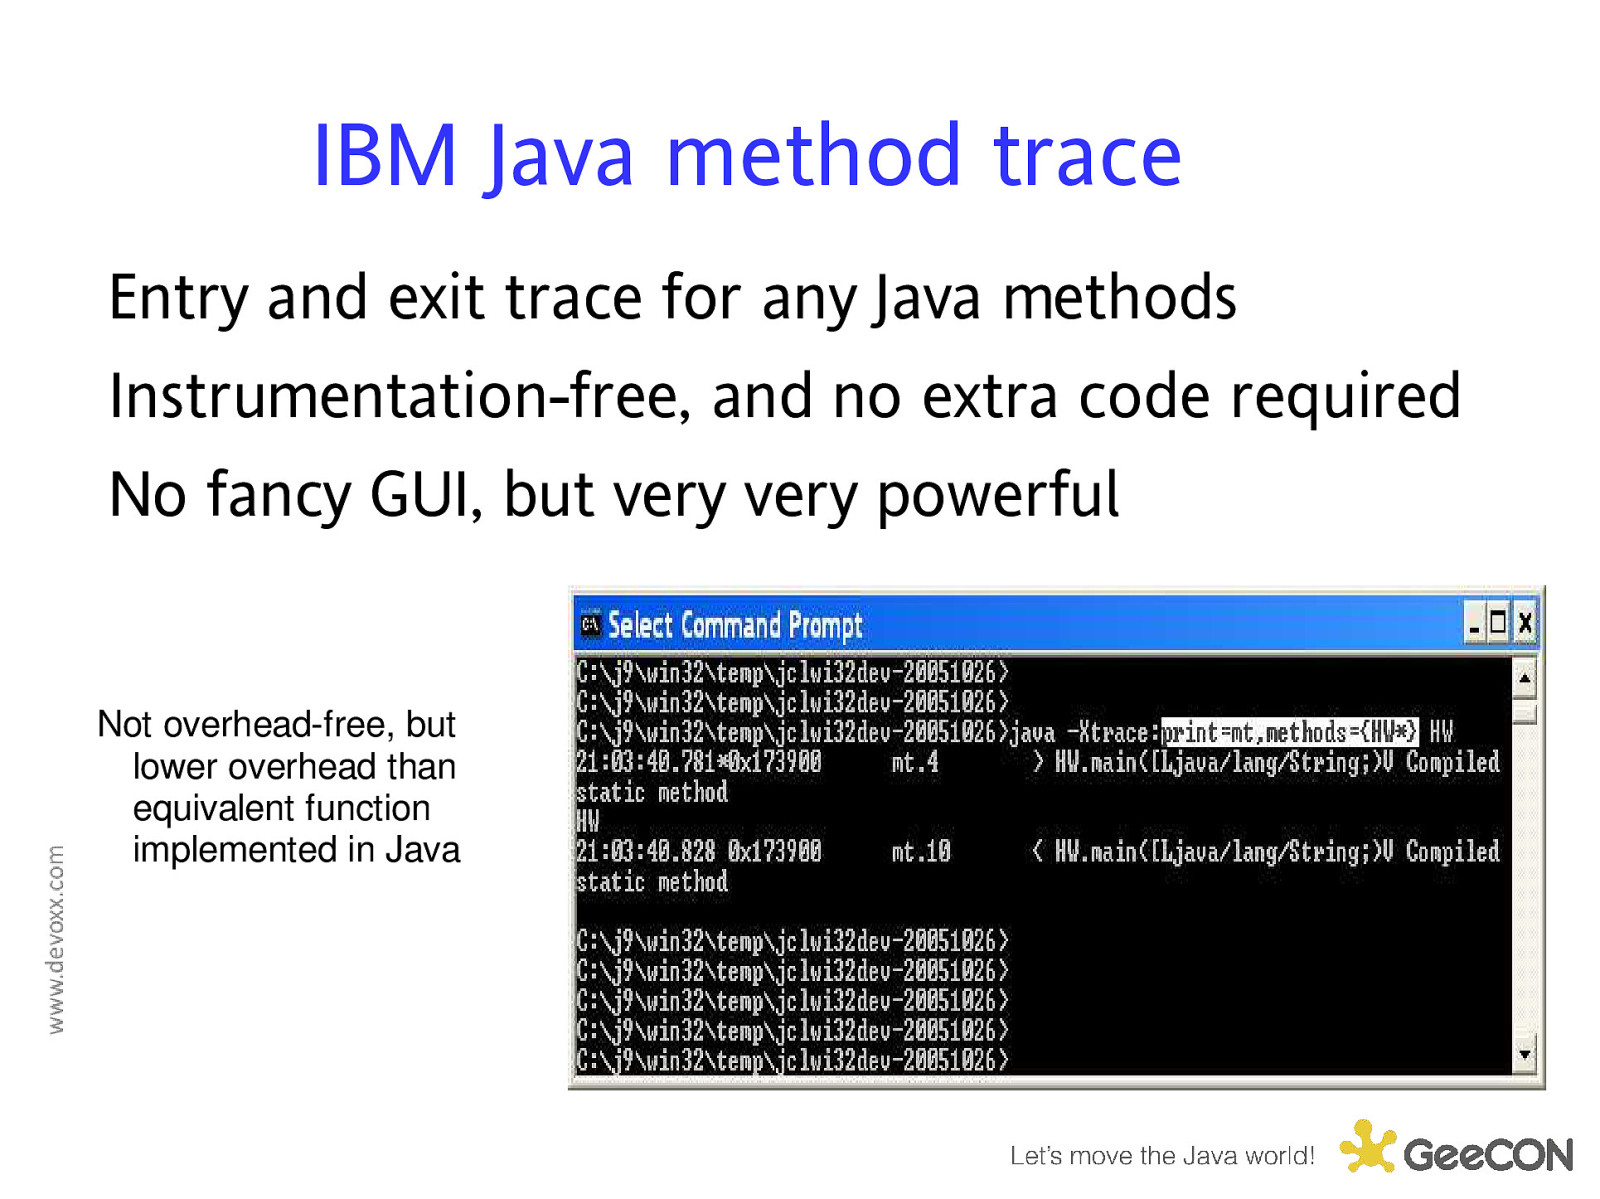
IBM Java method trace Entry and exit trace for any Java methods Instrumentation-free, and no extra code required No fancy GUI, but very very powerful Not overhead-free, but lower overhead than equivalent function implemented in Java
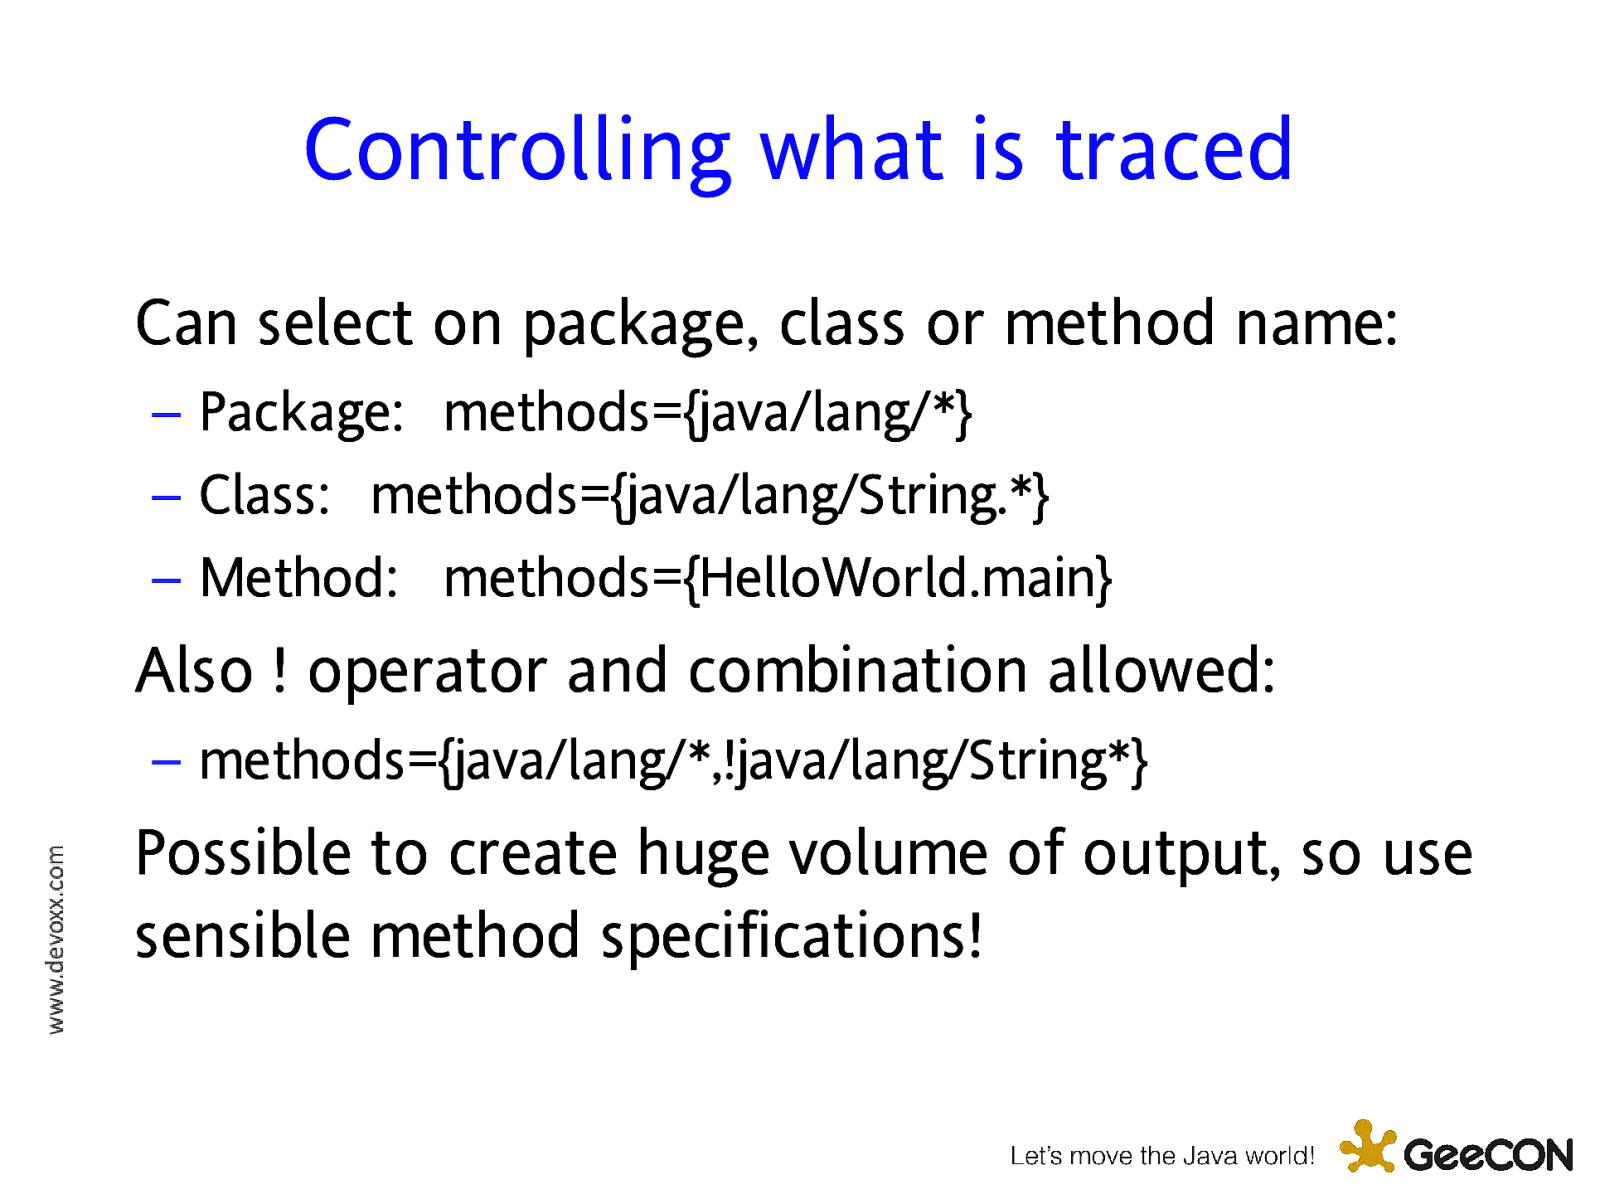
Controlling what is traced Can select on package, class or method name: – Package: methods={java/lang/} – Class: methods={java/lang/String.} – Method: methods={HelloWorld.main} Also ! operator and combination allowed: – methods={java/lang/,!java/lang/String} Possible to create huge volume of output, so use sensible method specifications!
Triggering events Can request certain actions occur when chosen methods are entered or exited Actions such as coredump, javadump, etc. Actions such as enabling more method trace! Can cause action to occur on n’th instance of trigger condition Can specify how many times the action occurs
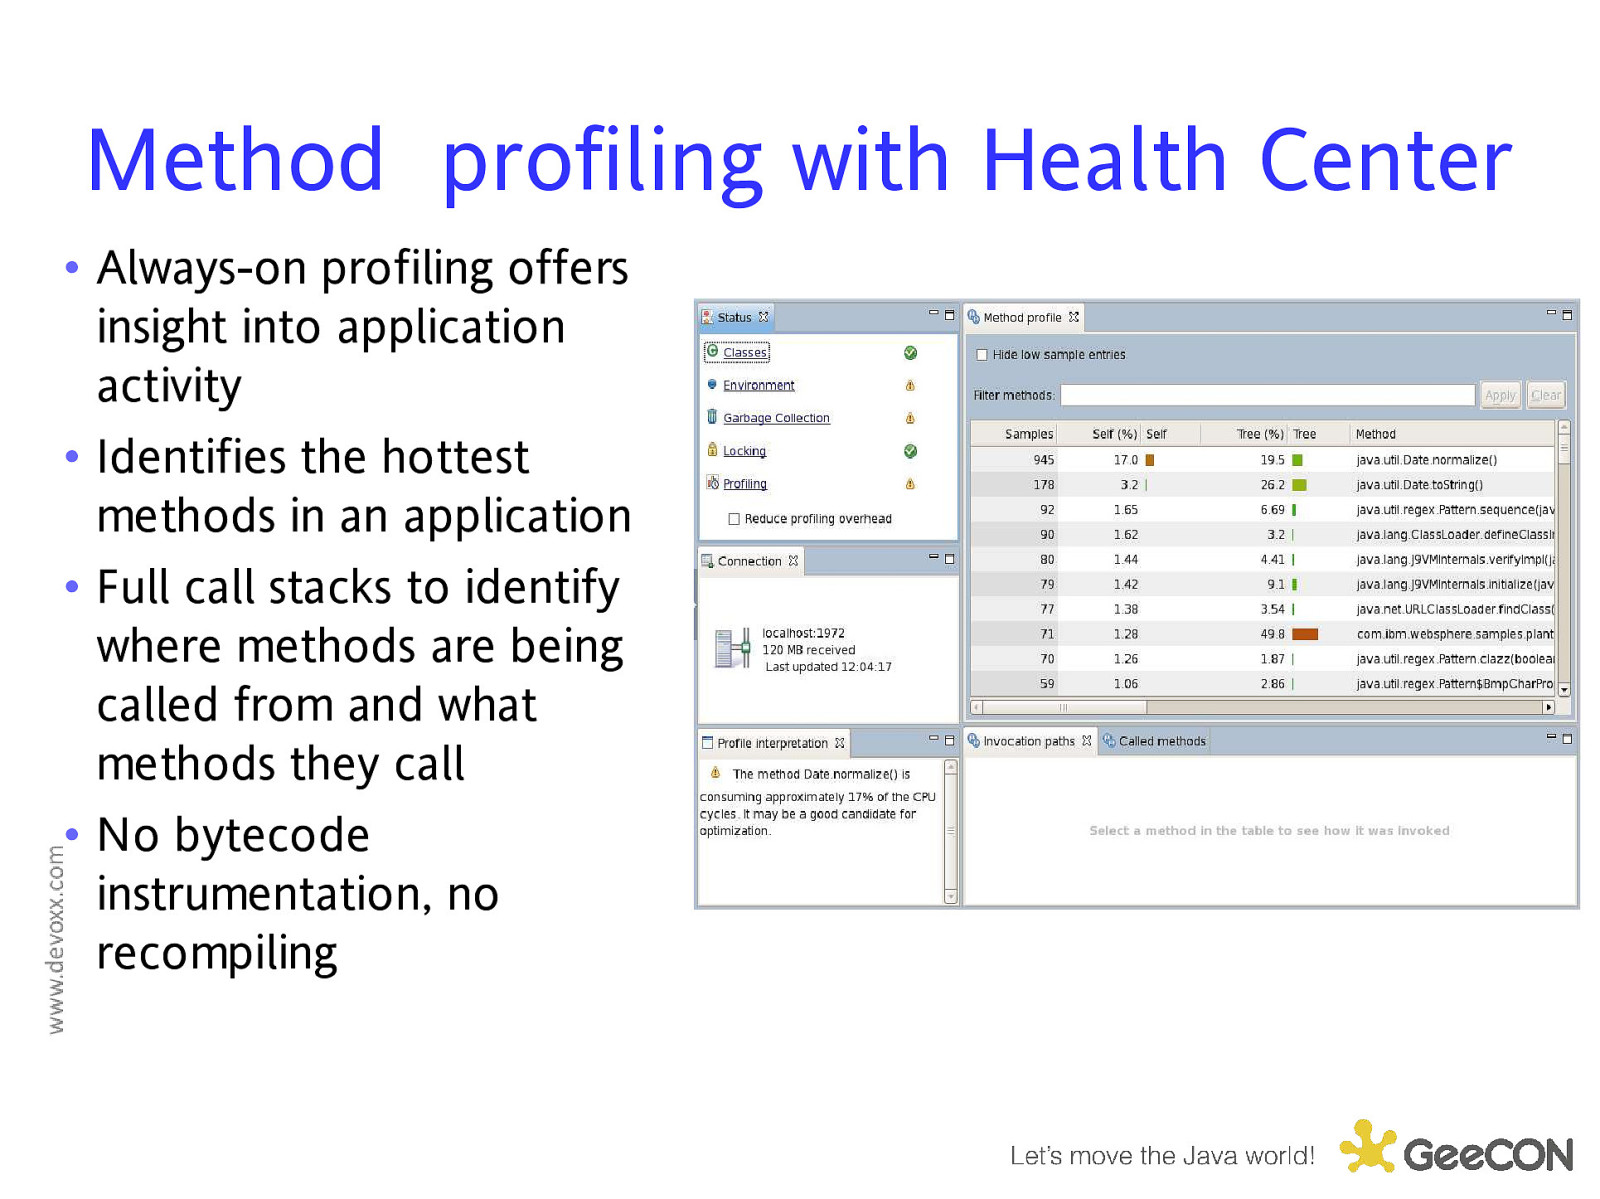
Method profiling with Health Center • Always-on profiling offers insight into application activity • Identifies the hottest methods in an application • Full call stacks to identify where methods are being called from and what methods they call • No bytecode instrumentation, no recompiling
DEMO Using the Health Center to optimise a code path 70
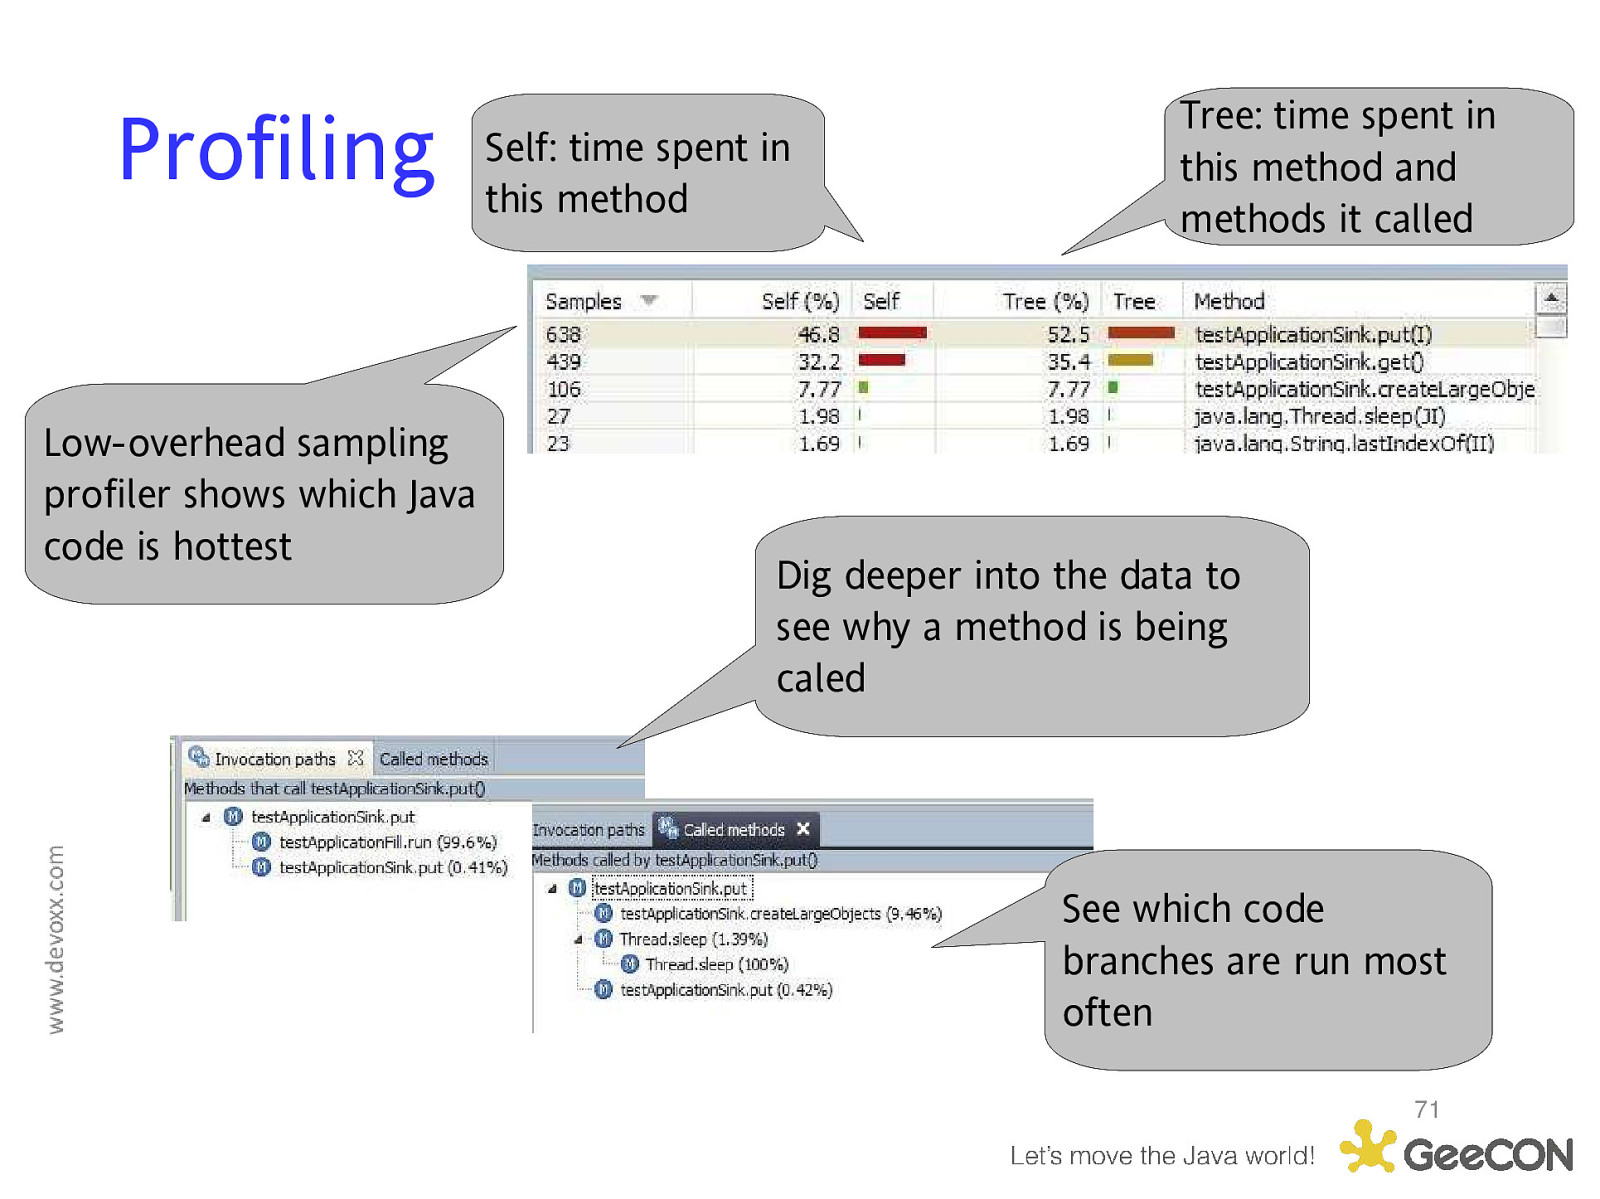
Profiling Low-overhead sampling profiler shows which Java code is hottest Self: time spent in this method Tree: time spent in this method and methods it called Dig deeper into the data to see why a method is being caled See which code branches are run most often 71
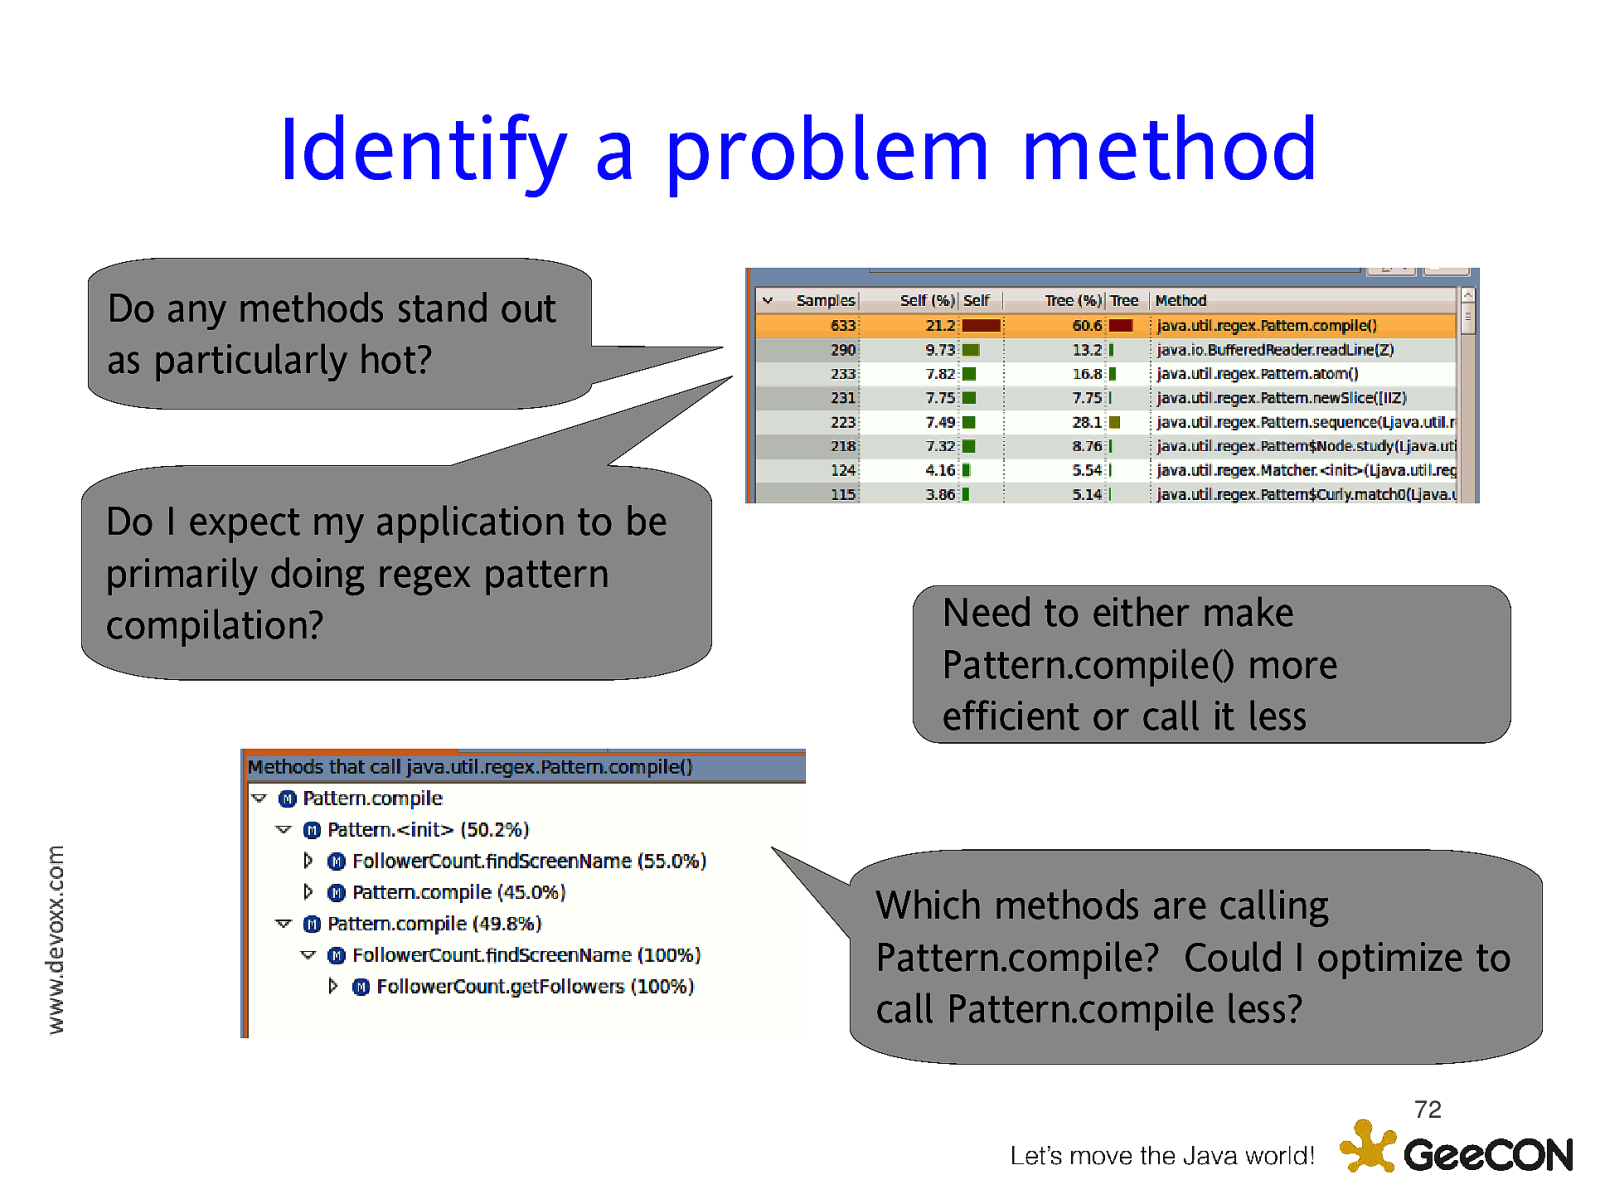
Identify a problem method Do any methods stand out as particularly hot? Do I expect my application to be primarily doing regex pattern compilation? Need to either make Pattern.compile() more efficient or call it less Which methods are calling Pattern.compile? Could I optimize to call Pattern.compile less? 72
Agenda Performance – why it’s actually cool and fun Performance tuning techniques Tools for identifying bottlenecks – Memory – CPU – I/O – Synchronization 73
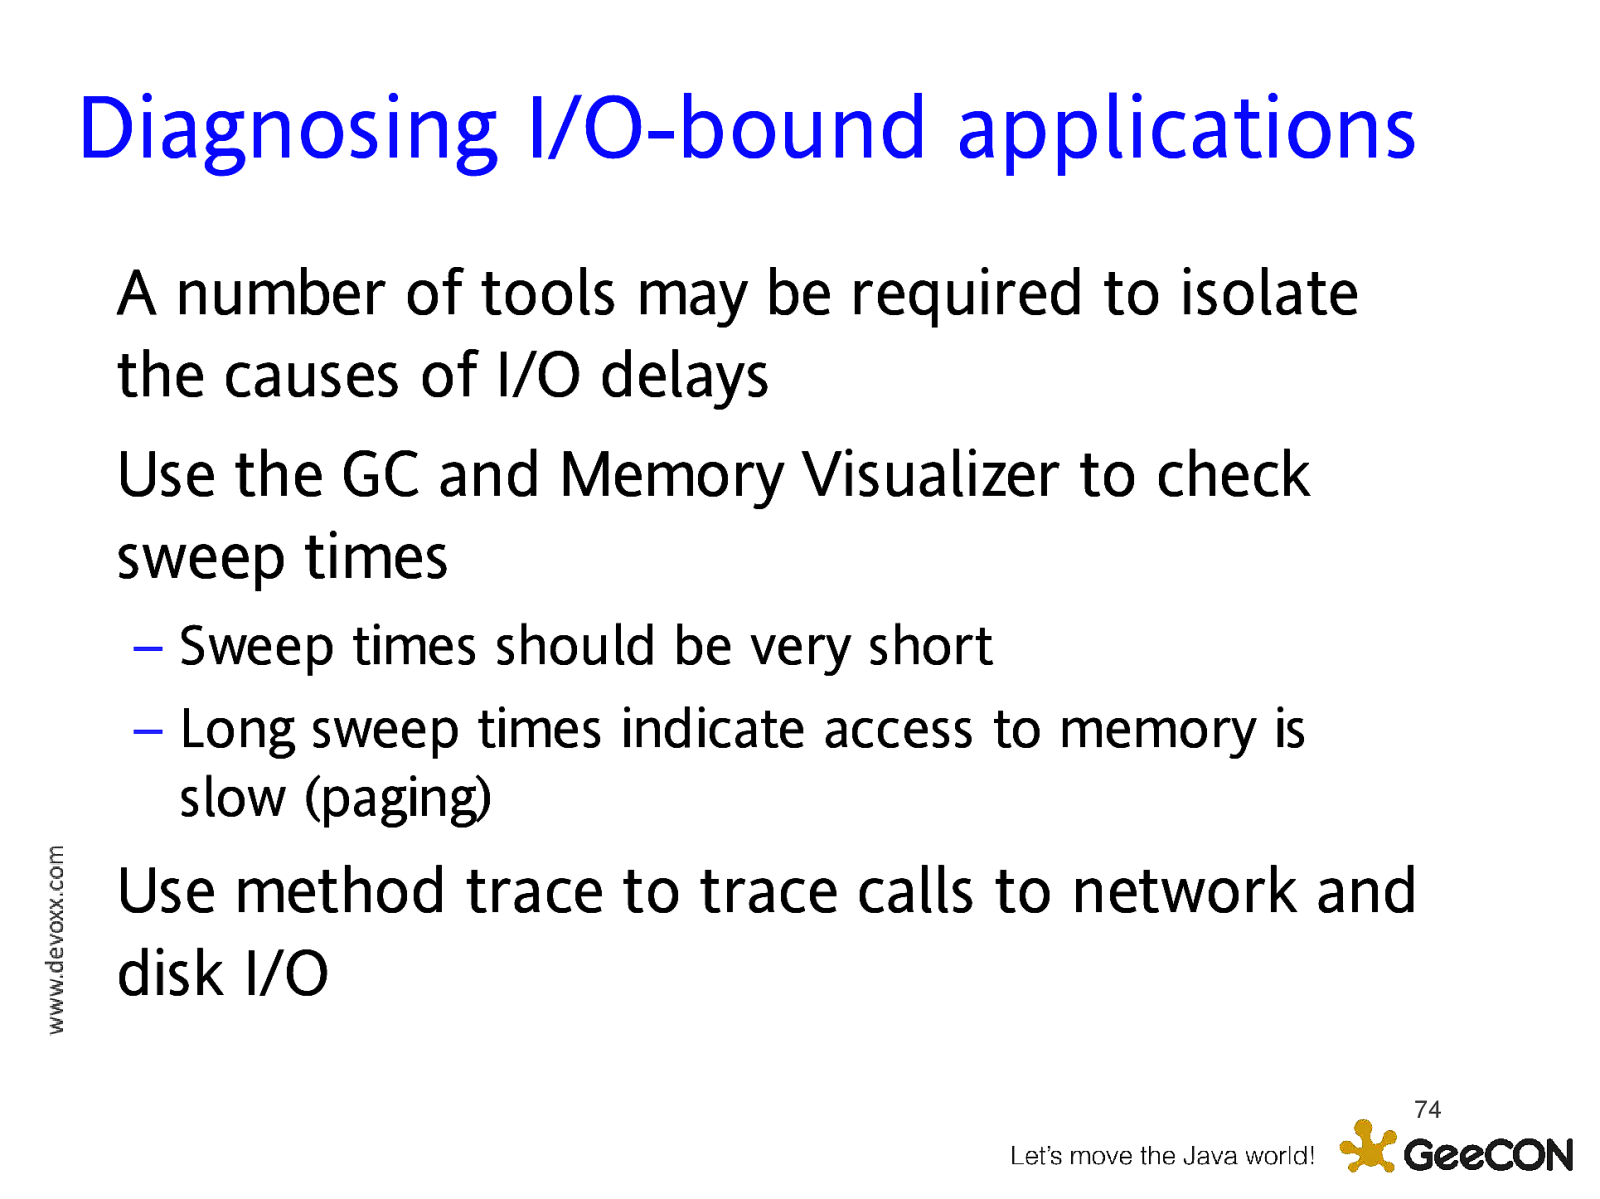
Diagnosing I/O-bound applications A number of tools may be required to isolate the causes of I/O delays Use the GC and Memory Visualizer to check sweep times – Sweep times should be very short – Long sweep times indicate access to memory is slow (paging) Use method trace to trace calls to network and disk I/O 74
Agenda Performance – why it’s actually cool and fun Performance tuning techniques Tools for identifying bottlenecks – Memory – CPU – I/O – Synchronization 75
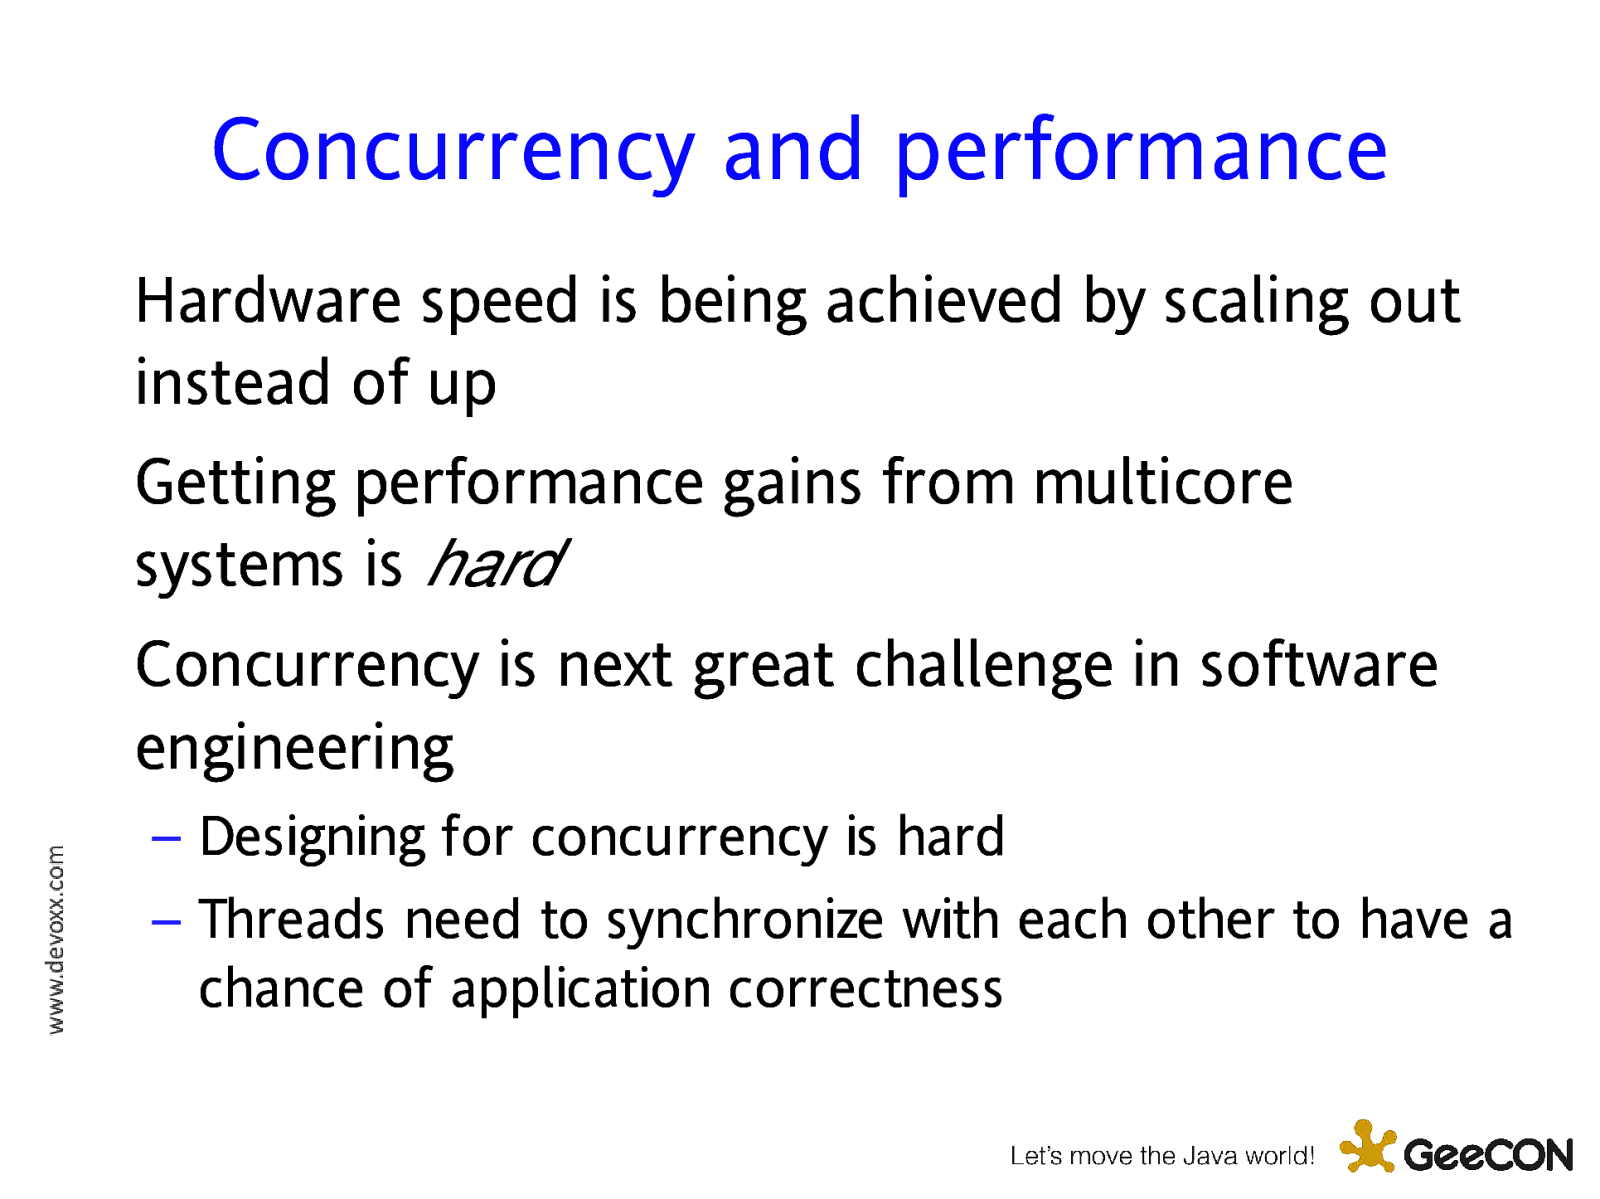
Concurrency and performance Hardware speed is being achieved by scaling out instead of up Getting performance gains from multicore systems is hard Concurrency is next great challenge in software engineering – Designing for concurrency is hard – Threads need to synchronize with each other to have a chance of application correctness
Concurrency and performance (ii) Synchronization has a performance cost – Effectively makes execution single-core This cost goes up with the number of cores – Synchronization needs to be a lot smarter on huge systems – At some point synchronization becomes the main performance bottleneck Even on two-core systems, locking can be a big performance cost
Diagnosing lock bound applications Poor synchronization can cause significant application delays IBM provides tooling to quickly diagnose and identify contended locks – Health Center provides information on locks used in Java applications and the JVM 78
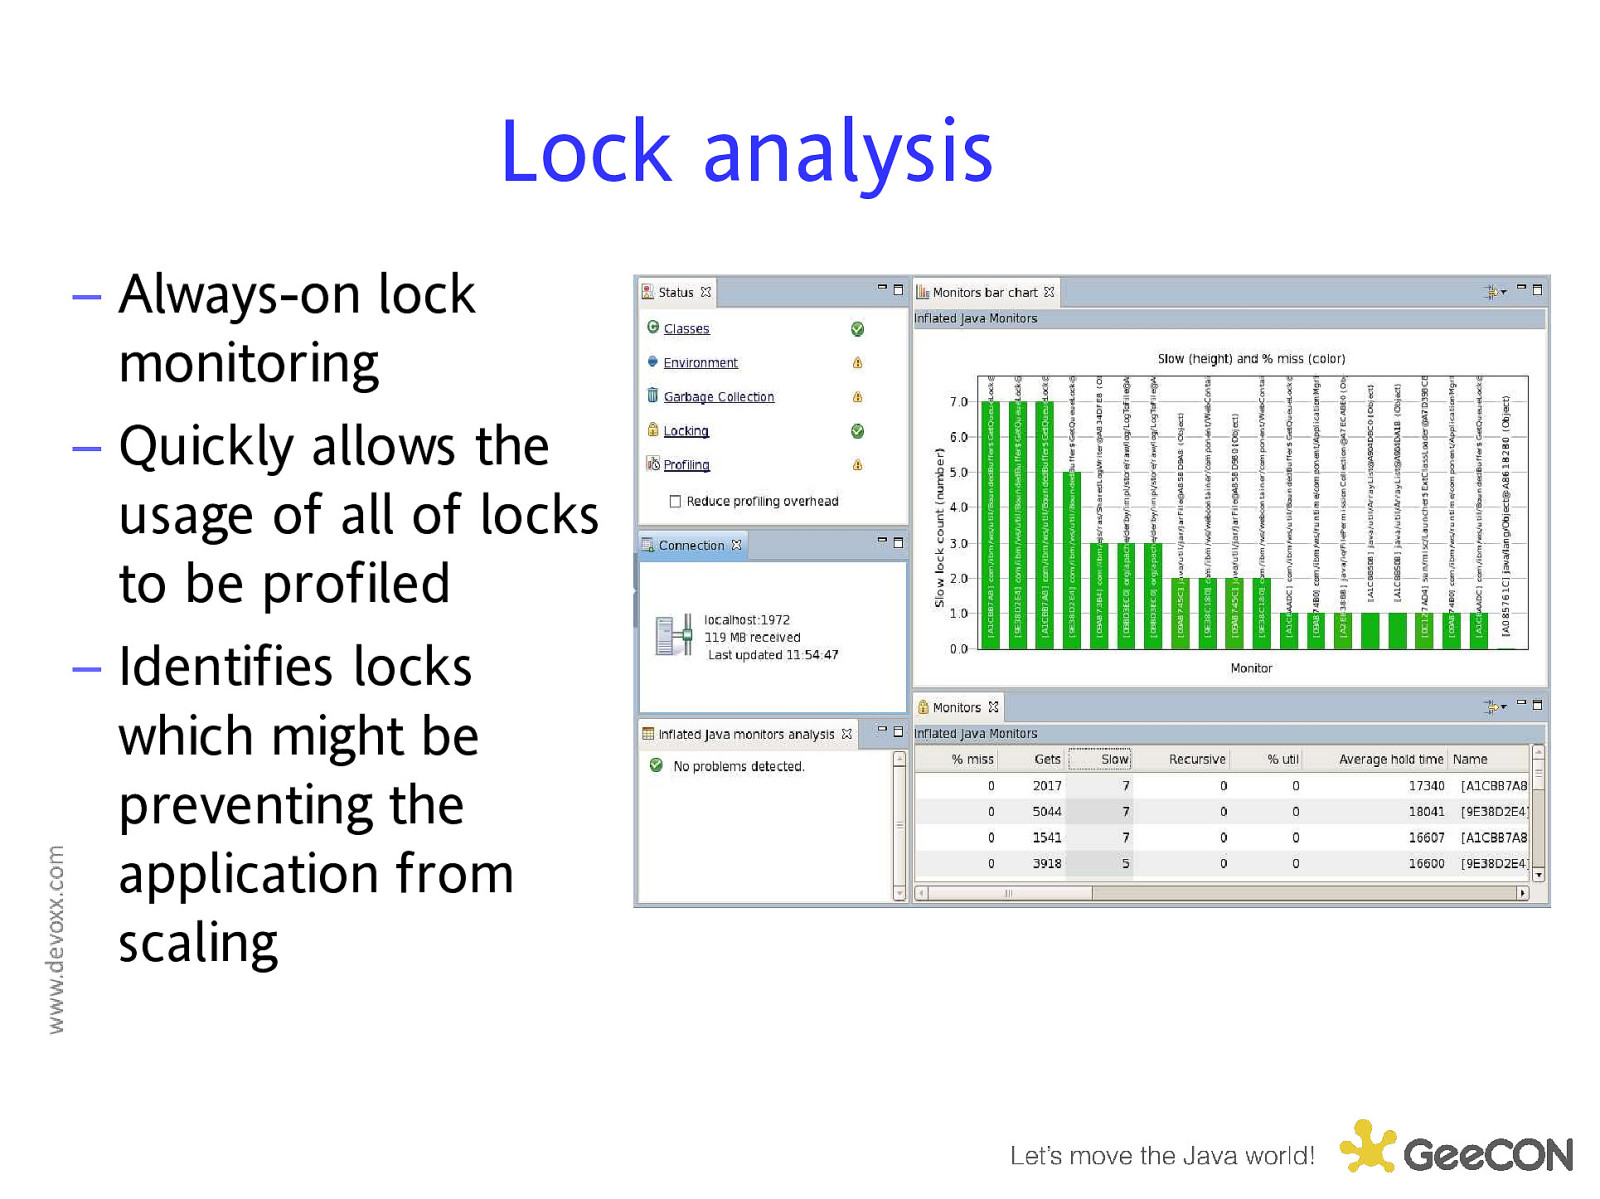
Lock analysis – Always-on lock monitoring – Quickly allows the usage of all of locks to be profiled – Identifies locks which might be preventing the application from scaling
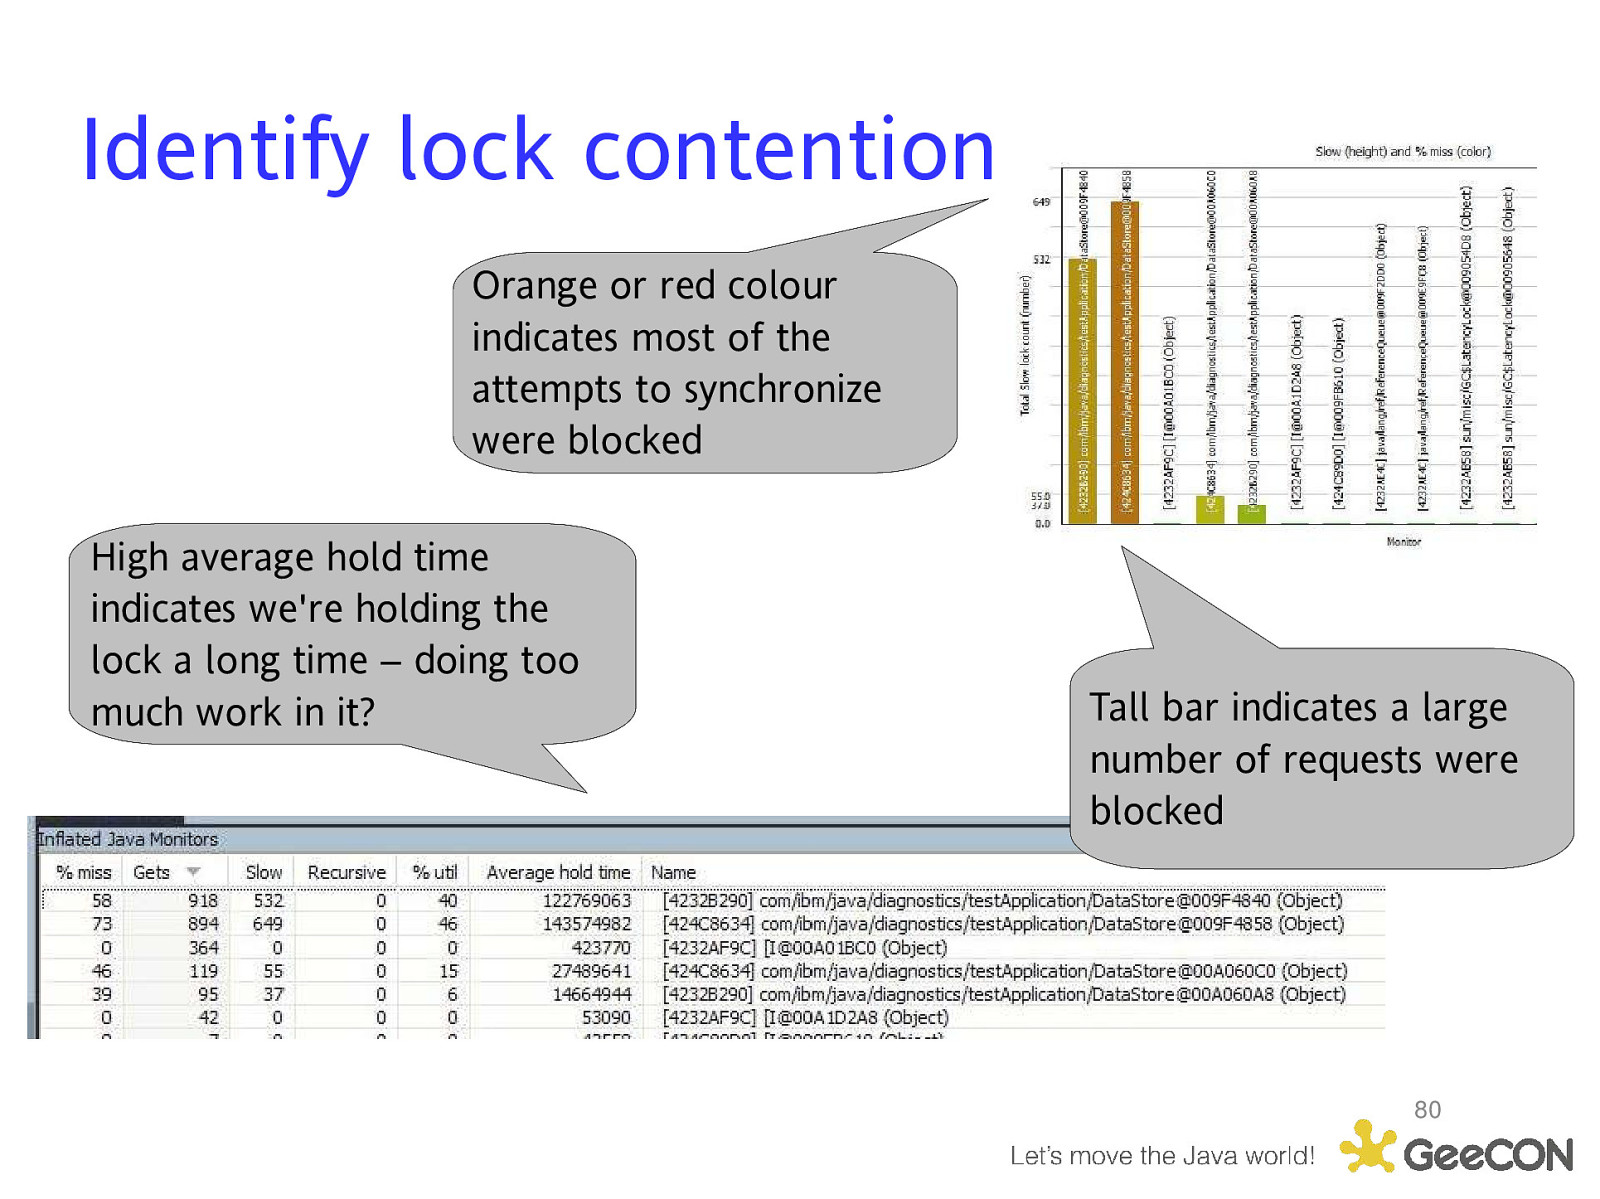
Identify lock contention Orange or red colour indicates most of the attempts to synchronize were blocked High average hold time indicates we’re holding the lock a long time – doing too much work in it? Tall bar indicates a large number of requests were blocked 80
Agenda Performance – why it’s actually cool and fun Performance tuning techniques Tools for identifying bottlenecks – Memory – CPU – I/O – Synchronization 81
So … You have a performance problem … You diagnose and fix it.

Conclusions Improving application performance starts with identifying limited resources Tools can help fix performance bottlenecks – Space bound • GC and Memory Visualizer/Health Center • Memory Analyzer – CPU bound • Health Center – Lock bound • Health Center
Where to find more information – IBM Support Assistant • http://www-01.ibm.com/software/support/isa/ – IBM Monitoring and Diagnostic Tools for Java • www.ibm.com/developerworks/java/jdk/tools/ – Health Center YouTube videos • http://www.youtube.com/watch?v=5Tcktcl0qxs (overview) • http://www.youtube.com/watch?v=6WjE9U0jvEk (client install) • http://www.youtube.com/watch?v=Hdp0mJ13NLQ (agent install) Health Center Forum – http://www.ibm.com/developerworks/forums/forum.jspa?forumID=1461 Email javatool@uk.ibm.com 85
The following terms are trademarks of International Business Machines Corporation in the United States, other countries, or both: – IBM – z/OS – PowerPC – WebSphere Java and all Java-based trademarks are trademarks of Sun Microsystems, Inc. in the United States, other countries, or both. Solaris is a trademark of Sun Microsystems, Inc. Intel is a trademarks of Intel Corporation or its subsidiaries in the United States, other countries, or both

Any Questions? 87