Ja v a P e rf o rm a n c e T o o ls Dr Holly Cummins Tooling Technical Lead Java Technology Centre IBM cumminsh@uk.ibm.com

A presentation at TheServerSide Java Symposium in March 2008 in Las Vegas, NV, USA by Holly Cummins
Ja v a P e rf o rm a n c e T o o ls Dr Holly Cummins Tooling Technical Lead Java Technology Centre IBM cumminsh@uk.ibm.com

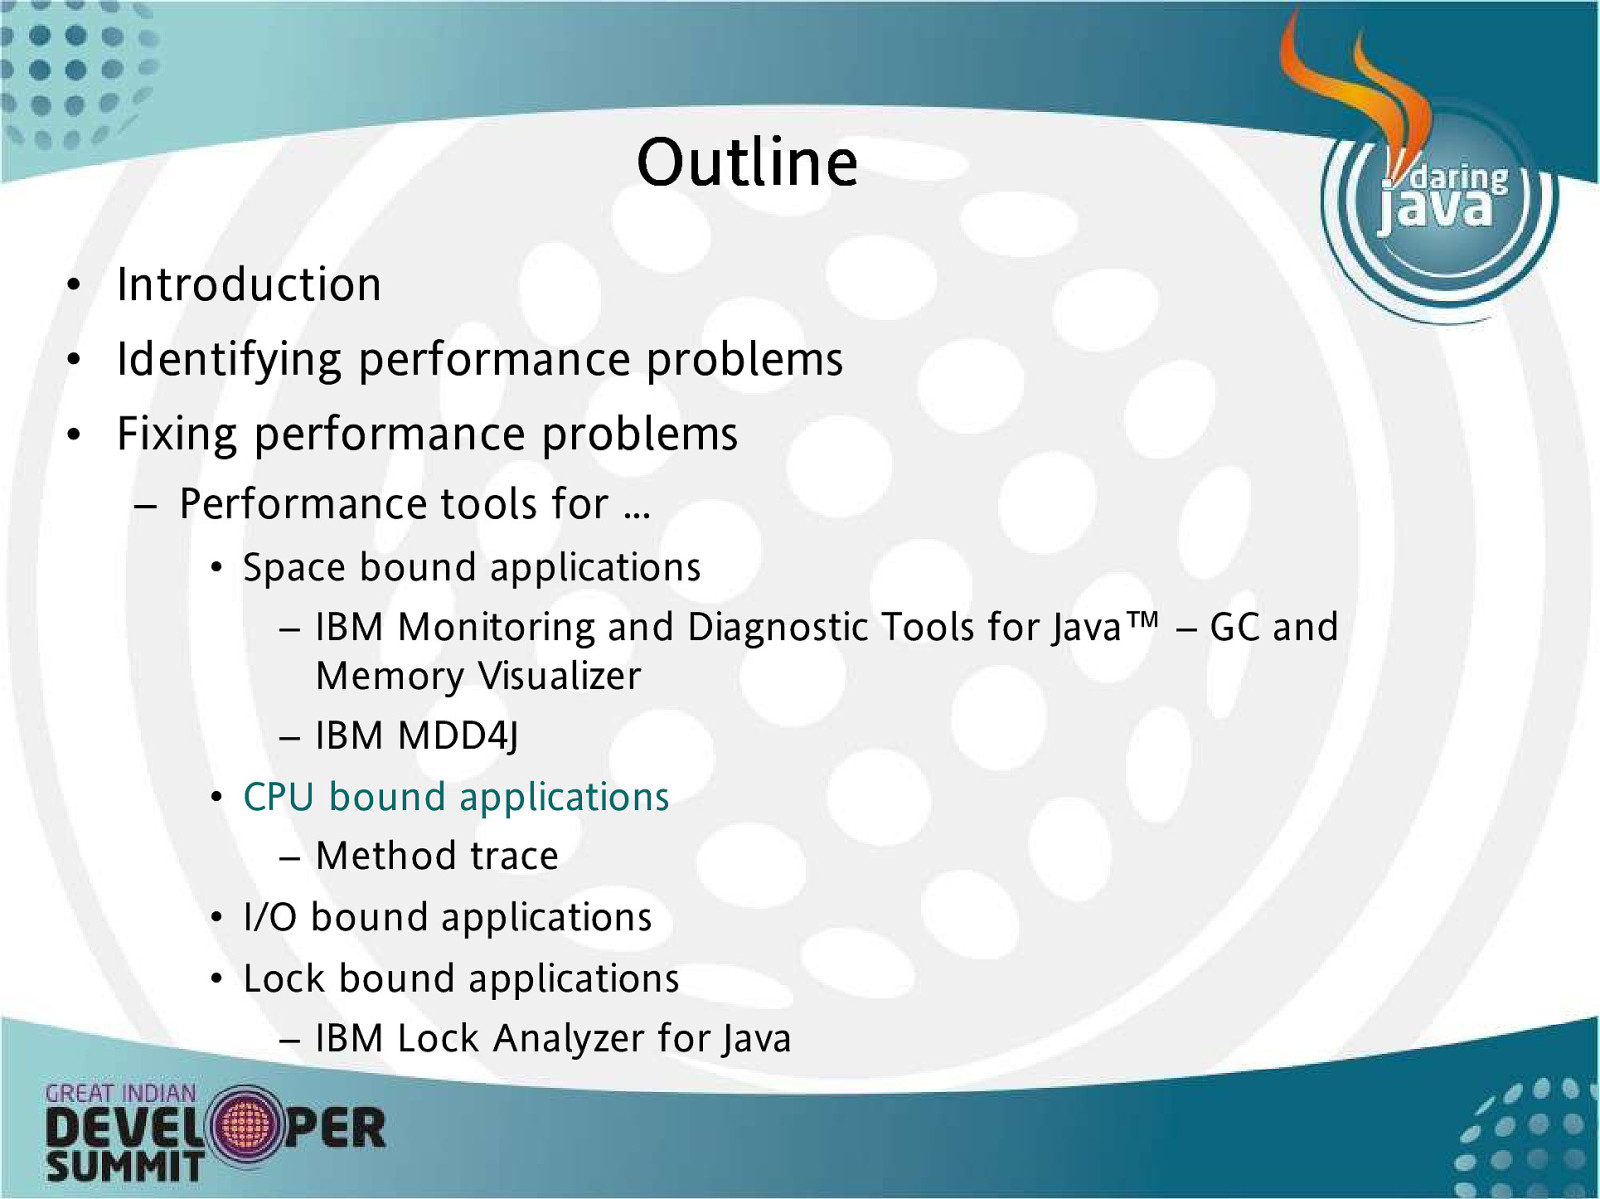
O u t l in e • Introduction • Identifying performance problems • Fixing performance problems – Performance tools for … • Space bound applications – IBM Monitoring and Diagnostic Tools for Java™ – GC and Memory Visualizer – IBM MDD4J • CPU bound applications – Method trace • I/O bound applications • Lock bound applications – IBM Lock Analyzer for Java
When would you us e a p erform ance tool? • When you have a performance problem!
What’s a perform ance p rob lem ? • It doesn’t go as fast as you think it ought to • It doesn’t go as fast as your users demand • It starts out fine and then after some period doesn’t go as fast as it used to • It hangs – This is a quite severe example of a performance problem
O u t l in e • Introduction • Assessing performance problems • Fixing performance problems – Performance tools for … • Space bound applications – IBM Monitoring and Diagnostic Tools for Java™ – GC and Memory Visualizer – IBM MDD4J • CPU bound applications – Method trace • I/O bound applications • Lock bound applications – IBM Lock Analyzer for Java
As s es s ing perform ance p roblem s • Performance must be measured before problems can be fixed – Otherwise you risk making things worse with a clever fix • We don’t provide a tool for this! – A performance tool cannot do your performance measurement for you • Performance measurement must be based on your application and your quality of service requirements – Throughput – Response times • Mean response time • 90th percentile response time • Worst-case response time
T h e p e r il s o f b e n c h m a r k s • Sometimes measuring the performance of your own application is difficult • Measuring the performance of a benchmark is not good enough – If it’s your application you care about, measure your application
T h e p e r i l s o f s im u l a t e d w o r k l o a d s • Generating a “real” workload can be hard in a test environment • Tuning a system against a simulated workload can be misleading – Example: garbage collection can be very sensitive to the exact distribution of object sizes and the pattern of connections between objects – Example: Insufficient variation in data can lead to artificially warm caches and disguise I/O bottlenecks • Care must be taken to ensure simulated workloads are sufficiently realistic
The p erils of inference • The performance metrics from performance tools cannot tell you how well your application is performing • Pause times cannot tell you what your application response times are • Time in GC cannot tell you how fast your application is running • • Generational garbage collectors often use more of the CPU but give better throughput, and shorter maximum response times A profiler may show more time is being spent in a method, but that may be because a change prompted the JIT to inline other methods, so total time may be reduced
How well is your application p erforming? • The simplest and most effective way to measure performance is to invoke System.currentTimeMillis() in a test harness to time properties of interest • Performance can be very variable, so measurements must be repeated • Allow unmeasured warm-up period – (If that’s how the application will run) – Allows caches to be populated and methods to be compiled
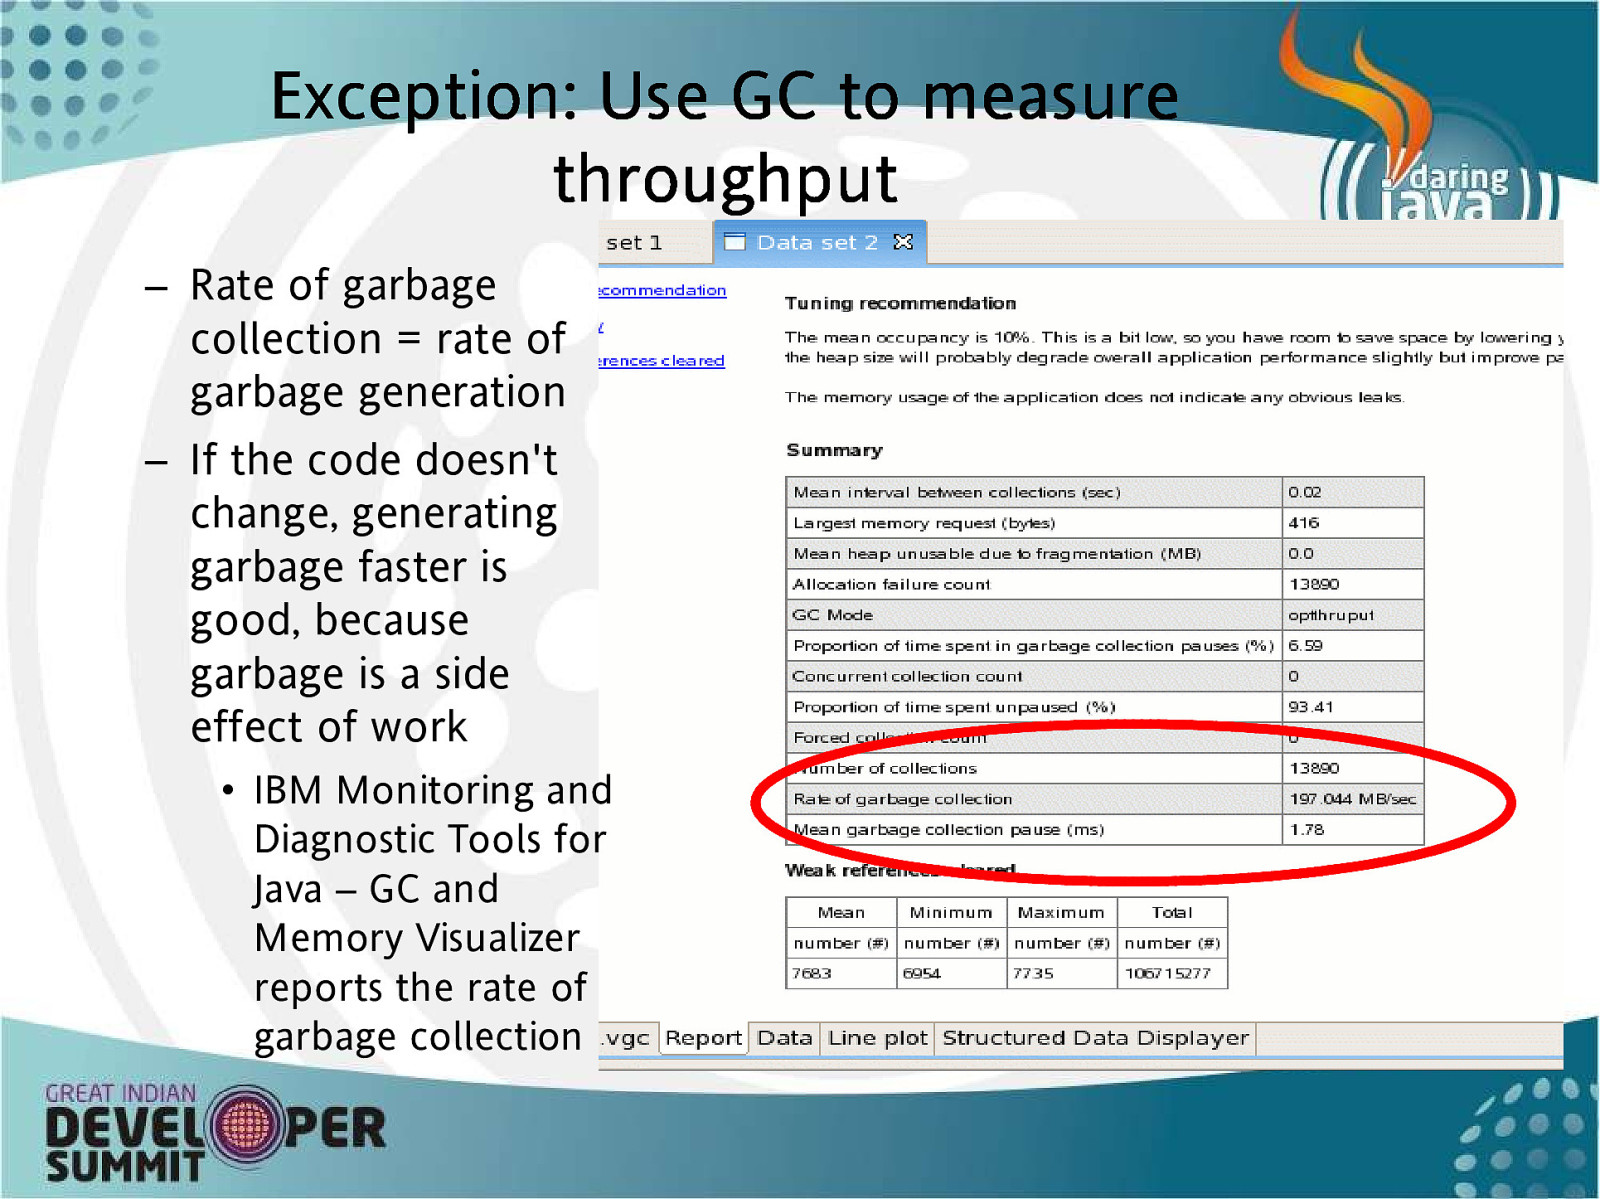
E x c e p t io n : U s e G C t o m e a s u r e th r ou g h p u t – Rate of garbage collection = rate of garbage generation – If the code doesn’t change, generating garbage faster is good, because garbage is a side effect of work • IBM Monitoring and Diagnostic Tools for Java – GC and Memory Visualizer reports the rate of garbage collection
O u t l in e • Introduction • Assessing performance problems • Fixing performance problems – Performance tools for … • Space bound applications – IBM Monitoring and Diagnostic Tools for Java™ – GC and Memory Visualizer – IBM MDD4J • CPU bound applications – Method trace • I/O bound applications • Lock bound applications – IBM Lock Analyzer for Java
Fixing p erform ance problem s • Performance problems are caused by limited resources • Which resource is limited? • Applications may be – CPU bound – I/O bound – Space bound – “Lock bound” (contended)
How to decid e which it is ? • CPU bound – CPU utilisation consistently high • I/O bound – CPU utilisation not consistently high • Lock bound – CPU utilisation not consistently high • Space bound – Any of the above! • These heuristics aren’t precise enough, so tools are required to guide diagnosis
IBM Perform ance T ools • IBM provides a number of tools to identify and fix performance bottlenecks • The tools are all freely available • Most – but not all – are targeted for IBM JVMs only • Tools available from – alphaWorks (alpha tools) – IBM Support Assistant (fully supported tools)
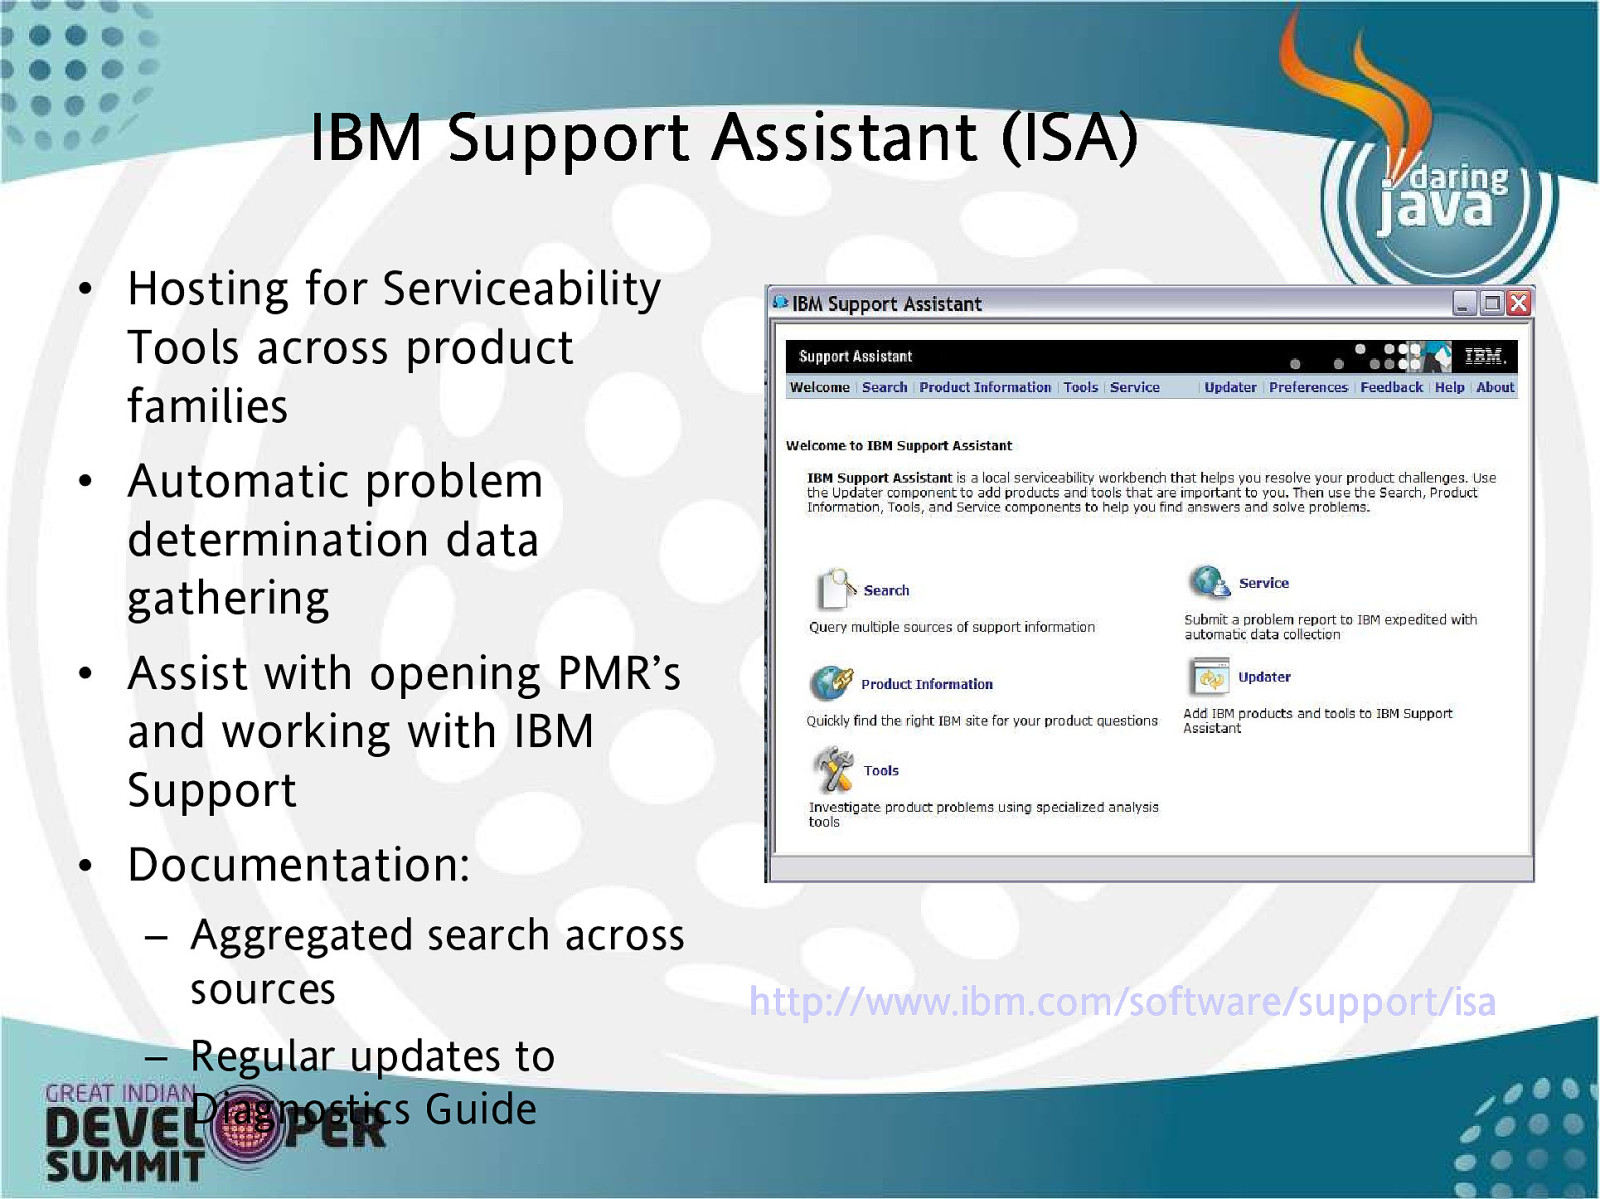
IBM Supp ort As s is tant (ISA) • Hosting for Serviceability Tools across product families • Automatic problem determination data gathering • Assist with opening PMR’s and working with IBM Support • Documentation: – Aggregated search across sources – Regular updates to Diagnostics Guide h ttp://www.ibm.com/so pp ort/isa /sofftware/su sup

O u t l in e • Introduction • Identifying performance problems • Fixing performance problems – Performance tools for … • Space bound applications – IBM Monitoring and Diagnostic Tools for Java™ – GC and Memory Visualizer – IBM MDD4J • CPU bound applications – Method trace • I/O bound applications • Lock bound applications – IBM Lock Analyzer for Java
Diagnos ing s pace bound ap plications • Space bound can be disguised as CPU bound – Java has garbage collection – If the GC is running excessively it will hog the CPU • Space-bound can also be disguised as I/O bound – Excessive “in use” footprint can cause • Paging • Cache misses • Enabling verbose garbage collection can quickly identify or rule out space issues – On IBM platforms, use -Xverbose:gc or -Xverbosegclog:$file to write directly to a file – Logs may be analyzed with a verbose gc analysis tool
O u t l in e • Introduction • Identifying performance problems • Fixing performance problems – Performance tools for … • Space bound applications – IBM Monitoring and Diagnostic Tools for Java™ – GC and Memory Visualizer – IBM MDD4J • CPU bound applications – Method trace • I/O bound applications • Lock bound applications – IBM Lock Analyzer for Java
T h e G C a n d M e m o r y V i s u a l iz e r • IBM Monitoring and Diagnostic Tools for Java – GC and Memory Visualizer (formerly known as EVTK) is a verbose GC analysis tool • Handles verbose GC from all versions of IBM JVMs – 1.4.2 and lower – 5.0 and higher – zSeries – iSeries – WebSphere real time • … and Solaris platforms • … and HP-UX platforms 20
GC and M em ory Vis ualizer cap abilities • Analyses heap usage, heap size, pause times, and many other properties • Provides tuning recommendations • Compares multiple logs in the same plots and reports • Many views on data – Reports – Graphs – Tables • Can save data to – HTML reports – JPEG pictures – CSV files
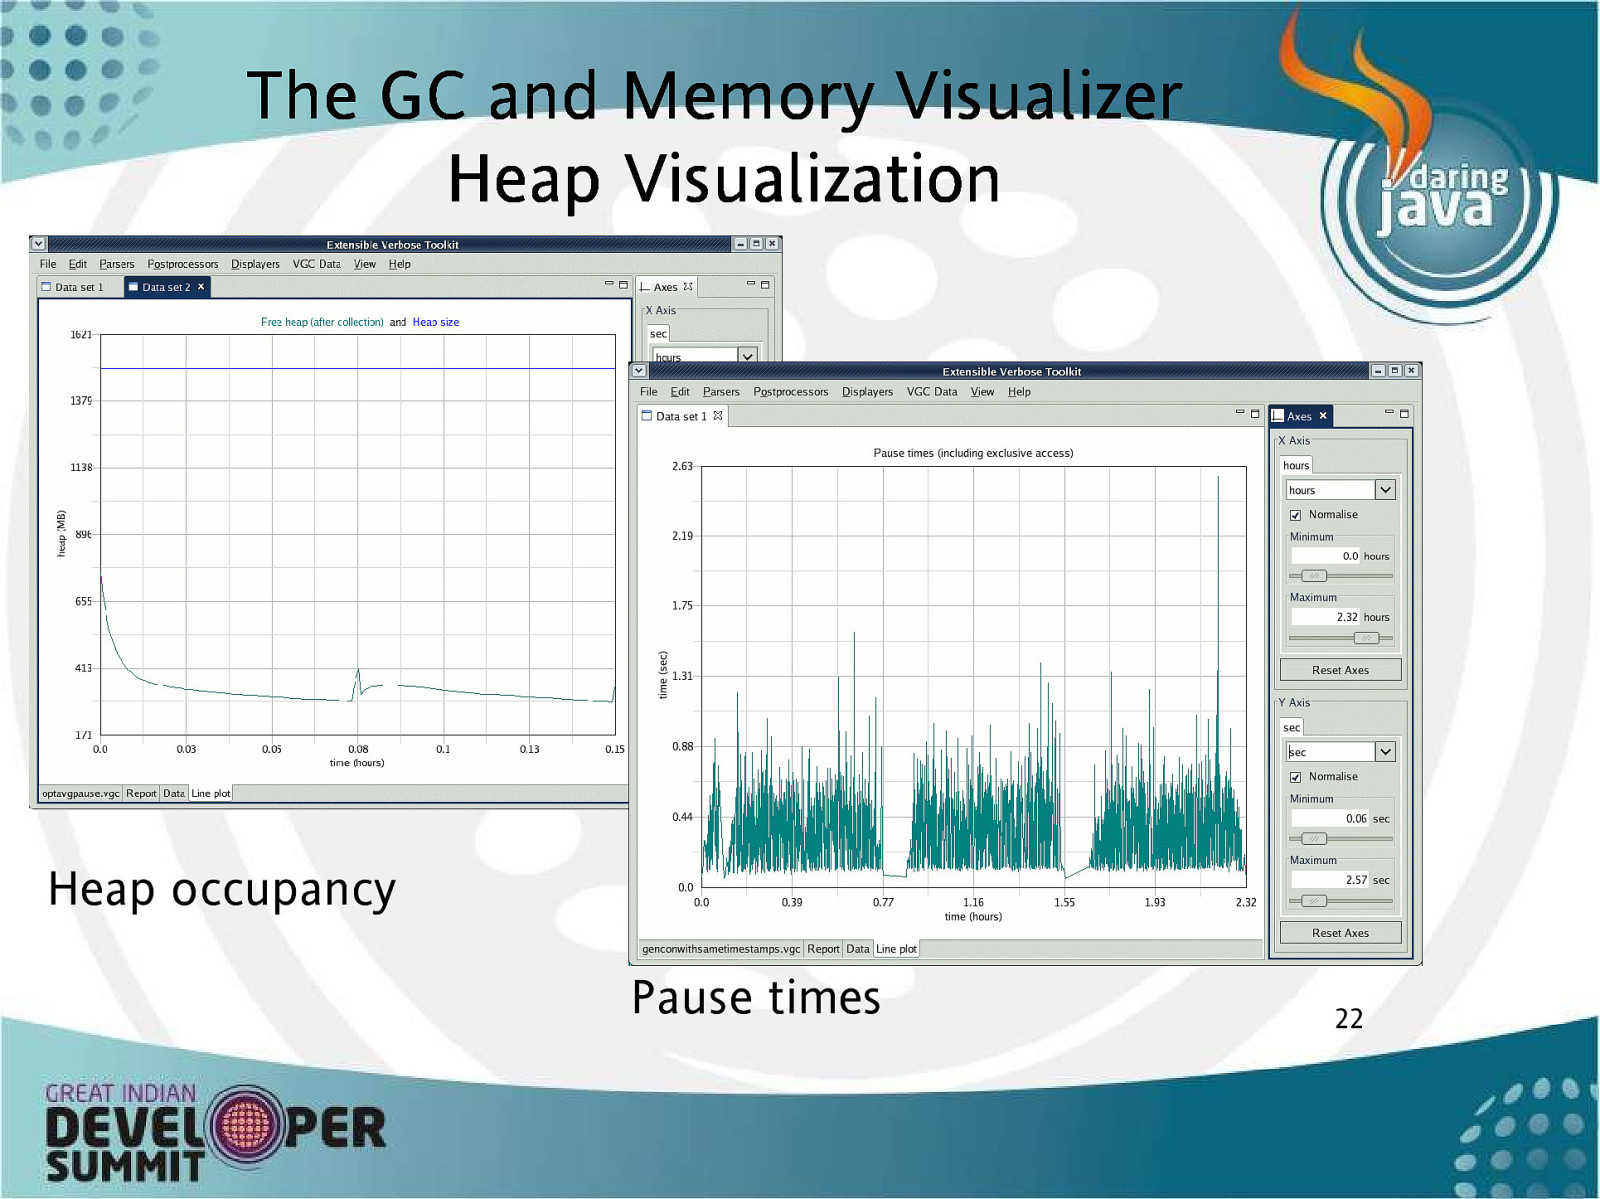
T he GC and M em ory Vis ualizer Heap Vis ualization Heap occupancy Pause times 22
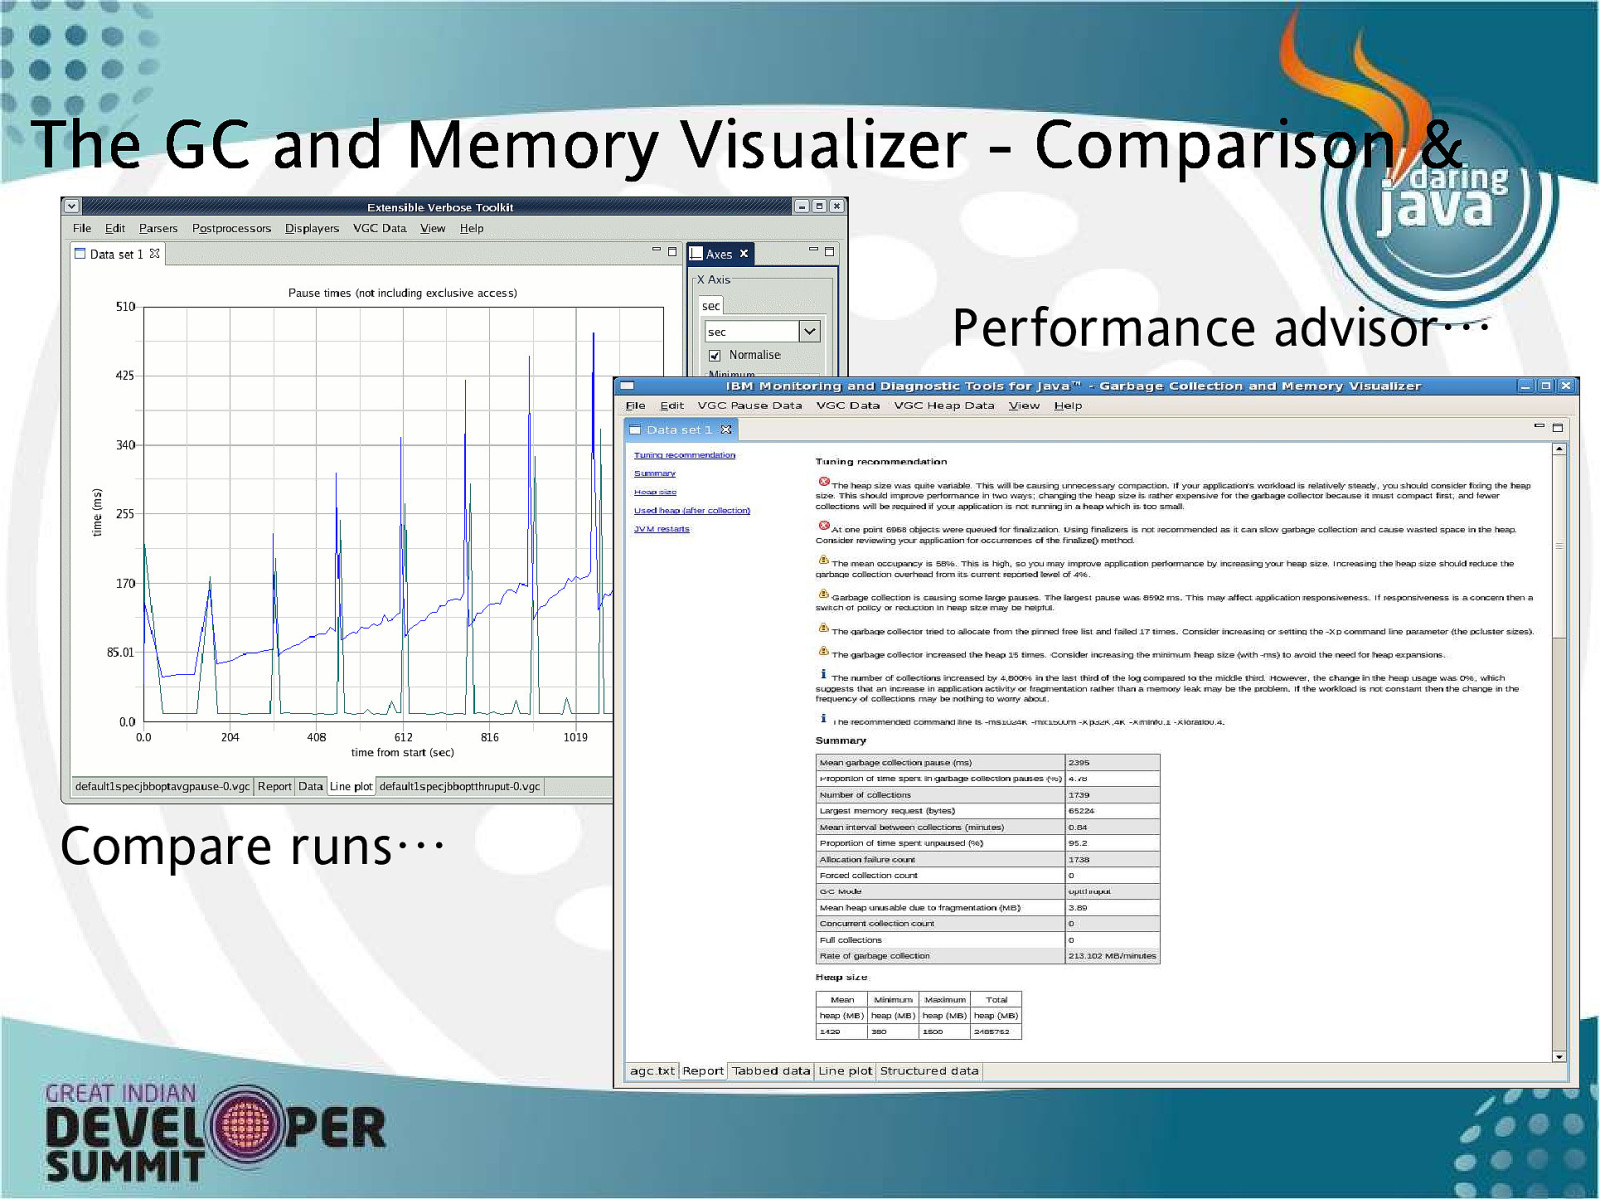
T h e G C a n d M e m o r y V is u a l i z e r - C o m p a r i s o n & A d v ic e Performance advisor… Compare runs… 23
W h a t d o e s g a r b a g e c o l l e c t io n t e l l y o u ? • High heap occupancy indicates an application is likely space bound – Increasing heap size or lowering application footprint should improve performance • If GC is using more than 10% or 20% of the CPU action may be required – Alternate choice of policy – GC tuning
Don’t forget native m em ory • Java applications use – and may leak - native memory • Low occupancy is no guarantee an application is not space bound. • Native memory use is not logged in verbose GC • Memory pressure and even OutOfMemory errors may occur even though there is lots of room in the heap • Use platform-specific tools – Windows perfmon tool – Linux ps – AIX vmstat
W h e n s h o u l d y o u s ize t h e h e a p ? • If performance is important – Fixing the heap size prevents the JVM shrinking the heap when the memory usage drops and then having to re-grow when it increases again – Try -Xmaxf=100 option to allow growth but prevent shrinking • If the application uses a lot of memory – Most JVMs will avoid using all the memory on a box! – The IBM JVM has an upper limit of half the physical memory – If the application needs more than this intervention is required
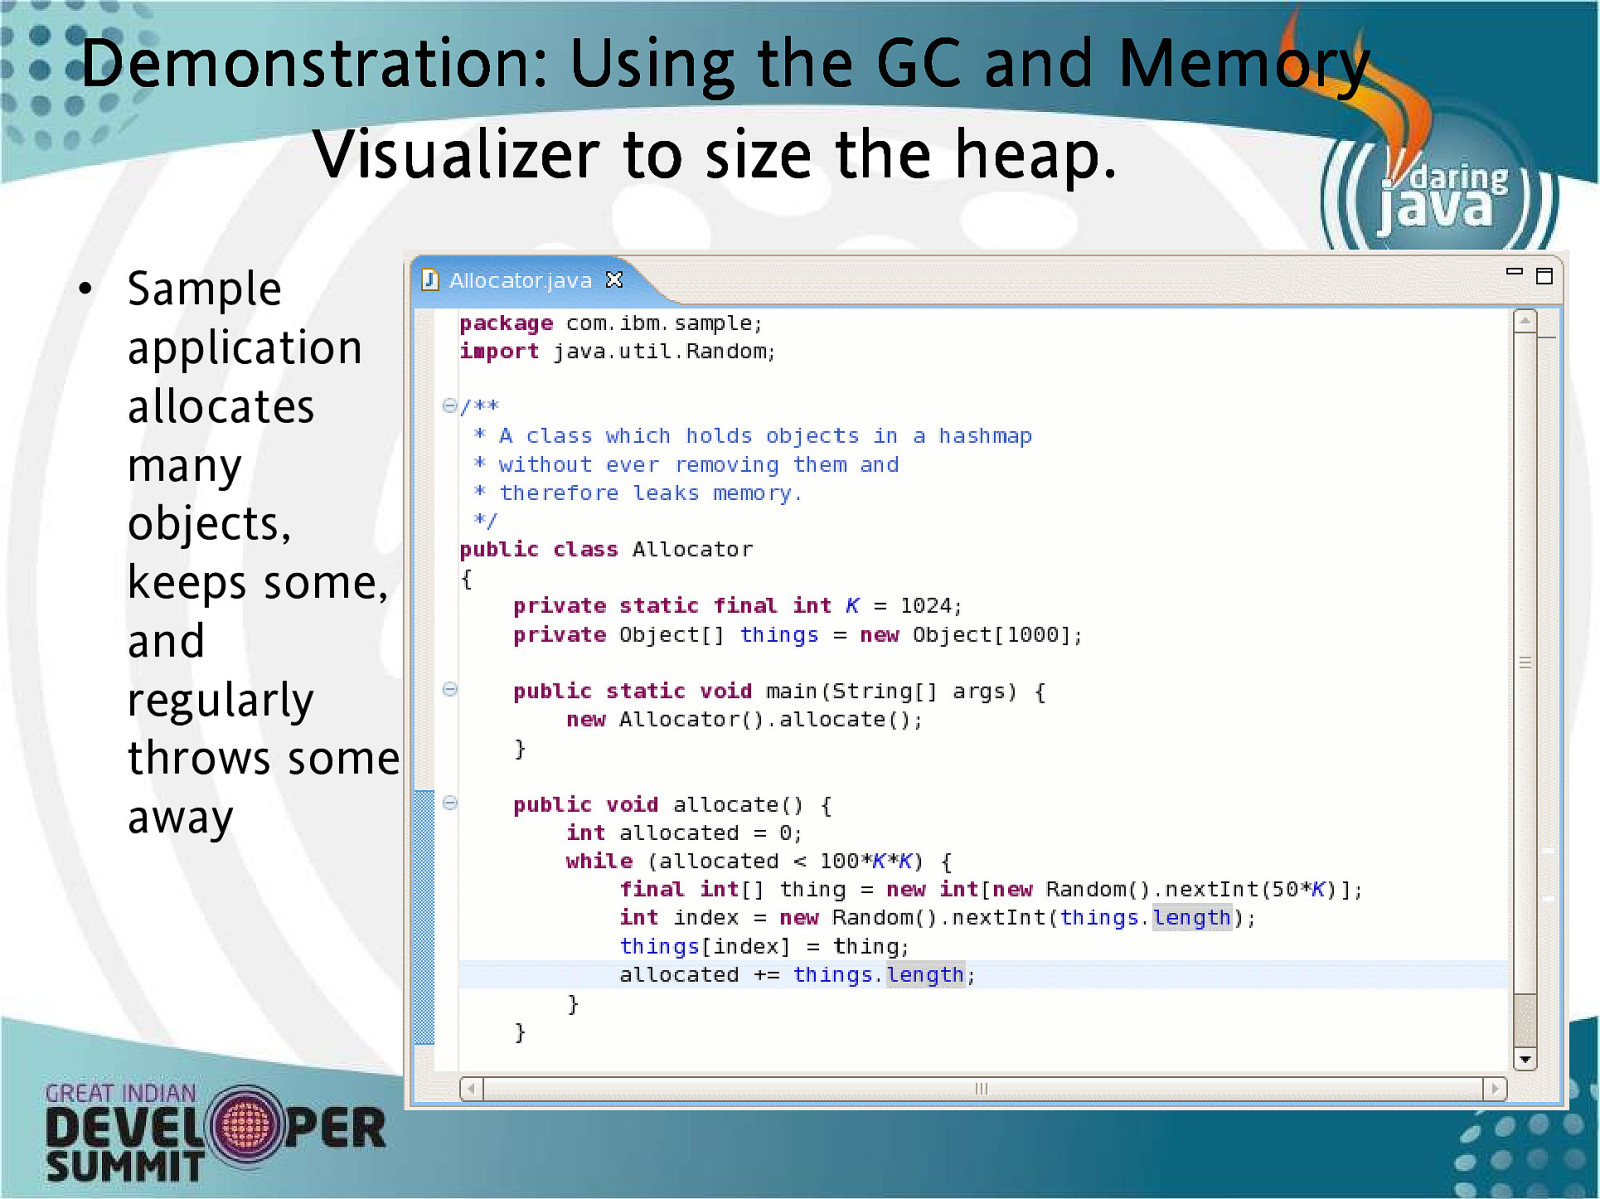
D e m o n s t r a t io n : U s in g t h e G C a n d M e m o r y Vis ualizer to s ize the heap . • Sample application allocates many objects, keeps some, and regularly throws some away
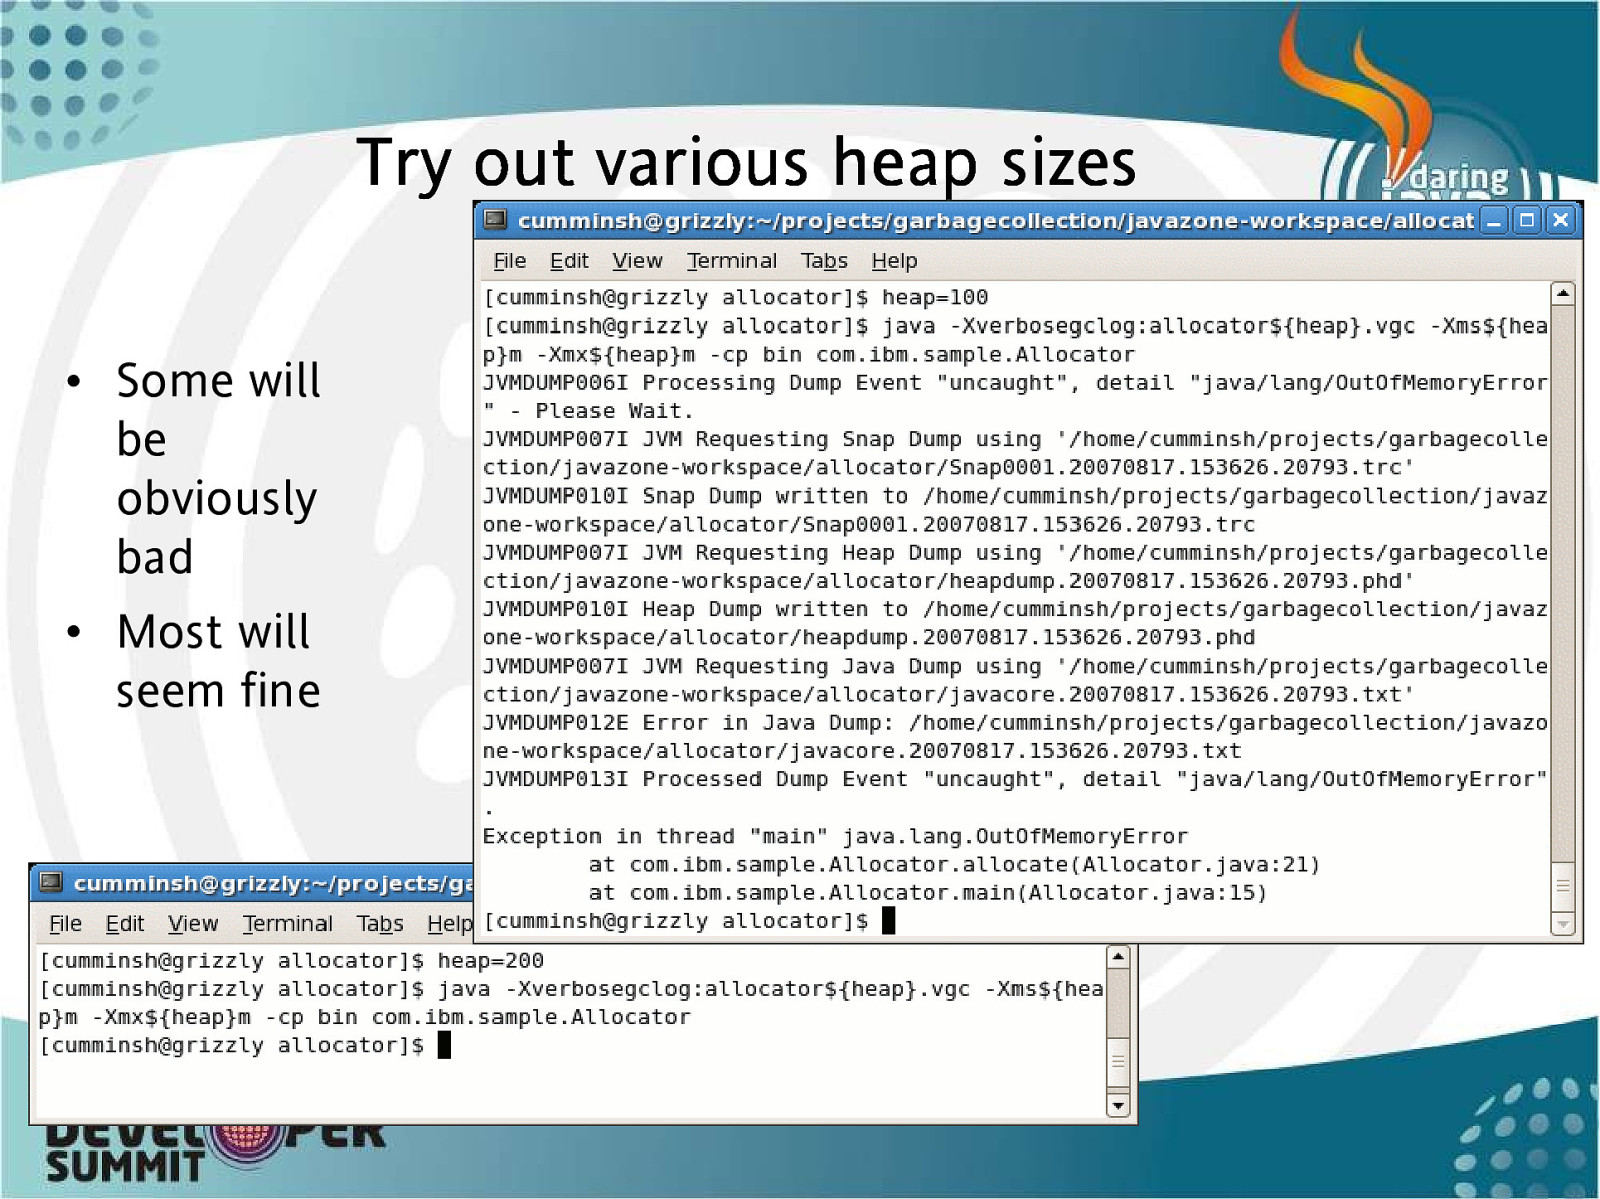
T ry out various heap s izes • Some will be obviously bad • Most will seem fine
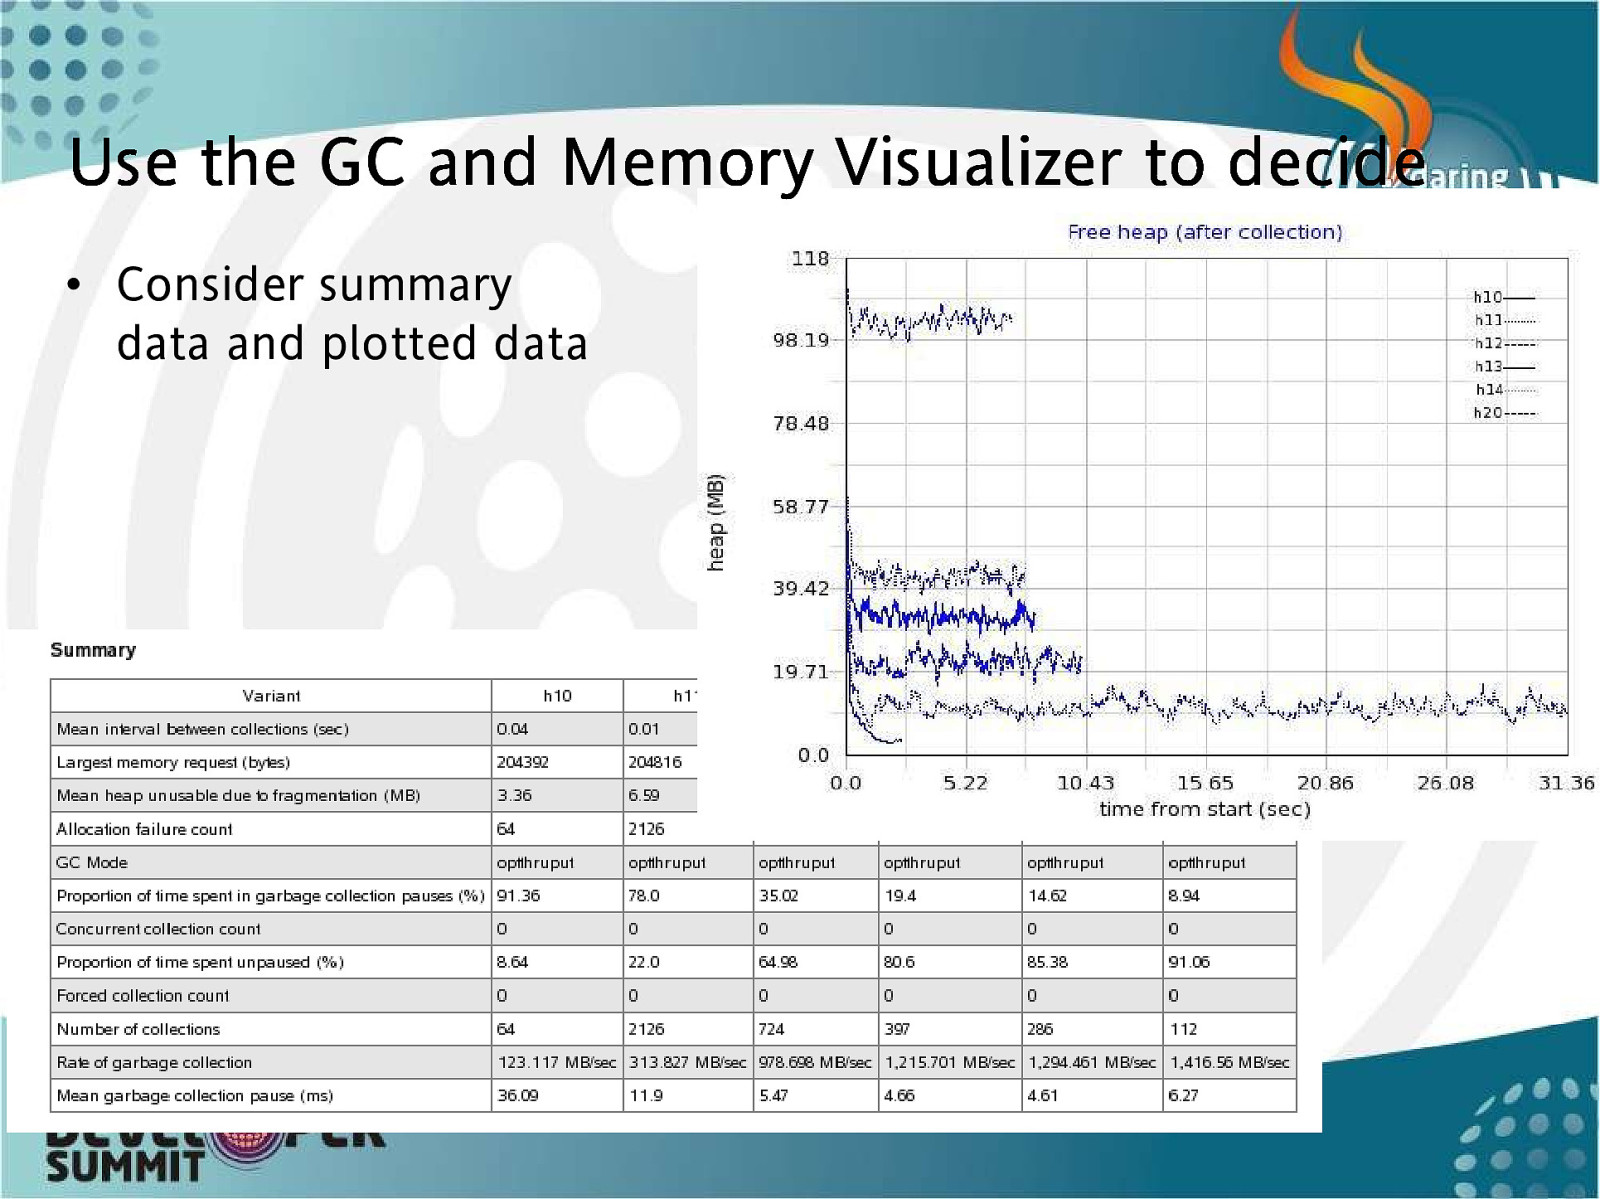
U s e t h e G C a n d M e m o r y V is u a l iz e r t o d e c i d e • Consider summary data and plotted data
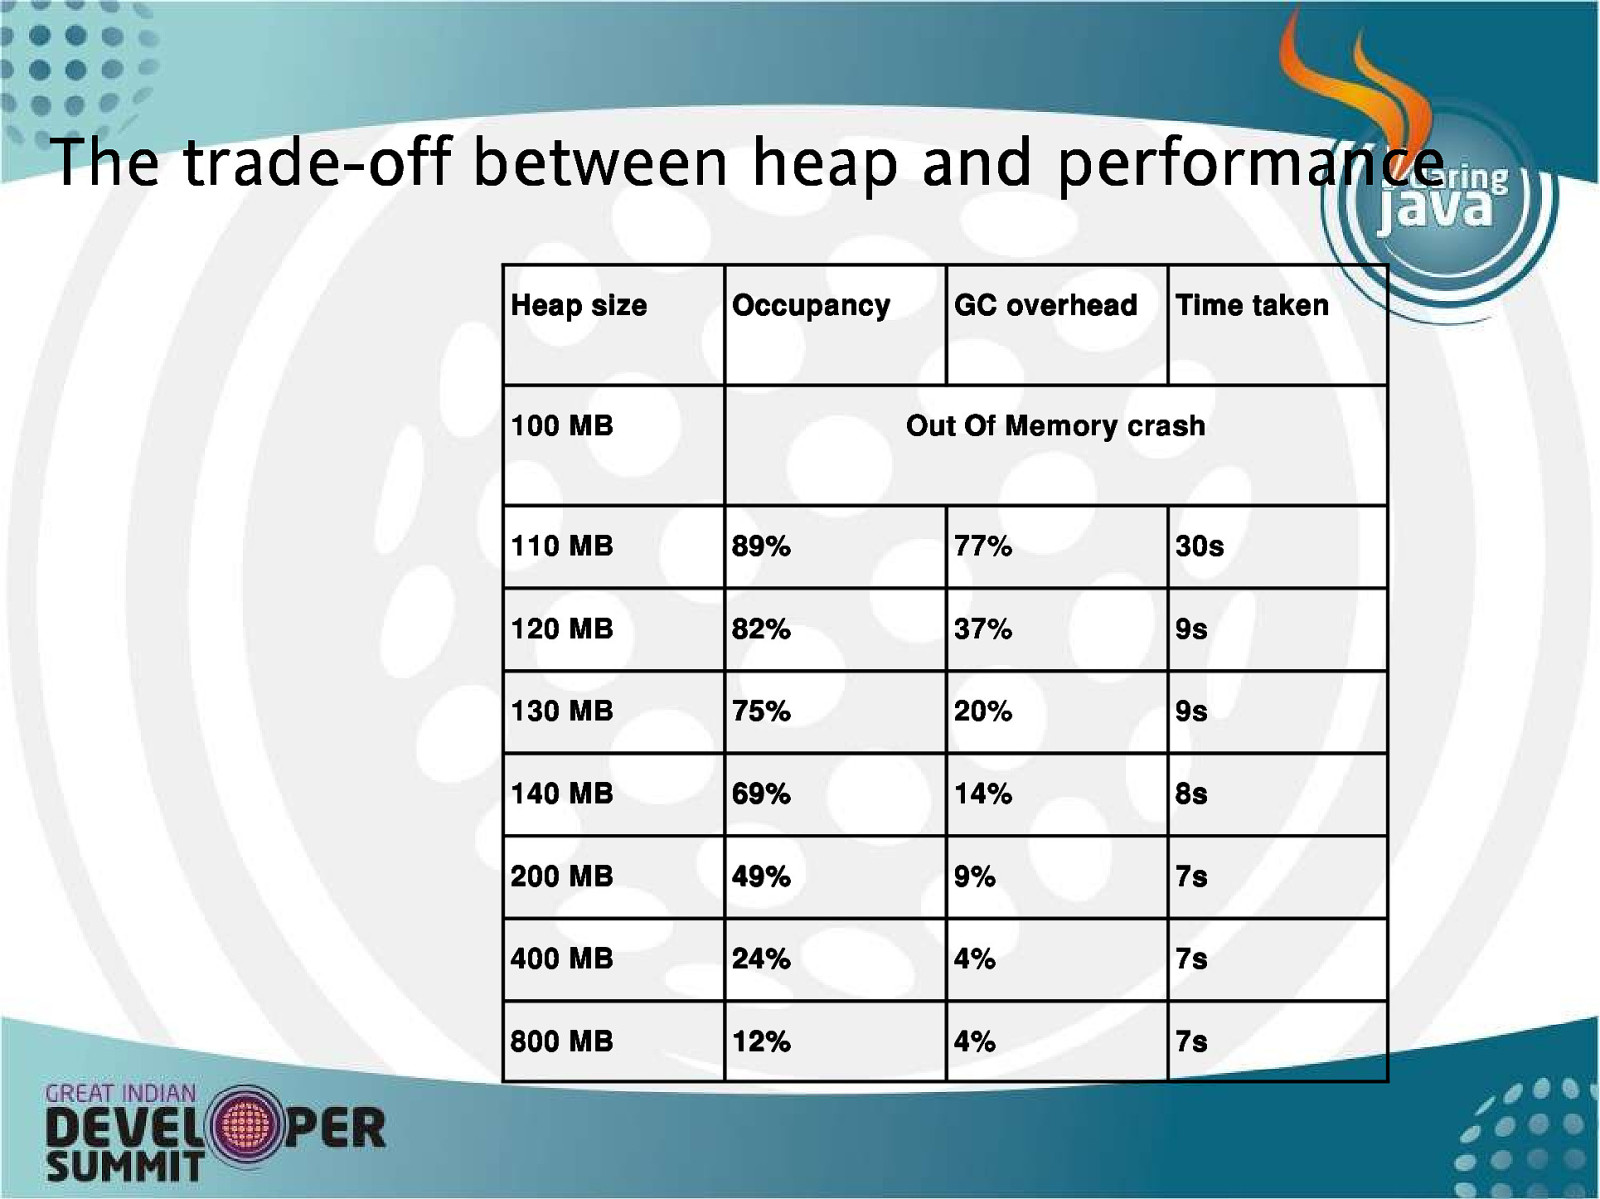
T he trade-off b etween heap and p erform ance H ea p s iz e O c c u p a nc y 100 M B GC ov e r he a d T i m e ta k e n O u t O f M e m or y c r a s h 110 M B 89% 77% 30s 120 M B 82% 37% 9s 130 M B 75% 20% 9s 140 M B 69% 14% 8s 200 M B 49% 9% 7s 400 M B 24% 4% 7s 800 M B 12% 4% 7s
What’s the right heap s ize? • It depends! • What other demands are there for heap on the system? • Larger heaps generally give better performance – But … • Very large heaps give diminishing returns • Pause times will generally be longer with larger heaps and may be very long with enormous heaps • Some policies are more sensitive than others to heap size • As a rule of thumb, aim for no more than 70% used heap (occupancy) • 50% used heap is a good balance between improving performance and avoiding waste
A s s e s s in g F o o t p r in t • After you’ve sized the heap, is the footprint what you expect? • If not, why not? – Excessive caching – Excessive cloning – Bloated object structures • Solution may be to reduce application’s memory usage rather than increase the heap size • Sometimes the solution may be to increase application’s memory usage if it’s using less than expected – “If my footprint’s that small then I can cache all that stuff and speed up my application”
Diagnosing footprint is s ues • Understanding leaks and excessive footprint needs an understanding of what objects are on the heap – Take a heap or system dump – Heap dumps are triggered automatically on OutOfMemoryErrors – Dumps may be triggered with ctrl-break (windows) or kill -3 (unix) – Dumps may also be triggered on method entry and other events – Dumps may also be triggered programmatically • Once you have a dump, the dump can be analysed to discover what’s holding onto memory

O u t l in e • Introduction • Identifying performance problems • Fixing performance problems – Performance tools for … • Space bound applications – IBM Monitoring and Diagnostic Tools for Java™ – GC and Memory Visualizer – IBM MDD4J • CPU bound applications – Method trace • I/O bound applications • Lock bound applications – IBM Lock Analyzer for Java
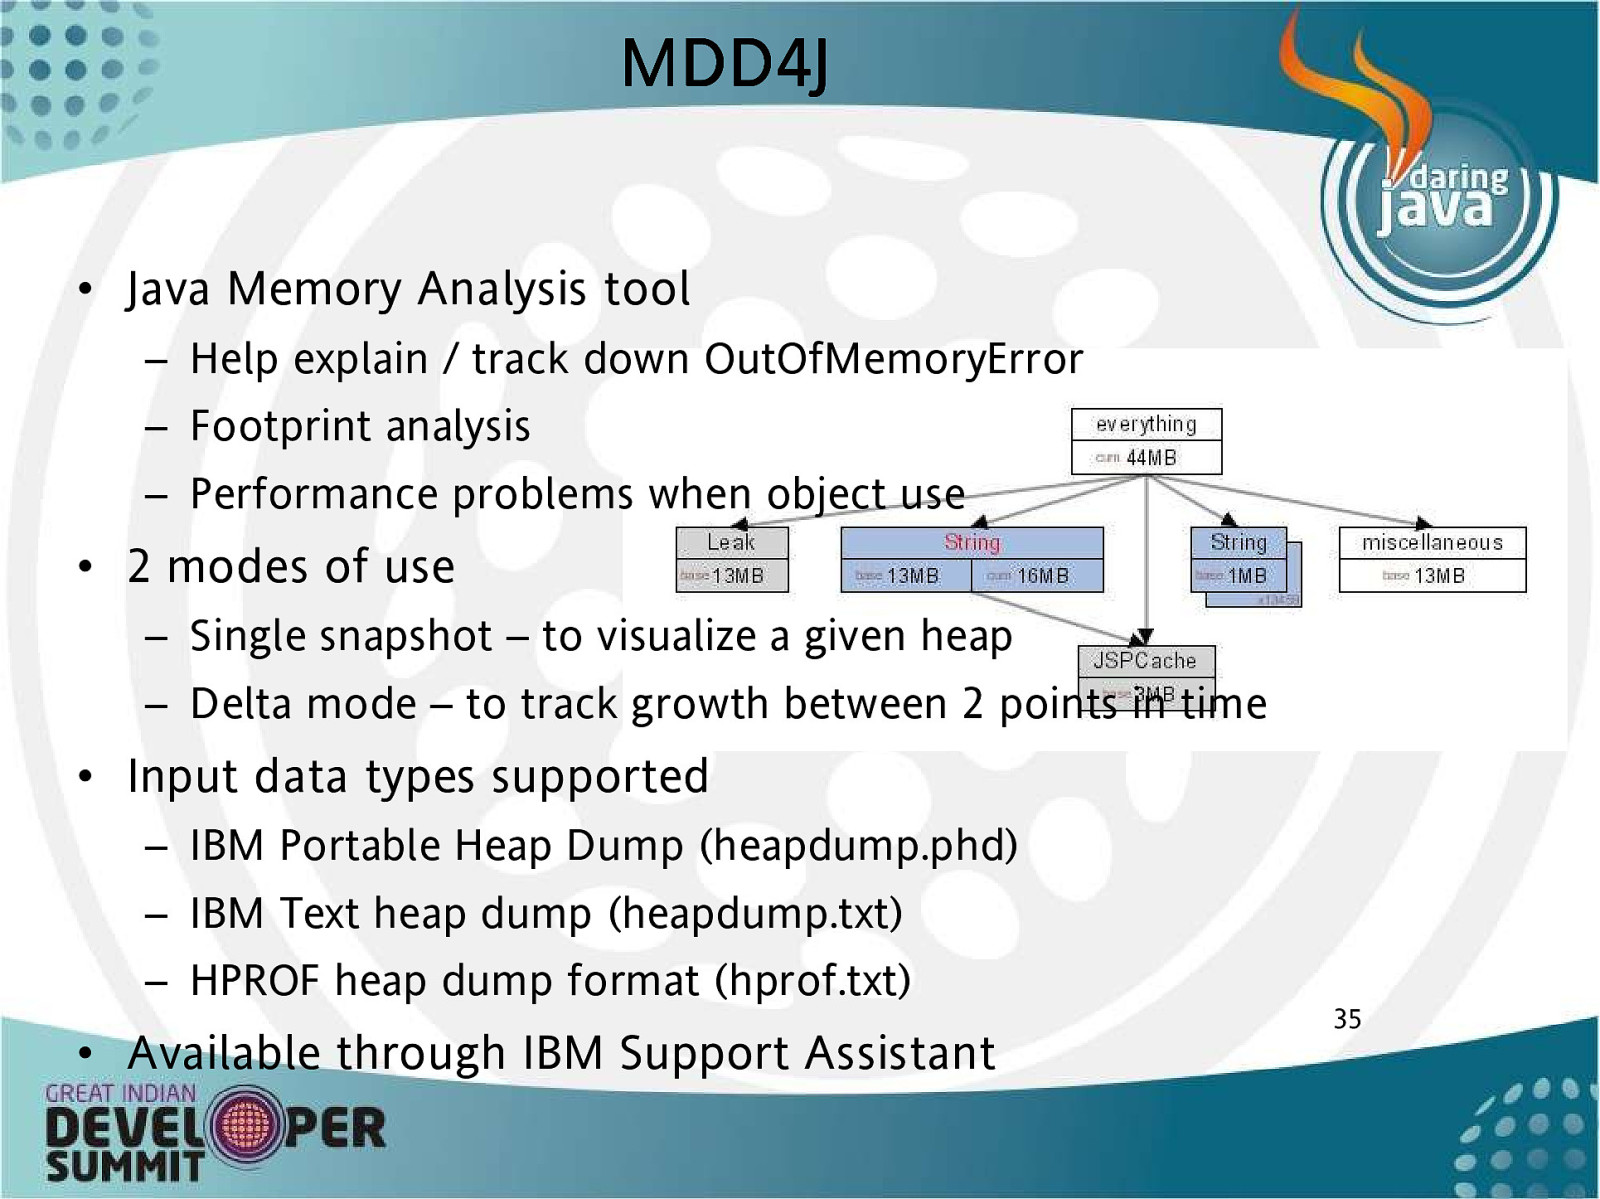
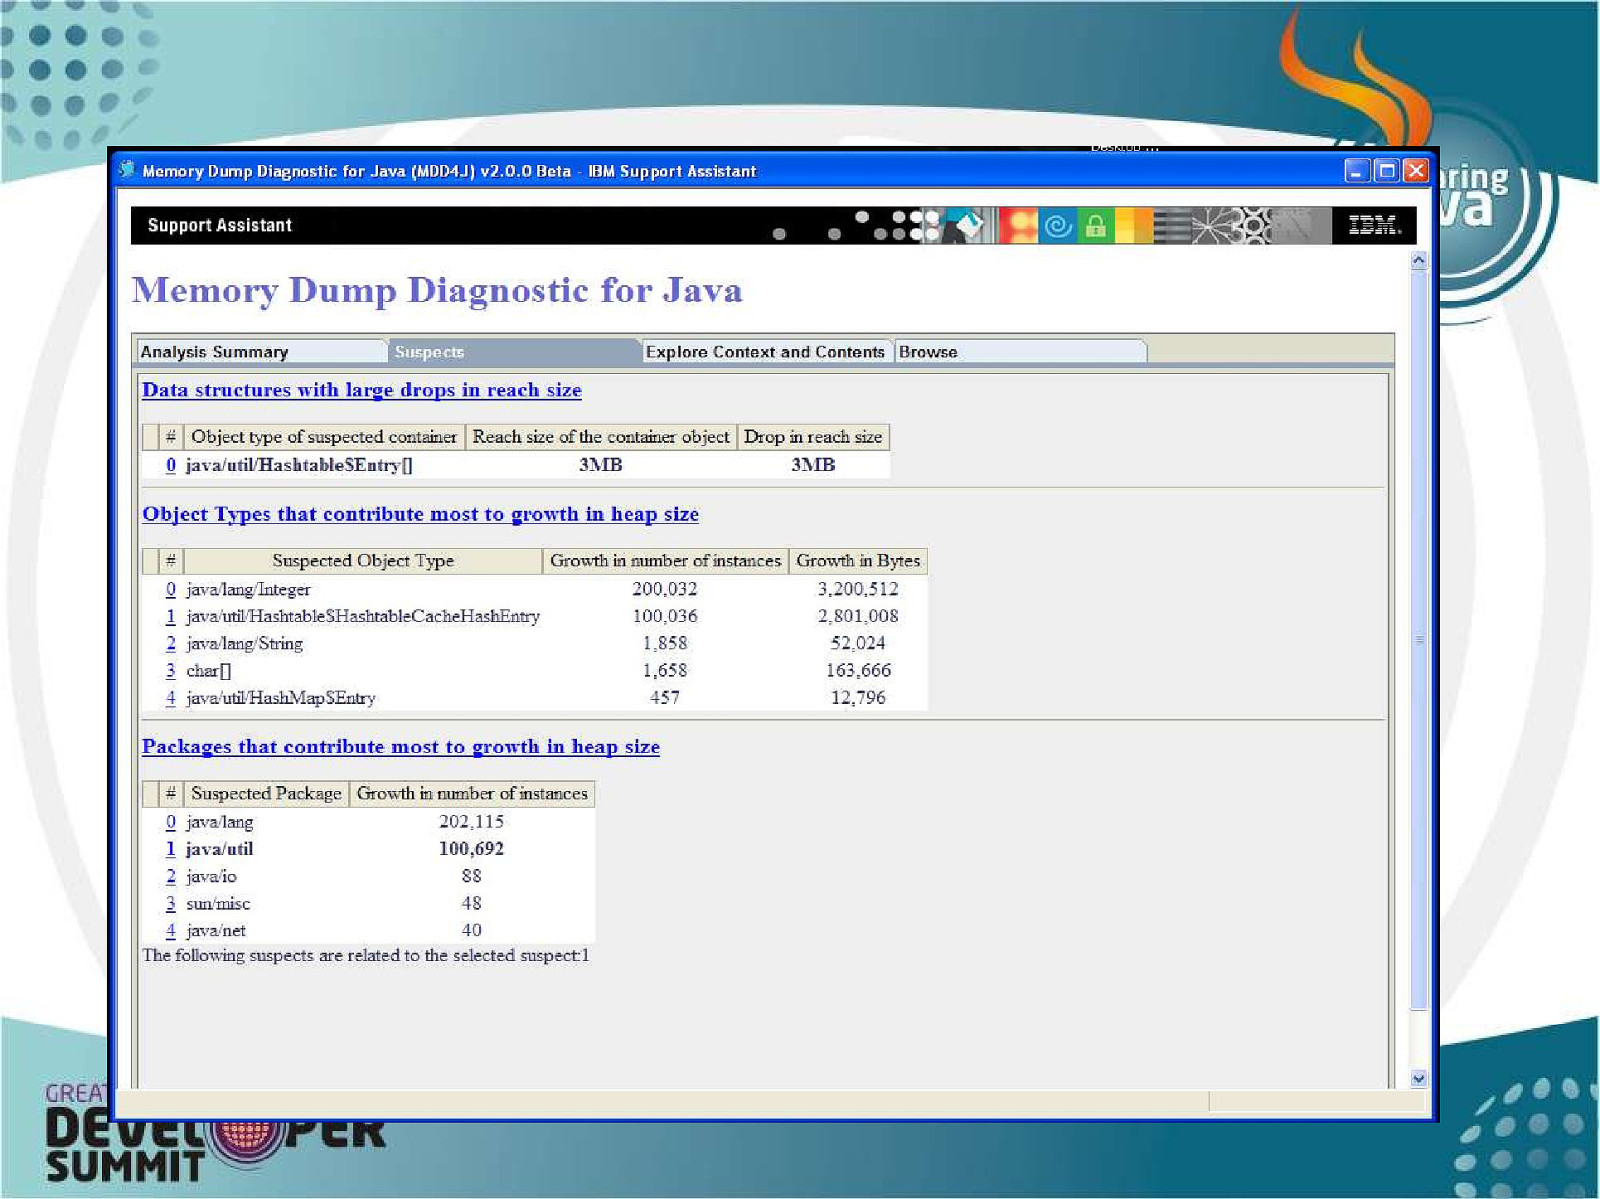
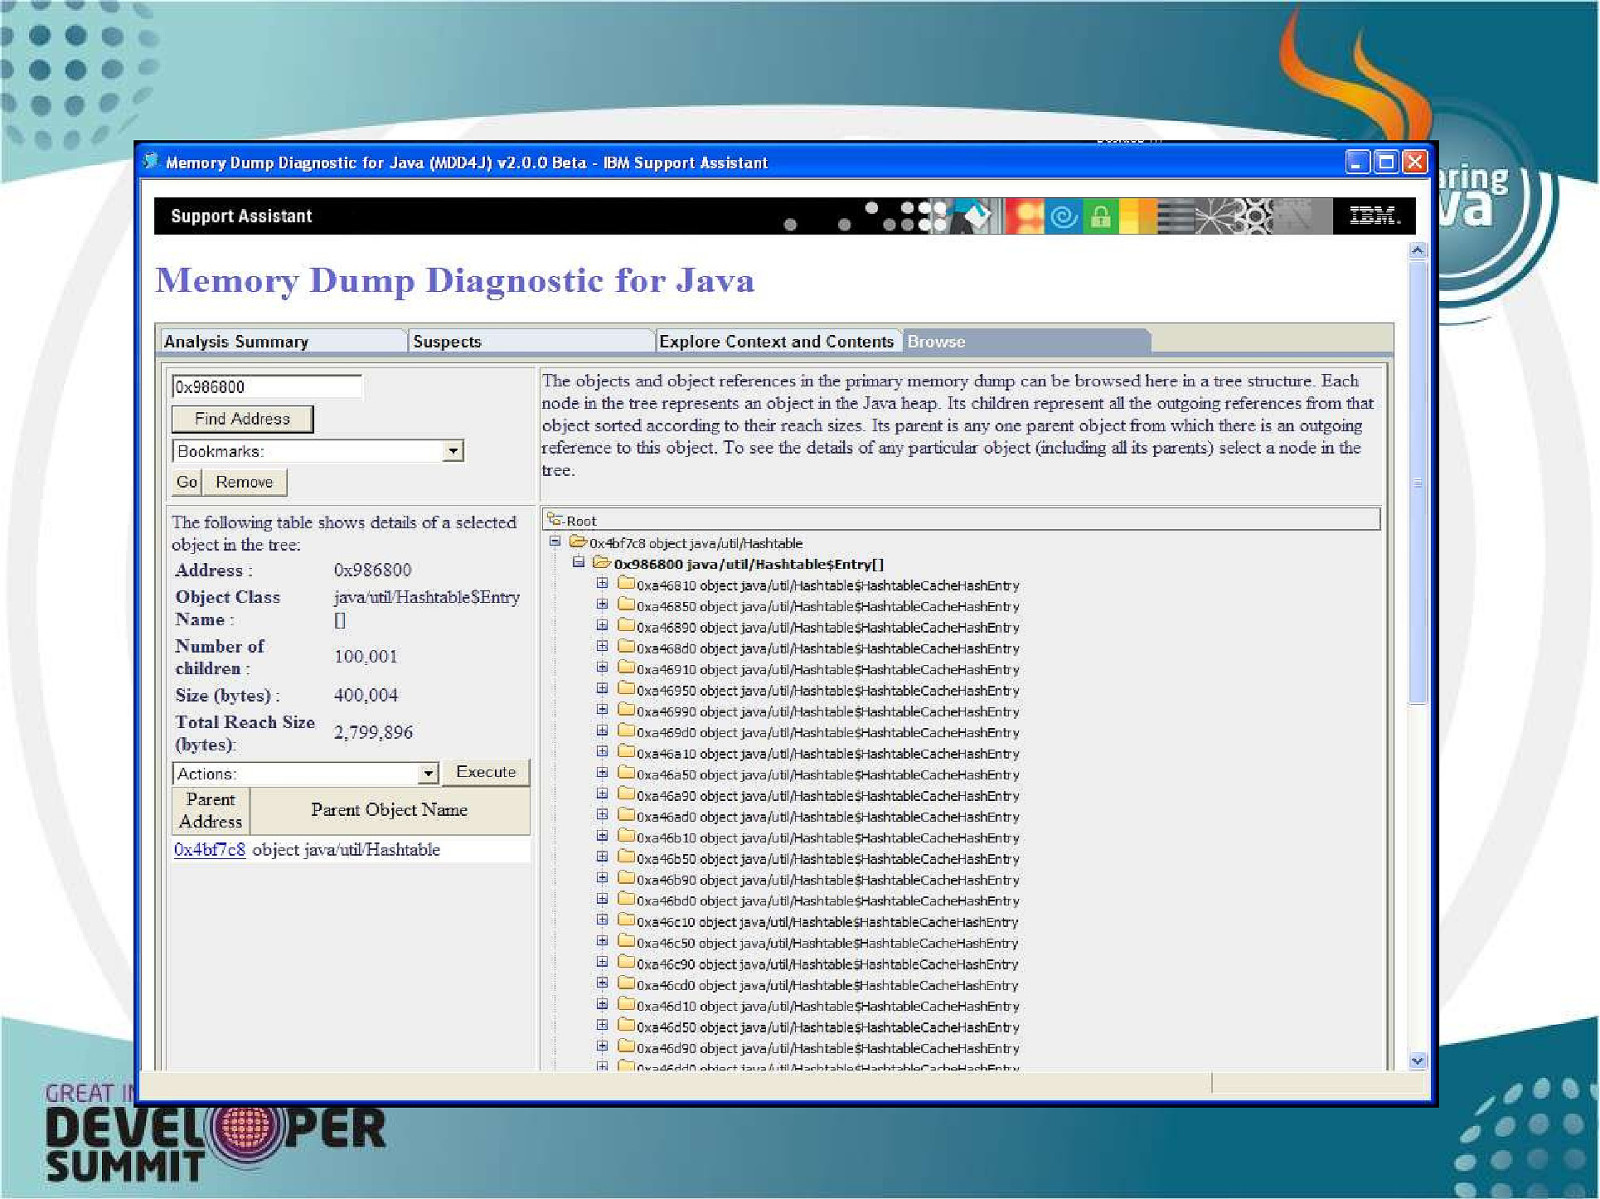
M DD4J • Java Memory Analysis tool – Help explain / track down OutOfMemoryError – Footprint analysis – Performance problems when object use • 2 modes of use – Single snapshot – to visualize a given heap – Delta mode – to track growth between 2 points in time • Input data types supported – IBM Portable Heap Dump (heapdump.phd) – IBM Text heap dump (heapdump.txt) – HPROF heap dump format (hprof.txt) • Available through IBM Support Assistant 35
36
37
O u t l in e • Introduction • Identifying performance problems • Fixing performance problems – Performance tools for … • Space bound applications – IBM Monitoring and Diagnostic Tools for Java™ – GC and Memory Visualizer – IBM MDD4J • CPU bound applications – Method trace • I/O bound applications • Lock bound applications – IBM Lock Analyzer for Java
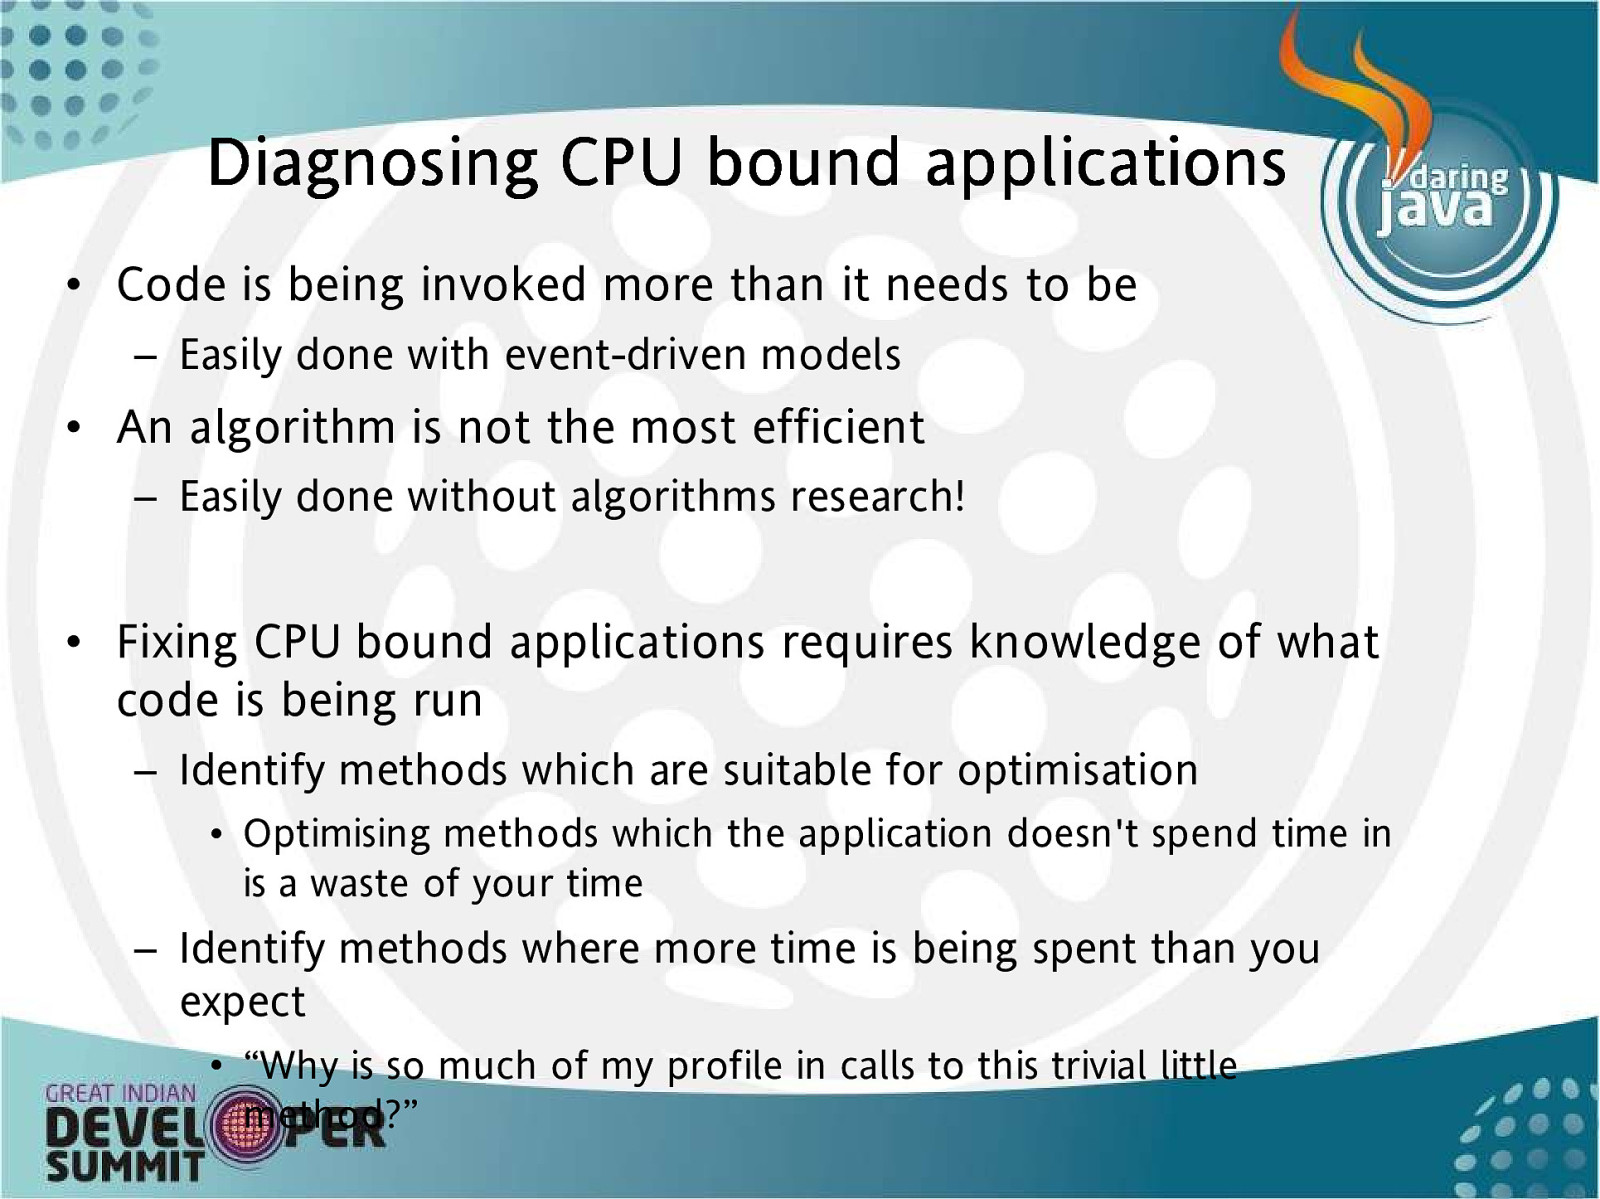
Diagnosing CPU bound ap plications • Code is being invoked more than it needs to be – Easily done with event-driven models • An algorithm is not the most efficient – Easily done without algorithms research! • Fixing CPU bound applications requires knowledge of what code is being run – Identify methods which are suitable for optimisation • Optimising methods which the application doesn’t spend time in is a waste of your time – Identify methods where more time is being spent than you expect • “Why is so much of my profile in calls to this trivial little method?”
M ethod trace and p rofiling • There are two ways to work out what code your application is doing – Trace – Profiling • Trace – Does not require specialist tools (but is better with them) – Records every invocation of a subset of methods – Gives insight into sequence of events – In the simplest case, System.out.println • Profiling – Requires specialist tools – Samples all methods and provides statistics

O u t l in e • Introduction • Identifying performance problems • Fixing performance problems – Performance tools for … • Space bound applications – IBM Monitoring and Diagnostic Tools for Java™ – GC and Memory Visualizer – IBM MDD4J • CPU bound applications – Method trace • I/O bound applications • Lock bound applications – IBM Lock Analyzer for Java
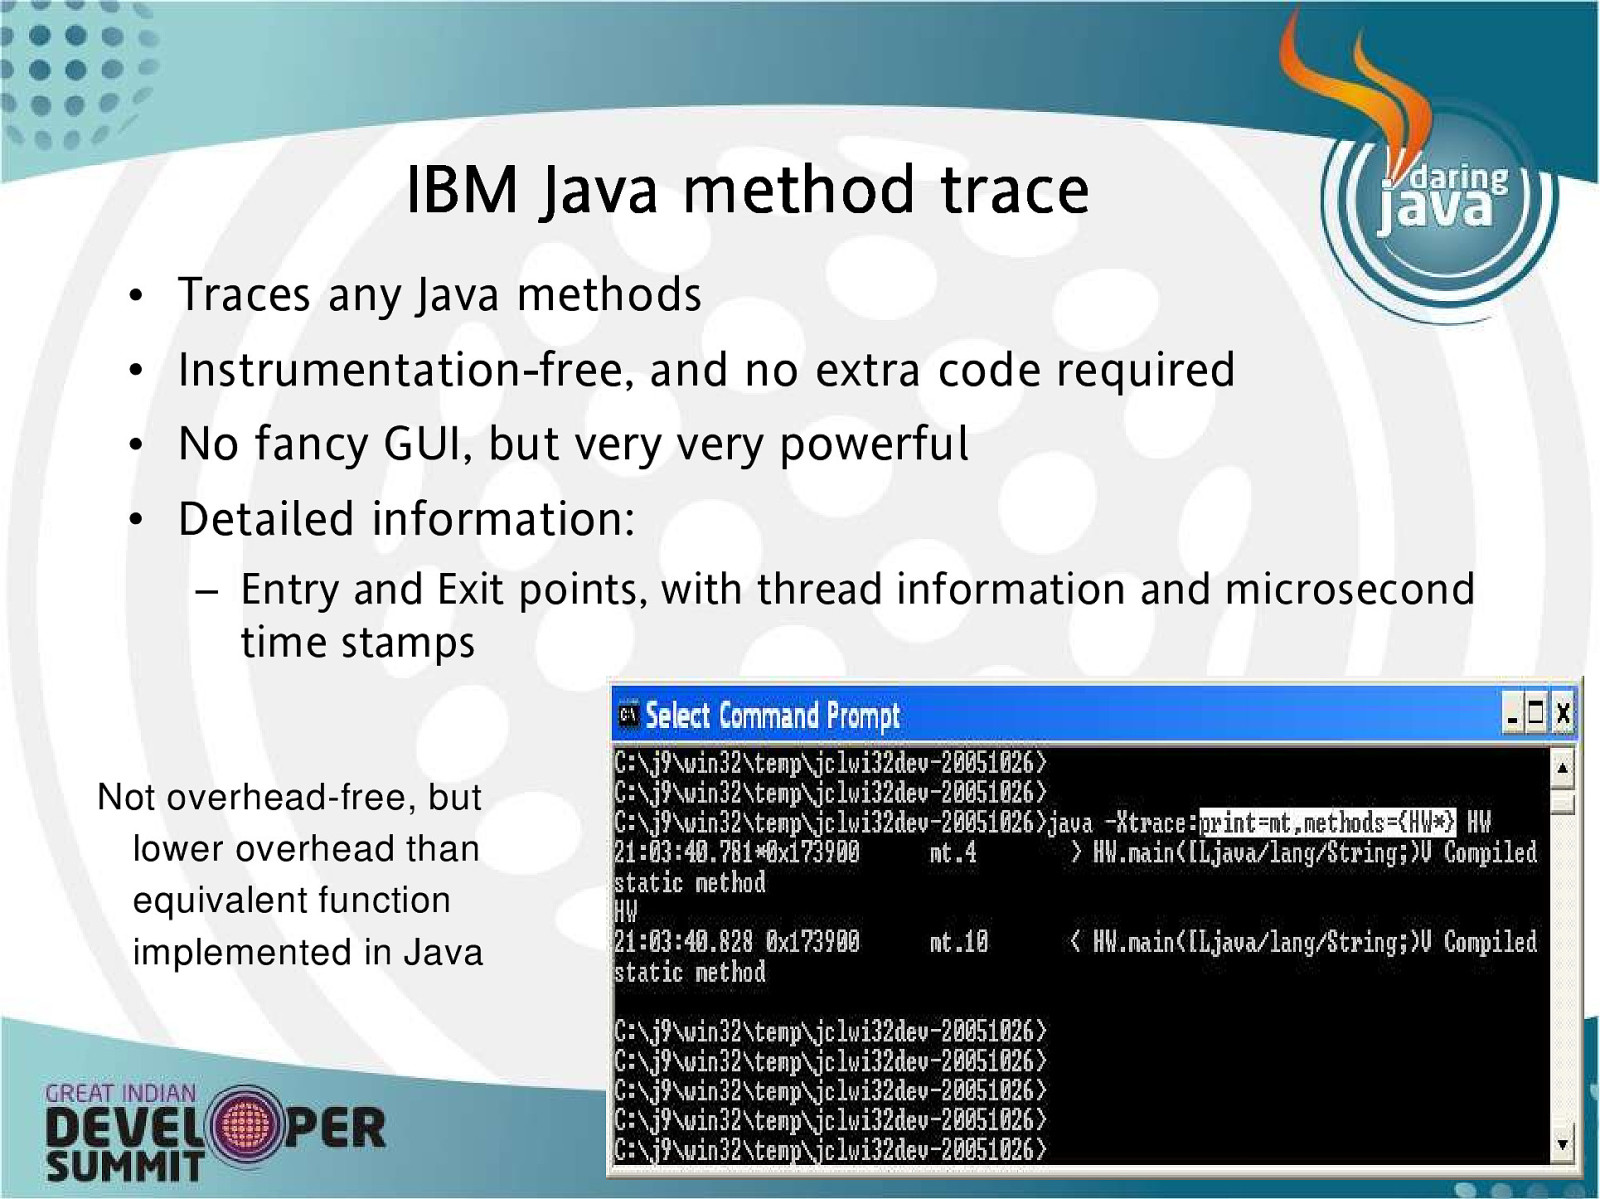
IBM Java m ethod trace • Traces any Java methods • Instrumentation-free, and no extra code required • No fancy GUI, but very very powerful • Detailed information: – Entry and Exit points, with thread information and microsecond time stamps Not overhead-free, but lower overhead than equivalent function implemented in Java
C o n t r o l l in g w h a t is t r a c e d • Can select methods on package, class or method name: • Package: methods={java/lang/} • Class: methods={java/lang/String.} • Method: methods={HelloWorld.main} • Also ! operator and combination allowed: – methods={java/lang/,!java/lang/String} • Possible to create huge volume of output, so use sensible method specifications!
T r i g g e r in g e v e n t s • Can request certain actions occur when chosen methods are entered or exited • Actions such as coredump, javadump, etc. • Actions such as enabling trace! • Can cause action to occur on n’th instance of trigger condition • Can specify how many times the action occurs • Multiple trigger types and actions can be specified
U s in g t r ig g e r in g t o t r a c e o n l y s o m e o f t h e t im e • Can start trace suspended, and resume / suspend it on matching method conditions • E.g. use start up option –Xtrace:resumecount=1 to start trace suspended. • Trigger={method{HelloWorld.main*,resumethis,suspendthis}} • This will cause the requested tracing to take effect only inside HelloWorld.main method • Less work than stepping through in a debugger and creates a permanent record
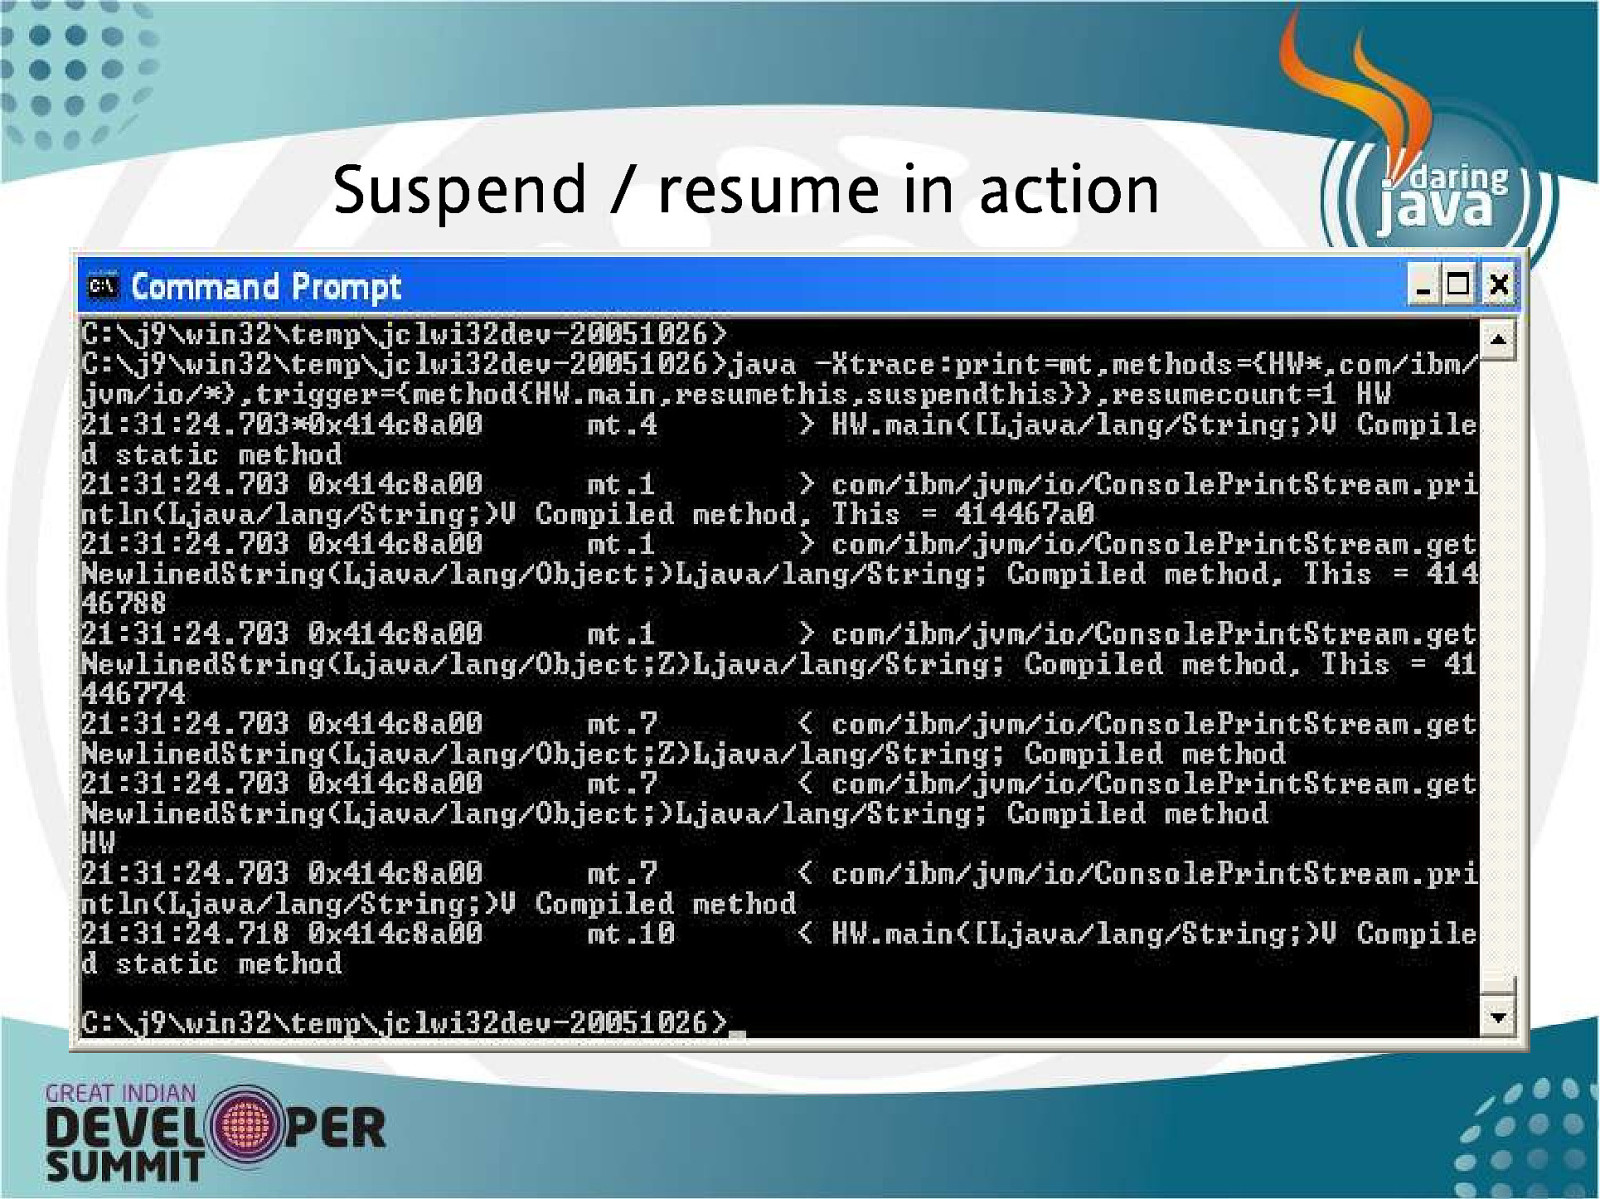
S u s p e n d / r e s u m e in a c t i o n
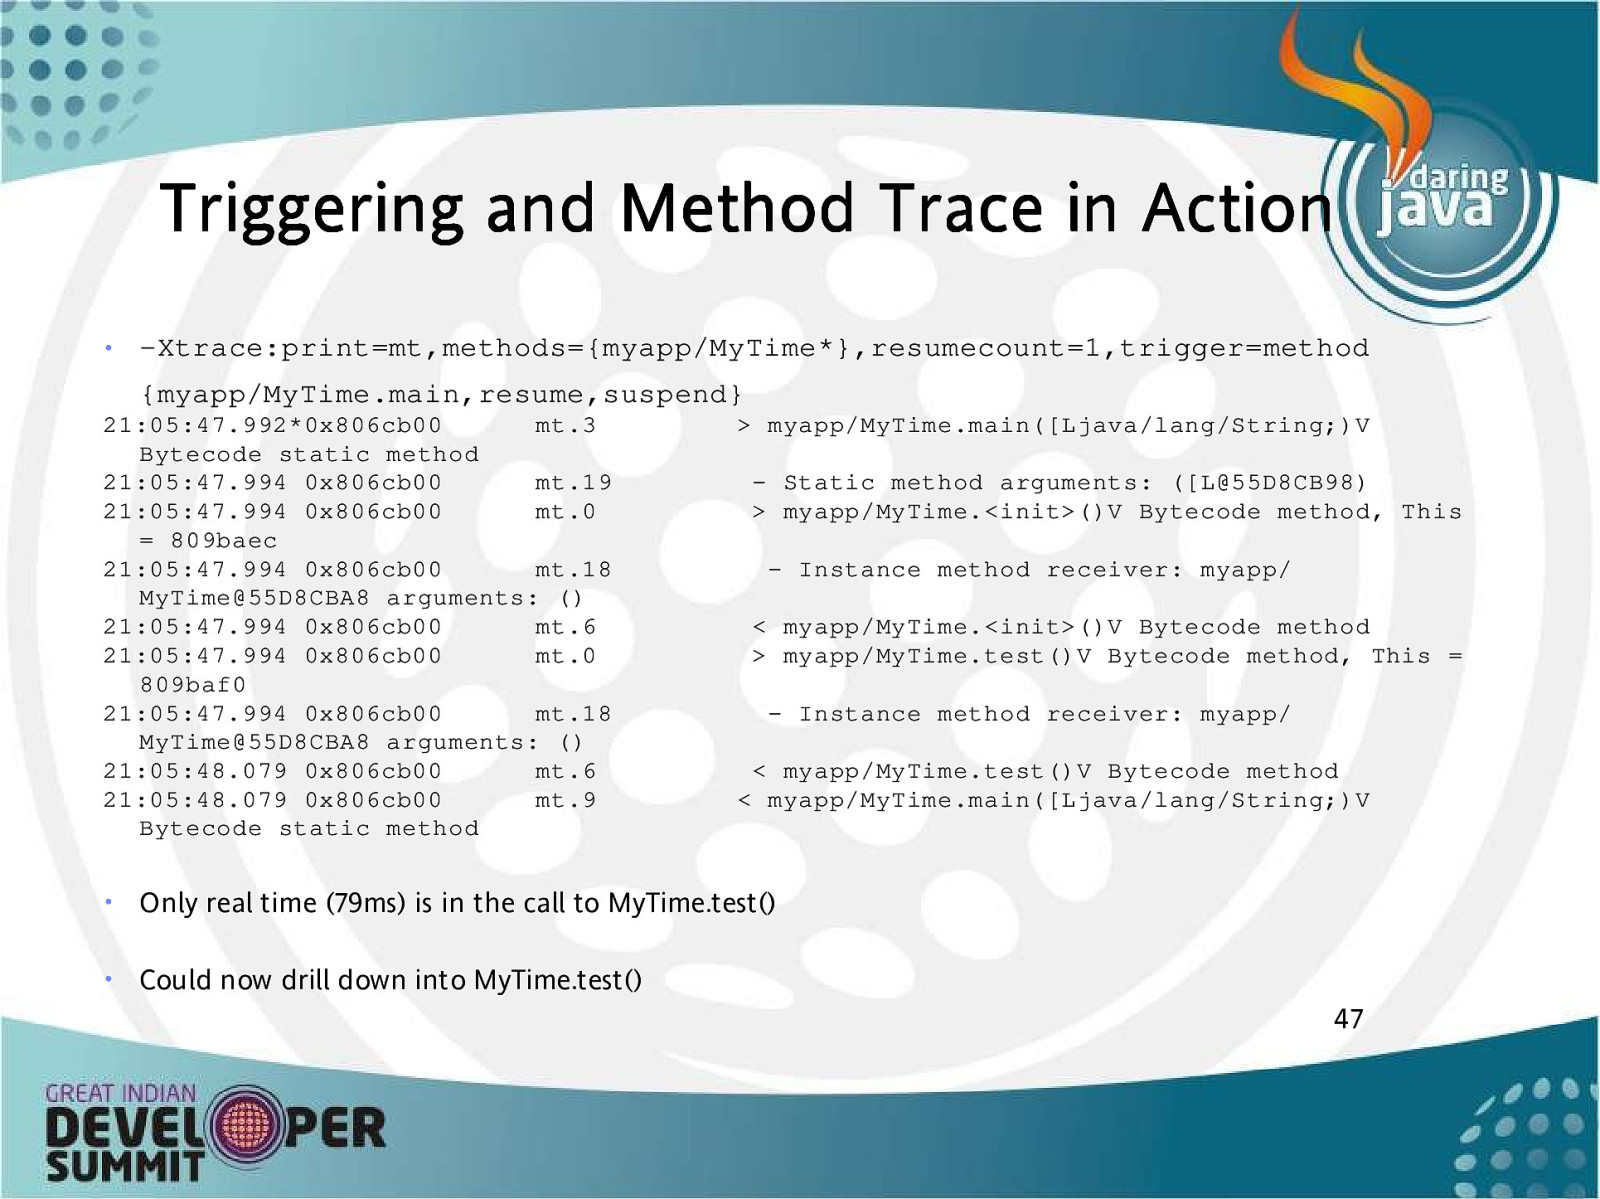
T r i g g e r i n g a n d M e t h o d T r a c e in A c t io n • -Xtrace:print=mt,methods={myapp/MyTime*},resumecount=1,trigger=method {myapp/MyTime.main,resume,suspend} 21:05:47.992*0x806cb00 mt.3 Bytecode static method 21:05:47.994 0x806cb00 mt.19 21:05:47.994 0x806cb00 mt.0 = 809baec 21:05:47.994 0x806cb00 mt.18 MyTime@55D8CBA8 arguments: () 21:05:47.994 0x806cb00 mt.6 21:05:47.994 0x806cb00 mt.0 809baf0 21:05:47.994 0x806cb00 mt.18 MyTime@55D8CBA8 arguments: () 21:05:48.079 0x806cb00 mt.6 21:05:48.079 0x806cb00 mt.9 Bytecode static method
myapp/MyTime.main([Ljava/lang/String;)V - Static method arguments: ([L@55D8CB98) > myapp/MyTime.<init>()V Bytecode method, This - Instance method receiver: myapp/ < myapp/MyTime.<init>()V Bytecode method > myapp/MyTime.test()V Bytecode method, This = - Instance method receiver: myapp/ < myapp/MyTime.test()V Bytecode method < myapp/MyTime.main([Ljava/lang/String;)V • Only real time (79ms) is in the call to MyTime.test() • Could now drill down into MyTime.test() 47
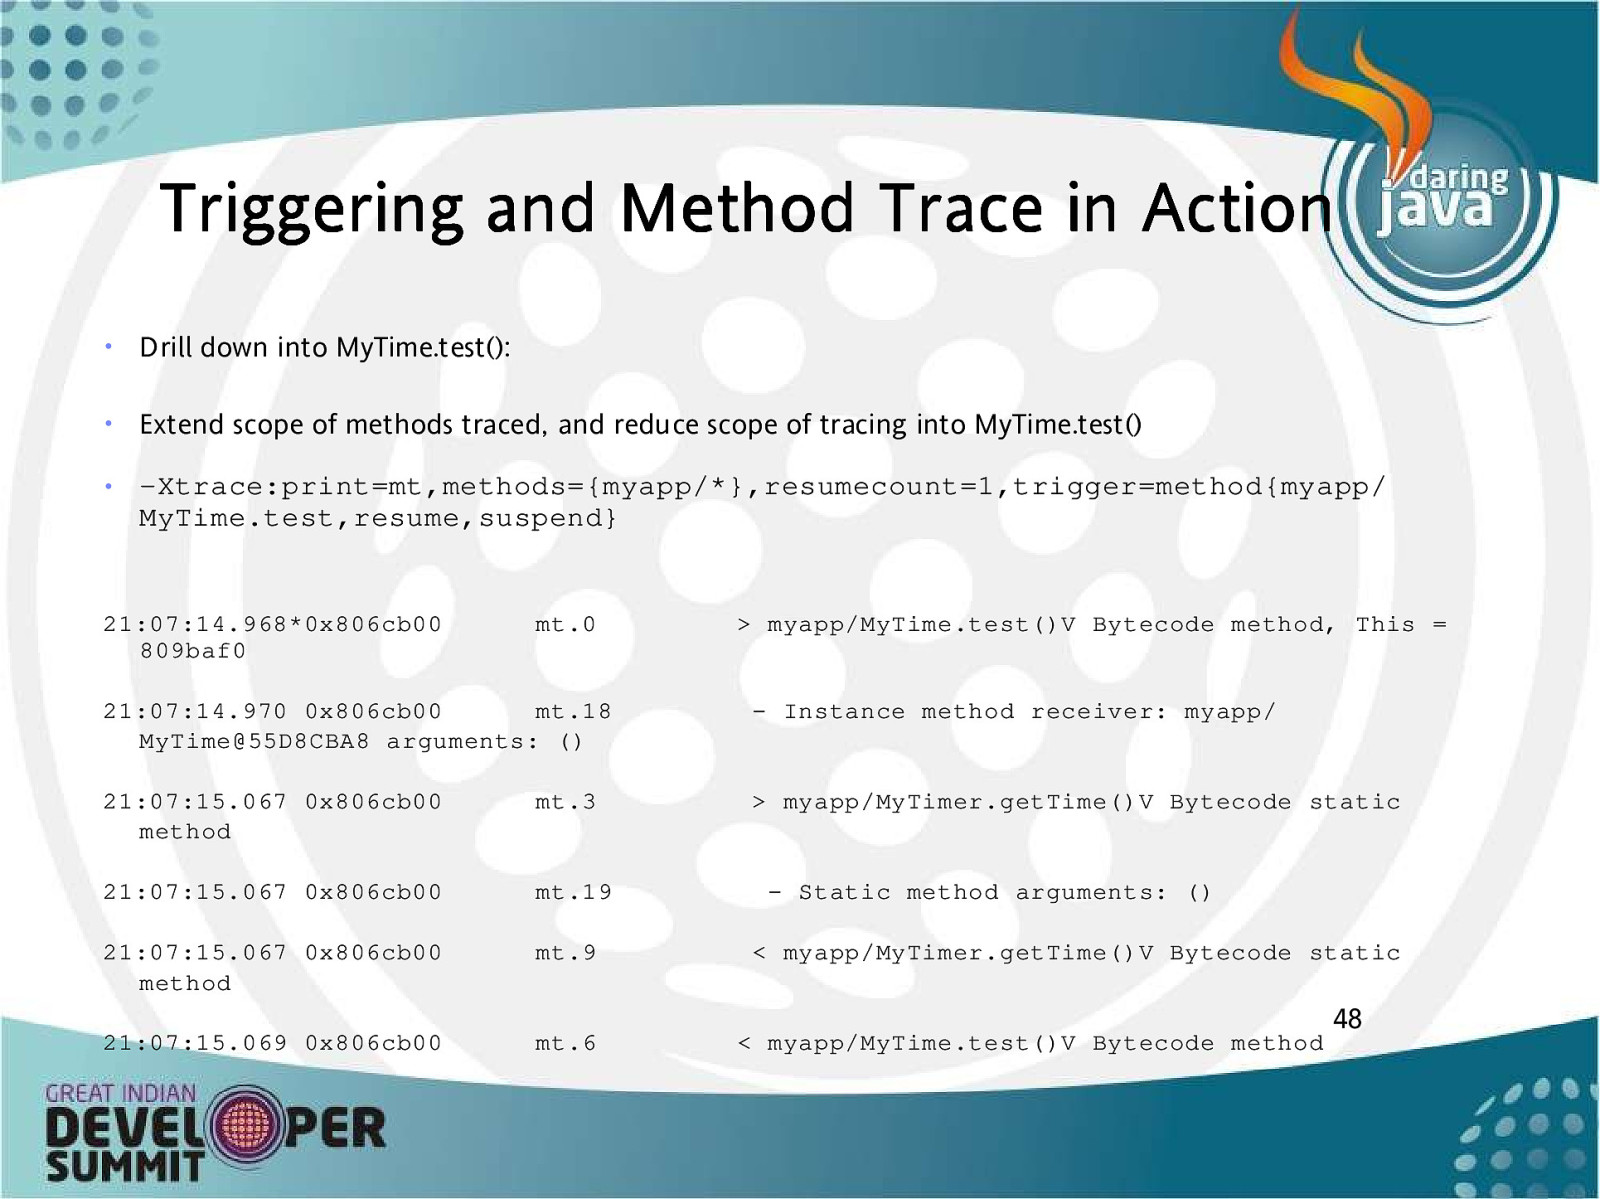
T r i g g e r i n g a n d M e t h o d T r a c e in A c t io n • Drill down into MyTime.test(): • Extend scope of methods traced, and reduce scope of tracing into MyTime.test() • -Xtrace:print=mt,methods={myapp/},resumecount=1,trigger=method{myapp/ MyTime.test,resume,suspend} 21:07:14.9680x806cb00 809baf0 mt.0
myapp/MyTime.test()V Bytecode method, This = 21:07:14.970 0x806cb00 mt.18 MyTime@55D8CBA8 arguments: ()
myapp/MyTimer.getTime()V Bytecode static 21:07:15.067 0x806cb00 mt.19 21:07:15.067 0x806cb00 method mt.9 21:07:15.069 0x806cb00 mt.6
O th e r u s e s o f t r a c e • Can count tracepoints using • java -Xtrace:count={tracepoint_selection} Class • This is almost like a sampling profiler
O u t l in e • Introduction • Identifying performance problems • Fixing performance problems – Performance tools for … • Space bound applications – IBM Monitoring and Diagnostic Tools for Java™ – GC and Memory Visualizer – IBM MDD4J • CPU bound applications – Method trace • I/O bound applications • Lock bound applications – IBM Lock Analyzer for Java
Diagnos ing I/O-bound ap plications • A number of tools may be required to isolate the causes of I/O delays • Use the GC and Memory Visualizer to check sweep times – Sweep times should be very short – Long sweep times indicate access to memory is slow – This indicates the application is probably paging • Use method trace to trace calls to network and disk I/O 51

O u t l in e • Introduction • Identifying performance problems • Fixing performance problems – Performance tools for … • Space bound applications – IBM Monitoring and Diagnostic Tools for Java™ – GC and Memory Visualizer – IBM MDD4J • CPU bound applications – Method trace • I/O bound applications • Lock bound applications – IBM Lock Analyzer for Java
Diagnosing lock bound ap plications • Infelicitous synchronization can cause significant application delays • IBM provides a tool to quickly diagnose and identify contended locks – A contended lock is the opposite of a contented lock! 53
O u t l in e • Introduction • Identifying performance problems • Fixing performance problems – Performance tools for … • Space bound applications – IBM Monitoring and Diagnostic Tools for Java™ – GC and Memory Visualizer – IBM MDD4J • CPU bound applications – Method trace • I/O bound applications • Lock bound applications – IBM Lock Analyzer for Java
IBM Lock Analyzer for Ja Javva • Download from http://www.alphaworks.ibm.com/tech/jla • JLA provides profiling data on monitors used in Java applications and the JVM: – Counters associated with contended locks – Total number of successful acquires – Recursive acquires – Frequency with which a thread had to block waiting on the monitor – Cumulative time the monitor was held. – For platforms that support 3 Tier Spin Locking the following are also collected • Number of times the requesting thread went through the inner 55 (spin loop) while attempting to acquire the monitor. • Number of times the requesting thread went through the outer (thread yield loop) while attempting to acquire the monitor.
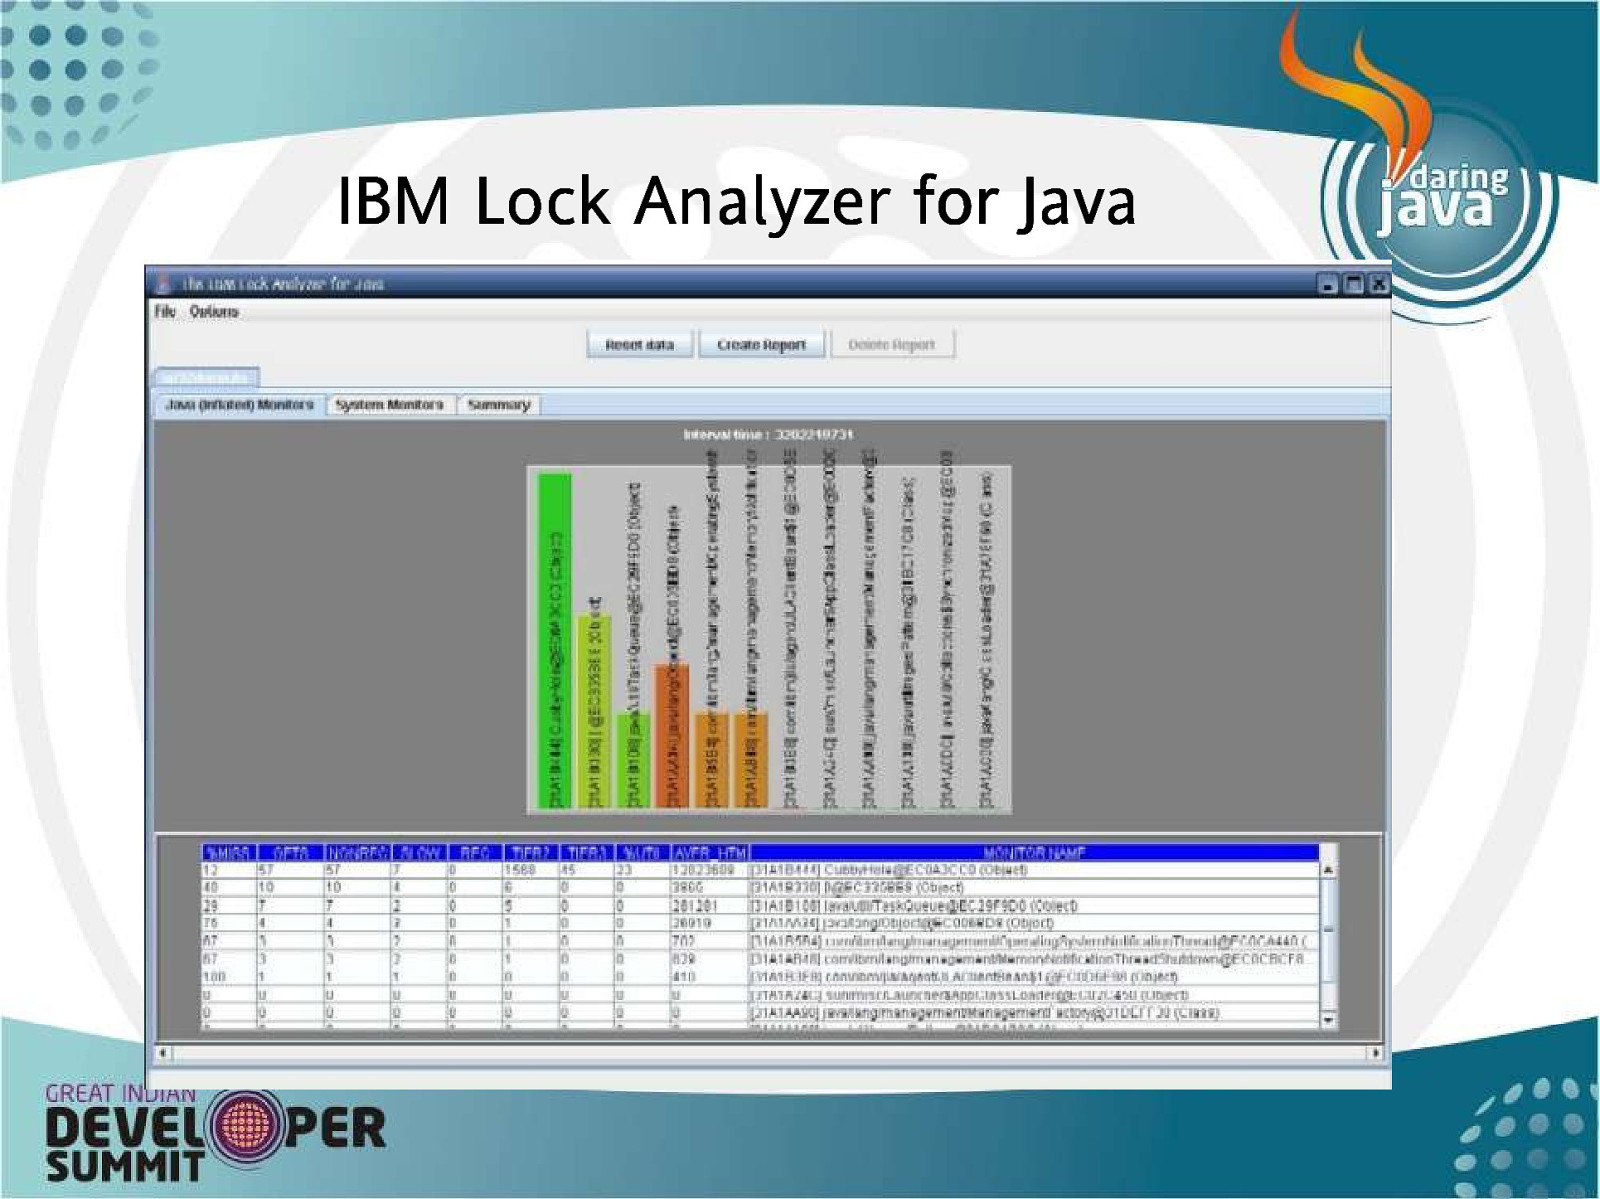
IBM Lock Analyzer for Java 56
W h a t d o th e b a r s m e a n ? • The Lock Analyzer provides very detailed information on locking and synchronization in the table below the chart • In most cases the chart will be enough • The height of the bar indicates how often threads were blocked waiting for the lock • The colour of the bar indicates what fraction of the attempts were unsuccessful
C o n cl u s io n s • Improving application performance starts with identifying limited resources • Tools can help fix performance bottlenecks – Space bound • GC and Memory Visualizer • MDD4J – CPU bound • Method tracing – Lock bound • Lock Analyzer for Java
• The following terms are trademarks of International Business Machines Corporation in the United States, other countries, or both: – IBM – z/OS – PowerPC – WebSphere • Java and all Java-based trademarks are trademarks of Sun Microsystems, Inc. in the United States, other countries, or both. • Solaris is a trademark of Sun Microsystems, Inc. • Intel is a trademarks of Intel Corporation or its subsidiaries in the United States, other countries, or both

A n y Q u e s t io n s ? 60