
A presentation at KubeCon+CloudNativeCon Japan 2025 in in Tokyo, Japan by Kasper Borg Nissen
Debugging OpenTelemetry: Ensuring Your Observability Signals Are Spot On Kasper Borg Nissen, Developer Advocate at @phennex kaspernissen.xyz
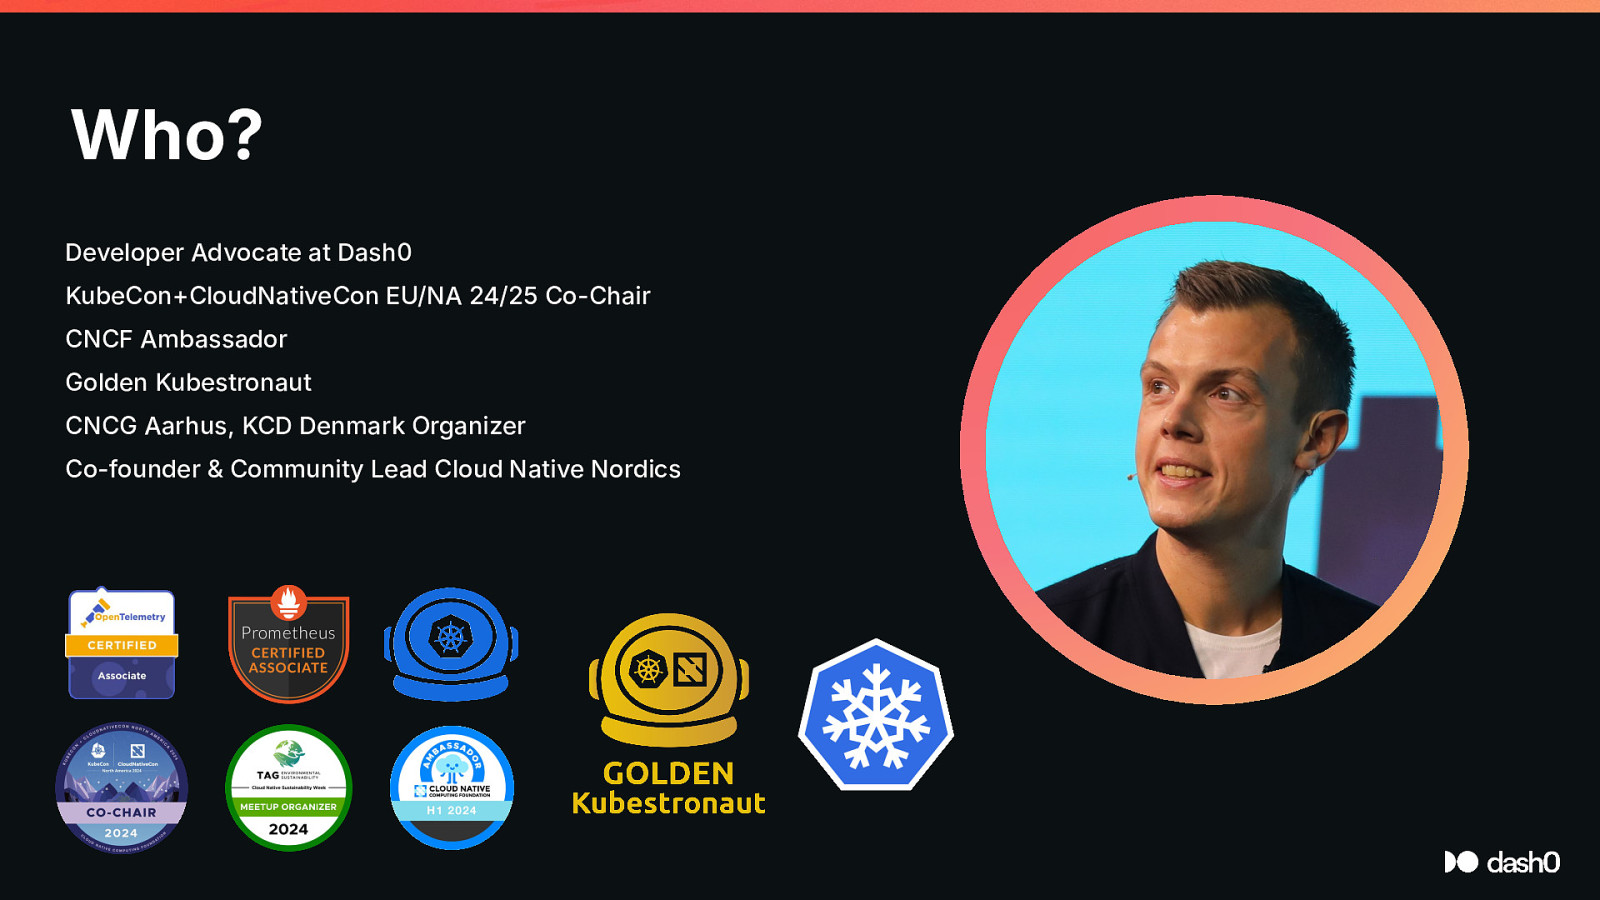
Who? Developer Advocate at Dash0 KubeCon+CloudNativeCon EU/NA 24/25 Co-Chair CNCF Ambassador Golden Kubestronaut CNCG Aarhus, KCD Denmark Organizer Co-founder & Community Lead Cloud Native Nordics
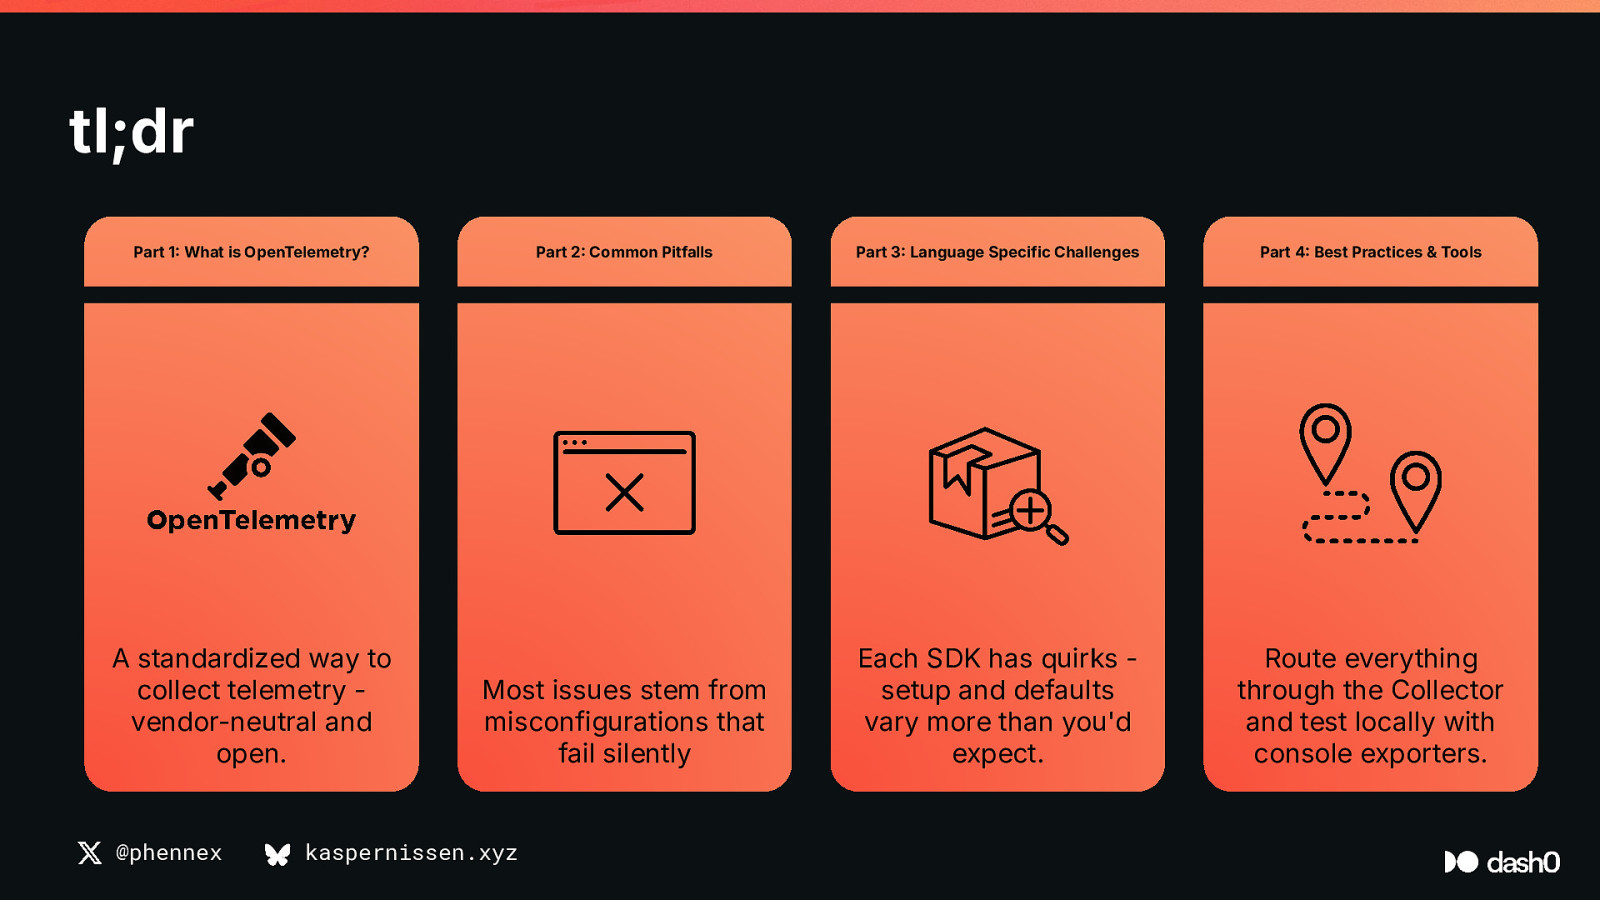
tl;dr Part 1 What is OpenTelemetry? Part 2 Common Pitfalls Part 3 Language Specific Challenges Part 4 Best Practices & Tools A standardized way to collect telemetry vendor-neutral and open. Most issues stem from misconfigurations that fail silently Each SDK has quirks setup and defaults vary more than you’d expect. Route everything through the Collector and test locally with console exporters. @phennex kaspernissen.xyz
Part 1 What is @phennex kaspernissen.xyz ?
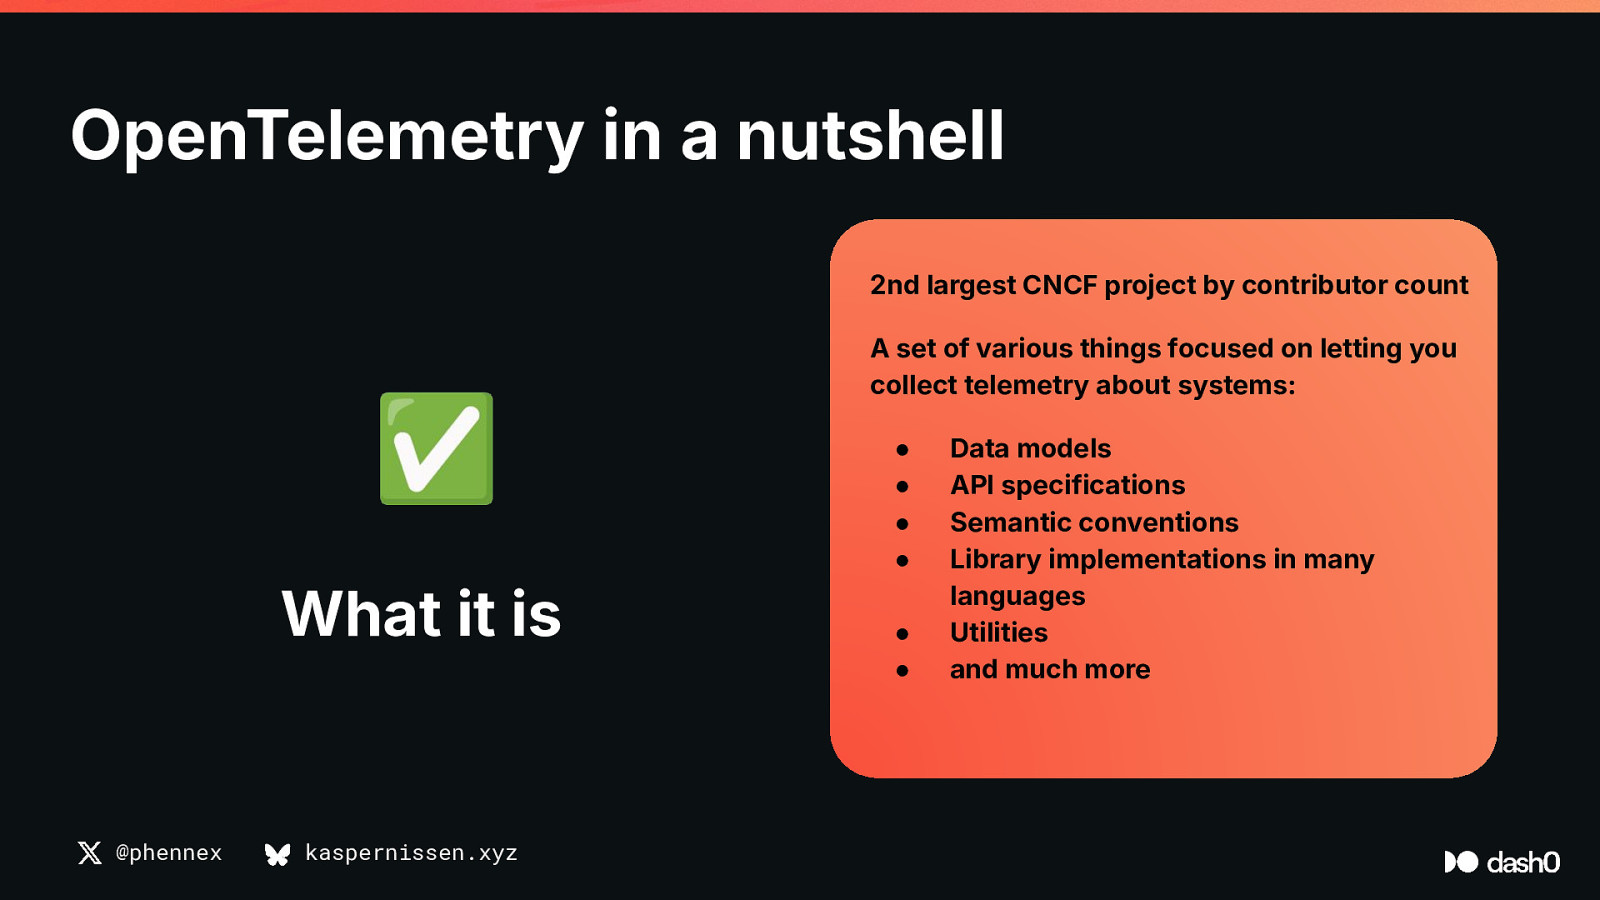
OpenTelemetry in a nutshell 2nd largest CNCF project by contributor count ✅ What it is @phennex kaspernissen.xyz A set of various things focused on letting you collect telemetry about systems: ● ● ● ● ● ● Data models API specifications Semantic conventions Library implementations in many languages Utilities and much more
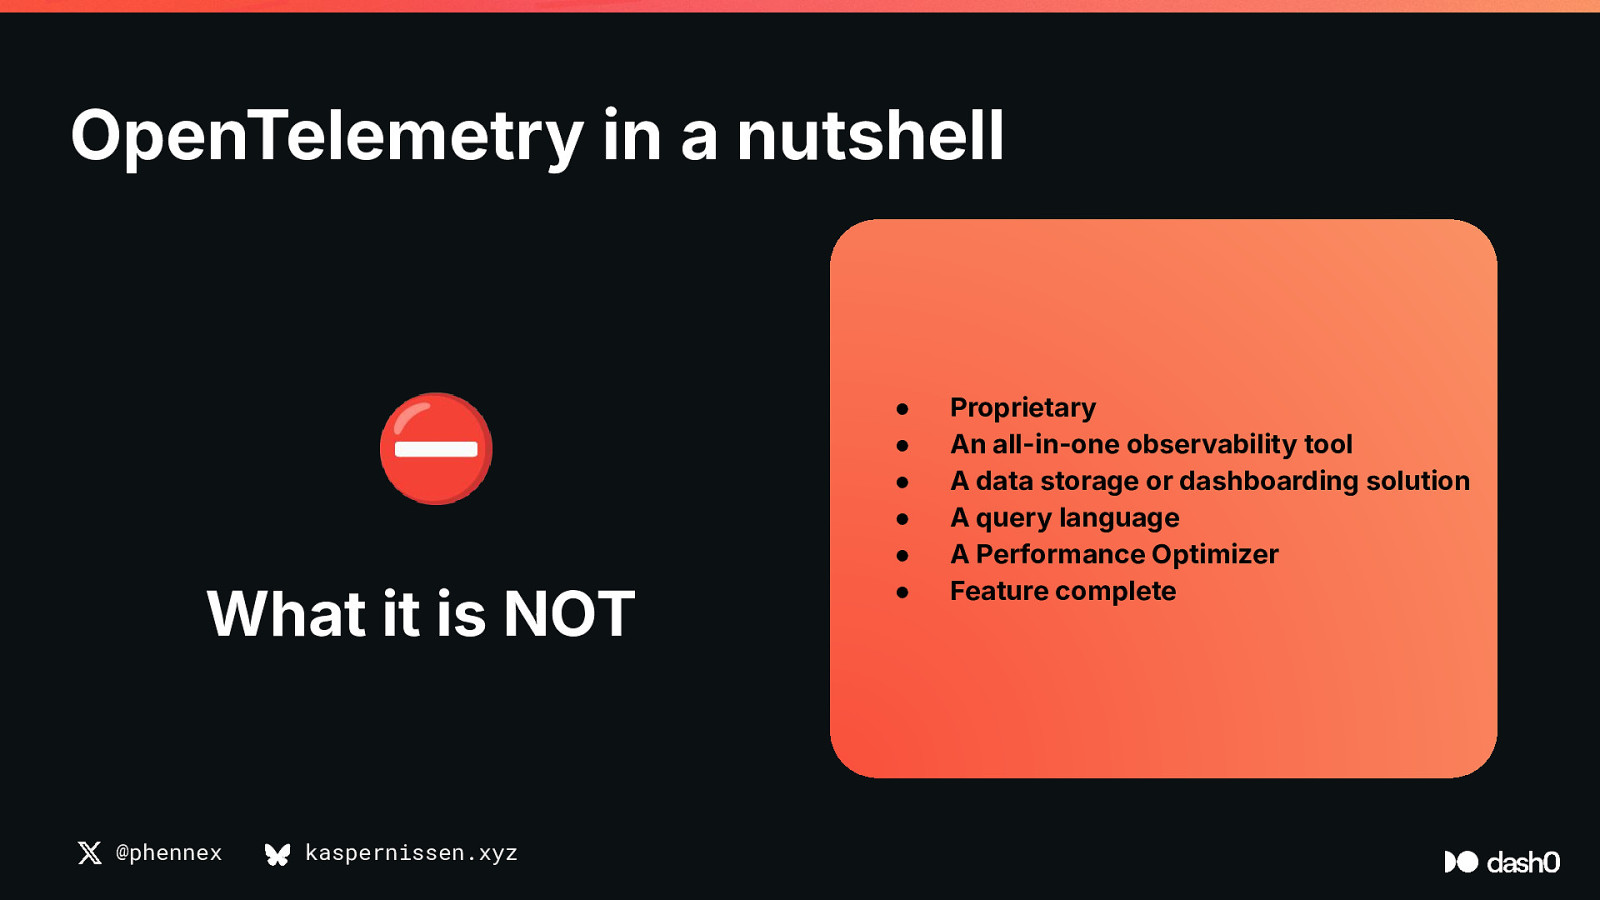
OpenTelemetry in a nutshell ⛔ What it is NOT @phennex kaspernissen.xyz ● ● ● ● ● ● Proprietary An all-in-one observability tool A data storage or dashboarding solution A query language A Performance Optimizer Feature complete
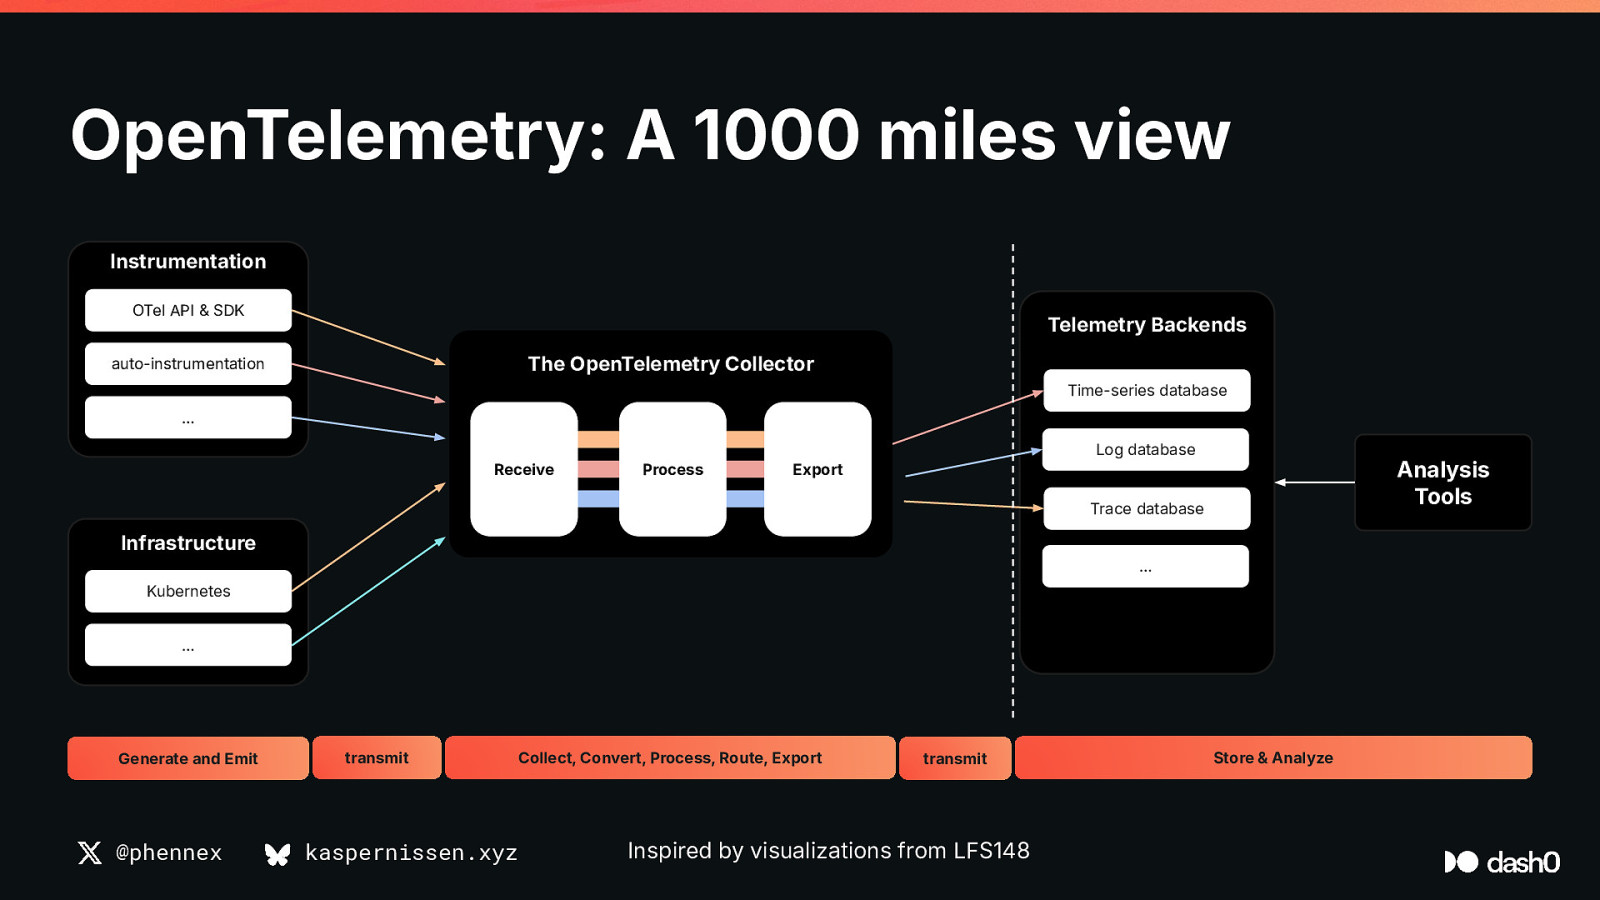
OpenTelemetry: A 1000 miles view Instrumentation OTel API & SDK Telemetry Backends The OpenTelemetry Collector auto-instrumentation Time-series database … Log database Receive Process Analysis Tools Export Trace database Infrastructure … Kubernetes … Generate and Emit @phennex transmit kaspernissen.xyz Collect, Convert, Process, Route, Export transmit Inspired by visualizations from LFS148 Store & Analyze
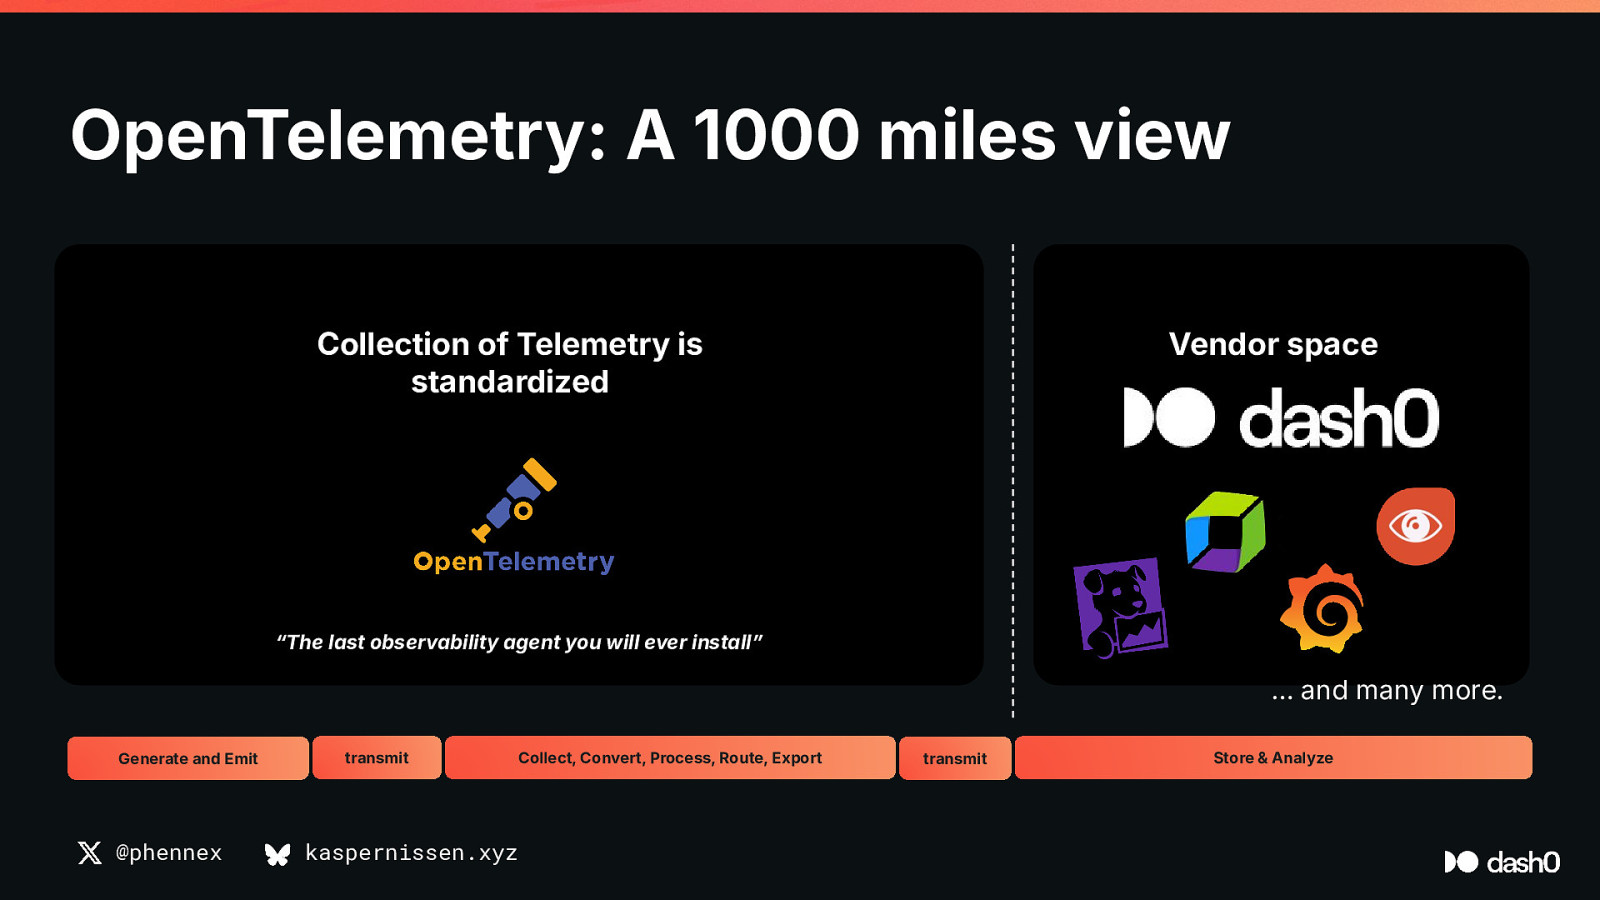
OpenTelemetry: A 1000 miles view OTel API & SDK auto-instrumentation Vendor space Collection of Telemetry is The OpenTelemetry Collector standardized … Receive Process Export Infrastructure Kubernetes … “The last observability agent you will ever installˮ … and many more. Generate and Emit @phennex transmit kaspernissen.xyz Collect, Convert, Process, Route, Export transmit Store & Analyze
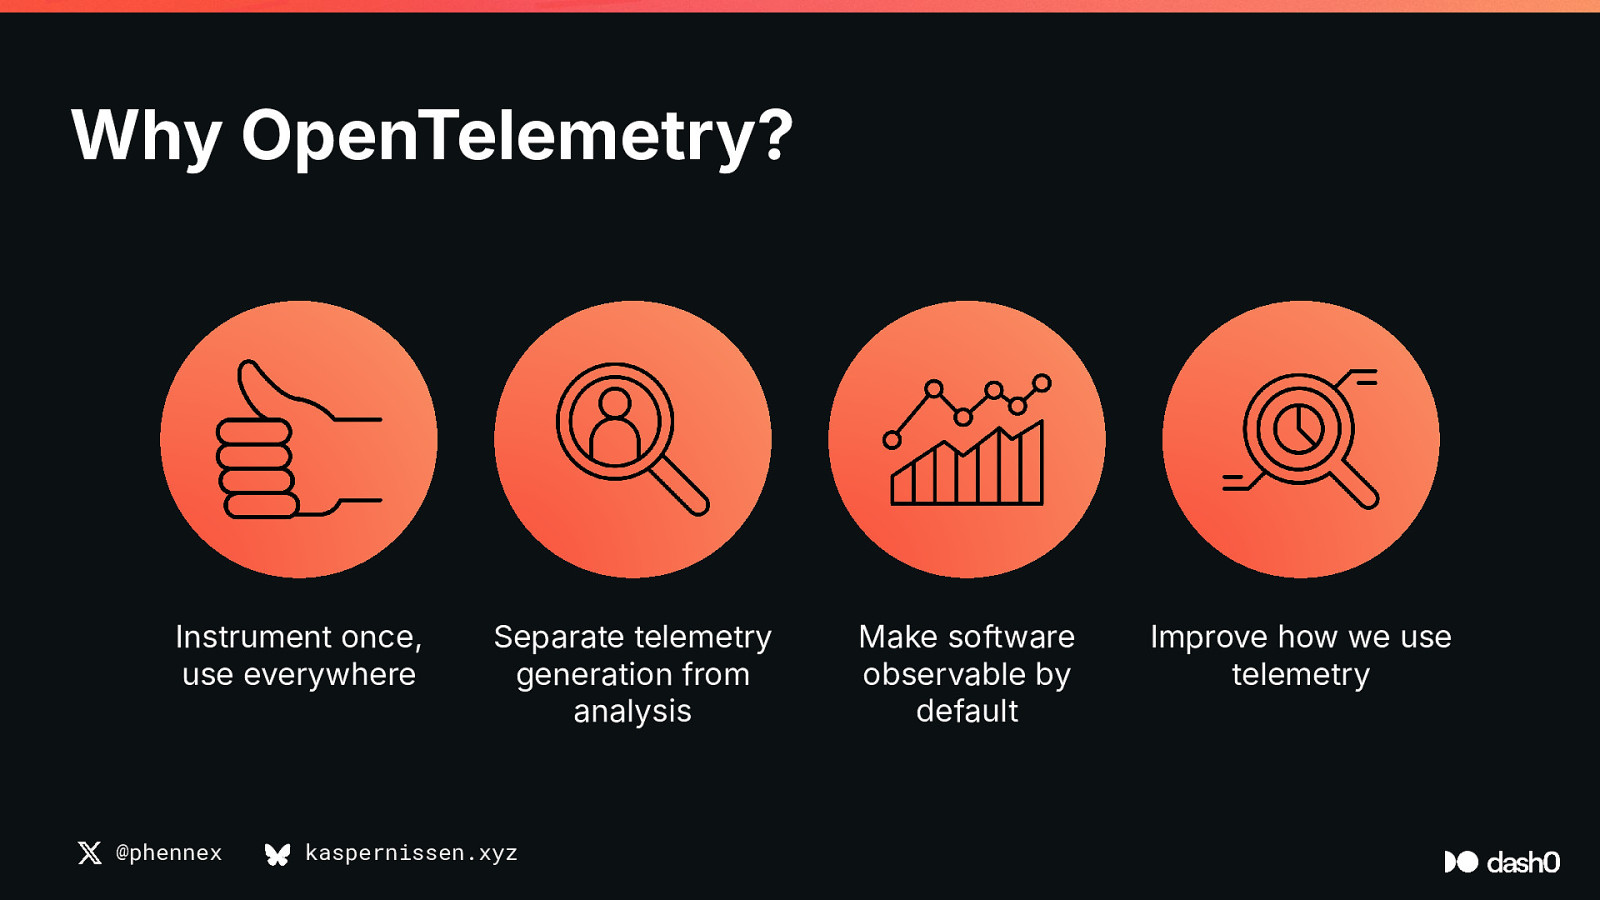
Why OpenTelemetry? Instrument once, use everywhere @phennex Separate telemetry generation from analysis kaspernissen.xyz Make software observable by default Improve how we use telemetry
Why Debugging OpenTelemetry Matters OpenTelemetry is powerful Easy to misconfigure Silent failures Debugging skills @phennex kaspernissen.xyz … but complex … hard to diagnose … equals missing signals … equals reliable observability
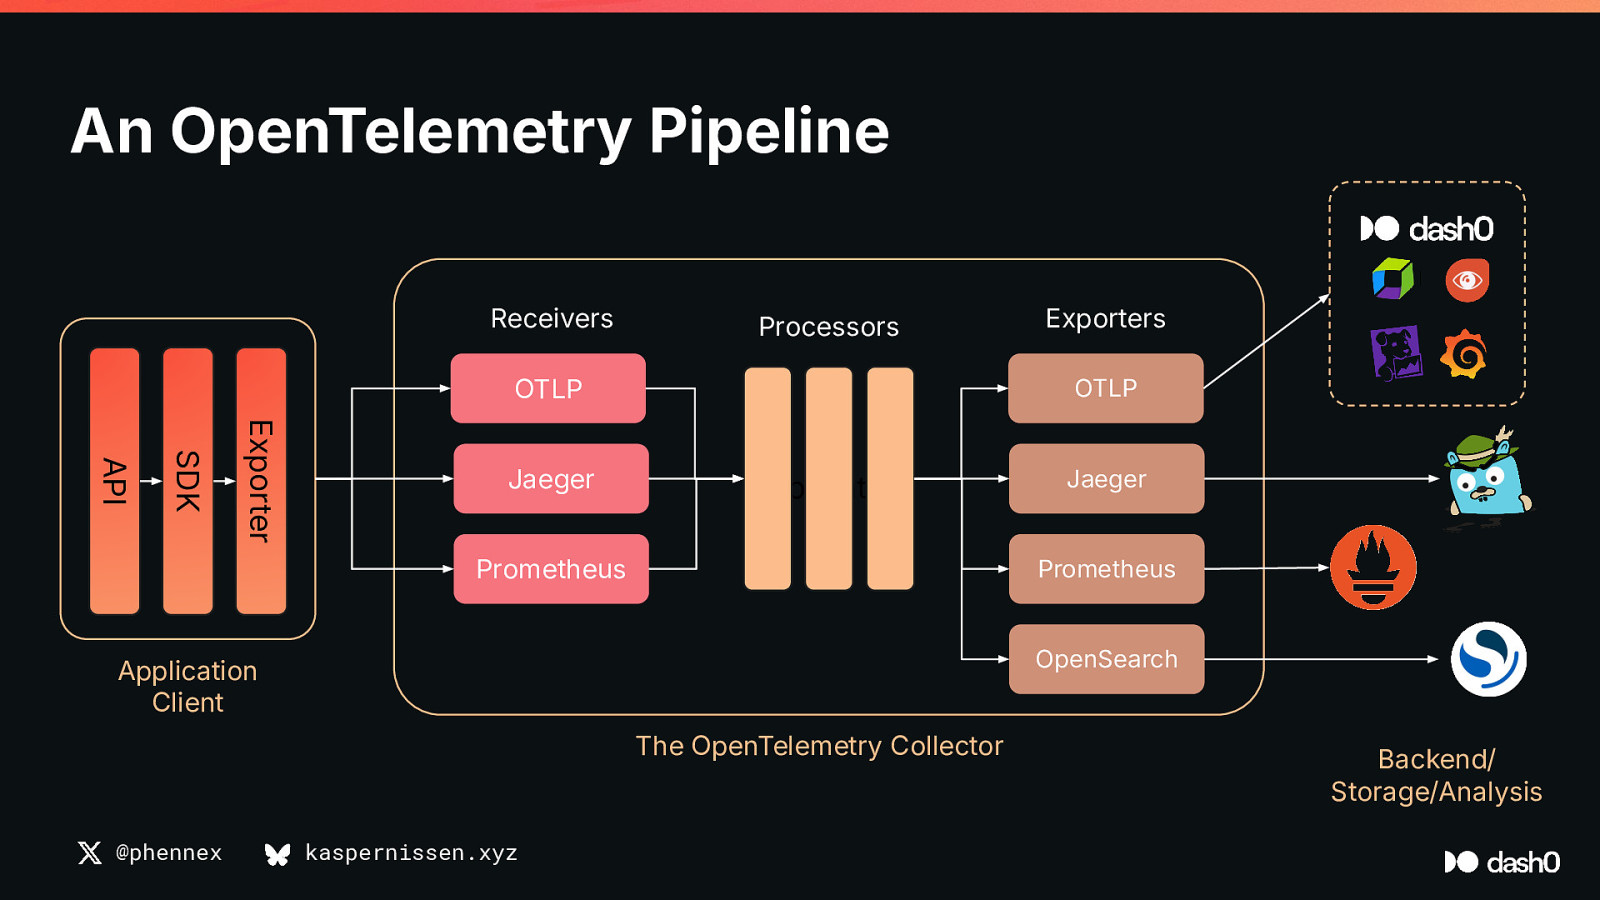
An OpenTelemetry Pipeline Receivers Processors OTLP Exporter SDK API Jaeger OTLP Application Prometheus Jaeger Prometheus OpenSearch Application Client The OpenTelemetry Collector @phennex Exporters kaspernissen.xyz Backend/ Storage/Analysis
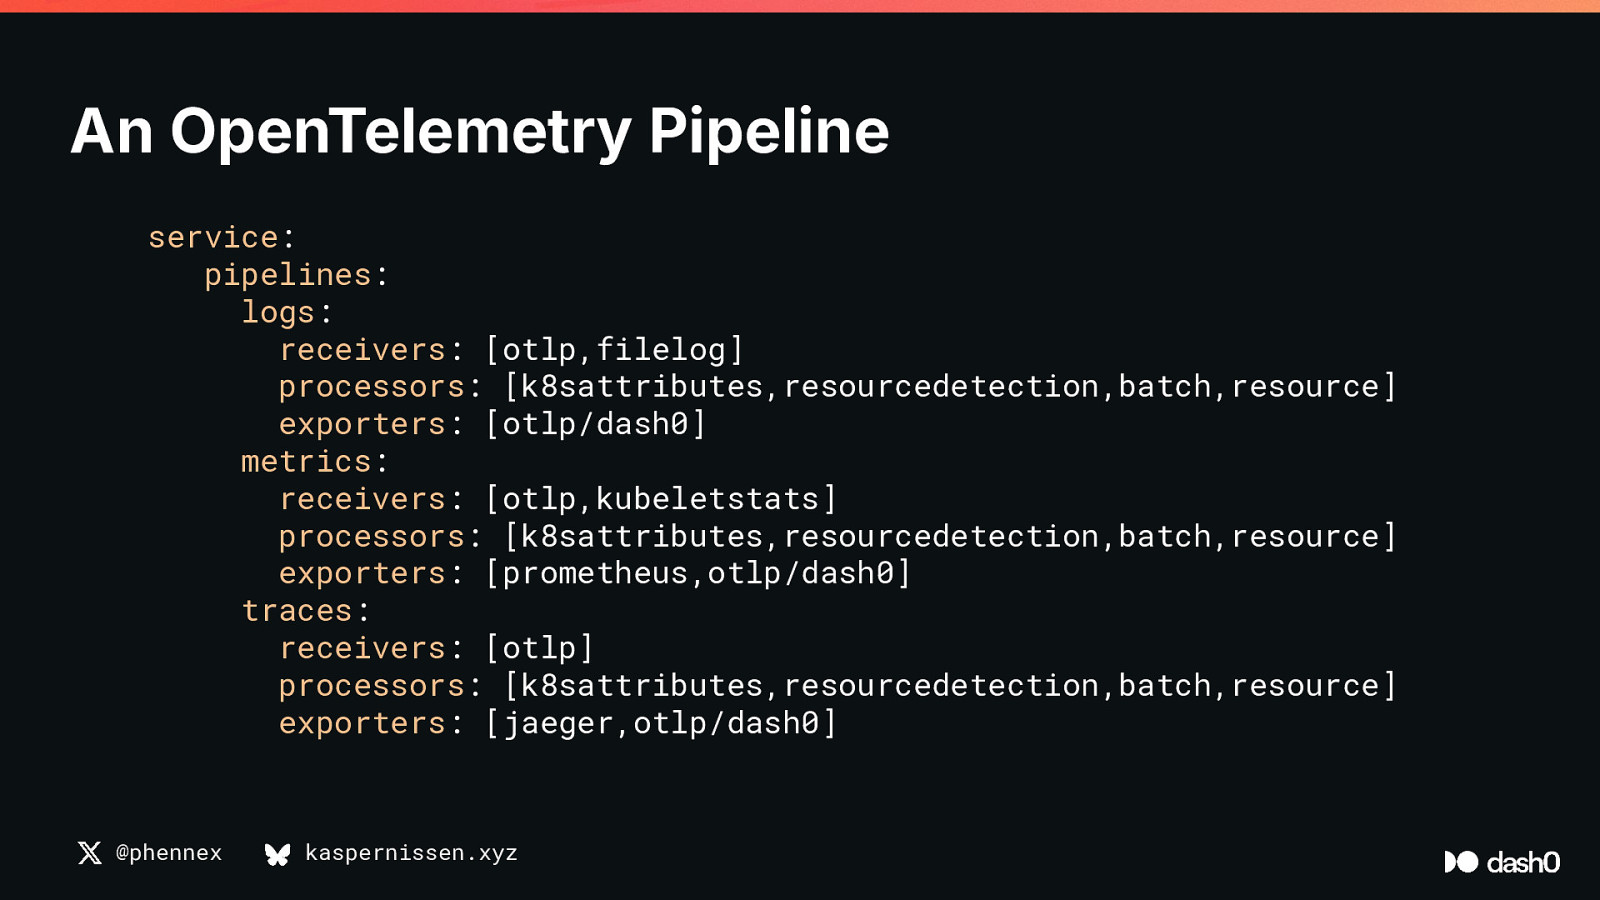
An OpenTelemetry Pipeline service: pipelines: logs: receivers: [otlp,filelog] processors: [k8sattributes,resourcedetection,batch,resource] exporters: [otlp/dash0] metrics: receivers: [otlp,kubeletstats] processors: [k8sattributes,resourcedetection,batch,resource] exporters: [prometheus,otlp/dash0] traces: receivers: [otlp] processors: [k8sattributes,resourcedetection,batch,resource] exporters: [jaeger,otlp/dash0] @phennex kaspernissen.xyz
Part 2 Common Pitfalls @phennex kaspernissen.xyz
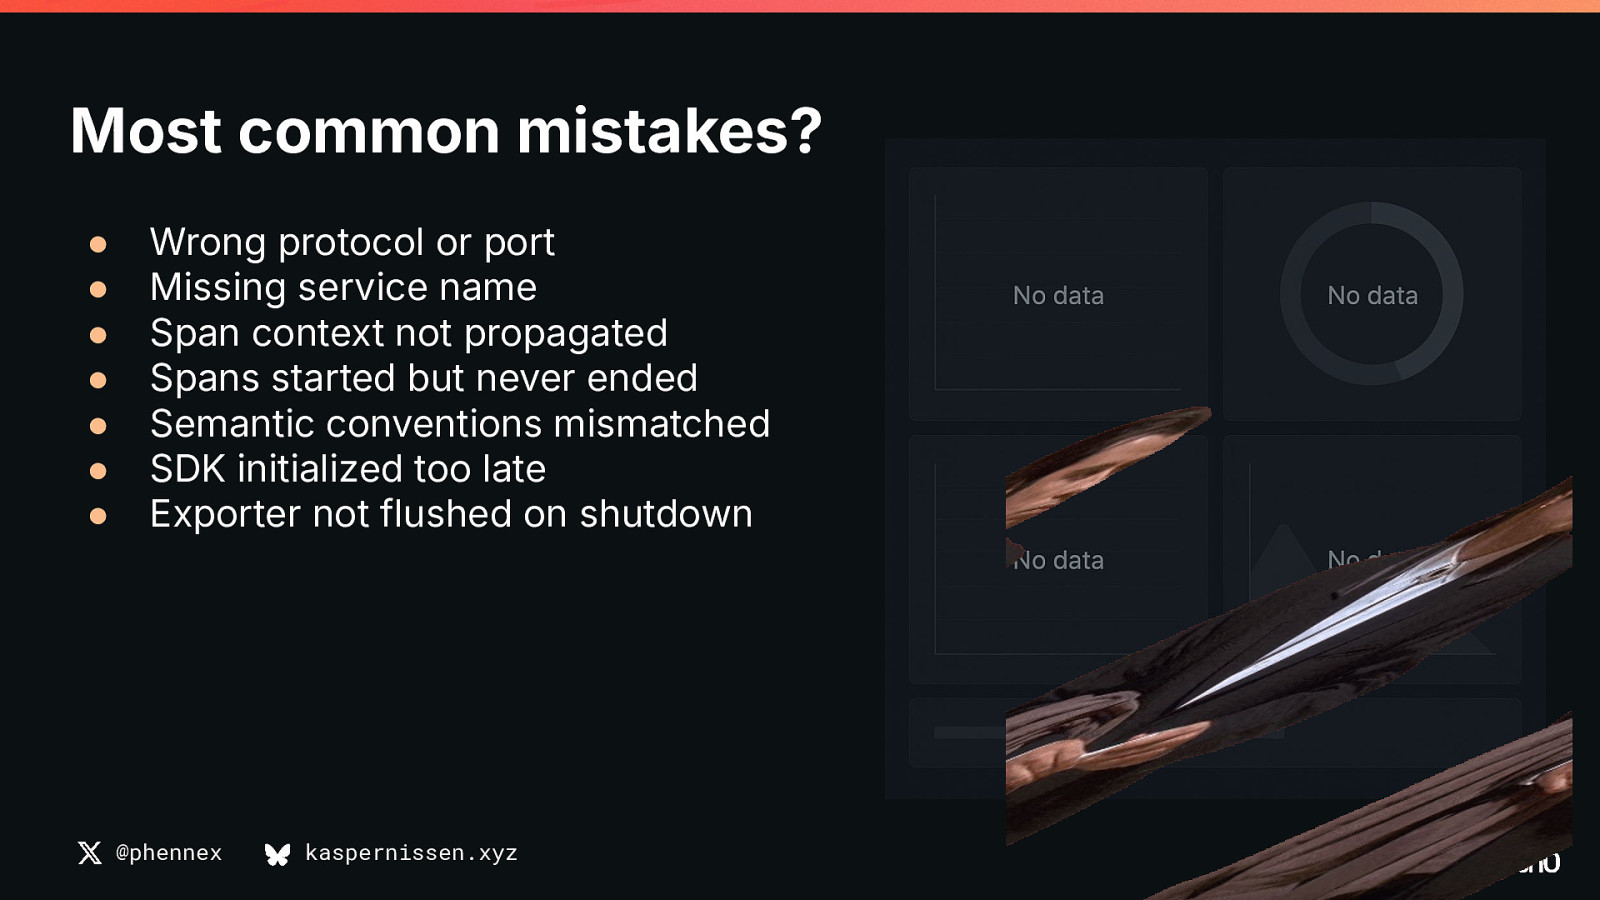
Most common mistakes? ● ● ● ● ● ● ● Wrong protocol or port Missing service name Span context not propagated Spans started but never ended Semantic conventions mismatched SDK initialized too late Exporter not flushed on shutdown @phennex kaspernissen.xyz
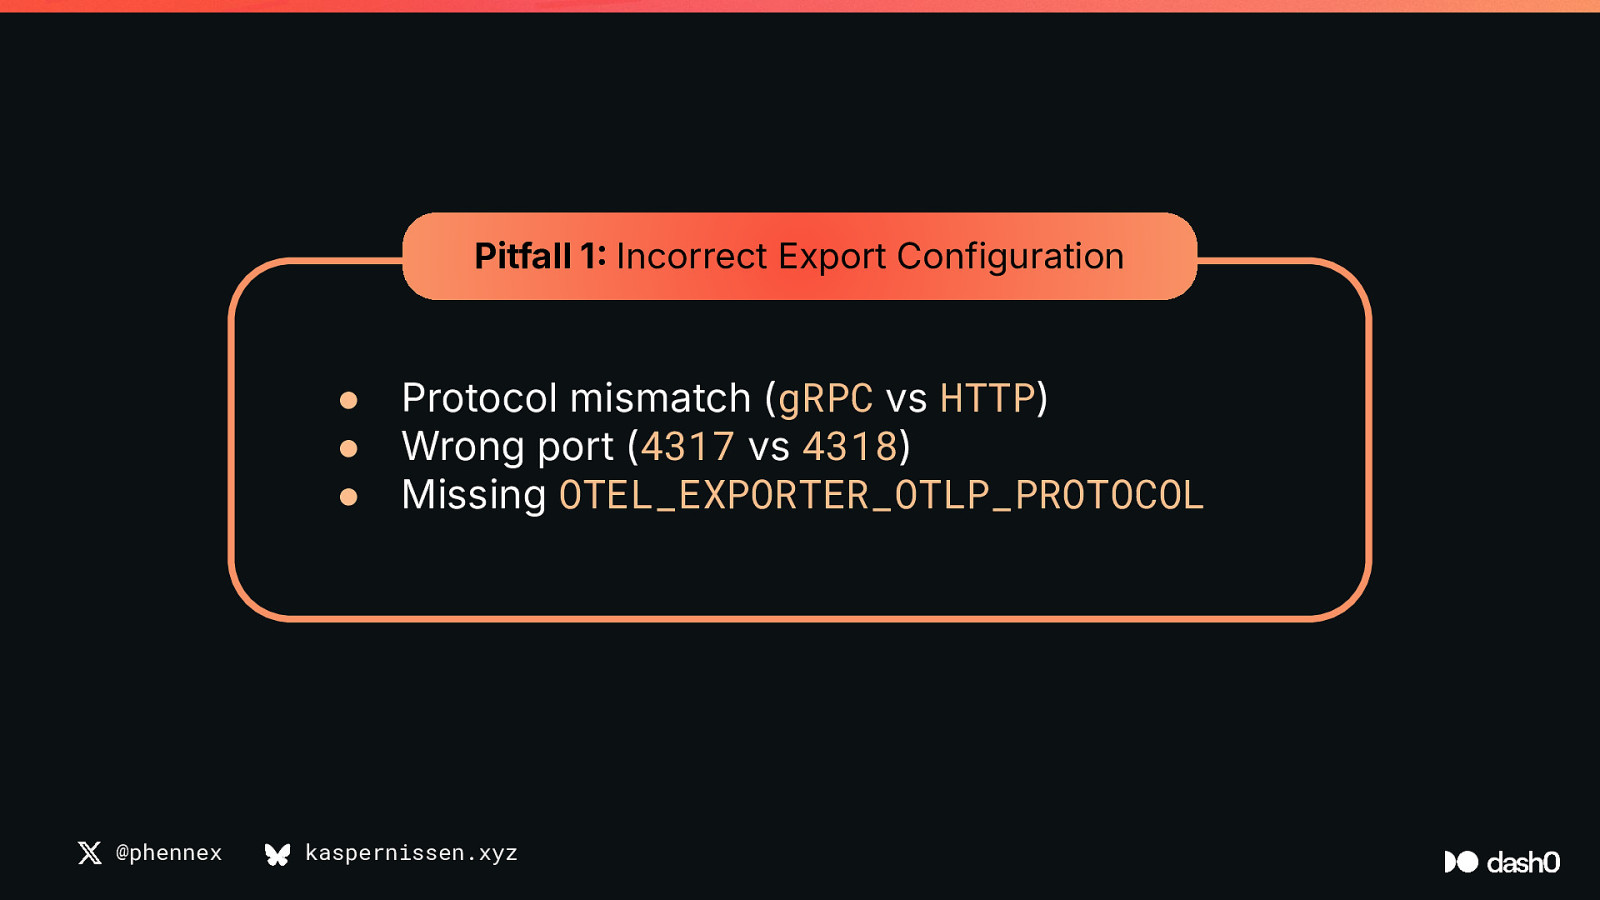
Pitfall 1 Incorrect Export Configuration ● ● ● @phennex Protocol mismatch (gRPC vs HTTP) Wrong port (4317 vs 4318) Missing OTEL_EXPORTER_OTLP_PROTOCOL kaspernissen.xyz
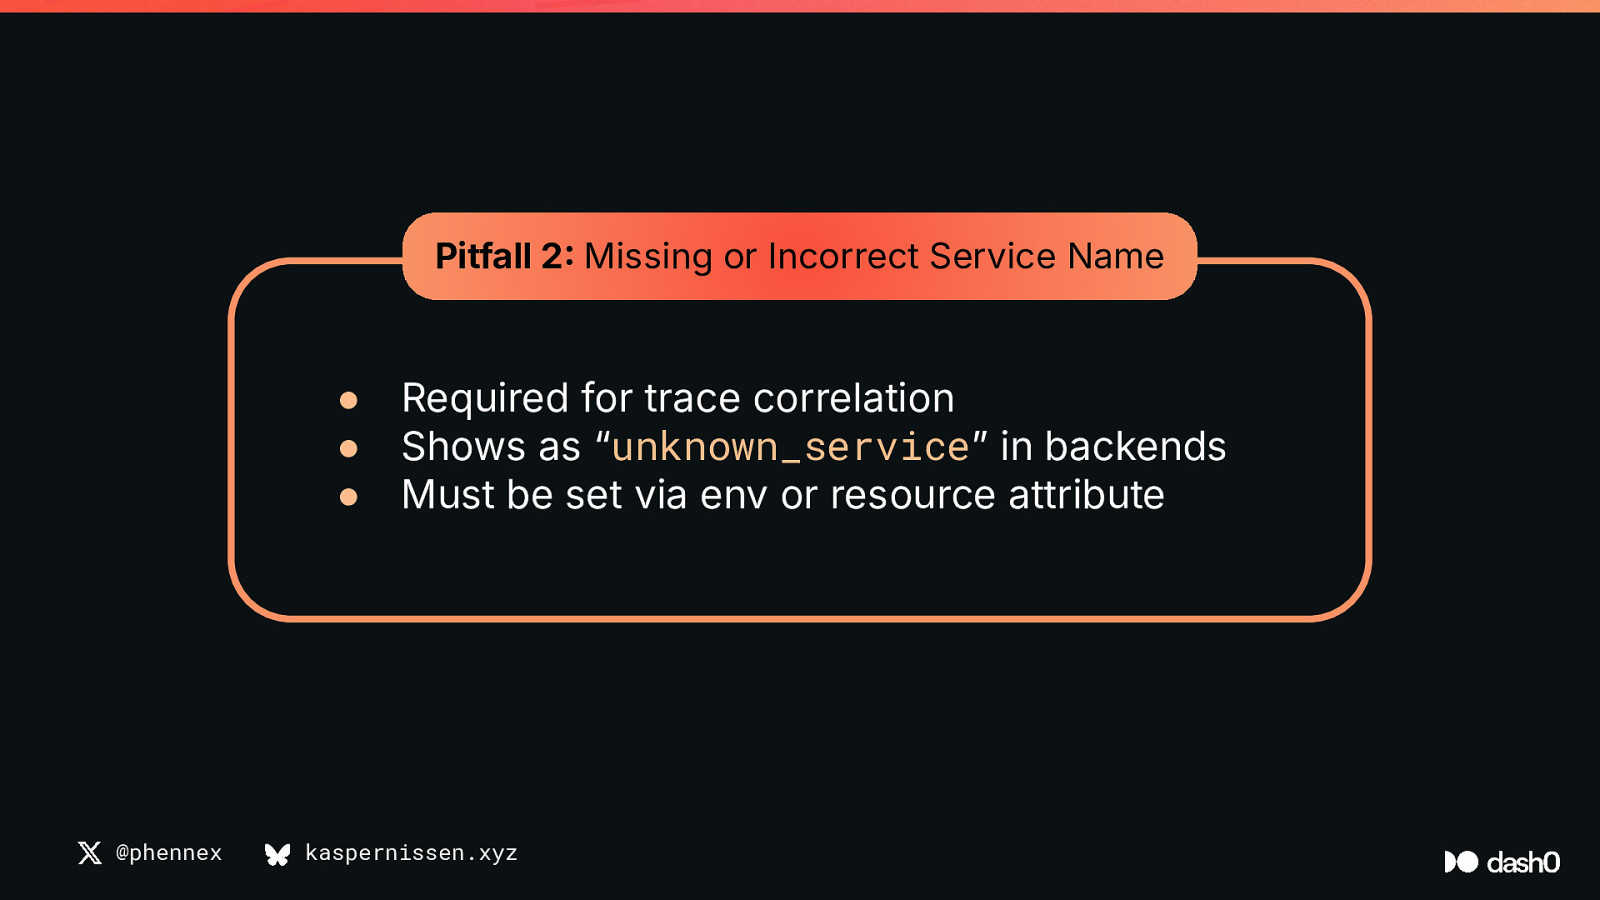
Pitfall 2 Missing or Incorrect Service Name ● ● ● @phennex Required for trace correlation Shows as “unknown_serviceˮ in backends Must be set via env or resource attribute kaspernissen.xyz
Pitfall 3 Context Propagation Issues ● ● ● @phennex New span started outside parent context Go: forgot to pass context Leads to orphan spans or broken traces kaspernissen.xyz
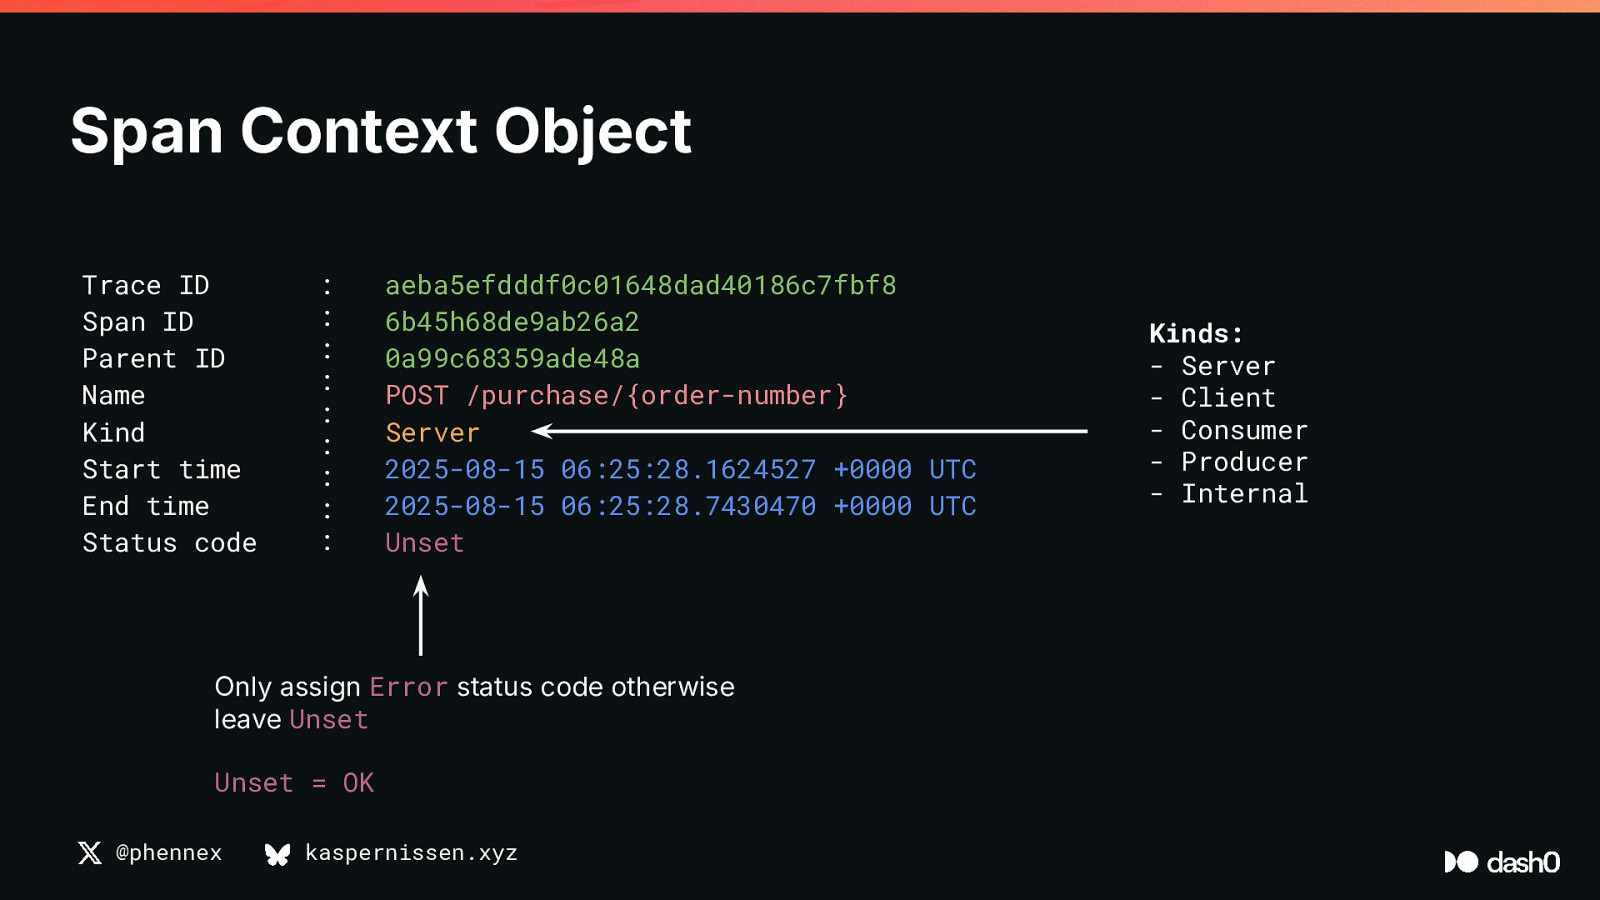
Span Context Object Trace ID Span ID Parent ID Name Kind Start time End time Status code : : : : : : : : : aeba5efdddf0c01648dad40186c7fbf8 6b45h68de9ab26a2 0a99c68359ade48a POST /purchase/{order-number} Server 2025-08-15 06:25:28.1624527 +0000 UTC 2025-08-15 06:25:28.7430470 +0000 UTC Unset Only assign Error status code otherwise leave Unset Unset = OK @phennex kaspernissen.xyz Kinds: - Server - Client - Consumer - Producer - Internal
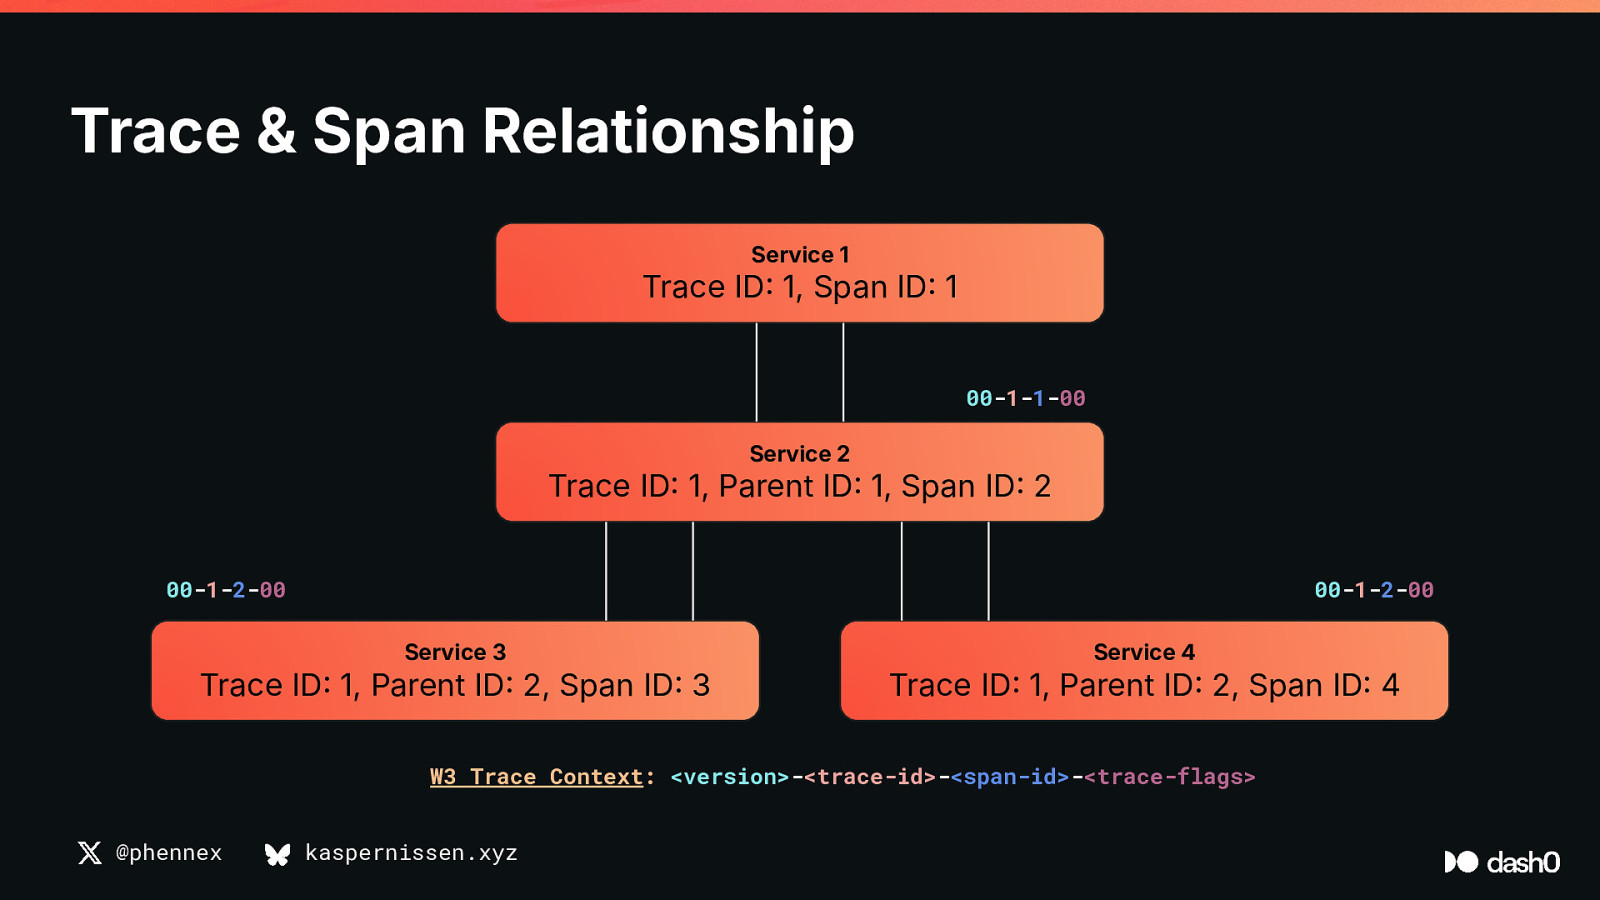
Trace & Span Relationship Service 1 Trace ID 1, Span ID 1 00-1-1-00 Service 2 Trace ID 1, Parent ID 1, Span ID 2 00-1-2-00 00-1-2-00 Service 3 Trace ID 1, Parent ID 2, Span ID 3 Service 4 Trace ID 1, Parent ID 2, Span ID 4 W3 Trace Context: <version>-<trace-id>-<span-id>-<trace-flags> @phennex kaspernissen.xyz
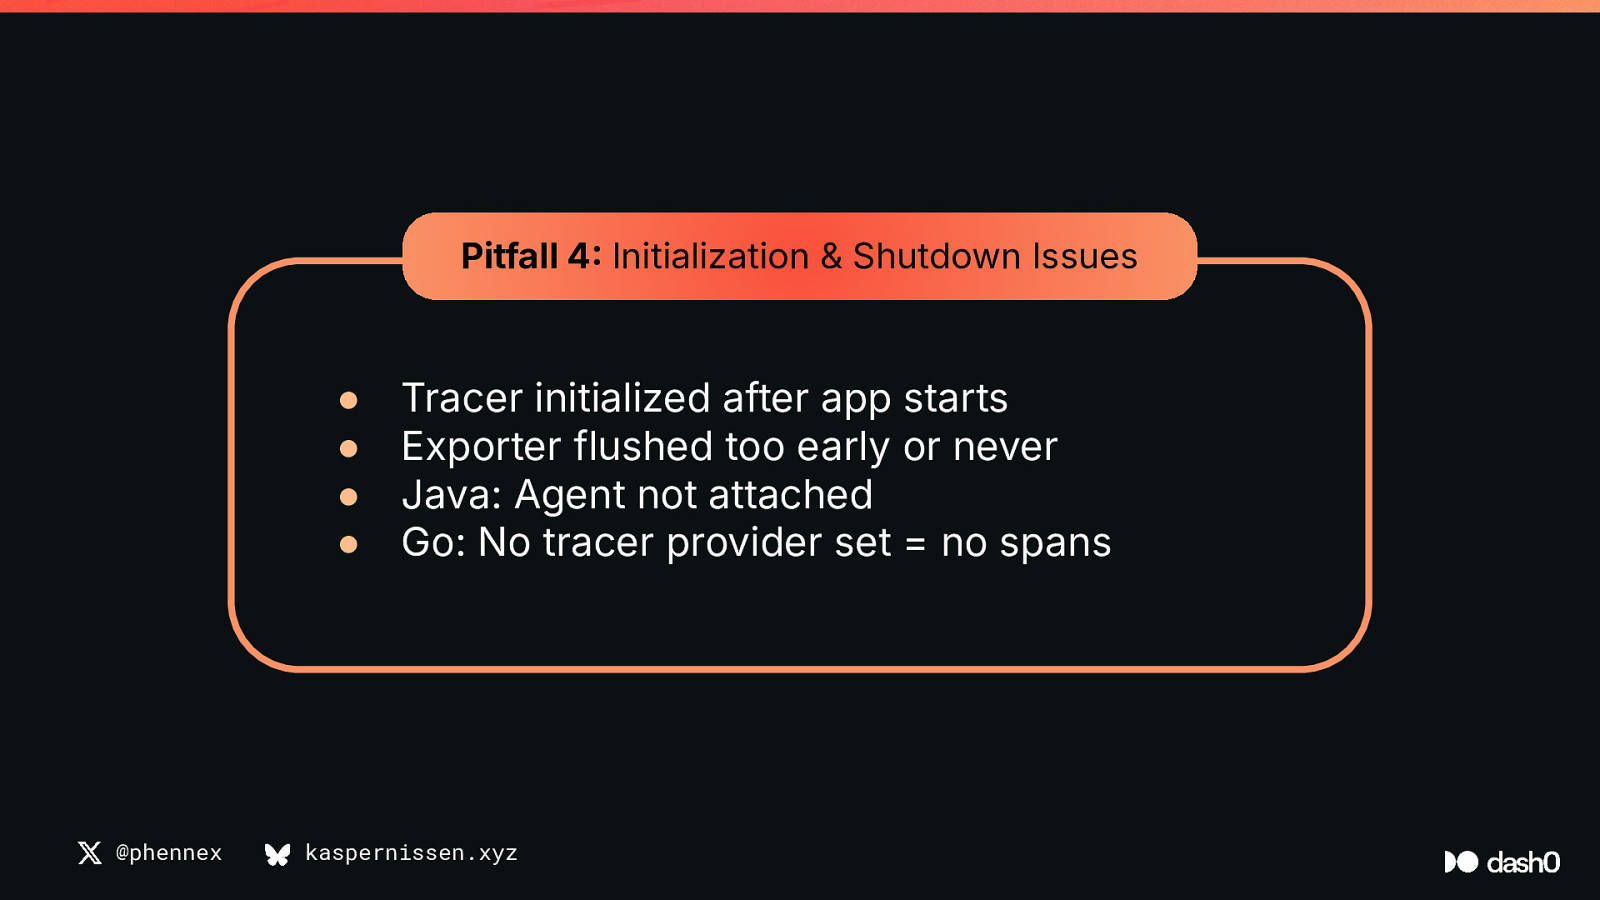
Pitfall 4 Initialization & Shutdown Issues ● ● ● ● @phennex Tracer initialized after app starts Exporter flushed too early or never Java: Agent not attached Go: No tracer provider set = no spans kaspernissen.xyz
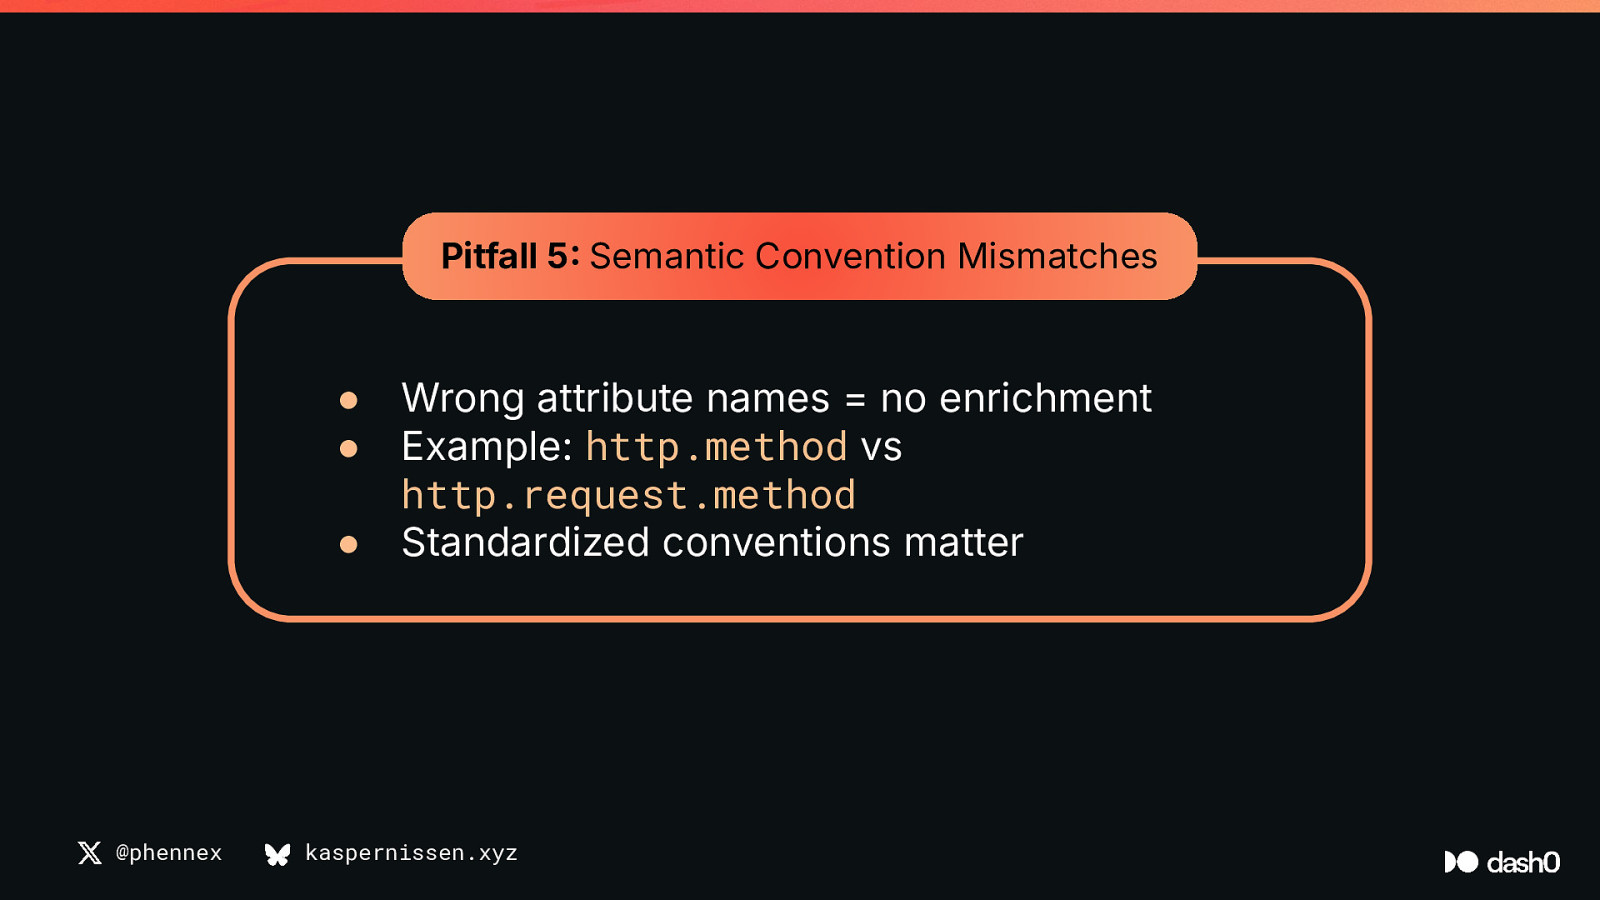
Pitfall 5 Semantic Convention Mismatches ● ● ● @phennex Wrong attribute names = no enrichment Example: http.method vs http.request.method Standardized conventions matter kaspernissen.xyz
Part 3 Language Specific Challenges @phennex kaspernissen.xyz
Java Auto-instrumentation with the Java Agent. 1. Java agent setup via JVM flag: -javaagent 2. Bytecode manipulation via java.lang.instrument.Instrumentation API to modify the bytecode of classes at load time 3. Auto-detect and replies relevant instrumentation modules from frameworks/libraries 4. Context Propagation via OpenTelemetryʼs Context Propagation APIs (injects/extracts context from e.g. HTTP headers (traceparent) 5. Instrumentation behavior is configured using environment variables or a otel.properties file 6. Exporting data via the configured exporters (defaults to OTLP http/protobuf to localhost:4318) @phennex kaspernissen.xyz Code Java Agent Application
Demo
Tea Ceremony Tracer ☕ A small Spring Boot web application that serves a /tea endpoint returning a random Japanese tea type and temperature.
@phennex
kaspernissen.xyz
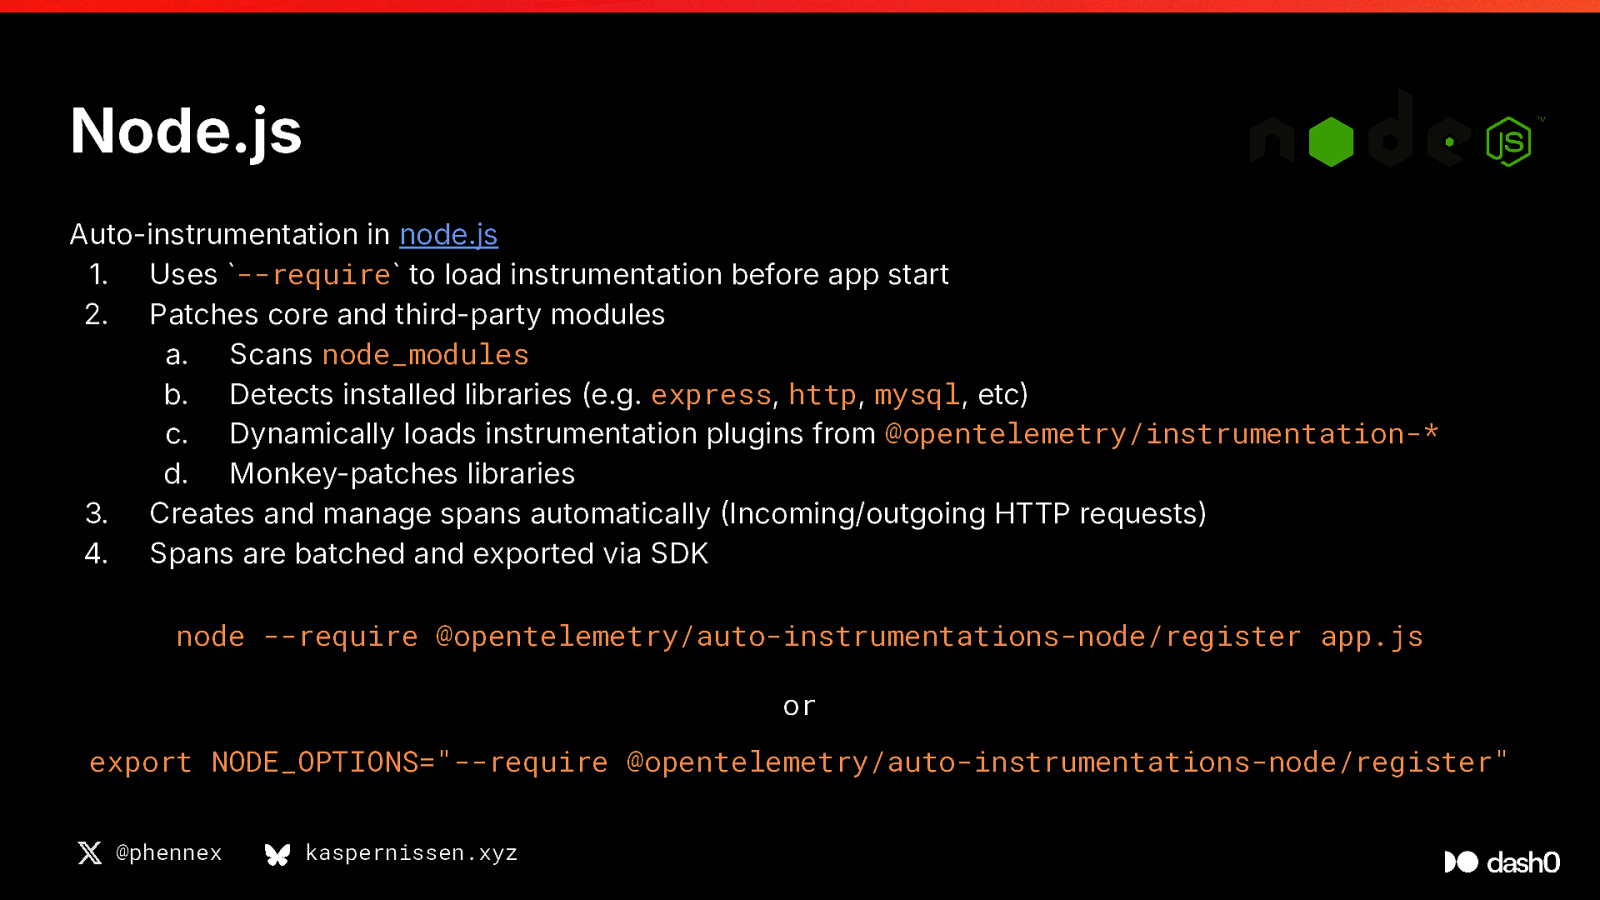
Node.js Auto-instrumentation in node.js 1. Uses --require to load instrumentation before app start 2. Patches core and third-party modules a. Scans node_modules b. Detects installed libraries (e.g. express, http, mysql, etc) c. Dynamically loads instrumentation plugins from @opentelemetry/instrumentation-* d. Monkey-patches libraries 3. Creates and manage spans automatically Incoming/outgoing HTTP requests) 4. Spans are batched and exported via SDK node —require @opentelemetry/auto-instrumentations-node/register app.js or export NODE_OPTIONS=”—require @opentelemetry/auto-instrumentations-node/register” @phennex
kaspernissen.xyz
Demo
Ramen Ratings API 🍜 A lightweight Express application that serves a /ramen endpoint returning a random ramen type and a rating between 0–5.
@phennex
kaspernissen.xyz
Go Manual Instrumentation 1. Import otel, sdk/trace, otlptracegrpc, etc 2. Create and set a TraceProvider 3. Use tracer.Start(ctx, “name”) + defer span.End() 4. Setup and flush your exporter (otlp, stdout,etc.) @phennex kaspernissen.xyz
Demo
Sakura Stats Service 🌸 A minimal HTTP service in Go that exposes a /sakura endpoint returning fictional cherry blossom bloom data.
@phennex
kaspernissen.xyz
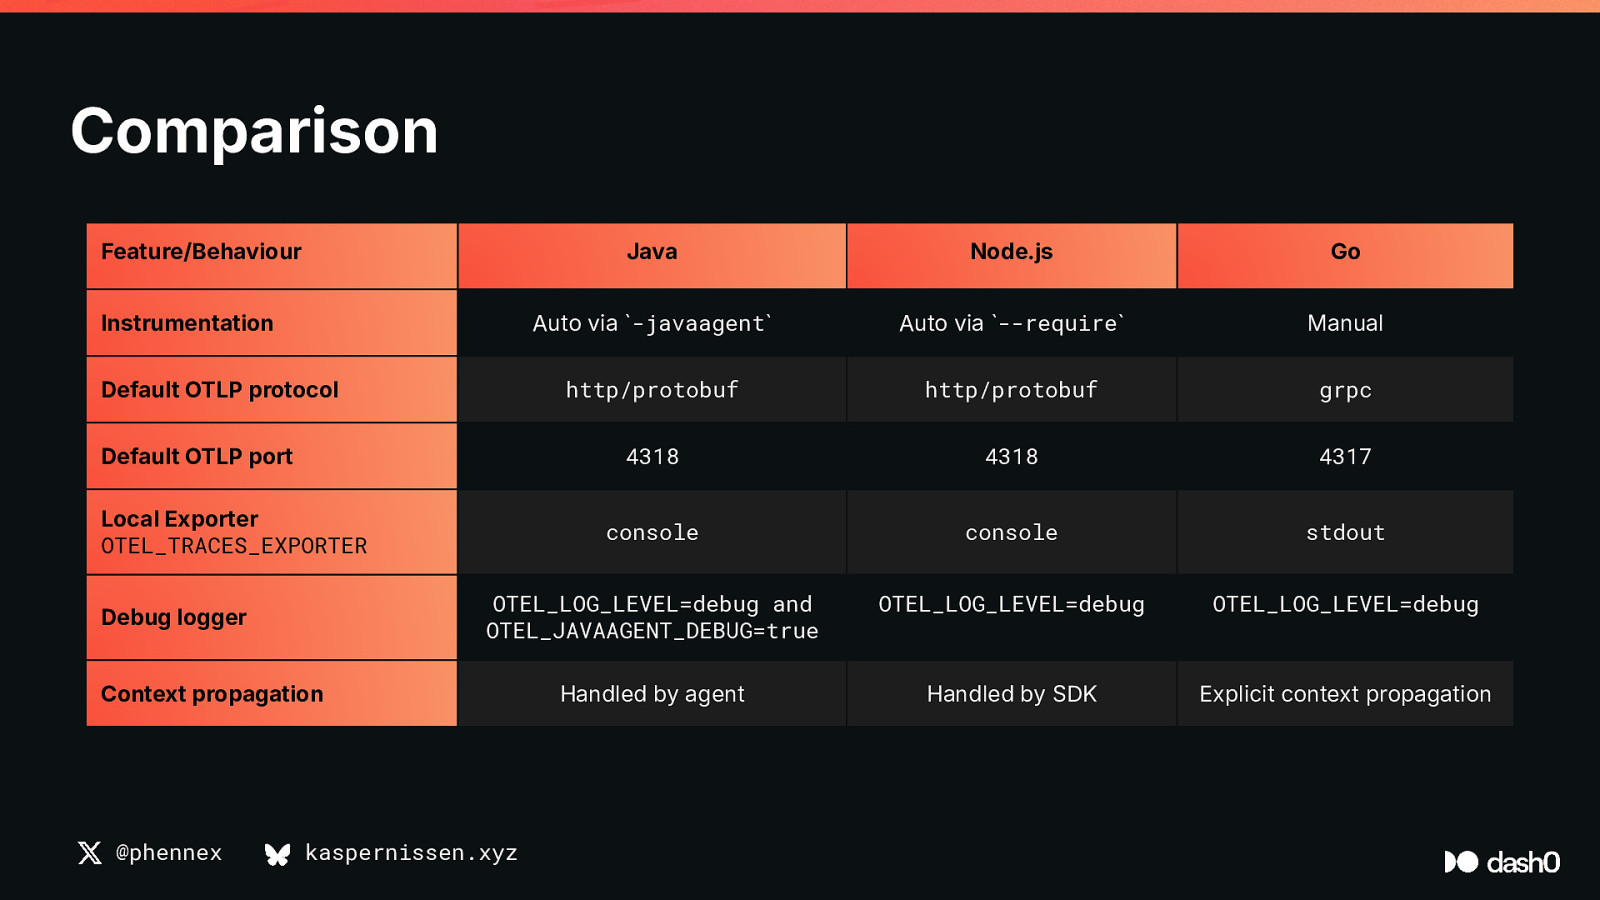
Comparison Feature/Behaviour
Java
Node.js
Go
Auto via -javaagent
Auto via --require
Manual
http/protobuf
http/protobuf
grpc
4318
4318
4317
console
console
stdout
OTEL_LOG_LEVEL=debug and OTEL_JAVAAGENT_DEBUG=true
OTEL_LOG_LEVEL=debug
OTEL_LOG_LEVEL=debug
Handled by agent
Handled by SDK
Explicit context propagation
Instrumentation Default OTLP protocol Default OTLP port Local Exporter OTEL_TRACES_EXPORTER Debug logger Context propagation
@phennex
kaspernissen.xyz
Part 4 Best Practices & Tools @phennex kaspernissen.xyz
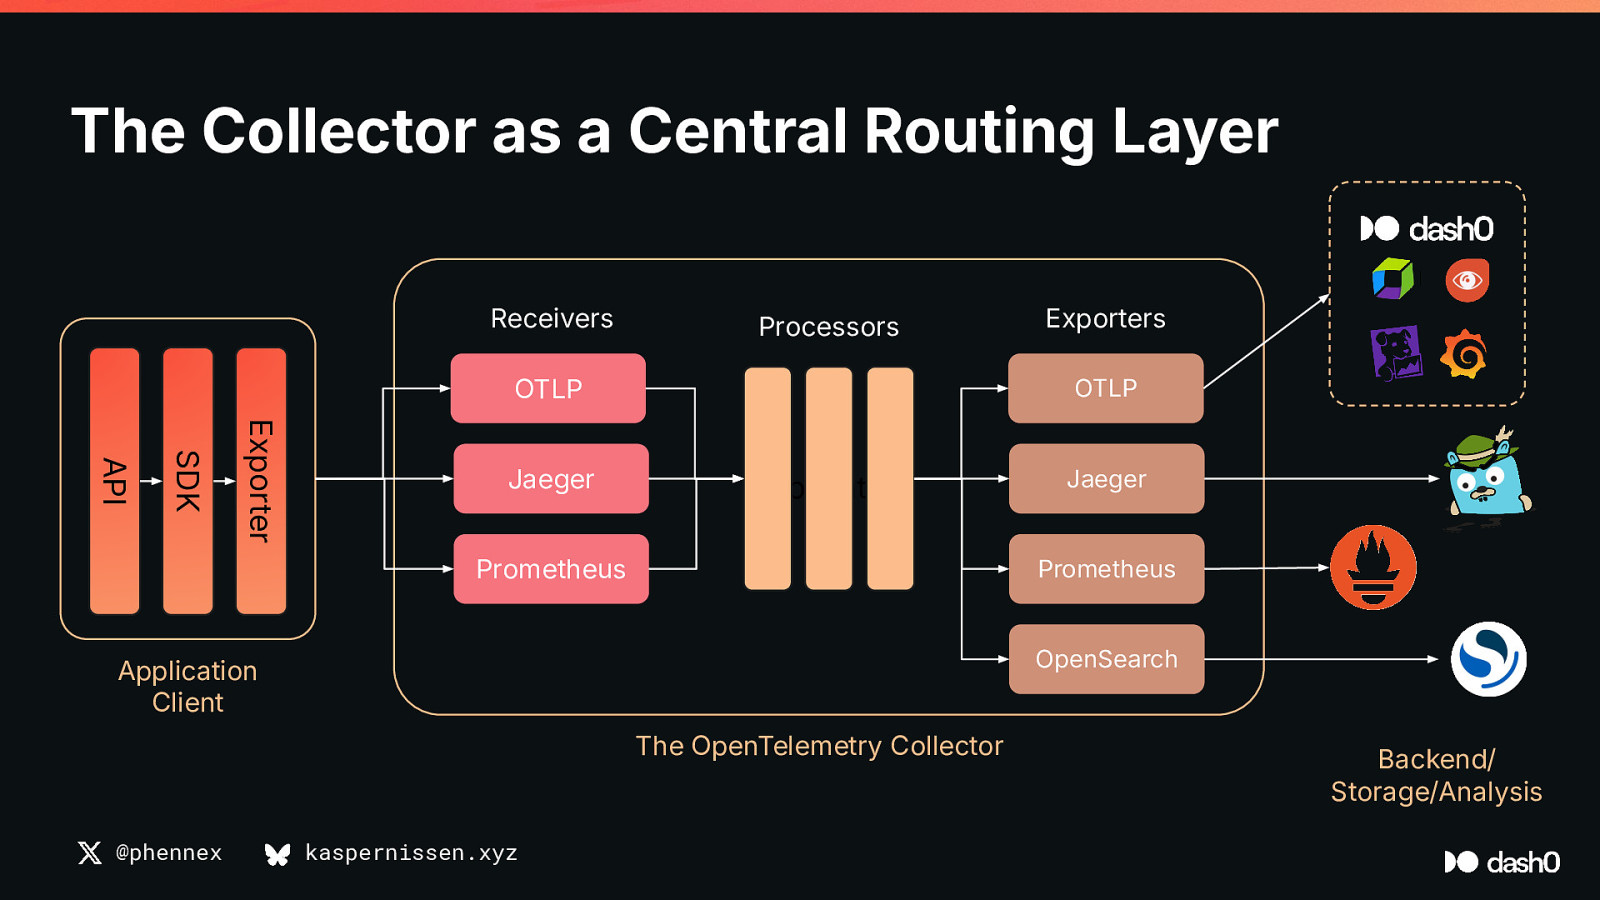
The Collector as a Central Routing Layer Receivers Processors OTLP Exporter SDK API Jaeger OTLP Application Prometheus Jaeger Prometheus OpenSearch Application Client The OpenTelemetry Collector @phennex Exporters kaspernissen.xyz Backend/ Storage/Analysis
Checklist ✅ ✅ ✅ ✅ ✅ ✅ ✅ Match protocol + port Set service name Initialize SDK early End all spans Use debug + console exporters Watch semantic conventions Always test with a local collector @phennex kaspernissen.xyz
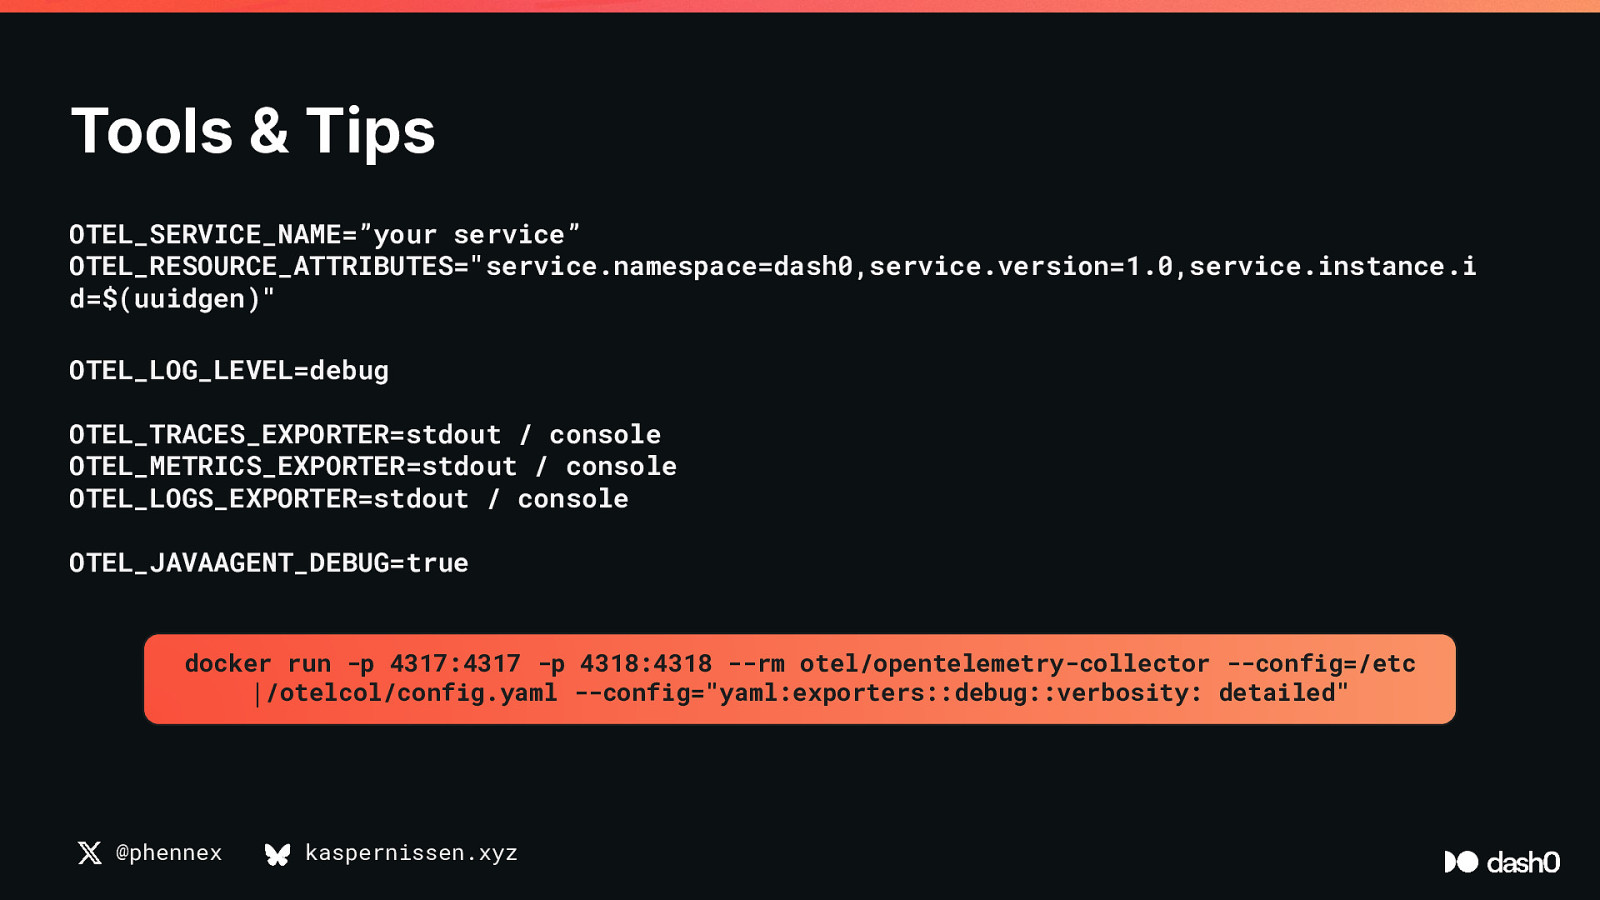
Tools & Tips OTEL_SERVICE_NAME=”your service” OTEL_RESOURCE_ATTRIBUTES=”service.namespace=dash0,service.version=1.0,service.instance.i d=$(uuidgen)” OTEL_LOG_LEVEL=debug OTEL_TRACES_EXPORTER=stdout / console OTEL_METRICS_EXPORTER=stdout / console OTEL_LOGS_EXPORTER=stdout / console OTEL_JAVAAGENT_DEBUG=true docker run -p 4317:4317 -p 4318:4318 —rm otel/opentelemetry-collector —config=/etc │/otelcol/config.yaml —config=”yaml:exporters::debug::verbosity: detailed” @phennex kaspernissen.xyz
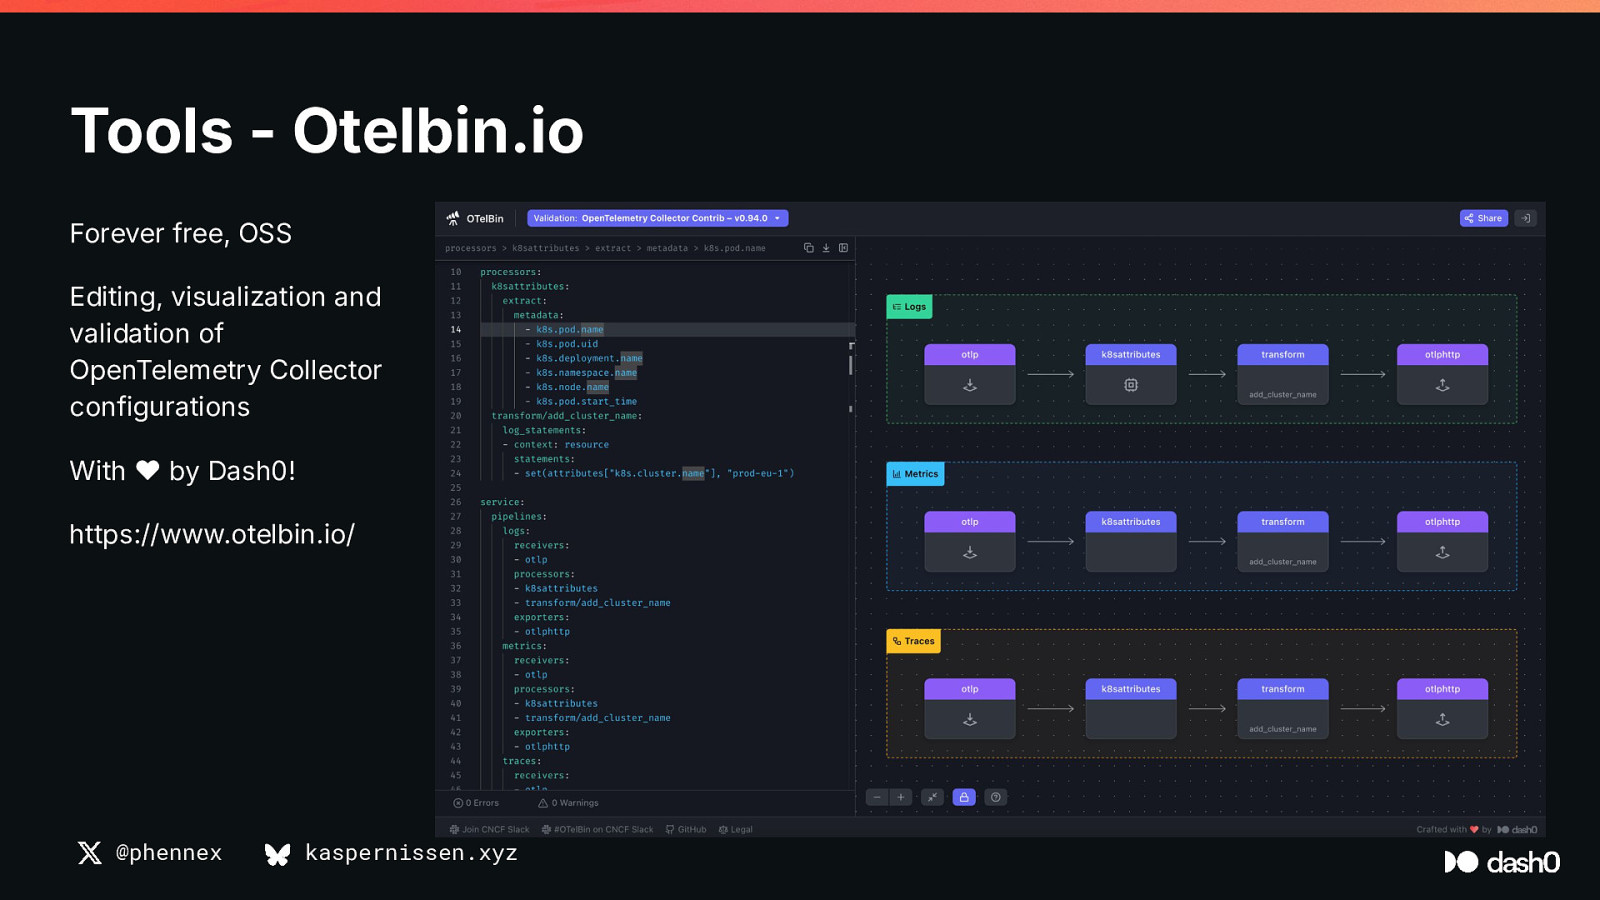
Tools - Otelbin.io Forever free, OSS Editing, visualization and validation of OpenTelemetry Collector configurations With ❤ by Dash0! https://www.otelbin.io/ @phennex kaspernissen.xyz
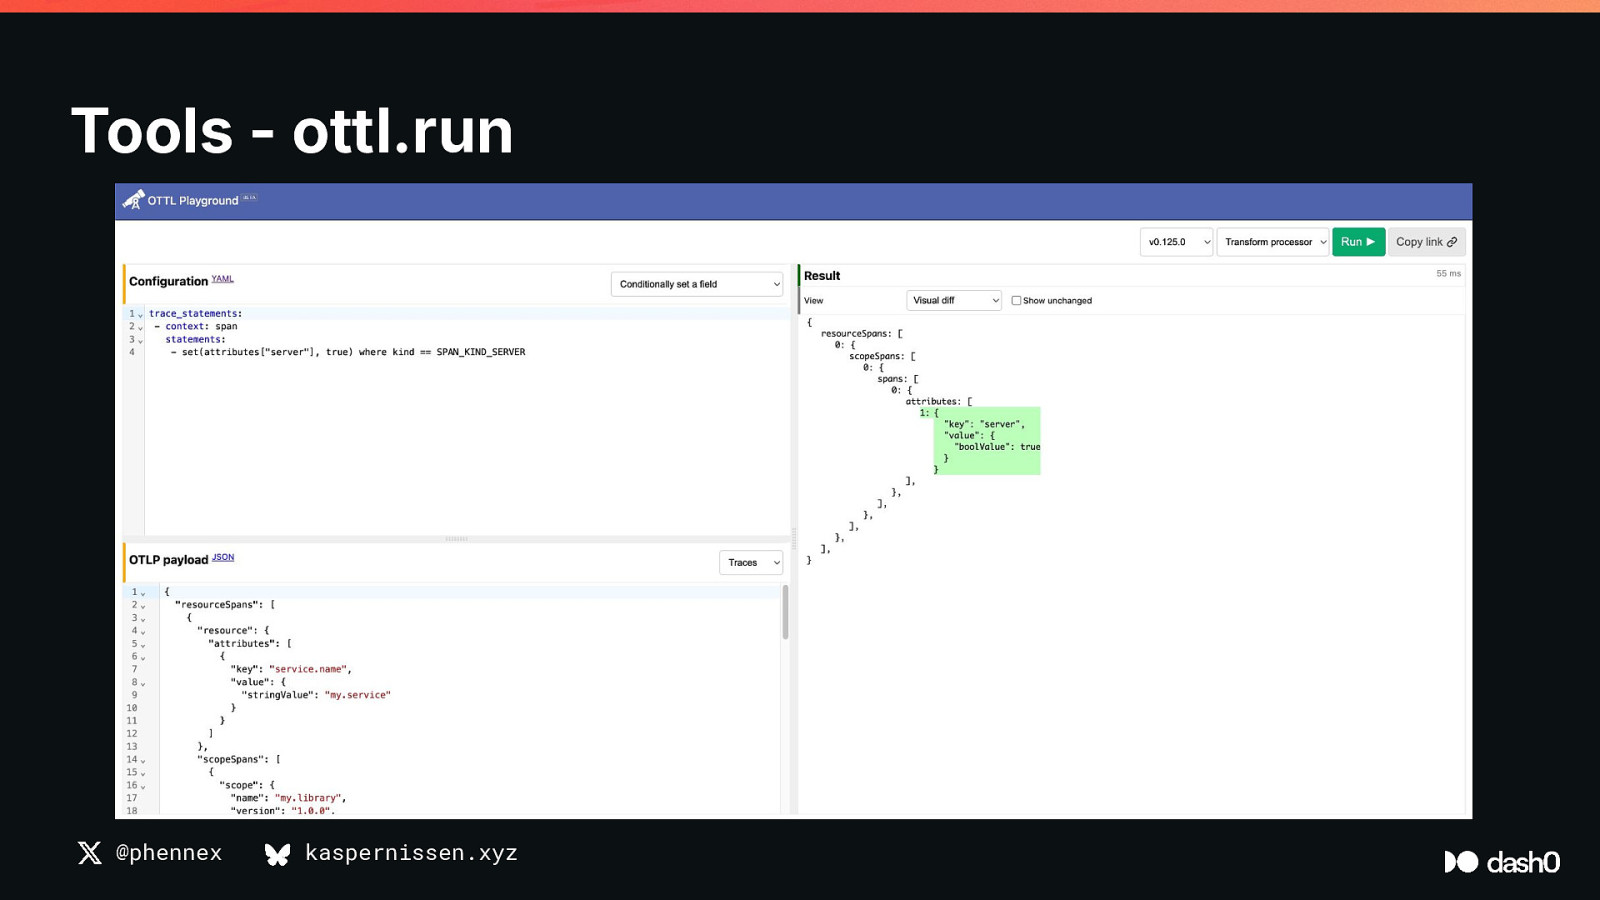
Tools - ottl.run @phennex kaspernissen.xyz
But, itʼs not just about getting the pipeline working… …itʼs about emitting good telemetry @phennex kaspernissen.xyz
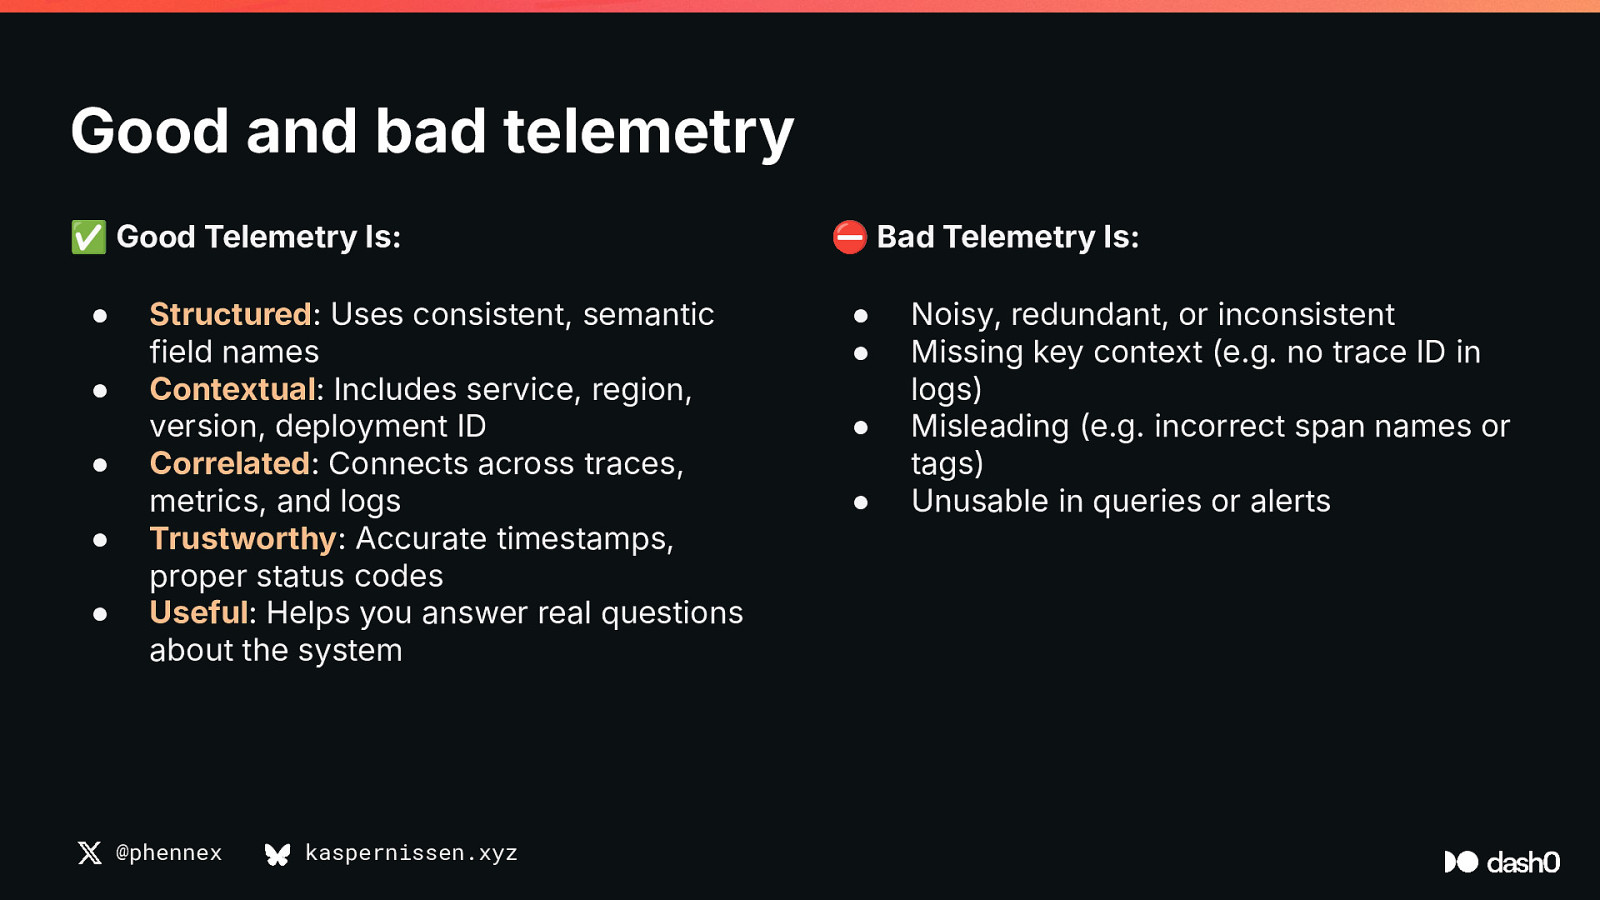
Good and bad telemetry ✅ Good Telemetry Is: ● ● ● ● ● Structured: Uses consistent, semantic field names Contextual: Includes service, region, version, deployment ID Correlated: Connects across traces, metrics, and logs Trustworthy: Accurate timestamps, proper status codes Useful: Helps you answer real questions about the system @phennex kaspernissen.xyz ⛔ Bad Telemetry Is: ● ● ● ● Noisy, redundant, or inconsistent Missing key context (e.g. no trace ID in logs) Misleading (e.g. incorrect span names or tags) Unusable in queries or alerts
“Telemetry without context is just dataˮ Michelle Mancioppi, Head of Product, Dash0 @phennex kaspernissen.xyz
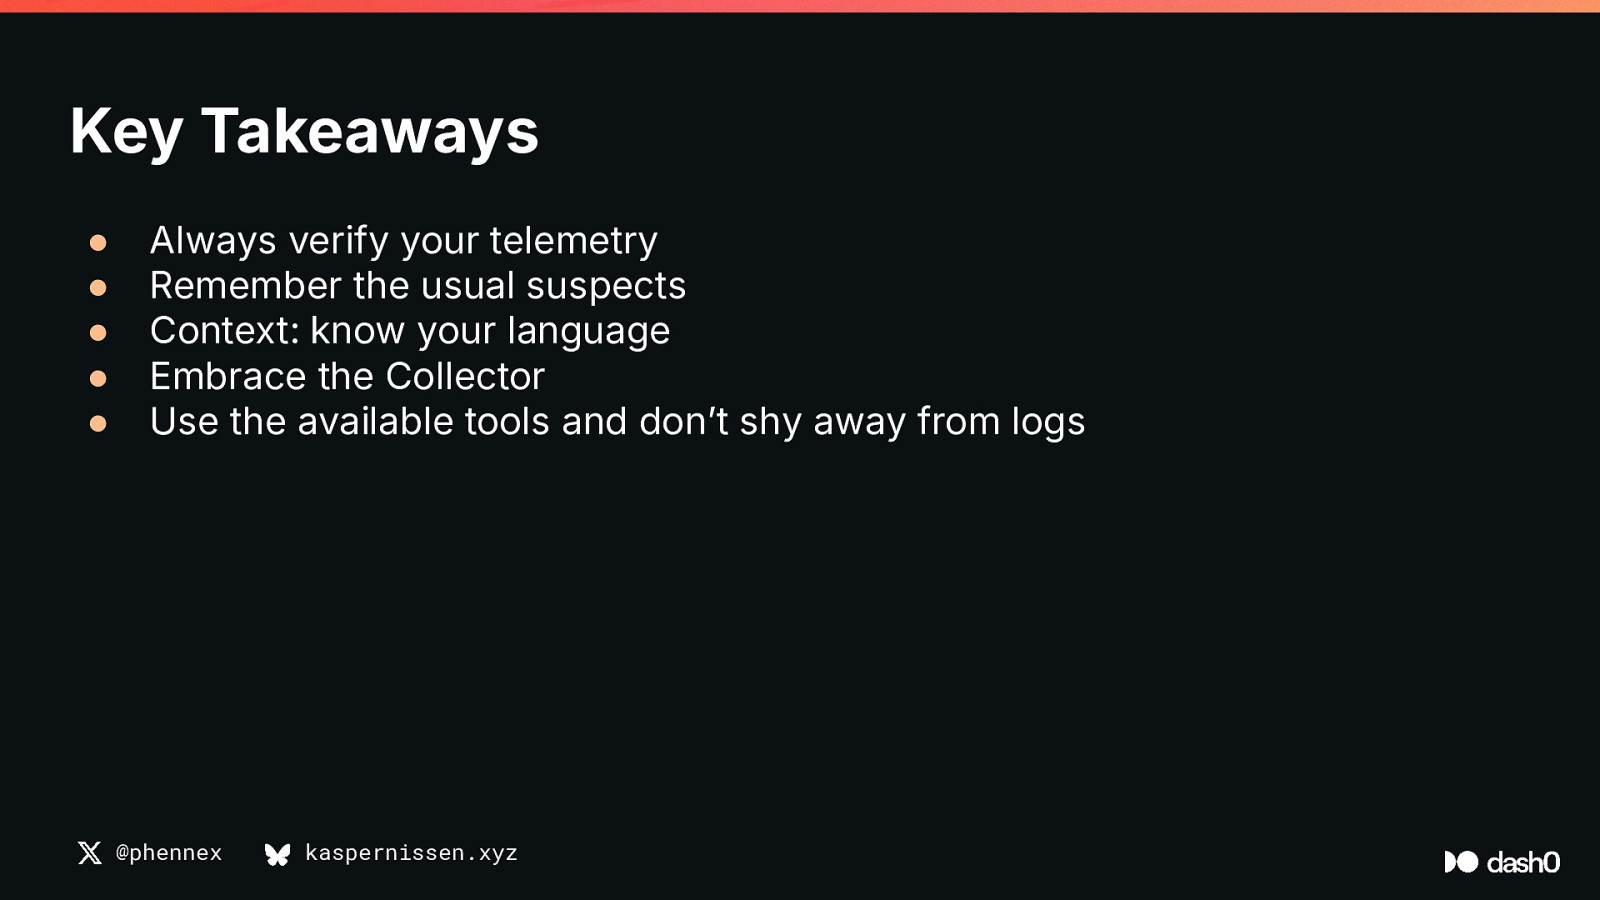
Key Takeaways ● ● ● ● ● Always verify your telemetry Remember the usual suspects Context: know your language Embrace the Collector Use the available tools and donʼt shy away from logs @phennex kaspernissen.xyz
Thank you! Get in touch! Stop by our booth and chat! Kasper Borg Nissen, Developer Advocate at @phennex kaspernissen.xyz
Abstract OpenTelemetry has become the go-to framework for unifying observability signals across metrics, logs, and traces. However, implementing OpenTelemetry often comes with its own set of challenges: broken instrumentation, missing signals, and misaligned semantic conventions that undermine its effectiveness. Debugging these issues can be daunting, leaving teams stuck with incomplete or unreliable observability data. In this session, Kasper will demystify the debugging process for OpenTelemetry. Attendees will learn how to identify and troubleshoot common issues, ensure signals are transferred correctly, and align instrumentation with semantic conventions for consistent insights. Through live demos, Kasper will showcase techniques for validating resource configurations, debugging signal pipelines, and building confidence in your observability setup. This session is designed for anyone looking to unlock the full potential of OpenTelemetry and create robust observability practices.

OpenTelemetry has become the go-to framework for unifying observability signals across metrics, logs, and traces. However, implementing OpenTelemetry often comes with its own set of challenges: broken instrumentation, missing signals, and misaligned semantic conventions that undermine its effectiveness. Debugging these issues can be daunting, leaving teams stuck with incomplete or unreliable observability data.
In this session, Kasper will demystify the debugging process for OpenTelemetry. Attendees will learn how to identify and troubleshoot common issues, ensure signals are transferred correctly, and align instrumentation with semantic conventions for consistent insights. Through live demos, Kasper will showcase techniques for validating resource configurations, debugging signal pipelines, and building confidence in your observability setup. This session is designed for anyone looking to unlock the full potential of OpenTelemetry and create robust observability practices.


 for free. You
can too.
for free. You
can too.