Introducting state machines and statecharts

A presentation at React Finland in September 2021 in Helsinki, Finland by Laura Kalbag

Slide 1

Slide 1

Introducing state machines and statecharts

By Laura Kalbag and Stately.

Hi, my name is Laura Kalbag, and today I’ll be introducing state charts and state machines. If you come to the session thinking, well, I don’t know what these are. That is what I am here for…

Slide 2

Slide 2

Because really, I was in your exact position just a couple of months ago, a real state machines and statecharts baby. And what follows is what I’ve learned over the last couple of months explained in a way that I can understand as a person who has no background in computer science and absolutely hates any kind of unnecessary complexity.

Slide 3

Slide 3

Statecharts are a visual language

Designers and collaborators can rejoice because statecharts are a visual language, so appealing, isn’t it? They’re used to describe the states in a process.

Slide 4

Slide 4

You may have used similar diagrams in the past to design user flows, maybe plan databases or map your app architecture. Statecharts are another way of using these boxes and arrows to represent flows. But with XState, these flows are also executable code that can be used to control the logic of your applications.

Slide 5

Slide 5

Statecharts

Statecharts are another way of using these boxes and arrows to represent flows. But with XState, these flows are also executable code that can be used to control the logic of your applications.

Slide 6

Slide 6

States

If you are going to draw a state chart for the process of a dog. Yes, a dog. There are two states that would first come to mind.

Slide 7

Slide 7

sleep. And awake. A dog is always asleep or awake, the dog can’t be asleep and awake at the same time, and it’s impossible for the dog to be neither asleep nor awake. There’s only these two states, a precisely limited, finite number of states that come back to that finite in a minute.

Slide 8

Slide 8

The states in statecharts are represented by these rounded rectangle boxes.

Slide 9

Slide 9

And how the dog goes between asleep and awake is through transitions, which is symbolized by an arrow pointing from one state to the next state in the process.

Slide 10

Slide 10

A transitions is caused by an event, the results in the changes of the state and these transitions are labeled with their events. Transitions and events are deterministic. Deterministic means that each transition and event always points to the same next state and always produces the same result from that given starting condition. Every time the process is run. Another way of putting it is that dogs never wake up to fall asleep or fall asleep to wake up. It is always going through those states in that same predictable order.

Slide 11

Slide 11

Finite State Machines

This tiny little dog process with its two finite states… as I mentioned earlier… and two transitions is a Finite State Machine. A state machine is used to describe the behavior of something, any thing. The machine describes the thing’s states and the transitions between those states. It’s a Finite State Machine because it has a finite number of states. Sometimes you’ll find finite state machines abbreviated to FSM. That’s just people who love jargon. We can safely ignore them.

Slide 12

Slide 12

Initial states

Any process that has states will have an initial site. The default state that the process exists in until an event happens to change that process’ state.

Slide 13

Slide 13

Using a state chart to describe the process of walking the dog, the initial state would be waiting to walk. And the initial state is represented by that little filled circle with an arrow pointing from the circle to the initial state.

Slide 14

Slide 14

Final states

Most processes with states will have a final state, the final state when the process is finished. In the dog walking state shot, the final state would be walk complete. And the final state is represented by a double border on the state’s rounded rectangle box.

Slide 15

Slide 15

And so between the waiting and the walk complete states, we have the on a walk state. And you transition between waiting and going for a walk with the leave home event and transition between the going for a walk and walk complete with the arrive home event.

Slide 16

Slide 16

Compound states

Compound states are where statecharts really start to shine compared to the other charts we might be used to. And they’re one of the features that make statecharts capable of handling way more complexity than an everyday state machine.

Slide 17

Slide 17

So a compound state is a state that can contain more states, also known as child states, and these child states can only happen when the parent compound state is happening.

Slide 18

Slide 18

So let’s have a look at what an on a walk compound state might contain…

Slide 19

Slide 19

First off, compound state symbolized by a rounded rectangle box, like any other states, that acts as a container for its child states. And is always labeled with its own state as well. So you know what state it is.

Slide 20

Slide 20

In the on a walk state that could be the child states of walking, running and stopping to sniff good smells, all the good stuff you do on a dog walk…

Slide 21

Slide 21

which would each have their own transition events. Now I know this has started to look quite busy at this point. But actually, if you look at it carefully, everything is quite simple. It has states. Each state has its transitions to the other states.

Slide 22

Slide 22

All of these states exist inside the On A Walk state, and as part of the overall dog walk statechart.

Slide 23

Slide 23

Compound states should also specify which child state is the initial state. In the on a walk compound state, the initial state is walking.

Slide 24

Slide 24

Atomic states

An atomic state is a state that doesn’t have any child states…

Slide 25

Slide 25

so waiting, walk complete, walking, running, stopping to sniff good smells. All of those are atomic states. The on a walk state is the one that’s not an atomic state because it has child states… can’t be an atomic state if it has child states.

Slide 26

Slide 26

Parallel states

Parallel states allow us to get to even more complex processes.

Slide 27

Slide 27

So a parallel state is a compound state where all of its child states, also known as regions, are active simultaneously at the same time. The regions are separated inside that compound state container by a dashed line.

Slide 28

Slide 28

And inside the on a walk compound state there could be two regions, we’ll just do two for… you could have loads and loads of regions in this, but I think for this case, for the size of this slide and the screen, I think it’s important that we just have two. You’ll see why…

Slide 29

Slide 29

One region contains the dog’s activity child states of walking, running, stopping to sniff good smells. That’s the state we looked at before.

Slide 30

Slide 30

And the other region contains the dog’s tail states of not wagging and wagging. So the dog can walk and wag its tail, run and wag its tail, or stop and sniff while wagging its tail. It can also do any of these activities without wagging its tail. The states in each region happen simultaneously.

Slide 31

Slide 31

Both regions should also specify which child state is the initial state. I keep going on about these initial states, but it’s the thing that I forget the most. In our tail region, the initial state is not wagging.

Slide 32

Slide 32

Self-transitions

Self transition is when an event happens, but the transition returns to the same state. So transition arrow exits and reenters that same state.

Slide 33

Slide 33

So if we’re going back to dogs again, because dogs are great… in a dog begging process, there will be a begging state with a gets treat event. And for the dogs who kind of love their food, no matter how many times you go through that gets treat event, you know that the dog is going to return to its begging state.

Slide 34

Slide 34

And the initial state, of course, begging.

Slide 35

Slide 35

Statecharts as a tool

One of the benefits of statecharts is that in the process of putting a statechart together, you explore all of the possible states in your process. And this exploration will help you avoid bugs and errors in your code as you’re more likely to cover all of the eventualities.

Slide 36

Slide 36

And because your statecharts are executable, they can behave as both a diagram and as the code. So cool! Making it less likely that you’ll introduce differences or bugs when you’re trying to interpret between the diagramming and the coding environments.

No more throwing things over the wall. There is no wall.

Slide 37

Slide 37

Planning statecharts

So let’s have a quick look at how you might go about planning a statechart and you’ll get some really good insight into this in Farzad’s talk later as well.

Slide 38

Slide 38

To draw a state chart for a login machine, start by listing the basic events in the process. So generally, these will be the things that your login machine will do. So just to start really simple, log in and log out.

Slide 39

Slide 39

And then list the states that exist as a result of those events. So we’ve got logged in and logged out.

Slide 40

Slide 40

And once there’s some events and states, there’s the beginnings of your statechart. See? Got my little initial state going on there as well. Don’t forget it. And in this case, the logged out state is the initial state, because any new user would come to the login process logged out. You don’t magically arrive at things already logged in when you’ve never even heard of them before.

Slide 41

Slide 41

Delayed transitions

Some log in and log out processes will log out an inactive user after a fixed length of time. As a a kind of security measure. We could use delayed transitions for this.

Slide 42

Slide 42

So before I get directly into the delayed transition, first we’ll make our logged in state into a compound state. And because we’ll only keep track of whether a user is active when they’re actually logged in. We can’t do that when they’re logged out.

Slide 43

Slide 43

The child states of our logged in compound state are active and idle. The user is either active or idle.

Slide 44

Slide 44

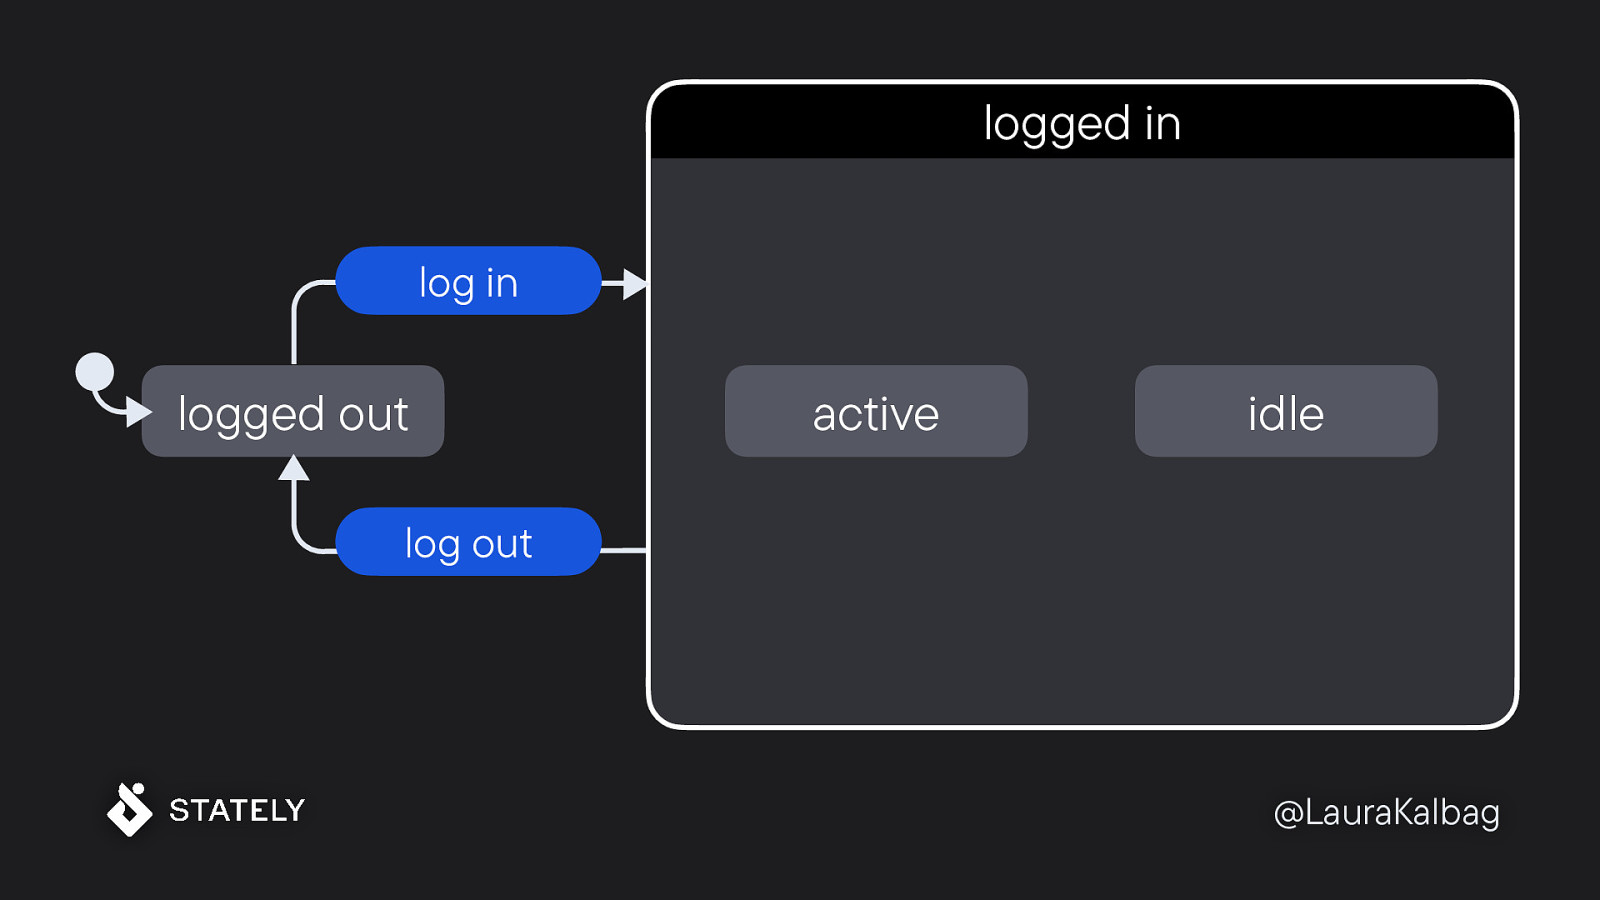
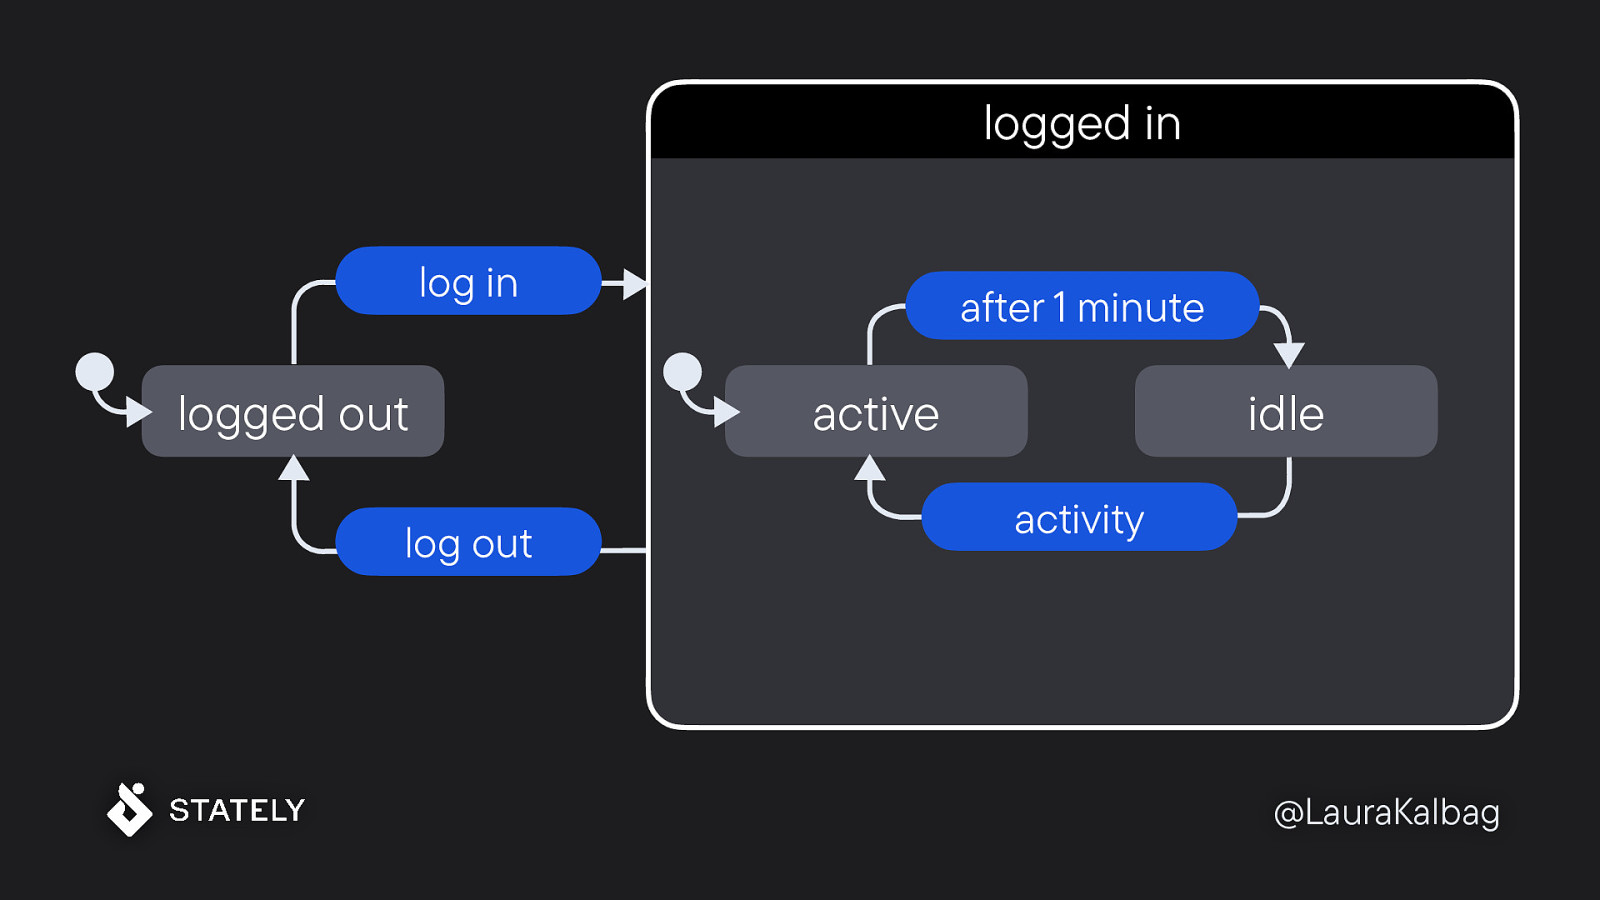
The initial state of the logged in compound state is active because it’s safe to assume that if a user’s just logged in, they’re active. And the event on the transition between idle and active is when there’s activity. Because we know a user is no longer idle if there’s some activity. And we can use a delayed transition, what I mentioned before, between active and idle. Because will determine the inactivity as a lack of activity for one minute.

The delayed transition is labeled “after” and a fixed duration, and that indicates how much time should pass before transitioning to the next indicated state. That’s what makes it a delayed transition.

Slide 45

Slide 45

We’ll also use a delayed transition of three minutes following the idle state to transition to an auto logged out state. If the user remains idle, that’s when we’ll log them out, and that will be the final state.

Slide 46

Slide 46

Actions

A statechart is used to set off actions in the system outside of the statechart. Actions are also commonly known as effects or side effects. And side effects sounds like weirdly negative or unimportant. But it’s actually the whole point of statecharts. The whole point of statecharts is setting off actions. You actually want to use these statecharts to do something in your code.

Slide 47

Slide 47

An action on a state is included inside the state’s container with an entry and slash, or an exit and a slash, label, depending on whether the action should be fired on entry or on exit from the state.

Slide 48

Slide 48

So in the login state chart, there’s an entry action on the idle state to warn the user they might be logged out. So that’s the position when we’ll fire off an action to warn that user, you might be logged out if you stay inactive. We’re all used to say those dialogues, right?

Slide 49

Slide 49

Why should I use statecharts for state management?

So why would you use statecharts for state management?

Slide 50

Slide 50

Well, for one, statecharts make it easy to understand just the small pieces of logic as equally well as you understand that greater whole logic of your application.

Slide 51

Slide 51

Statecharts can do complexity really well. So that works really well with the small to big, they scale really easily from your tiny little machines, which you’ll see I make a lot of tiny little machines, to machines inside machines that… much like the complexity of your application.

Slide 52

Slide 52

You’re doing state management anyway, so why not formalize it in a way that gives you an overview and a detailed view and can handle that complexity. Because whatever you’re building, you’re handling state. Whether you’re handle it well is a different matter.

Slide 53

Slide 53

And statecharts are understandable by the whole team. This is one of the reasons why stat charts really appealed to me in the first place. I’m a designer and a developer, and I fundamentally believe that we build better applications when every discipline is included from the start of a project. That way, we gain the benefit of everyone’s expertise. And if your project manager and your designer and your developer can all collaborate on your code without requiring any translation between them, then isn’t that the dream?

Slide 54

Slide 54

So you can find all of the examples from this talk as actual machines in XState on the Stately registry. If you go to the registry, if you follow that link, you’ll be able to find me, type my name in… Laura, probably the only Laura on there at the moment. Probably, hopefully. And if you are a Laura and you want to join, please do. And you can search and you can just find my little examples up in there.

Slide 55

Slide 55

Thank you. And if you like my talk, just you wait until you hear and Farzad and Matt’s talks. They’re going to get into the really good stuff!