Rome | March 22 - 23, 2019 Rediscover the known Universe with NASA datasets Horacio Gonzalez @LostInBrittany @LostInBrittany

A presentation at Codemotion Rome in March 2019 in Rome, Metropolitan City of Rome, Italy by Horacio Gonzalez

Rome | March 22 - 23, 2019 Rediscover the known Universe with NASA datasets Horacio Gonzalez @LostInBrittany @LostInBrittany
Horacio Gonzalez @LostInBrittany Spaniard lost in Brittany, developer, dreamer and all-around geek @LostInBrittany
HelloExoWorld Looking for exoplanets in NASA datasets @LostInBrittany
HelloExoWorld Once upon a time… @LostInBrittany
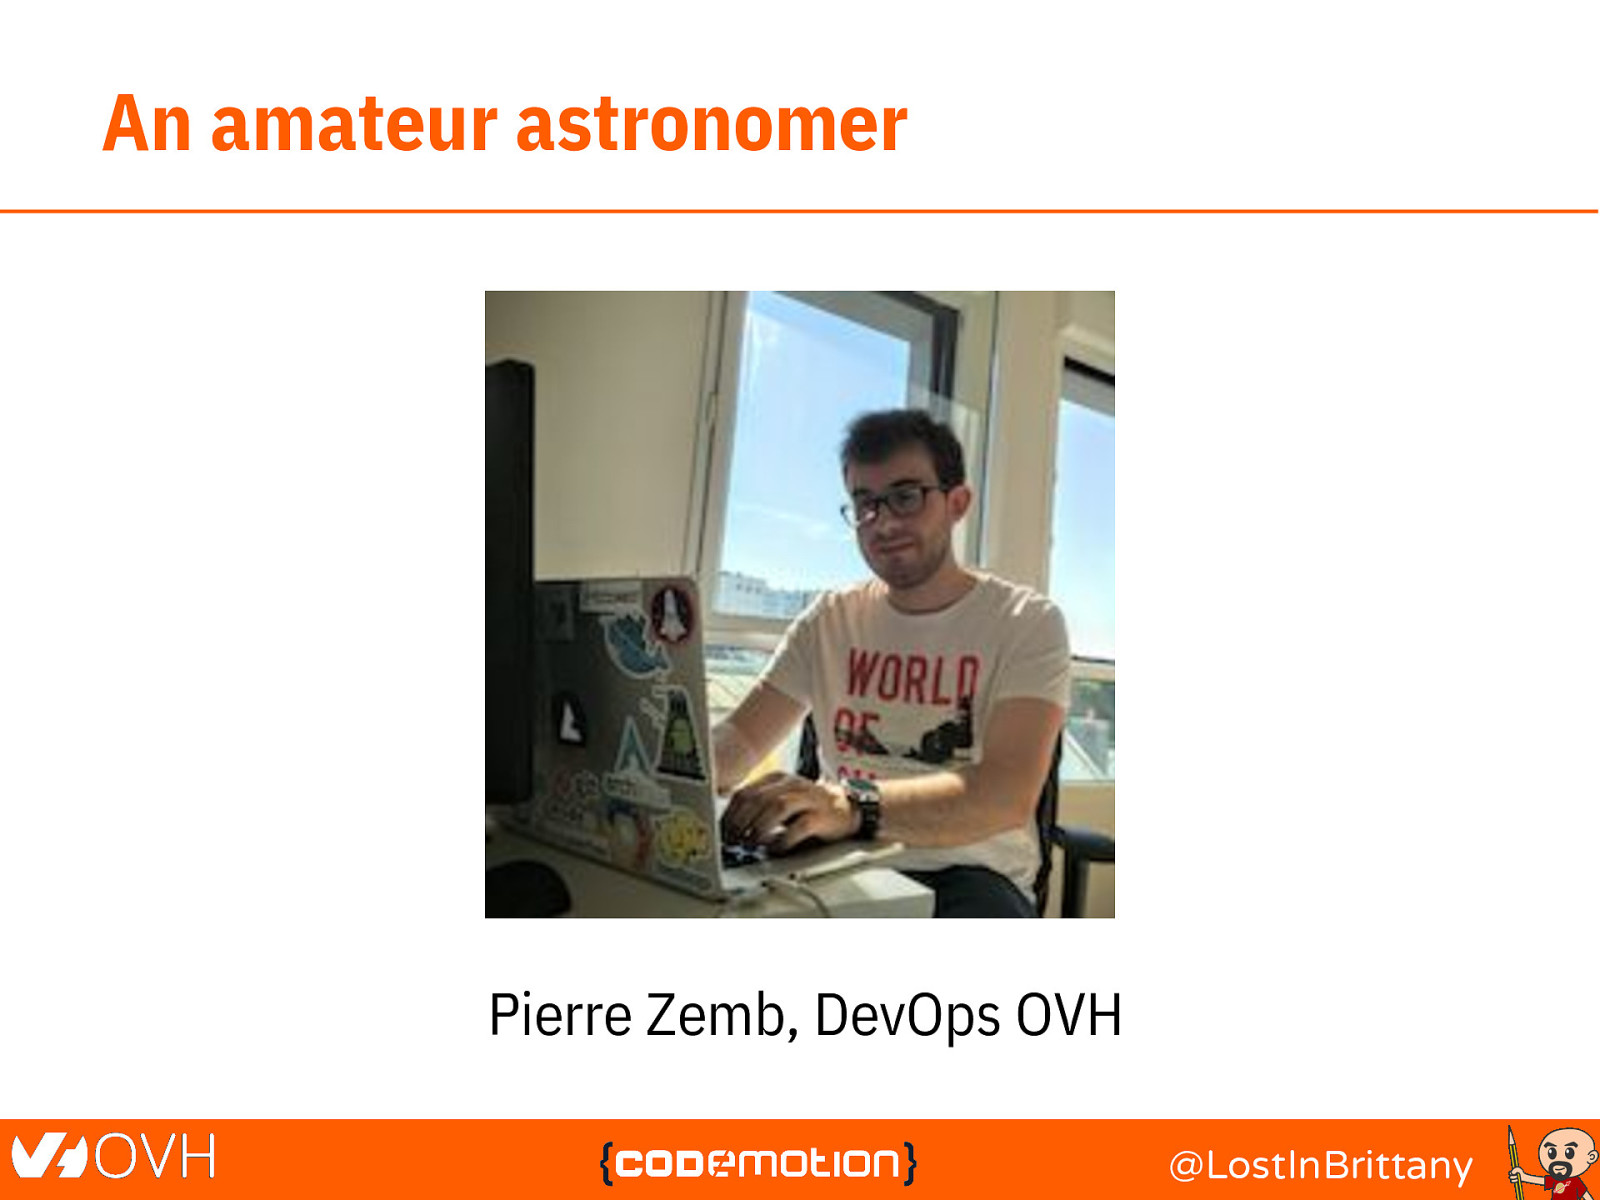
An amateur astronomer Pierre Zemb, DevOps OVH @LostInBrittany
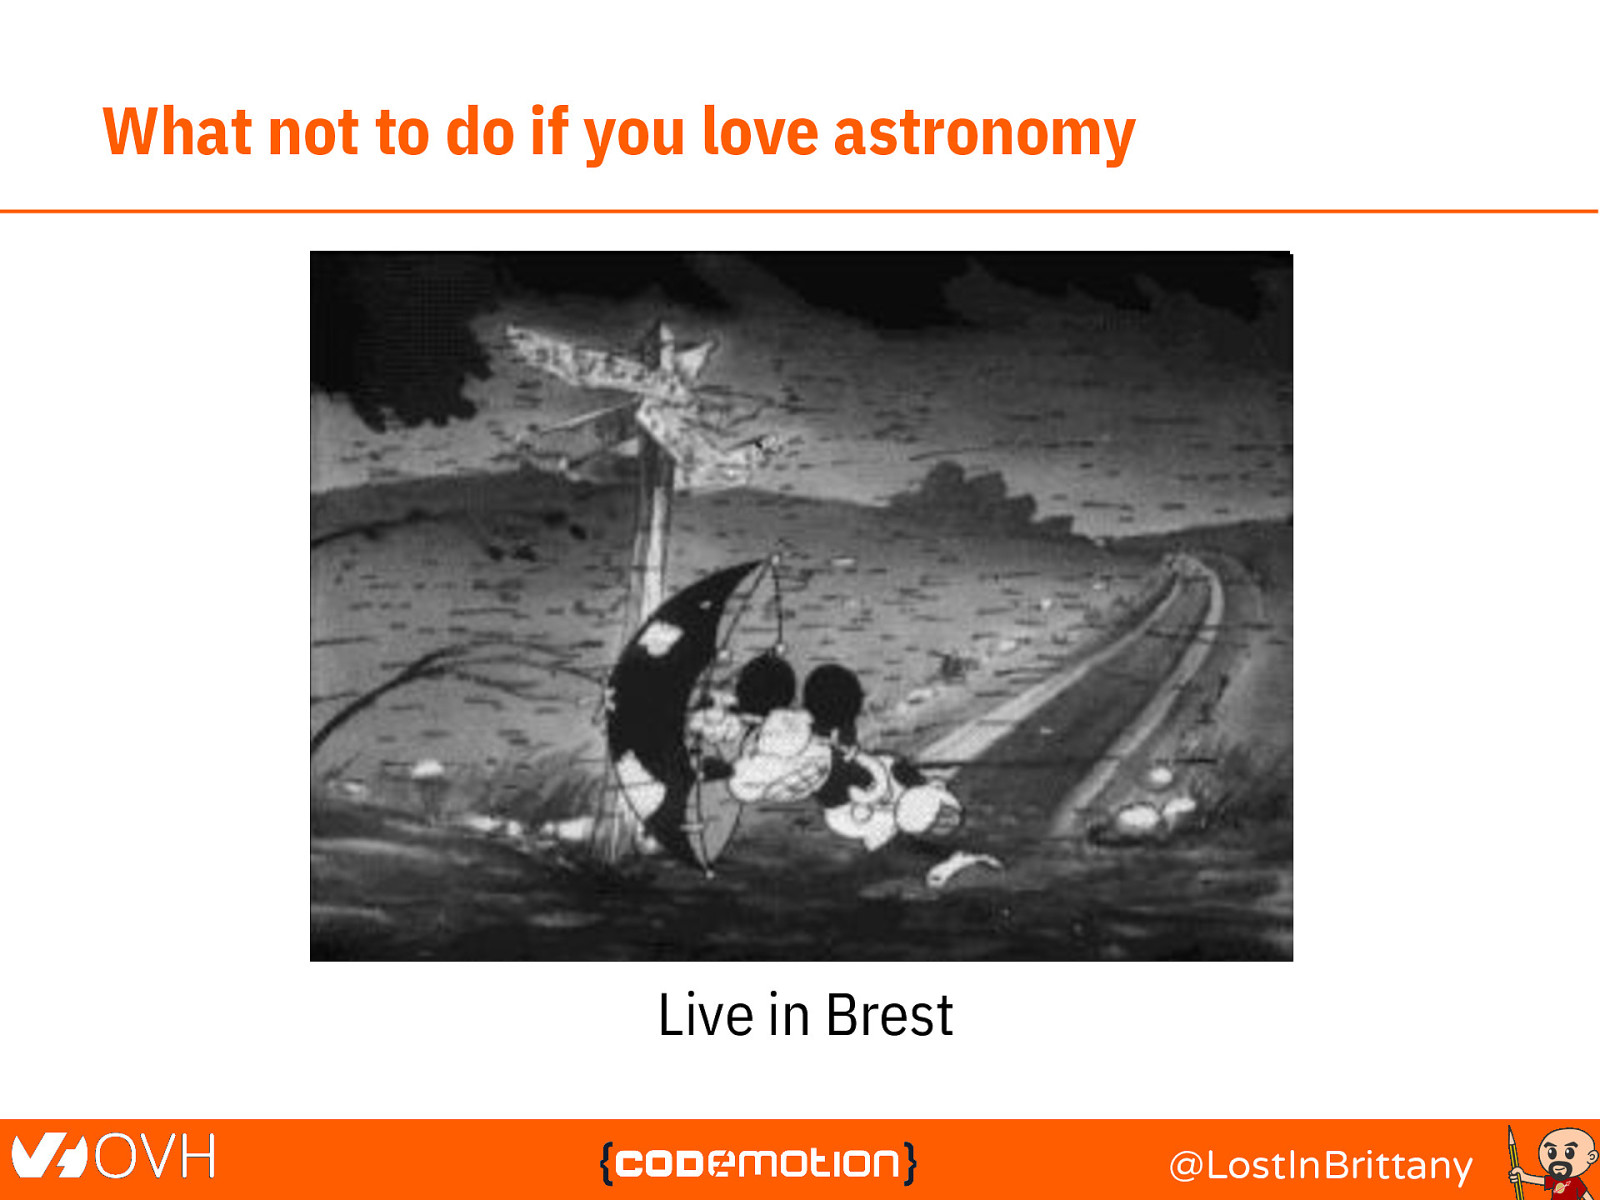
What not to do if you love astronomy Live in Brest @LostInBrittany
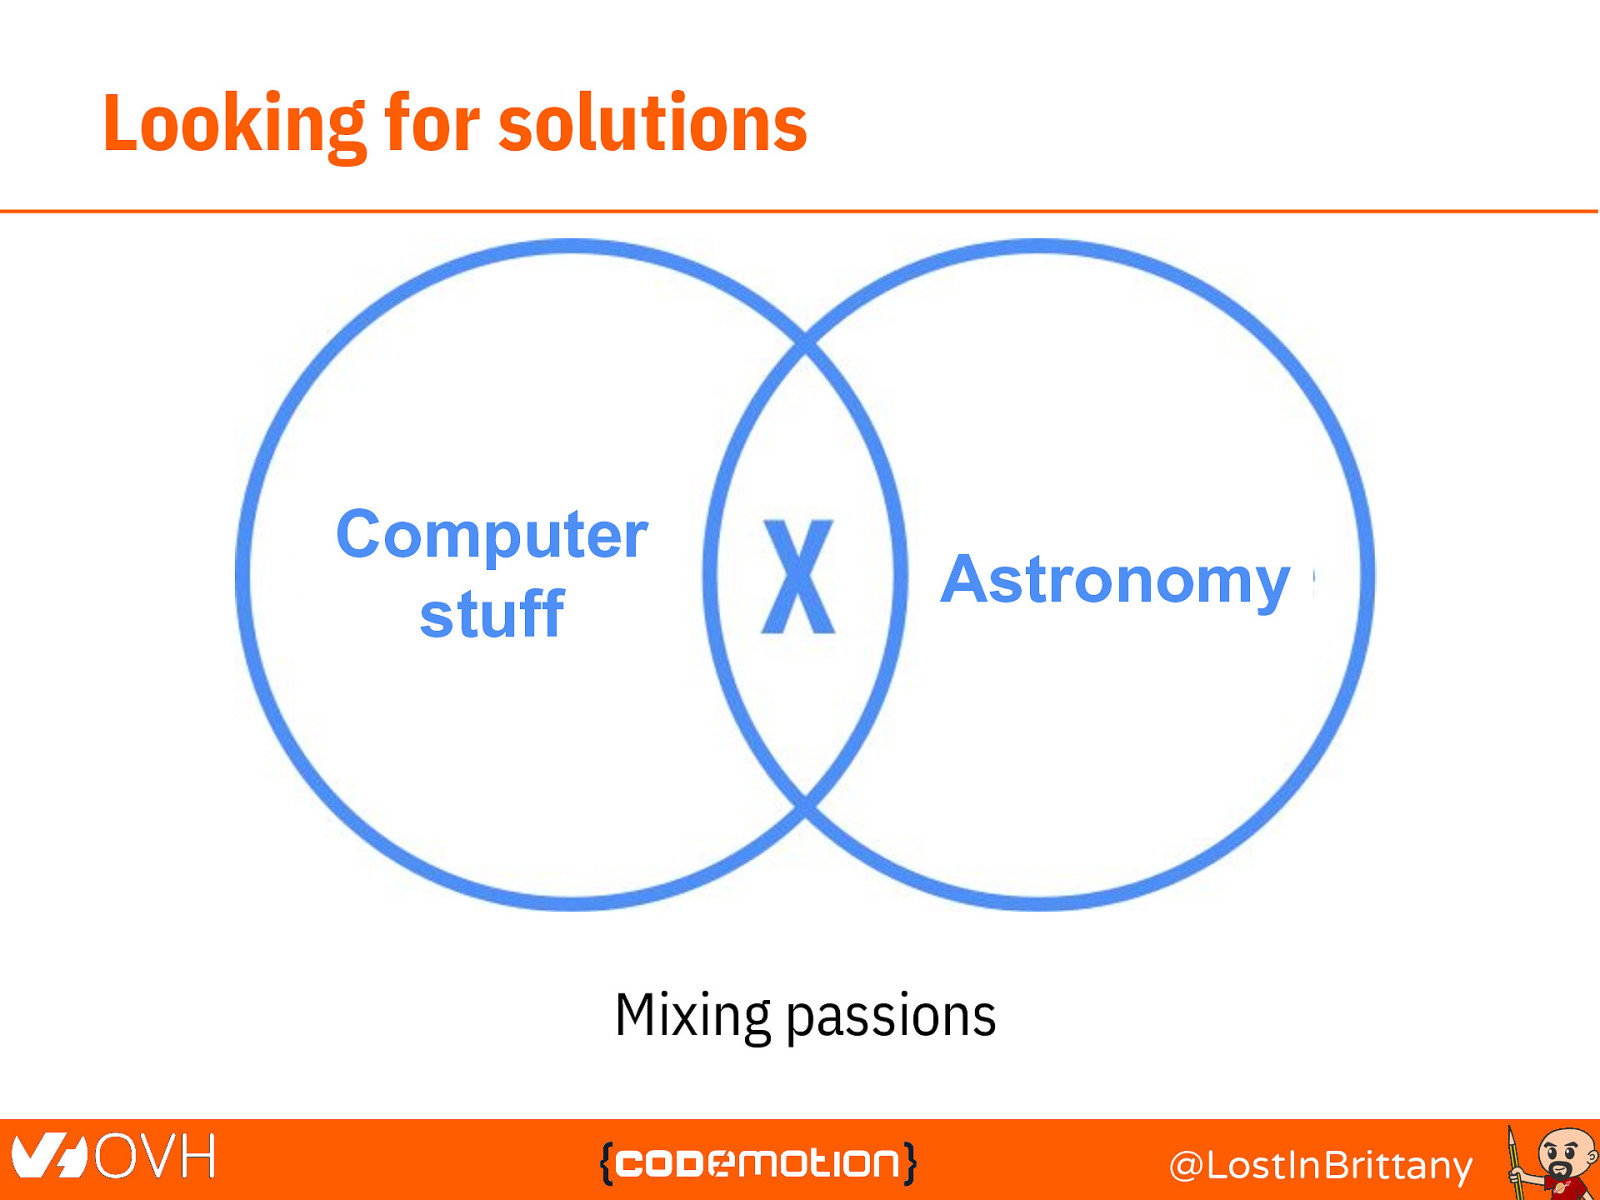
Looking for solutions Computer stuff Astronomy Mixing passions @LostInBrittany
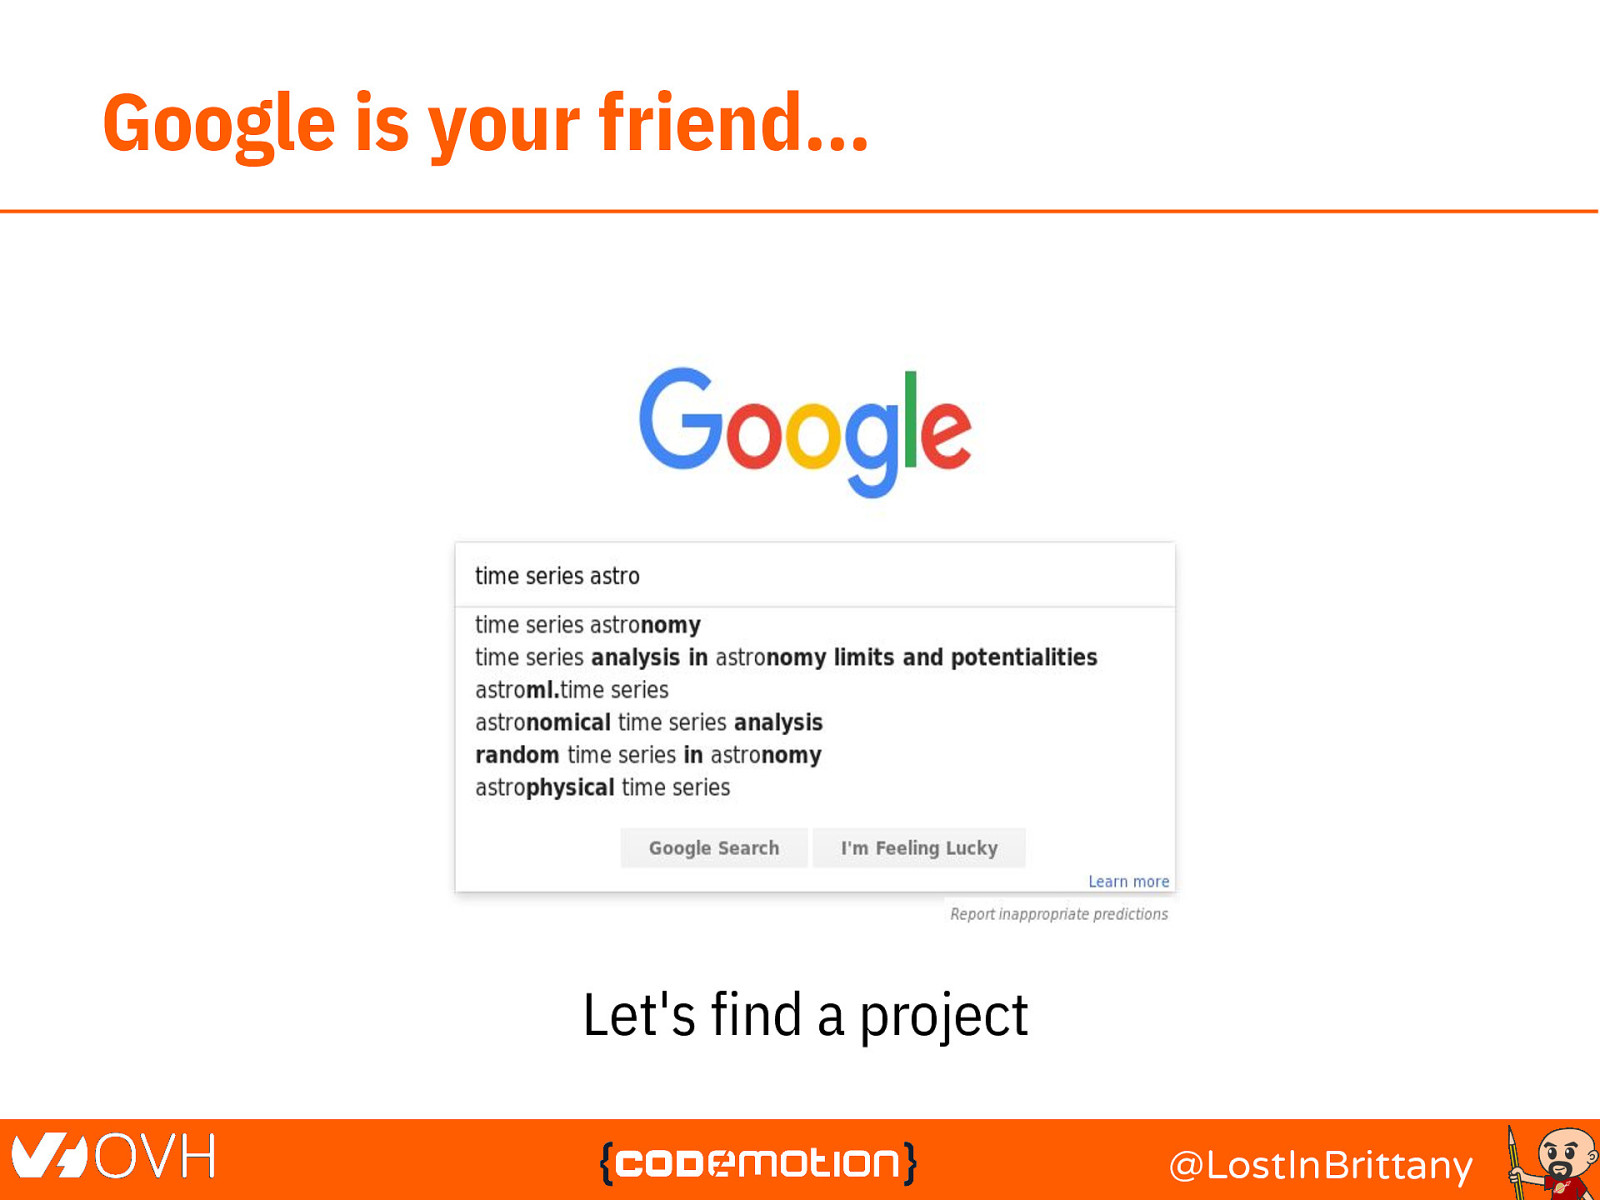
Google is your friend… Let’s find a project @LostInBrittany
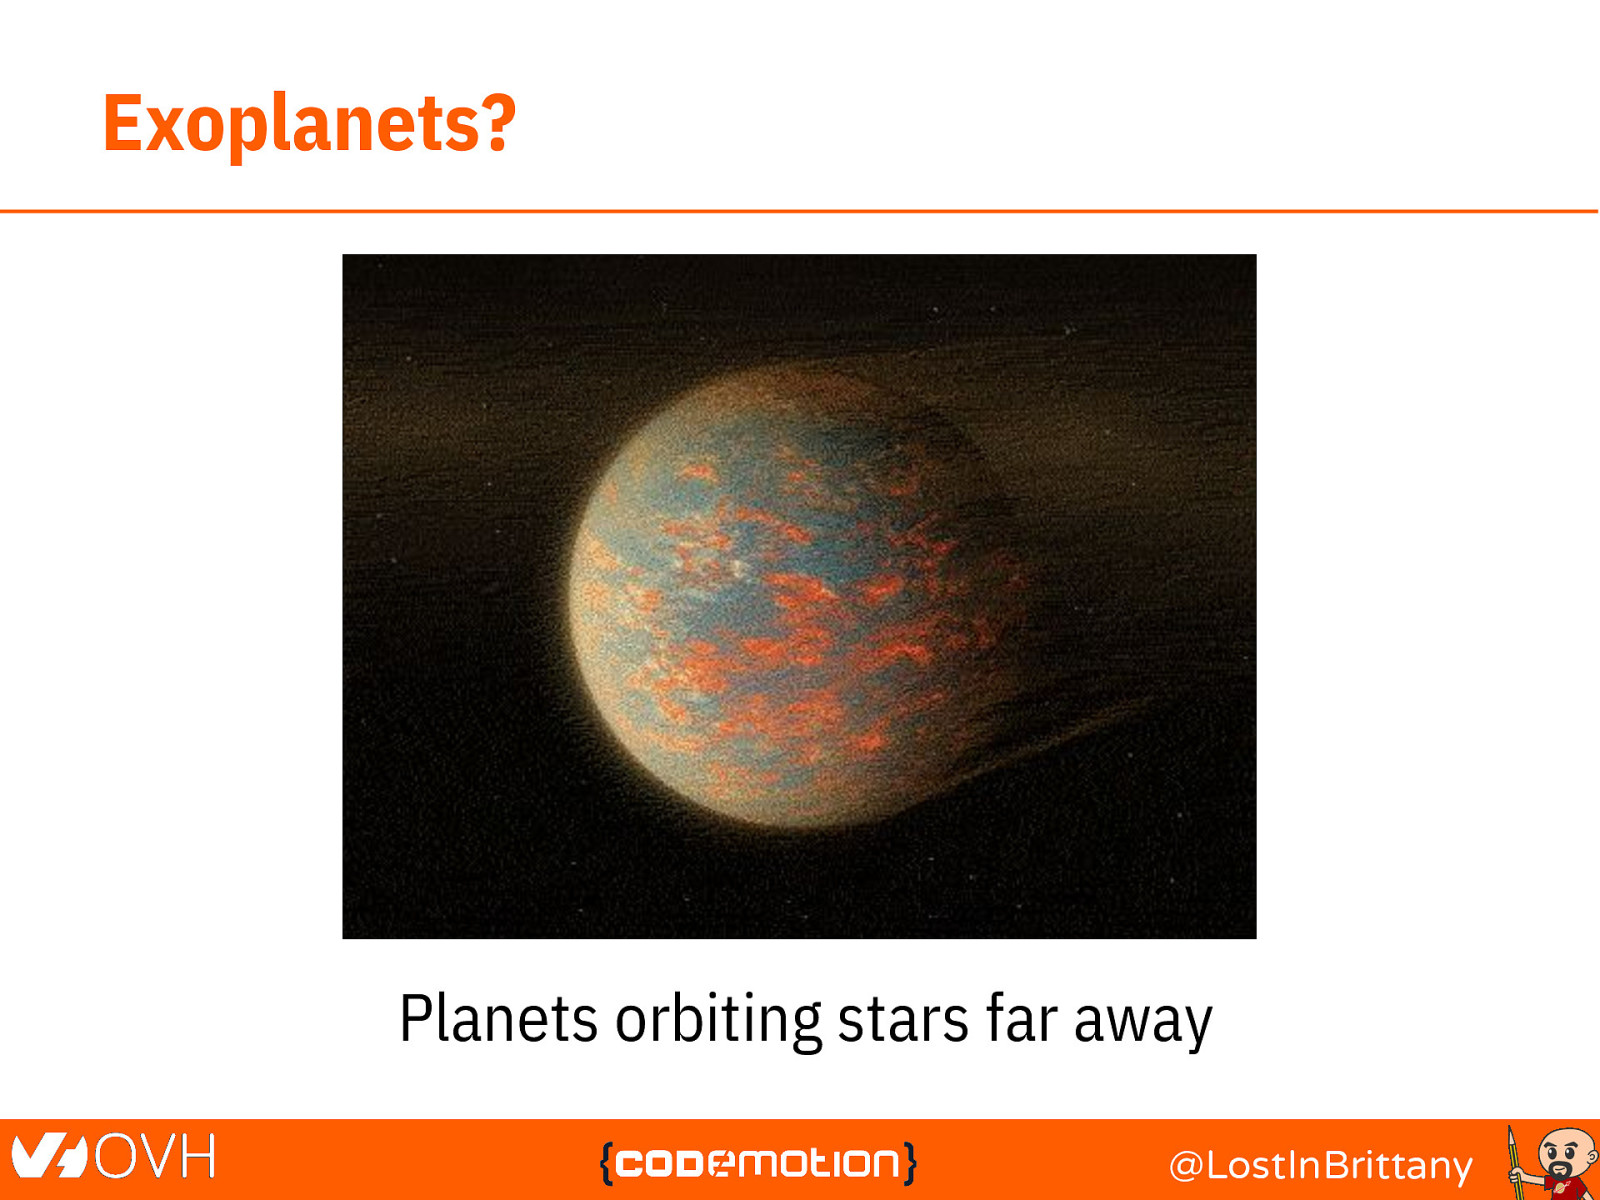
Exoplanets? Planets orbiting stars far away @LostInBrittany
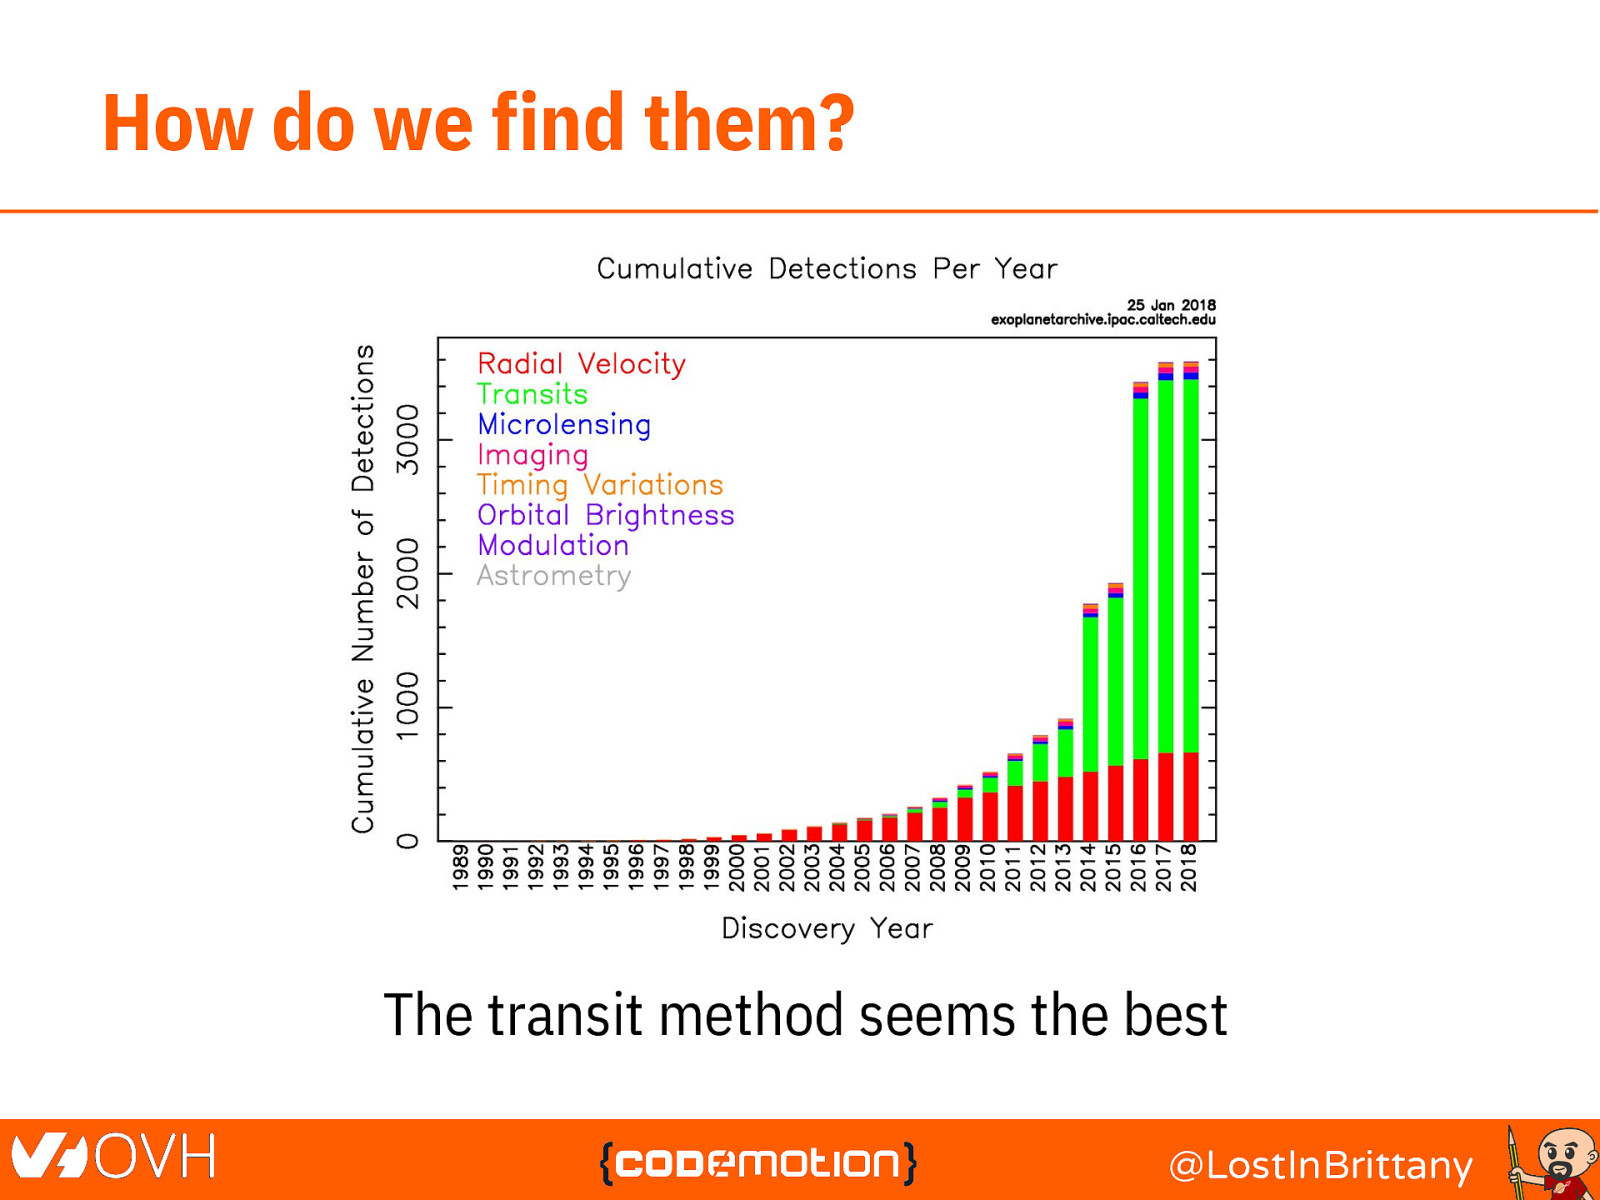
How do we find them? The transit method seems the best @LostInBrittany
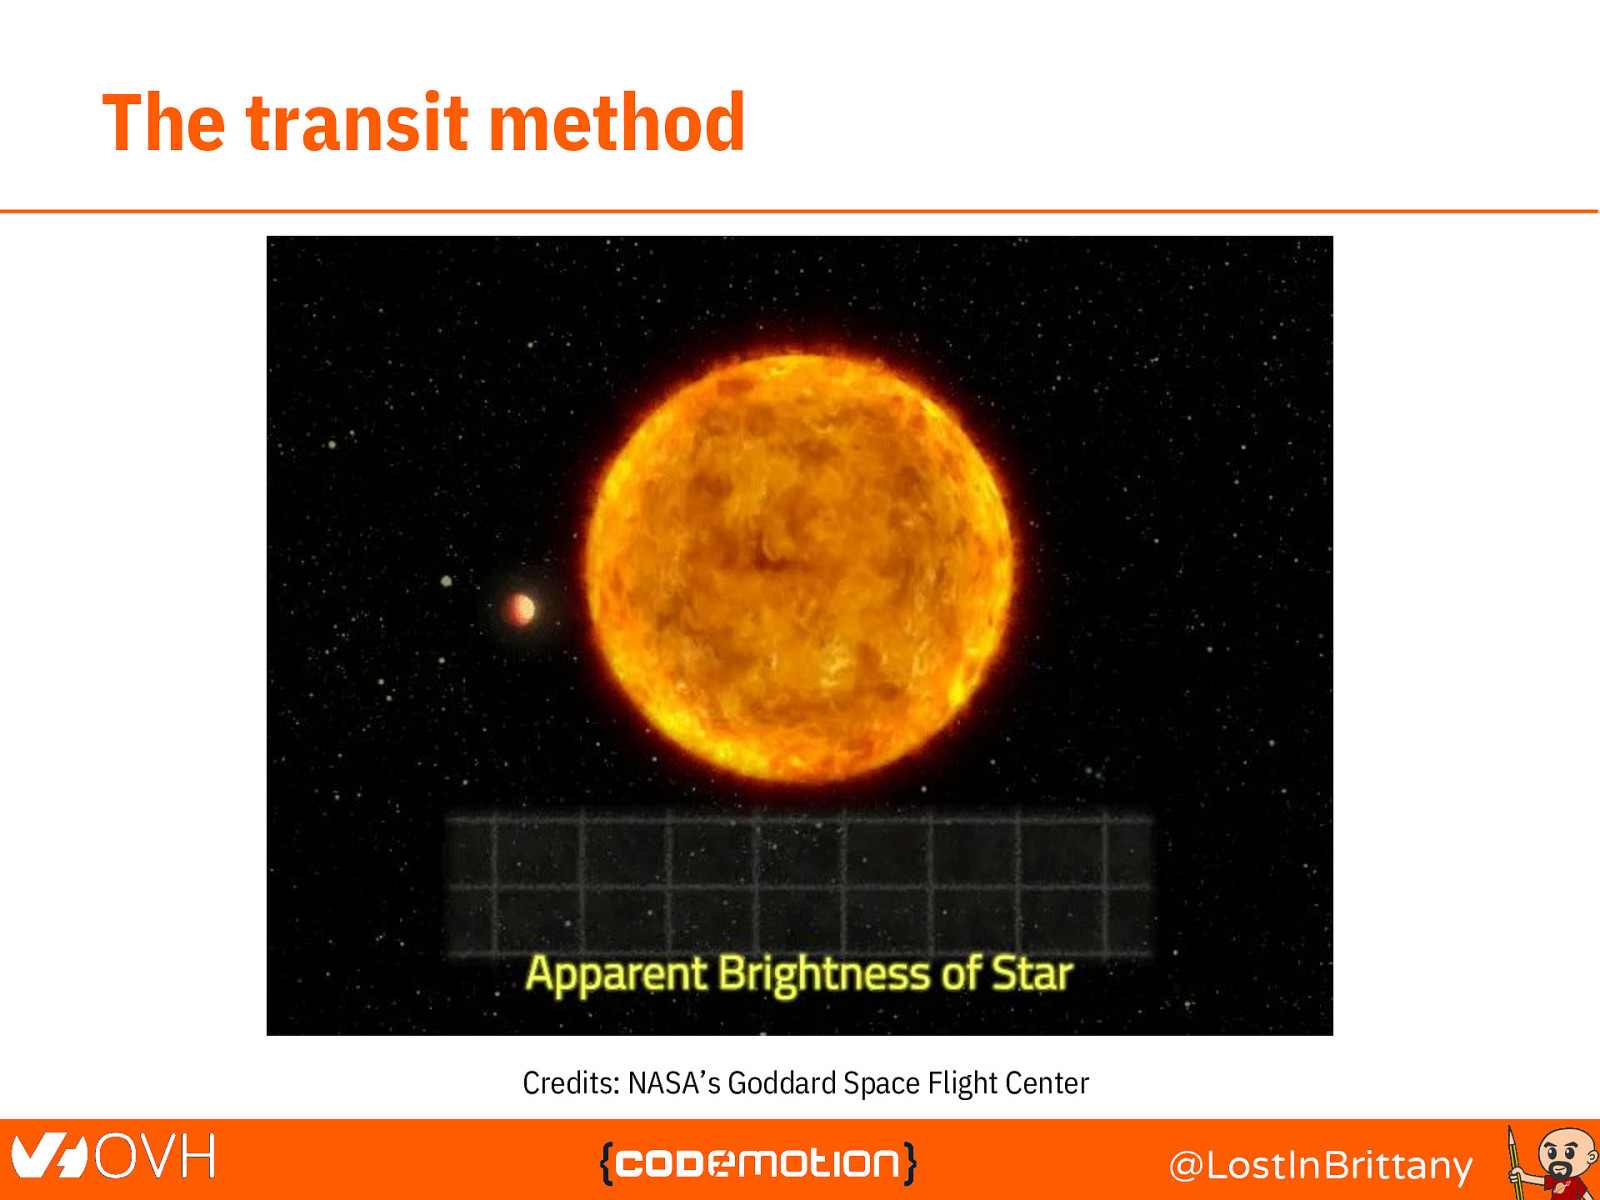
The transit method Credits: NASA’s Goddard Space Flight Center @LostInBrittany
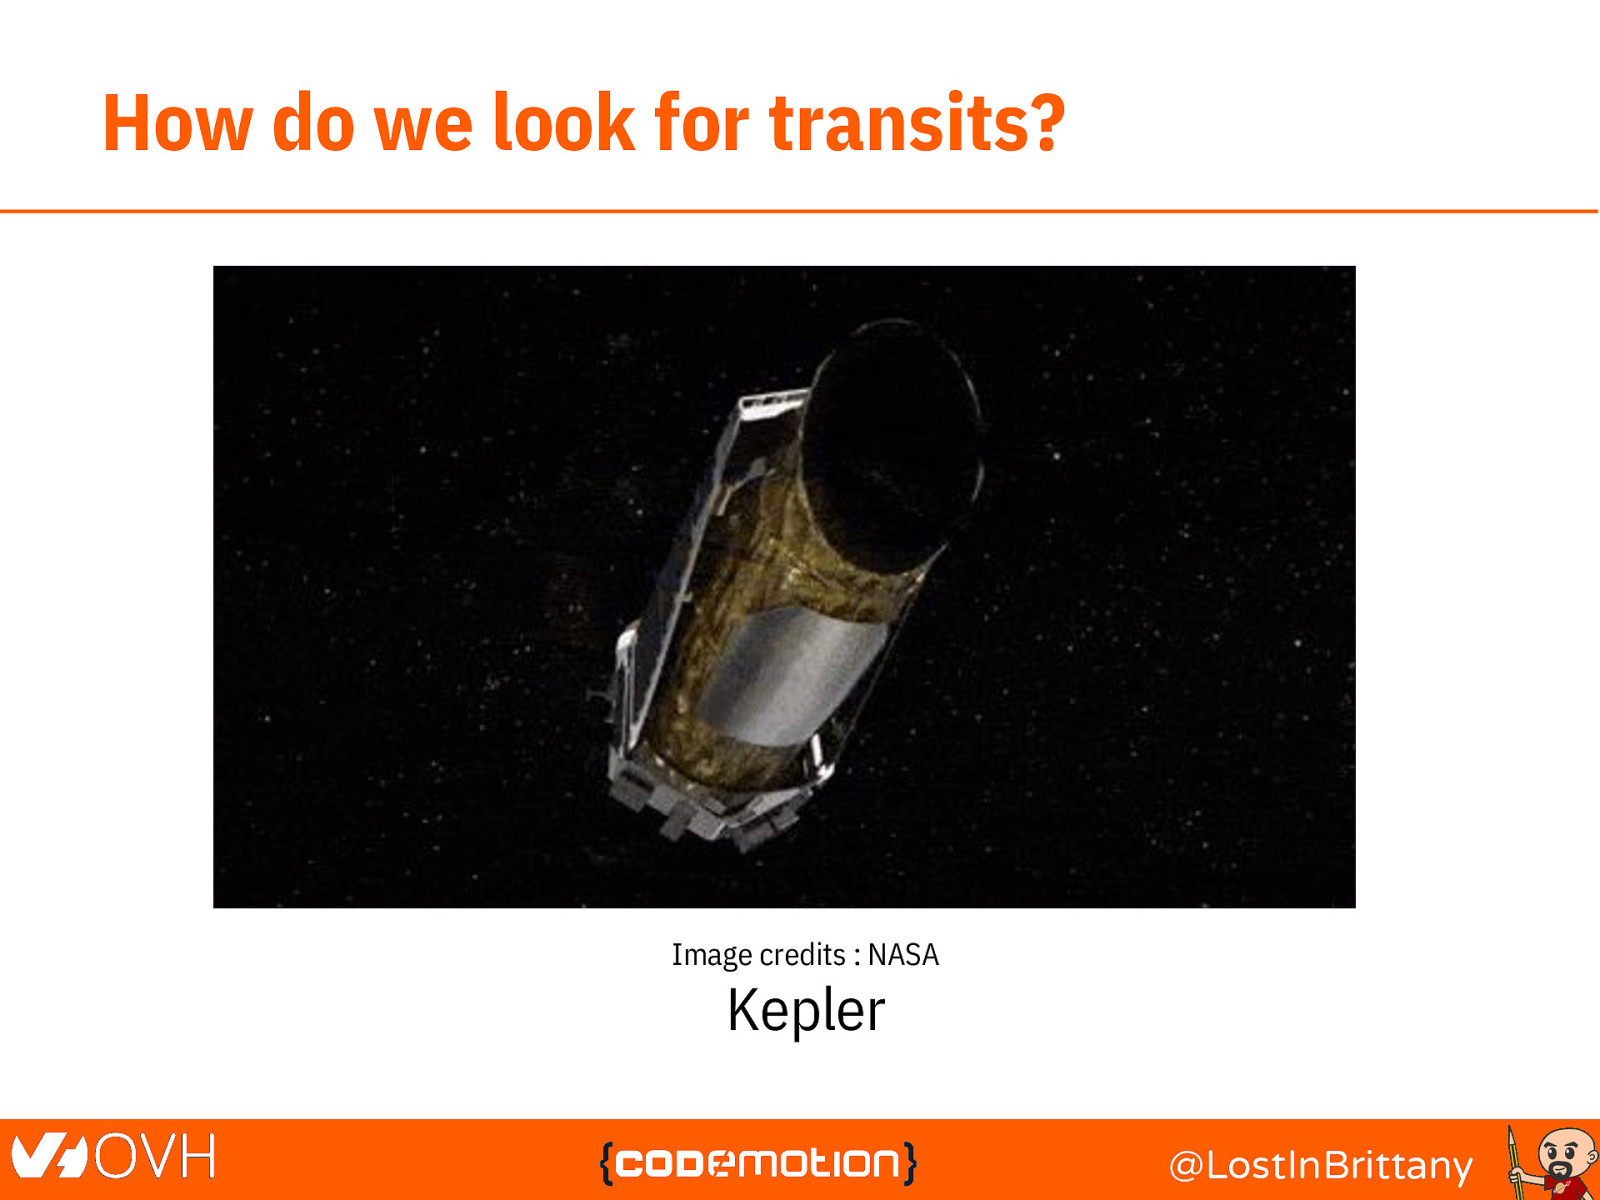
How do we look for transits? Image credits : NASA Kepler @LostInBrittany
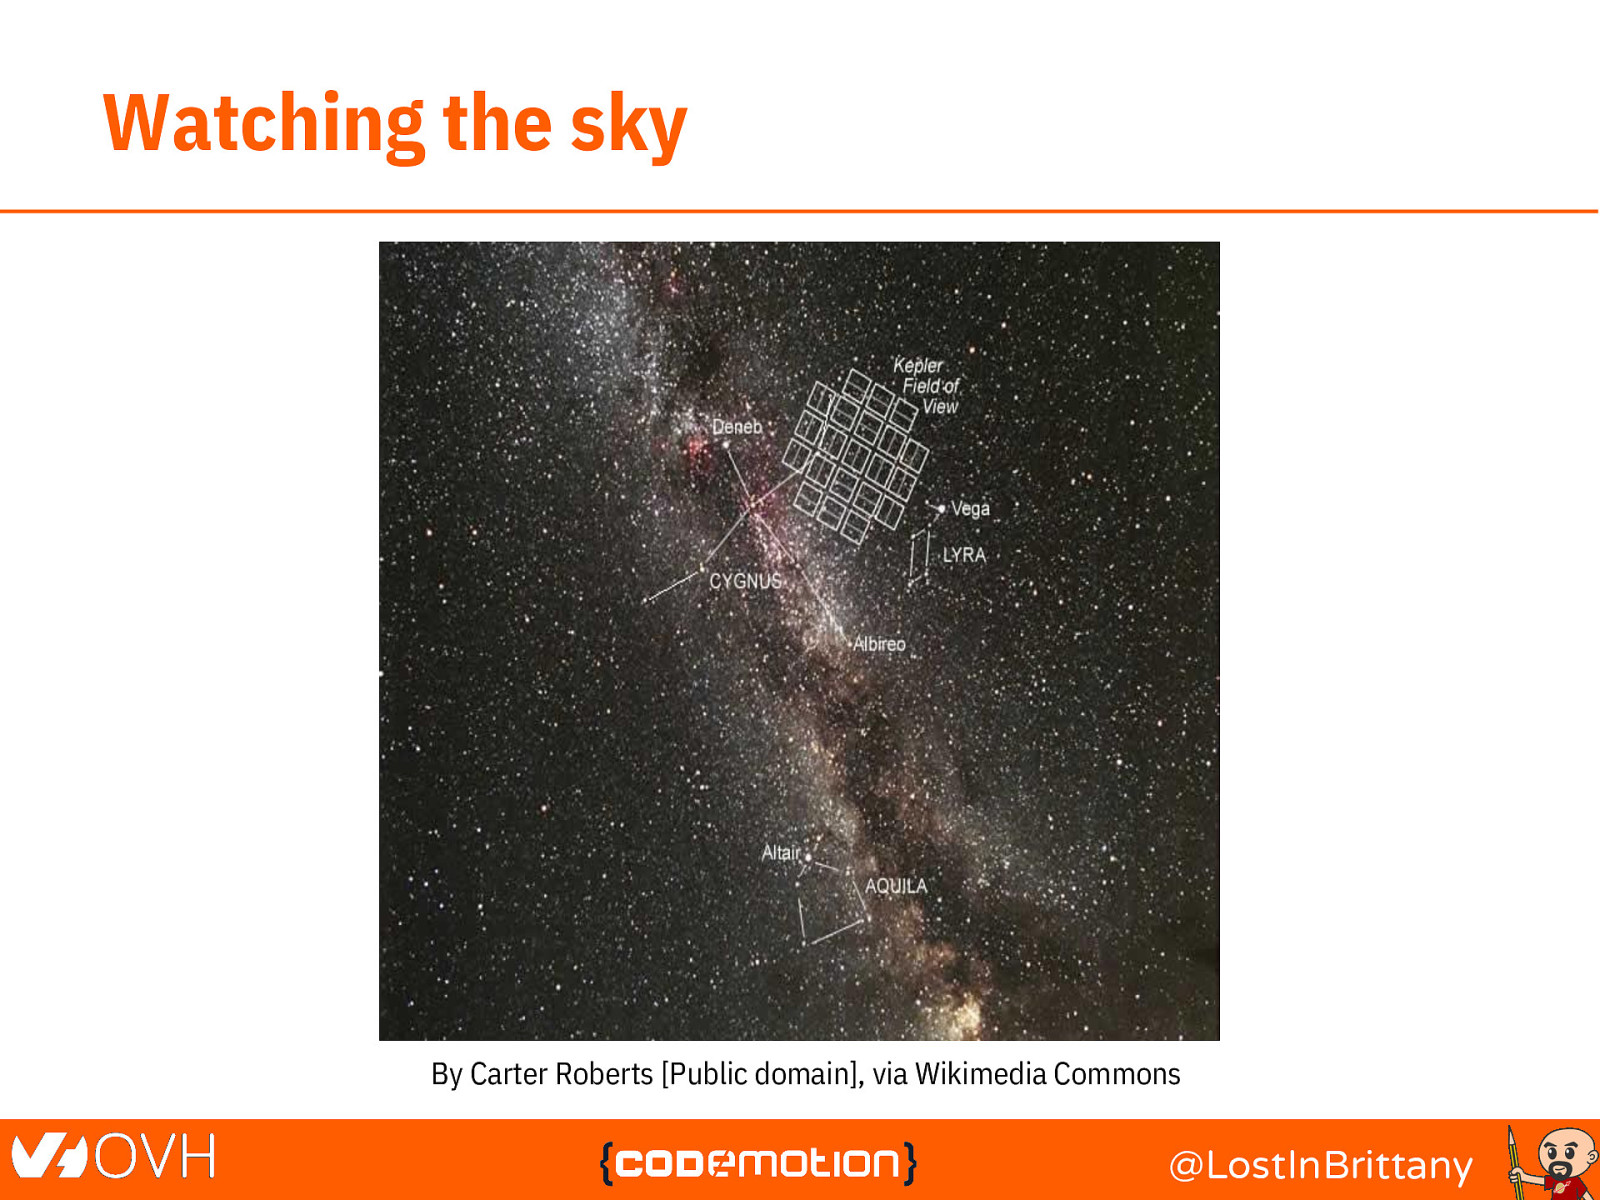
Watching the sky By Carter Roberts [Public domain], via Wikimedia Commons @LostInBrittany
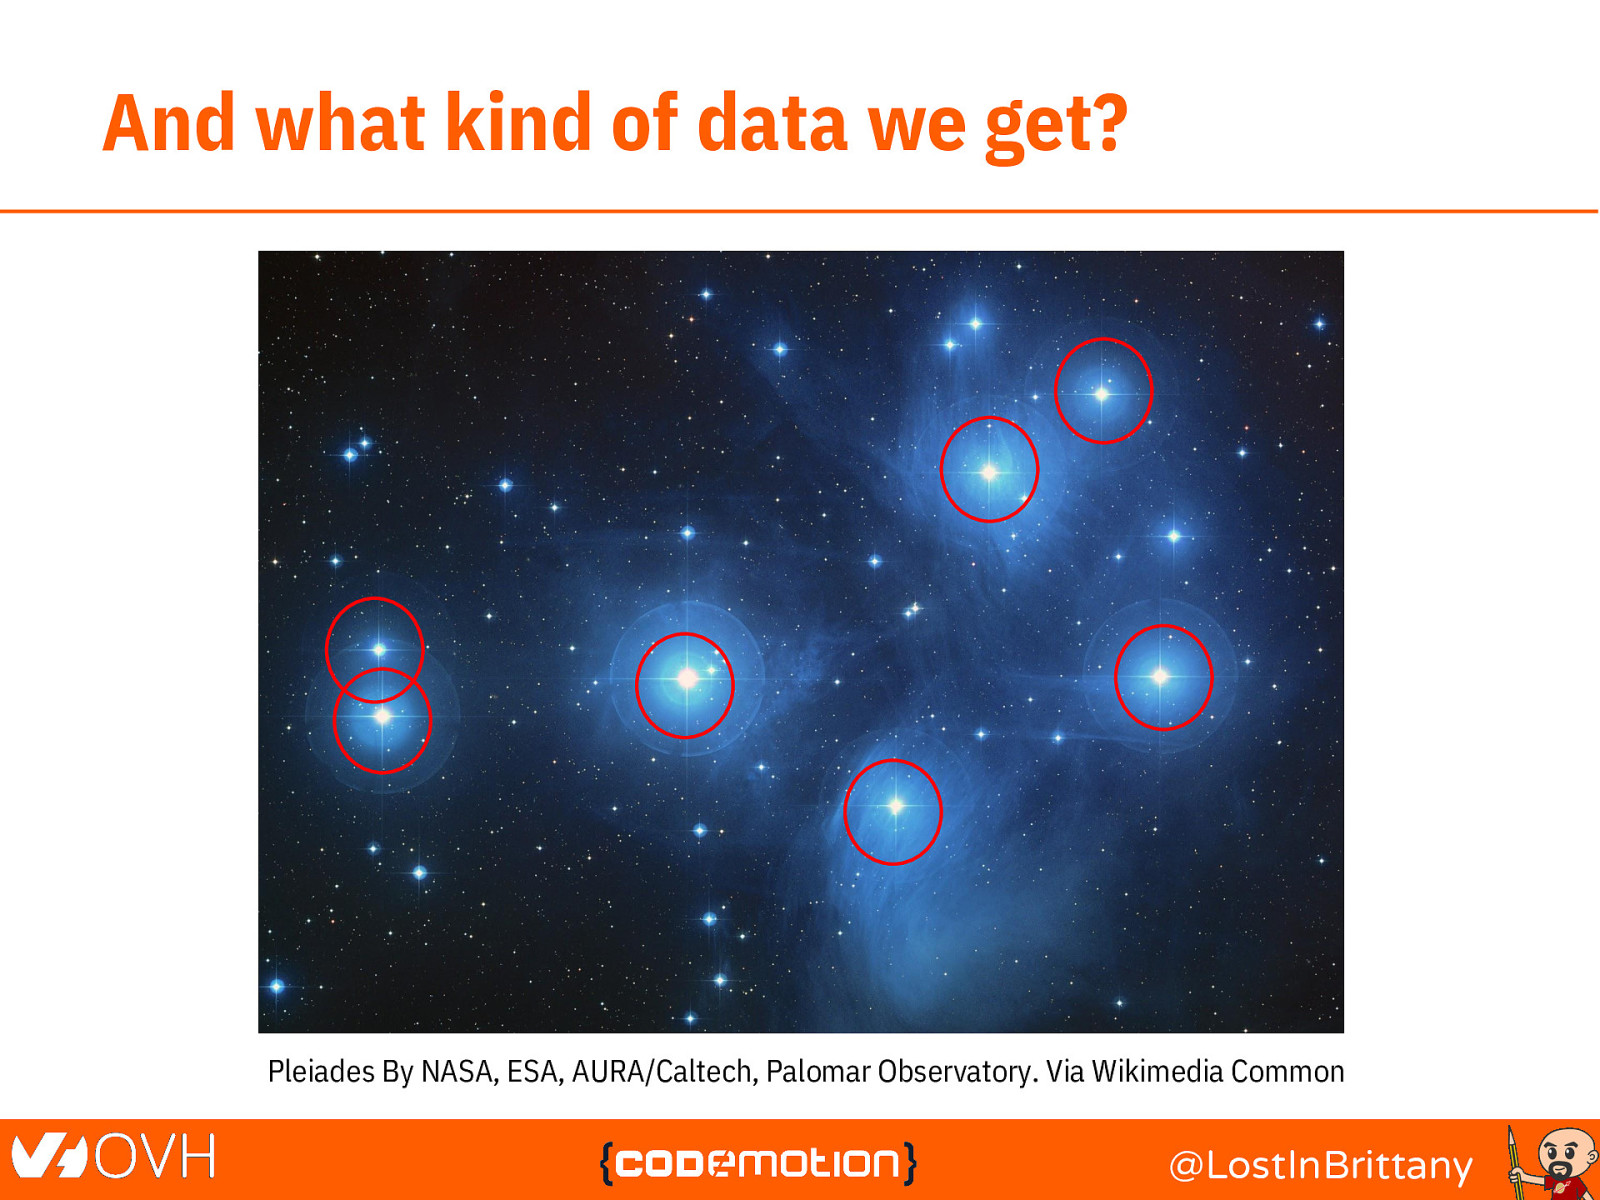
And what kind of data we get? Pleiades By NASA, ESA, AURA/Caltech, Palomar Observatory. Via Wikimedia Common @LostInBrittany
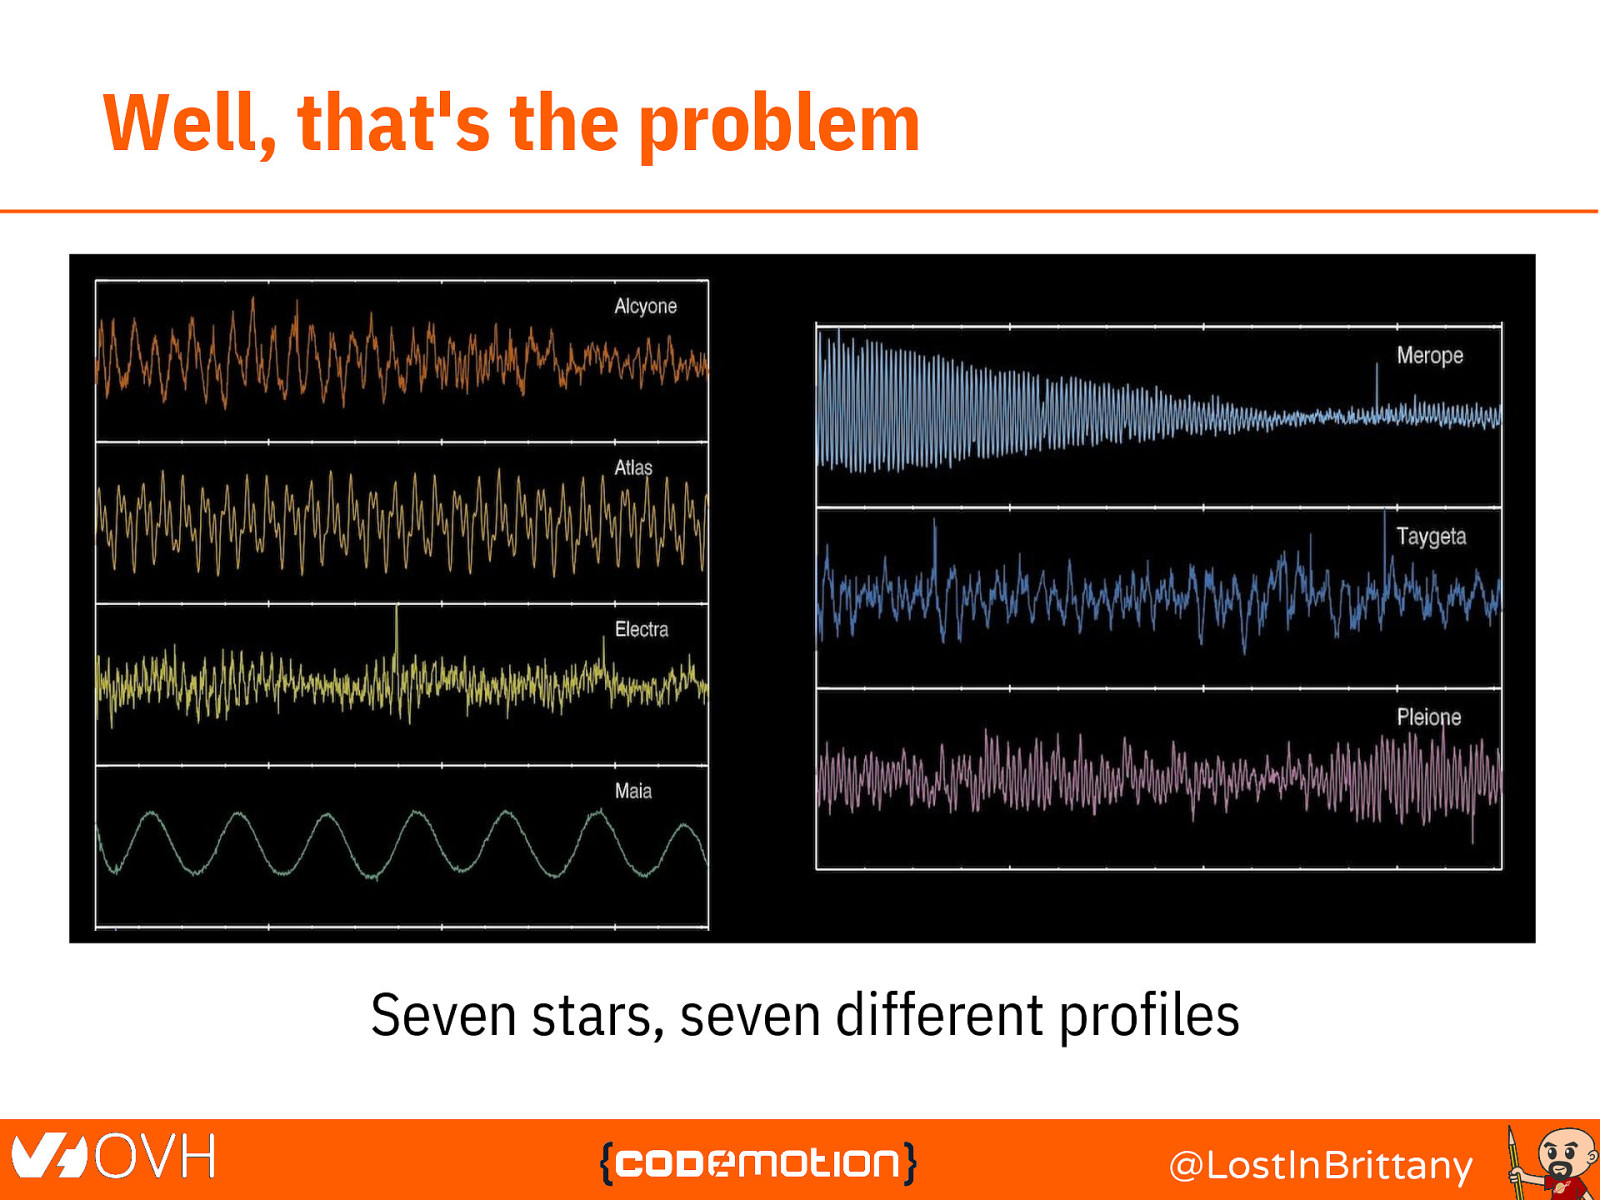
Well, that’s the problem Seven stars, seven different profiles @LostInBrittany
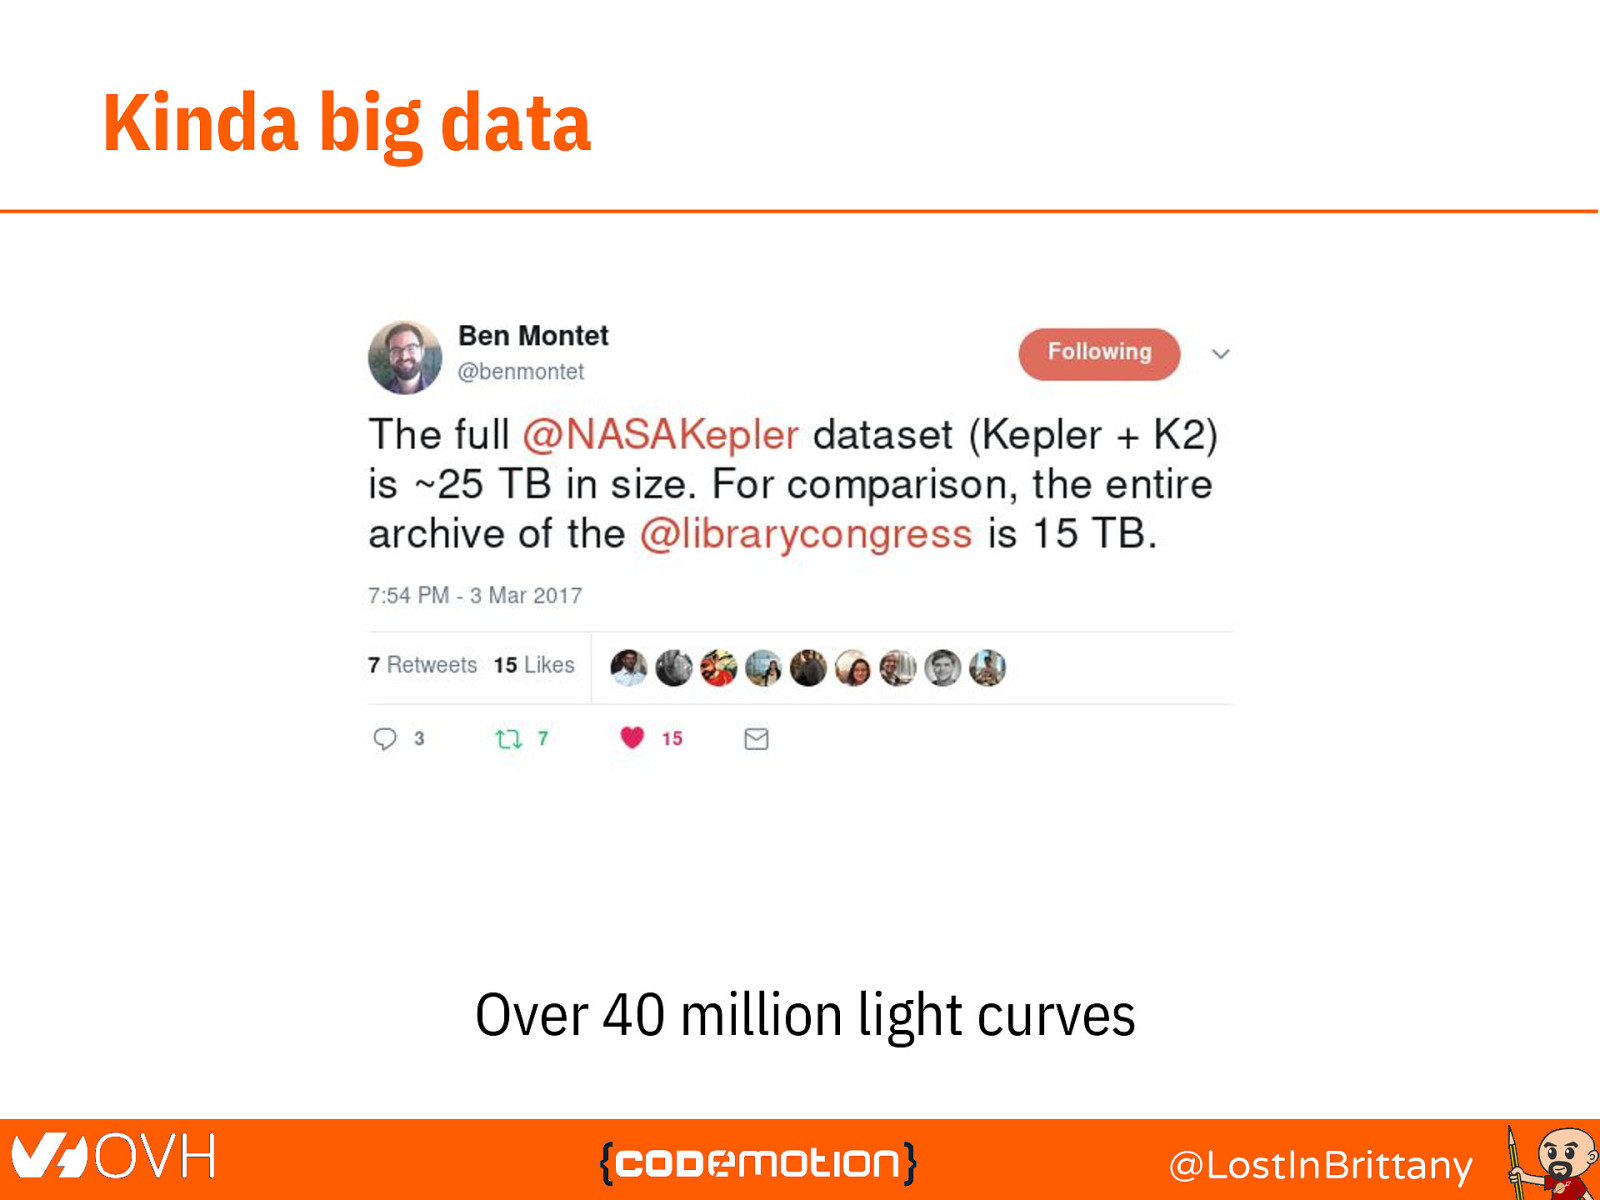
Kinda big data Over 40 million light curves @LostInBrittany
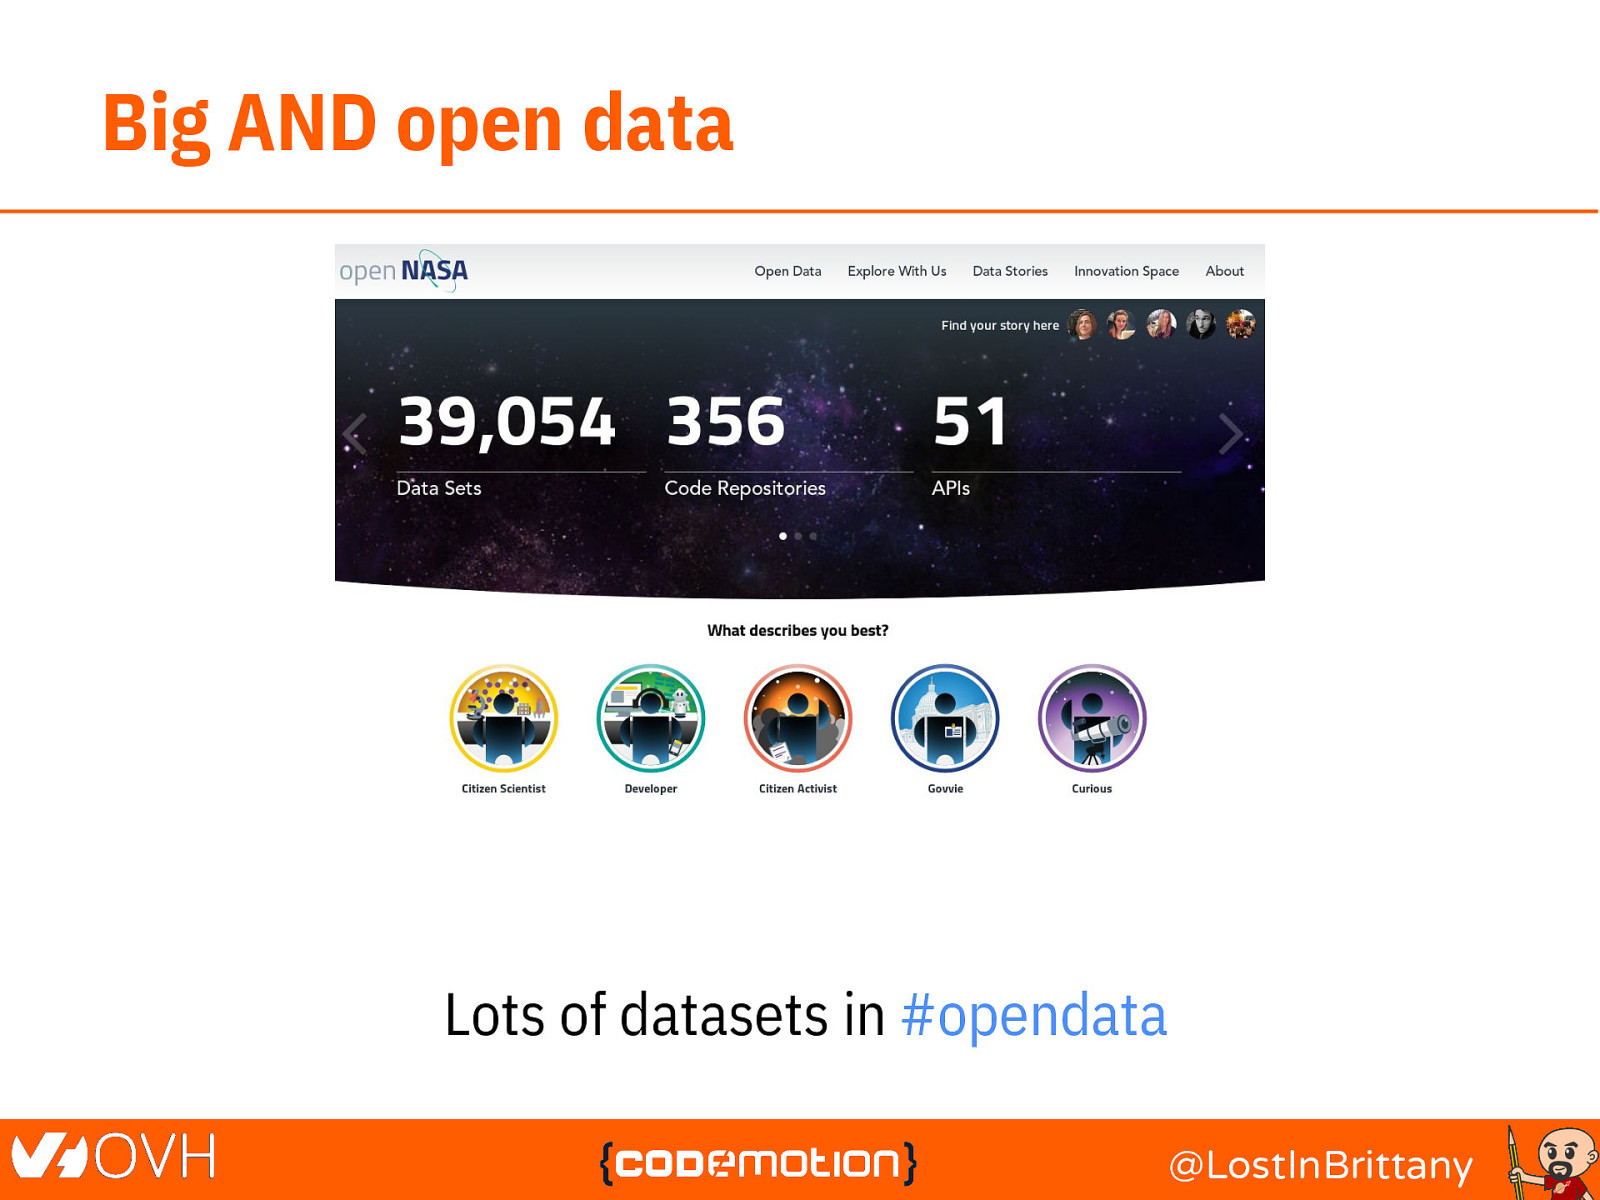
Big AND open data Lots of datasets in #opendata @LostInBrittany
And we can help with that! Let’s use our tools to analyse the data @LostInBrittany
Time Series To analyse Kepler datasets @LostInBrittany
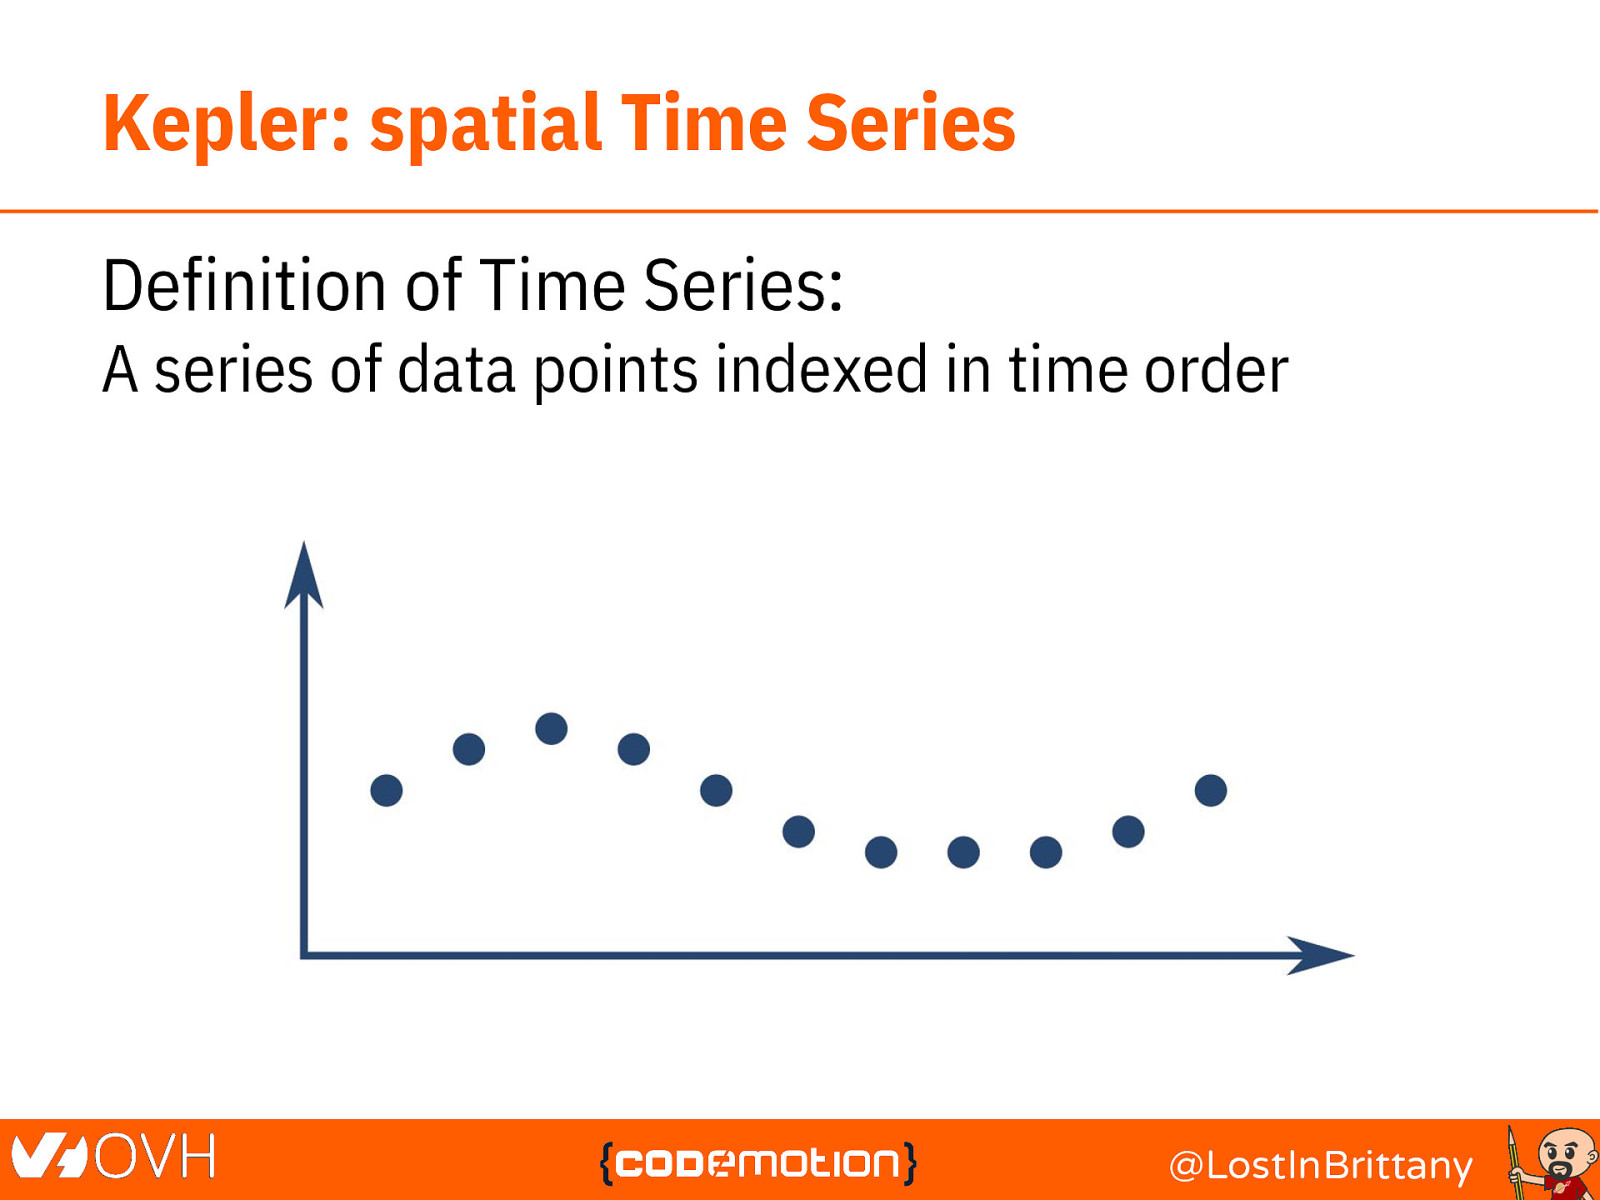
Kepler: spatial Time Series Definition of Time Series: A series of data points indexed in time order @LostInBrittany
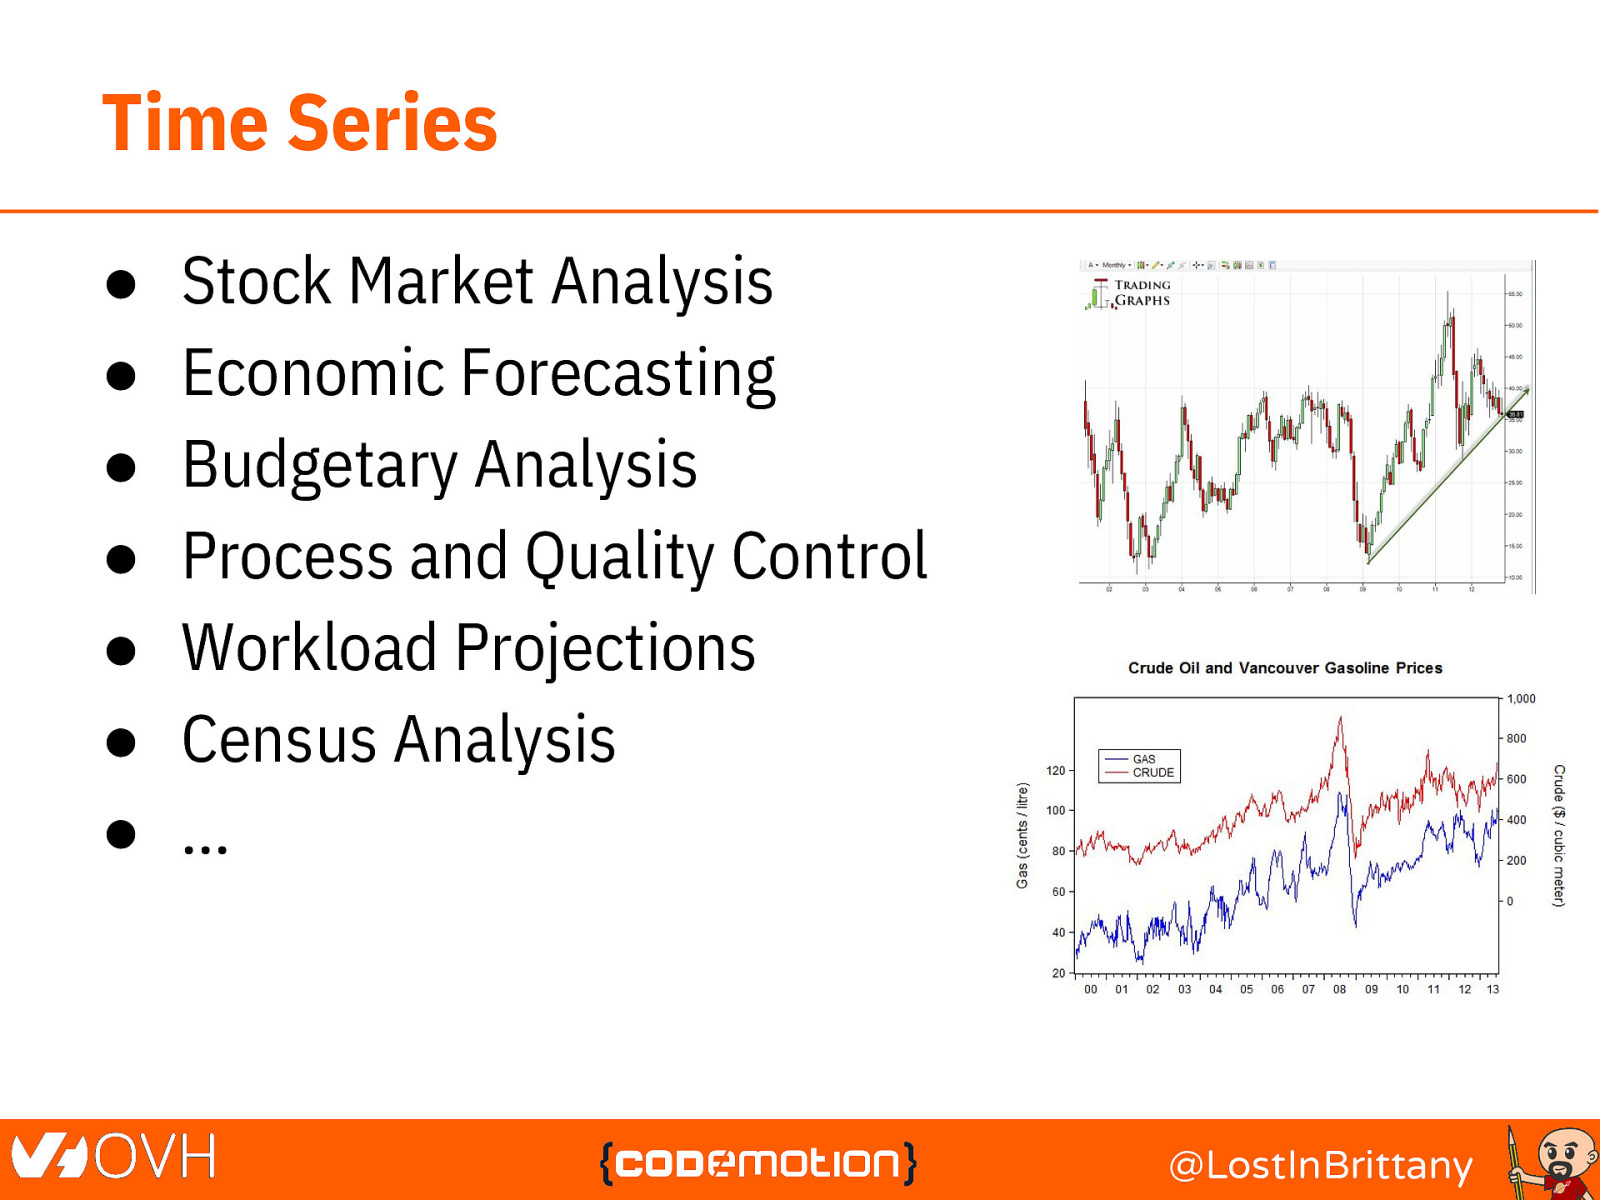
Time Series ● ● ● ● ● ● ● Stock Market Analysis Economic Forecasting Budgetary Analysis Process and Quality Control Workload Projections Census Analysis … @LostInBrittany
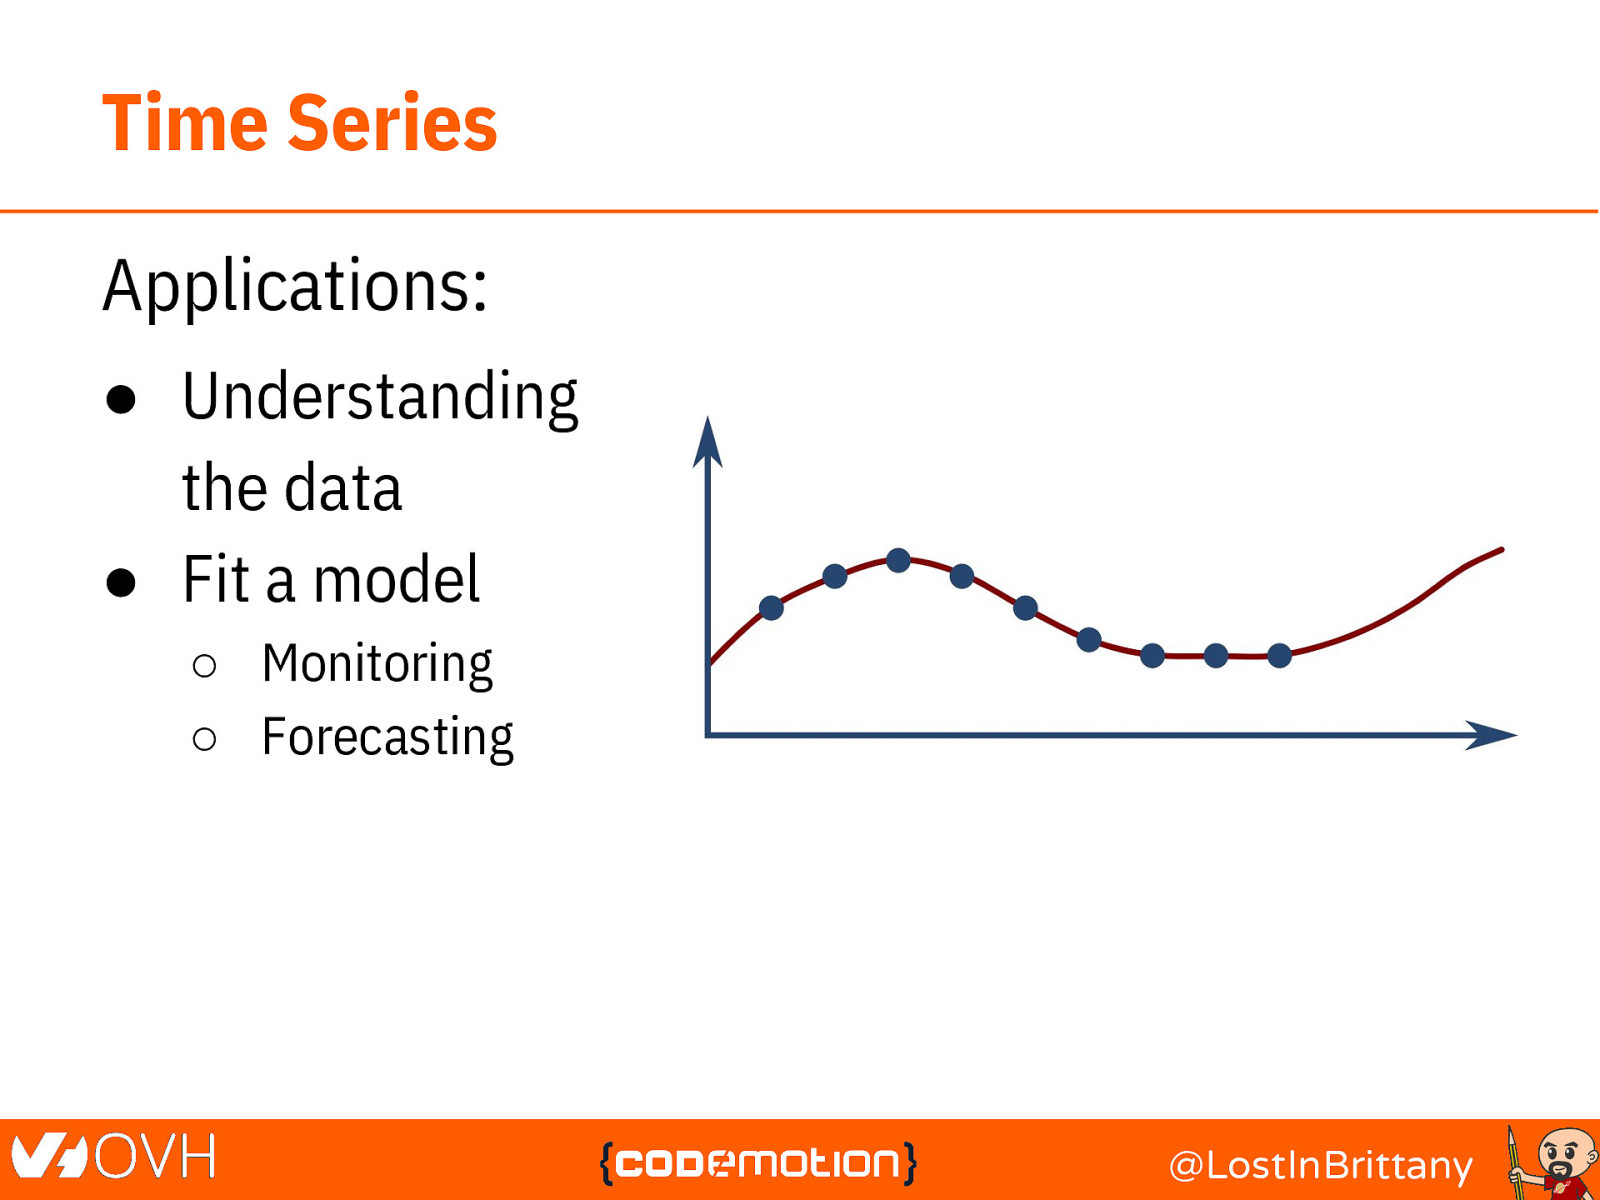
Time Series Applications: ● Understanding the data ● Fit a model ○ Monitoring ○ Forecasting @LostInBrittany
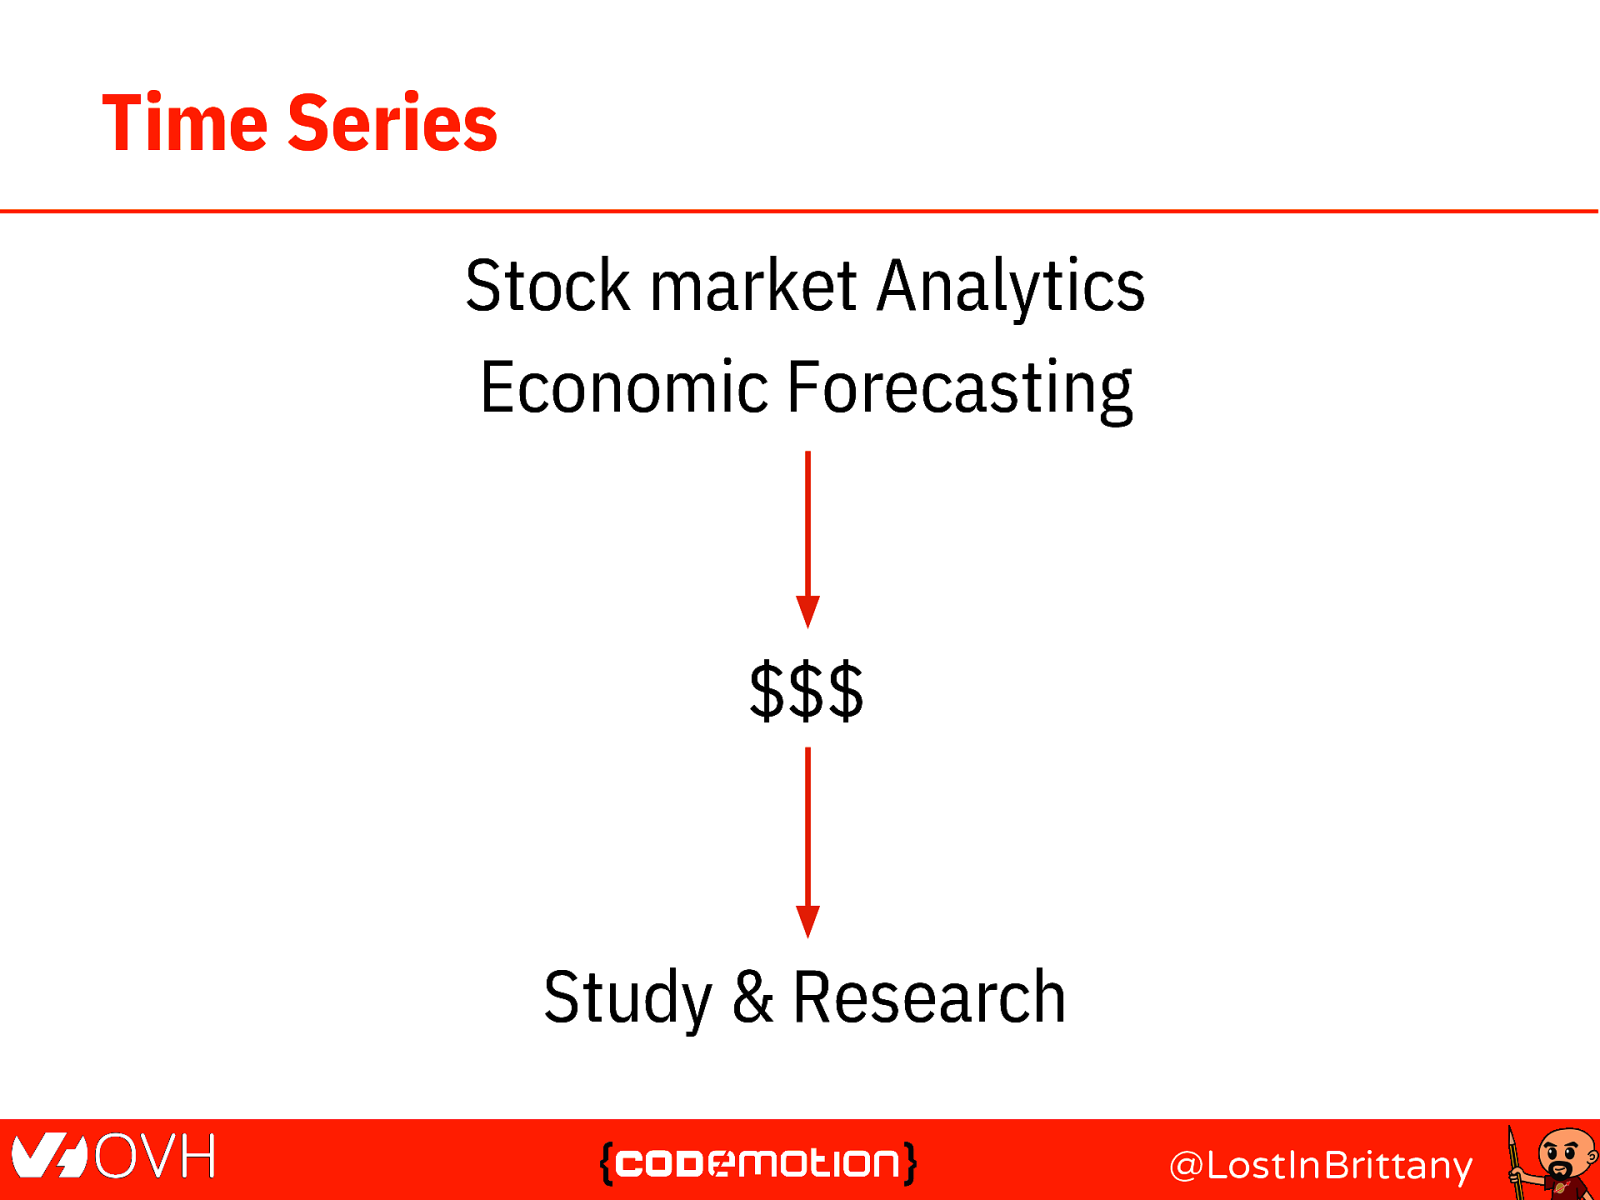
Time Series Stock market Analytics Economic Forecasting $$$ Study & Research @LostInBrittany
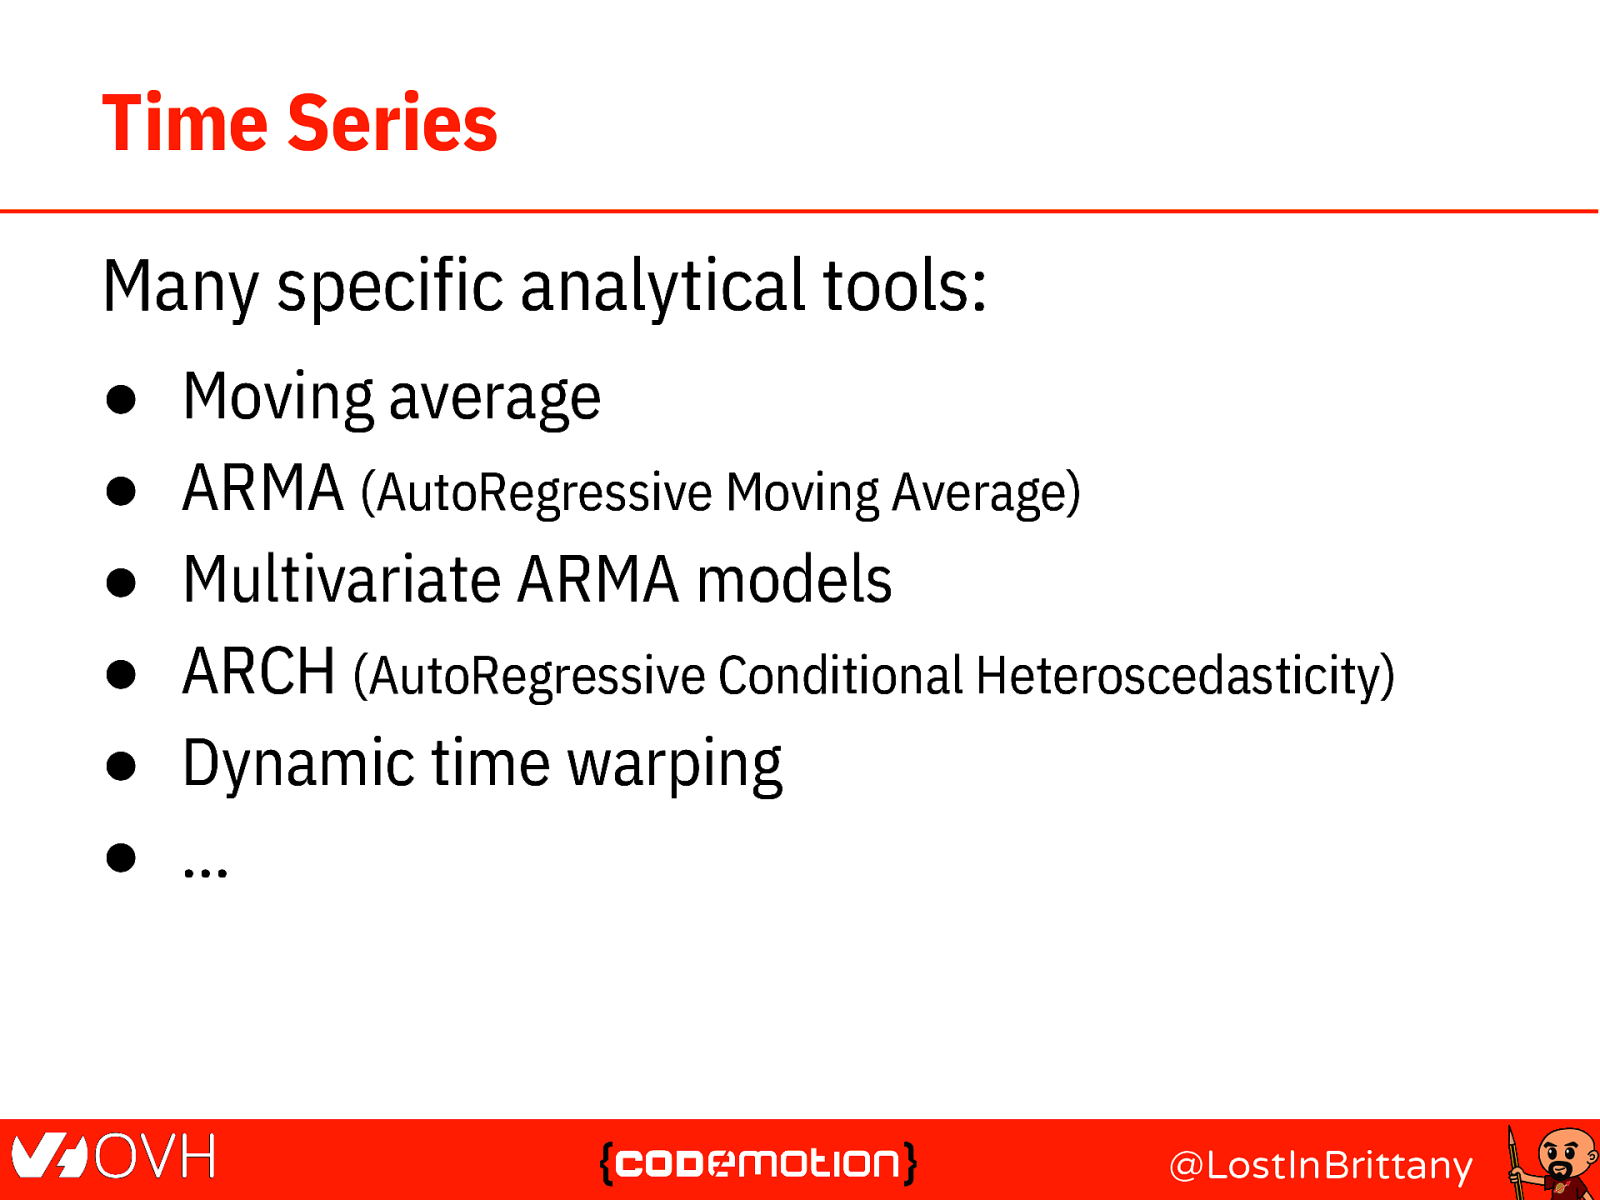
Time Series Many specific analytical tools: ● ● ● ● ● ● Moving average ARMA (AutoRegressive Moving Average) Multivariate ARMA models ARCH (AutoRegressive Conditional Heteroscedasticity) Dynamic time warping … @LostInBrittany
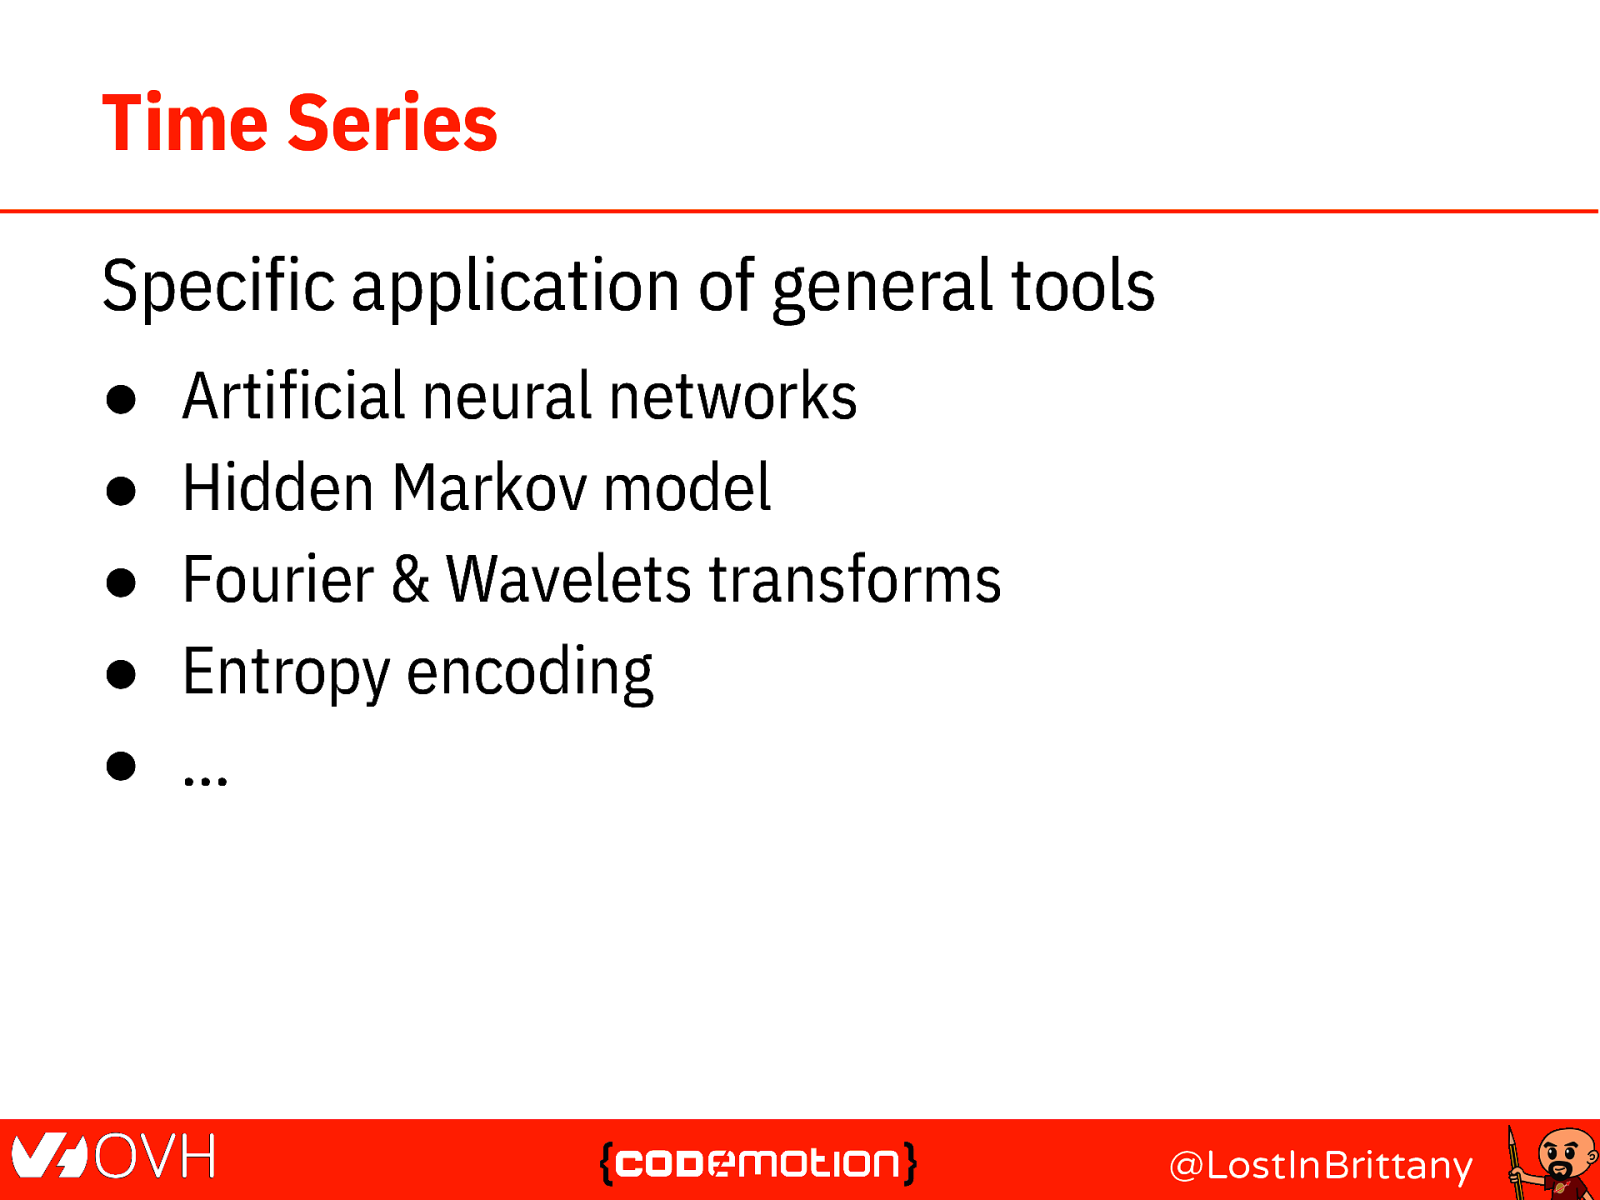
Time Series Specific application of general tools ● ● ● ● ● Artificial neural networks Hidden Markov model Fourier & Wavelets transforms Entropy encoding … @LostInBrittany
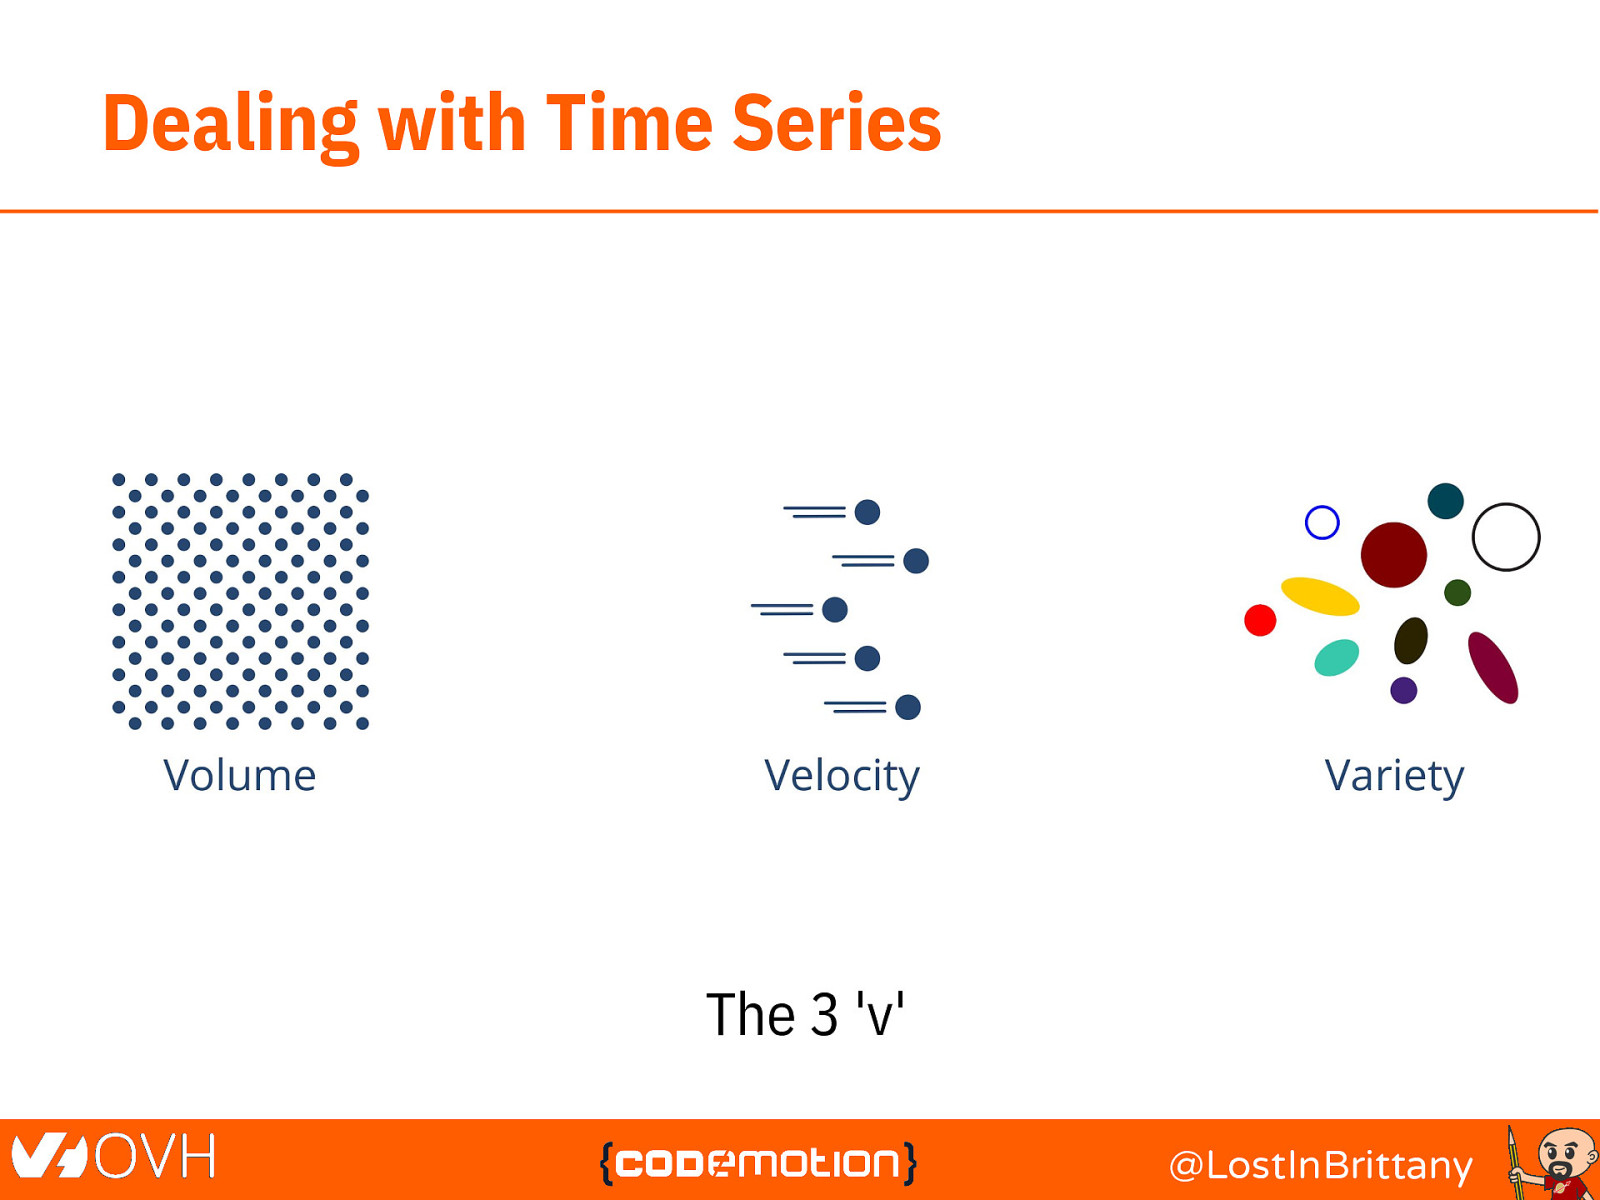
Dealing with Time Series The 3 ‘v’ @LostInBrittany
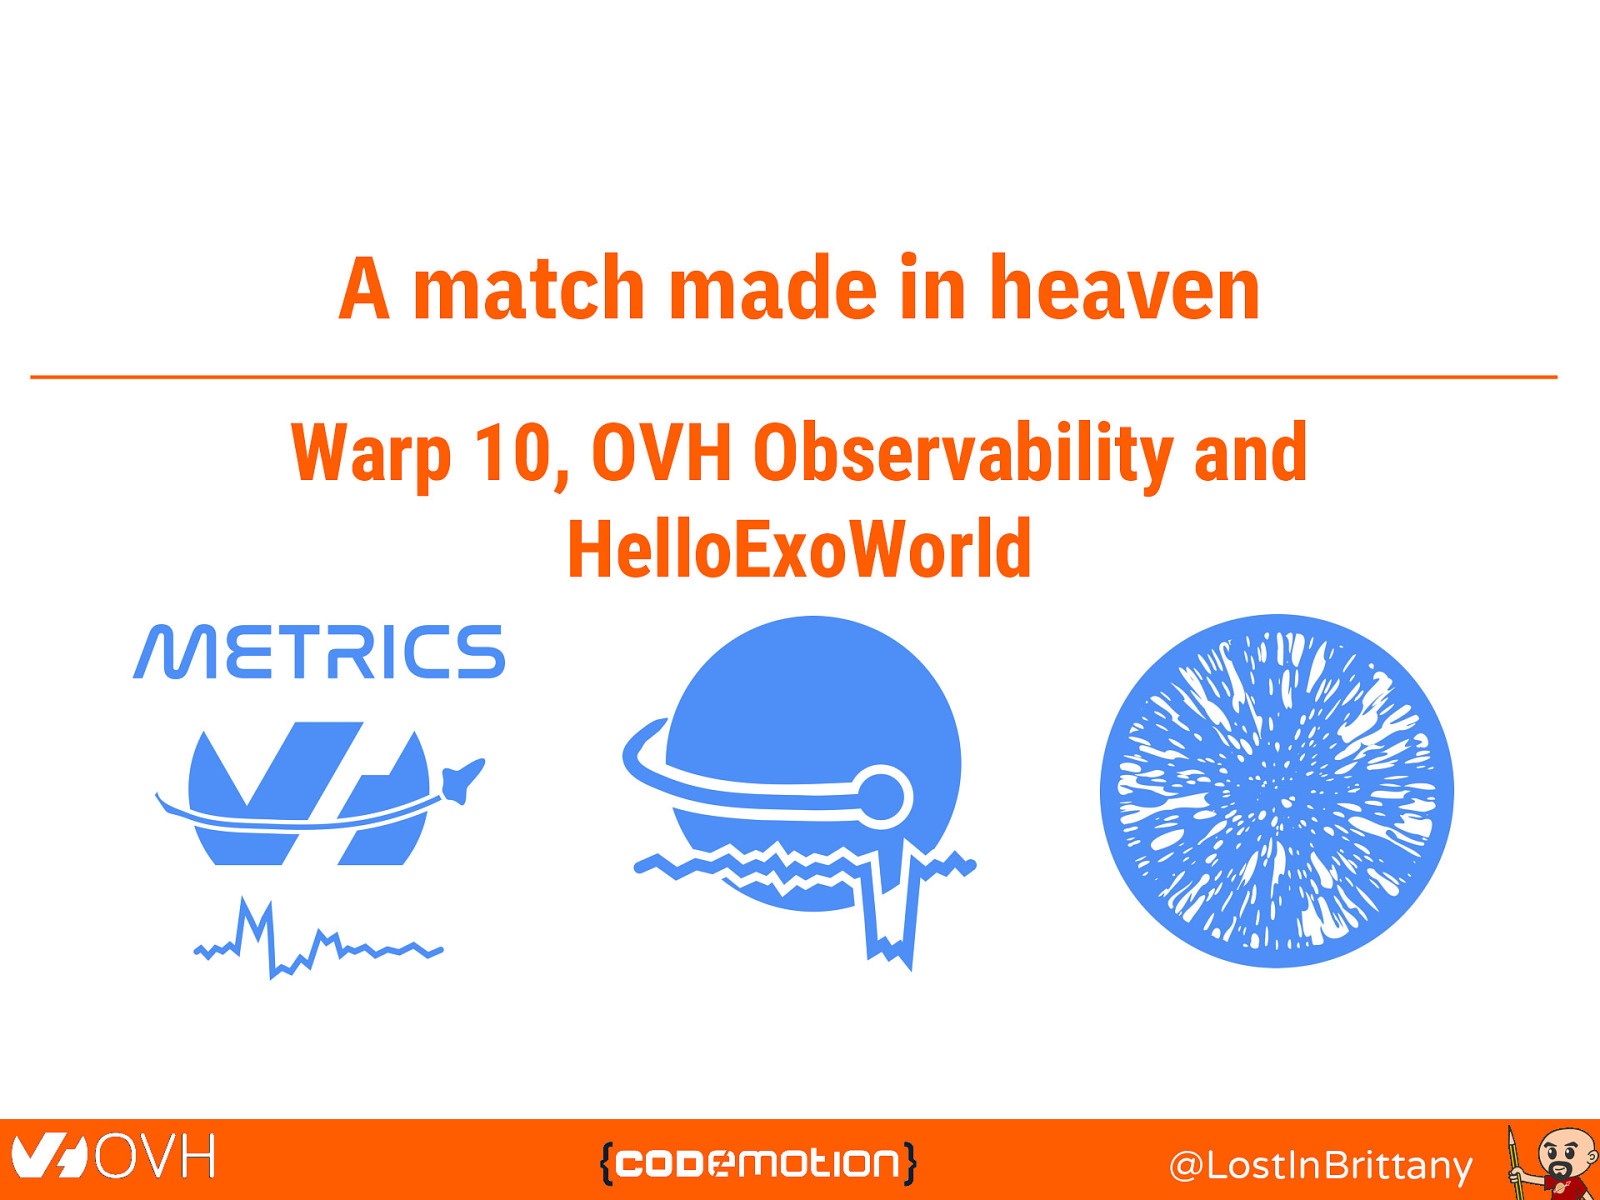
A match made in heaven Warp 10, OVH Observability and HelloExoWorld @LostInBrittany
Monitoring OVH with Time Series @LostInBrittany
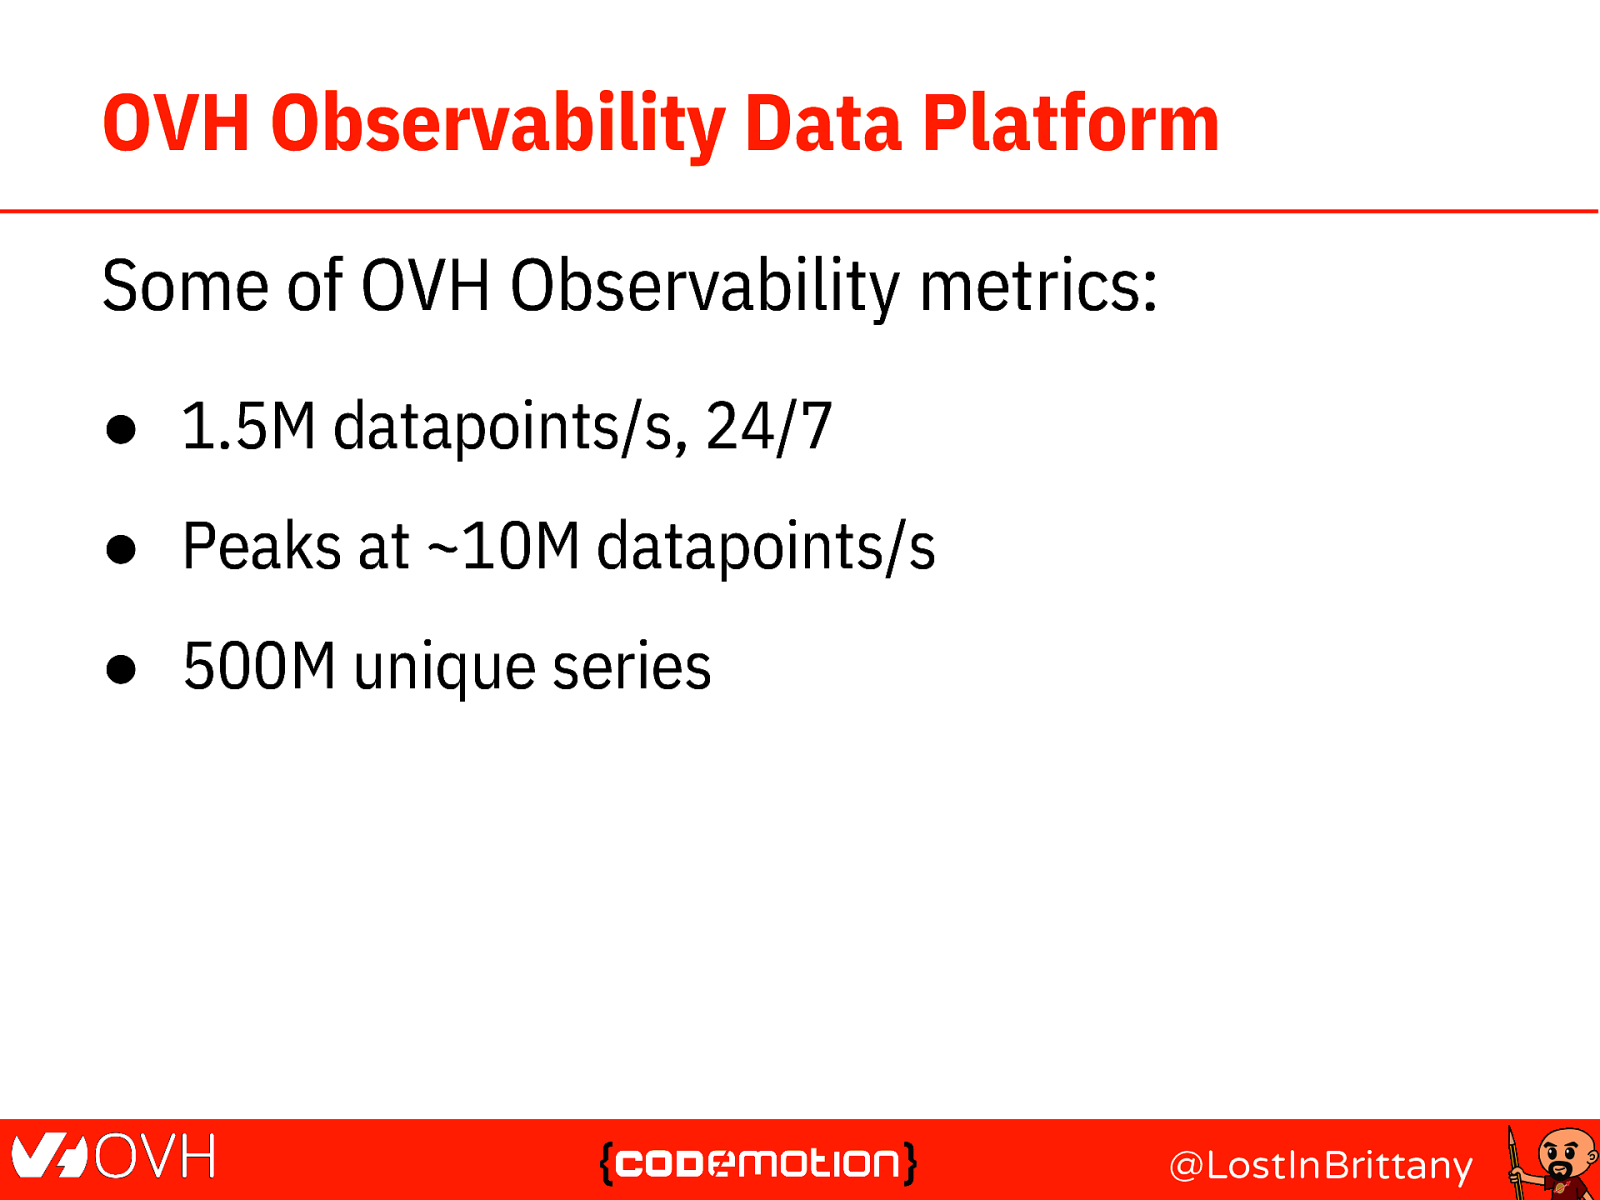
OVH Observability Data Platform Some of OVH Observability metrics: ● 1.5M datapoints/s, 24/7 ● Peaks at ~10M datapoints/s ● 500M unique series @LostInBrittany
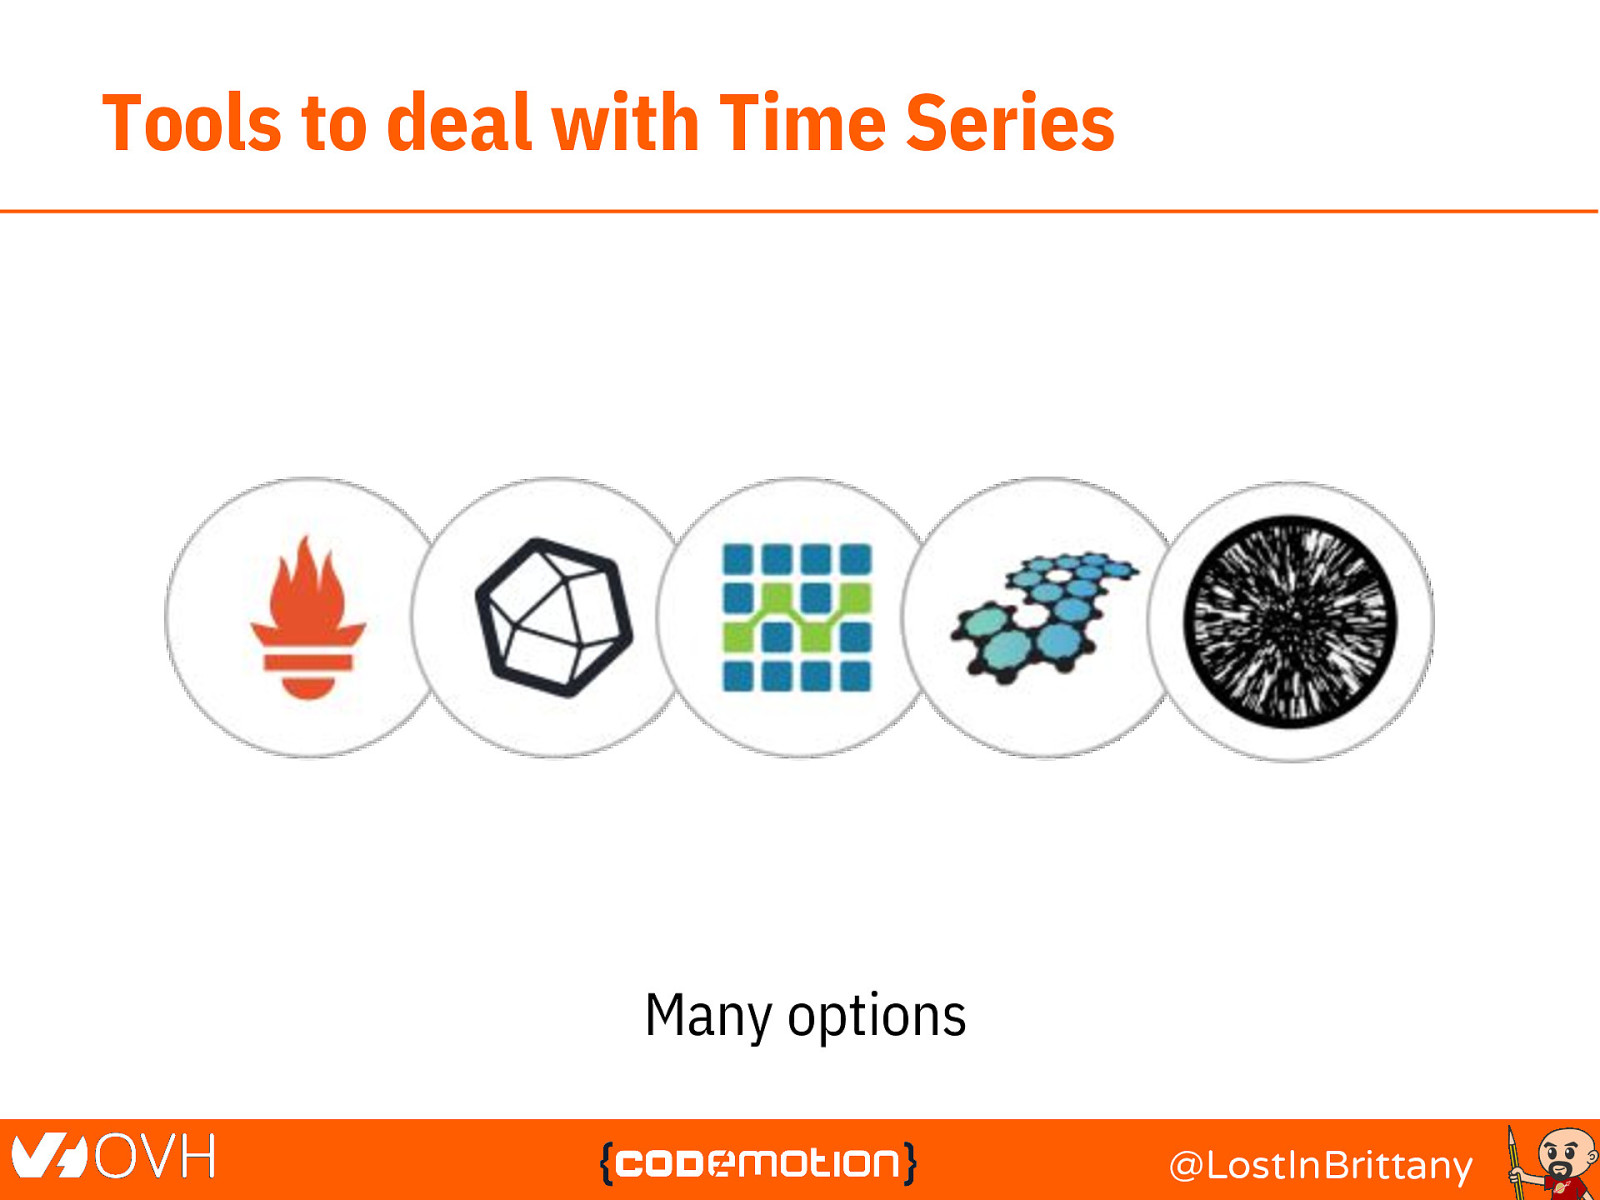
Tools to deal with Time Series Many options @LostInBrittany
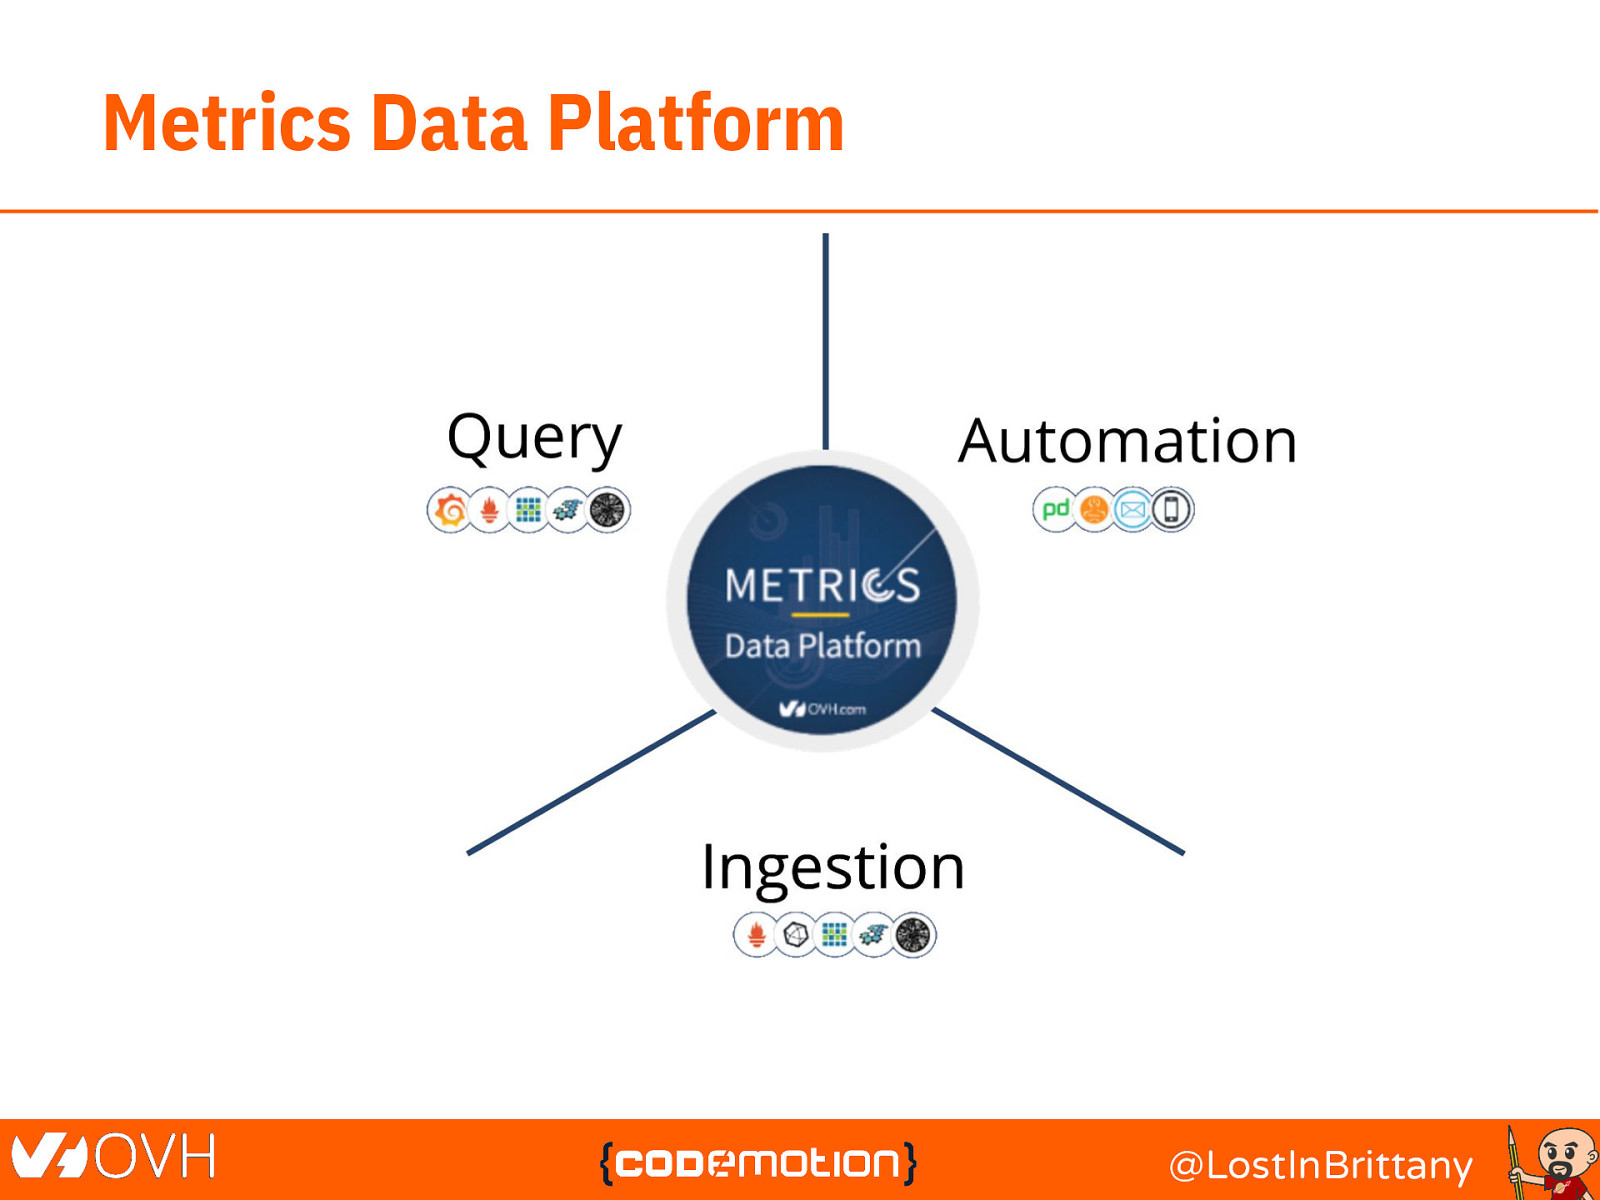
Metrics Data Platform @LostInBrittany
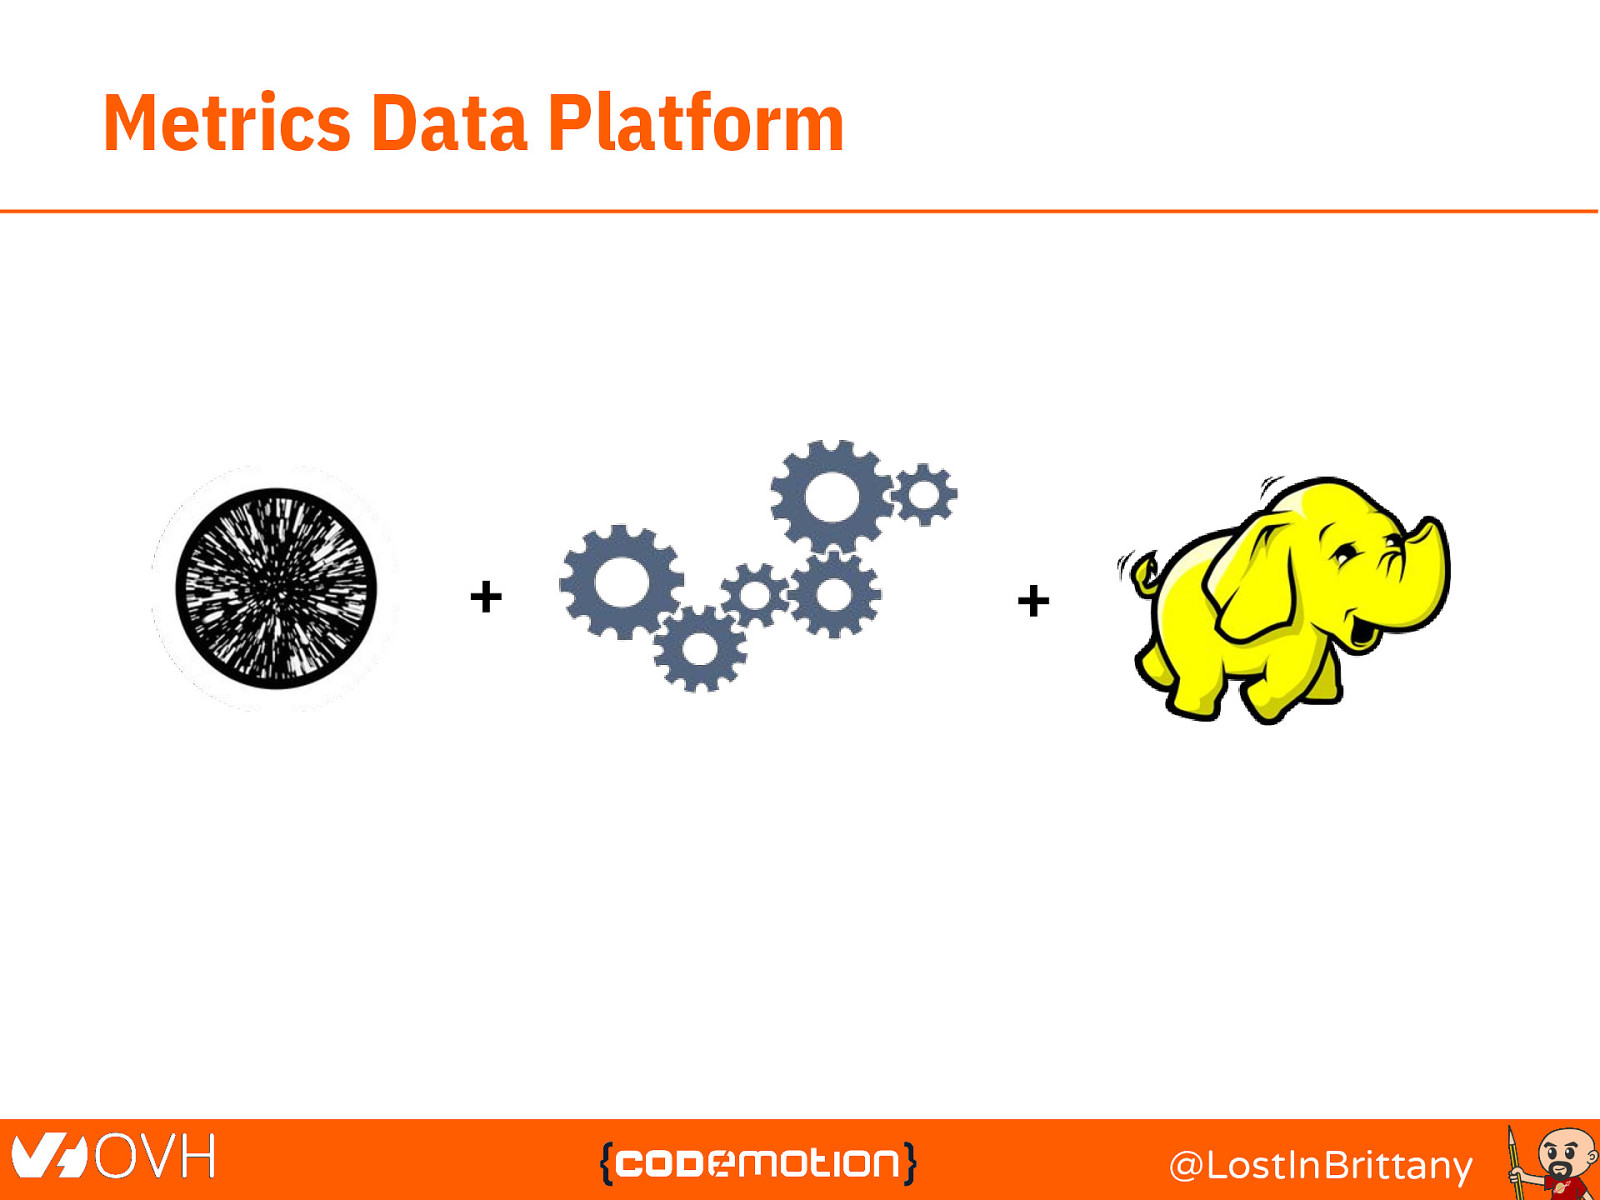
Metrics Data Platform + + @LostInBrittany
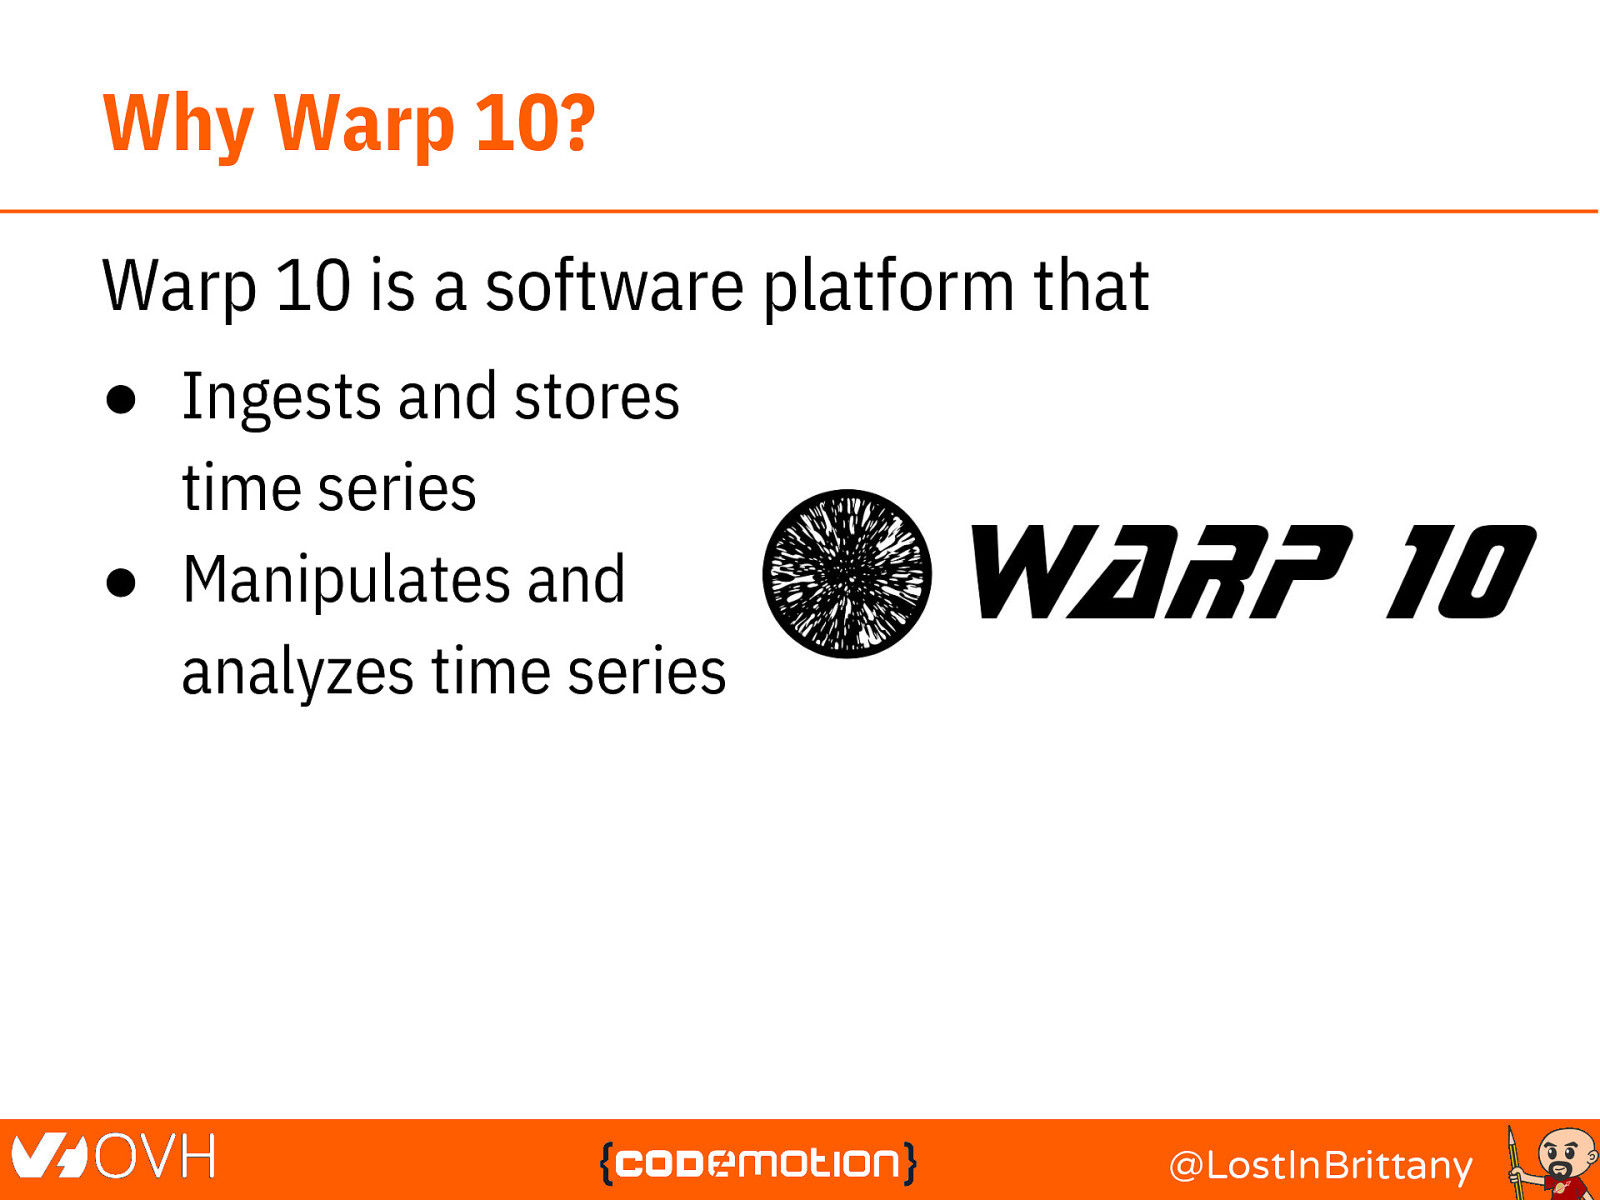
Why Warp 10? Warp 10 is a software platform that ● Ingests and stores time series ● Manipulates and analyzes time series @LostInBrittany
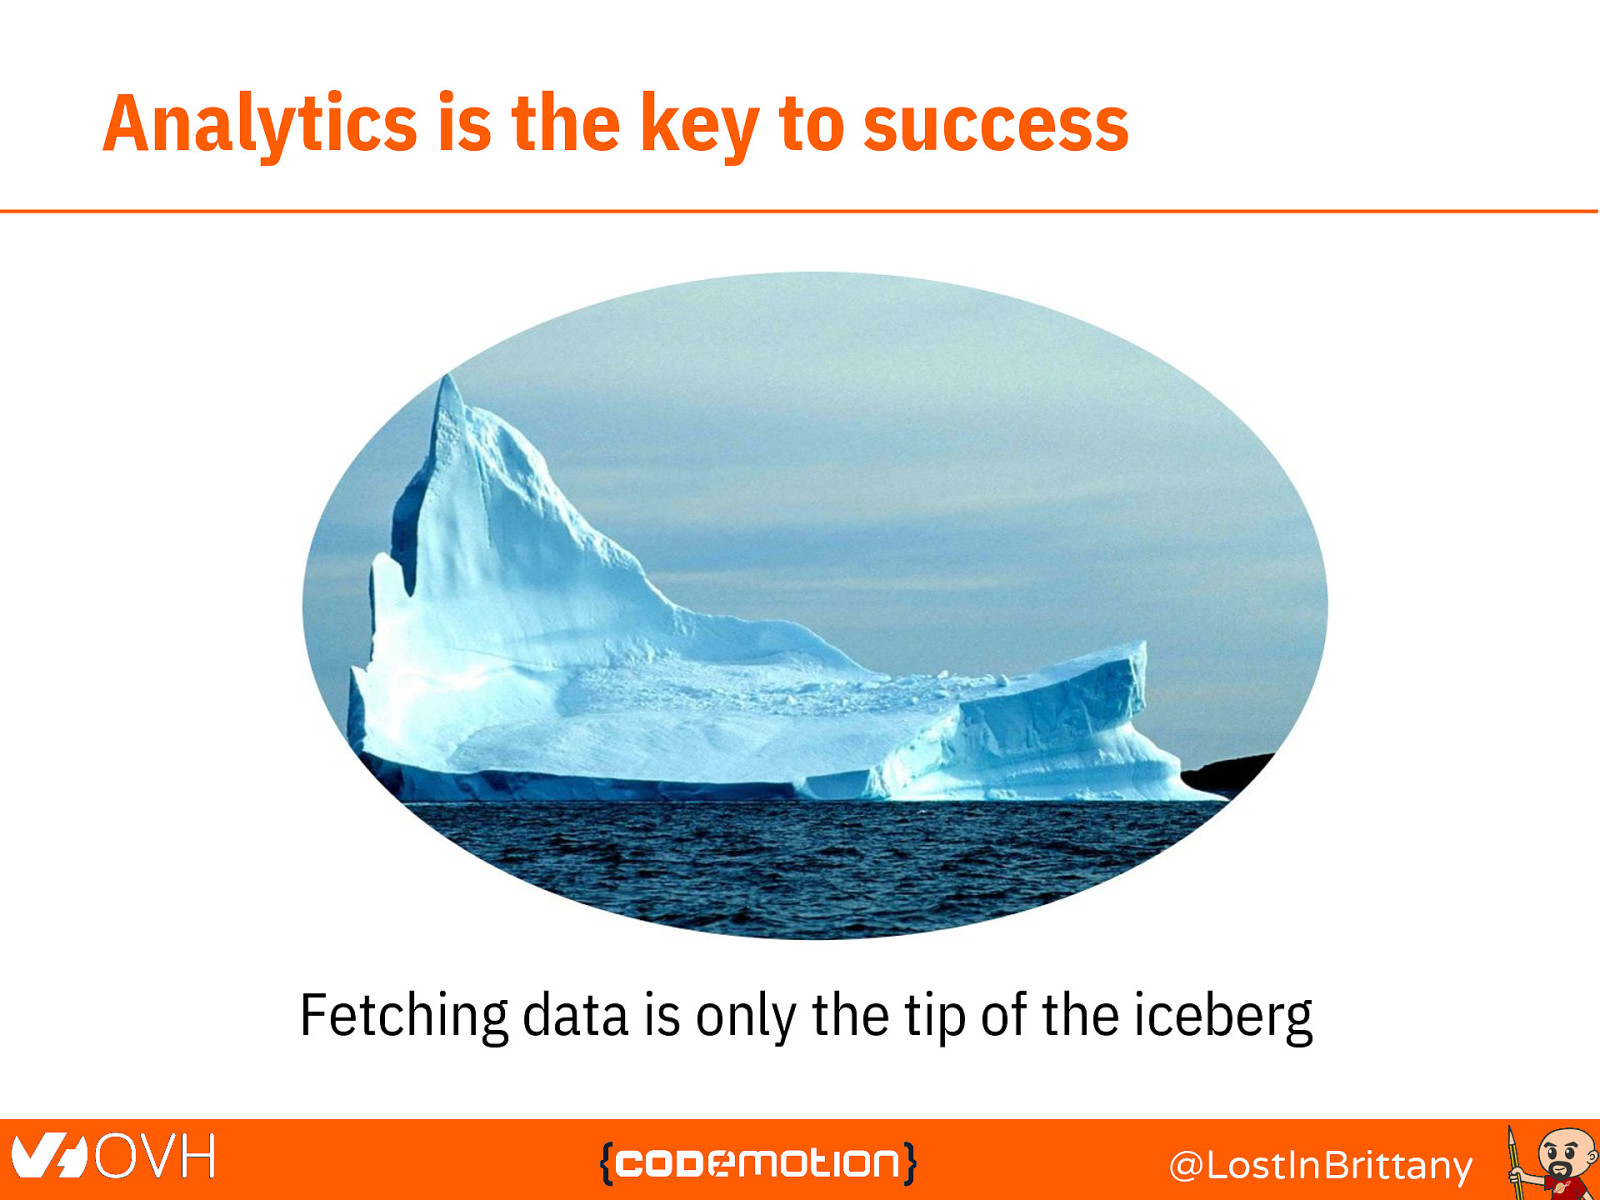
Analytics is the key to success Fetching data is only the tip of the iceberg @LostInBrittany
Manipulating Time Series with Warp 10 A true Time Series analysis toolbox ○ Hundreds of functions ○ Manipulation frameworks ○ Analysis workflow @LostInBrittany
What we have done ● ● ● ● Downloaded and parsed 40 millions of FITS files Pushed it to OVH Metrics Select a cool subset as training set Verified we could find the same planets as NASA @LostInBrittany

Choosing a star: Kepler 11 Image credit: NASA/Tim Pyle @LostInBrittany
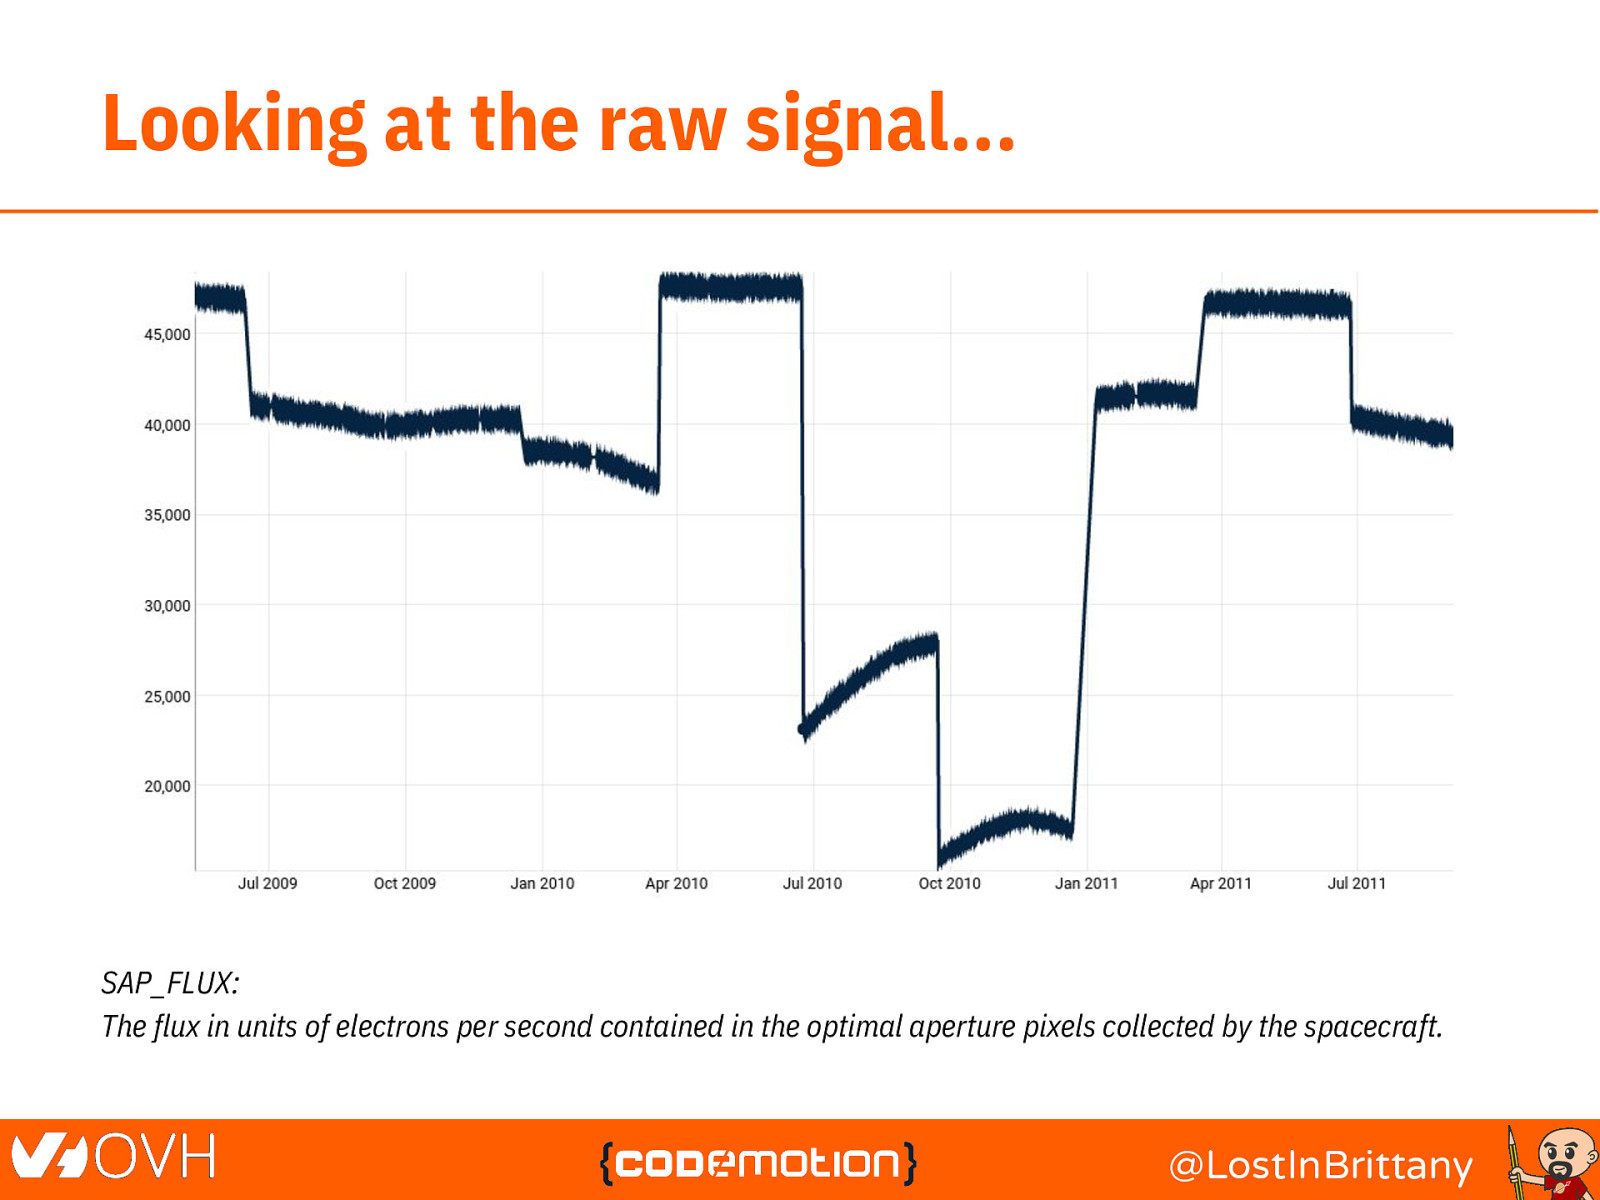
Looking at the raw signal… SAP_FLUX: The flux in units of electrons per second contained in the optimal aperture pixels collected by the spacecraft. @LostInBrittany
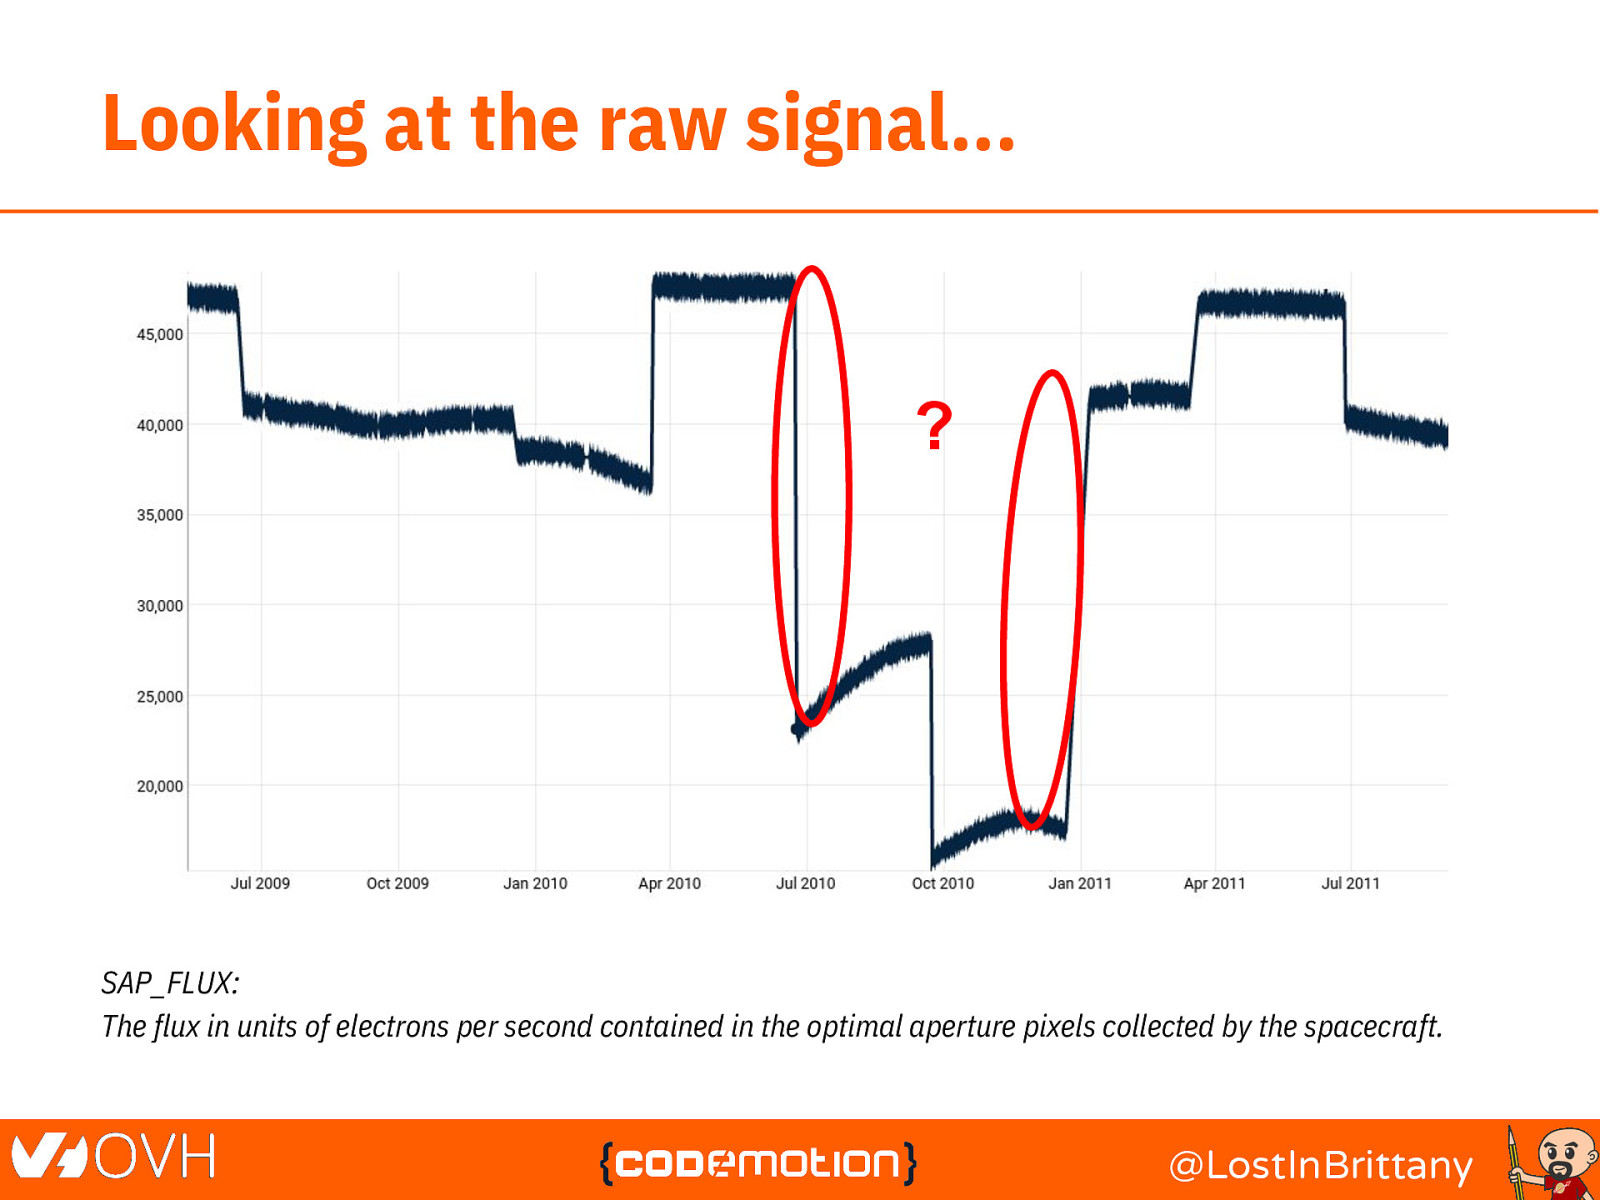
Looking at the raw signal… ? SAP_FLUX: The flux in units of electrons per second contained in the optimal aperture pixels collected by the spacecraft. @LostInBrittany
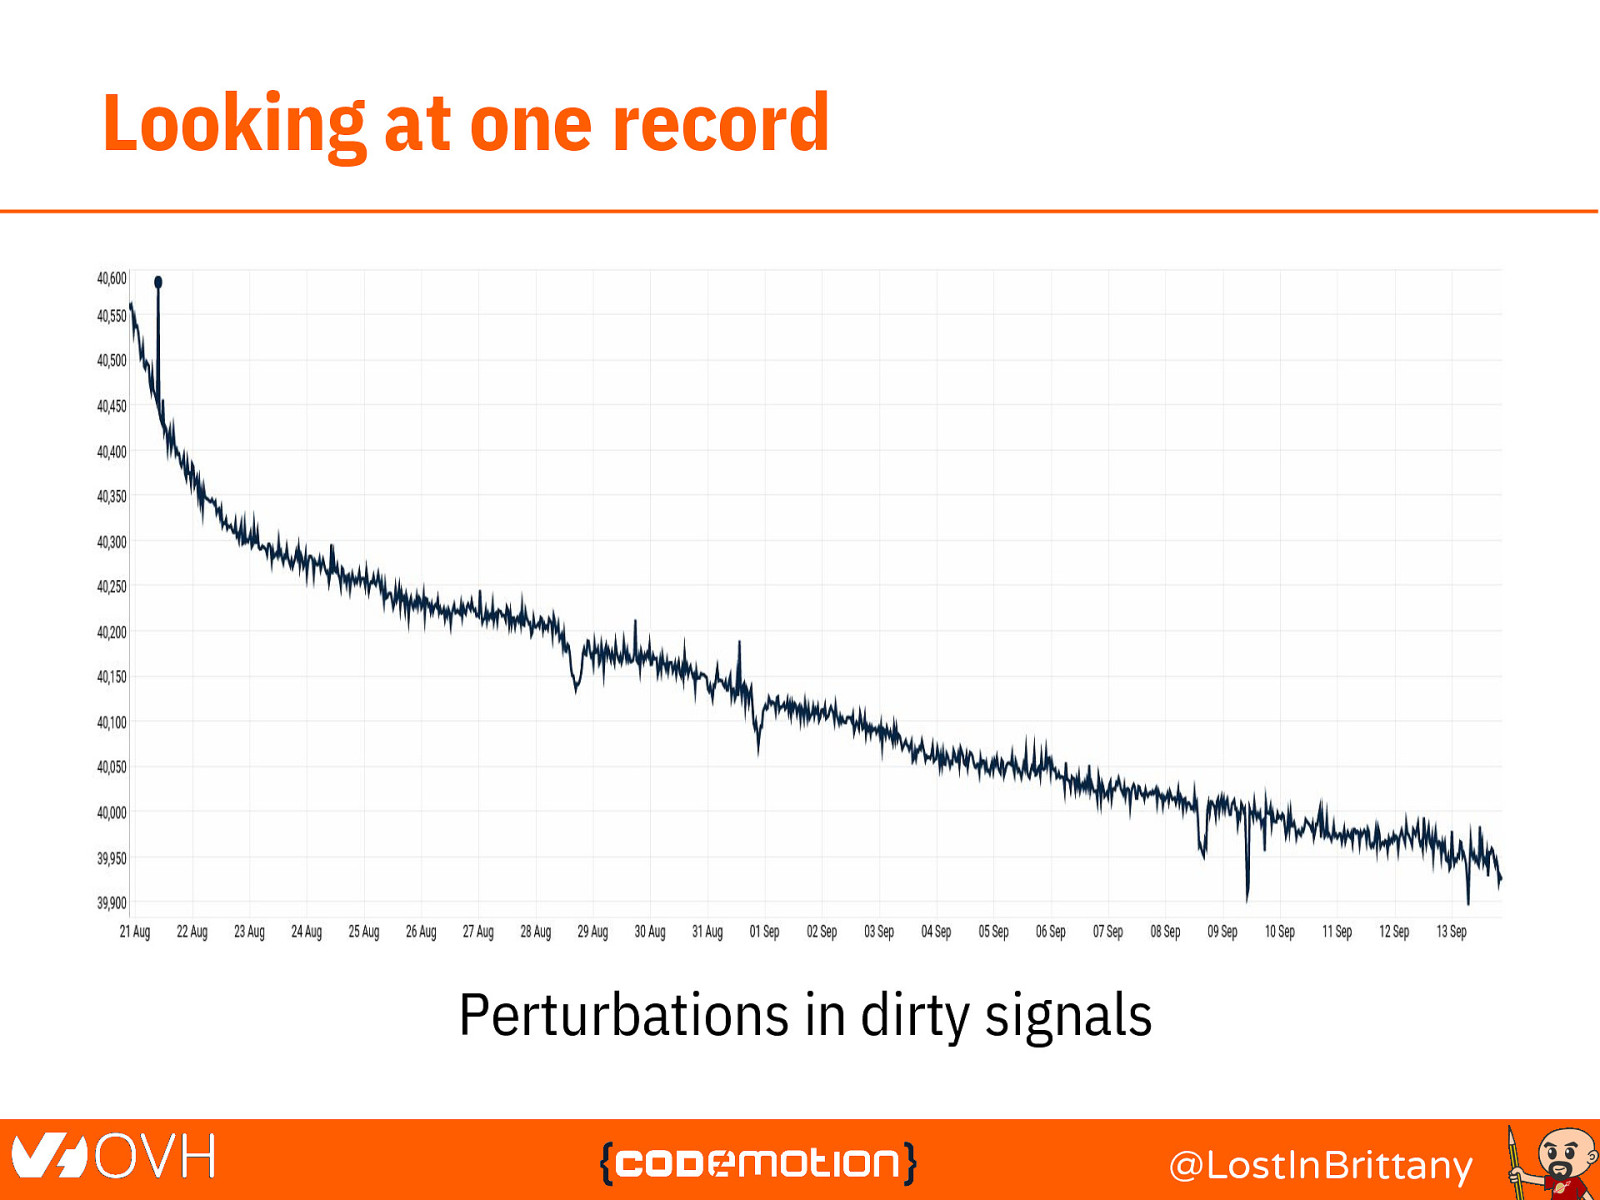
Looking at one record Perturbations in dirty signals @LostInBrittany
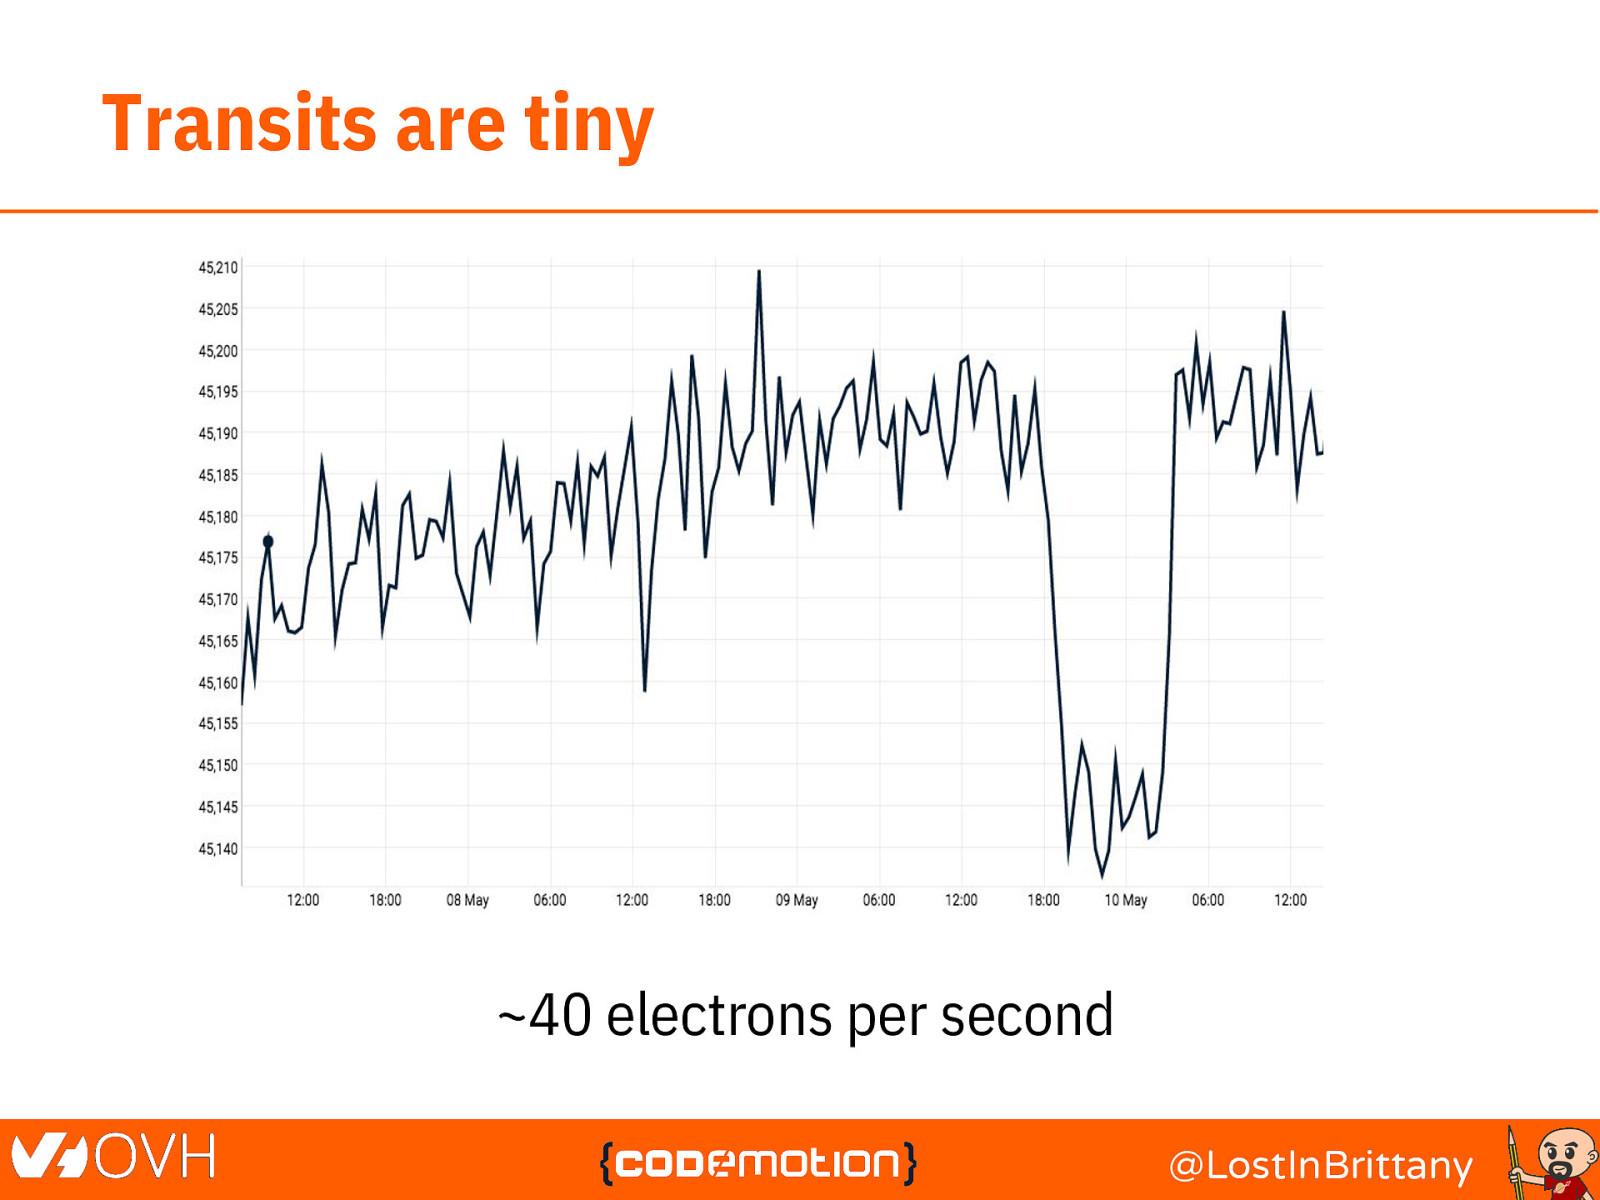
Transits are tiny ~40 electrons per second @LostInBrittany
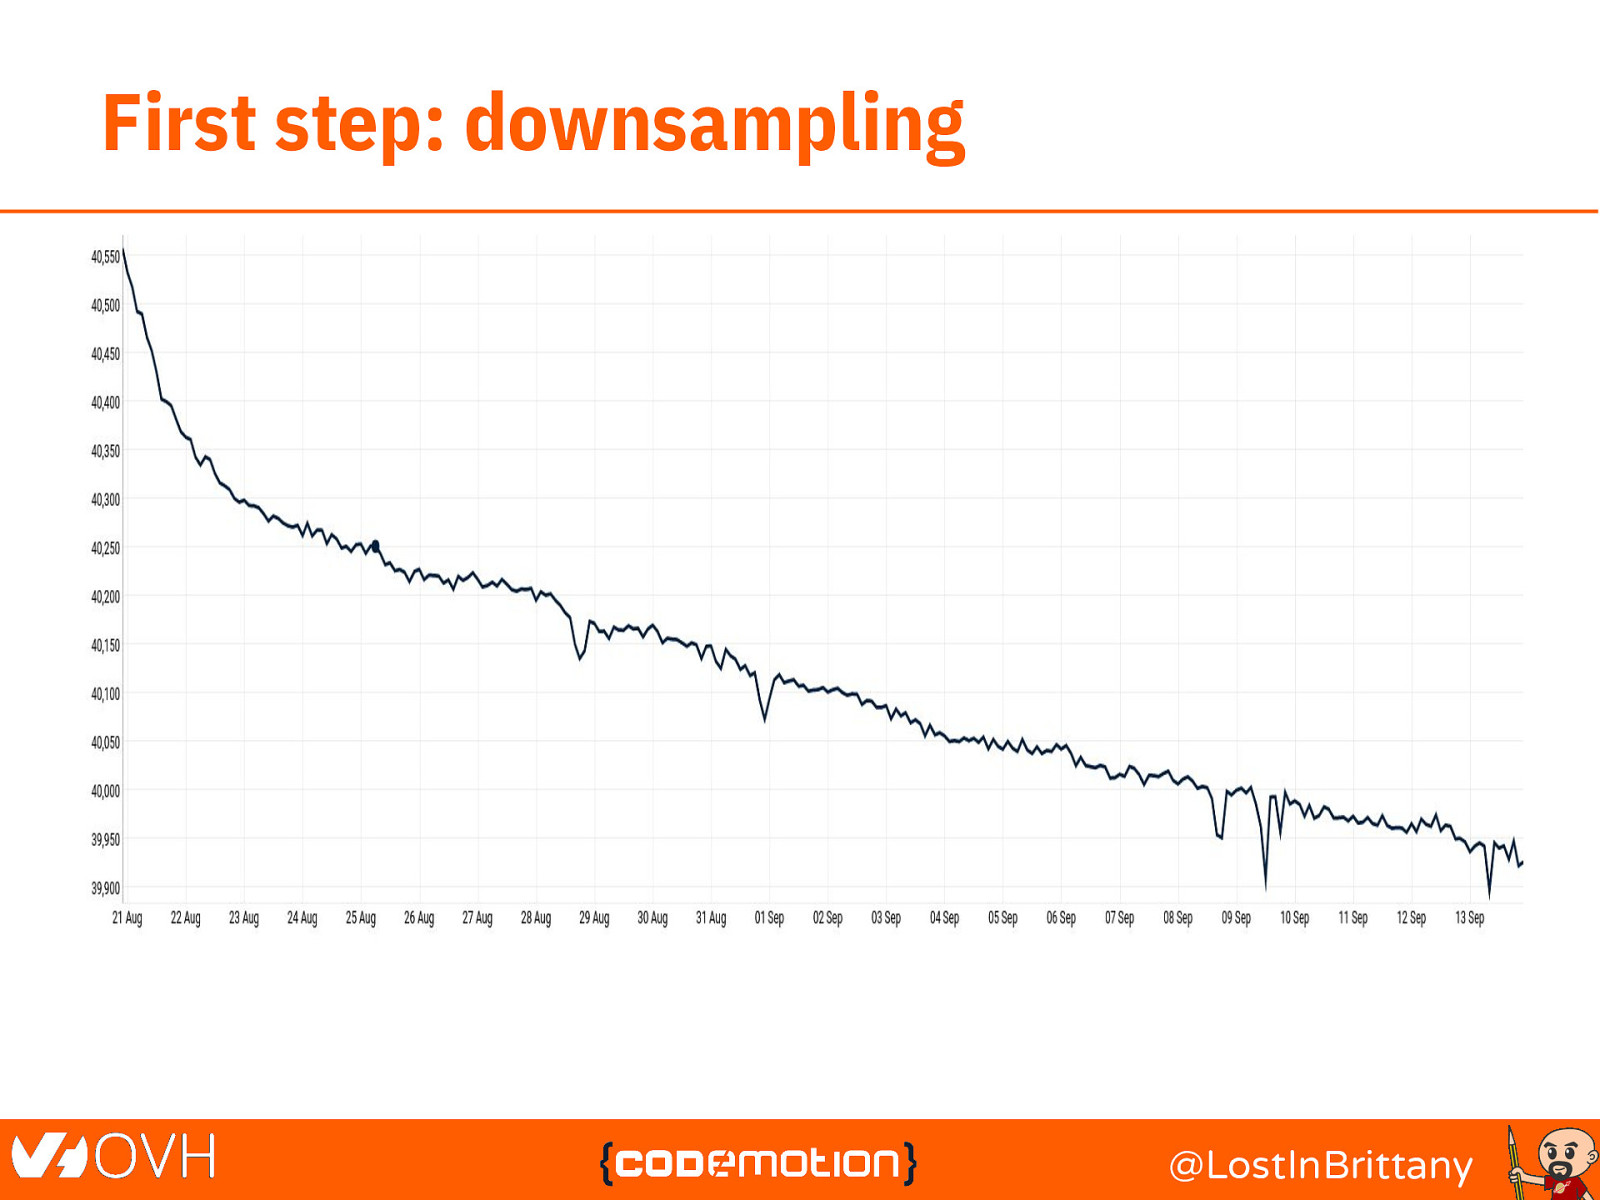
First step: downsampling @LostInBrittany
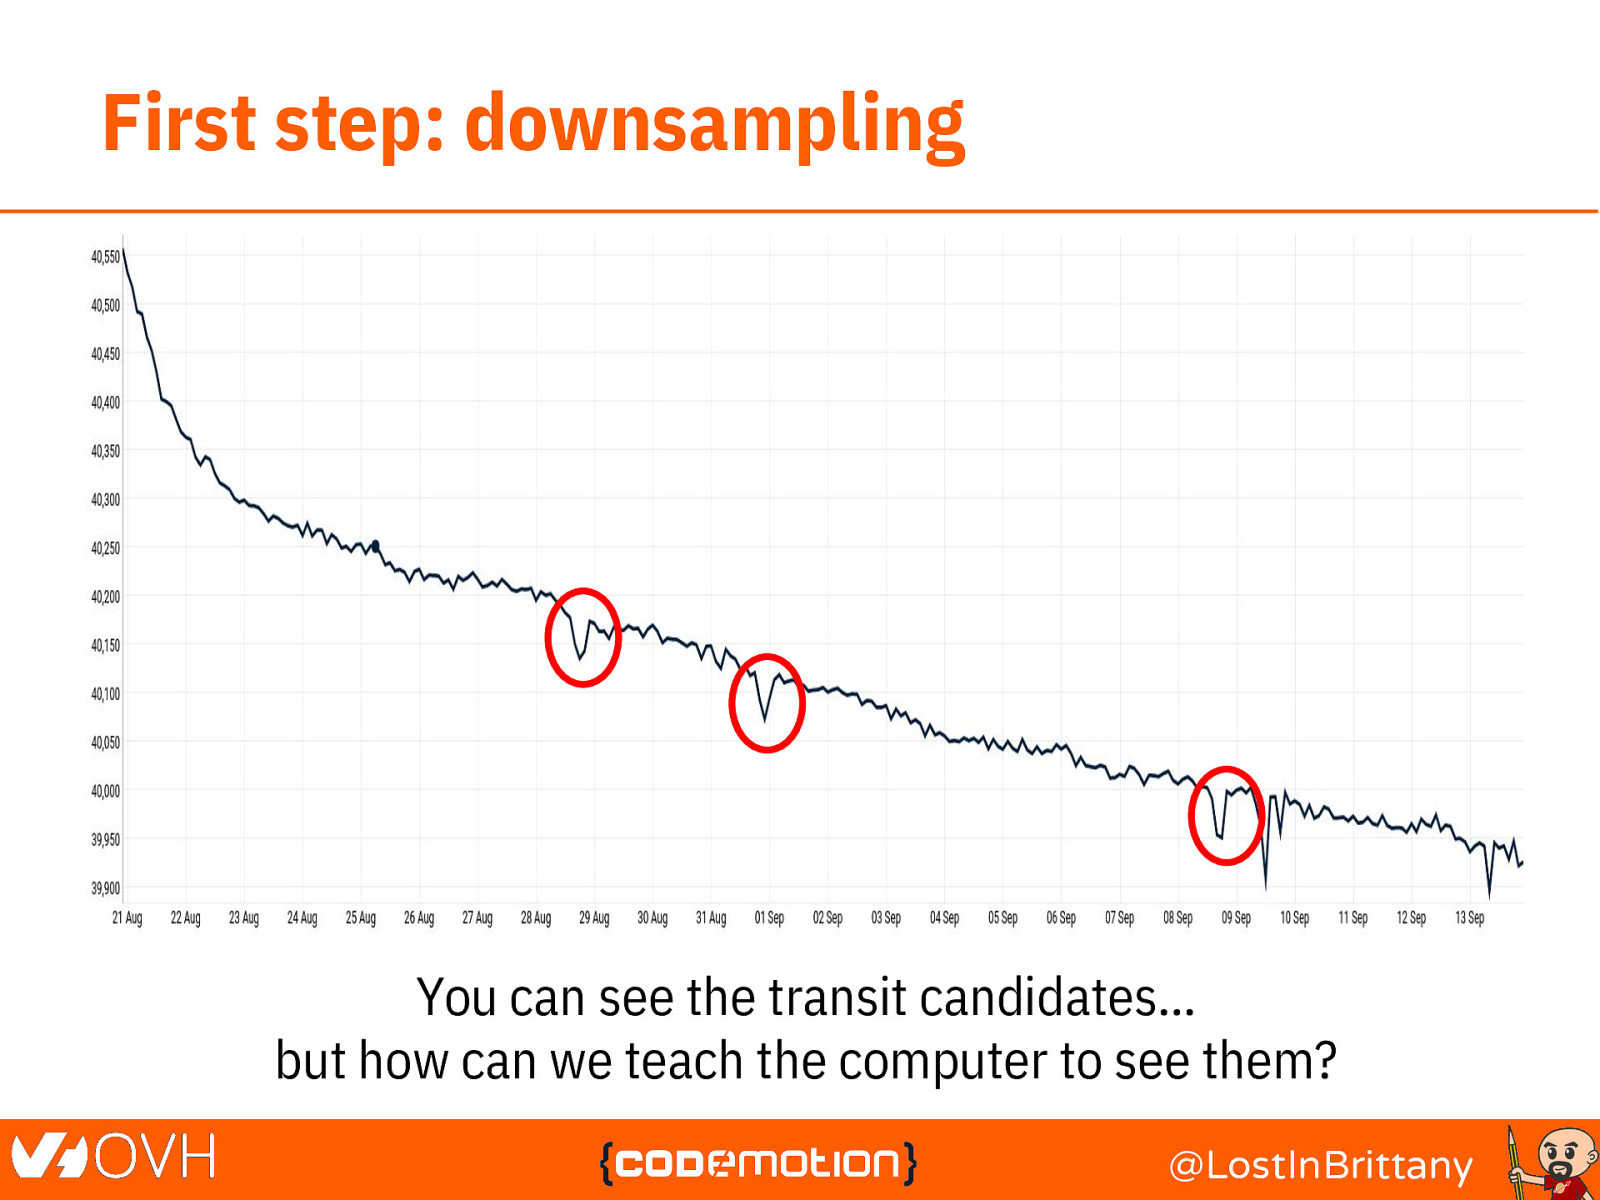
First step: downsampling You can see the transit candidates… but how can we teach the computer to see them? @LostInBrittany
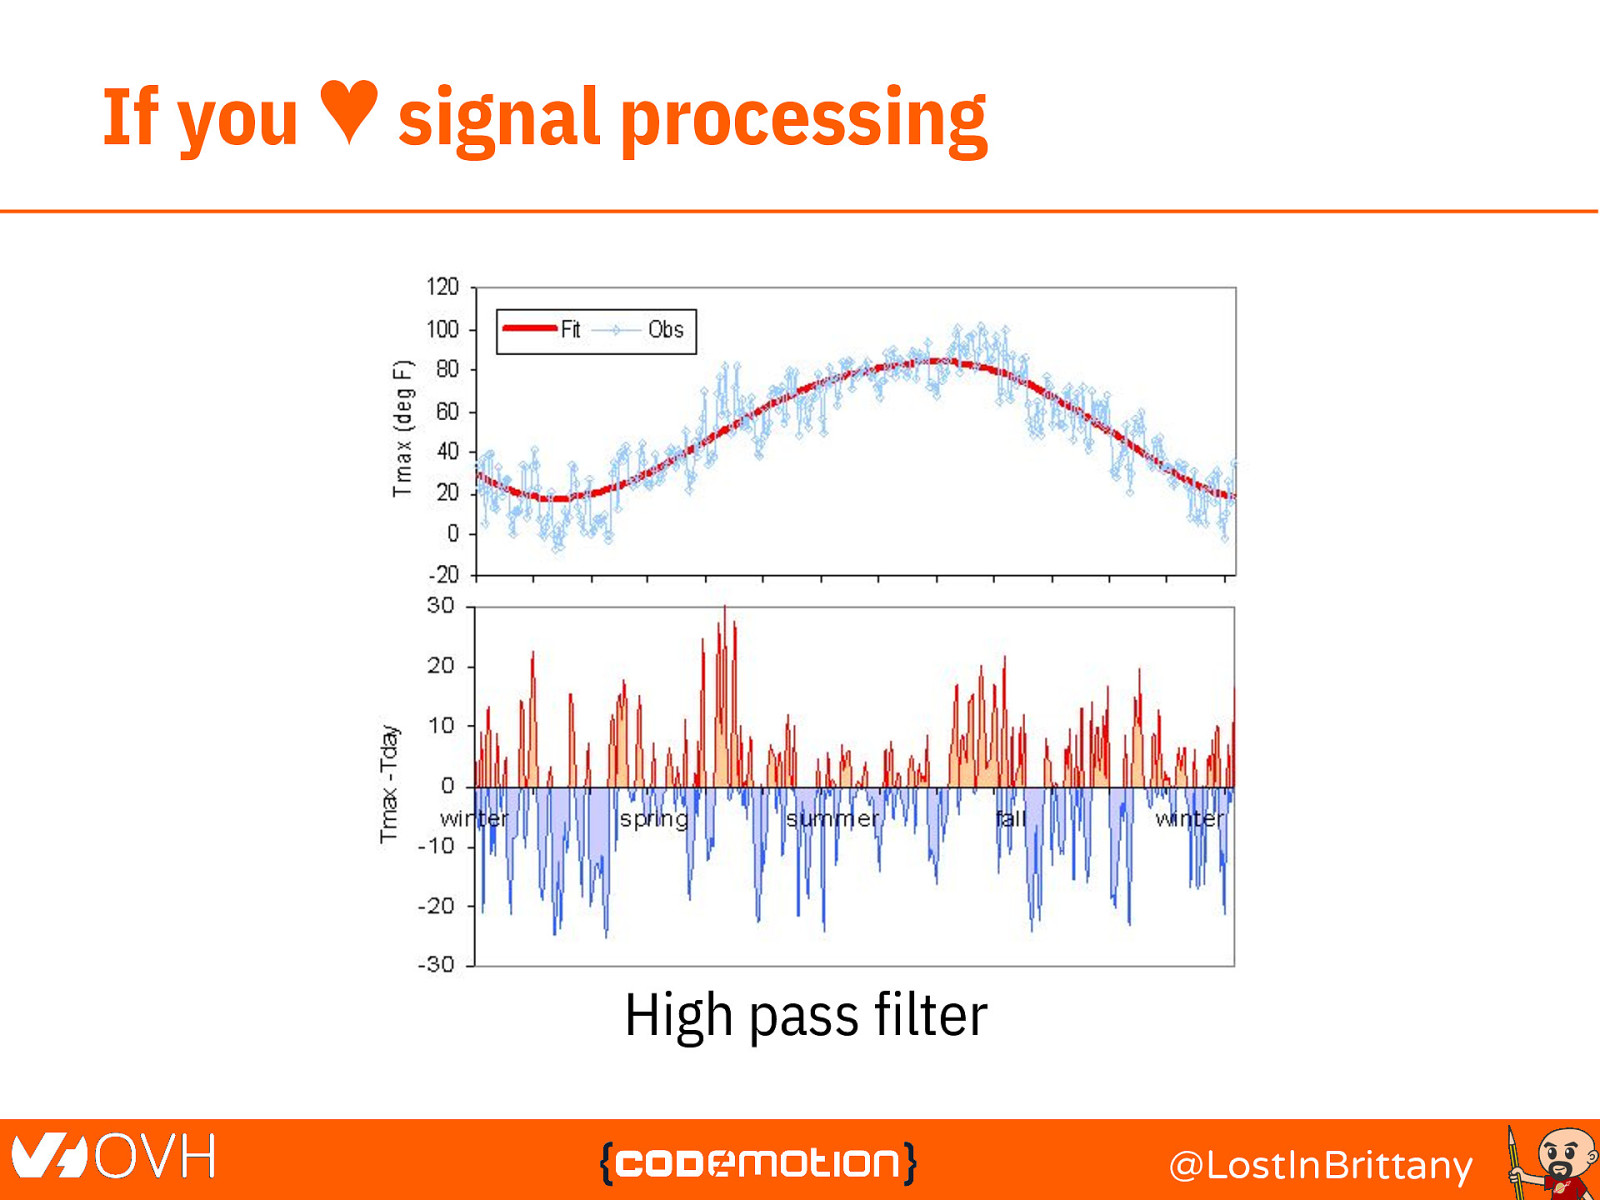
If you ♥ signal processing High pass filter @LostInBrittany
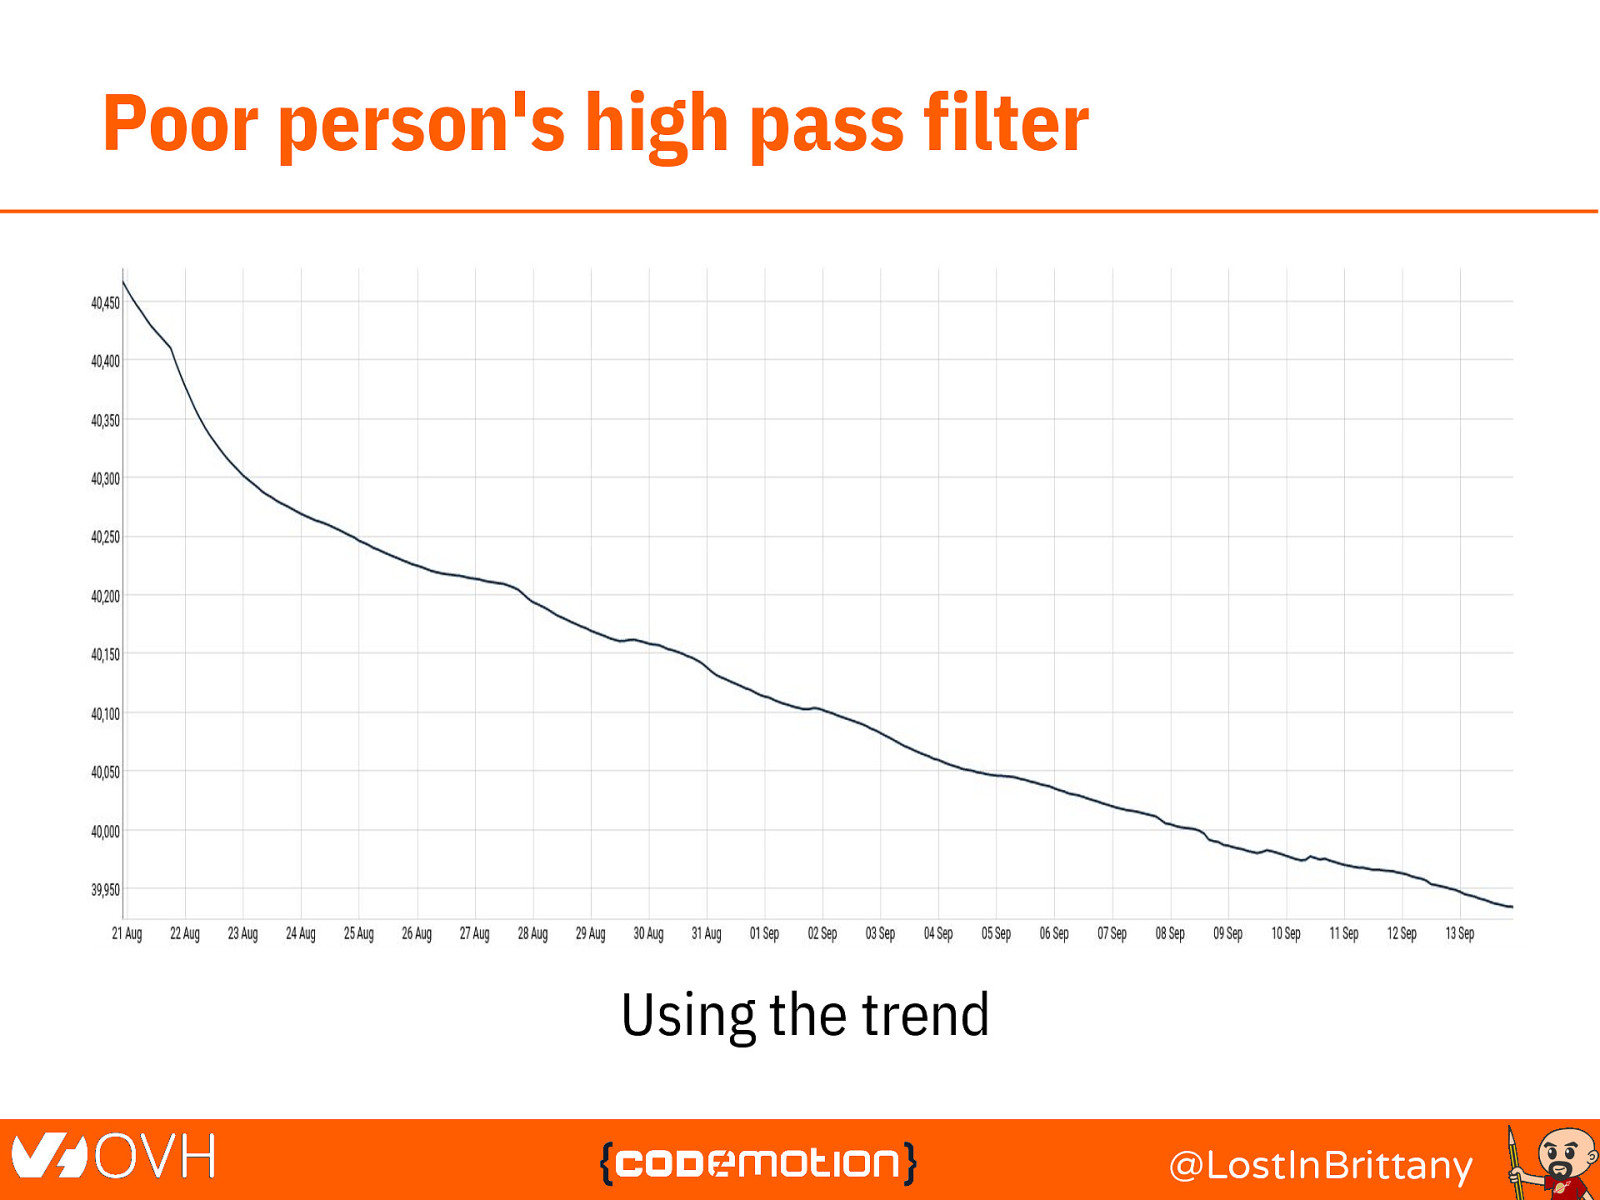
Poor person’s high pass filter Using the trend @LostInBrittany
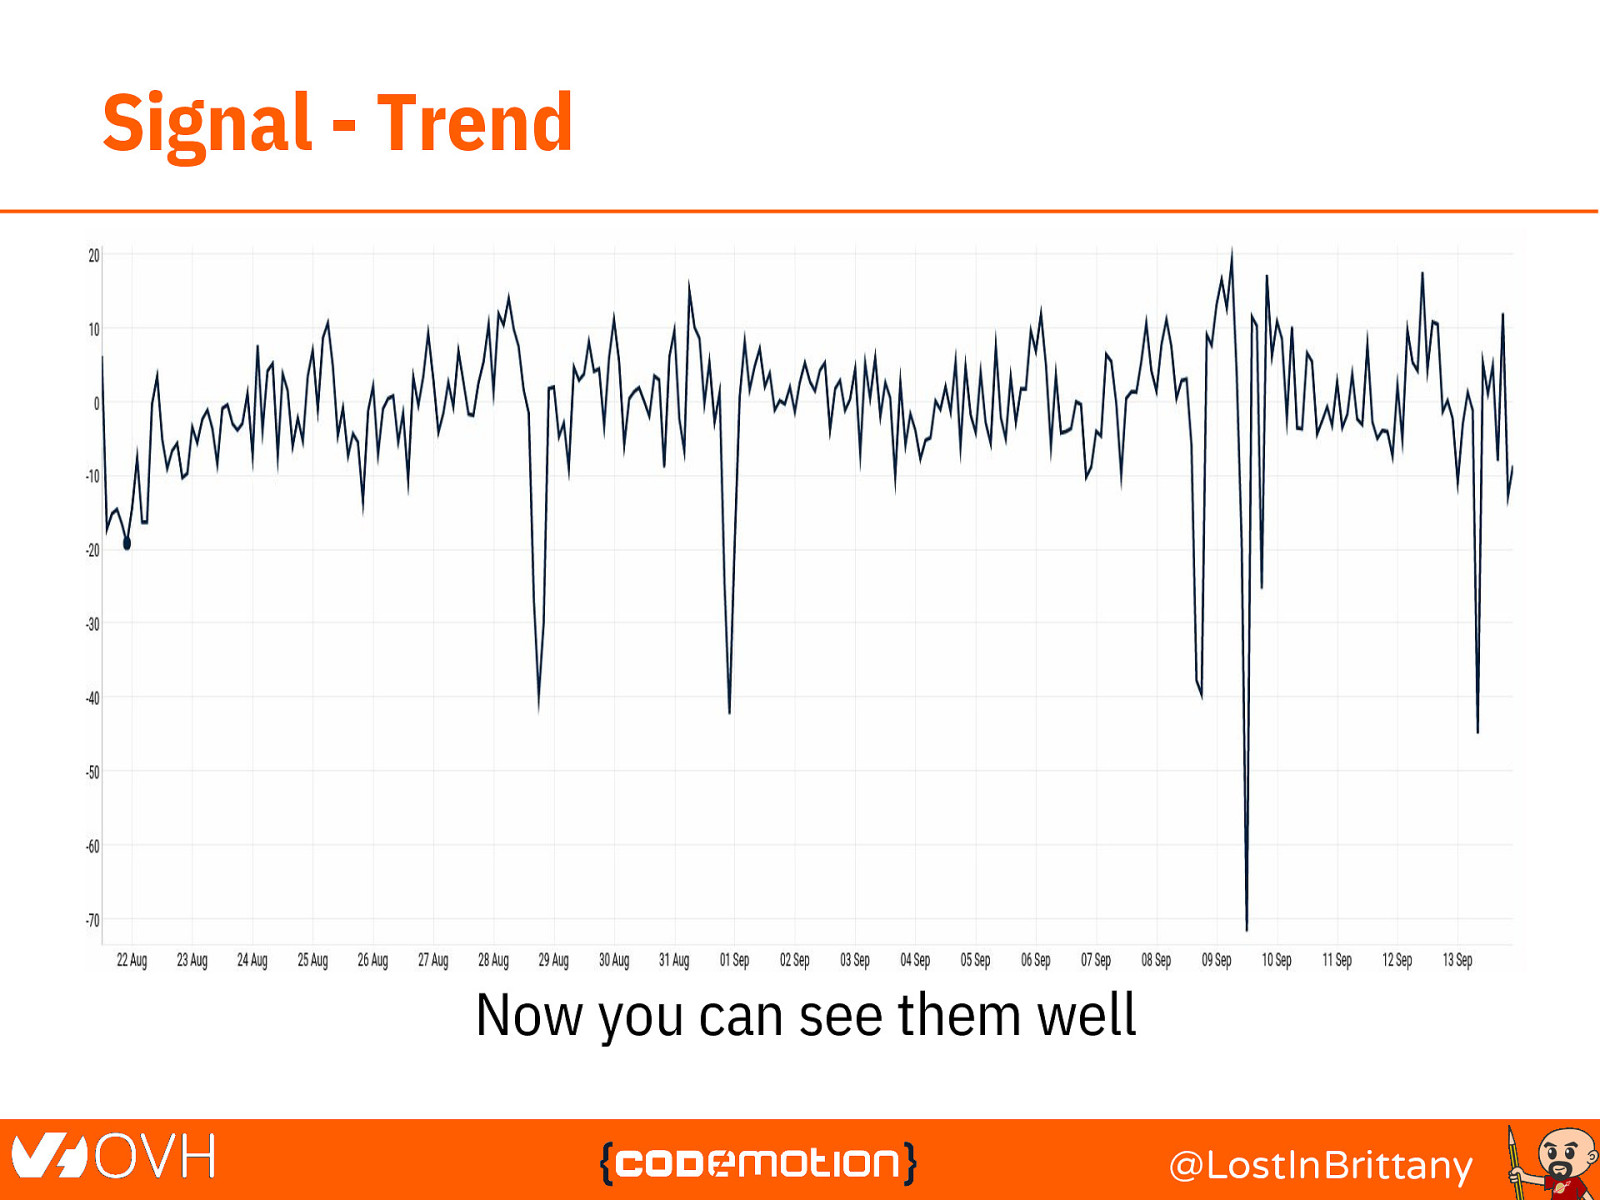
Signal - Trend Now you can see them well @LostInBrittany
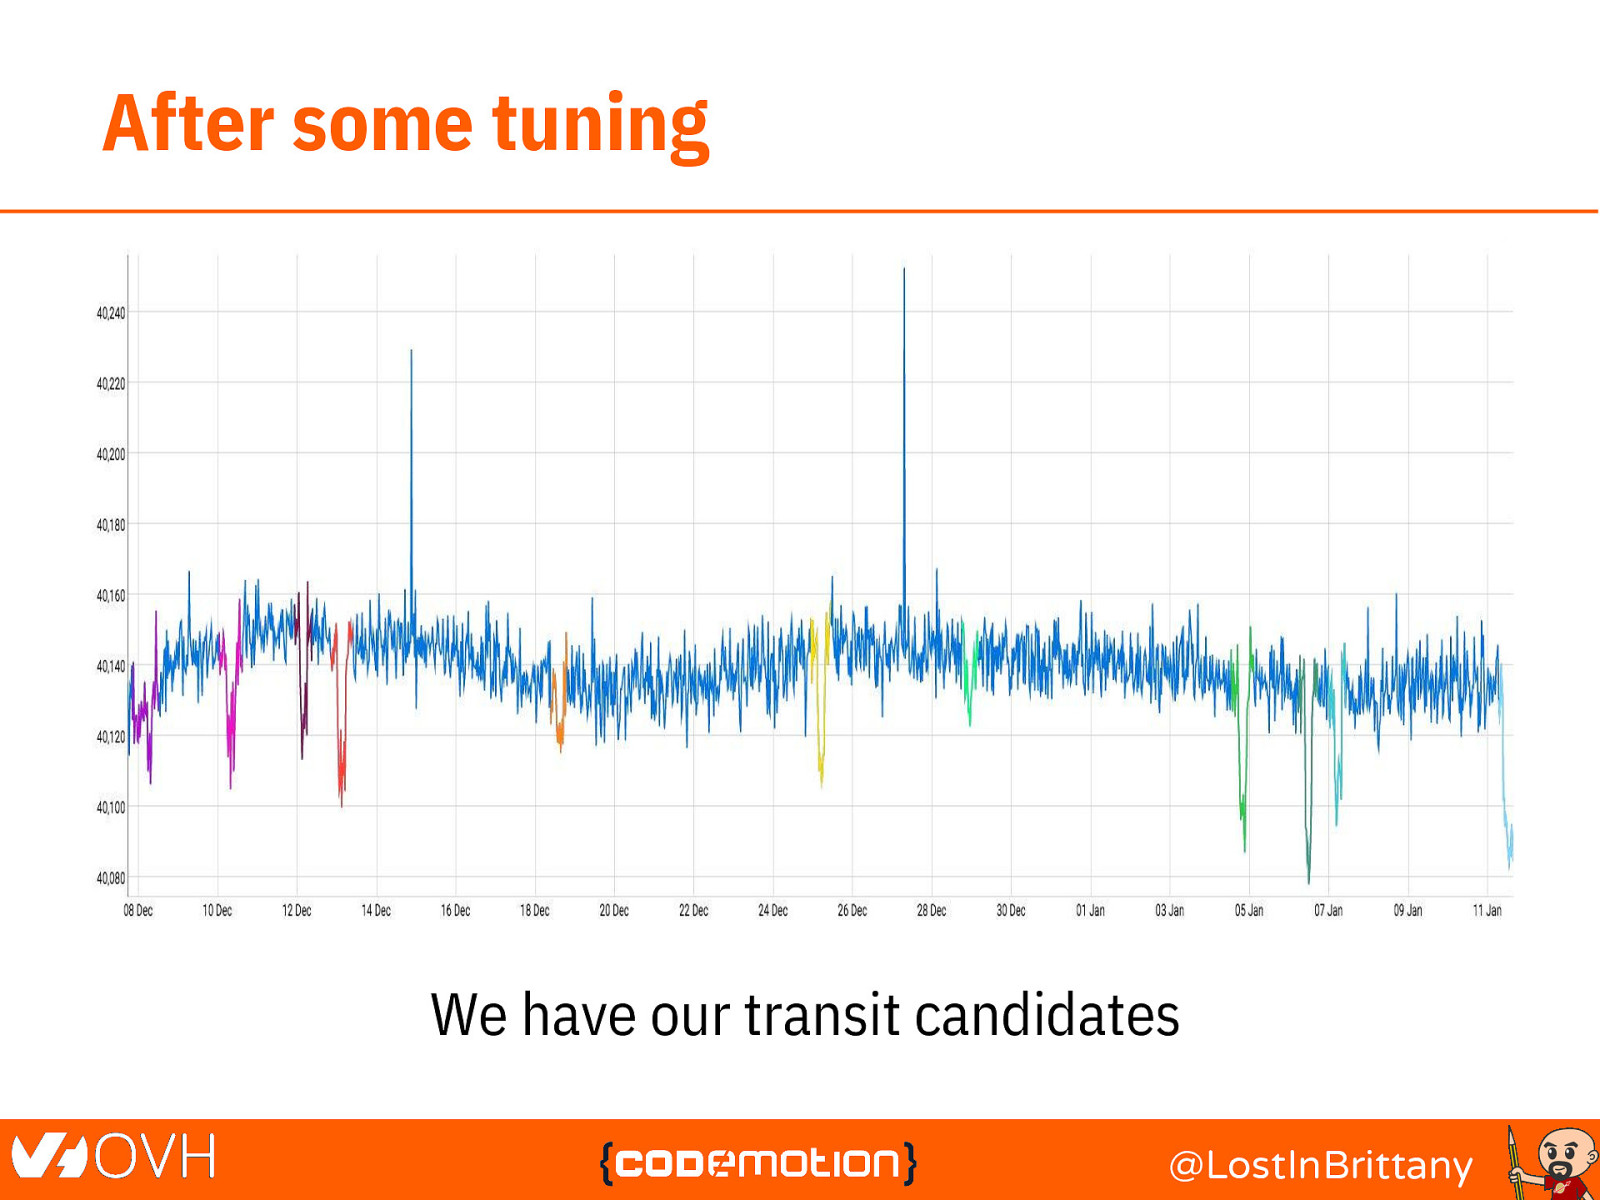
After some tuning We have our transit candidates @LostInBrittany

What’s next? Where do we go from here? @LostInBrittany
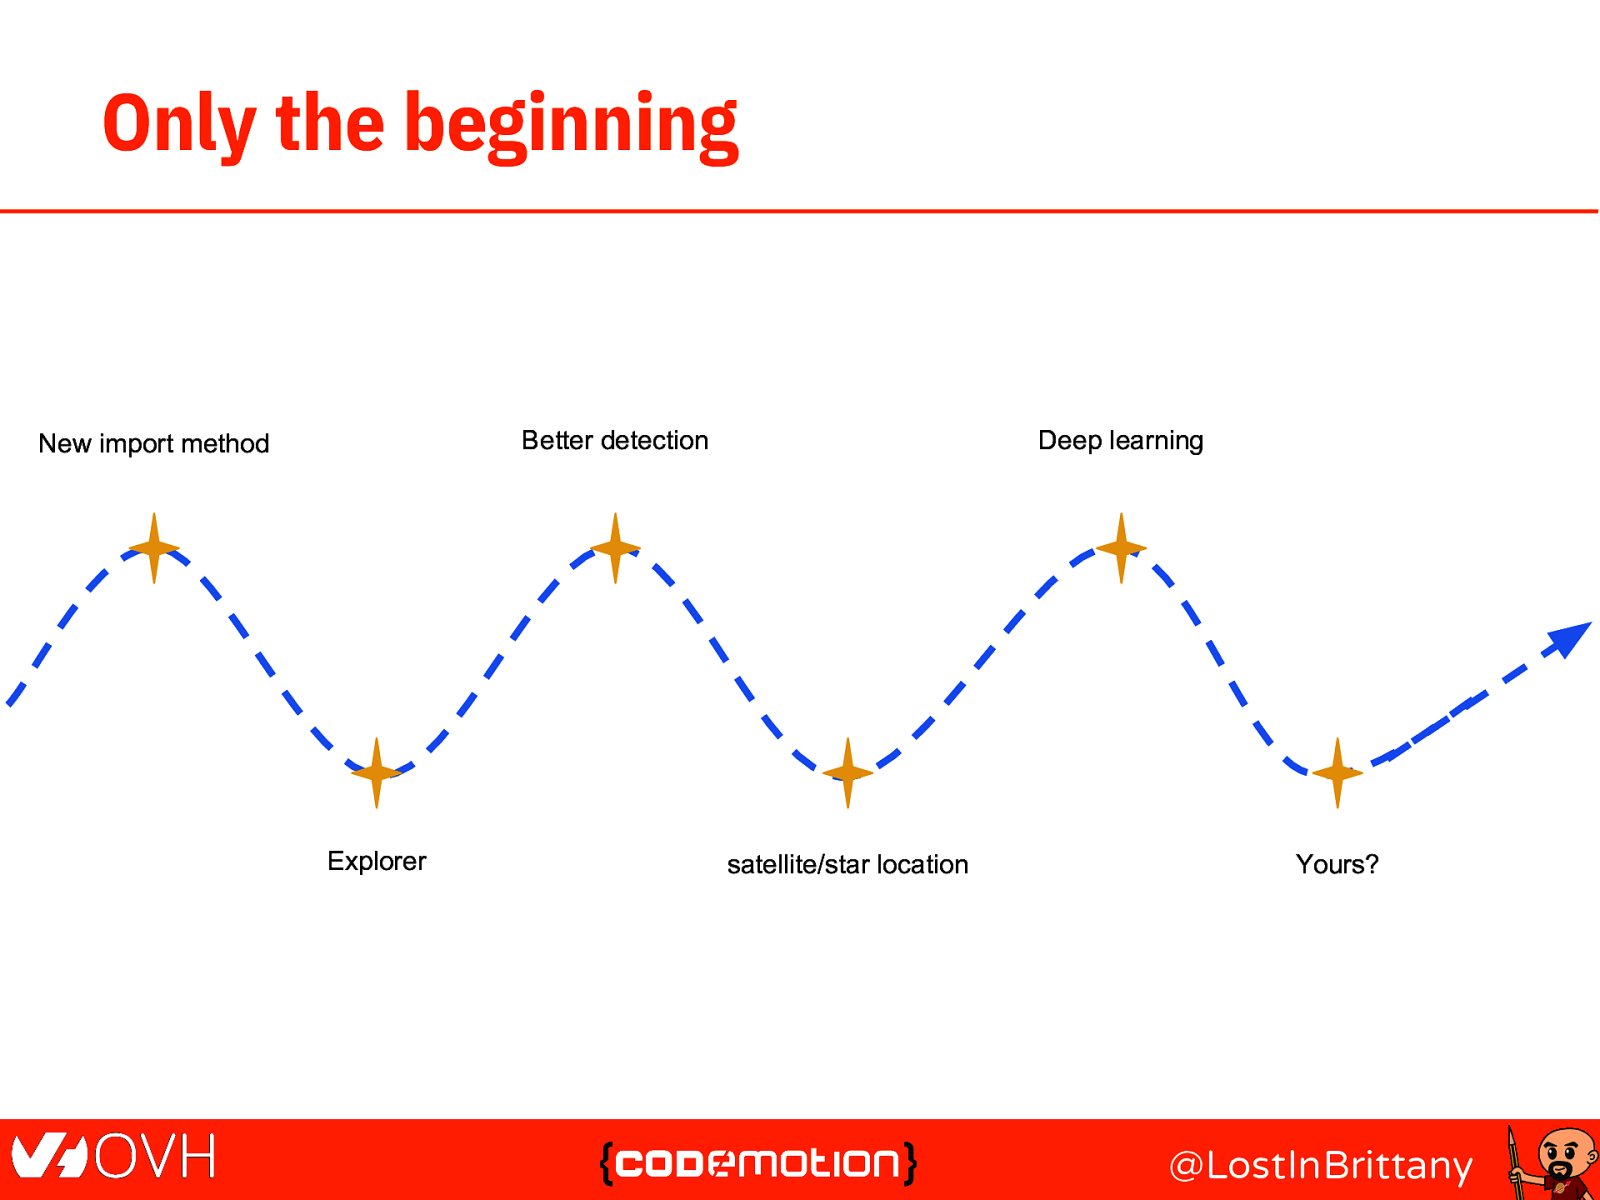
Only the beginning Better detection New import method Explorer Deep learning satellite/star location Yours? @LostInBrittany
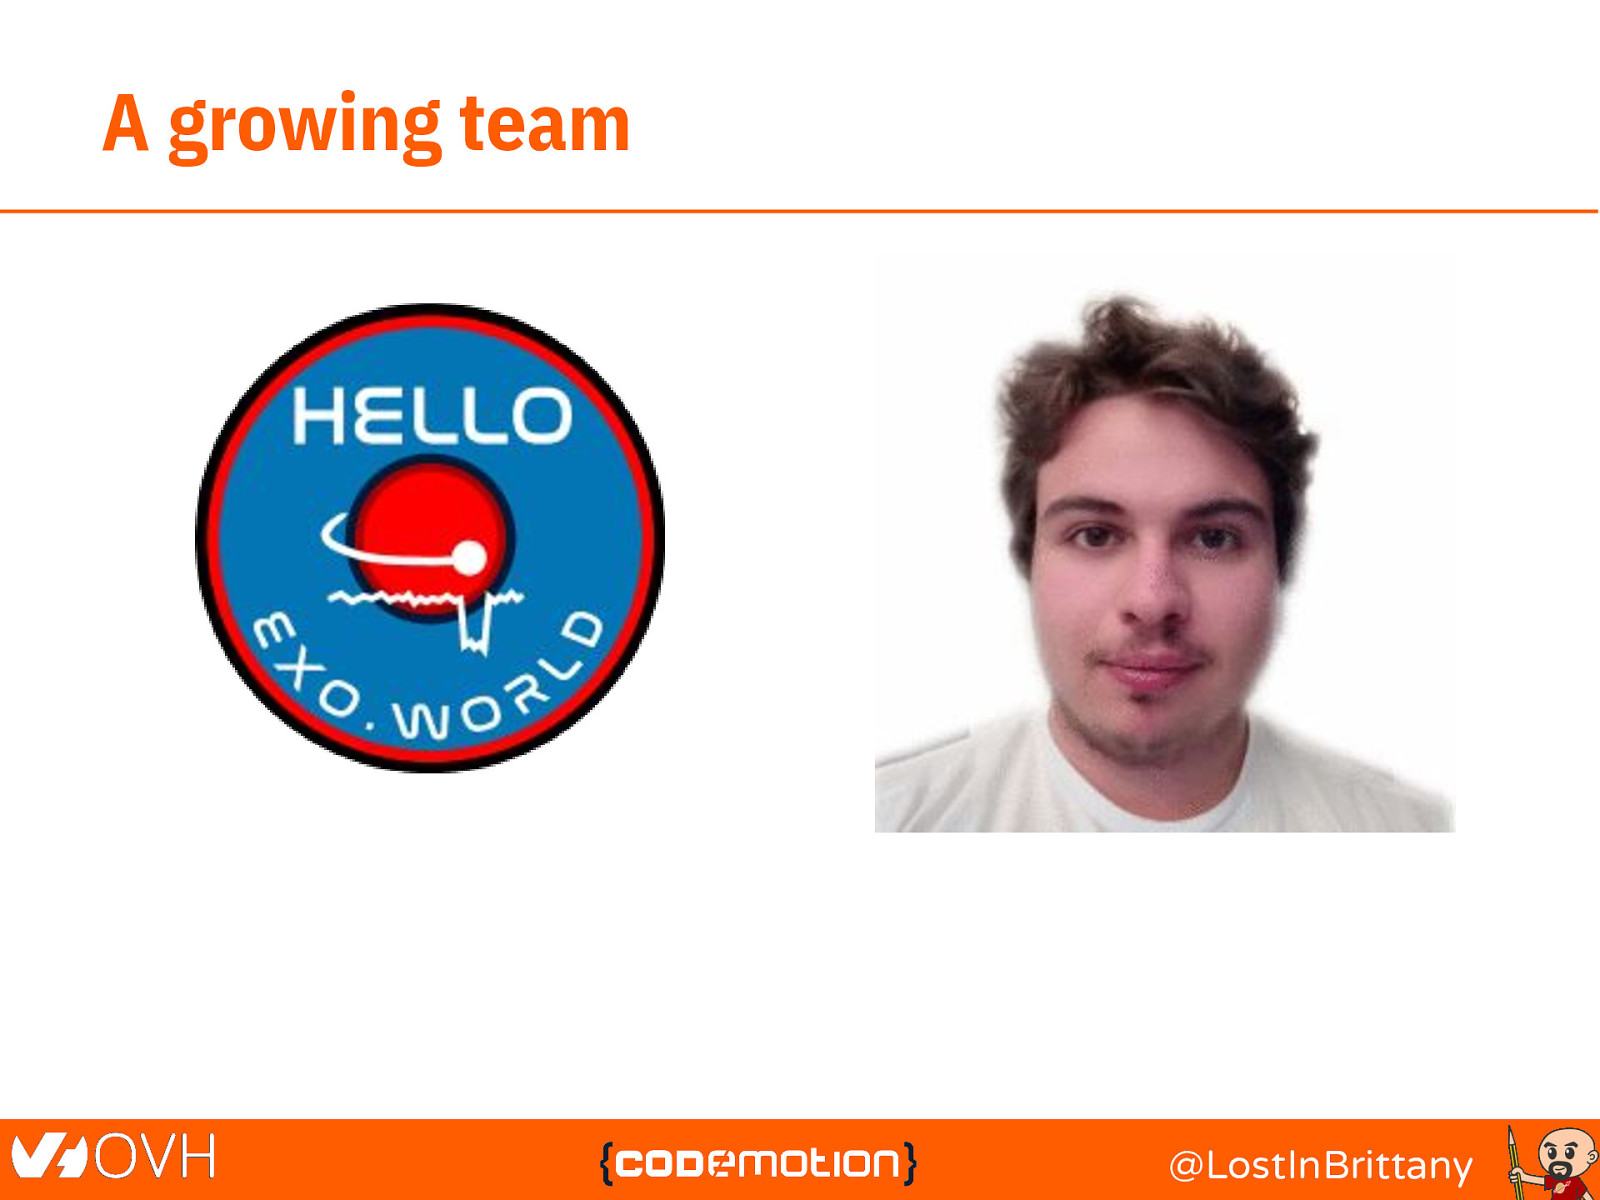
A growing team @LostInBrittany

And you! Join us! https://helloexo.world https://xkcd.com/1371/ @LostInBrittany
Thank you! @LostInBrittany
Want to know more? Analysing with WarpScript @LostInBrittany
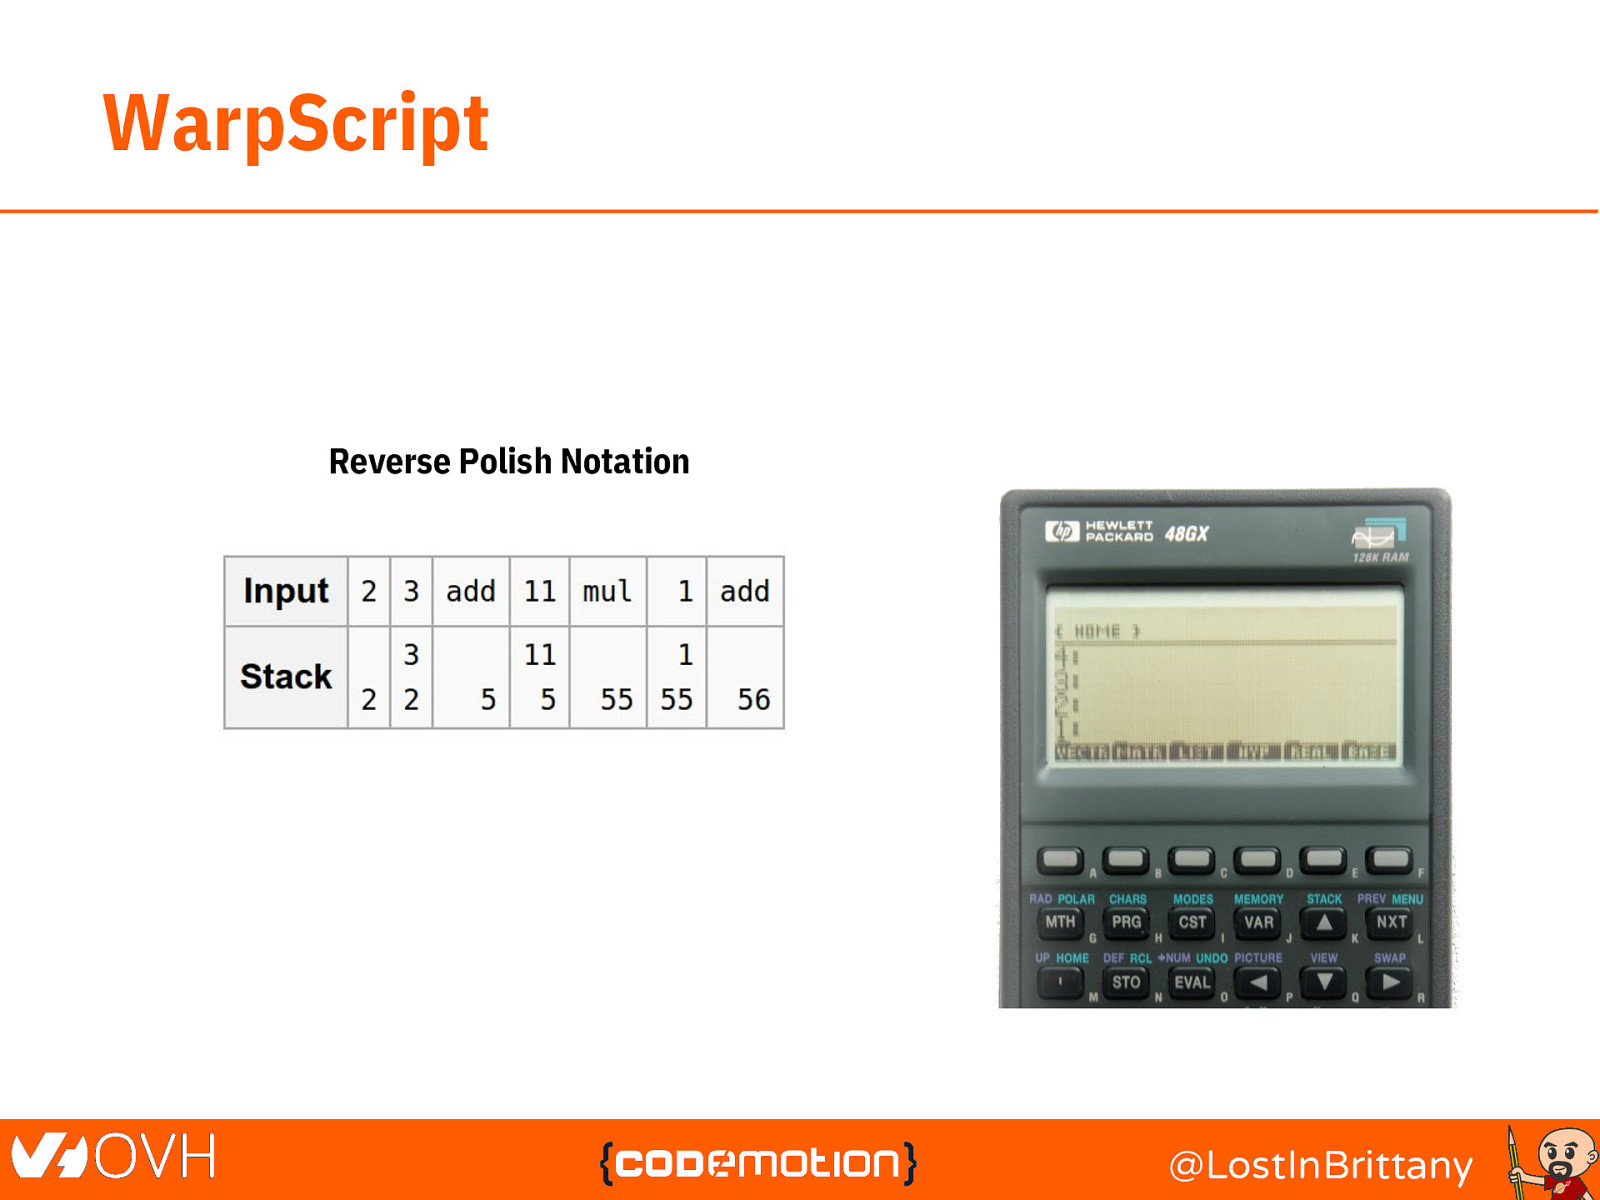
WarpScript Reverse Polish Notation @LostInBrittany
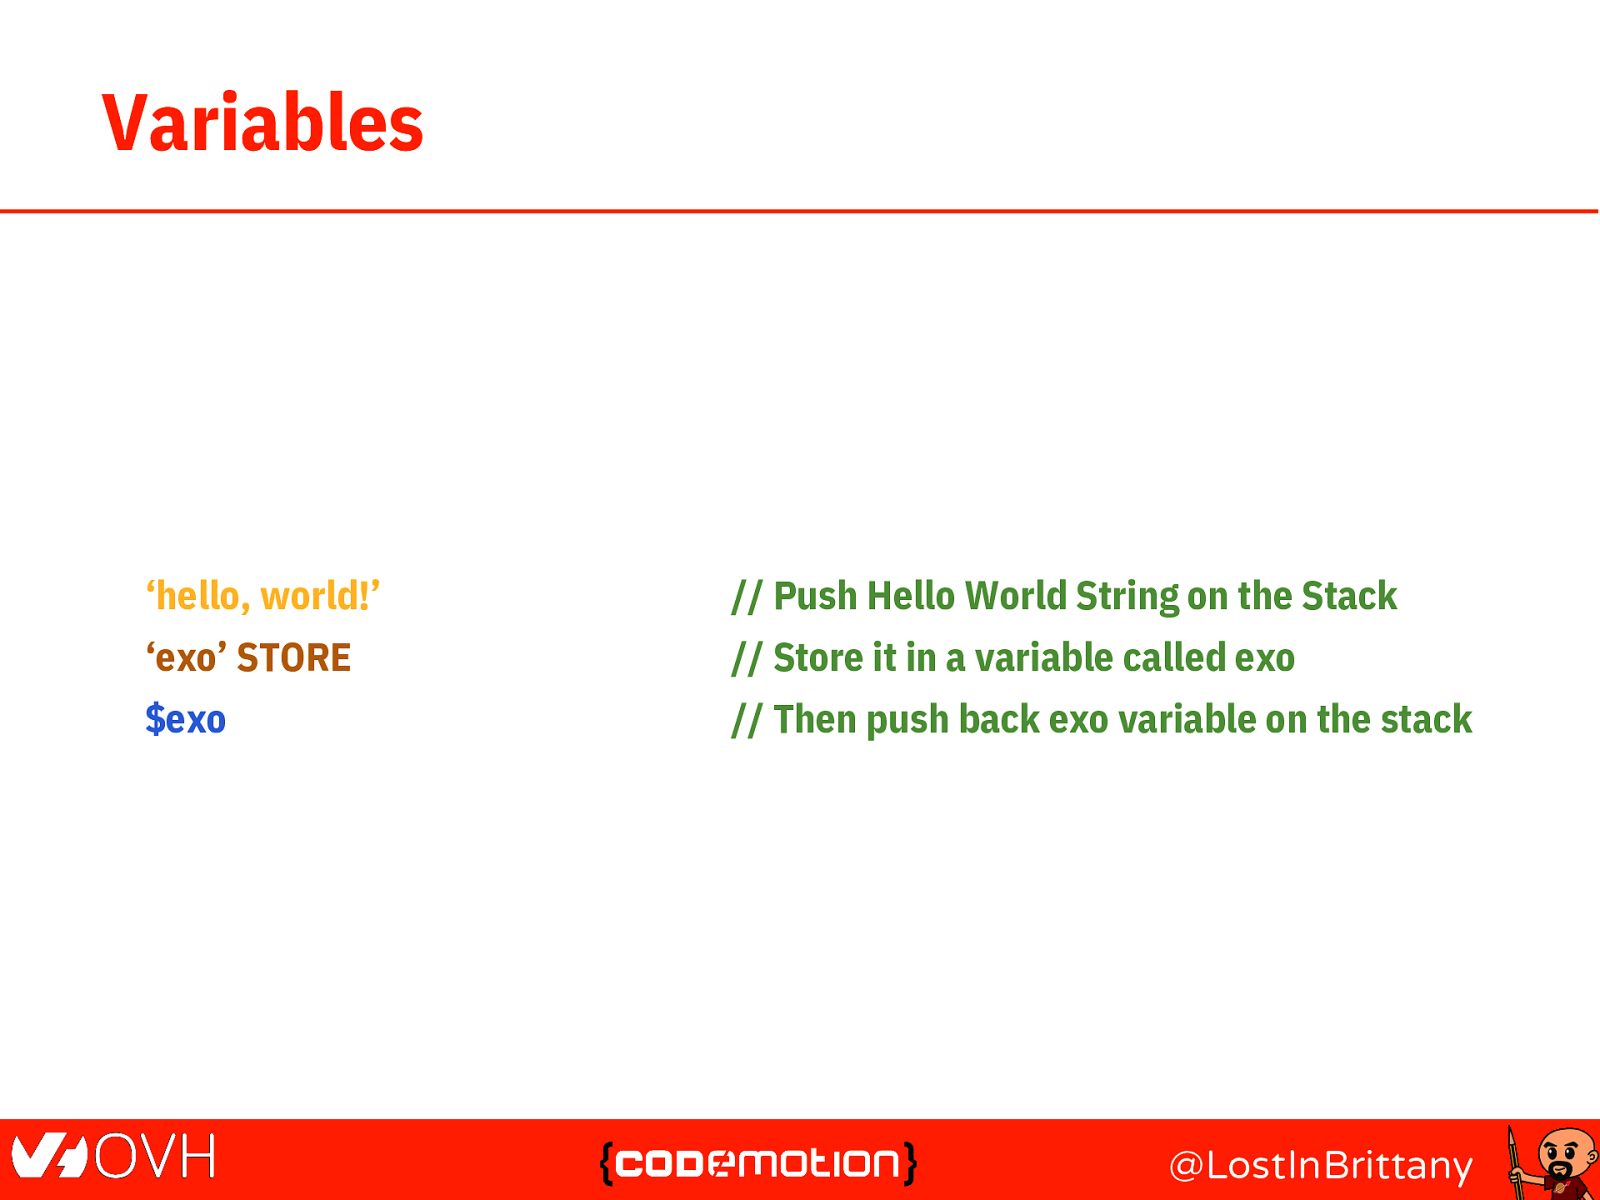
Variables ‘hello, world!’ // Push Hello World String on the Stack ‘exo’ STORE // Store it in a variable called exo $exo // Then push back exo variable on the stack @LostInBrittany
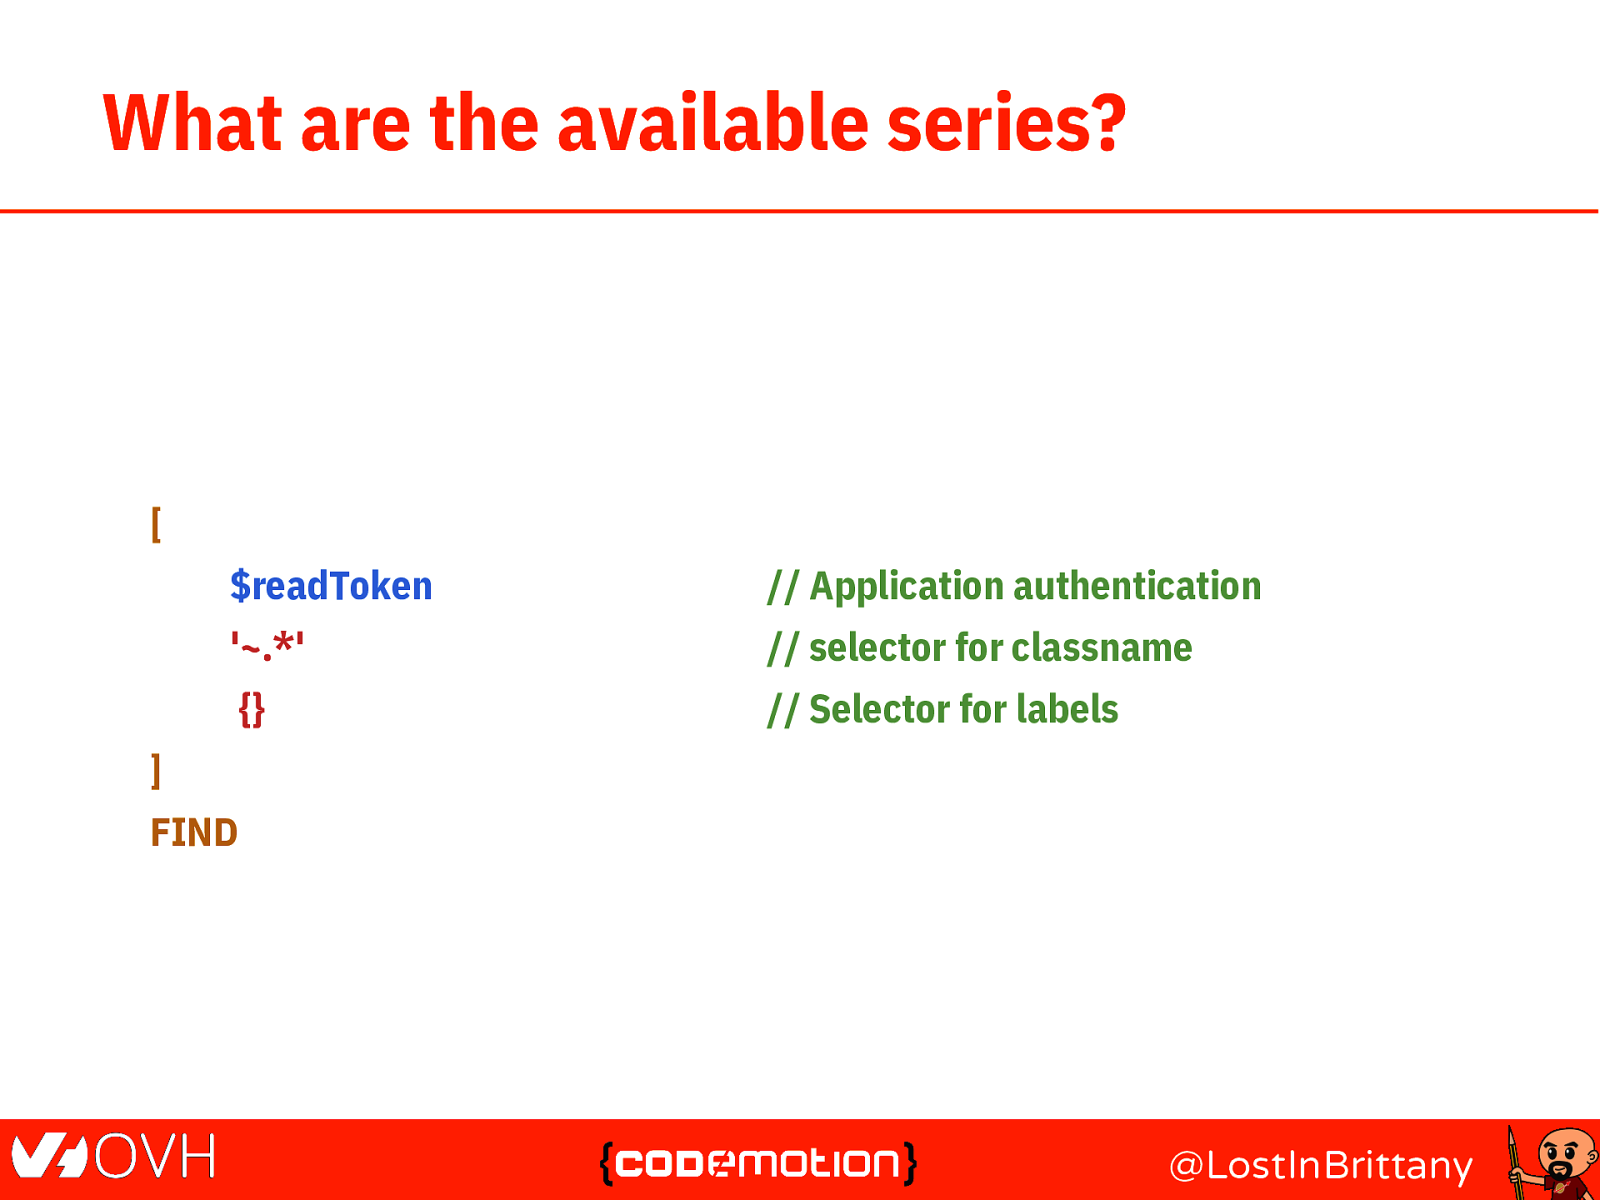
What are the available series? [ $readToken // Application authentication ‘~.*’ // selector for classname {} // Selector for labels ] FIND @LostInBrittany
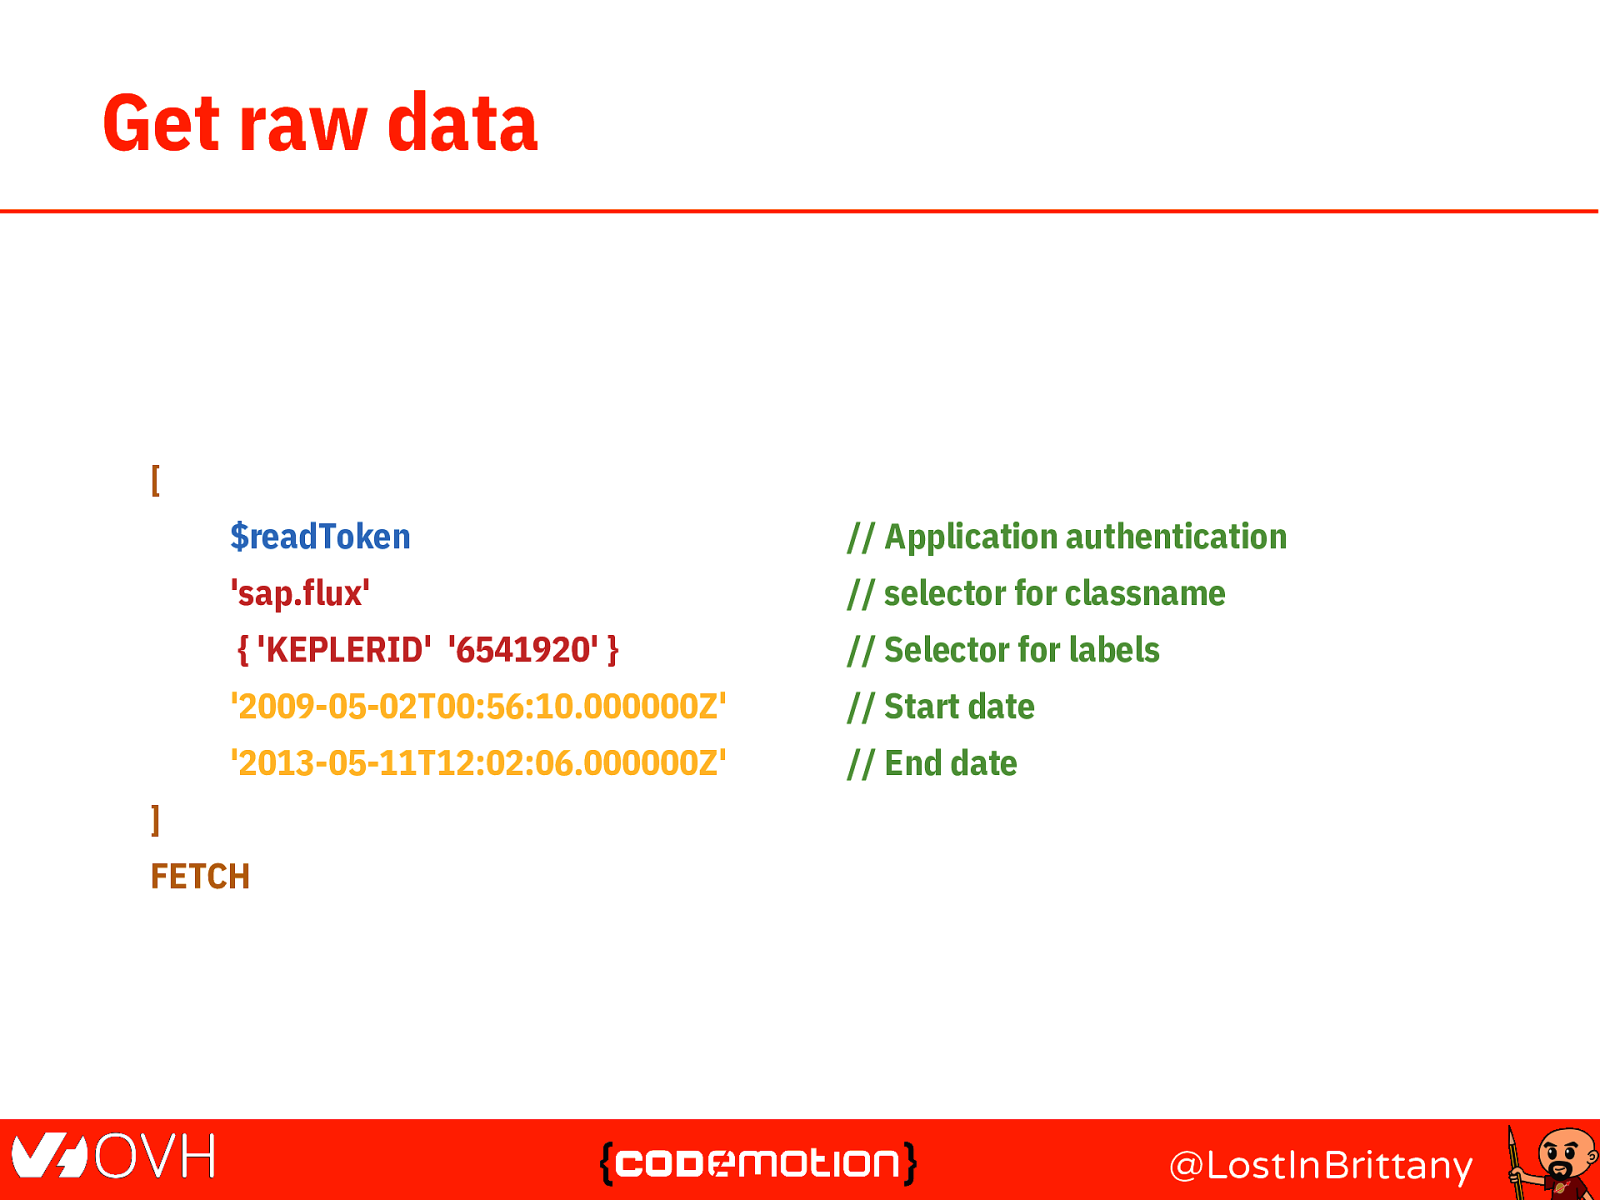
Get raw data [ $readToken // Application authentication ‘sap.flux’ // selector for classname { ‘KEPLERID’ ‘6541920’ } // Selector for labels ‘2009-05-02T00:56:10.000000Z’ // Start date ‘2013-05-11T12:02:06.000000Z’ // End date ] FETCH @LostInBrittany
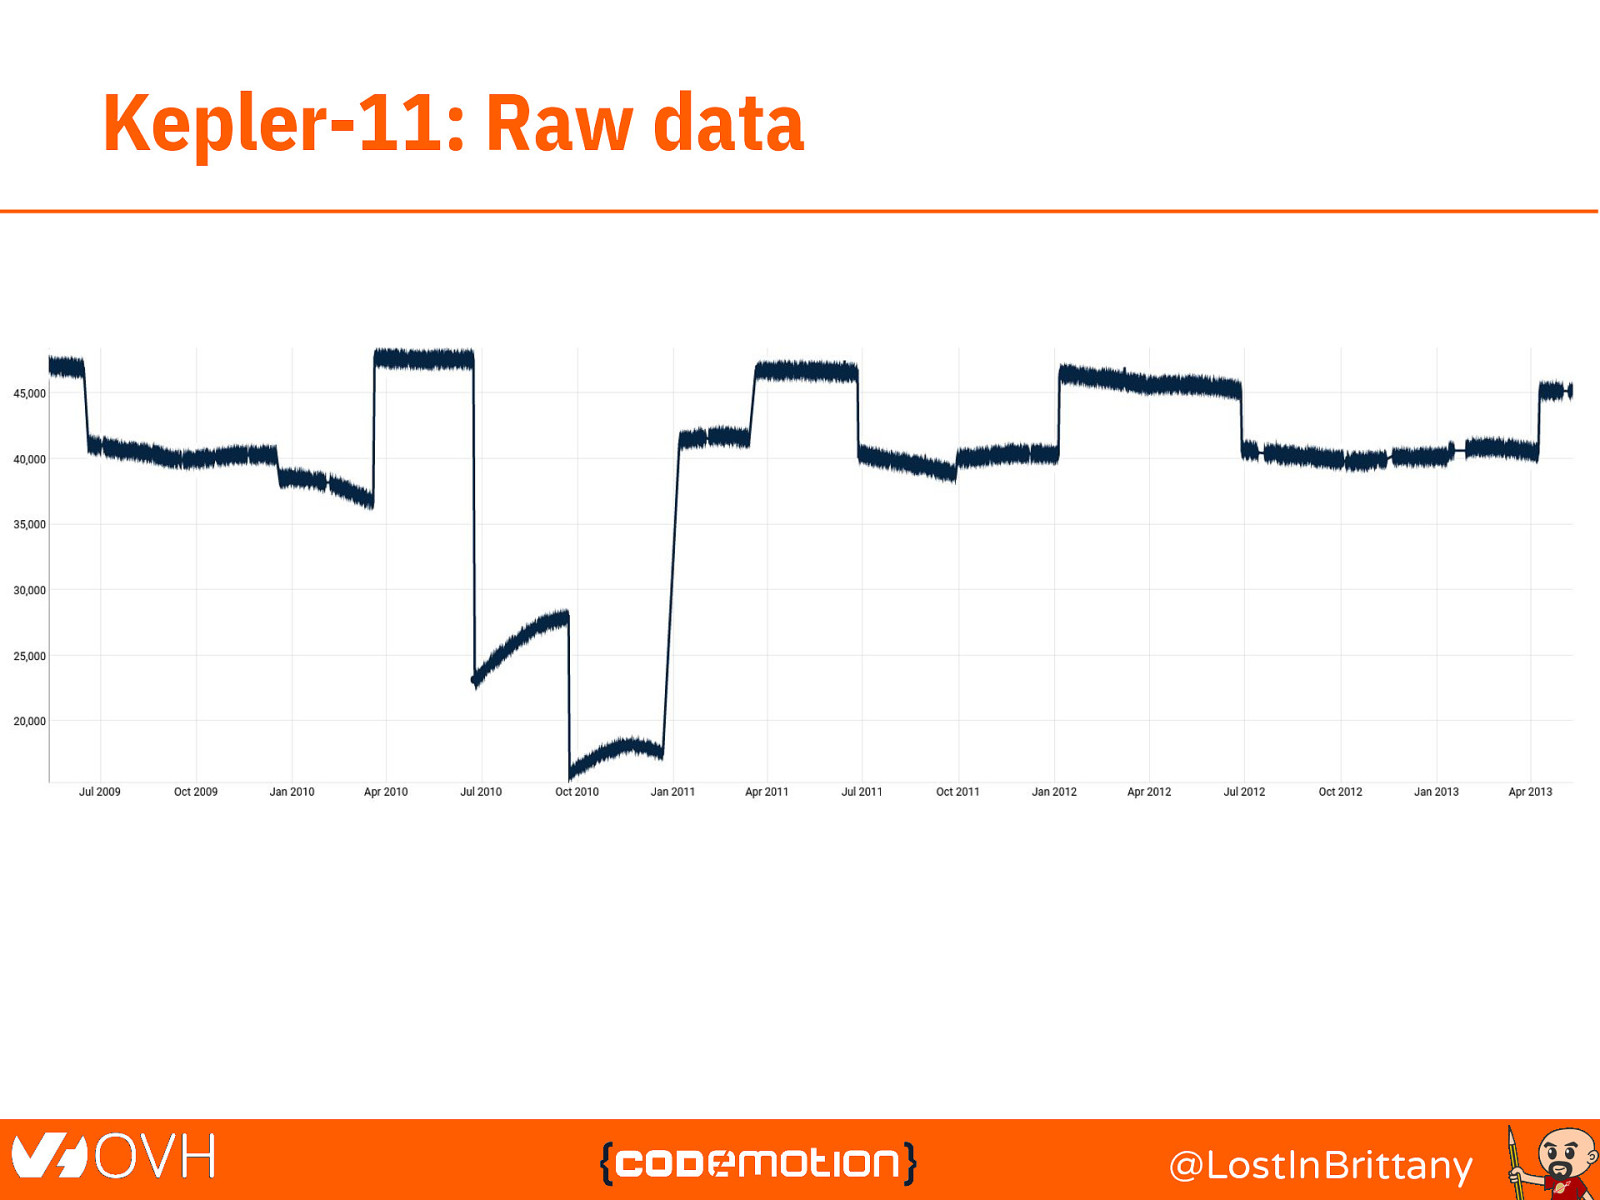
Kepler-11: Raw data @LostInBrittany
Time manipulation @LostInBrittany
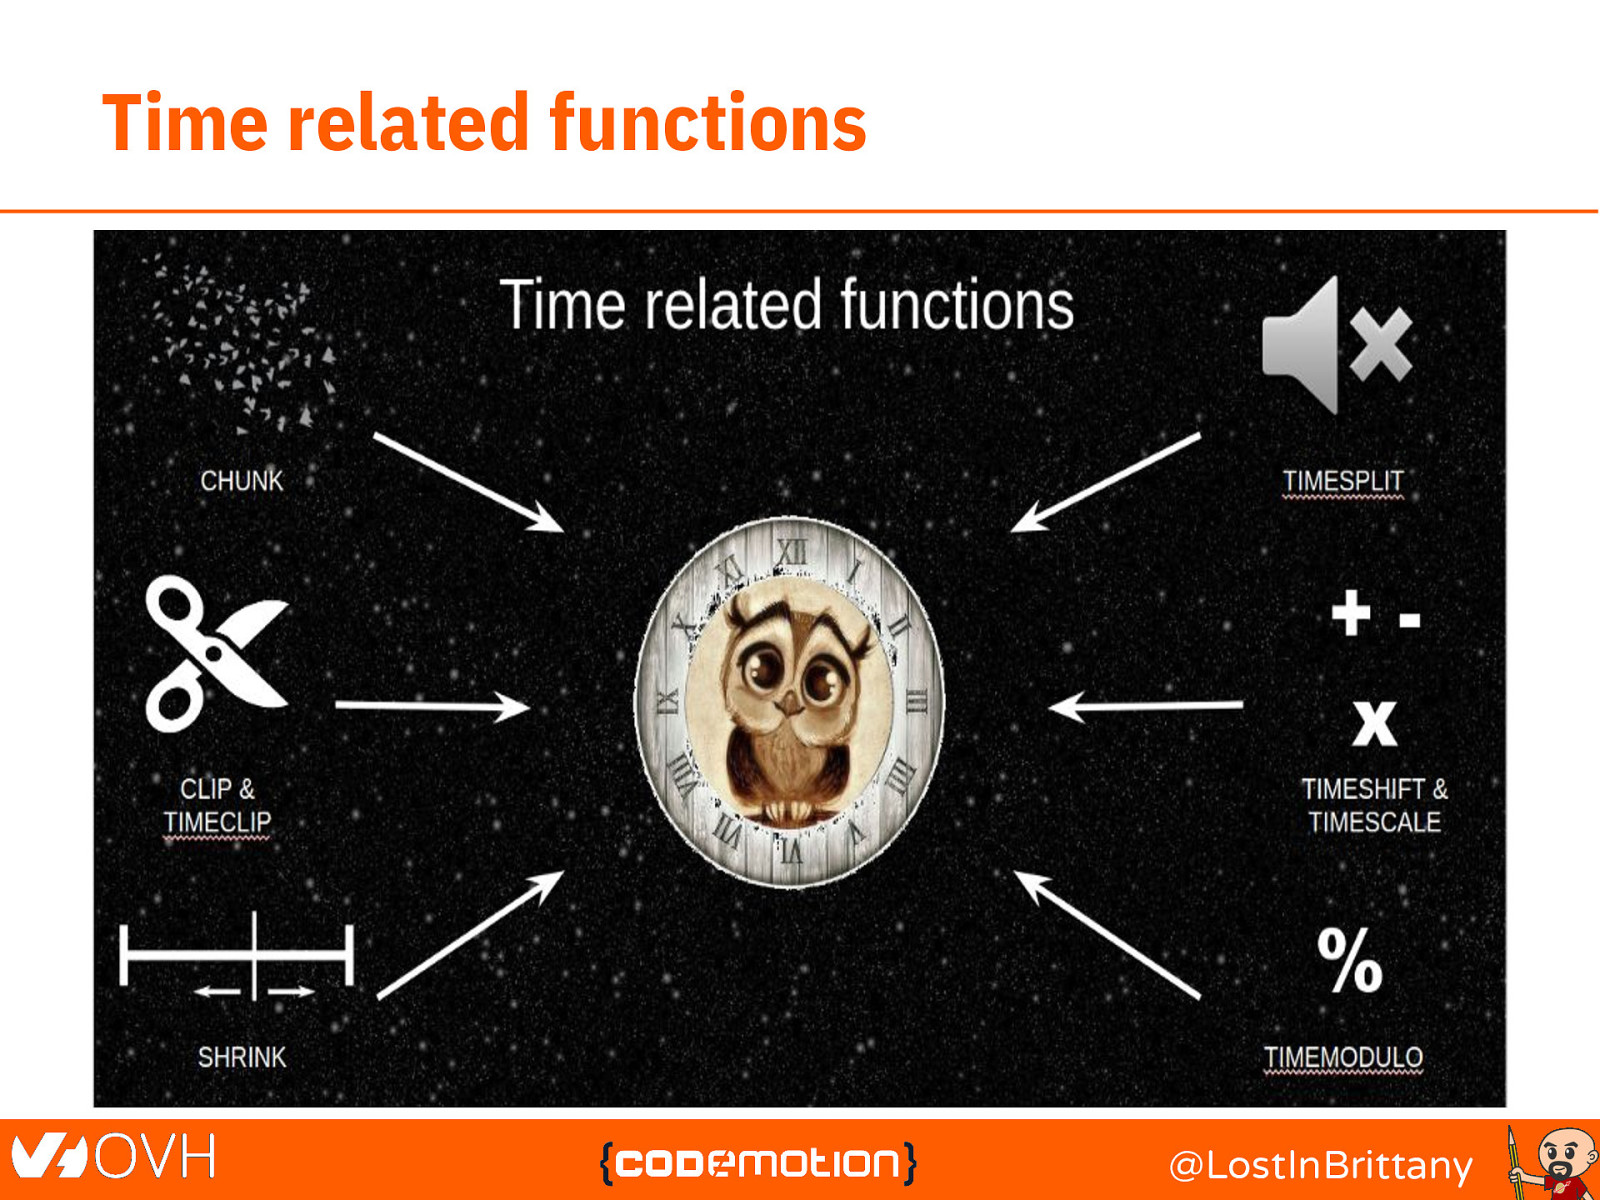
Time related functions @LostInBrittany
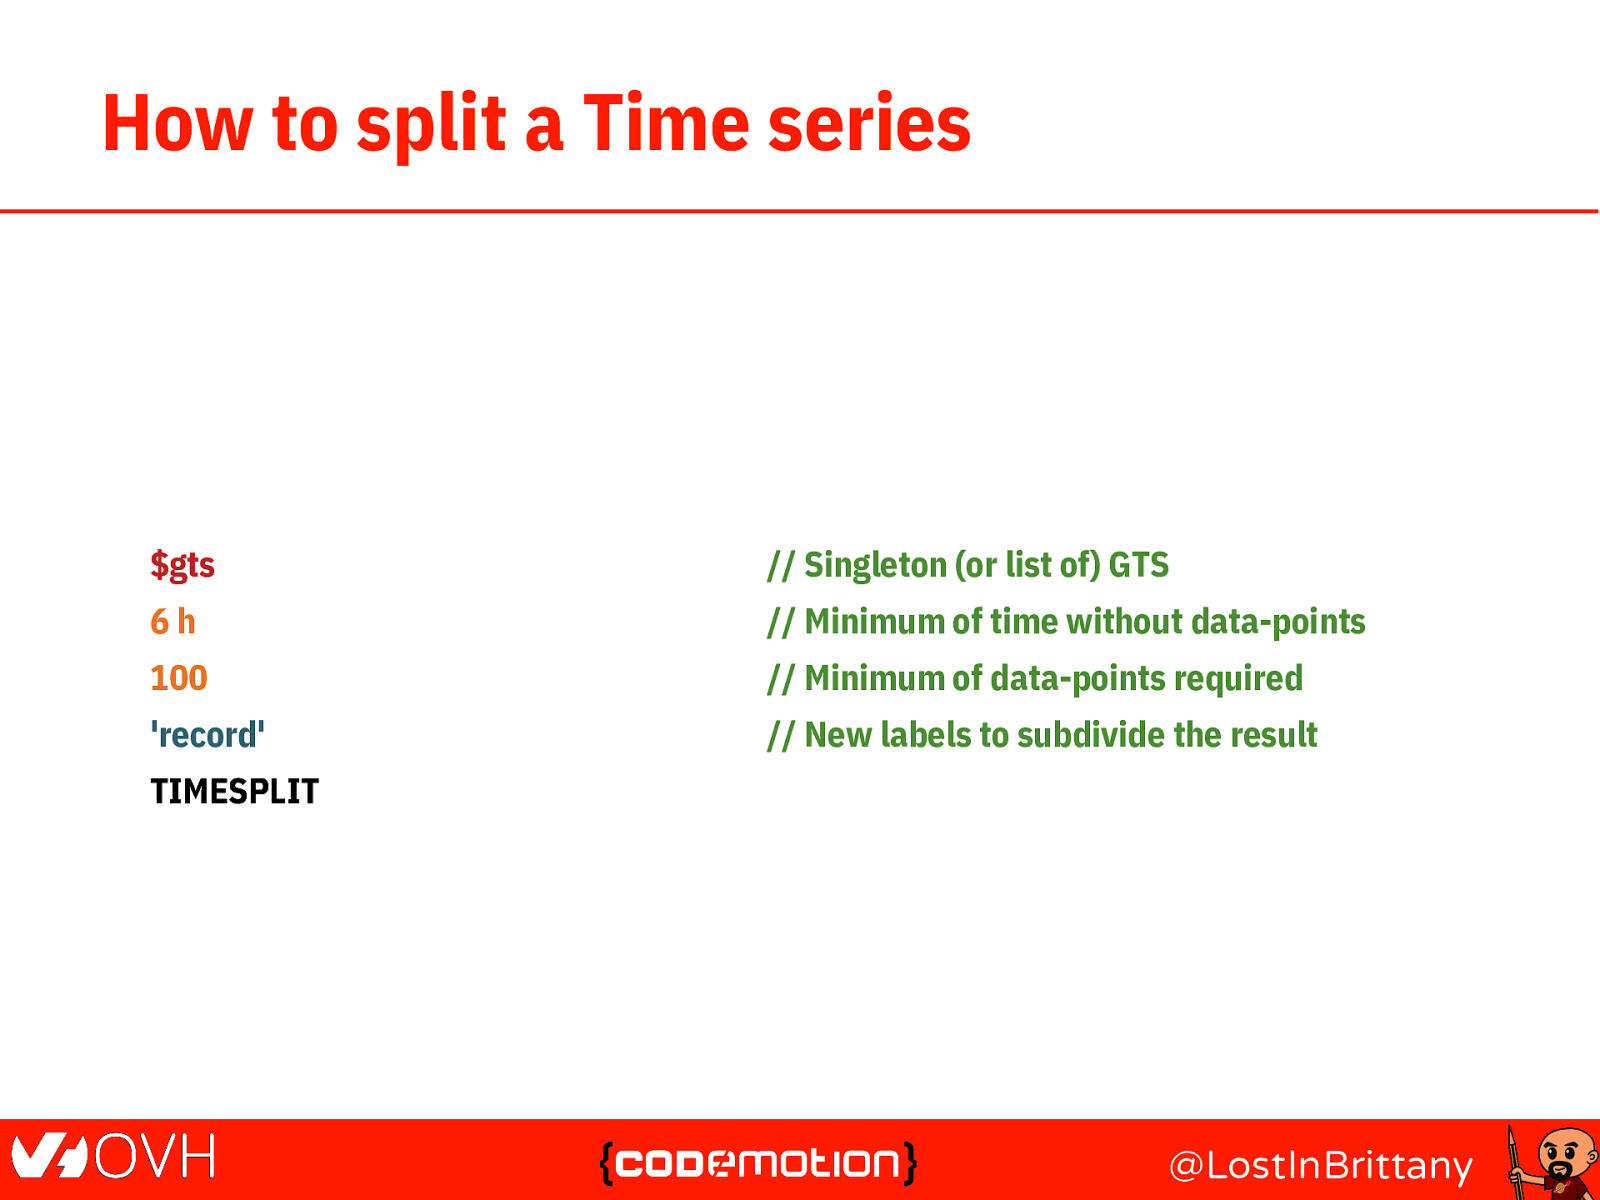
How to split a Time series $gts // Singleton (or list of) GTS 6h // Minimum of time without data-points 100 // Minimum of data-points required ‘record’ // New labels to subdivide the result TIMESPLIT @LostInBrittany
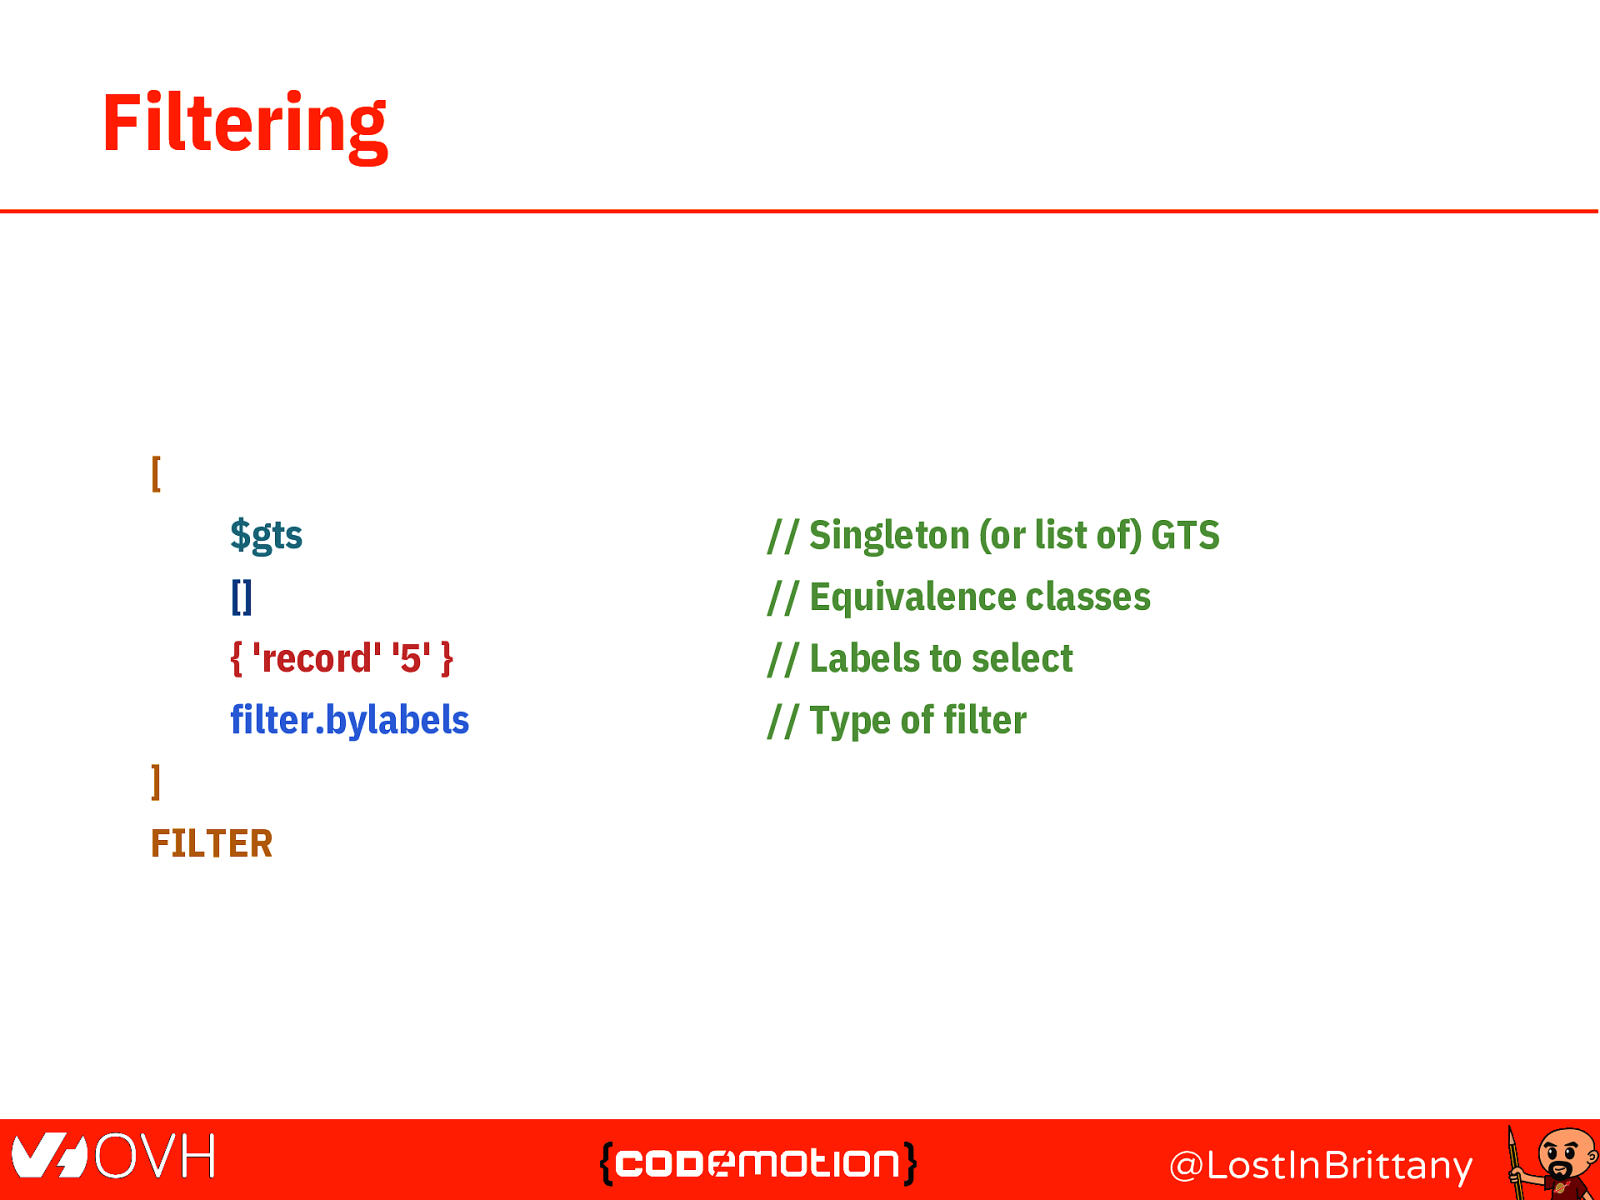
Filtering [ $gts // Singleton (or list of) GTS [] // Equivalence classes { ‘record’ ‘5’ } // Labels to select filter.bylabels // Type of filter ] FILTER @LostInBrittany
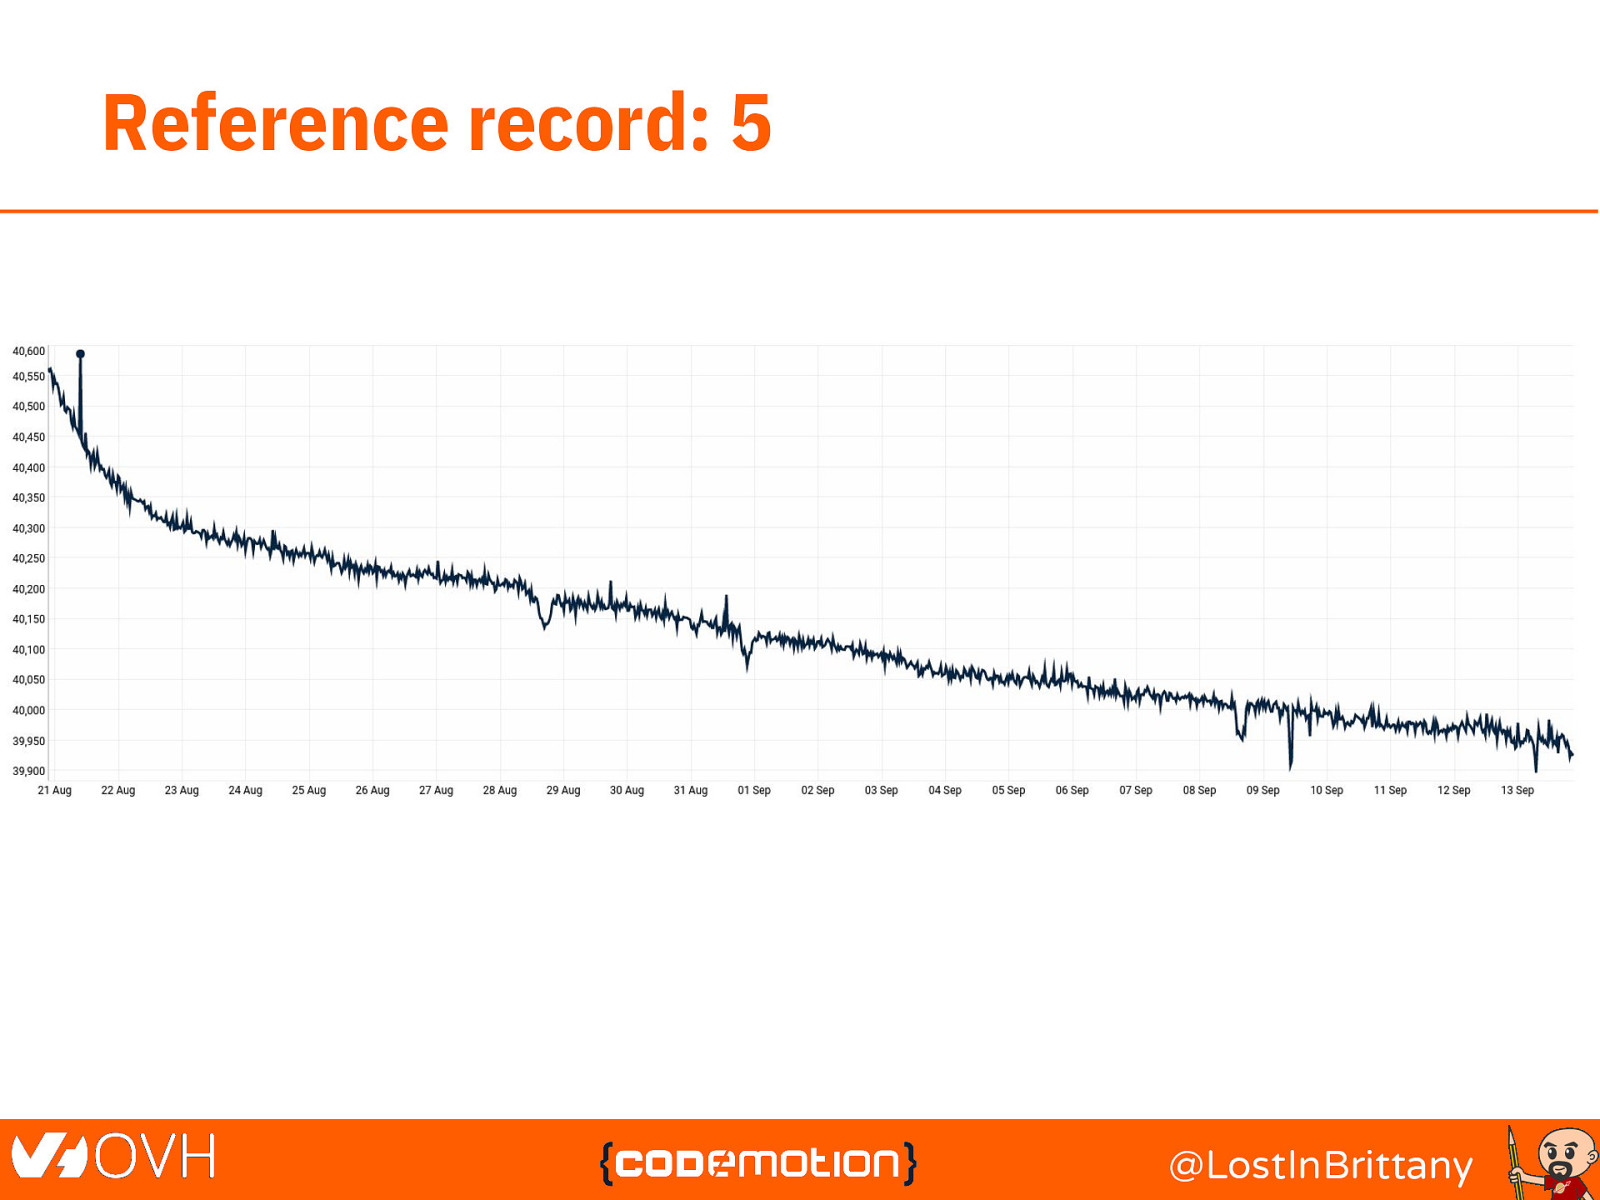
Reference record: 5 @LostInBrittany
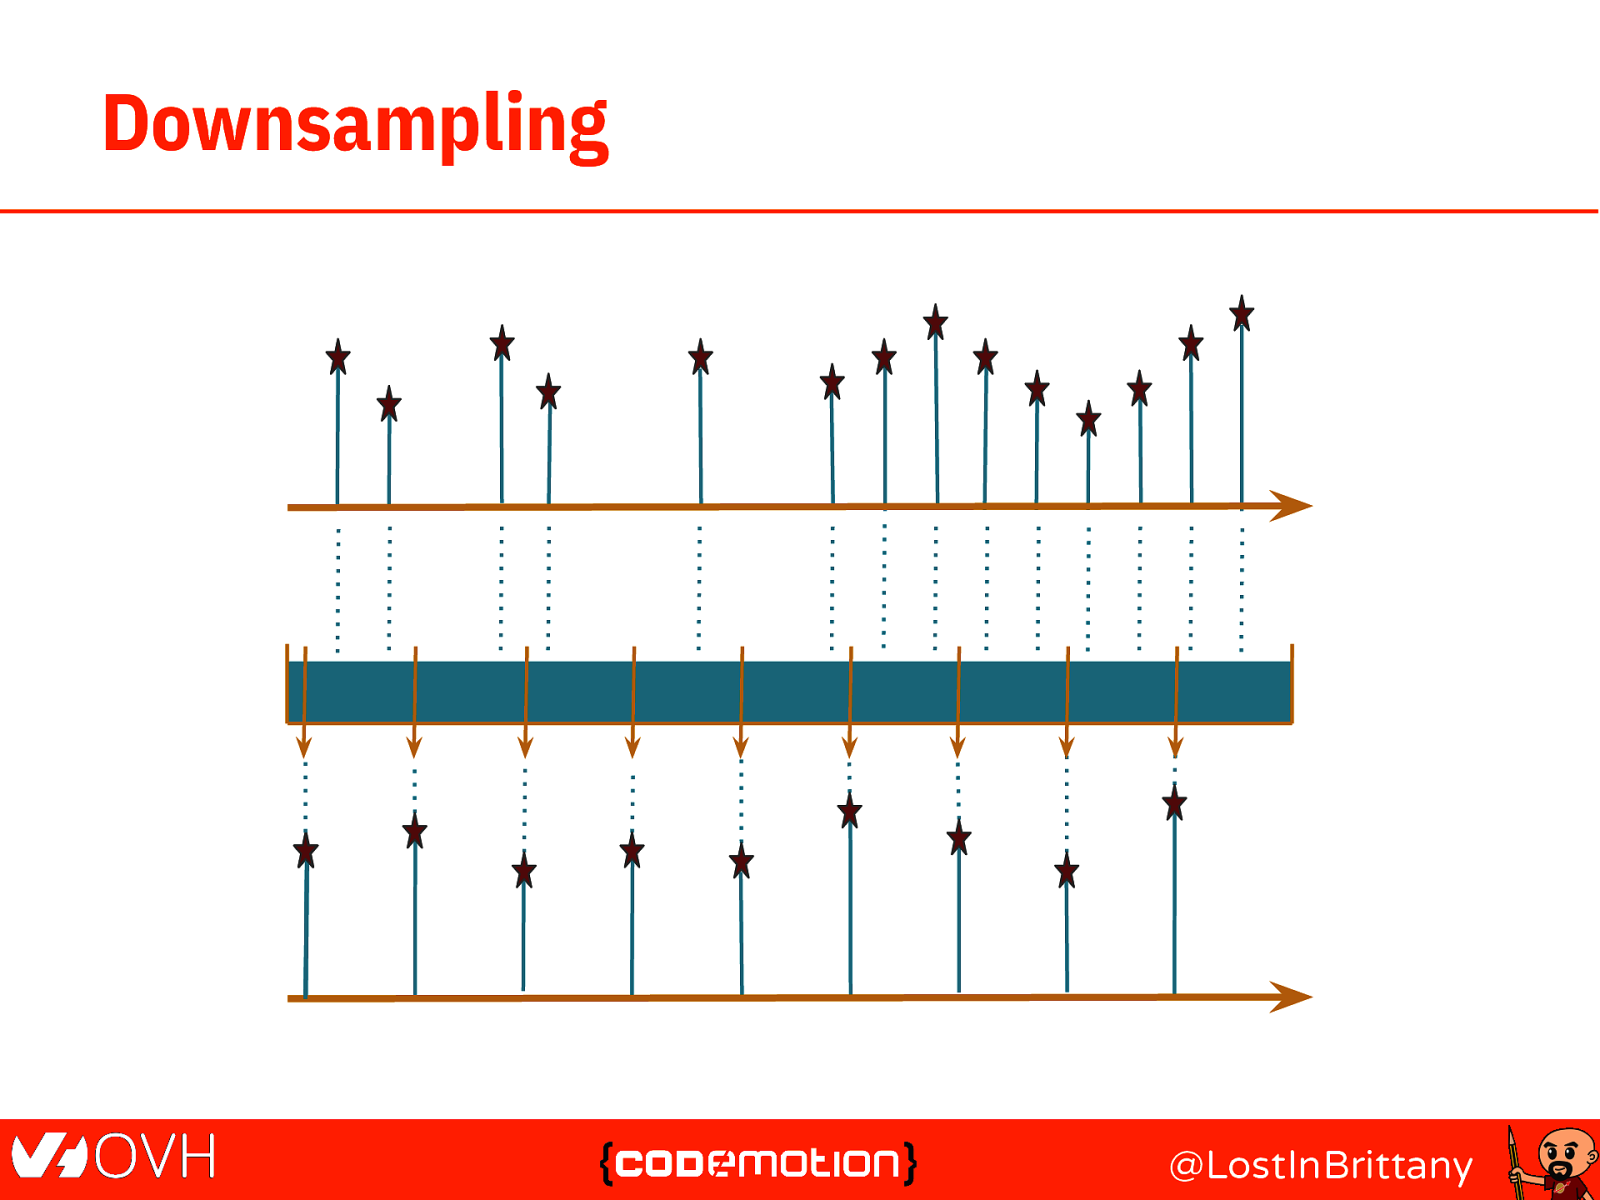
Downsampling @LostInBrittany
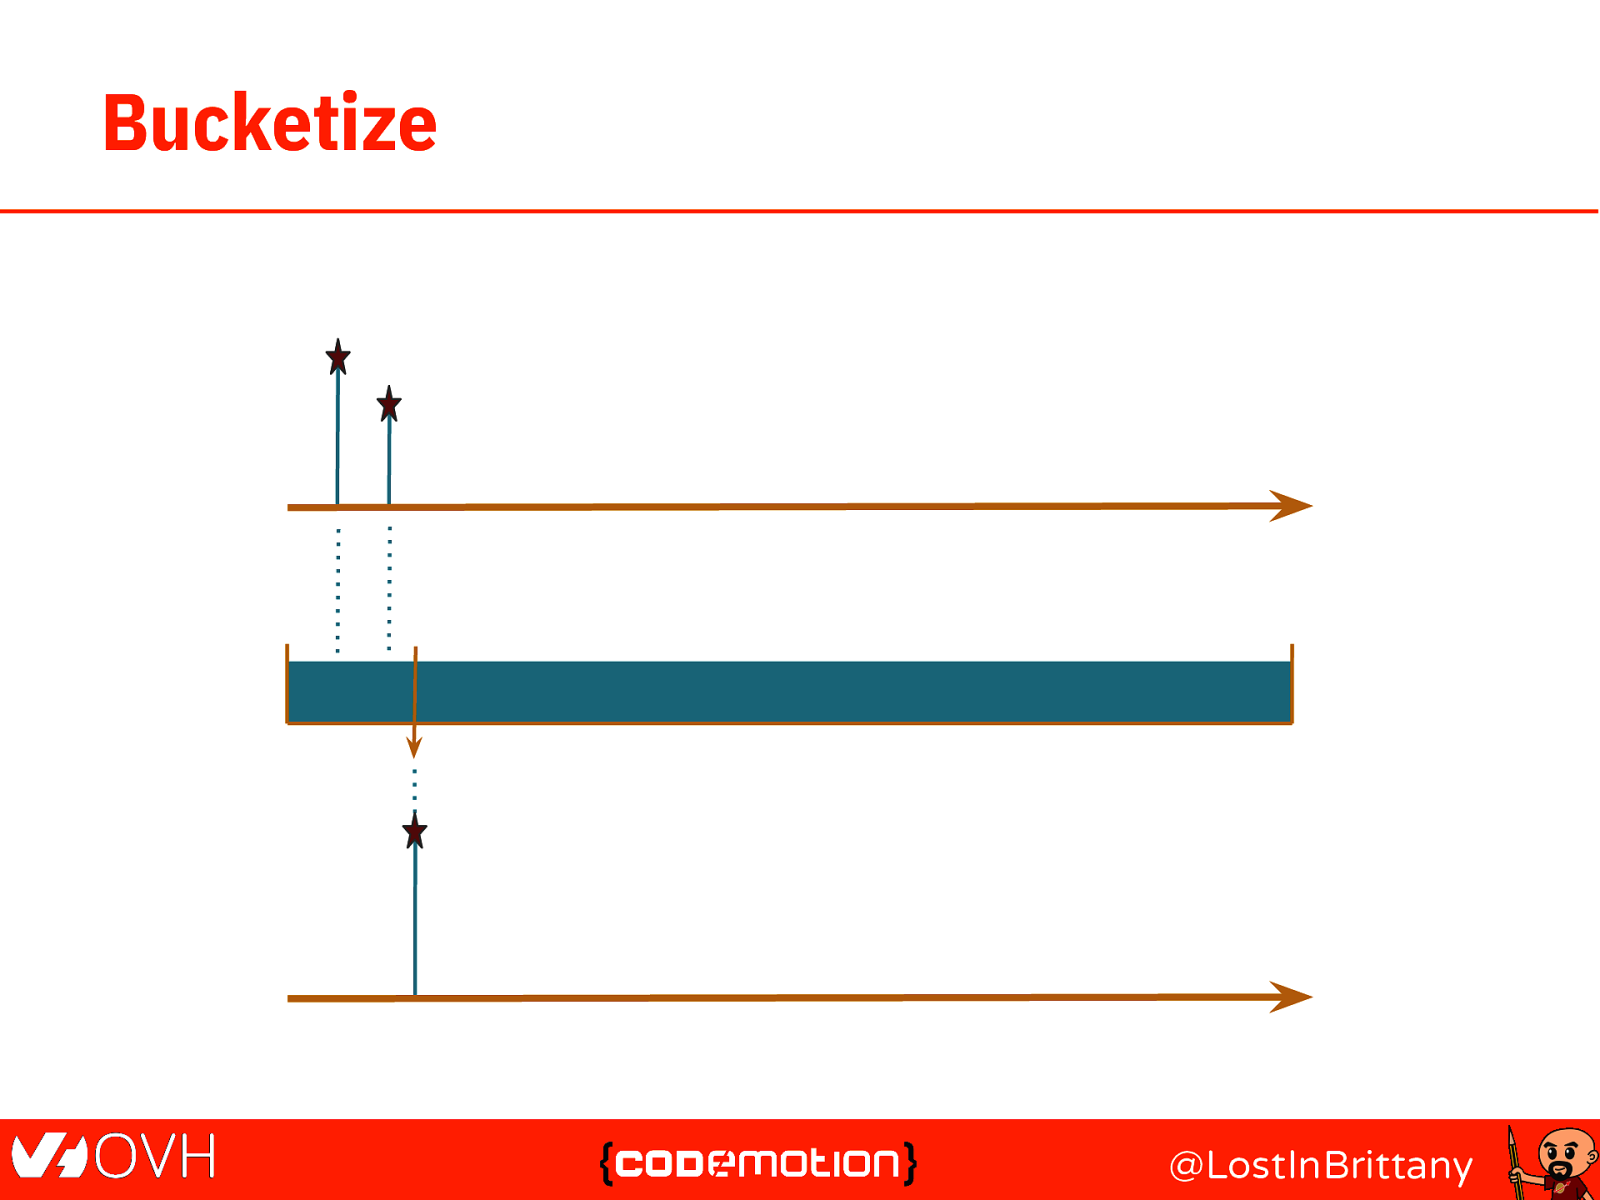
Bucketize @LostInBrittany
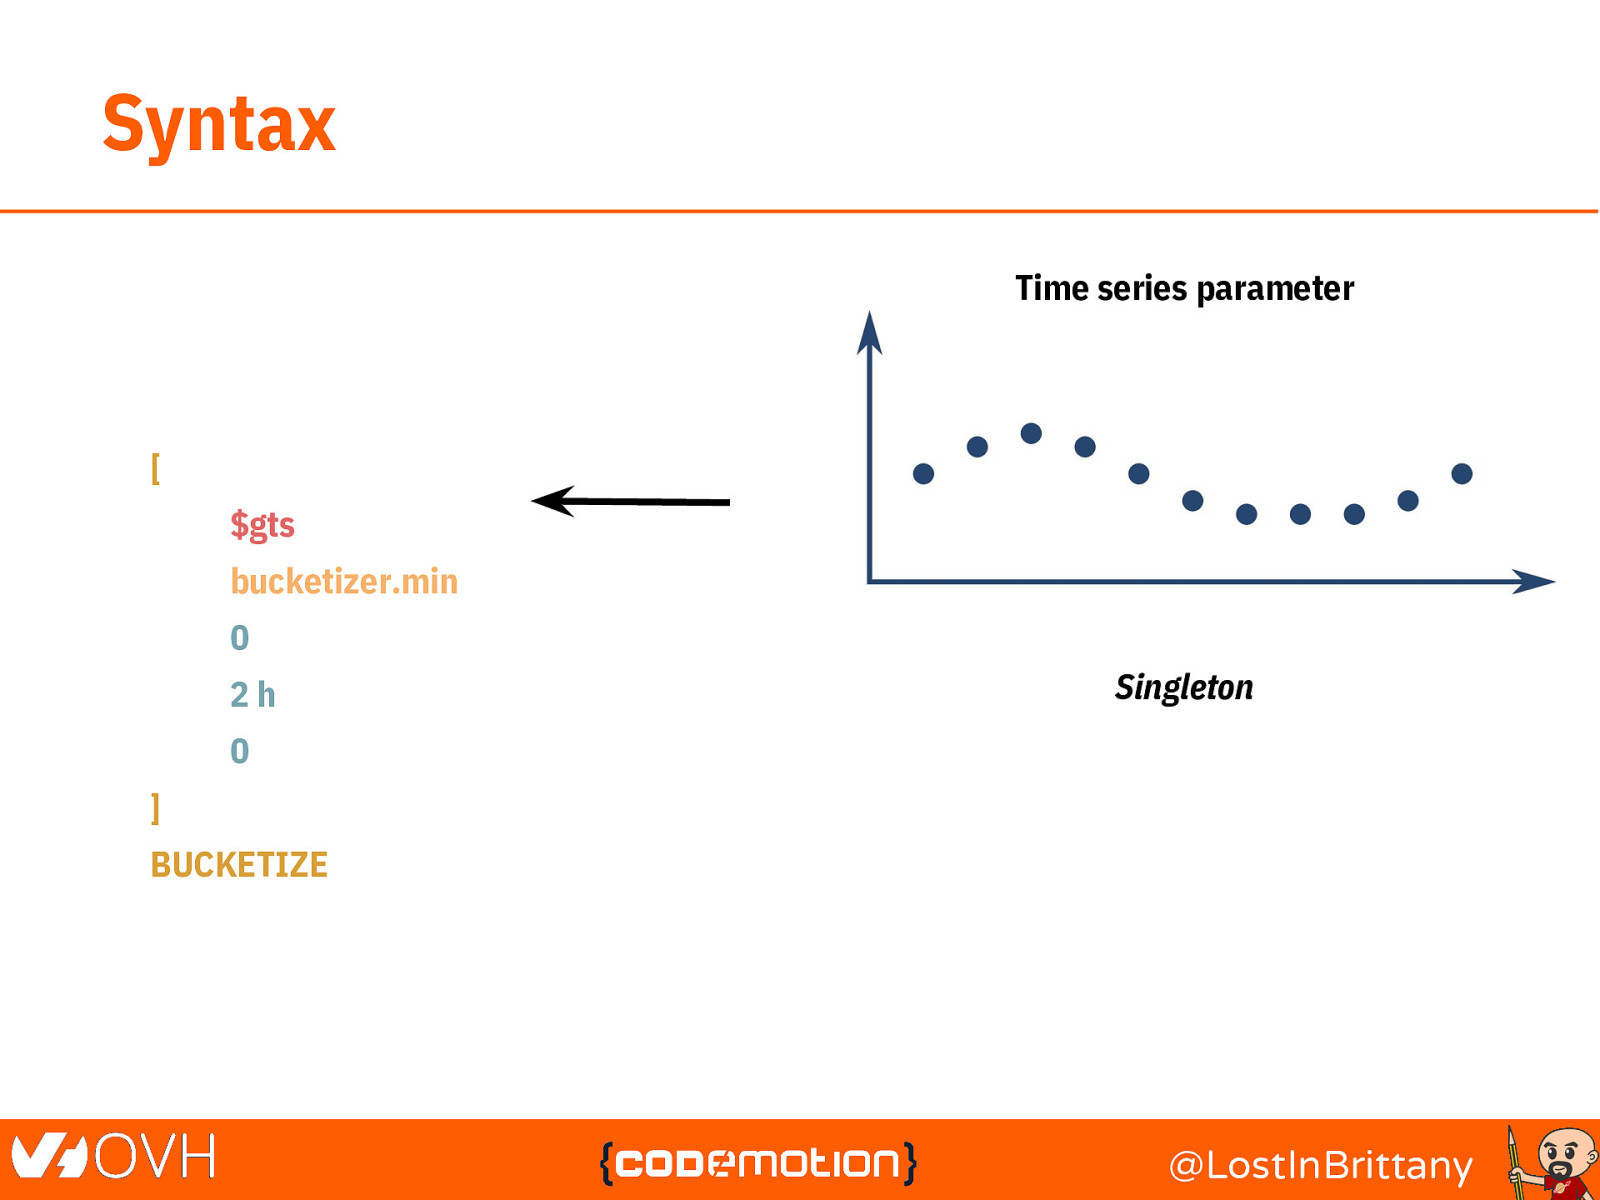
Syntax Time series parameter [ $gts bucketizer.min 0 2h Singleton 0 ] BUCKETIZE Time-series set @LostInBrittany
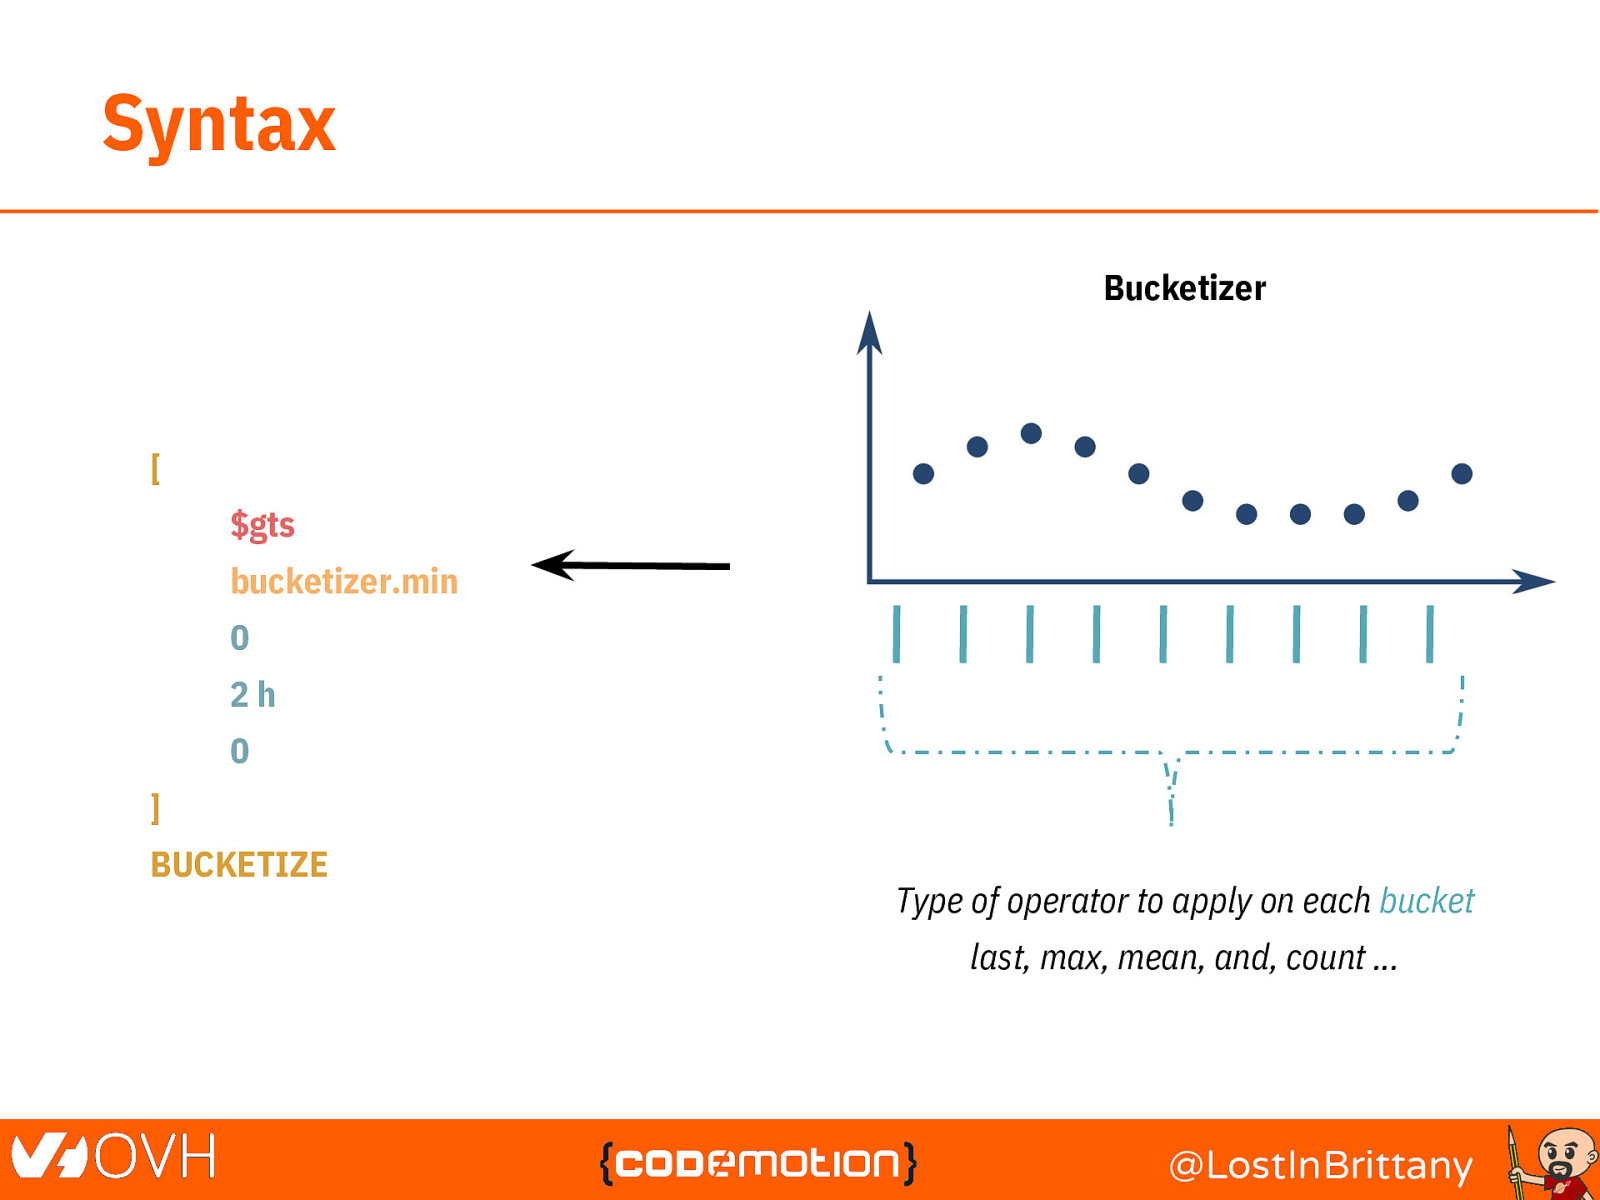
Syntax Bucketizer [ $gts bucketizer.min 0 2h 0 ] BUCKETIZE Type of operator to apply on each bucket last, max, mean, and, count … @LostInBrittany
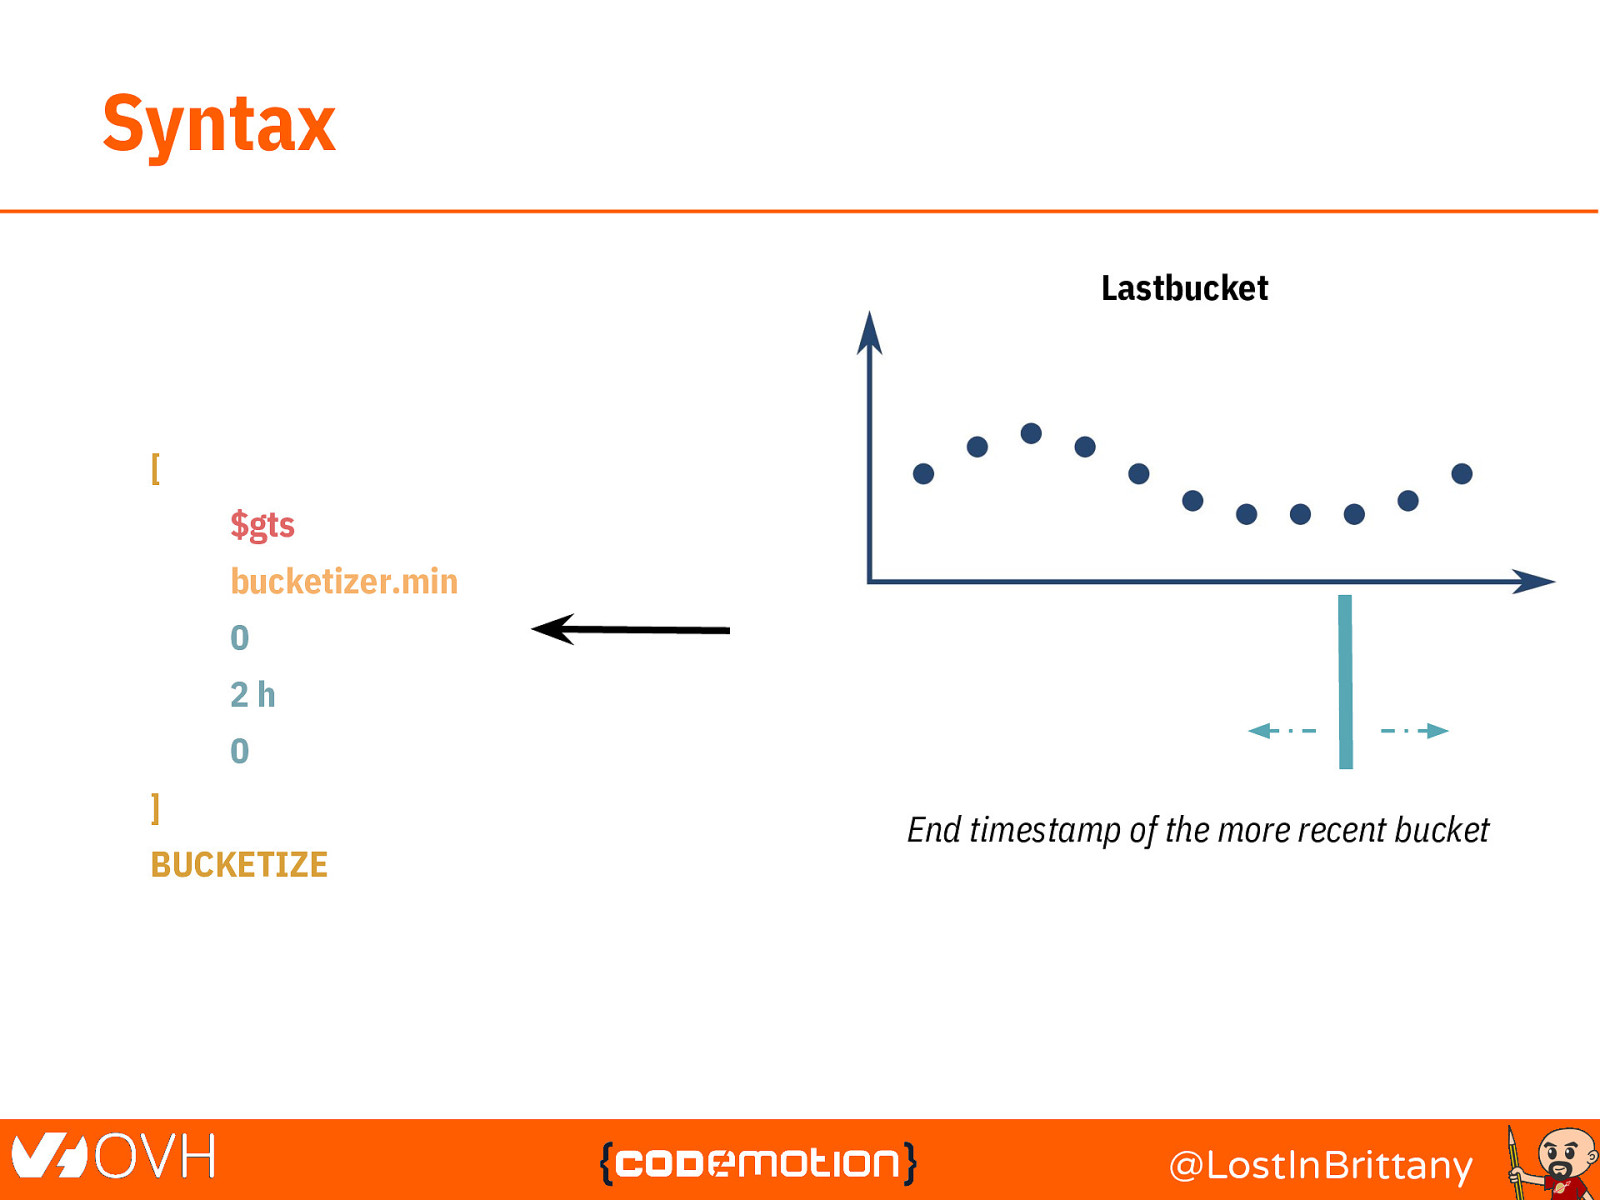
Syntax Lastbucket [ $gts bucketizer.min 0 2h 0 ] BUCKETIZE End timestamp of the more recent bucket @LostInBrittany
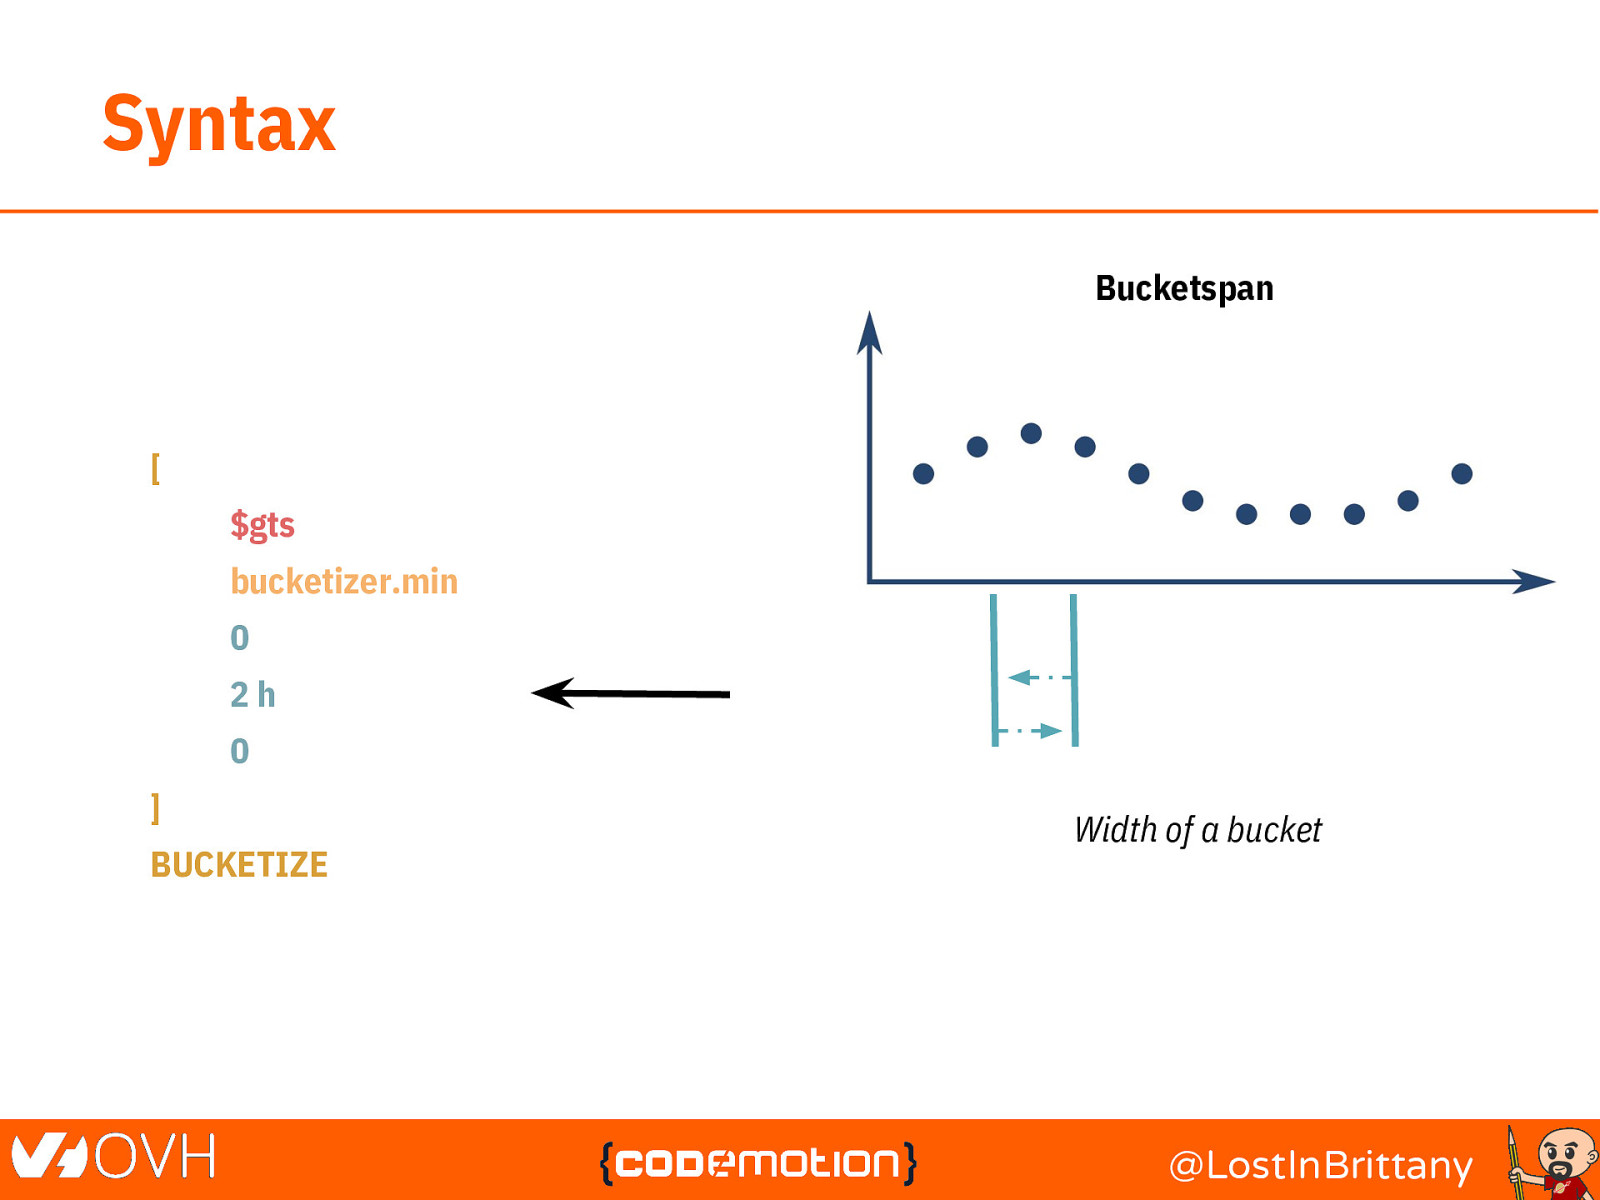
Syntax Bucketspan [ $gts bucketizer.min 0 2h 0 ] BUCKETIZE Width of a bucket @LostInBrittany
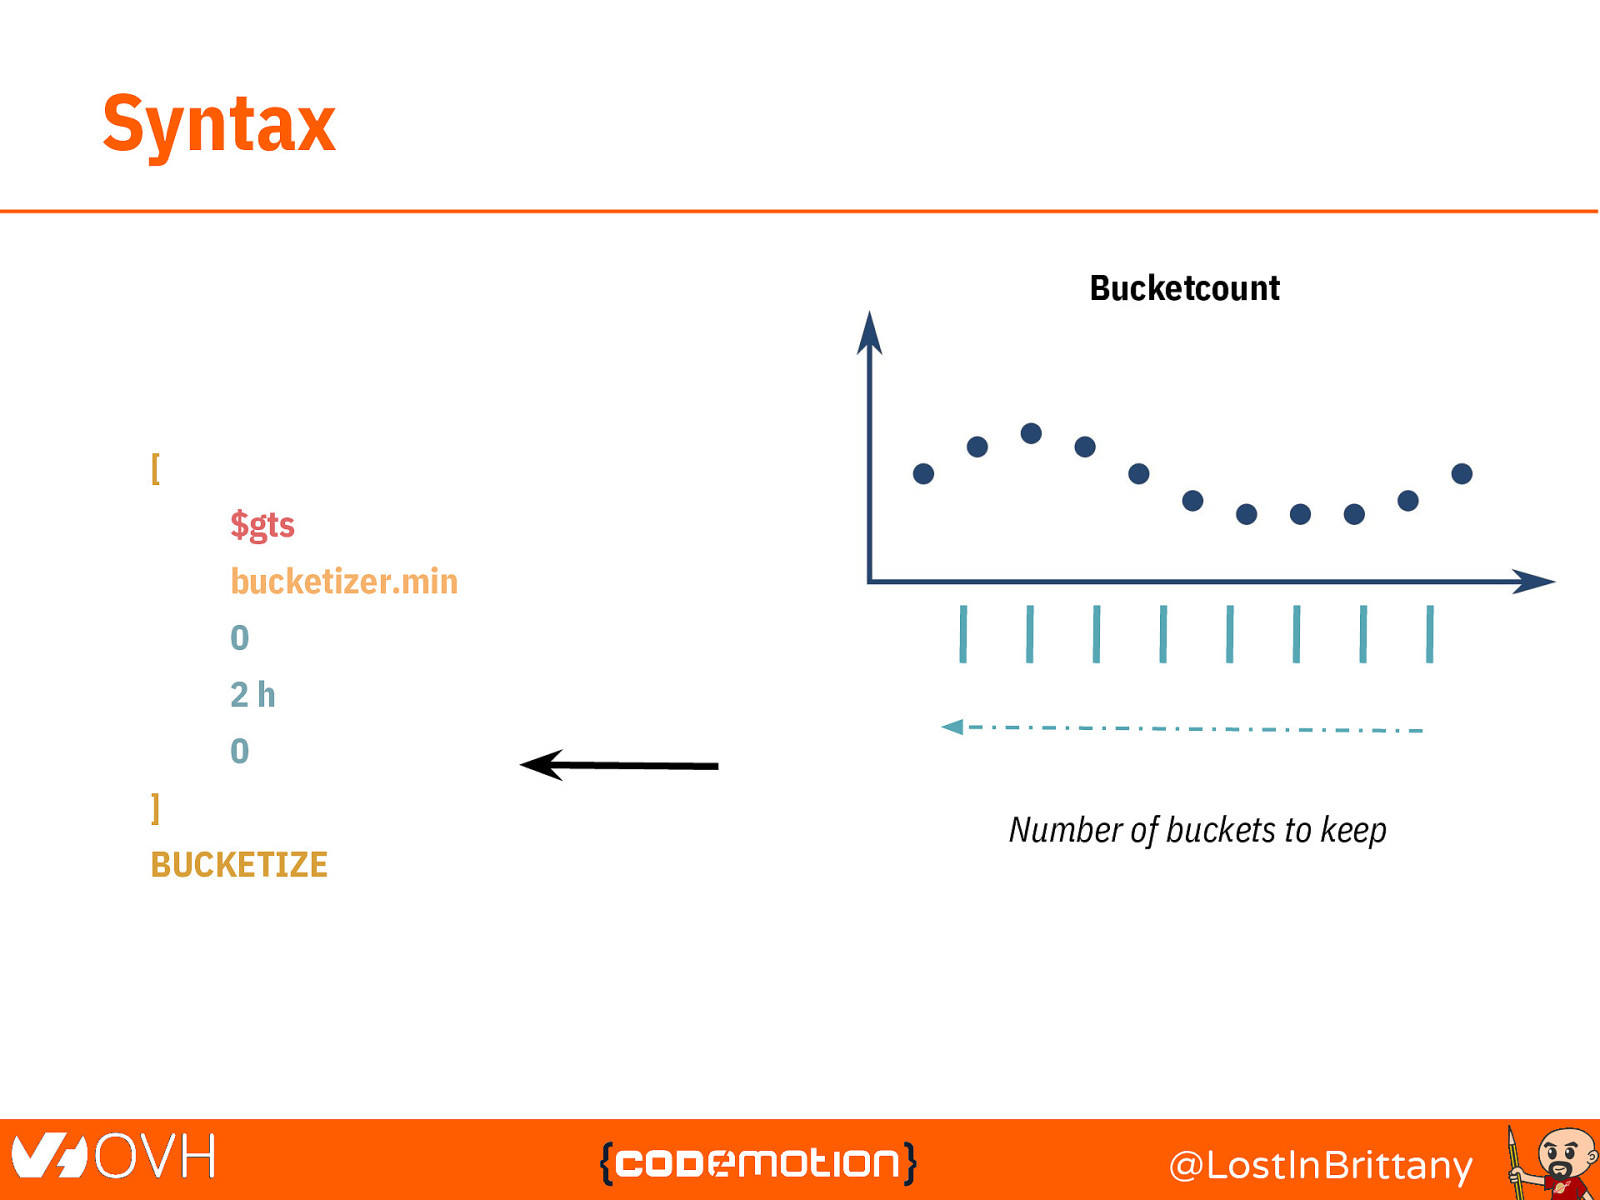
Syntax Bucketcount [ $gts bucketizer.min 0 2h 0 ] BUCKETIZE Number of buckets to keep @LostInBrittany
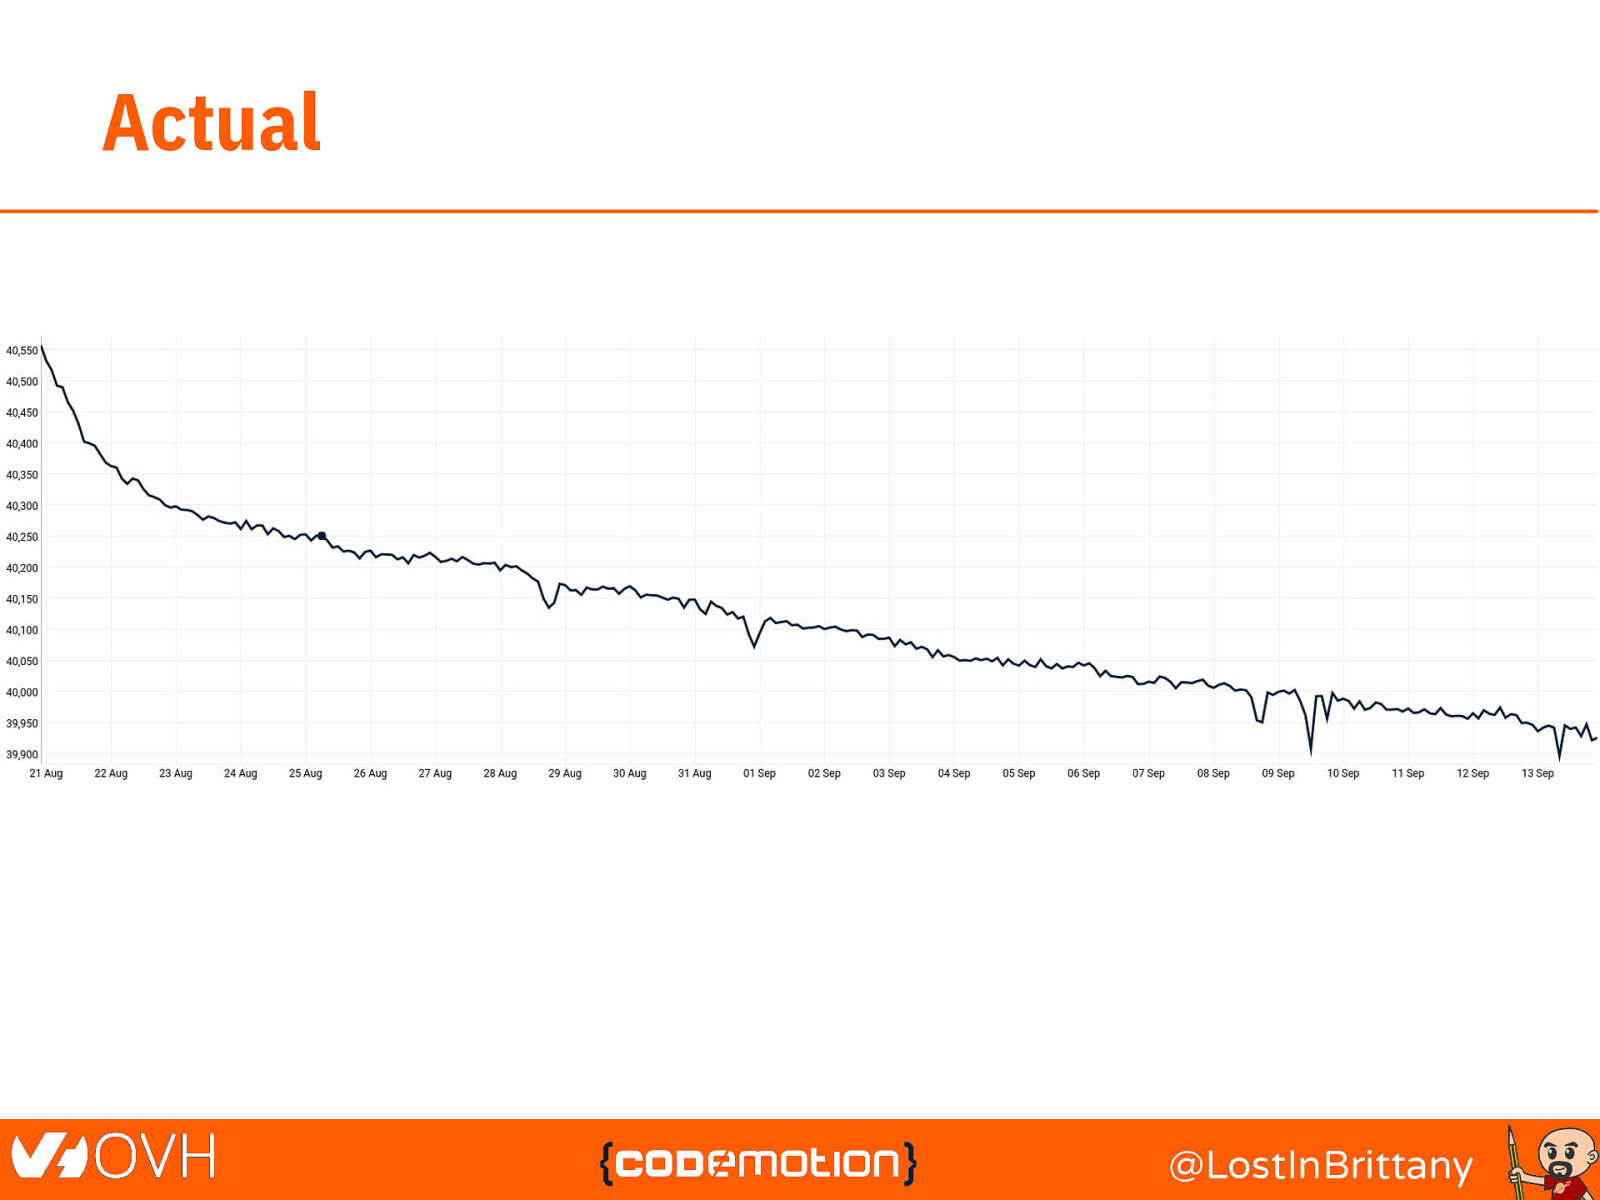
Actual @LostInBrittany
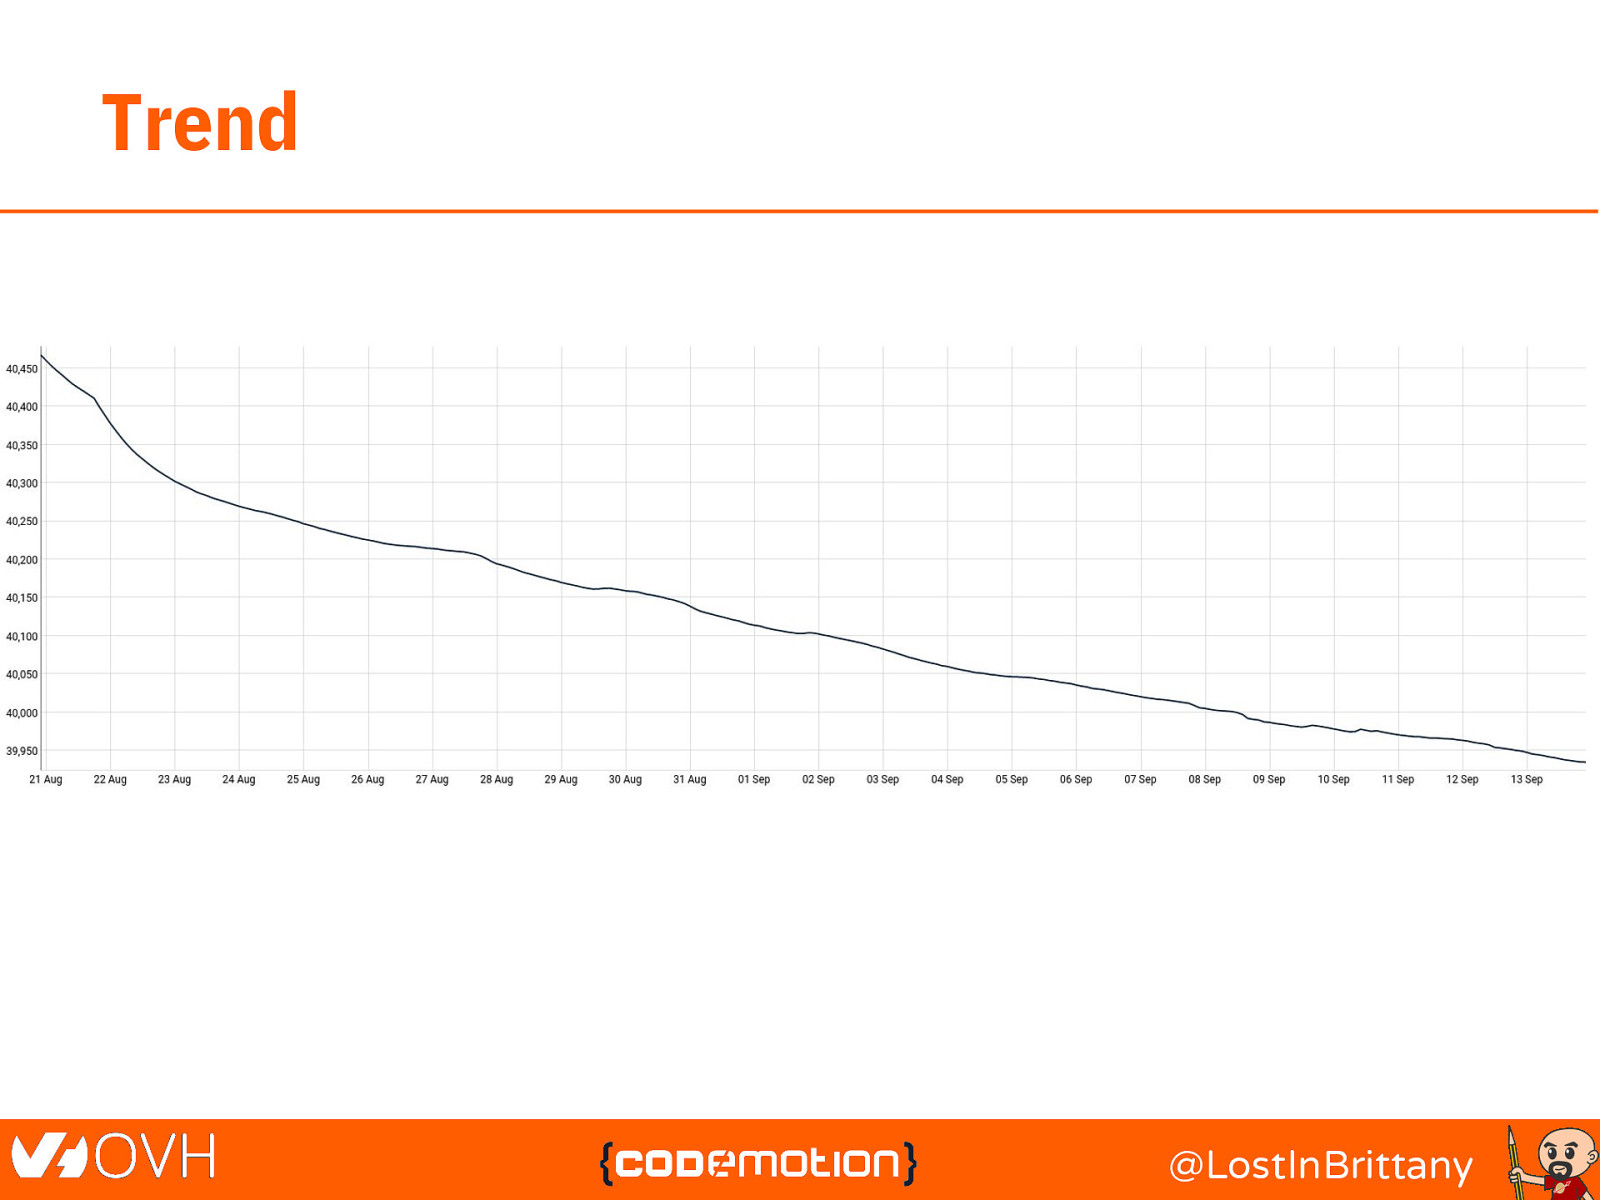
Trend @LostInBrittany
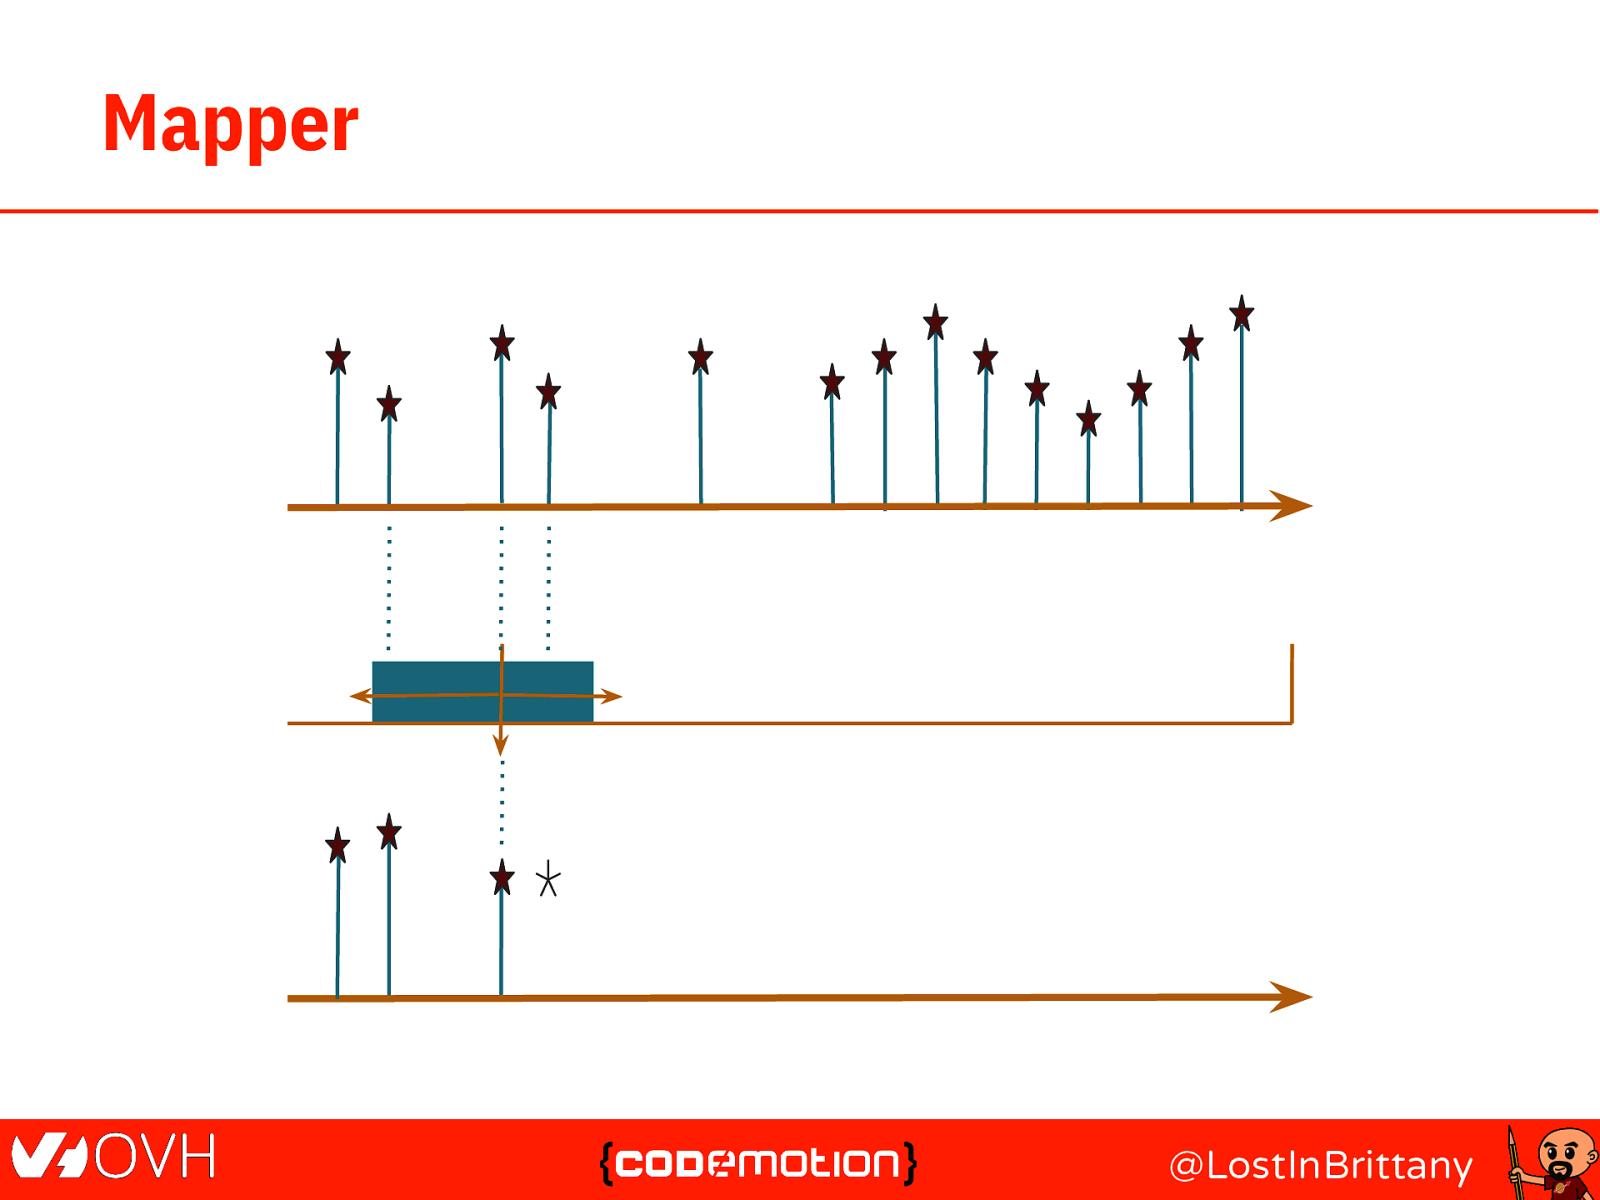
Mapper @LostInBrittany
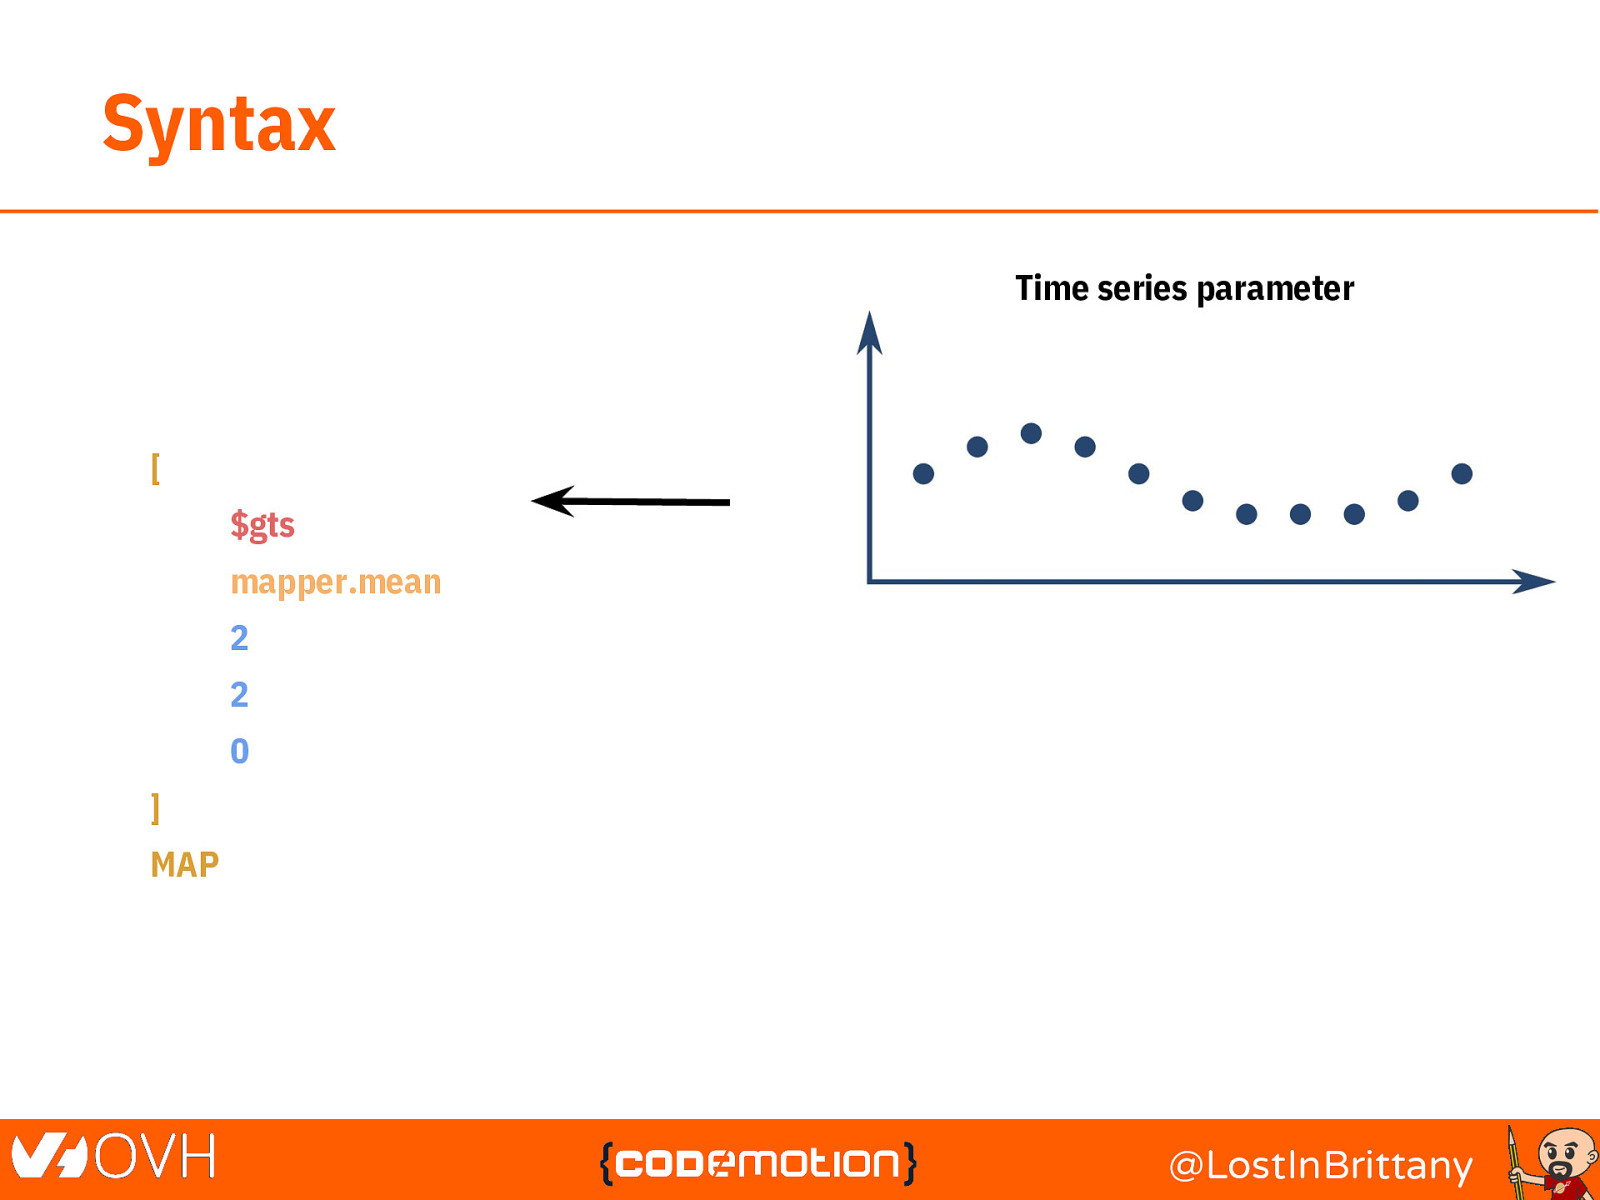
Syntax Time series parameter [ $gts mapper.mean 2 2 Singleton 0 ] MAP Time-series set @LostInBrittany
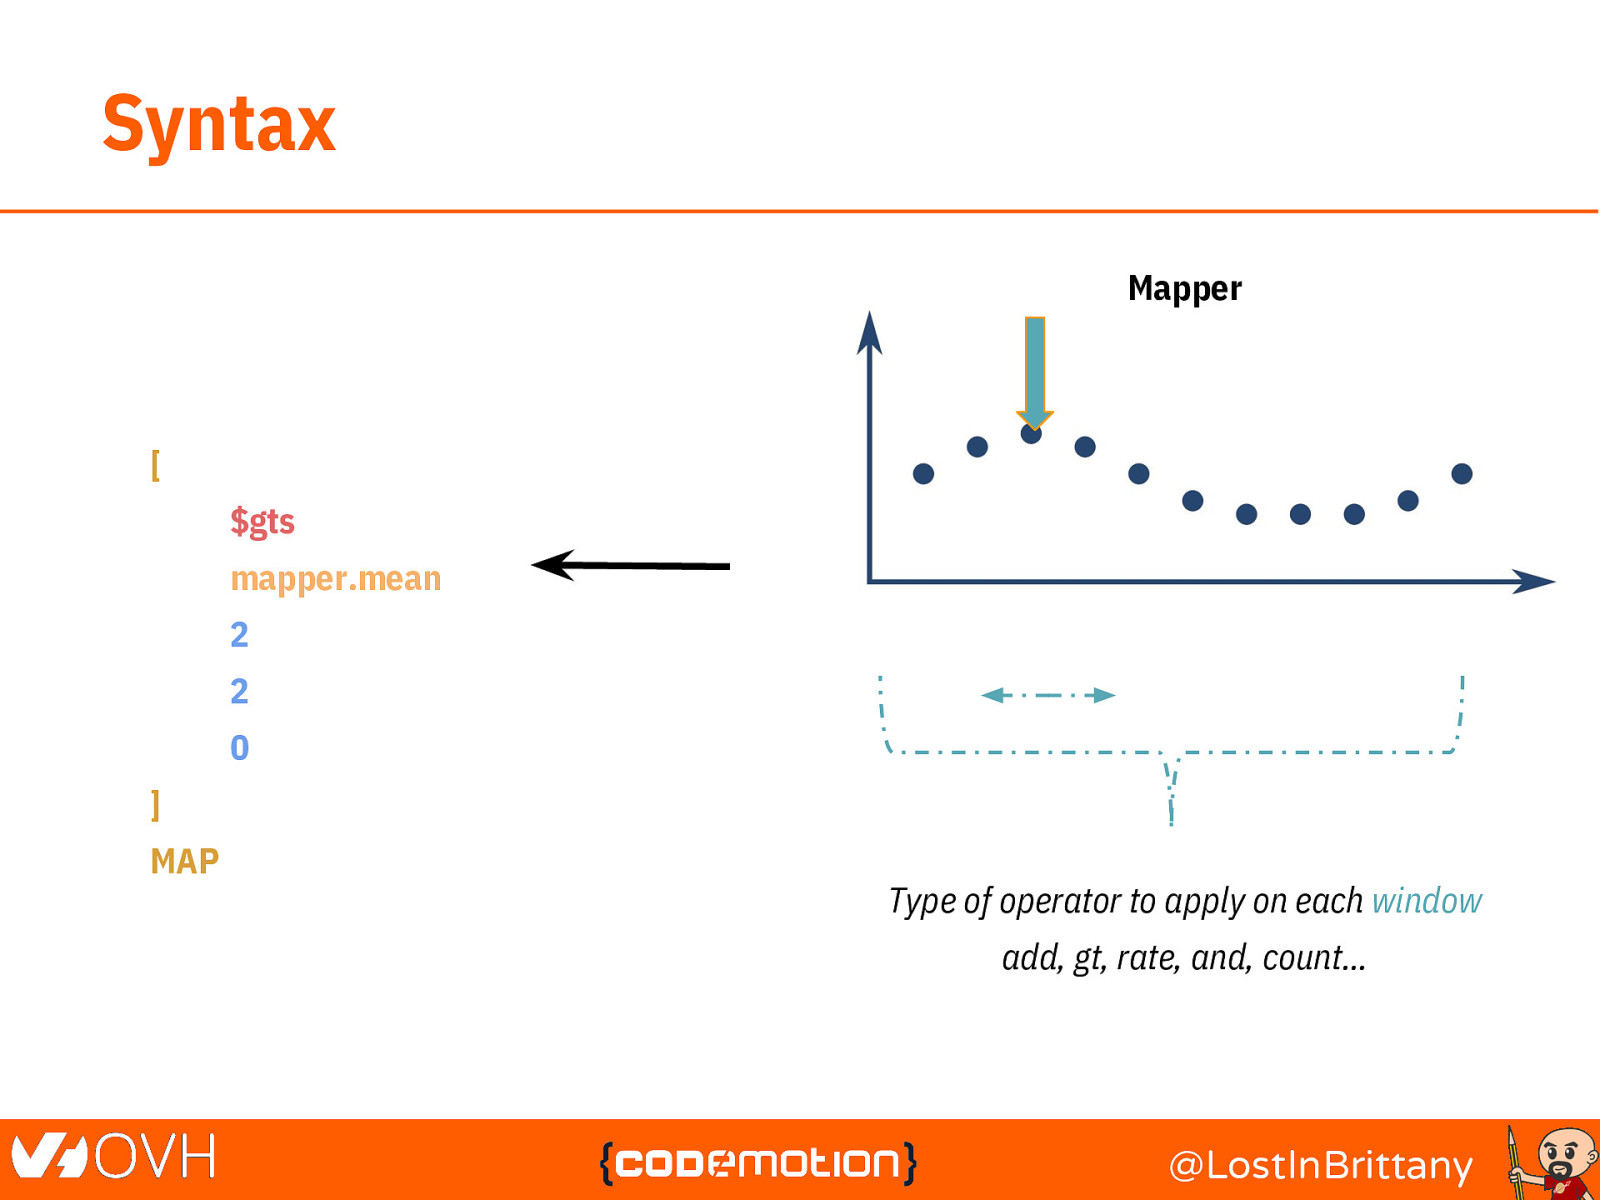
Syntax Mapper [ $gts mapper.mean 2 2 0 ] MAP Type of operator to apply on each window add, gt, rate, and, count… @LostInBrittany
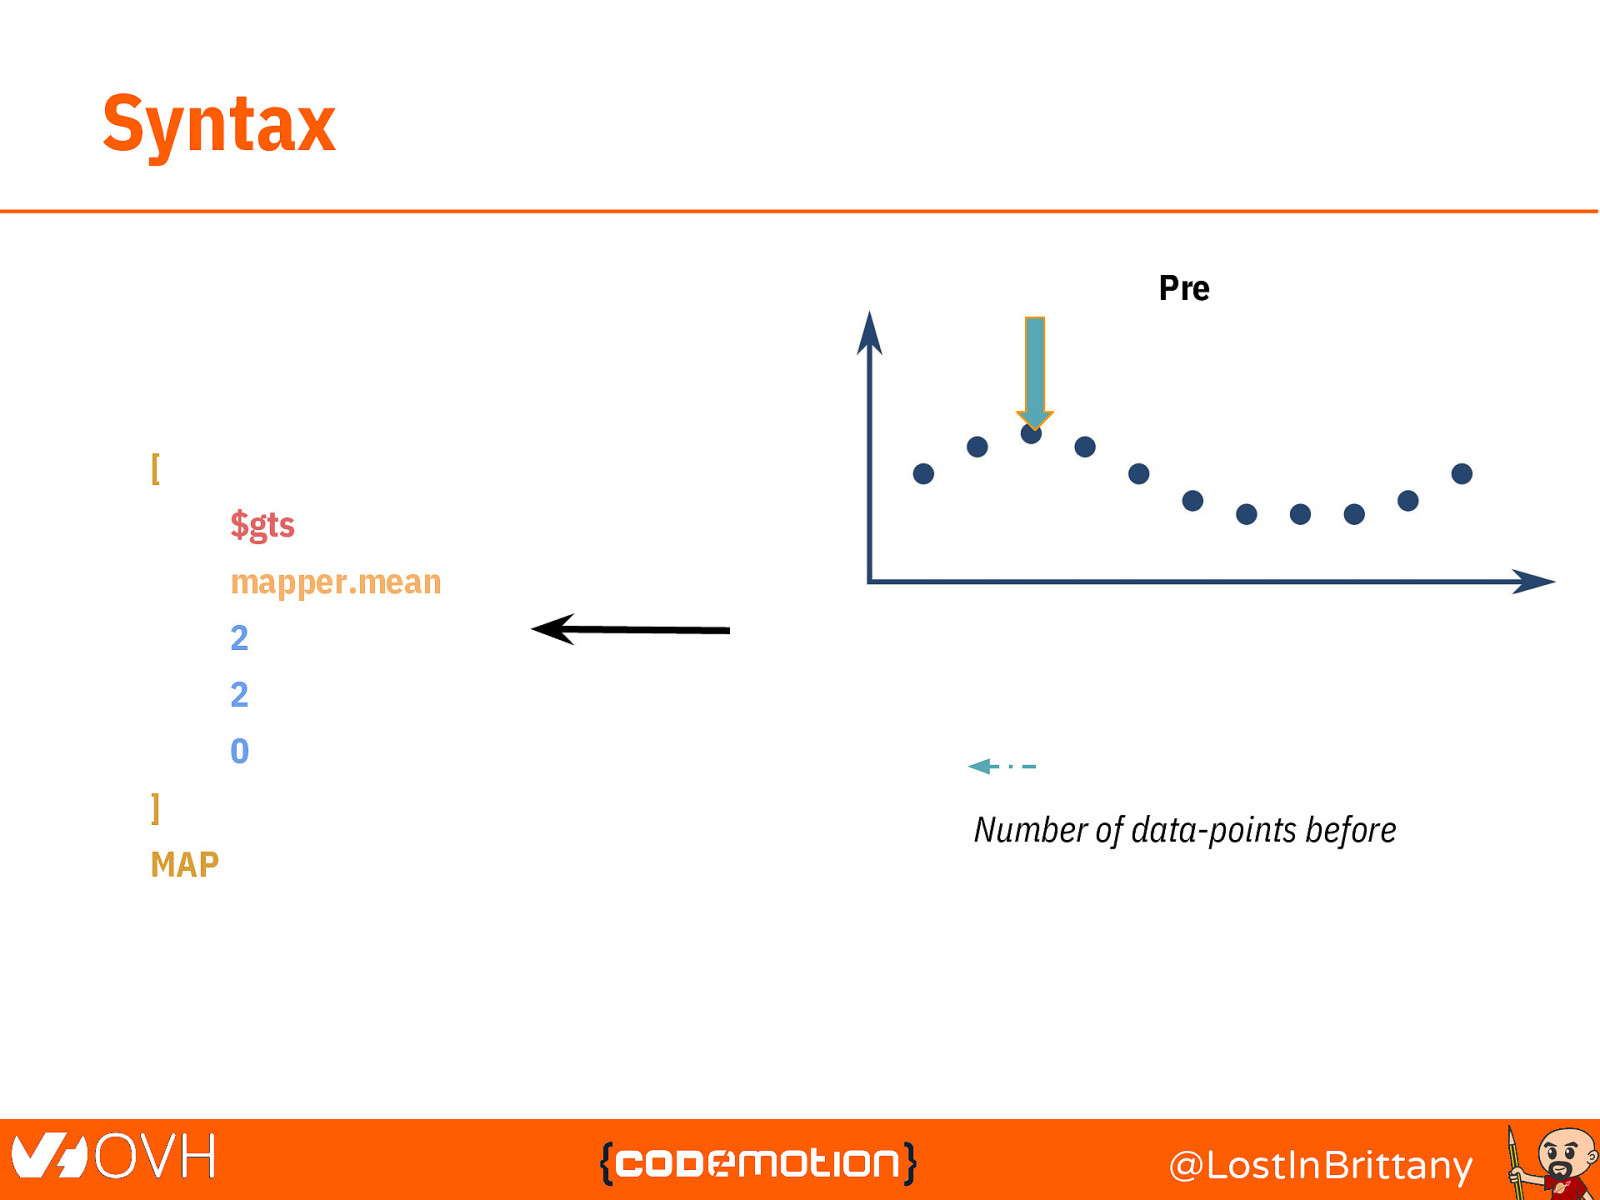
Syntax Pre [ $gts mapper.mean 2 2 0 ] MAP Number of data-points before @LostInBrittany
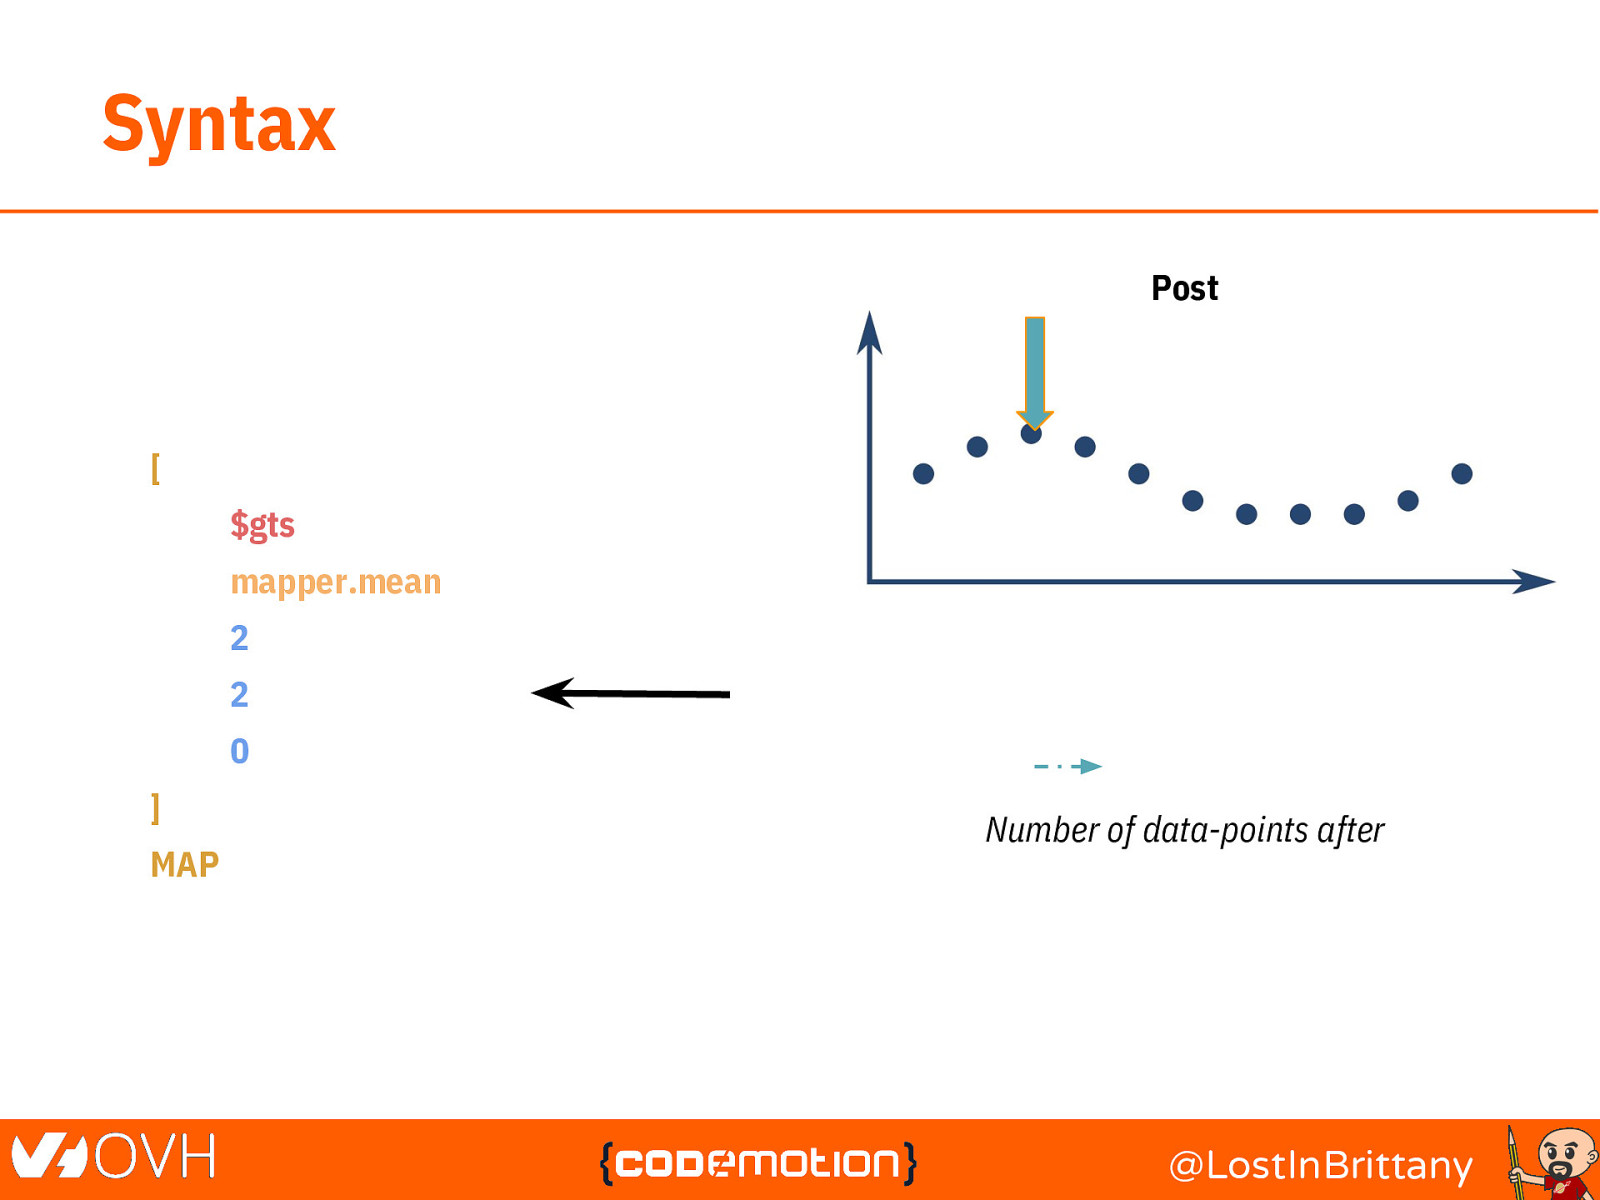
Syntax Post [ $gts mapper.mean 2 2 0 ] MAP Number of data-points after @LostInBrittany
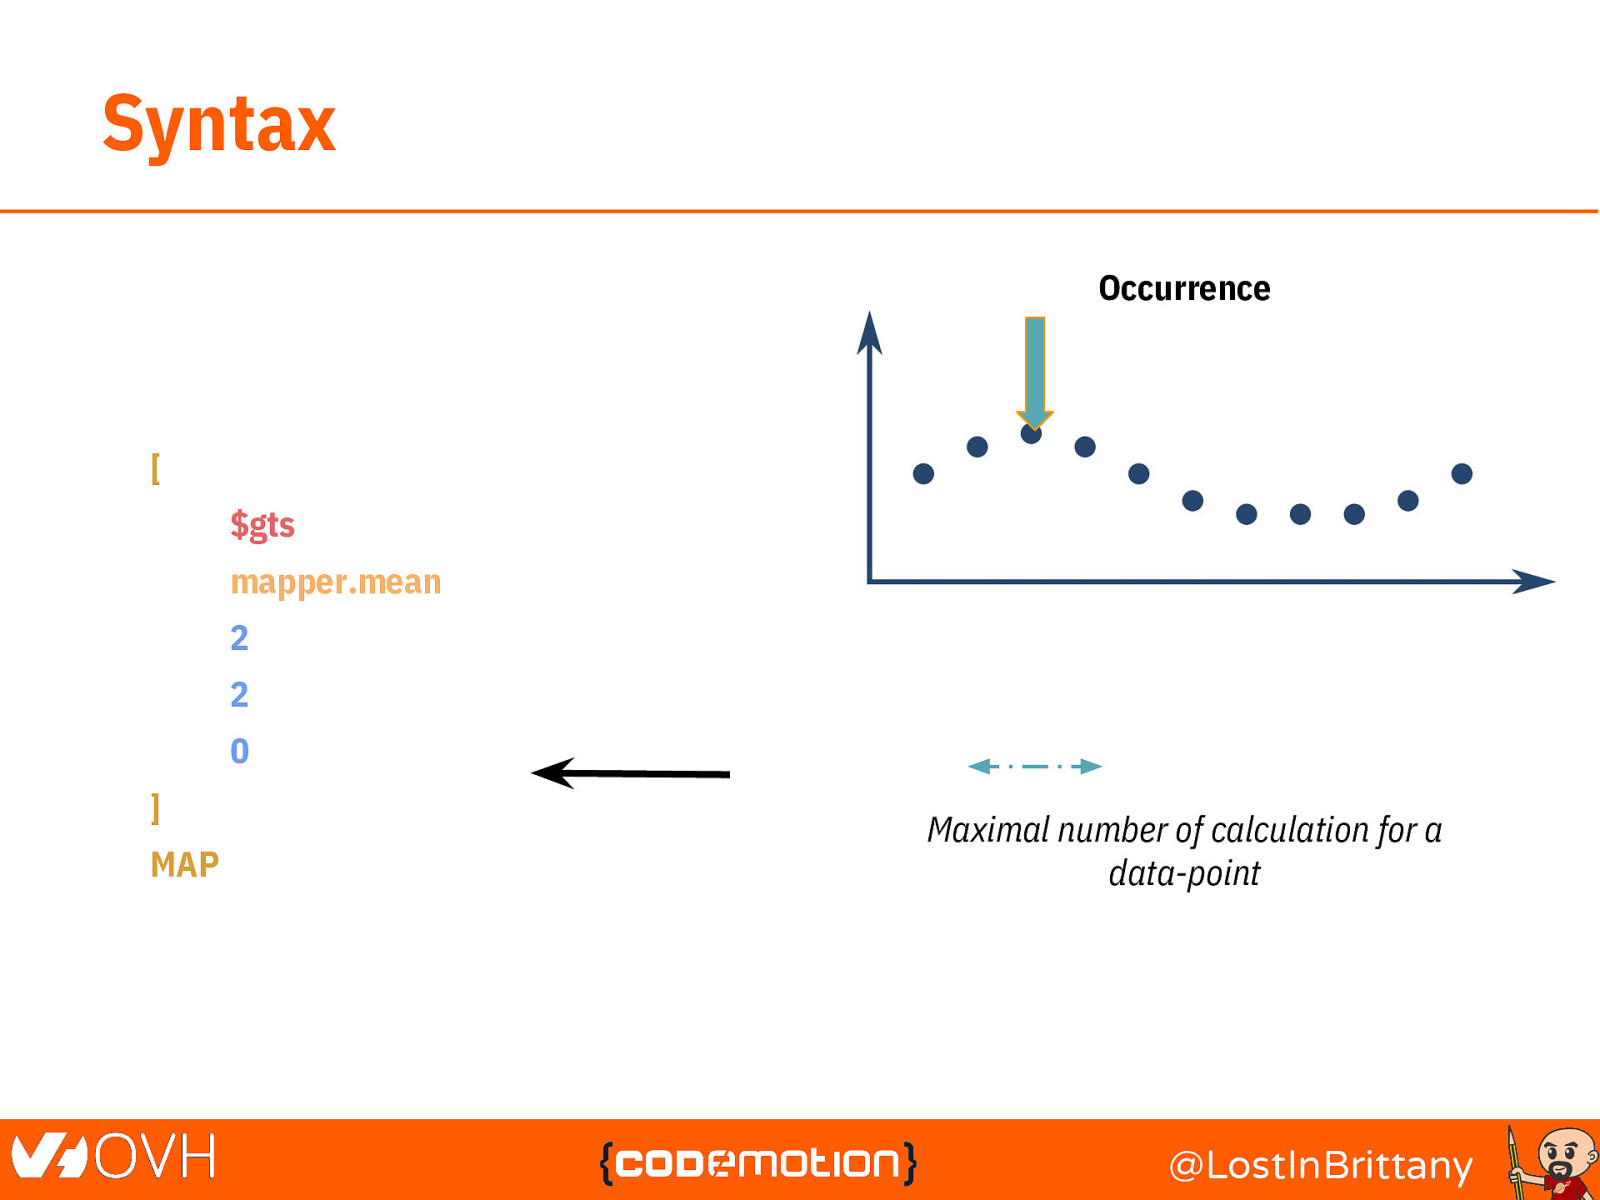
Syntax Occurrence [ $gts mapper.mean 2 2 0 ] MAP Maximal number of calculation for a data-point @LostInBrittany

Actual @LostInBrittany

Trend @LostInBrittany
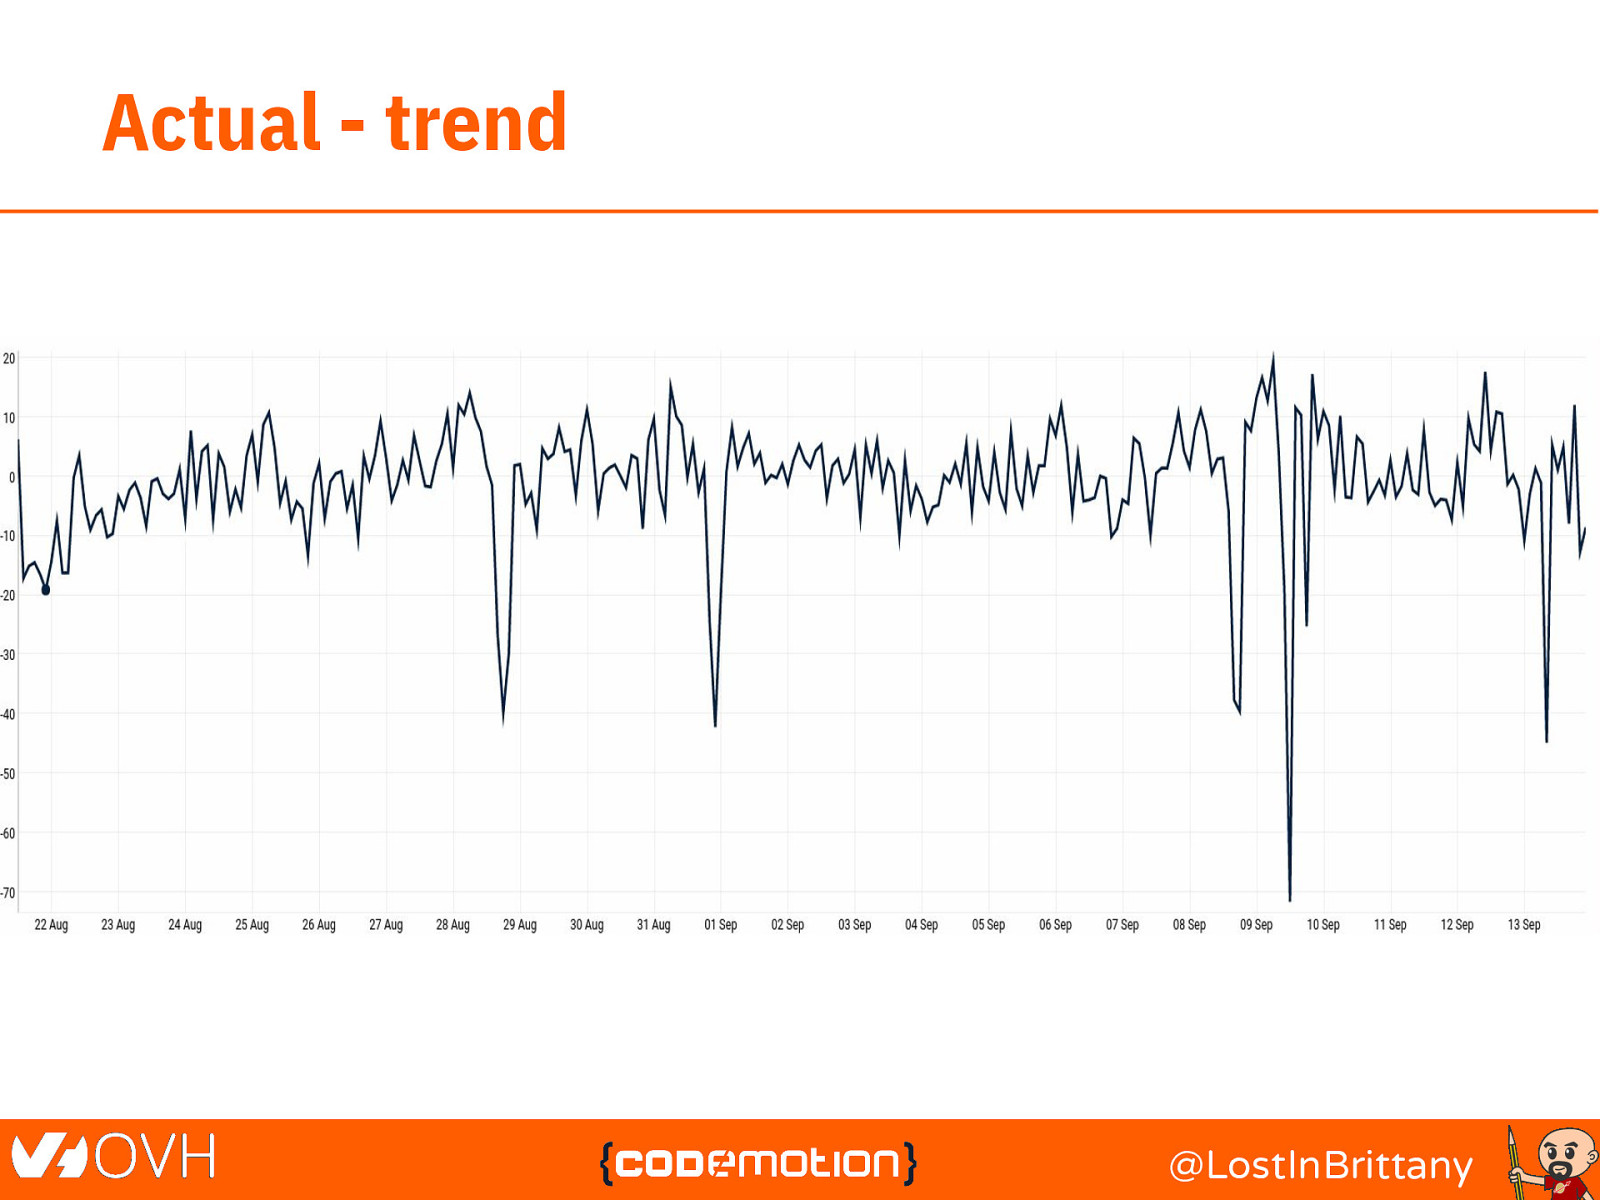
Actual - trend @LostInBrittany
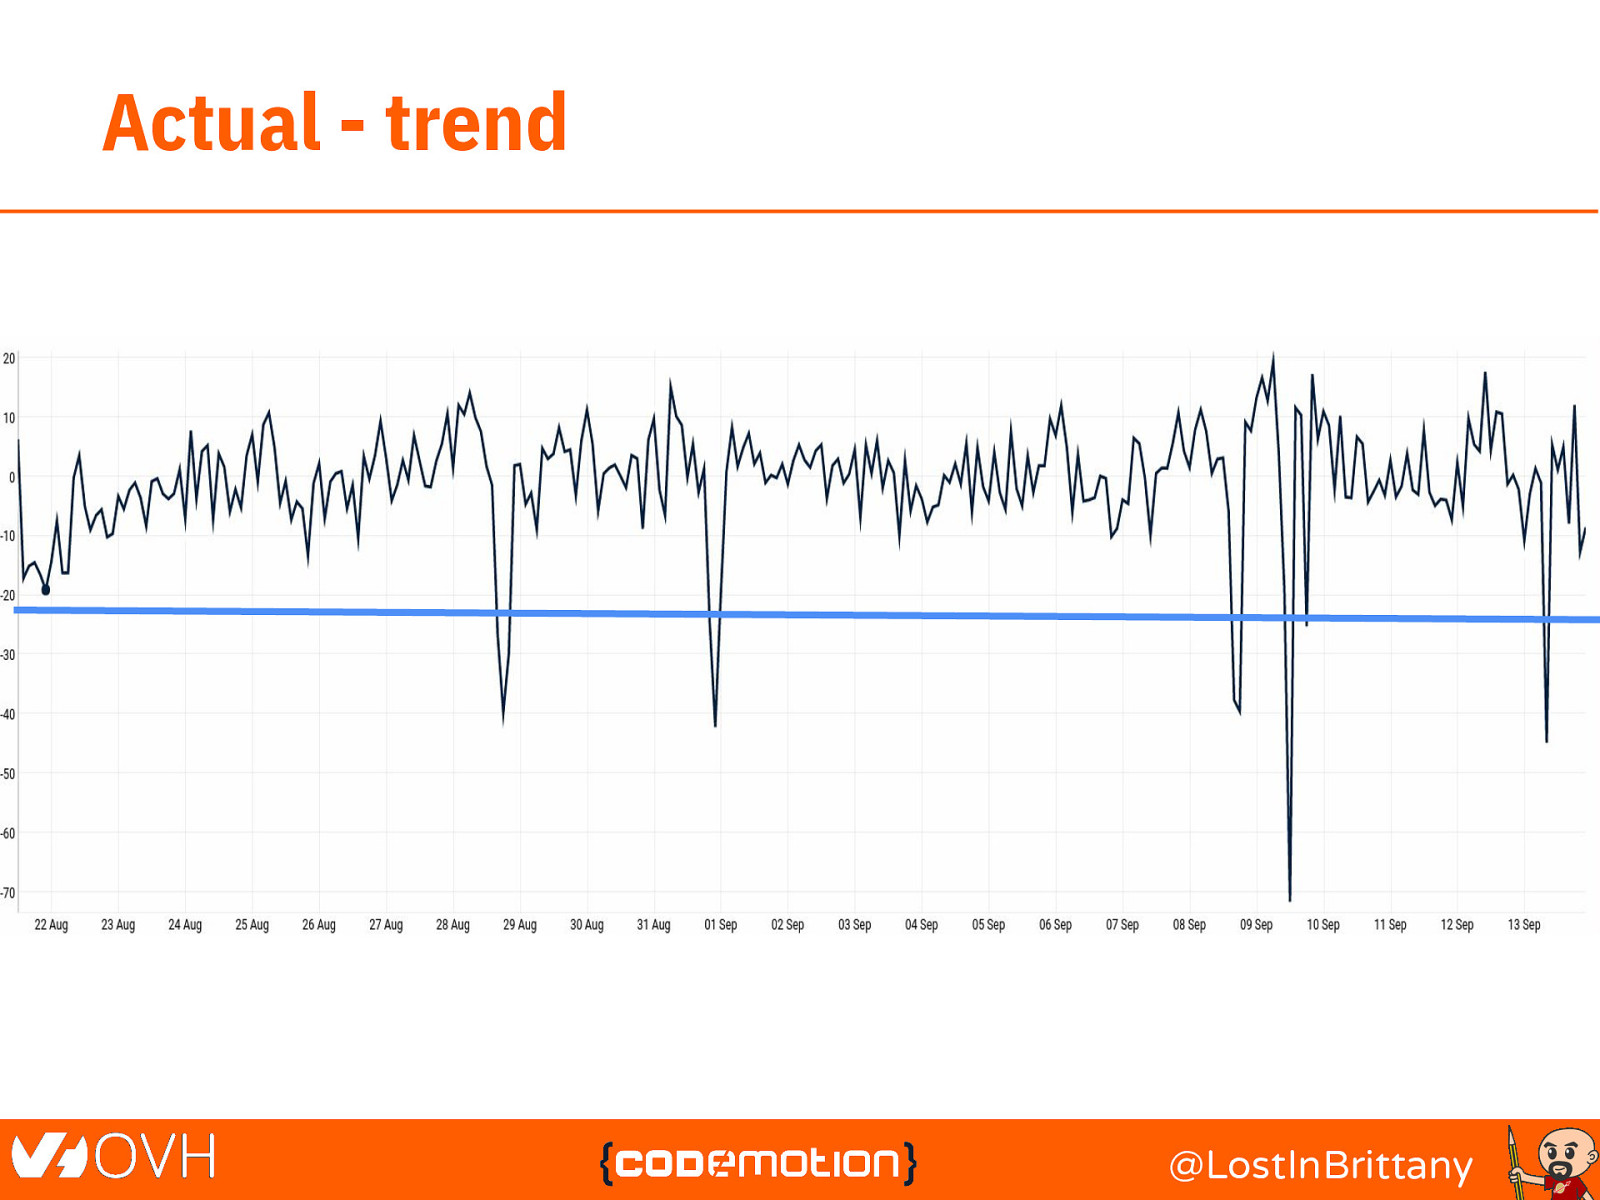
Actual - trend @LostInBrittany

Time to level-up! @LostInBrittany
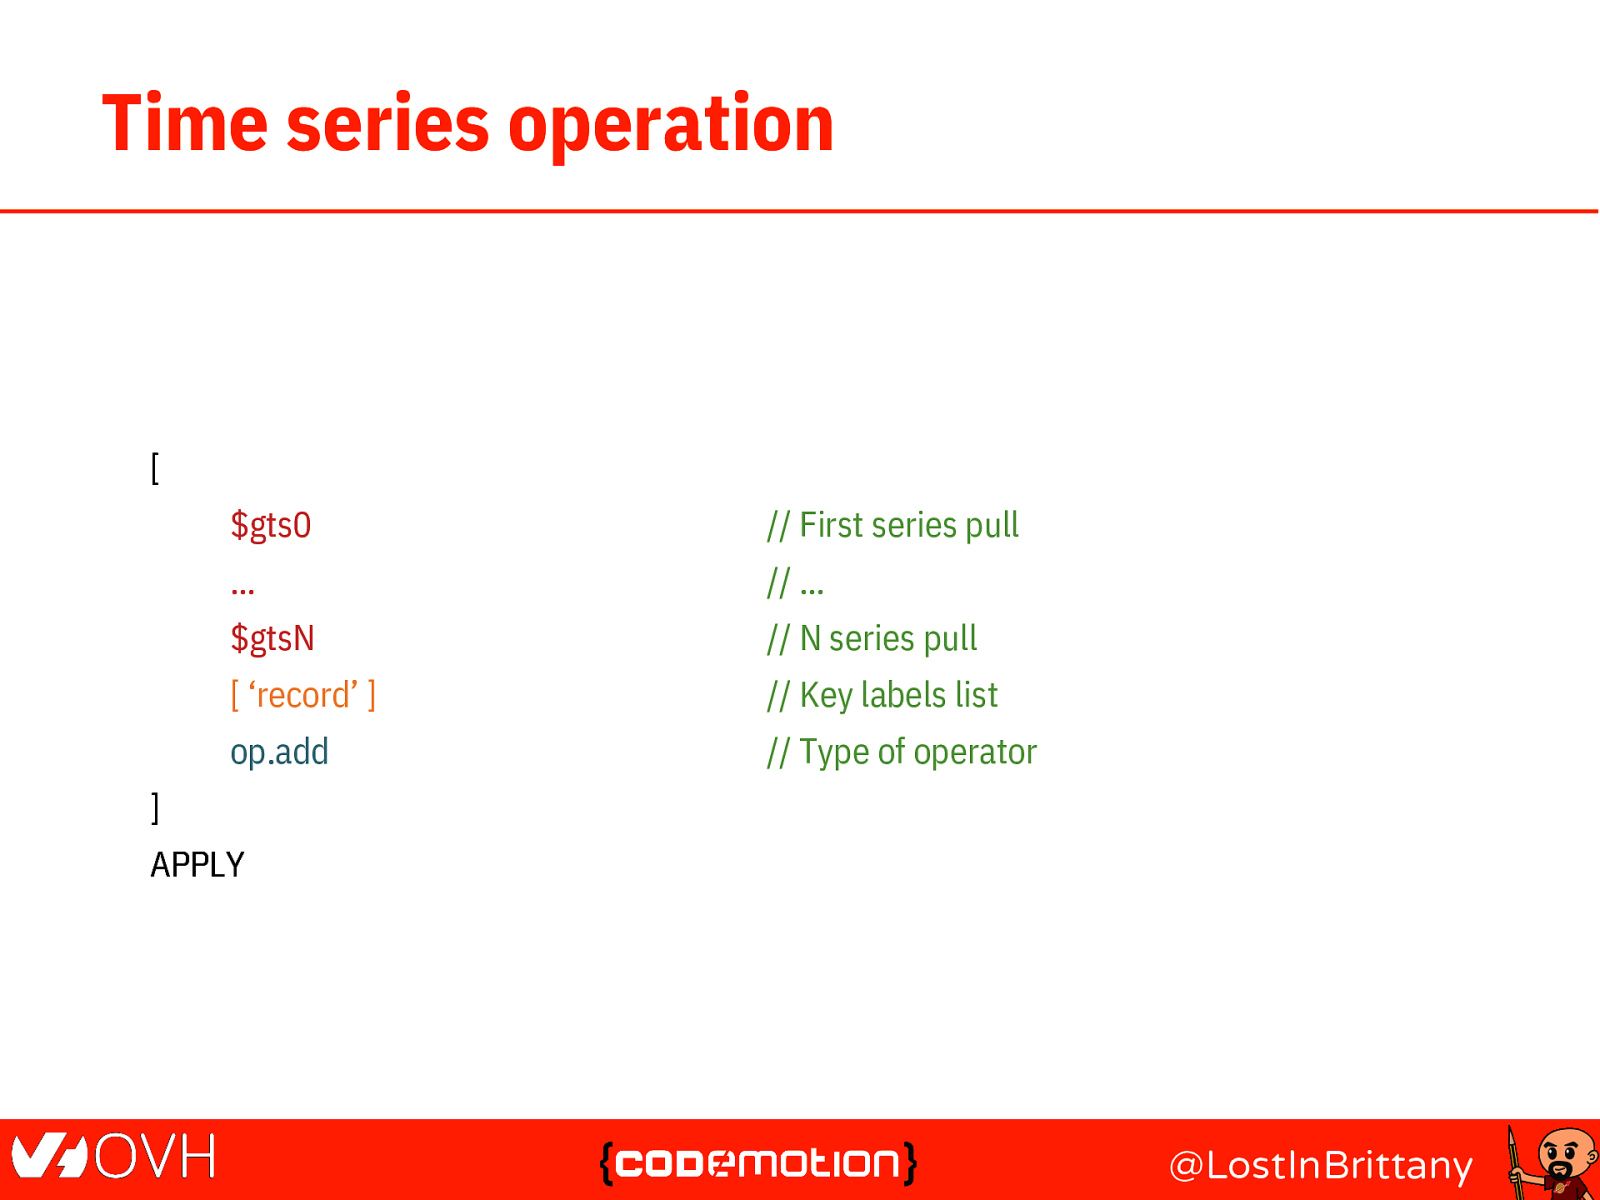
Time series operation [ $gts0 // First series pull … // … $gtsN // N series pull [ ‘record’ ] // Key labels list op.add // Type of operator ] APPLY @LostInBrittany
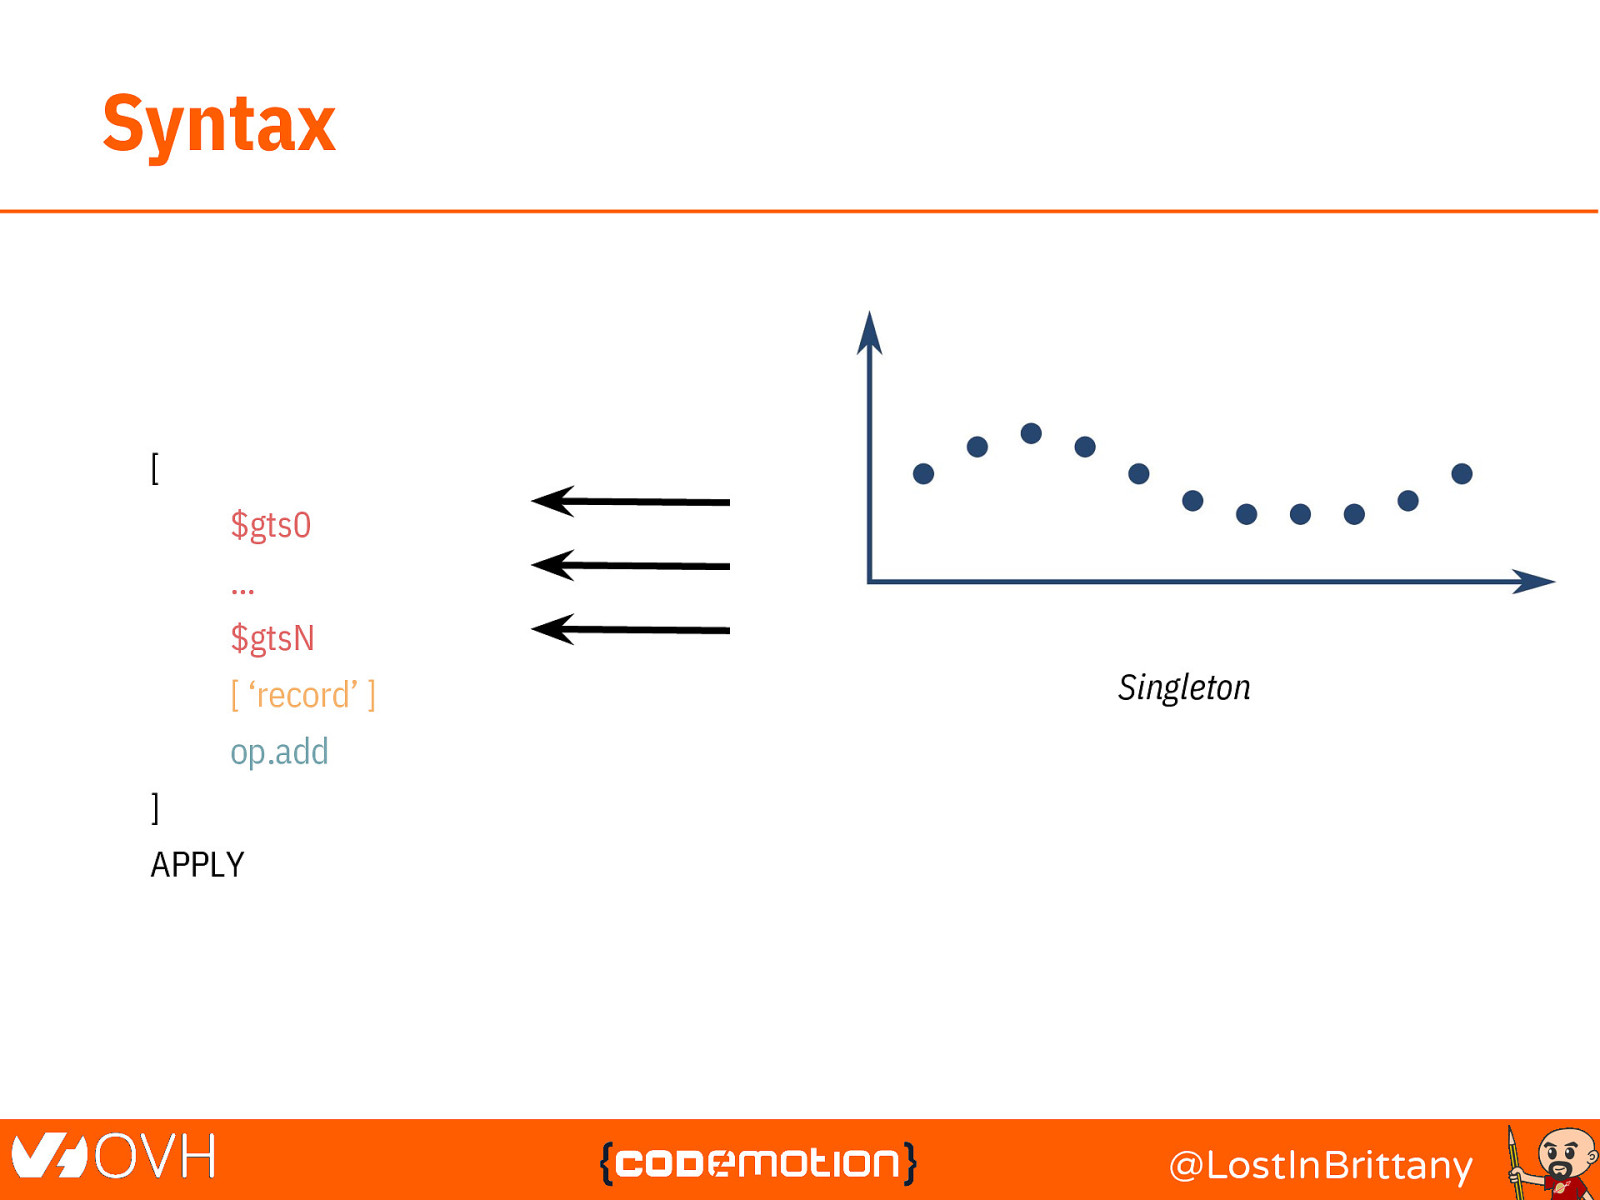
Syntax Time series parameter [ $gts0 … $gtsN [ ‘record’ ] Singleton op.add ] APPLY Time-series set @LostInBrittany
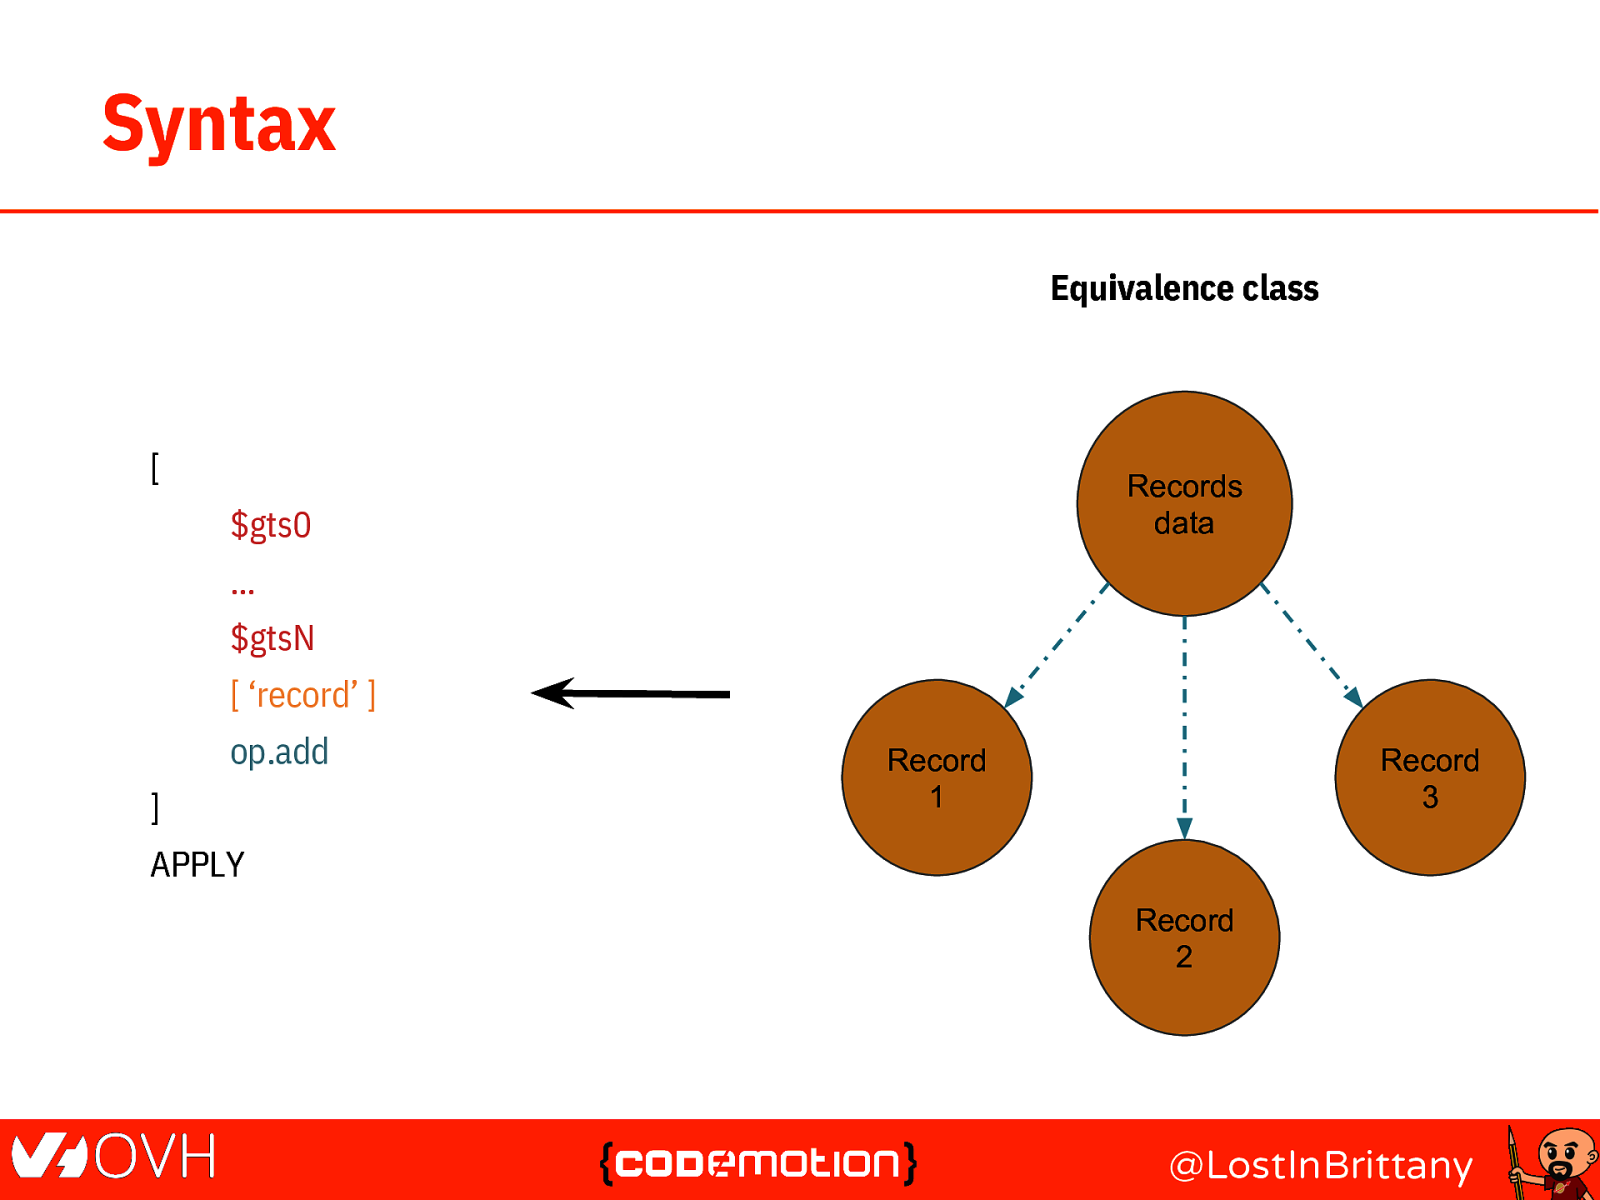
Syntax Equivalence class [ Records data $gts0 … $gtsN [ ‘record’ ] op.add ] Record 1 Record 3 APPLY Record 2 @LostInBrittany
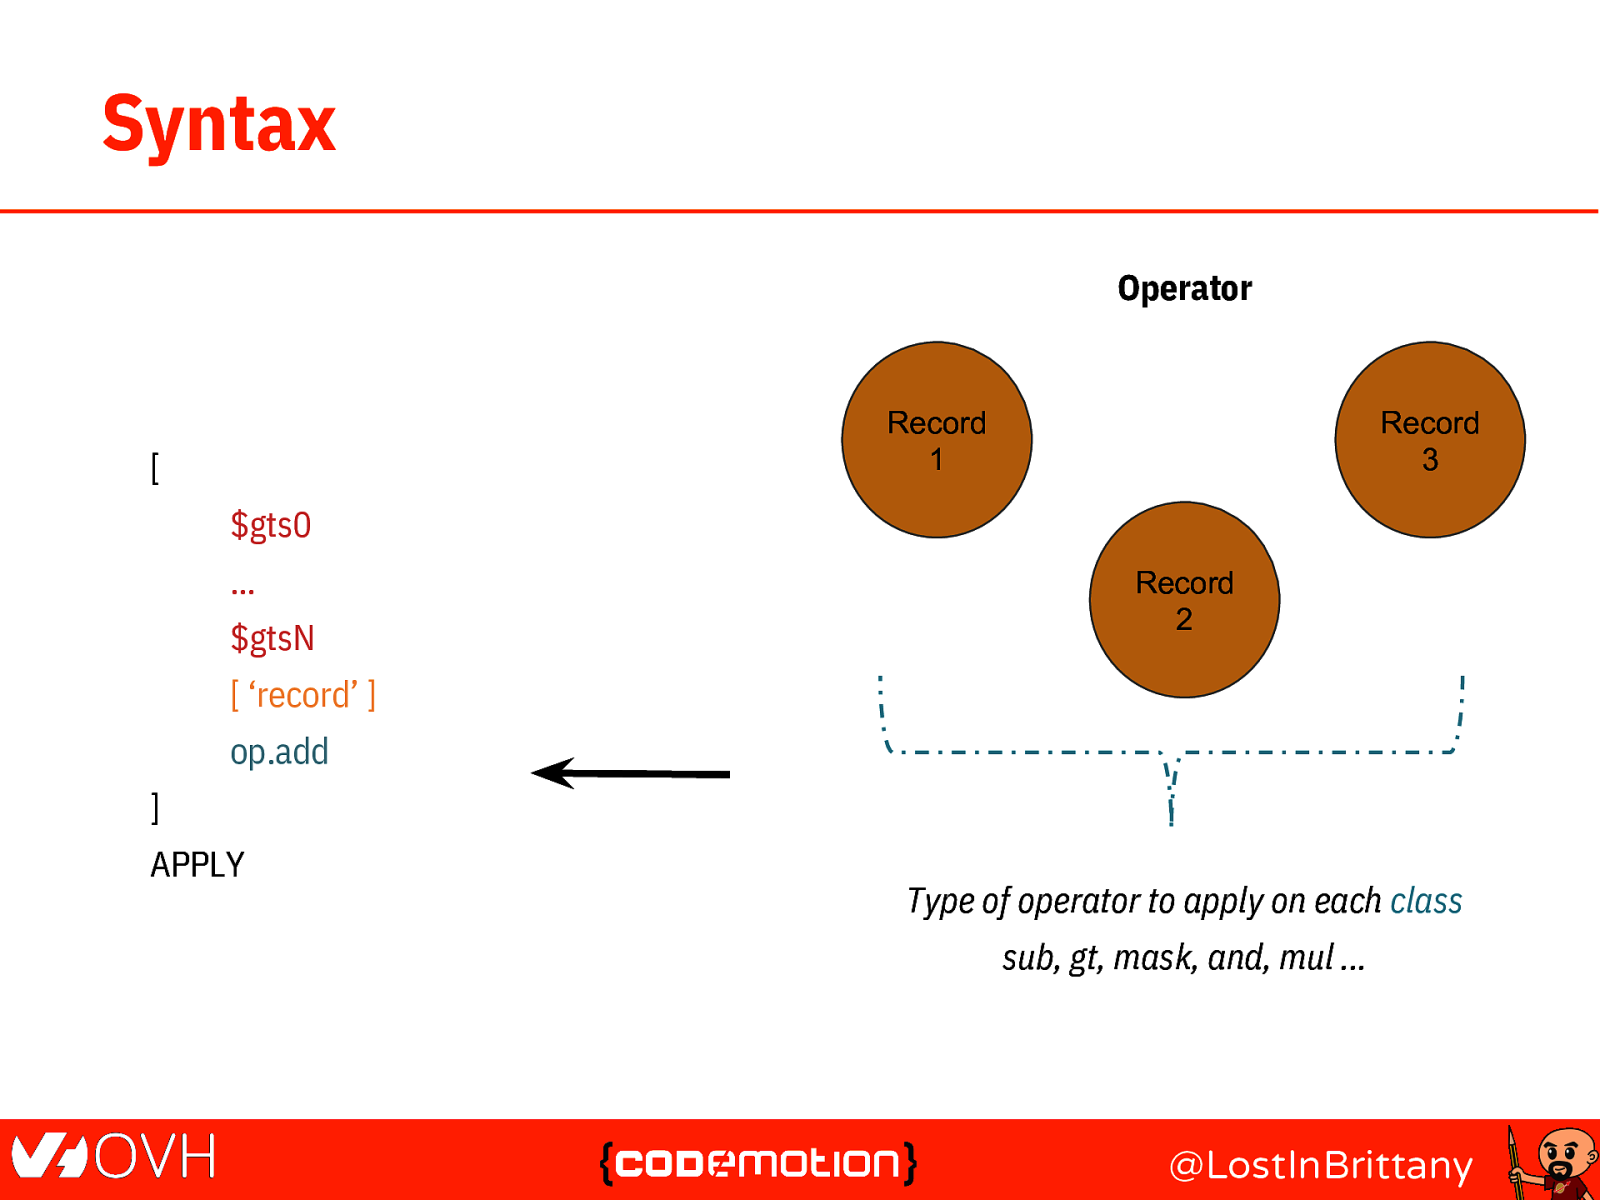
Syntax Operator Record 1 [ Record 3 $gts0 … $gtsN Record 2 [ ‘record’ ] op.add ] APPLY Type of operator to apply on each class sub, gt, mask, and, mul … @LostInBrittany
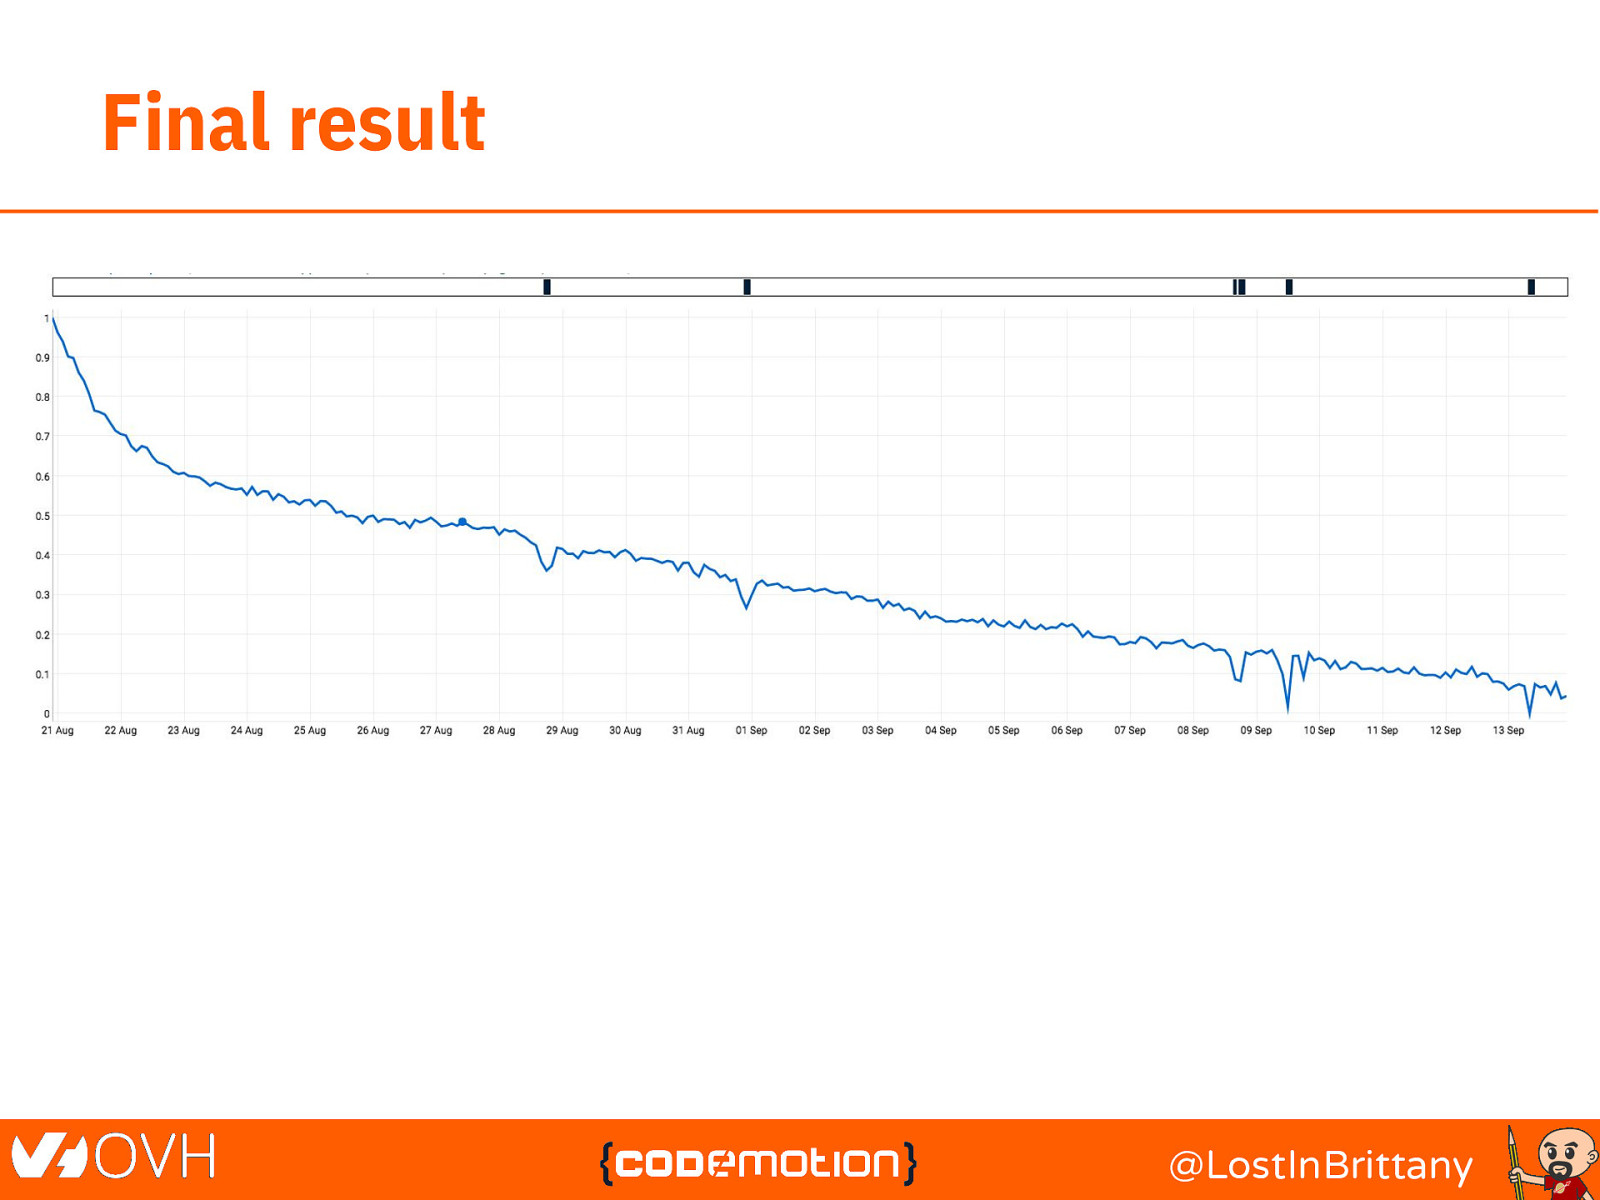
Final result @LostInBrittany