Monitoring OVH: 350k servers, 30 DCs… and one Metrics platform Horacio Gonzalez @LostInBrittany @LostInBrittany

A presentation at DevFest Toulouse in October 2019 in Toulouse, France by Horacio Gonzalez
Monitoring OVH: 350k servers, 30 DCs… and one Metrics platform Horacio Gonzalez @LostInBrittany @LostInBrittany
Who are we? Introducing myself and introducing OVH OVHcloud @LostInBrittany
Horacio Gonzalez @LostInBrittany Spaniard lost in Brittany, developer, dreamer and all-around geek Flutter @LostInBrittany
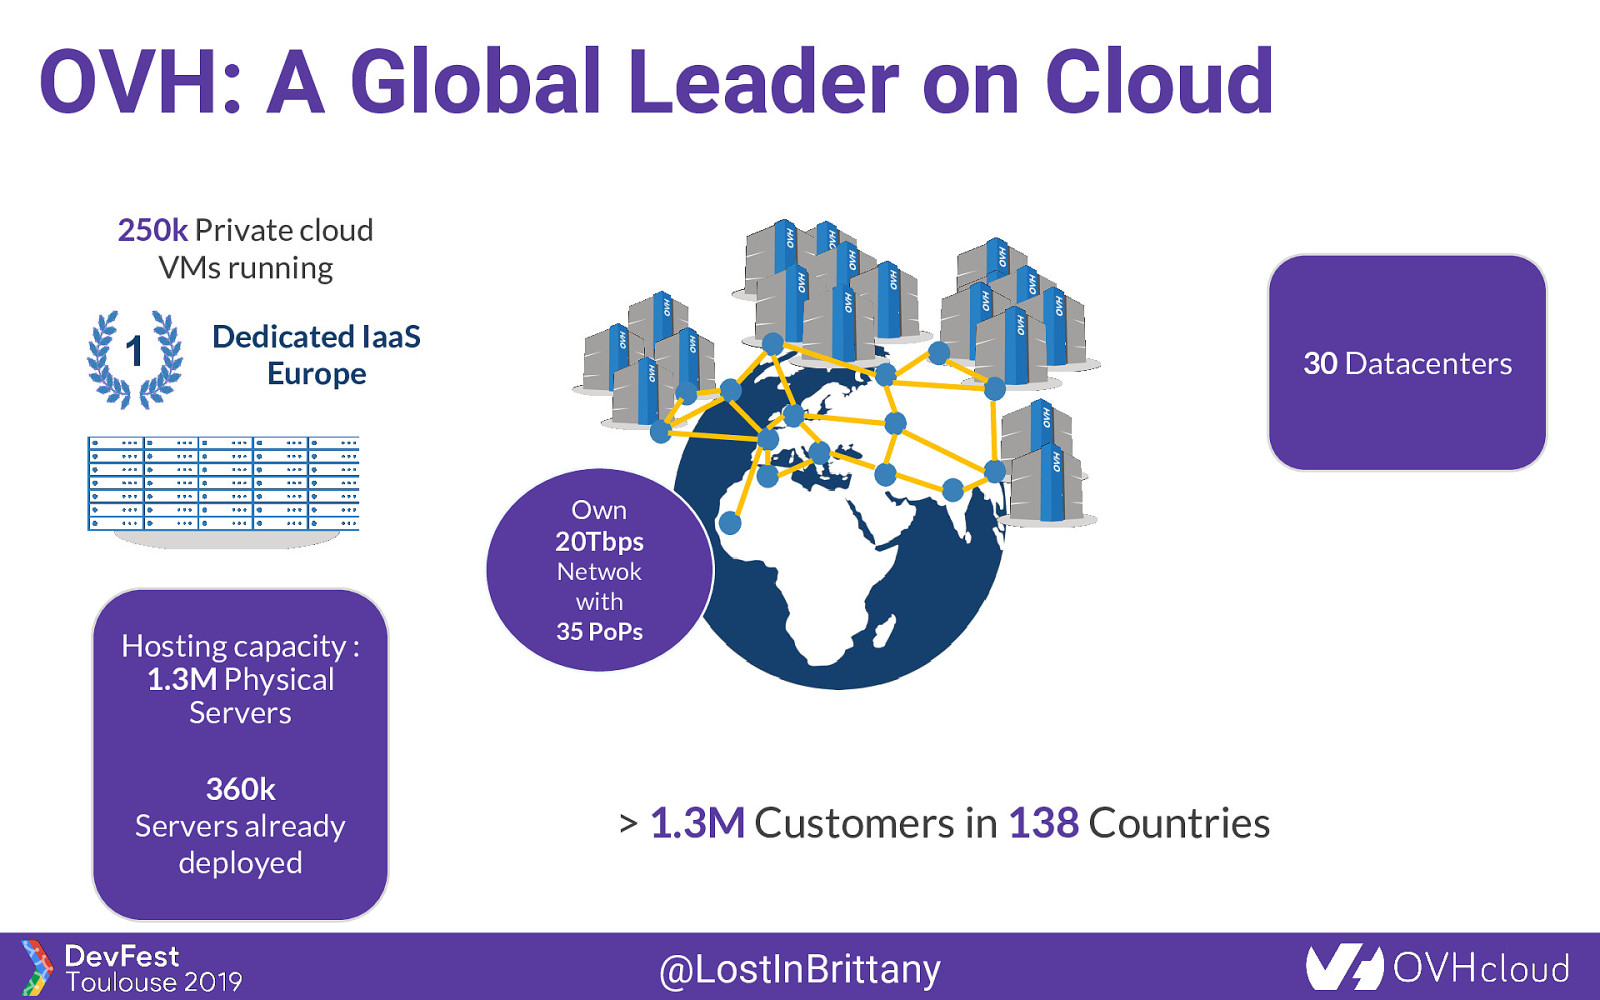
OVH: A Global Leader on Cloud 250k Private cloud VMs running 1 Dedicated IaaS Europe 30 Datacenters Own 20Tbps Hosting capacity : 1.3M Physical Servers 360k Servers already deployed Netwok with 35 PoPs
1.3M Customers in 138 Countries @LostInBrittany
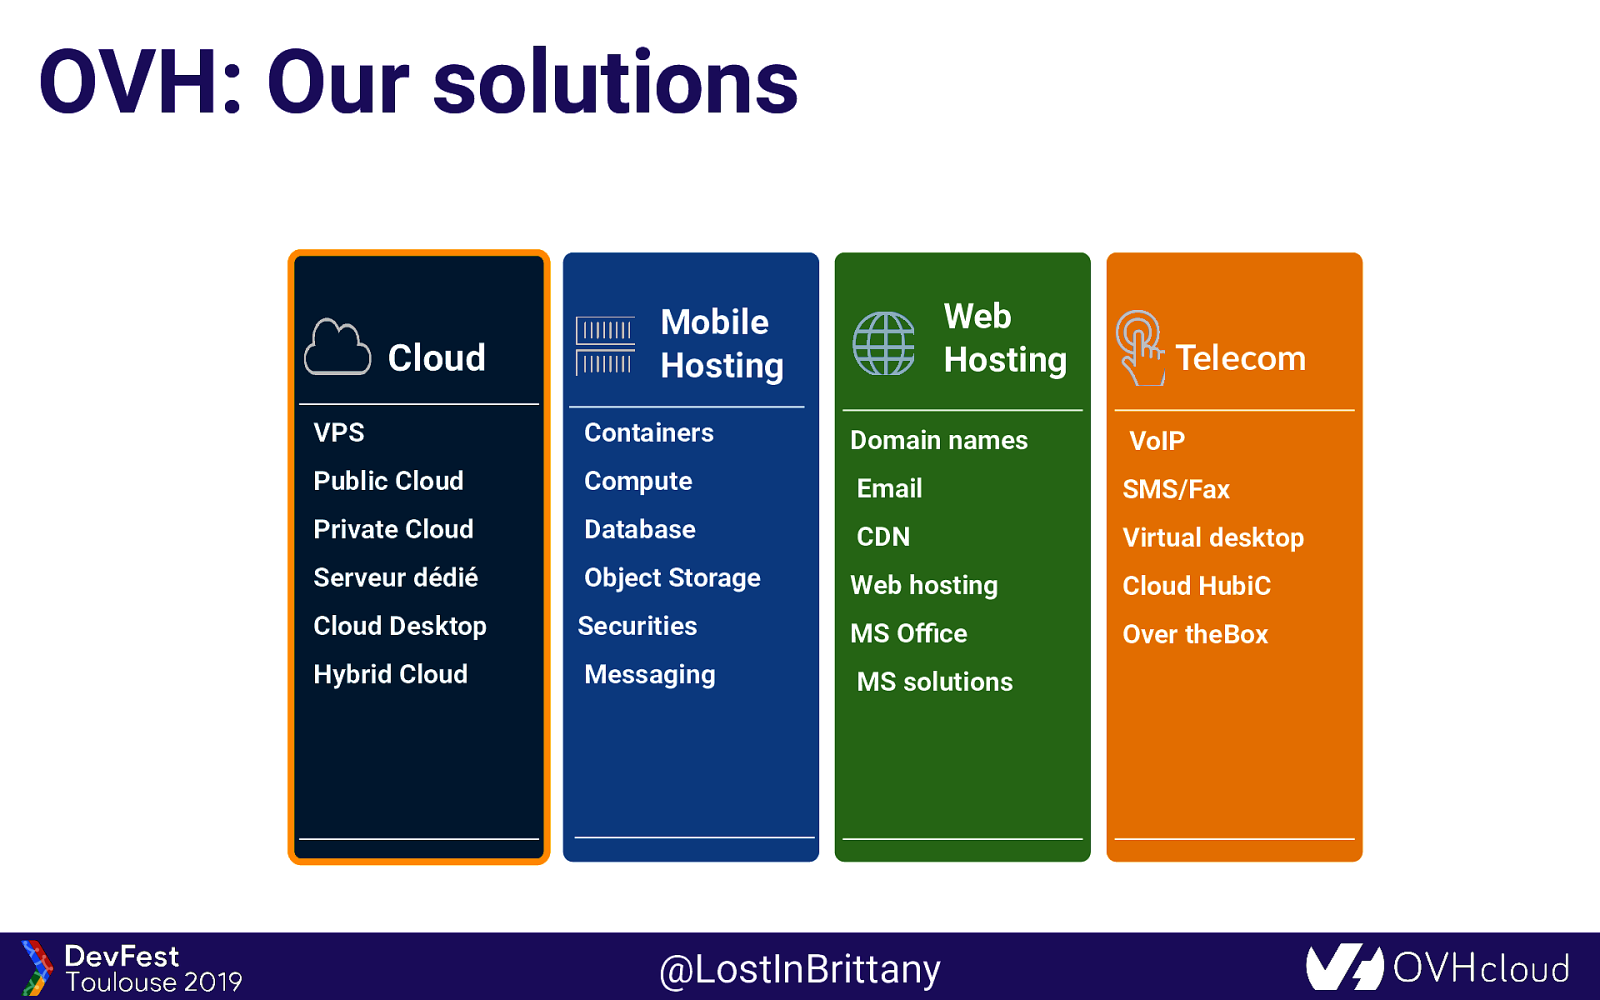
OVH: Our solutions Cloud Web Hosting Mobile Hosting Telecom VPS Containers ▪ Dedicated Server Domain names VoIP Public Cloud Compute ▪ Data Storage Email SMS/Fax Private Cloud ▪ Network and Database CDN Virtual desktop Serveur dédié Security Object Storage Web hosting Cloud HubiC Over theBox ▪ Licences Cloud Desktop Securities MS Office Hybrid Cloud Messaging MS solutions @LostInBrittany
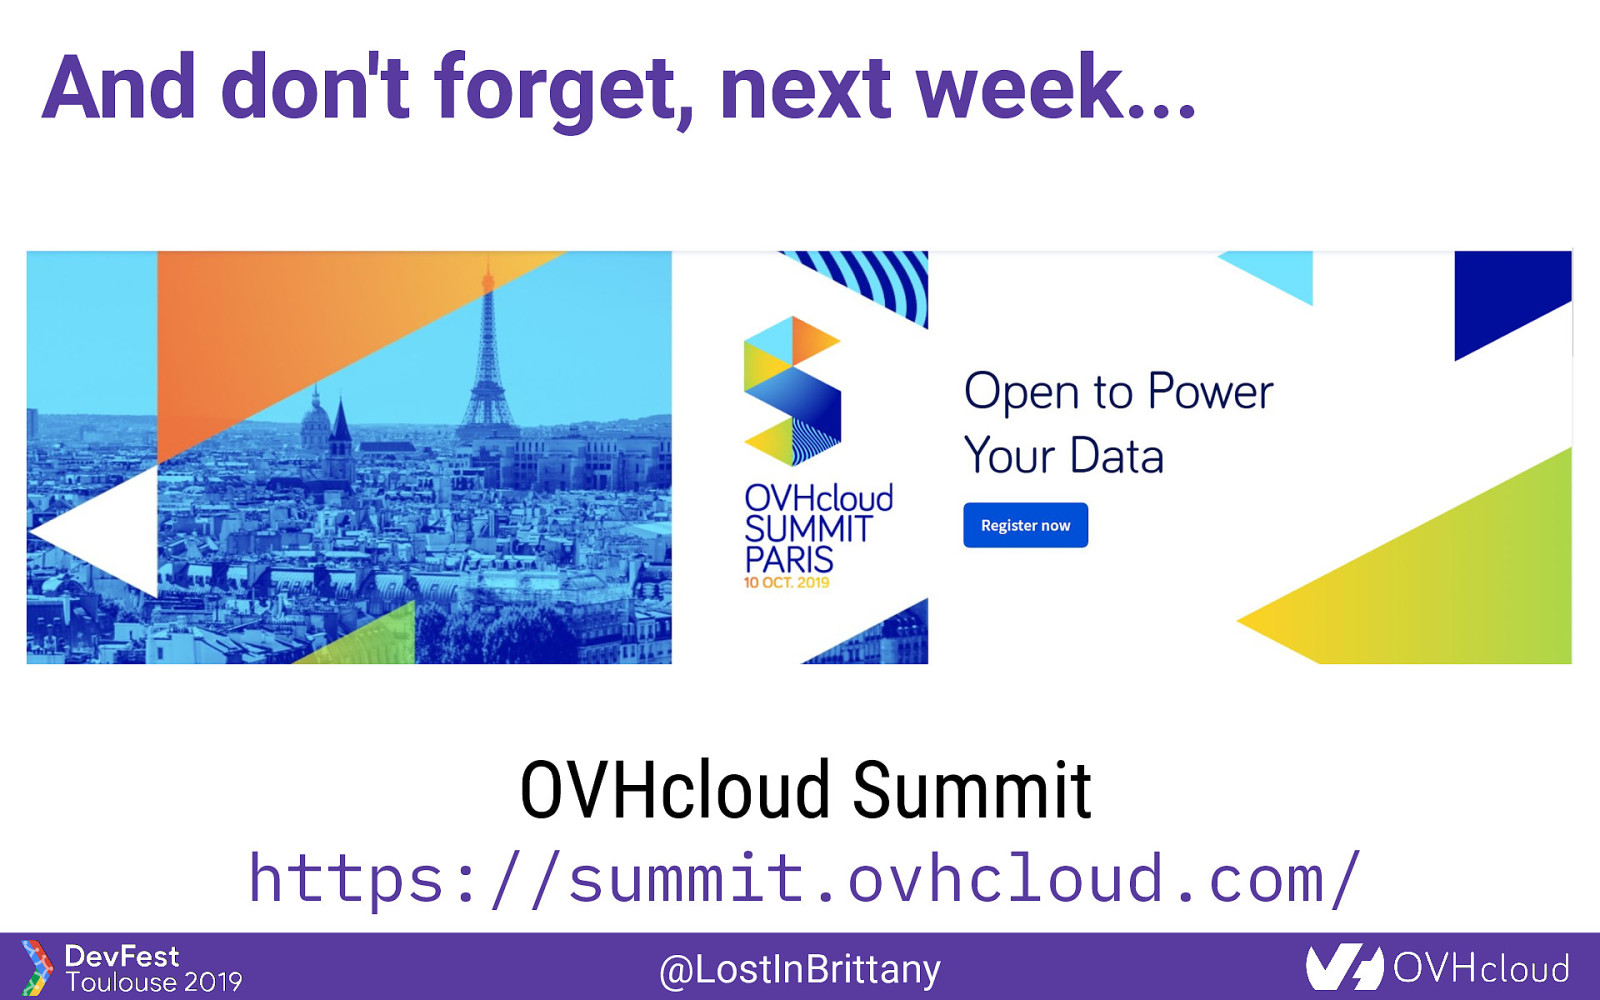
And don’t forget, next week… OVHcloud Summit https://summit.ovhcloud.com/ @LostInBrittany
Once upon a time… Because I love telling tales @LostInBrittany
This talk is about a tale… A true one nevertheless @LostInBrittany
And as in most tales It begins with a mission @LostInBrittany
And a band of heroes Engulfed into the adventure @LostInBrittany
They fight against mishaps And all kind of foes @LostInBrittany
They build mighty fortresses Pushing the limits of possible @LostInBrittany
And defend them day after day Against all odds @LostInBrittany
But we don’t know yet the end Because this tale isn’t finished yet @LostInBrittany
It begins with a mission Build a metrics platform for OVH @LostInBrittany
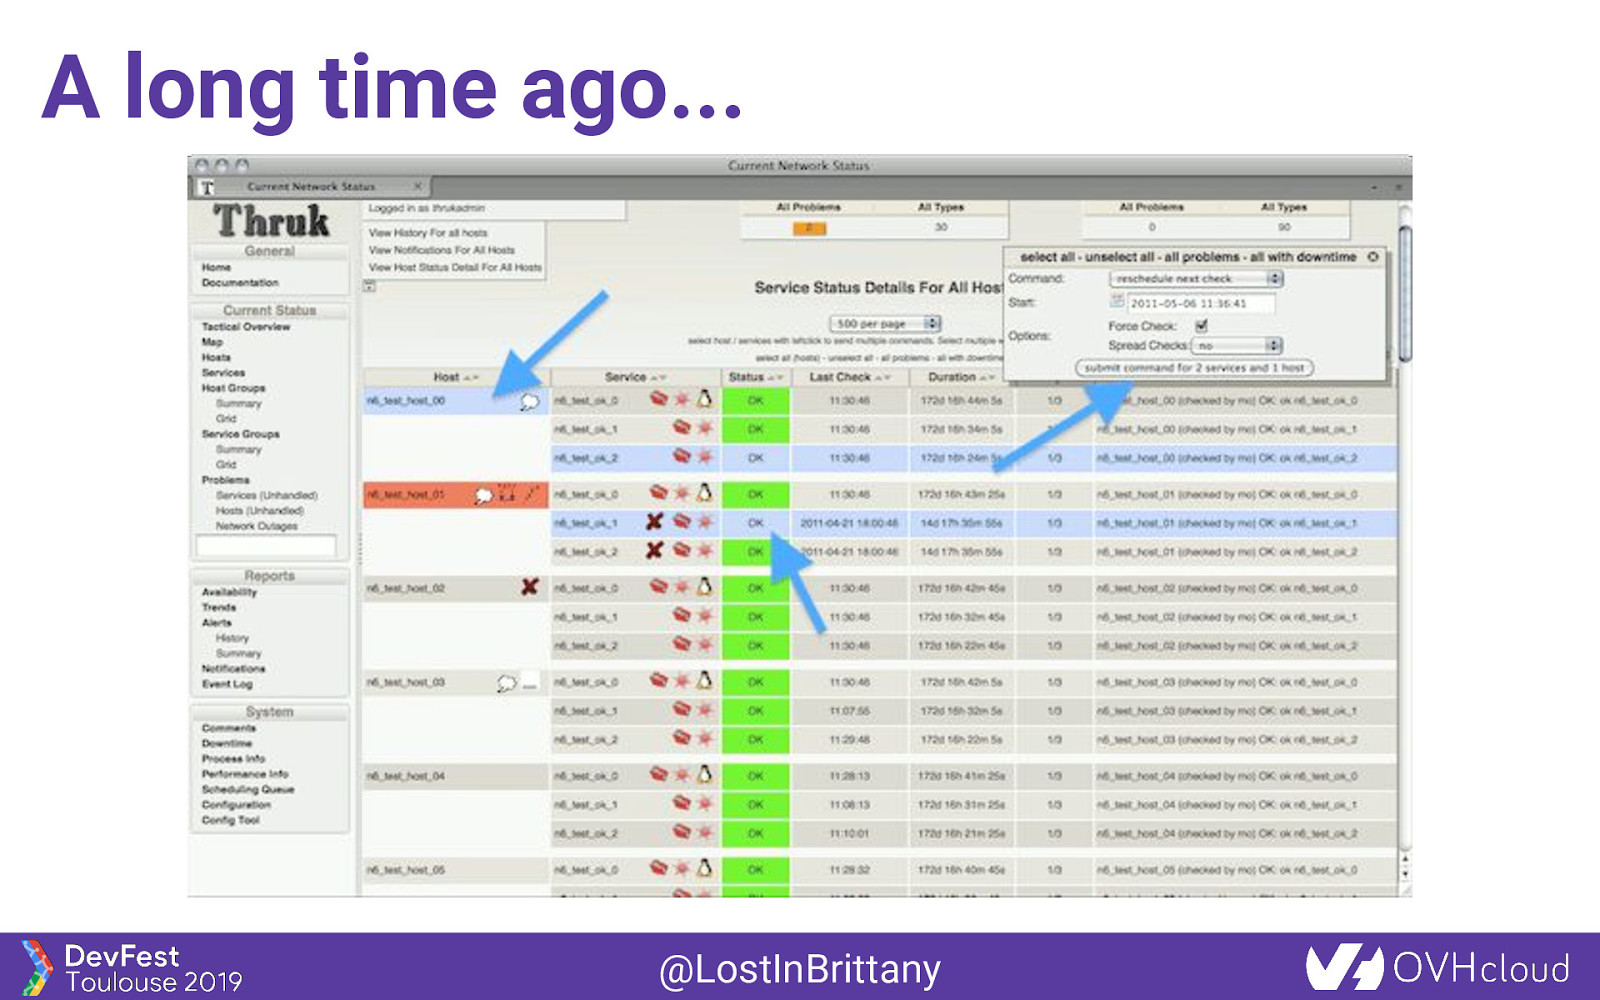
A long time ago… @LostInBrittany
A long time ago… Monitoring: Does the system works? @LostInBrittany
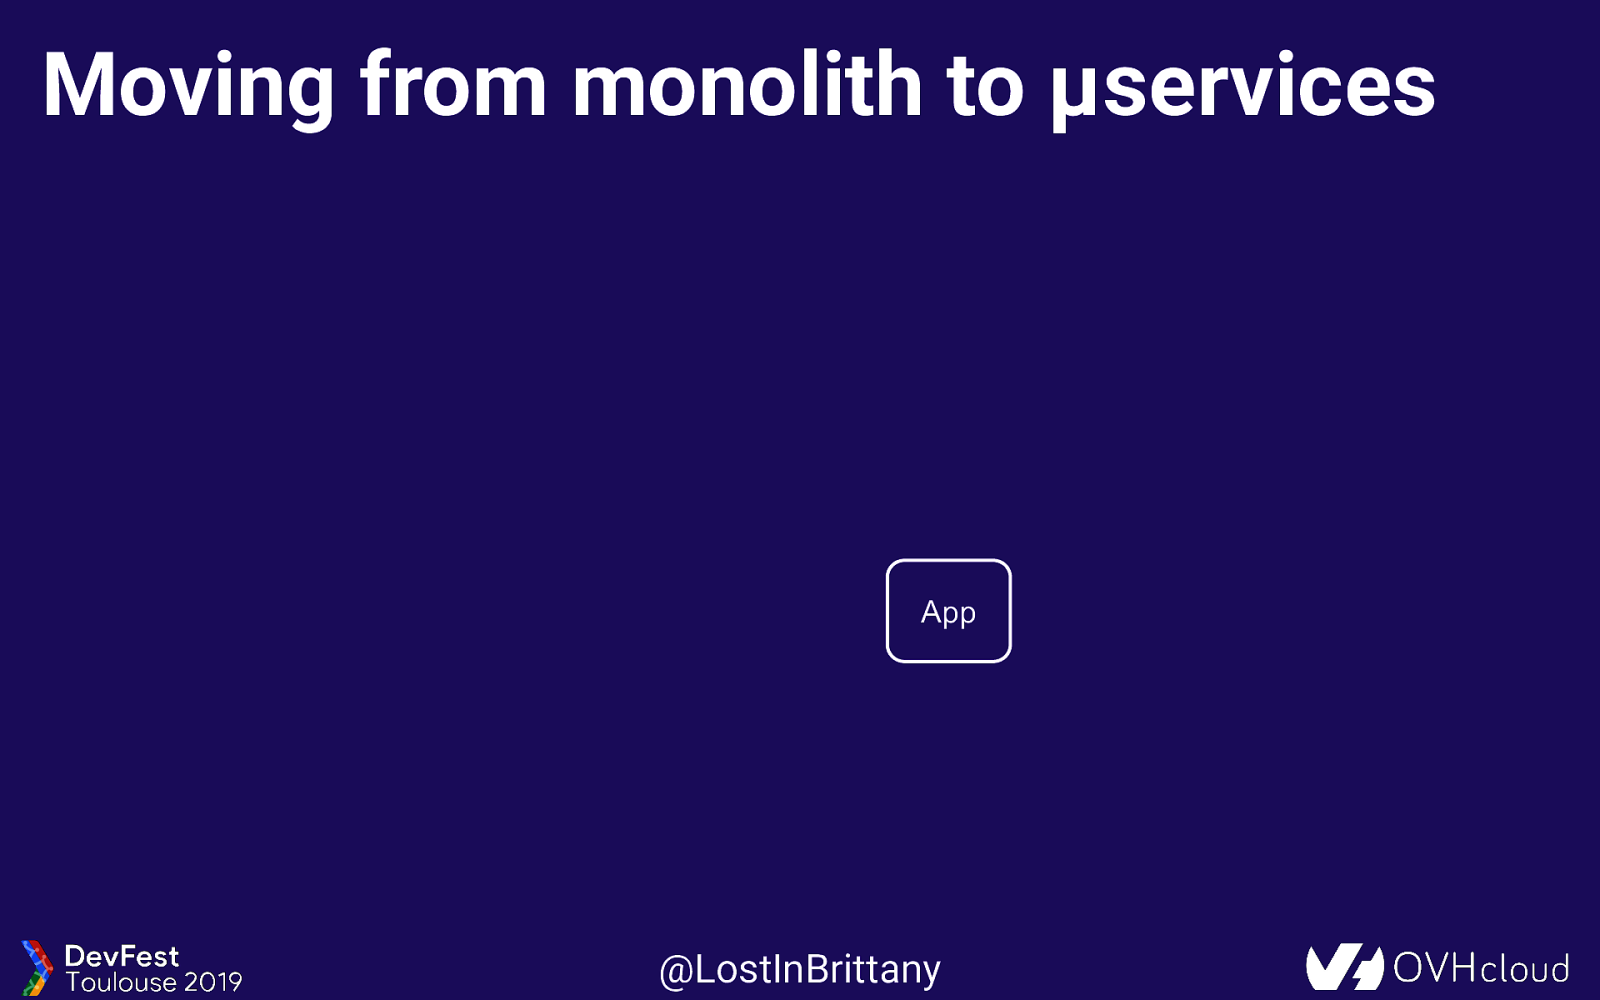
Moving from monolith to μservices App @LostInBrittany
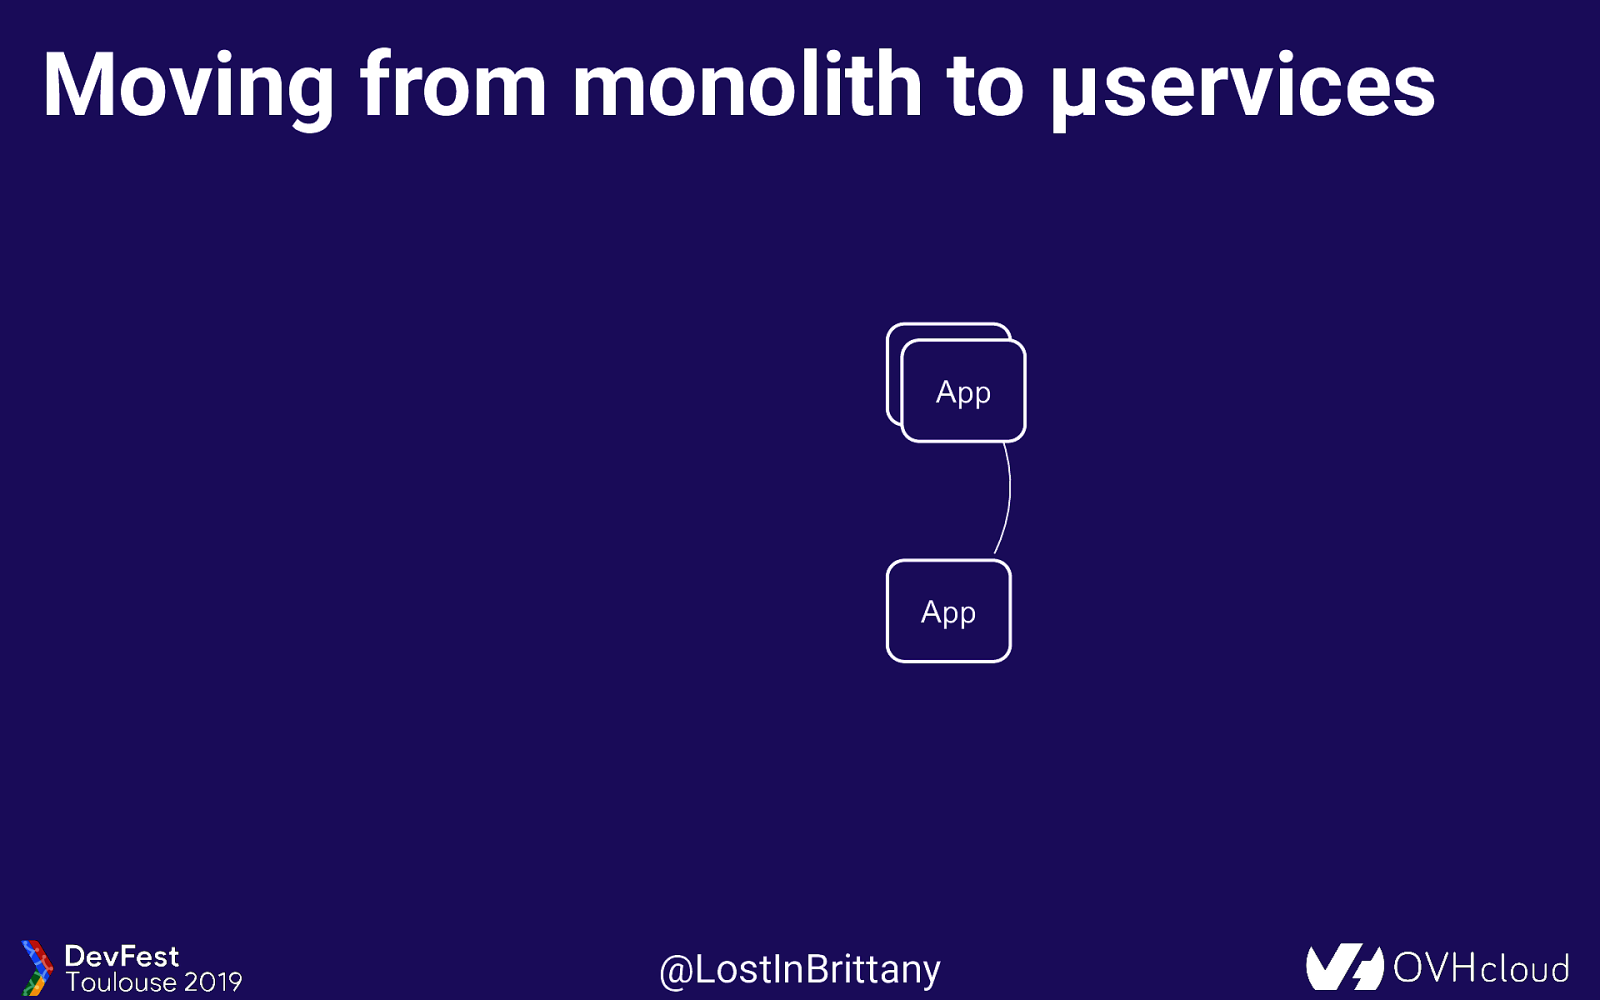
Moving from monolith to μservices App App App @LostInBrittany
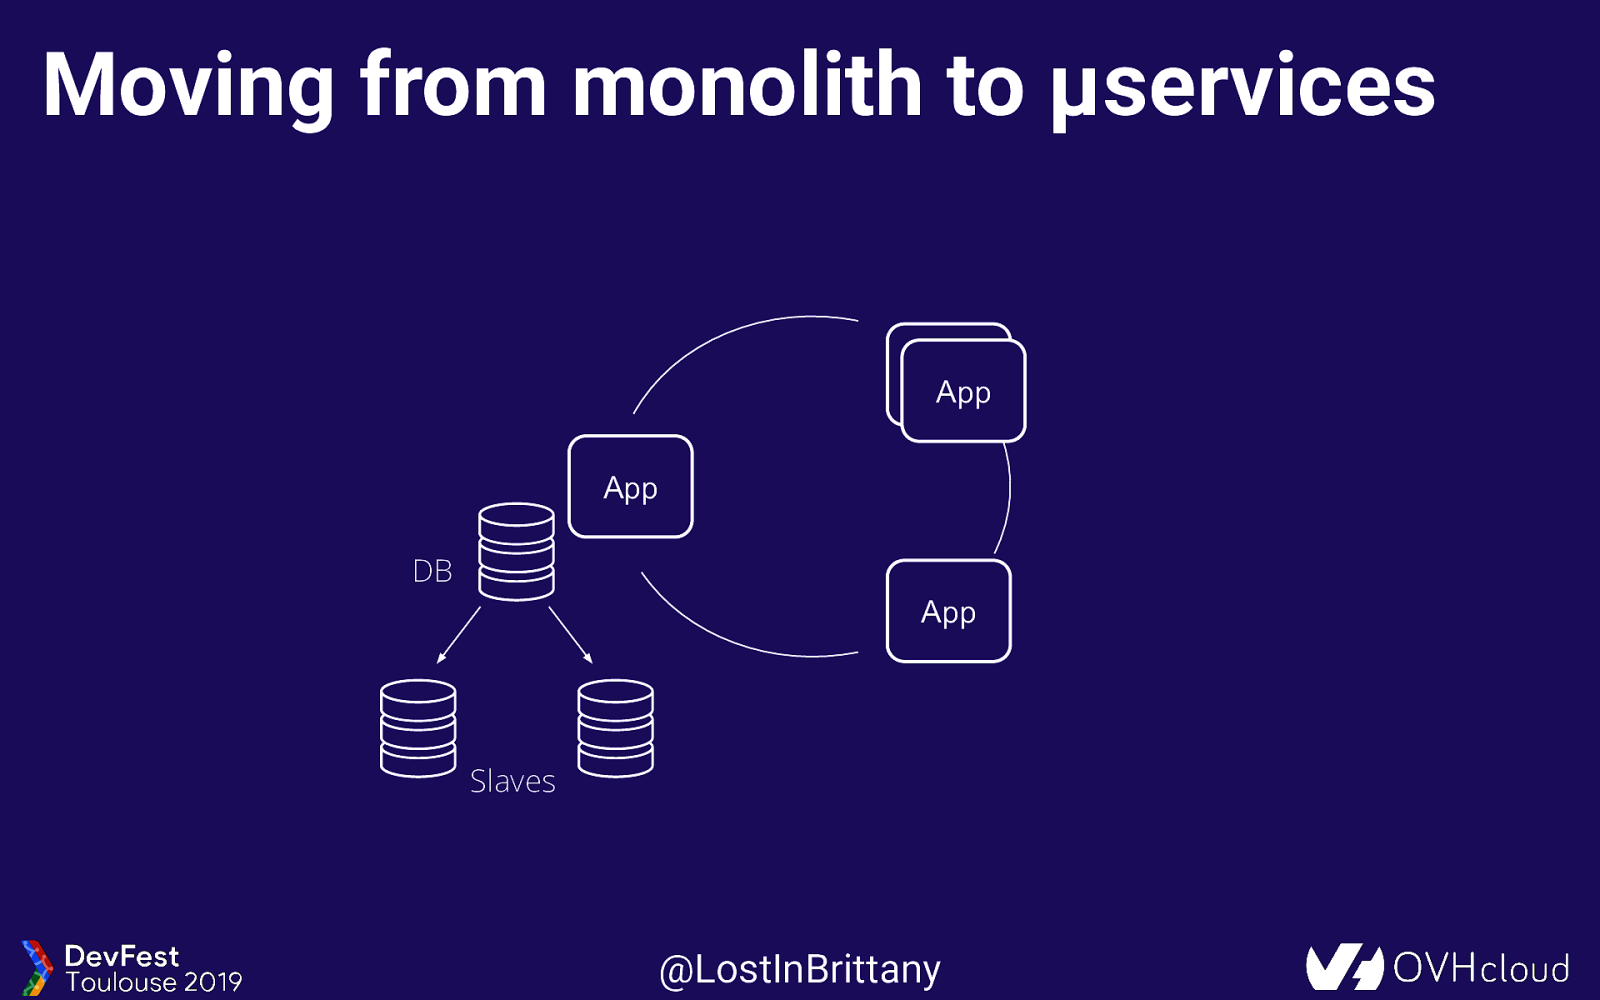
Moving from monolith to μservices App App App DB App Slaves @LostInBrittany
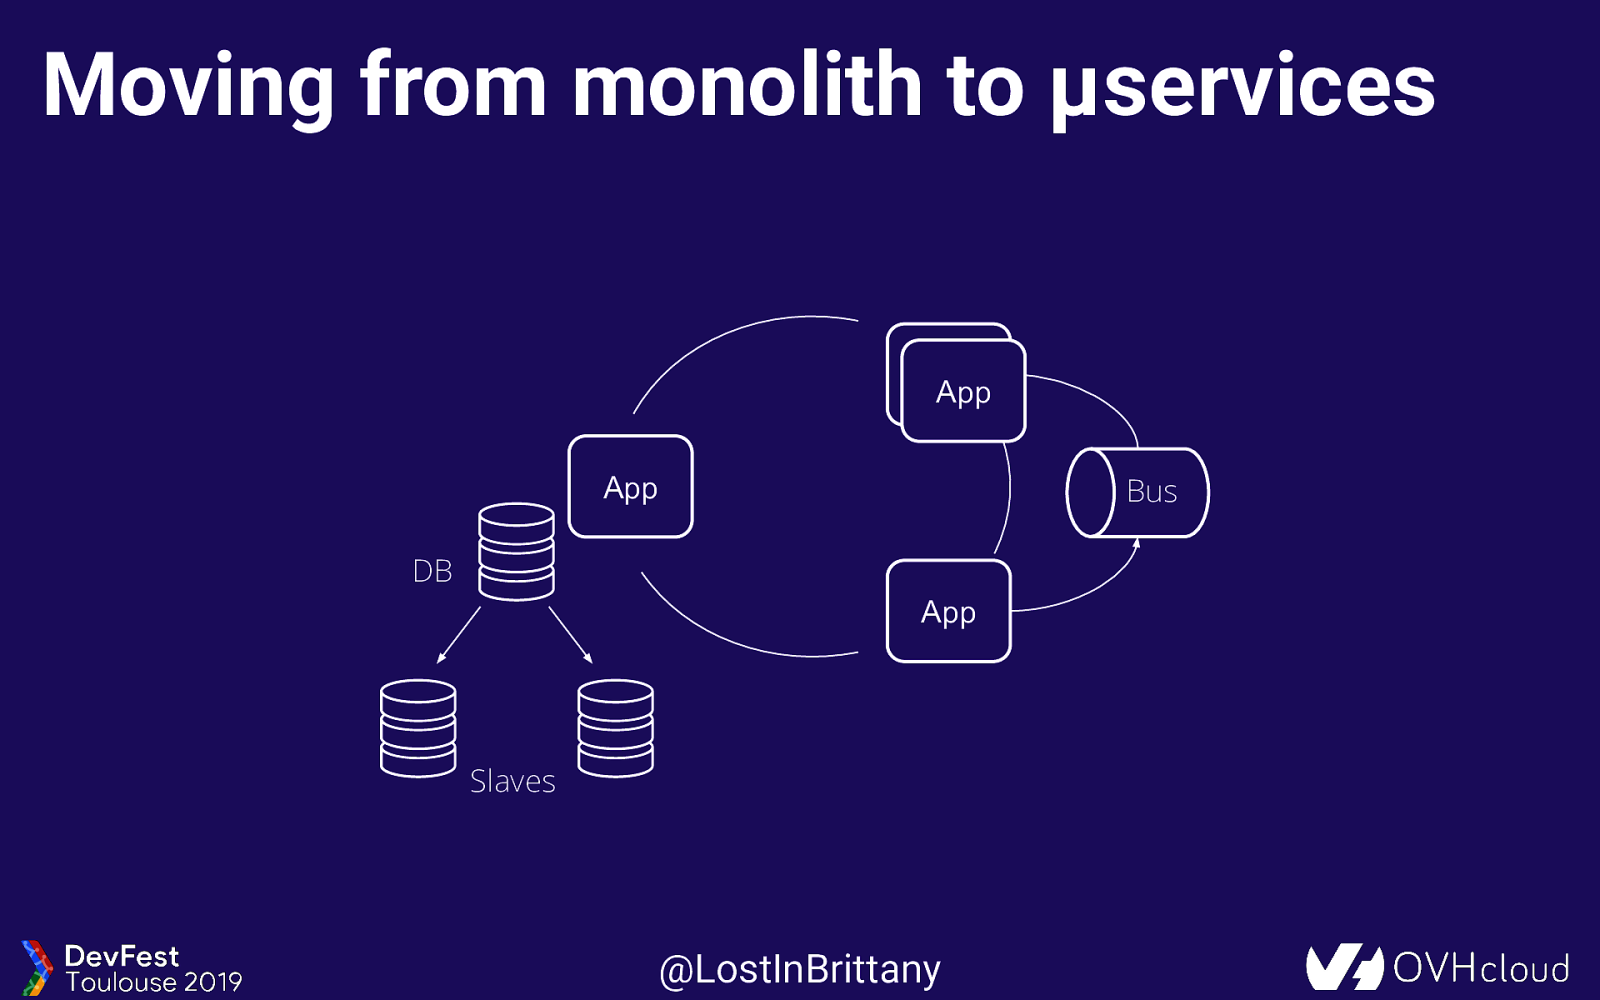
Moving from monolith to μservices App App App Bus DB App Slaves @LostInBrittany
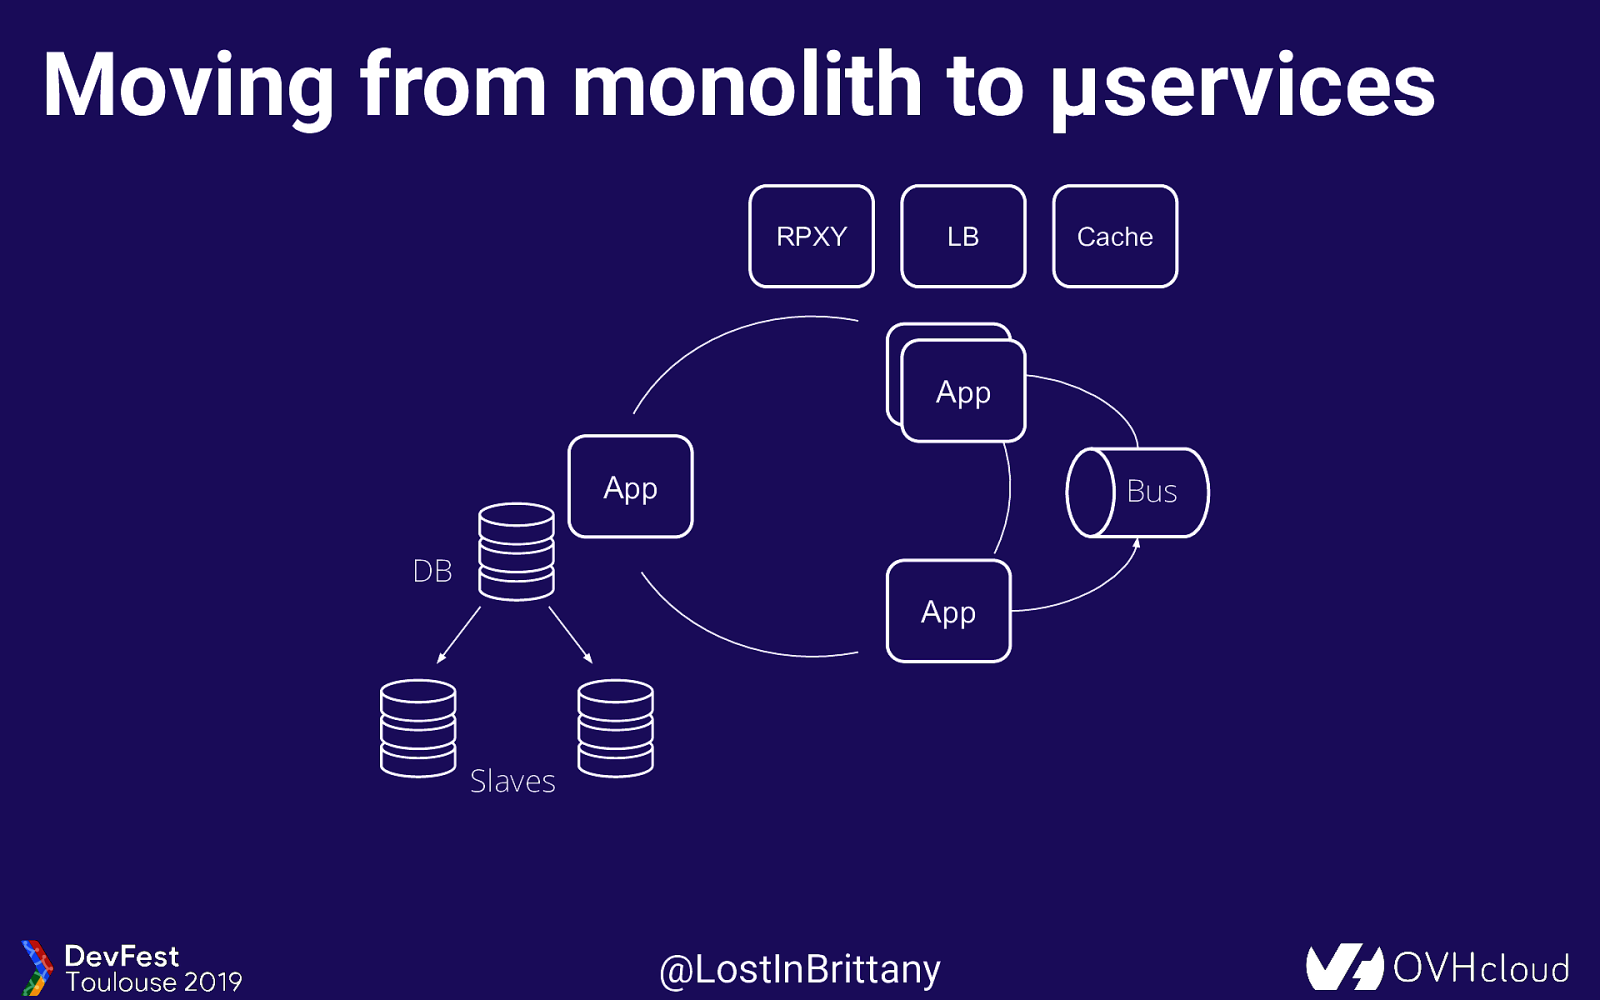
Moving from monolith to μservices RPXY LB Cache App App App Bus DB App Slaves @LostInBrittany
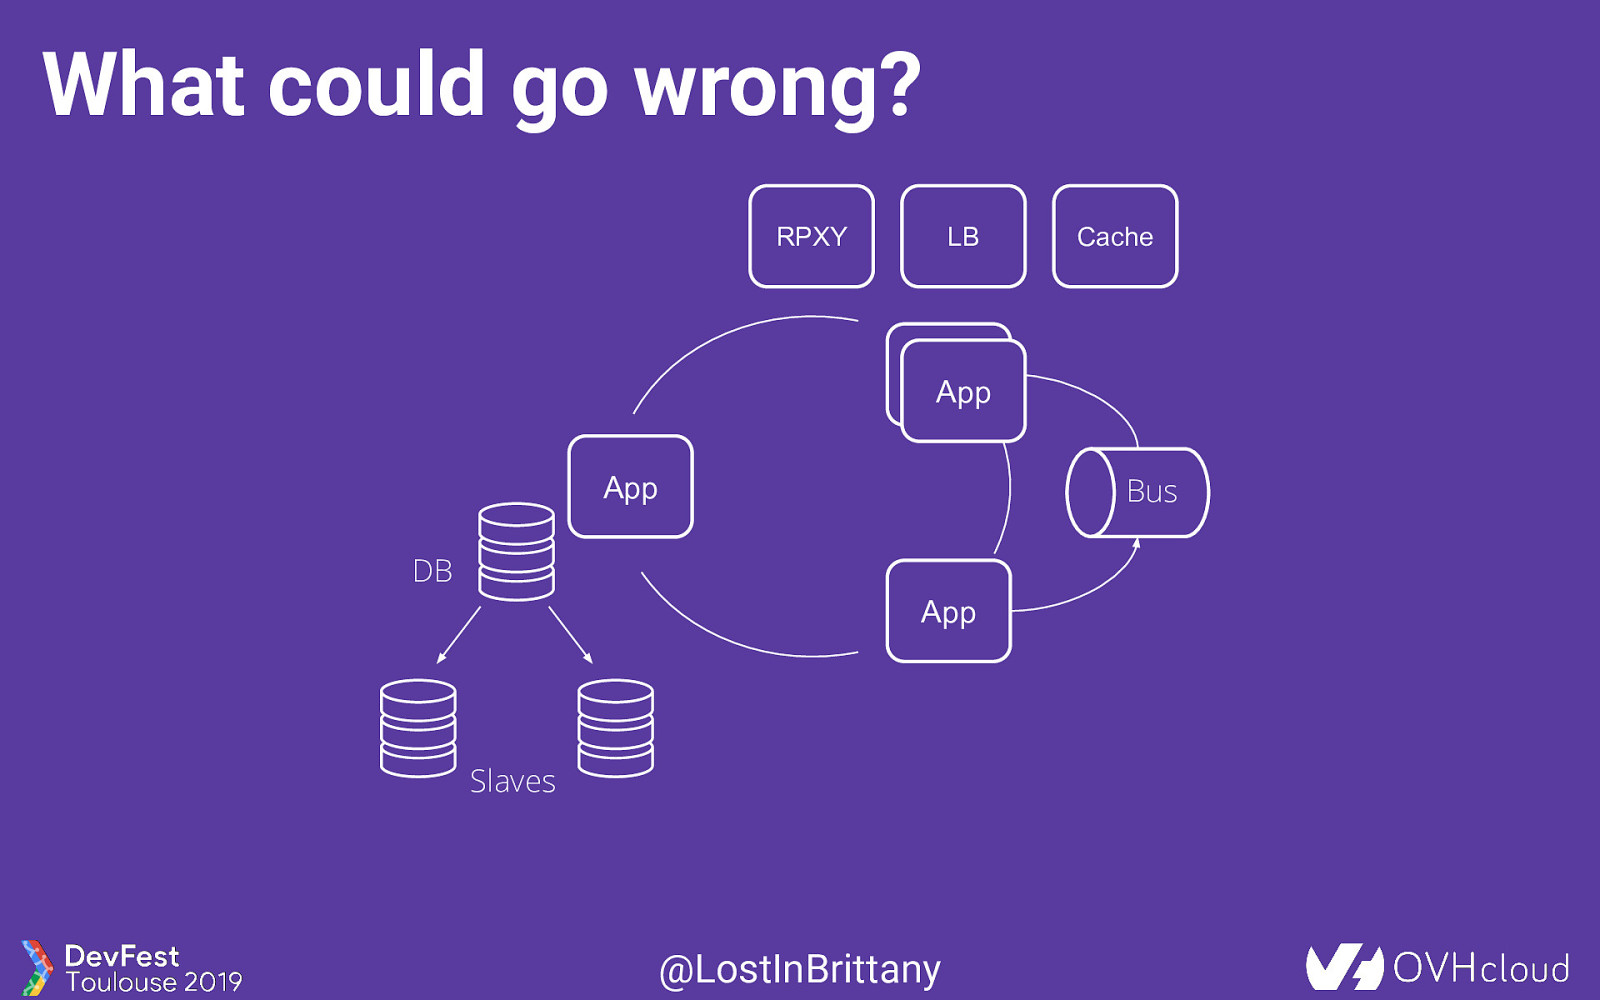
What could go wrong? RPXY LB Cache App App App Bus DB App Slaves @LostInBrittany
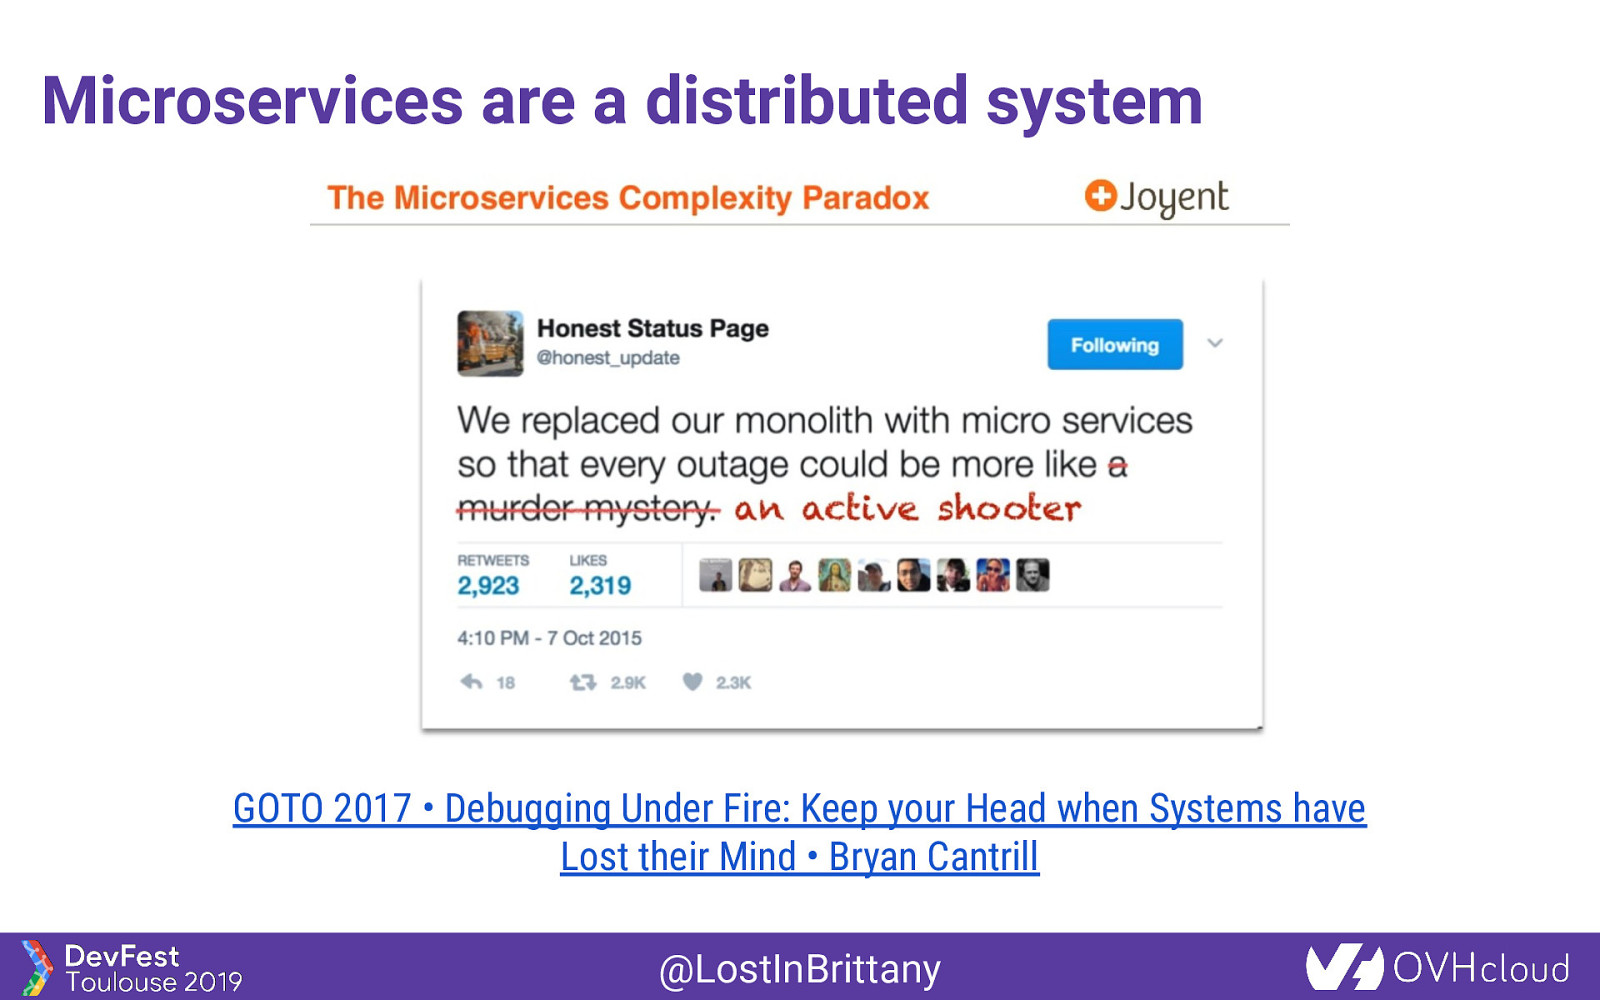
Microservices are a distributed system GOTO 2017 • Debugging Under Fire: Keep your Head when Systems have Lost their Mind • Bryan Cantrill @LostInBrittany
We need to have insights Observability: How the system works? @LostInBrittany
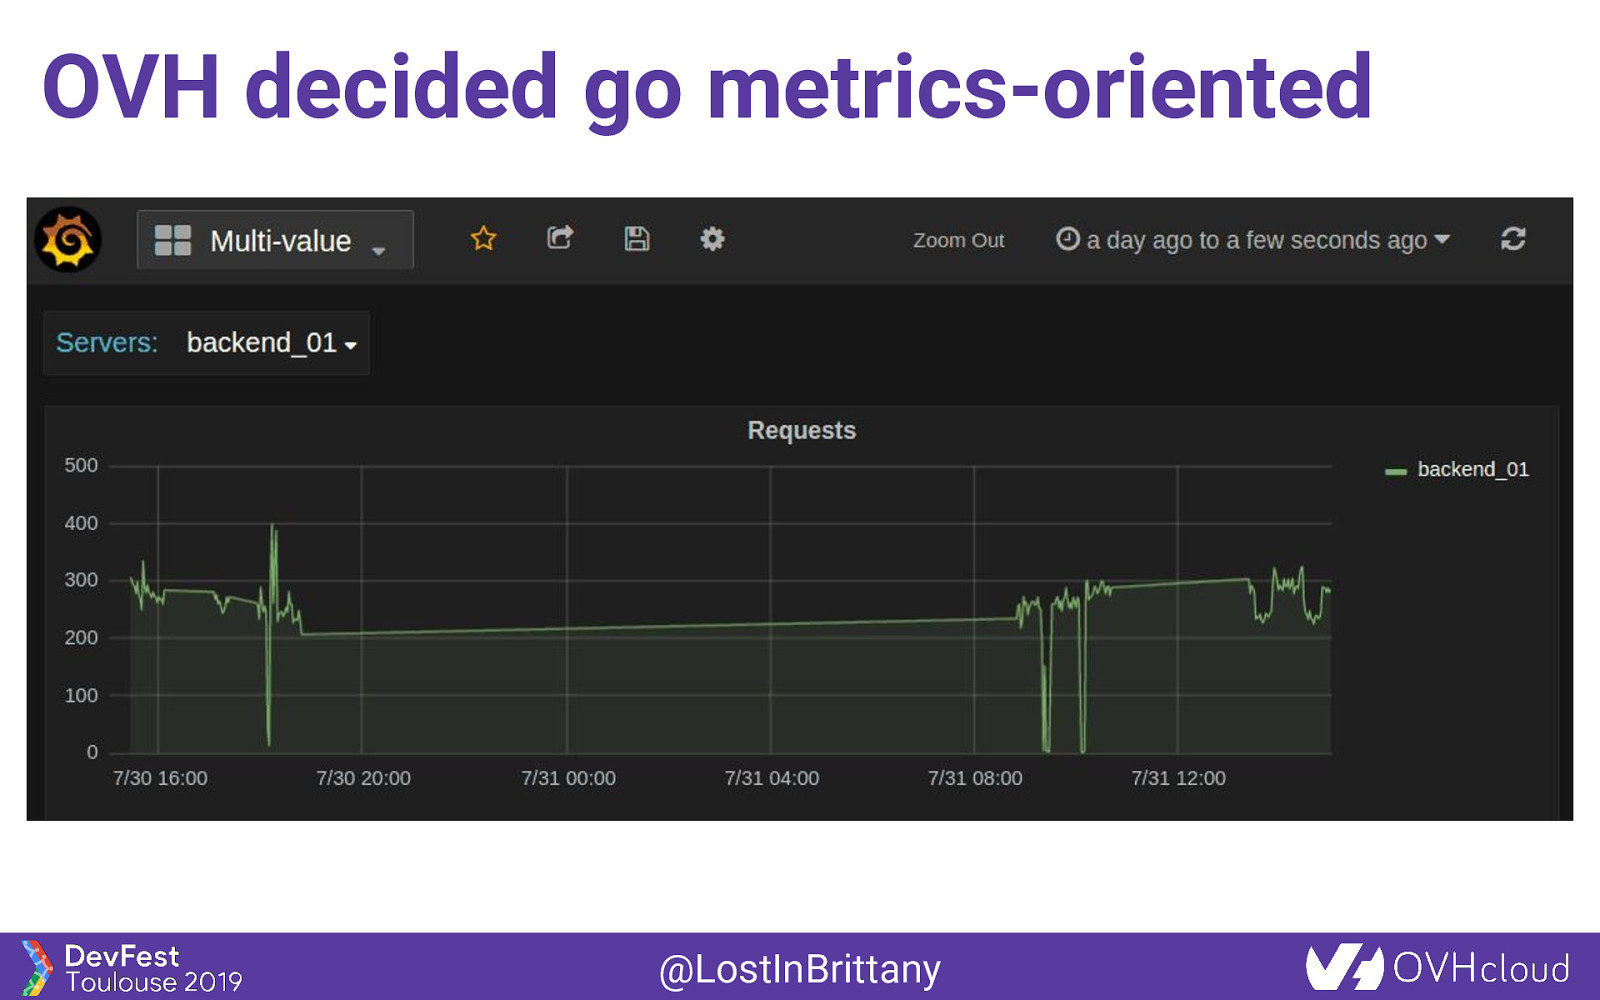
OVH decided go metrics-oriented @LostInBrittany
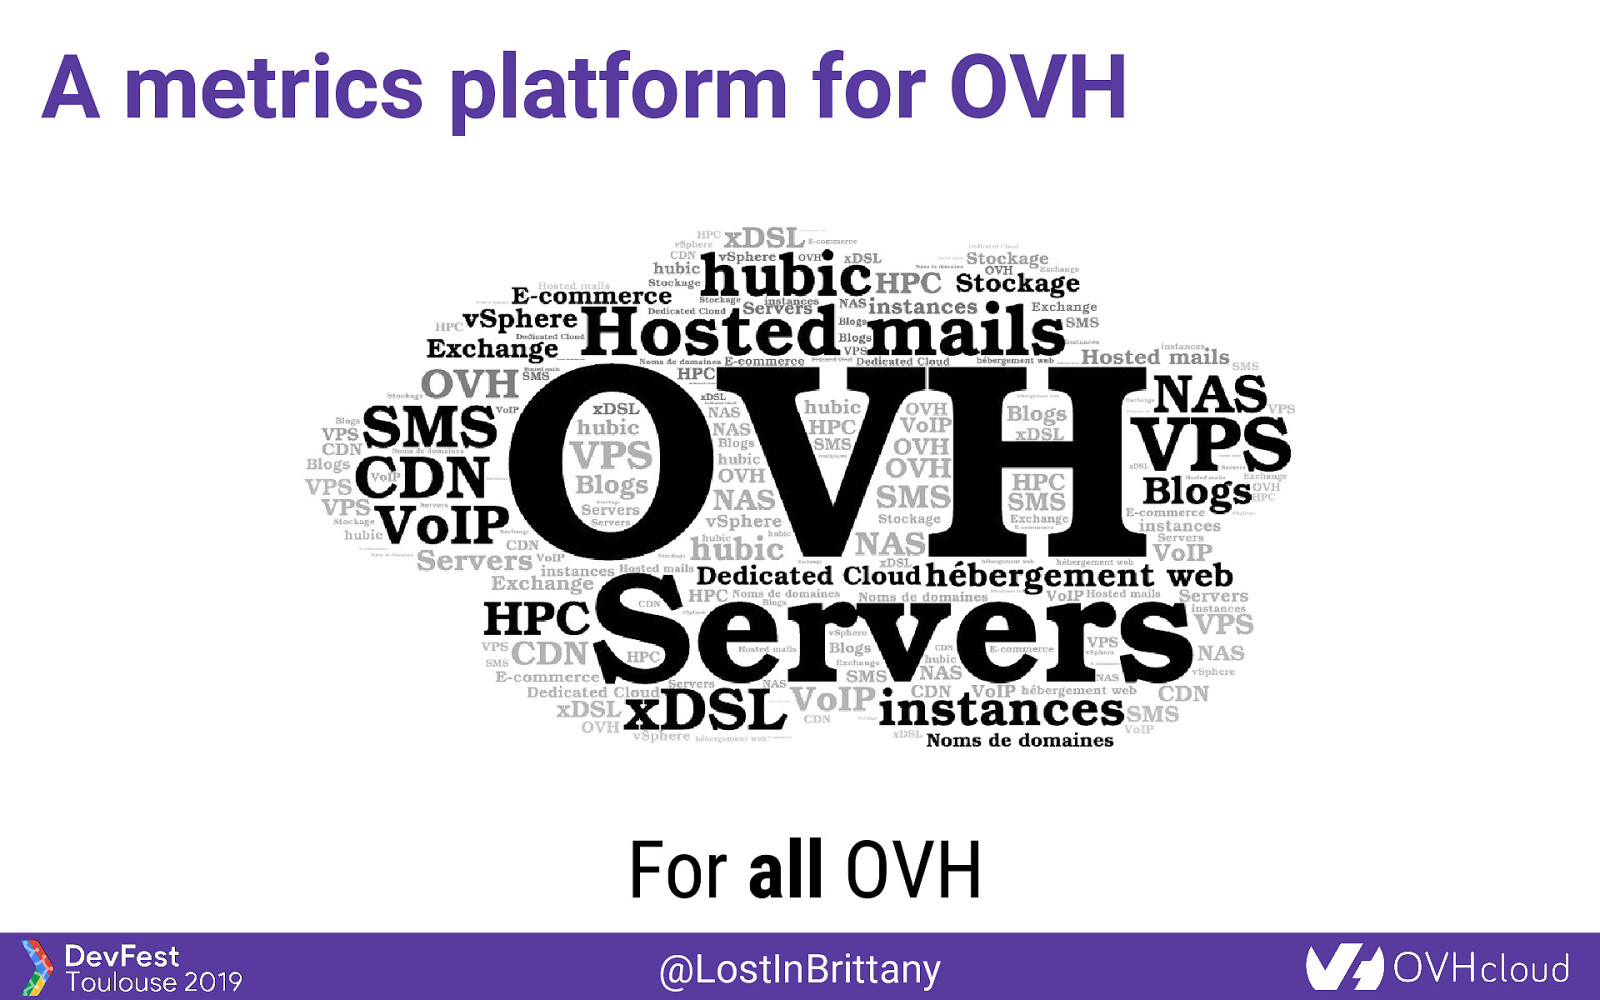
A metrics platform for OVH For all OVH @LostInBrittany
Building OVH Metrics One Platform to unify them all, One Platform to find them, One Platform to bring them all and in the Metrics monitor them @LostInBrittany
What is OVH Metrics? Managed Cloud Platform for Time Series @LostInBrittany
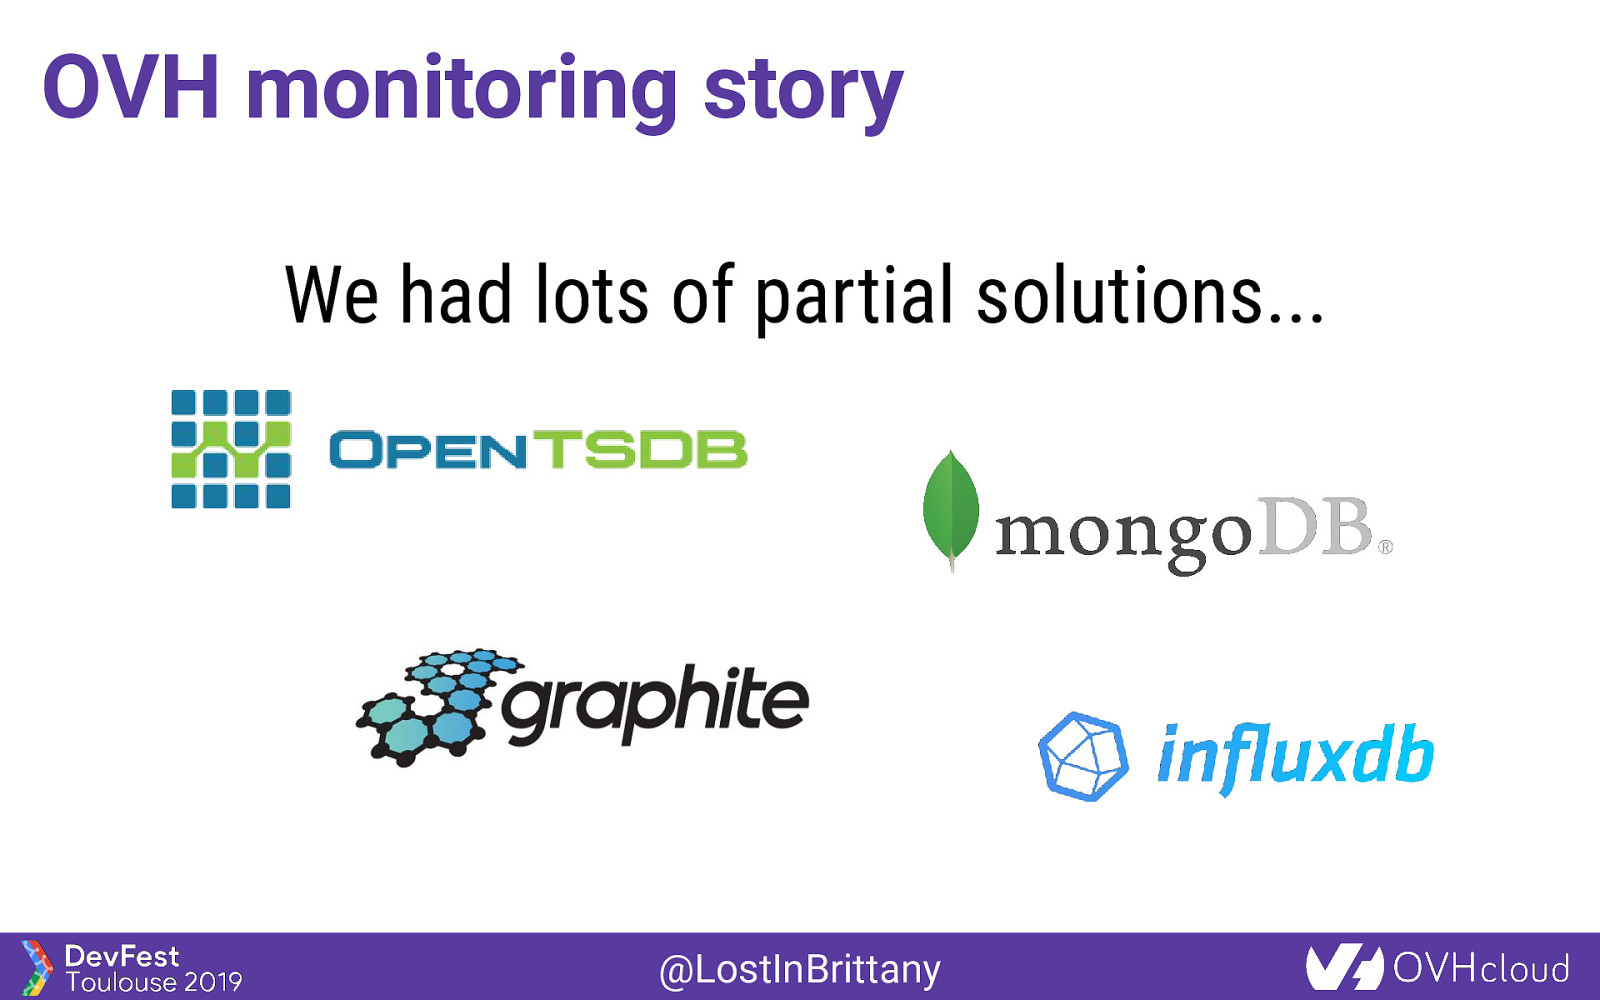
OVH monitoring story We had lots of partial solutions… @LostInBrittany
OVH monitoring story One Platform to unify them all What should we build it on? @LostInBrittany
OVH monitoring story Including a really big @LostInBrittany
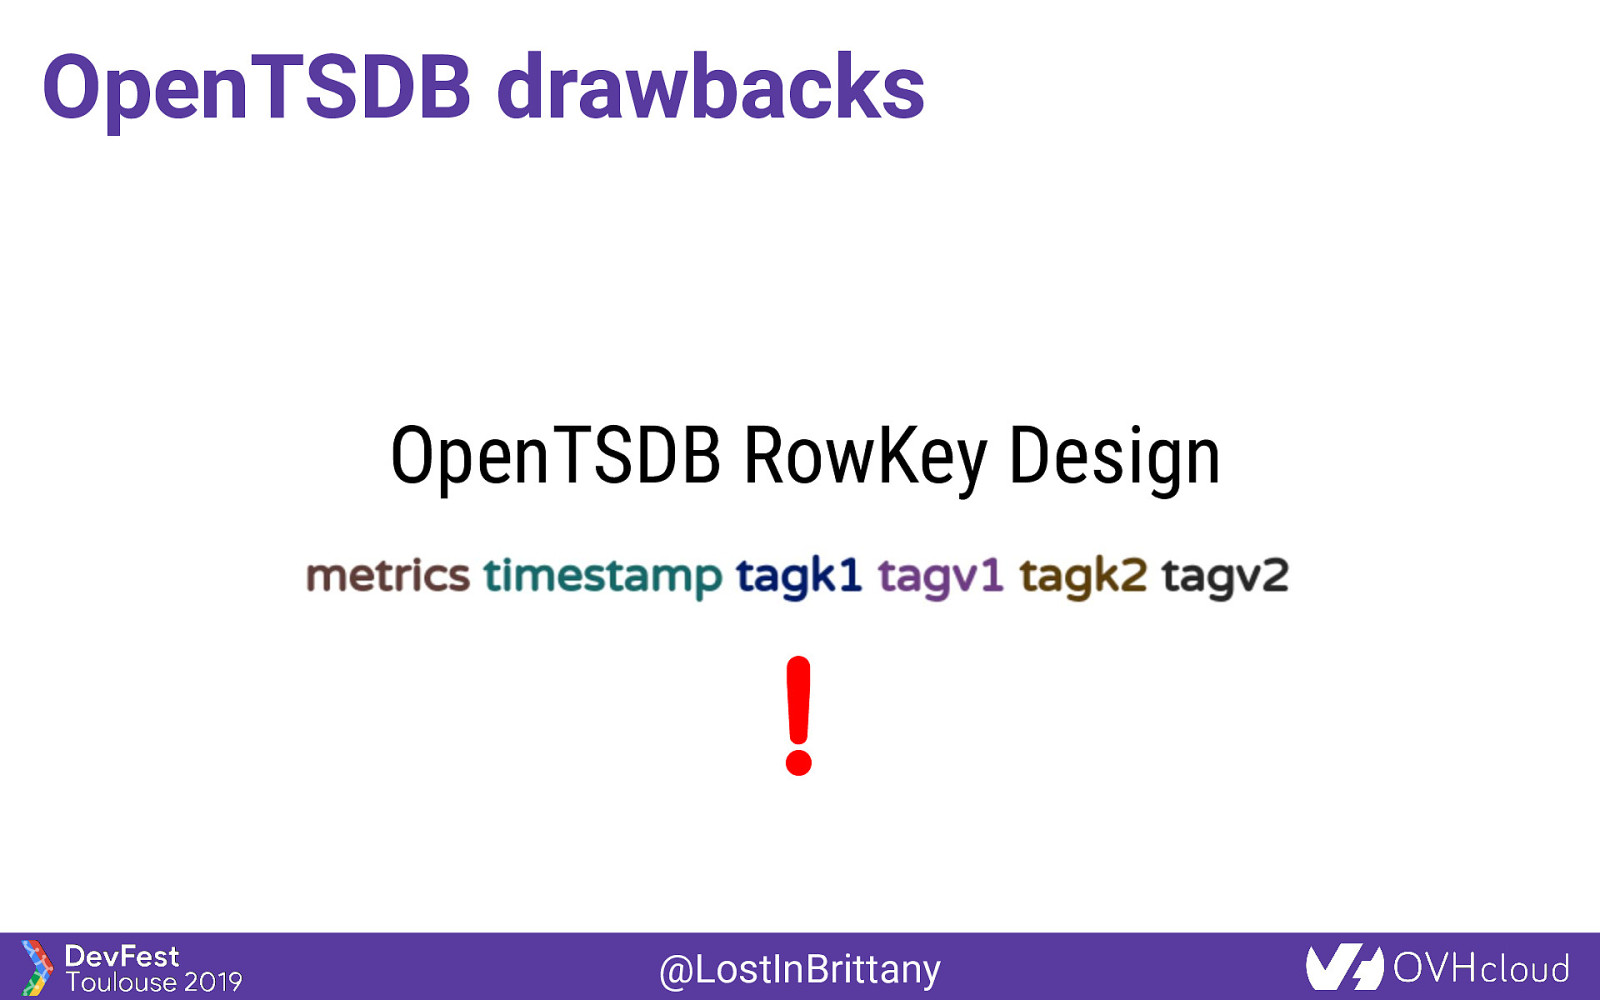
OpenTSDB drawbacks OpenTSDB RowKey Design ! @LostInBrittany
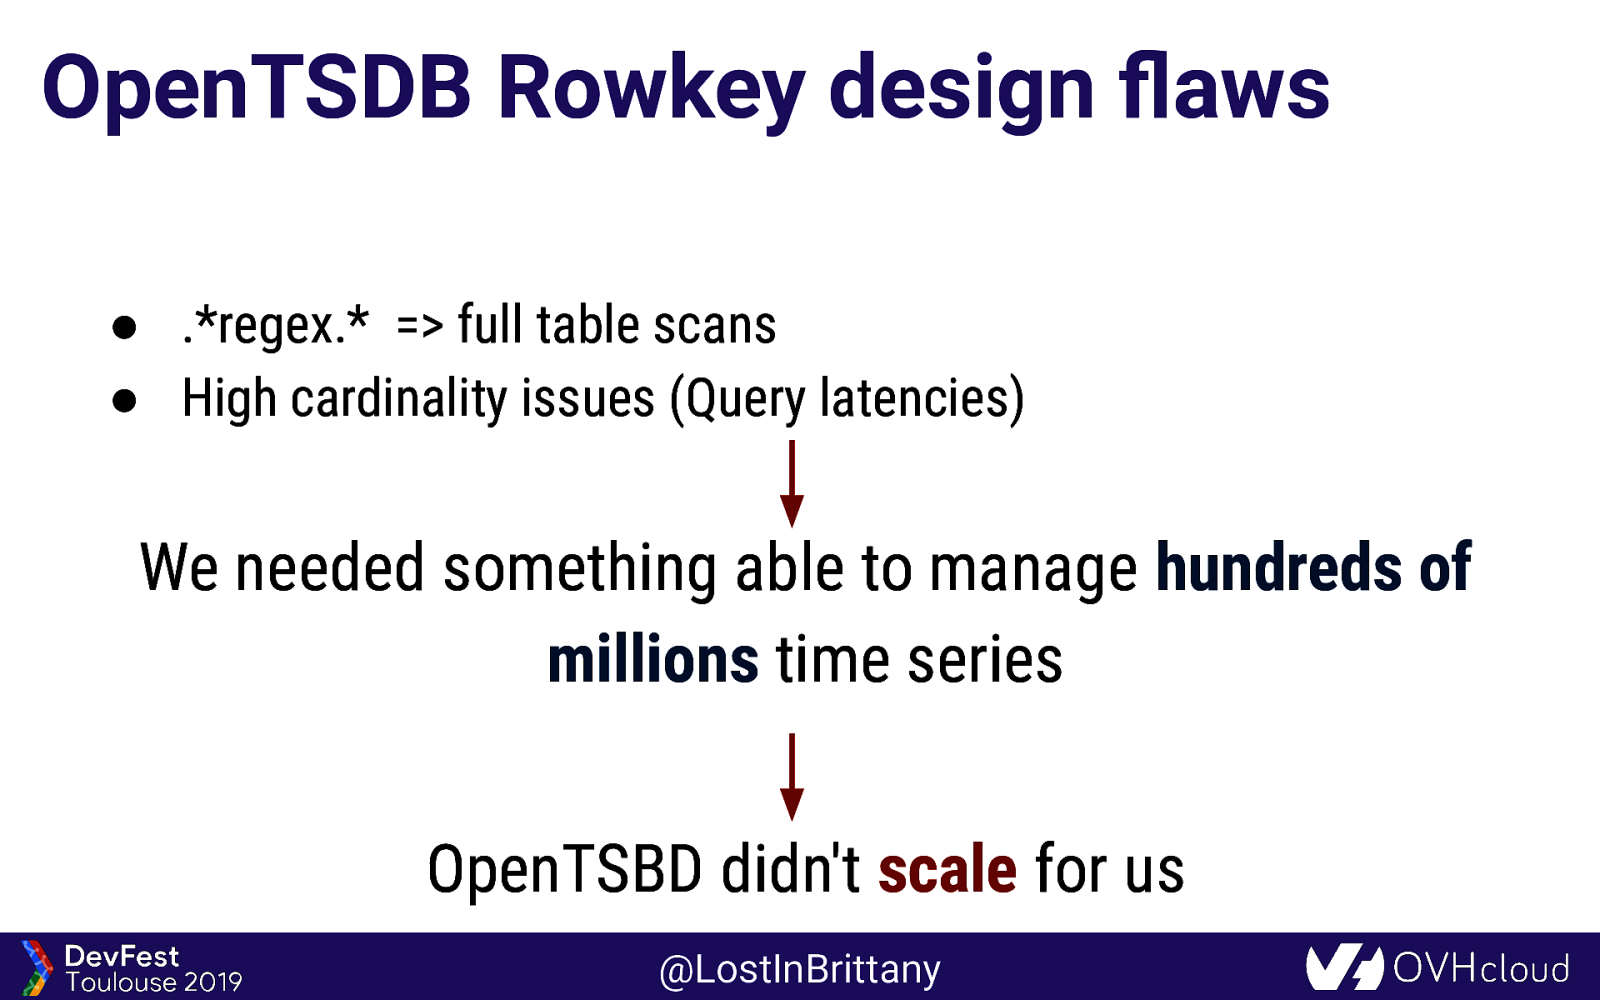
OpenTSDB Rowkey design flaws ● .regex. => full table scans ● High cardinality issues (Query latencies) We needed something able to manage hundreds of millions time series OpenTSBD didn’t scale for us @LostInBrittany
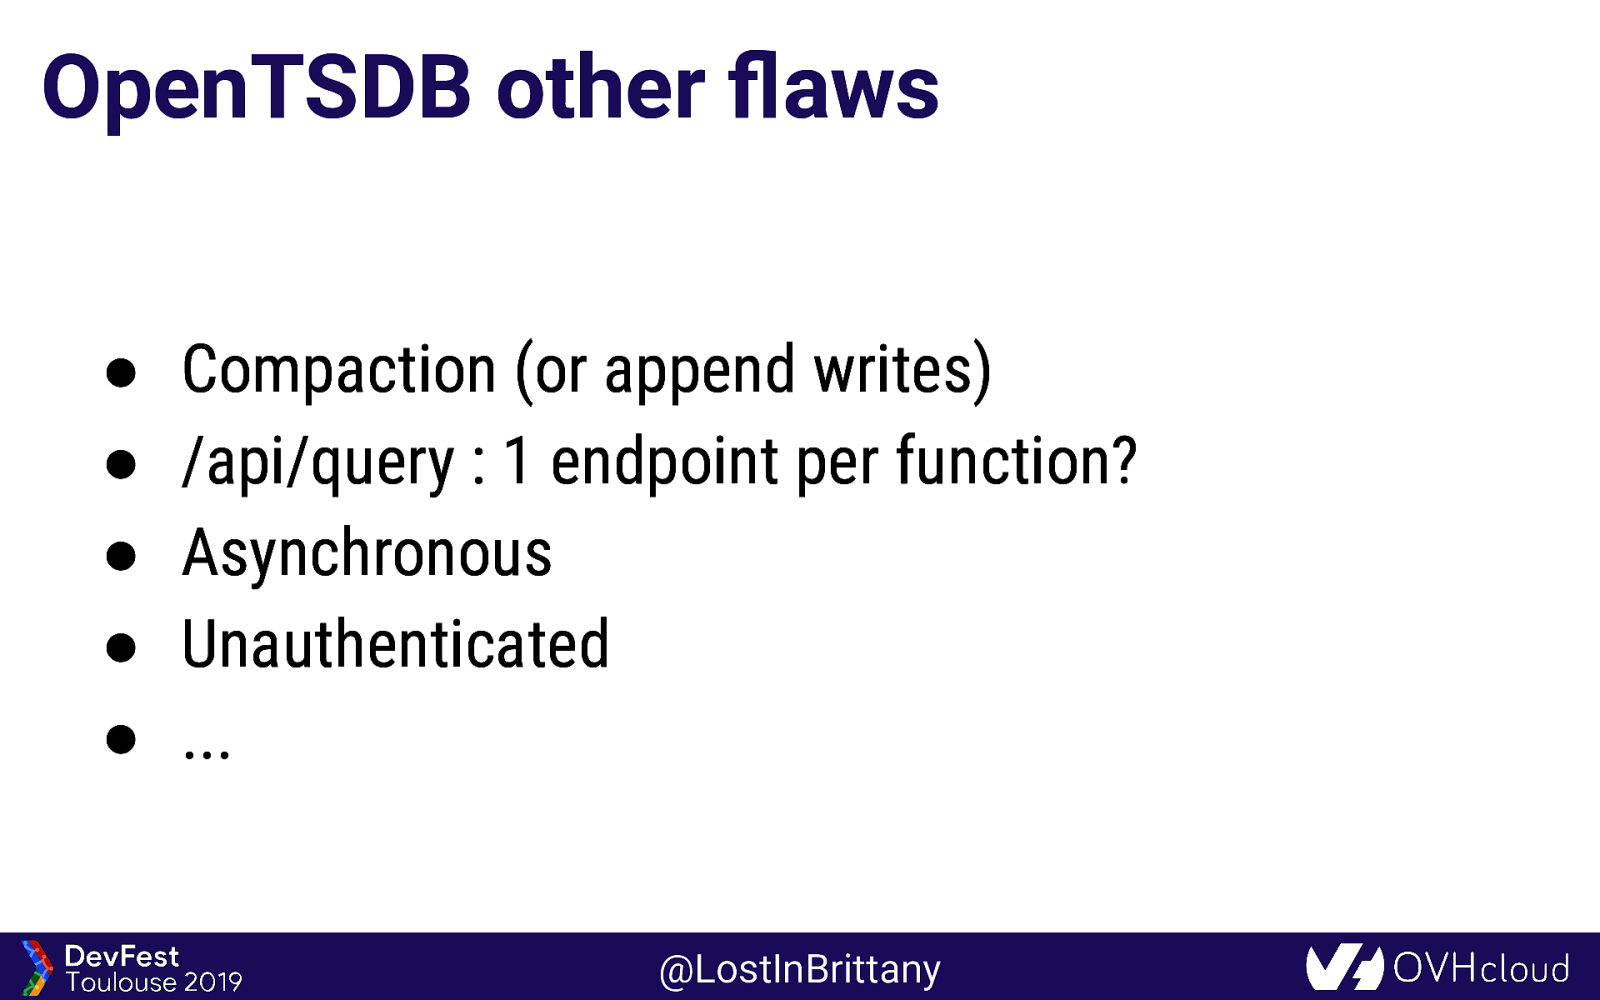
OpenTSDB other flaws ● ● ● ● ● Compaction (or append writes) /api/query : 1 endpoint per function? Asynchronous Unauthenticated … @LostInBrittany
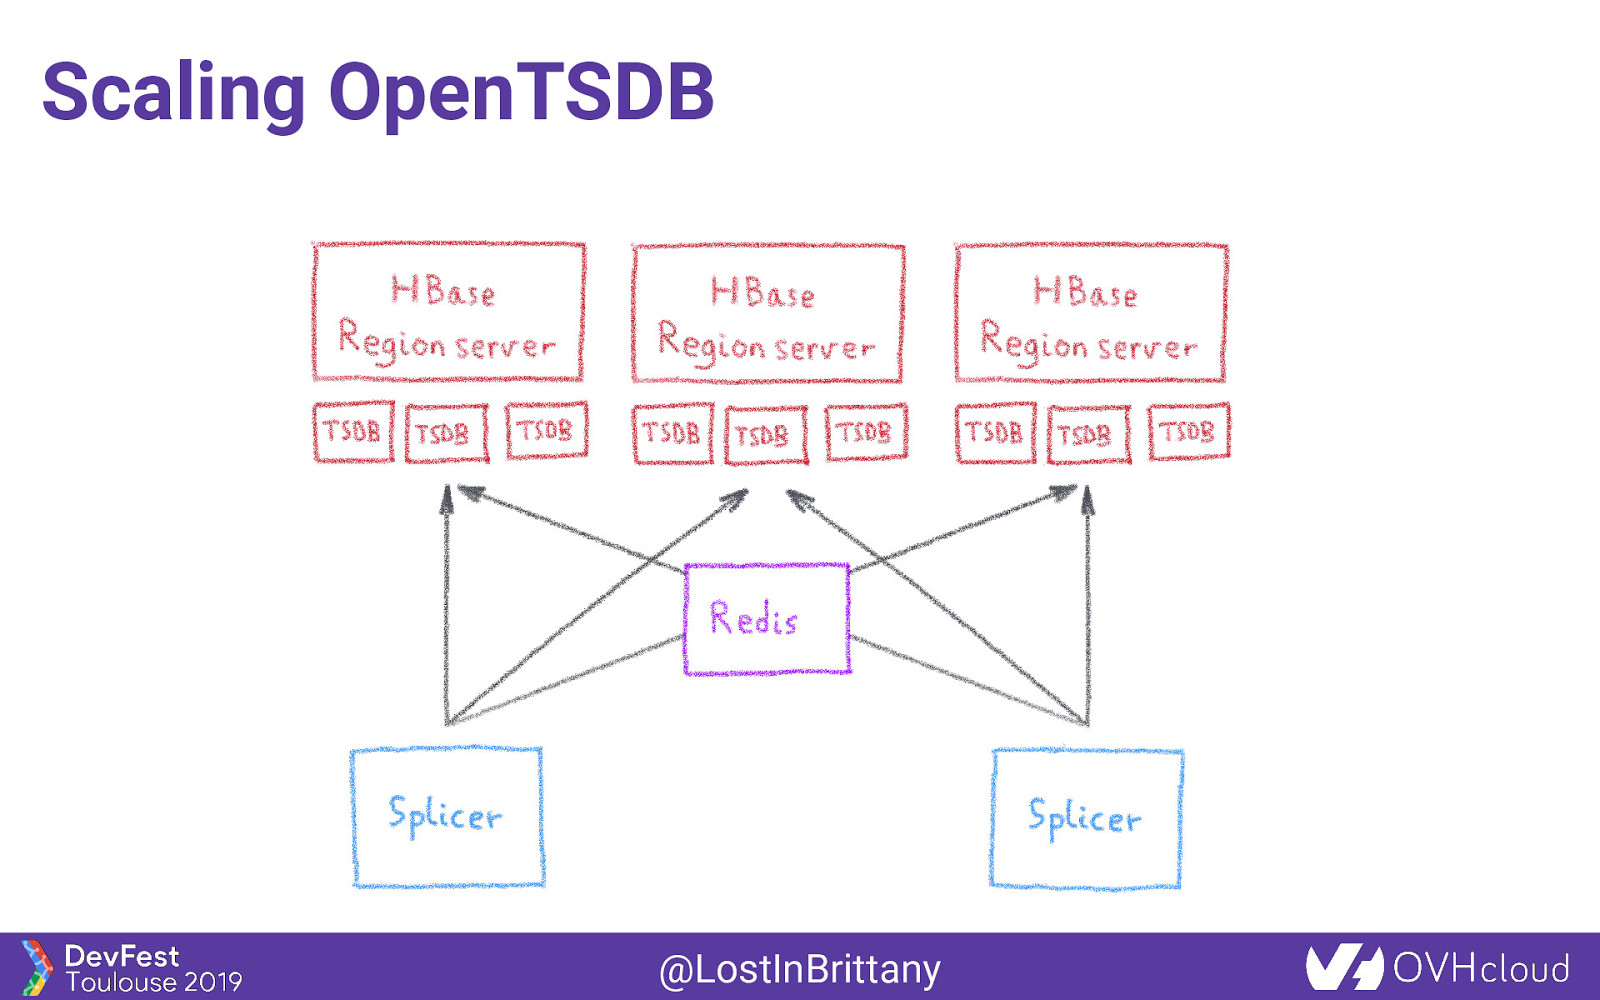
Scaling OpenTSDB @LostInBrittany
Metrics needs First need: To be massively scalable @LostInBrittany
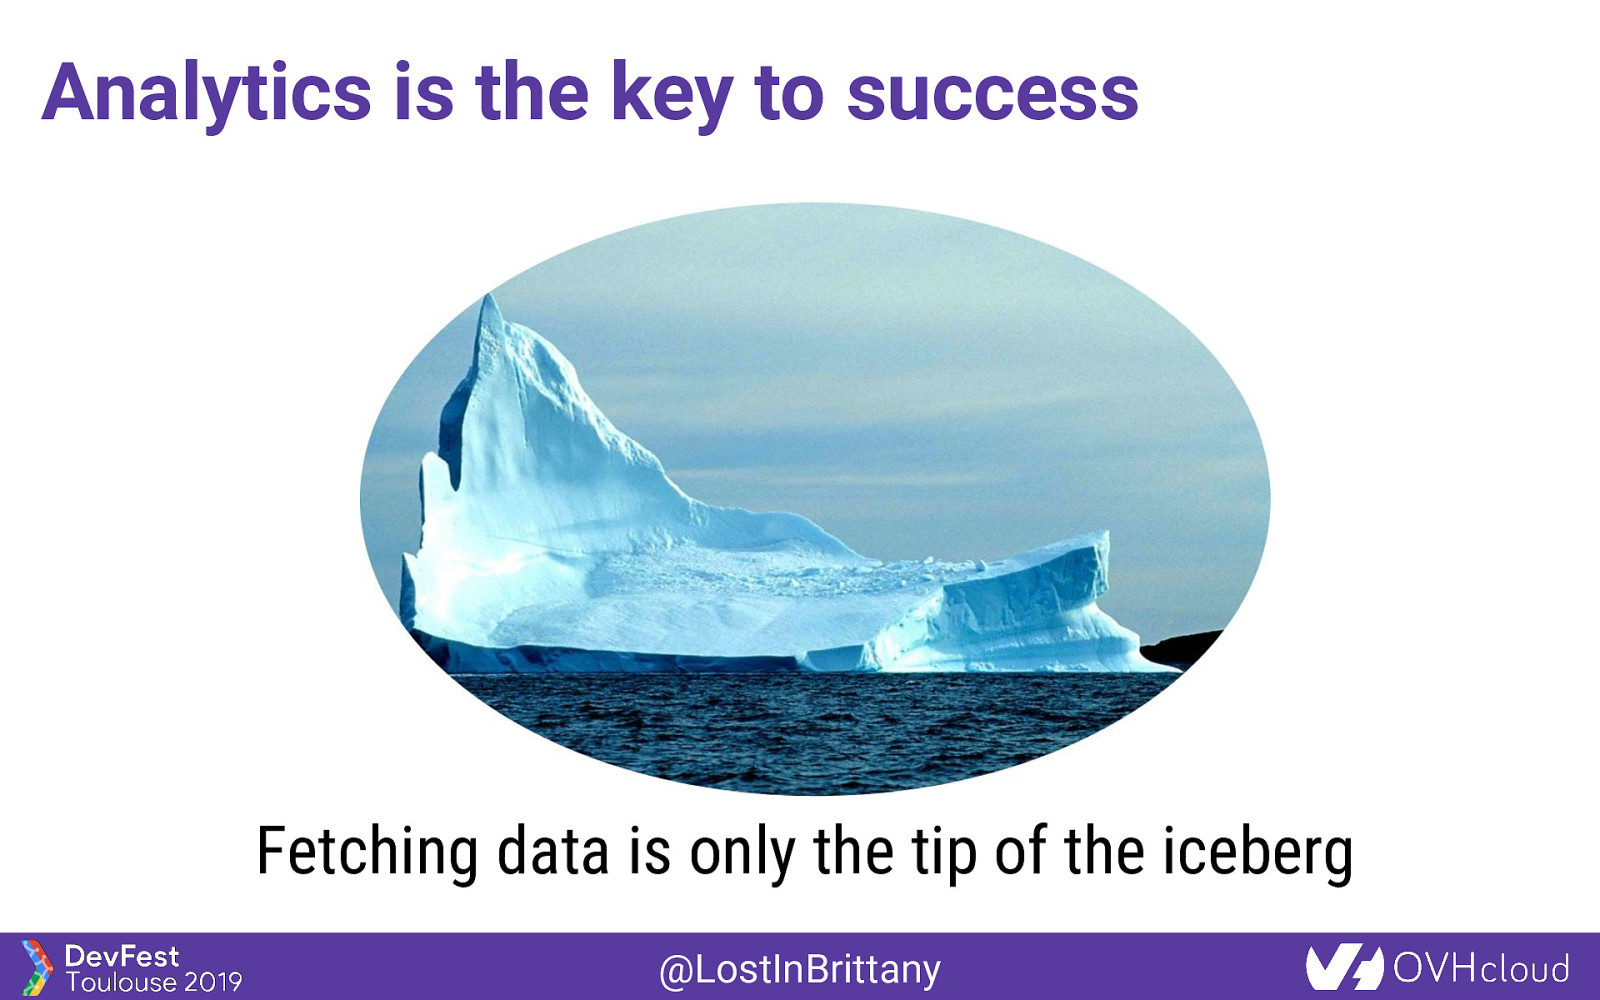
Analytics is the key to success Fetching data is only the tip of the iceberg @LostInBrittany
Analysing metrics data To be scalable, analysis must be done in the database, not in user’s computer @LostInBrittany
Metrics needs Second need: To have rich query capabilities @LostInBrittany
Enter Warp 10… Open-source Time series Database @LostInBrittany
More than a Time Series DB Warp 10 is a software platform that ● Ingests and stores time series ● Manipulates and analyzes time series @LostInBrittany
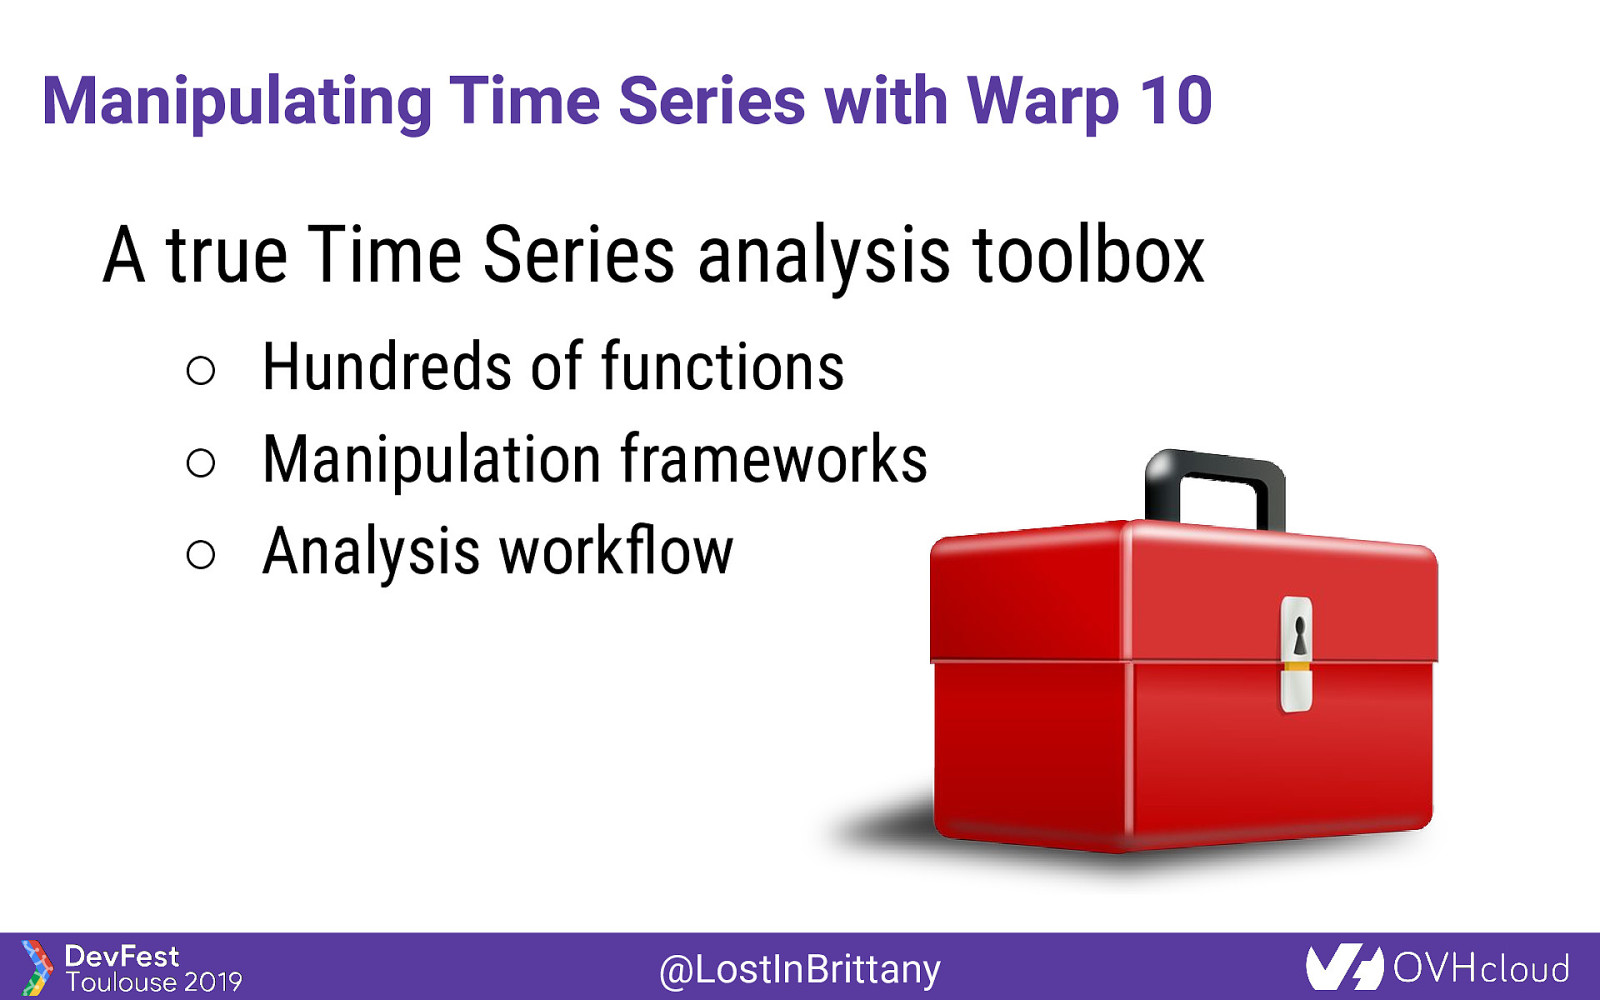
Manipulating Time Series with Warp 10 A true Time Series analysis toolbox ○ Hundreds of functions ○ Manipulation frameworks ○ Analysis workflow @LostInBrittany
Manipulating Time Series with Warp 10 A Time Series manipulation language WarpScript @LostInBrittany
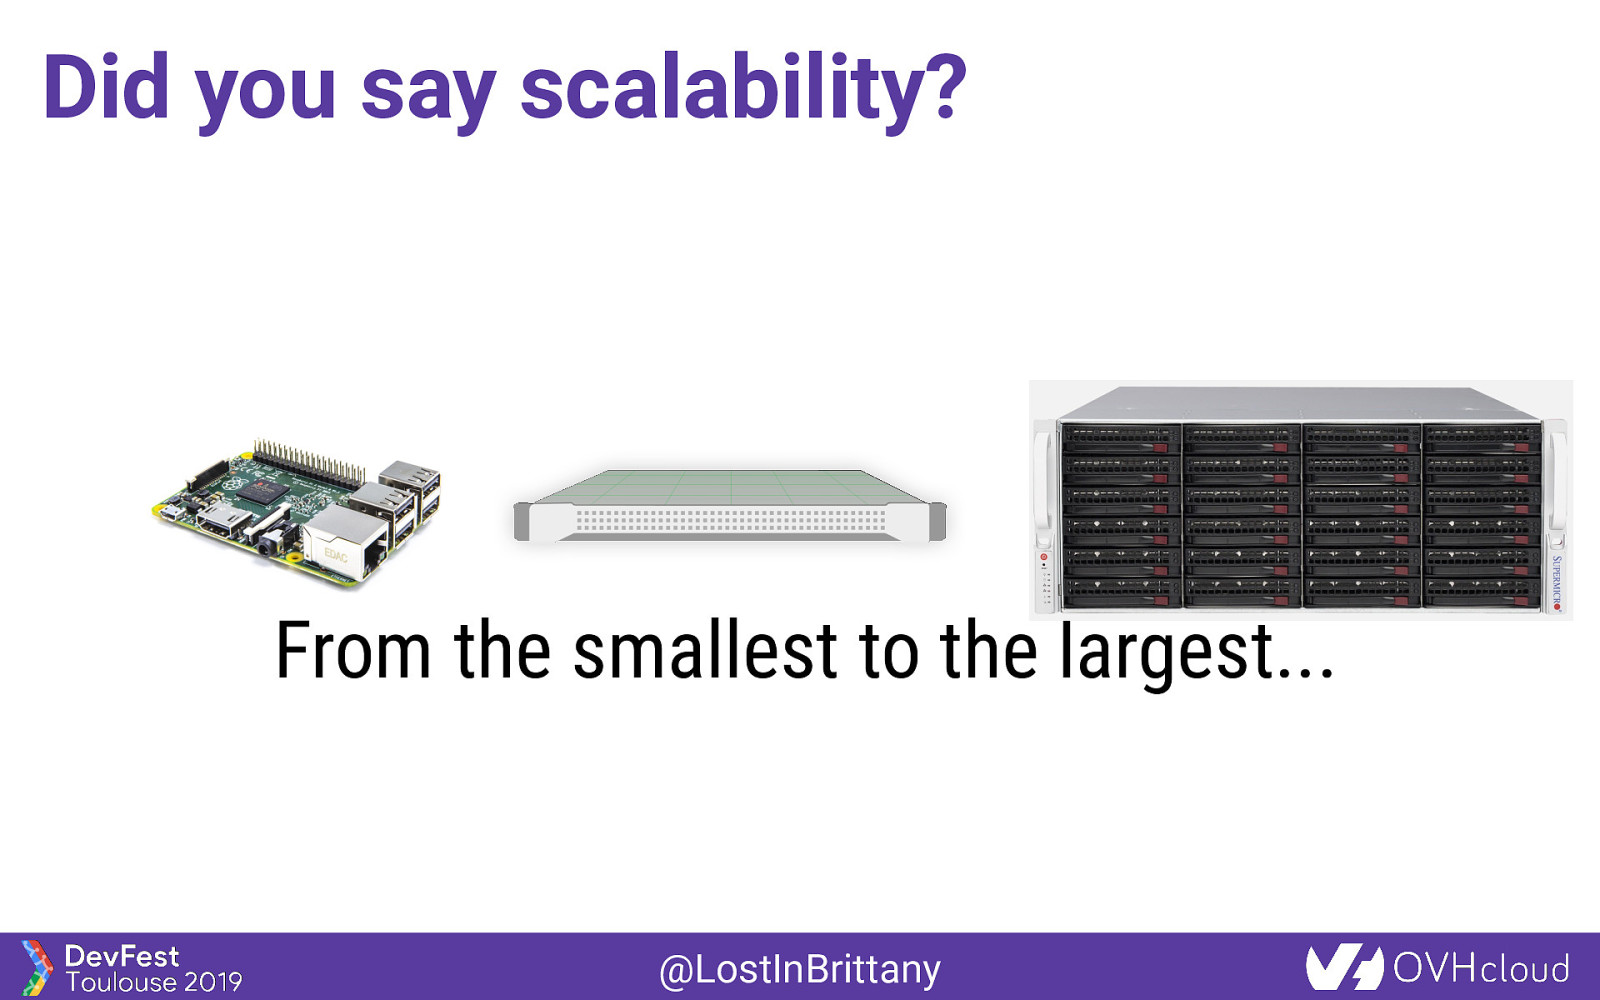
Did you say scalability? From the smallest to the largest… @LostInBrittany
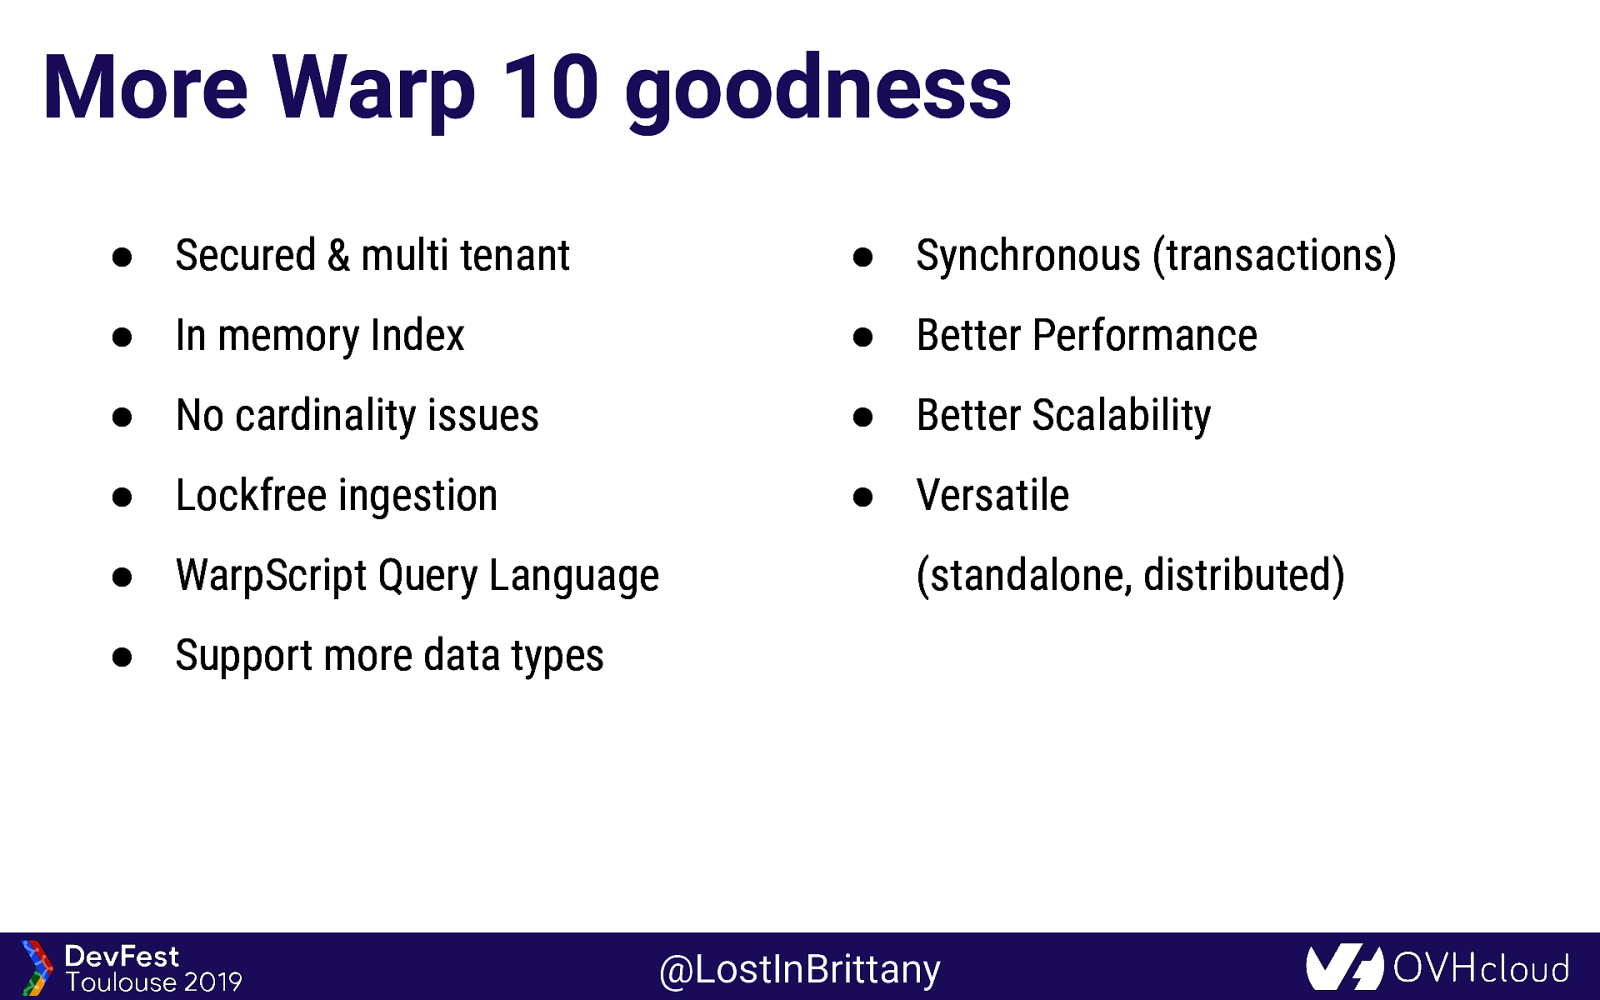
More Warp 10 goodness ● Secured & multi tenant ● Synchronous (transactions) ● In memory Index ● Better Performance ● No cardinality issues ● Better Scalability ● Lockfree ingestion ● Versatile ● WarpScript Query Language (standalone, distributed) ● Support more data types @LostInBrittany
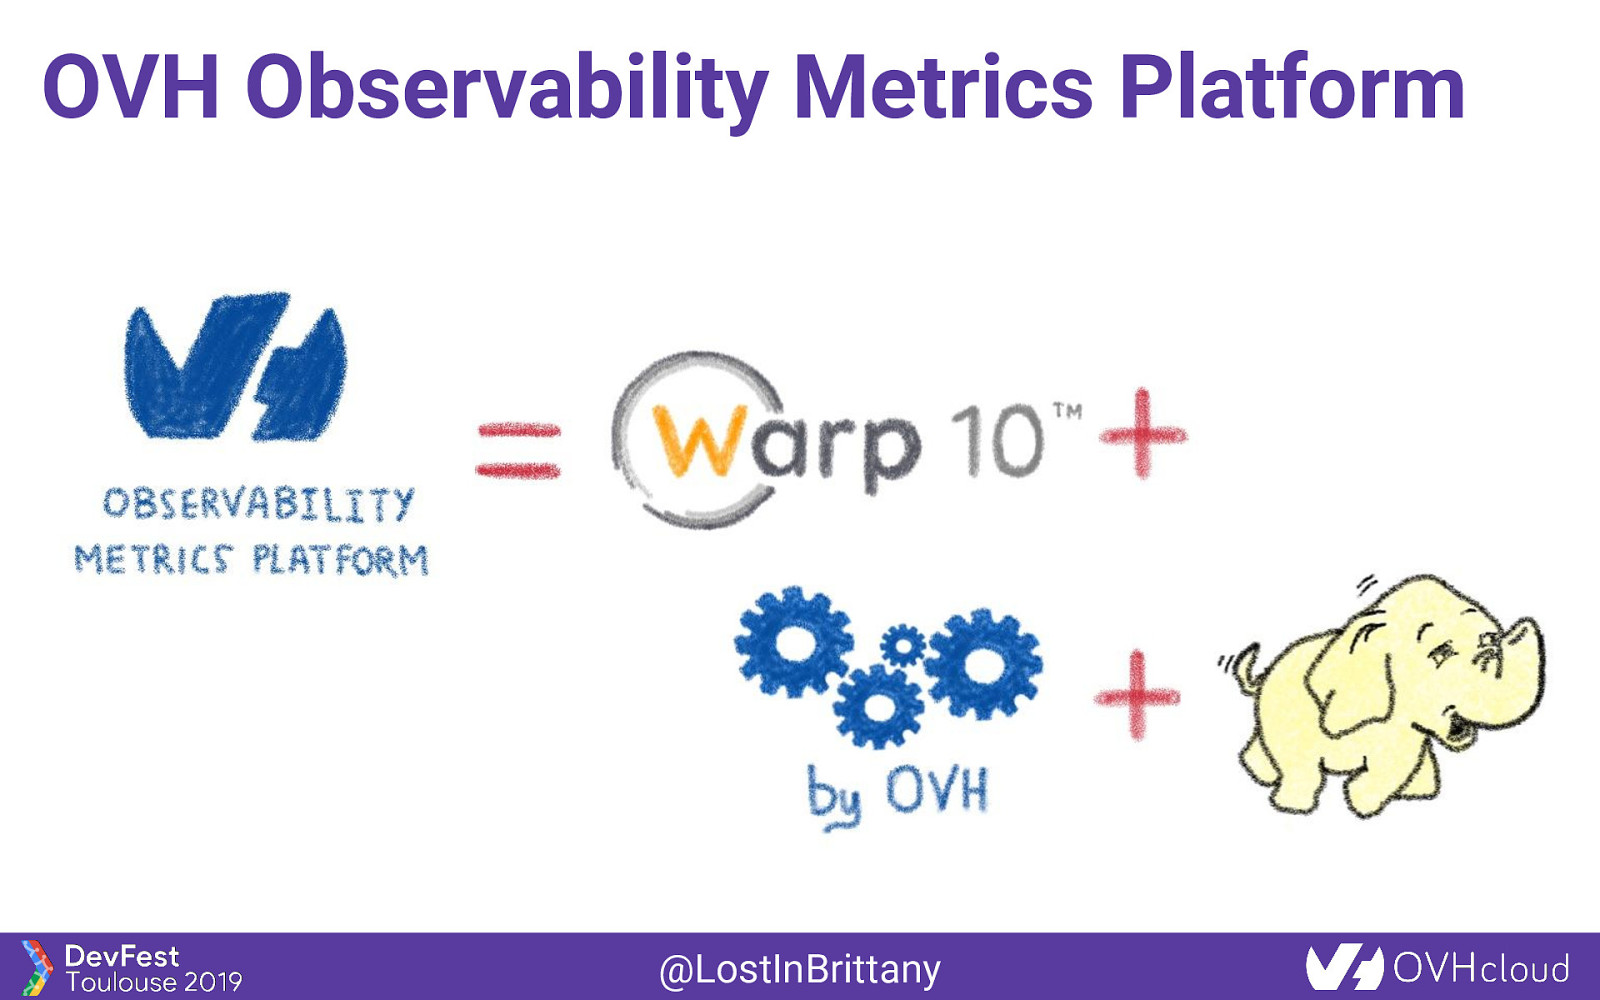
OVH Observability Metrics Platform @LostInBrittany
Building an ecosystem From Warp 10 to OVH Metrics @LostInBrittany
What protocols should we support? Who must do the effort? @LostInBrittany
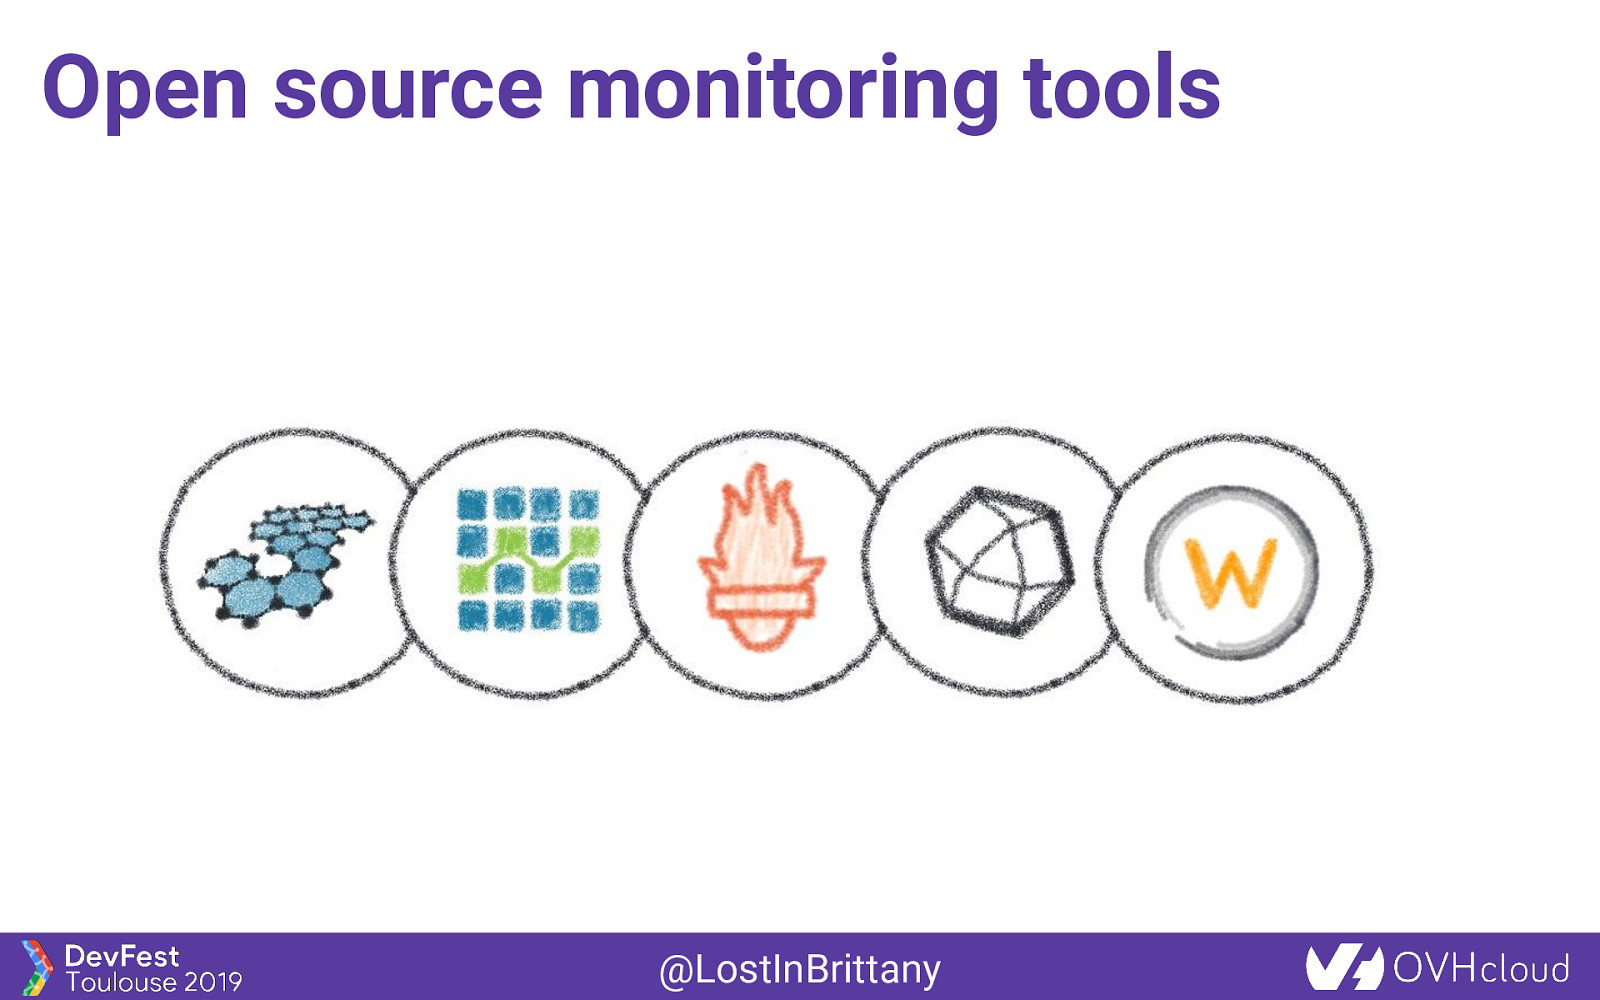
Open source monitoring tools @LostInBrittany
Open source monitoring tools @LostInBrittany
Open source monitoring tools @LostInBrittany
Open source monitoring tools @LostInBrittany
Open source monitoring tools @LostInBrittany
Open source monitoring tools @LostInBrittany
Open source monitoring tools Why choose? Let’s support all of them! @LostInBrittany
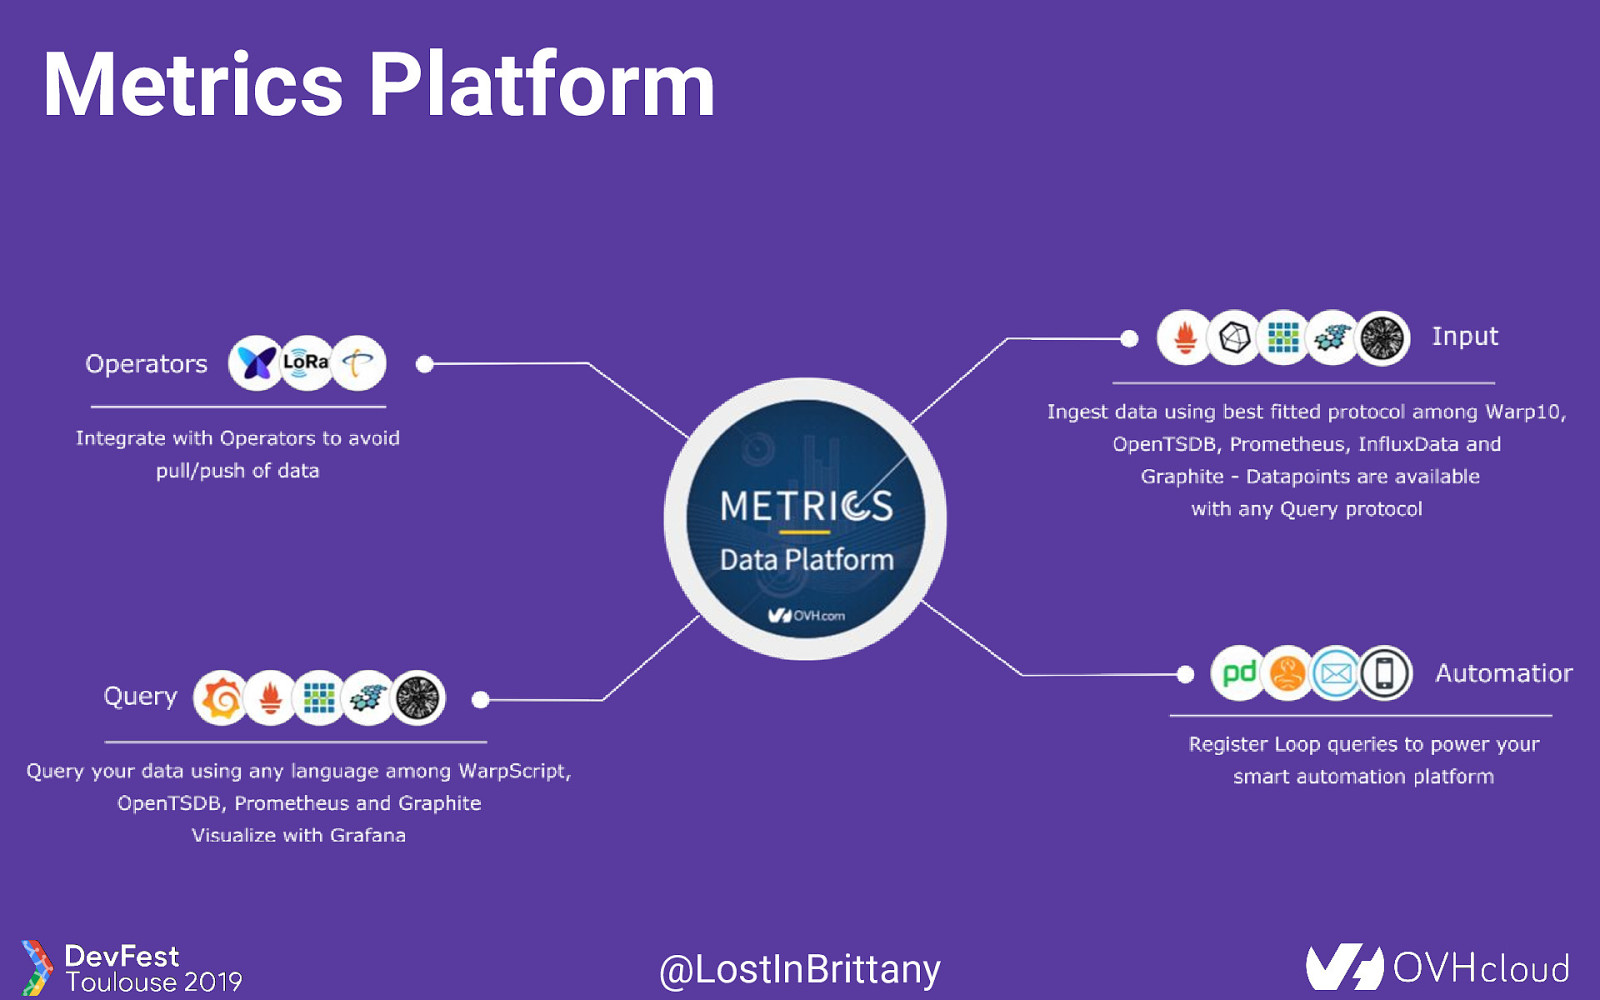
Metrics Platform @LostInBrittany
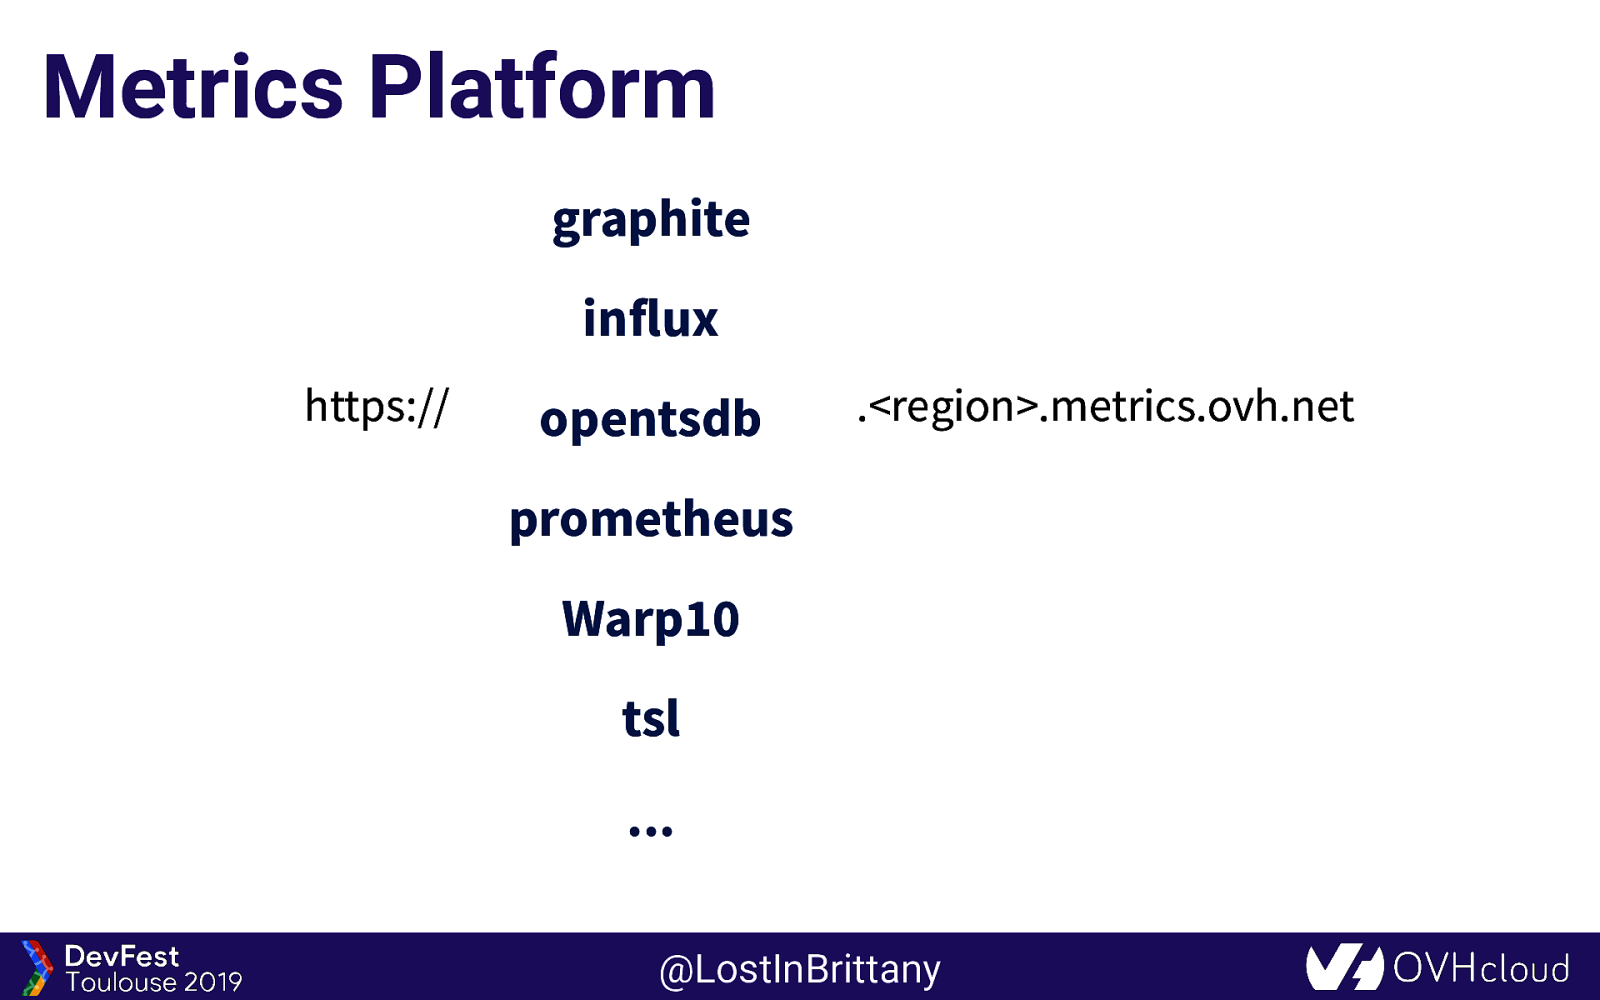
Metrics Platform graphite influx https:// opentsdb .<region>.metrics.ovh.net prometheus Warp10 tsl … @LostInBrittany
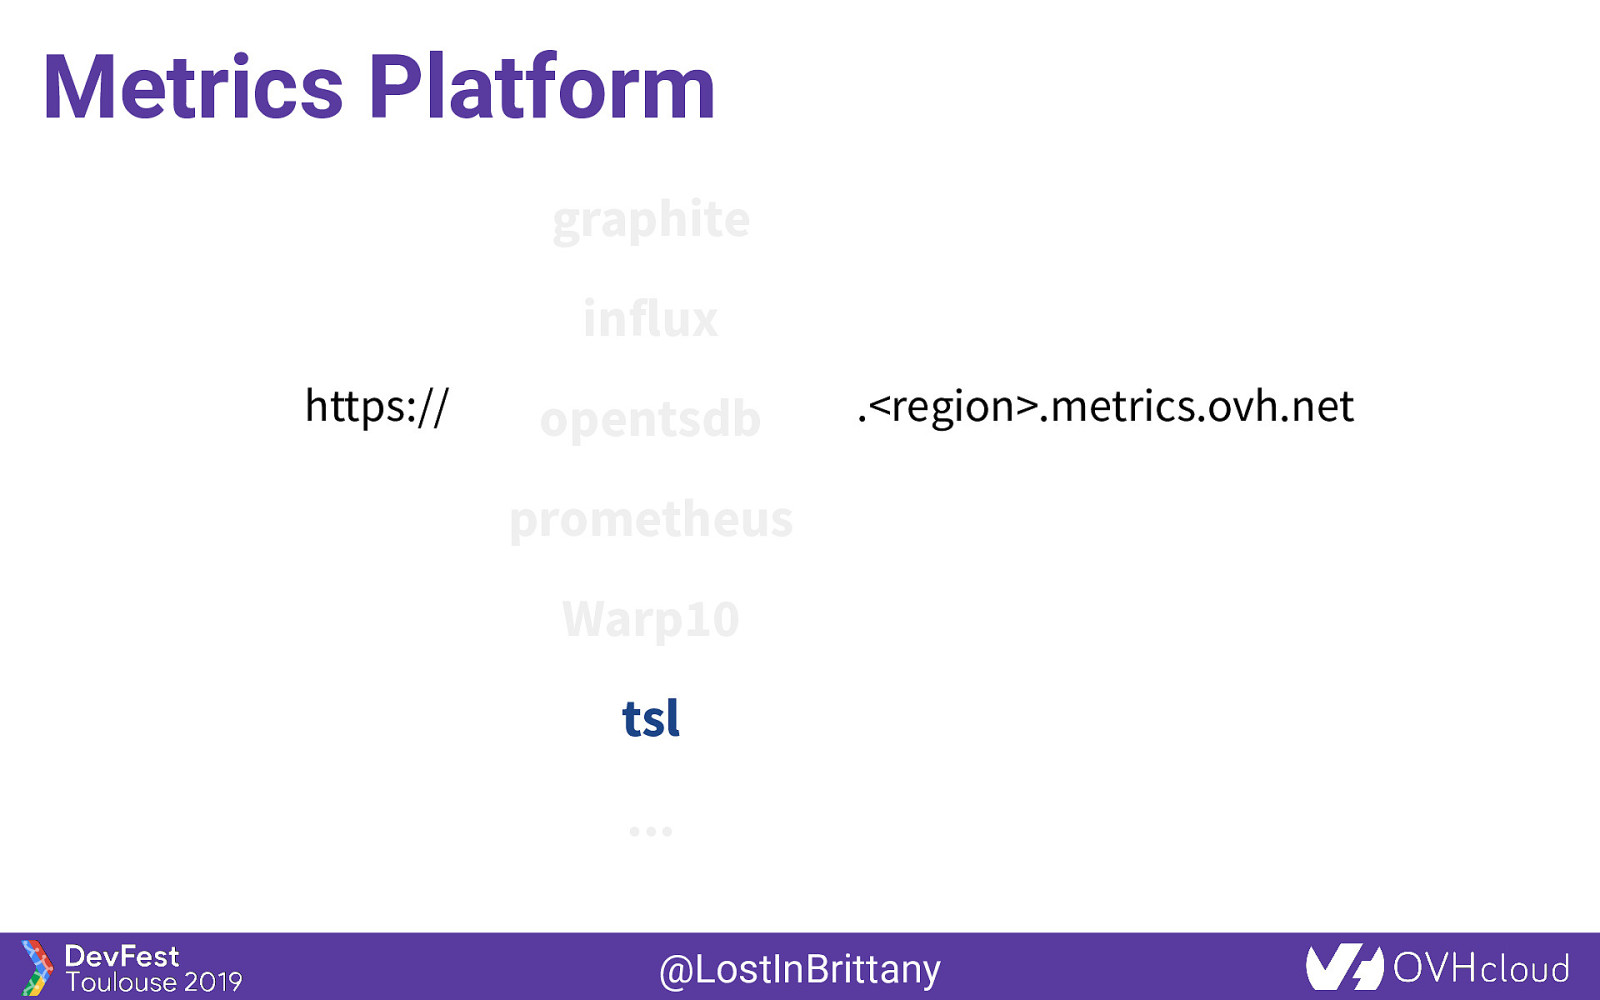
Metrics Platform graphite influx https:// opentsdb .<region>.metrics.ovh.net prometheus Warp10 tsl … @LostInBrittany
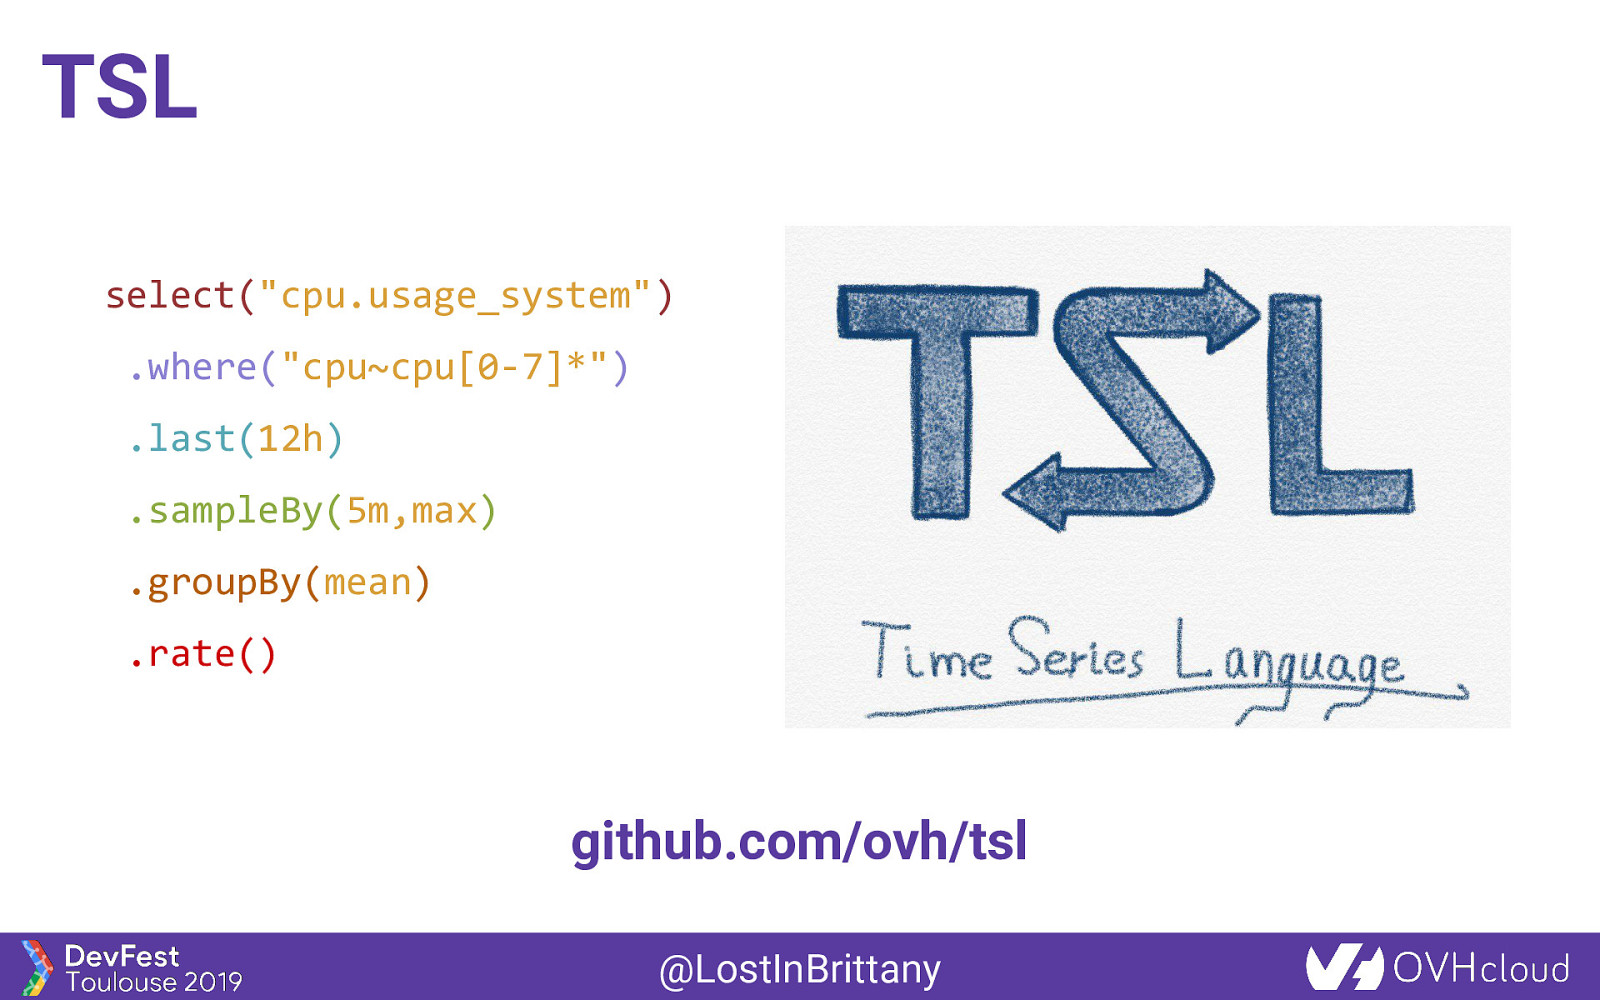
TSL select(“cpu.usage_system”) .where(“cpu~cpu[0-7]*”) .last(12h) .sampleBy(5m,max) .groupBy(mean) .rate() github.com/ovh/tsl @LostInBrittany
Metrics Live In-memory, high-performance Metrics instances @LostInBrittany
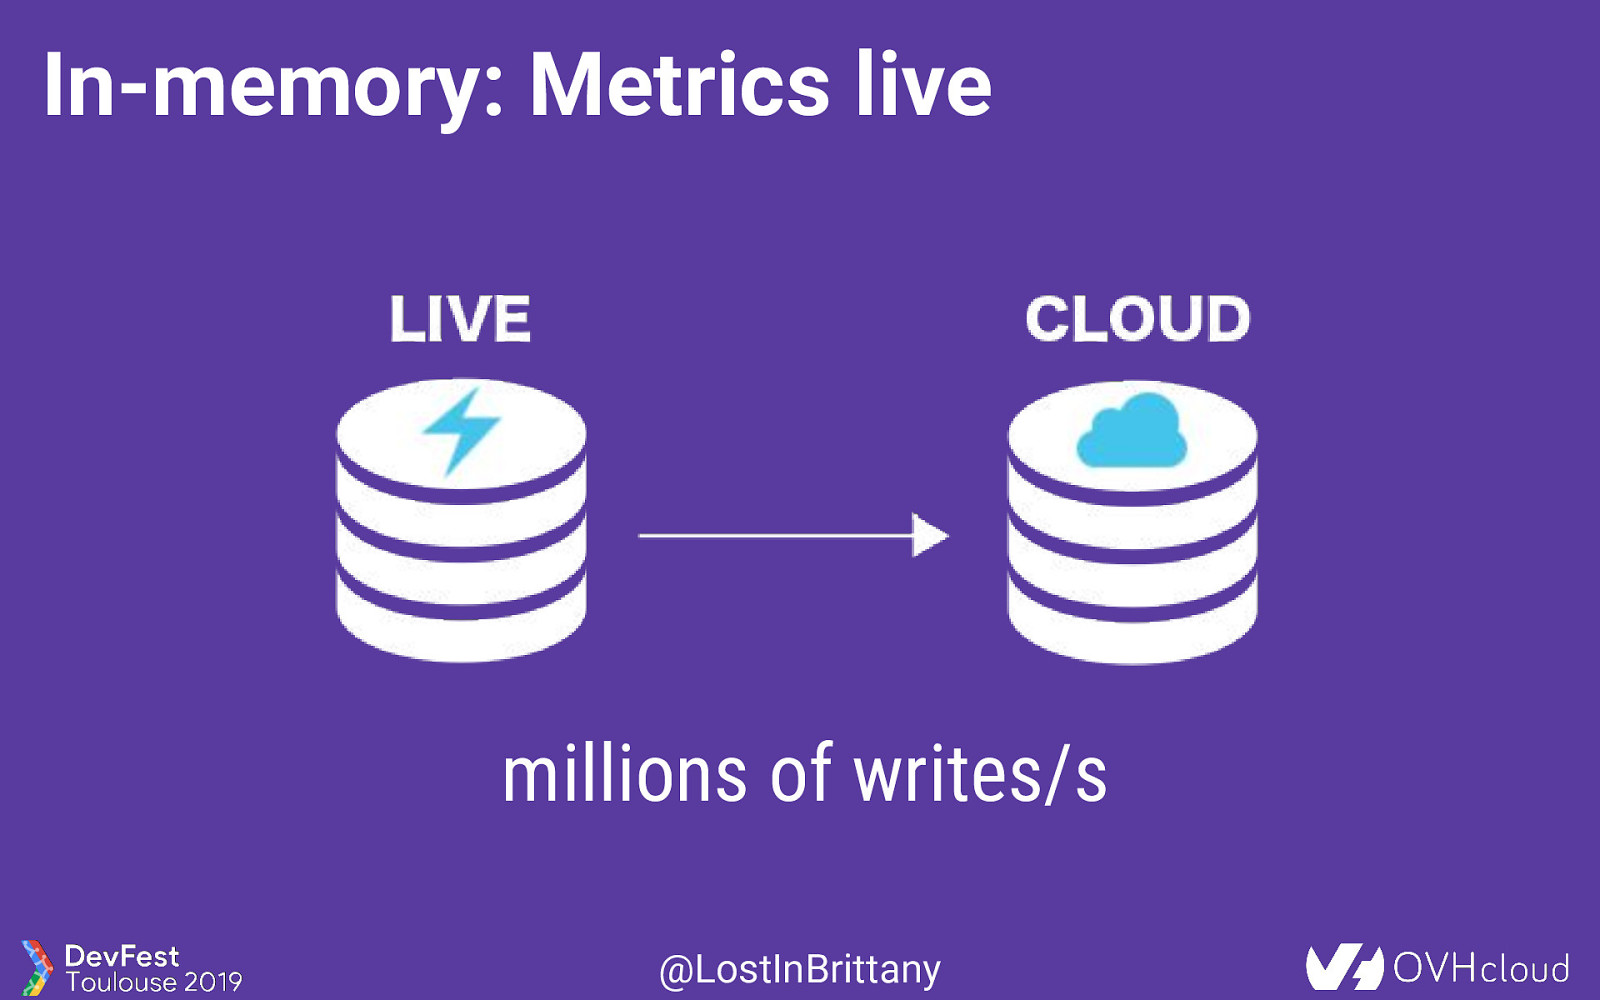
In-memory: Metrics live millions of writes/s @LostInBrittany
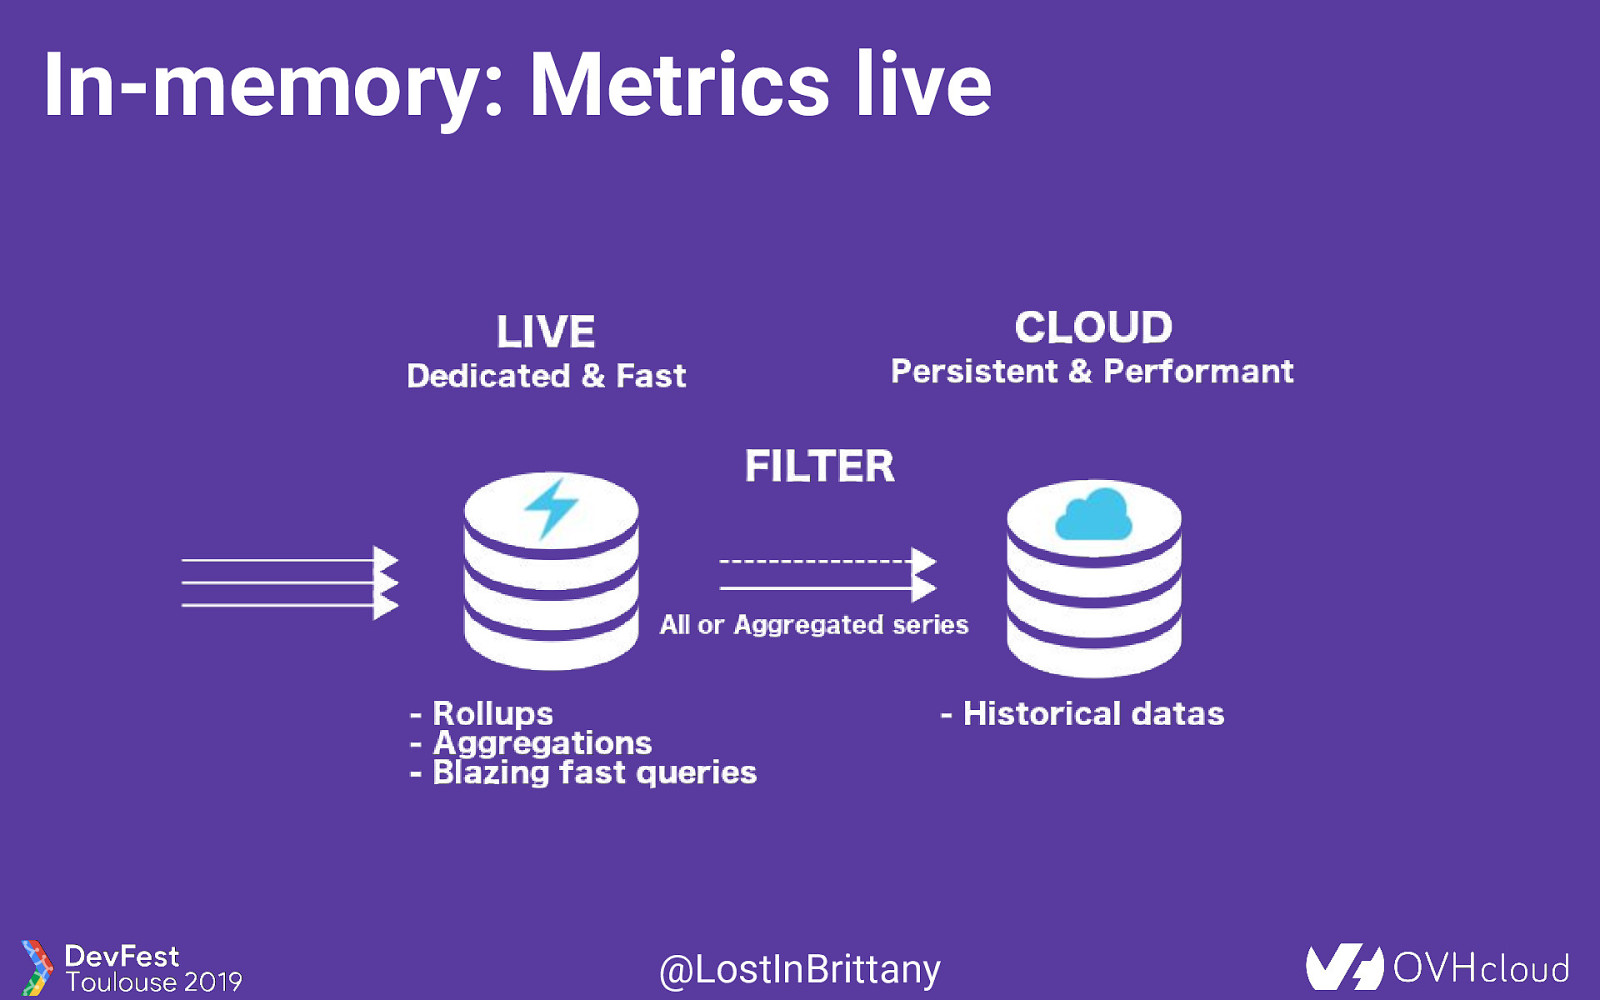
In-memory: Metrics live @LostInBrittany
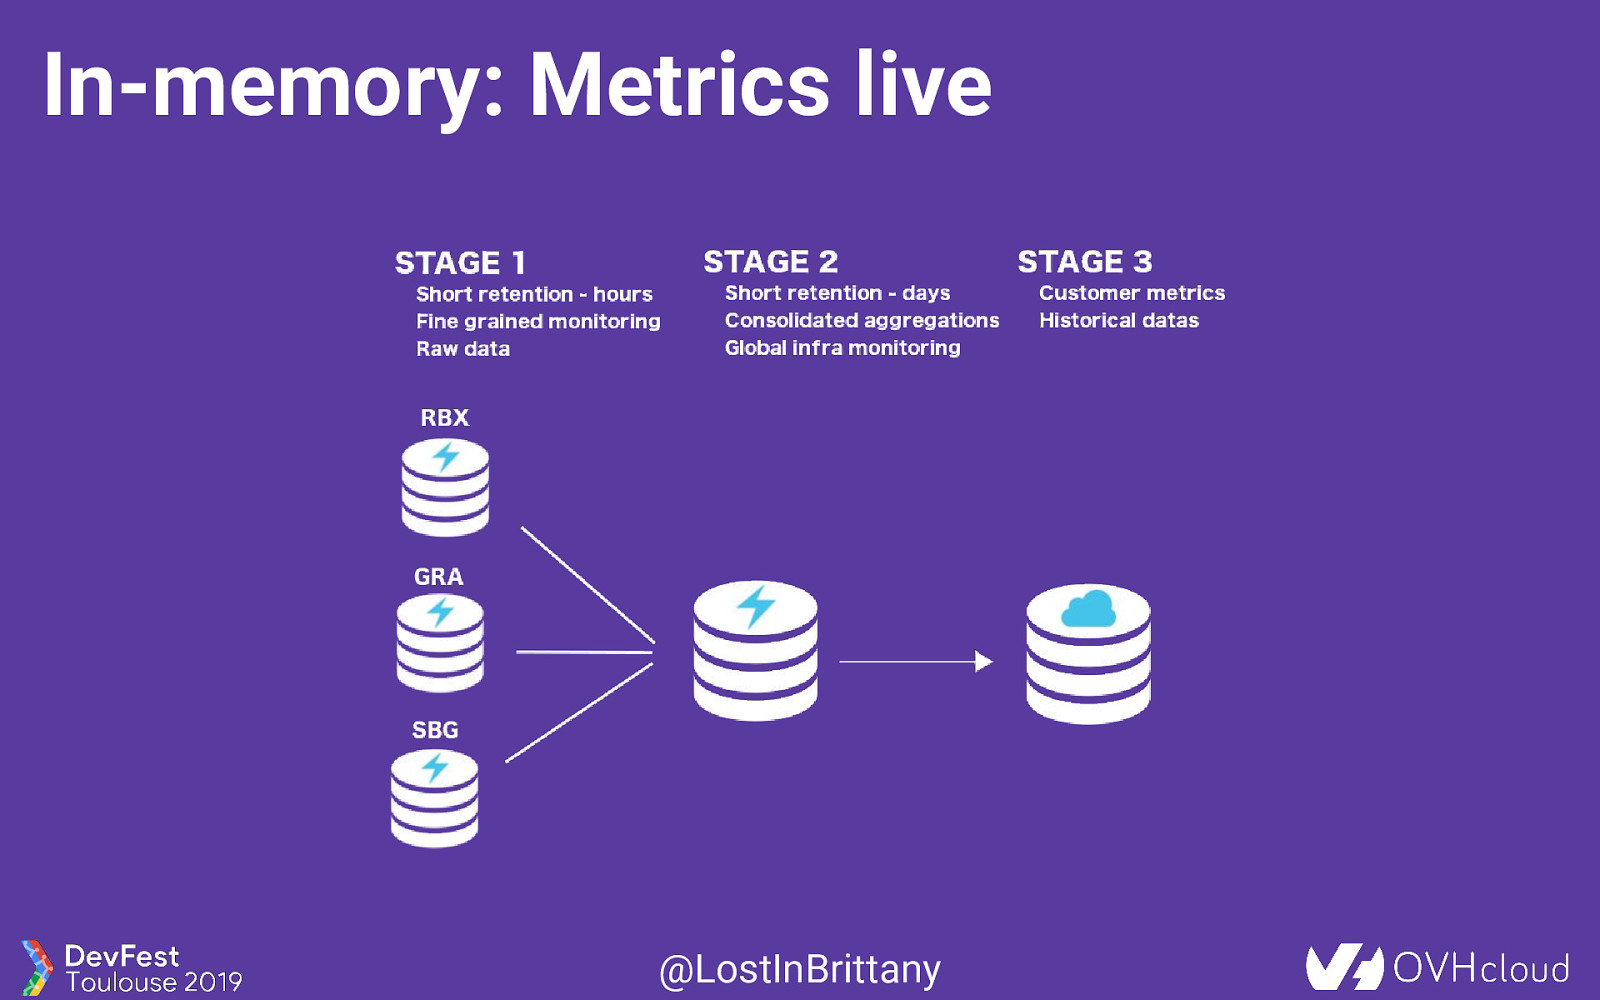
In-memory: Metrics live @LostInBrittany
Monitoring is only the beginning OVH Metrics answer to many other use cases @LostInBrittany
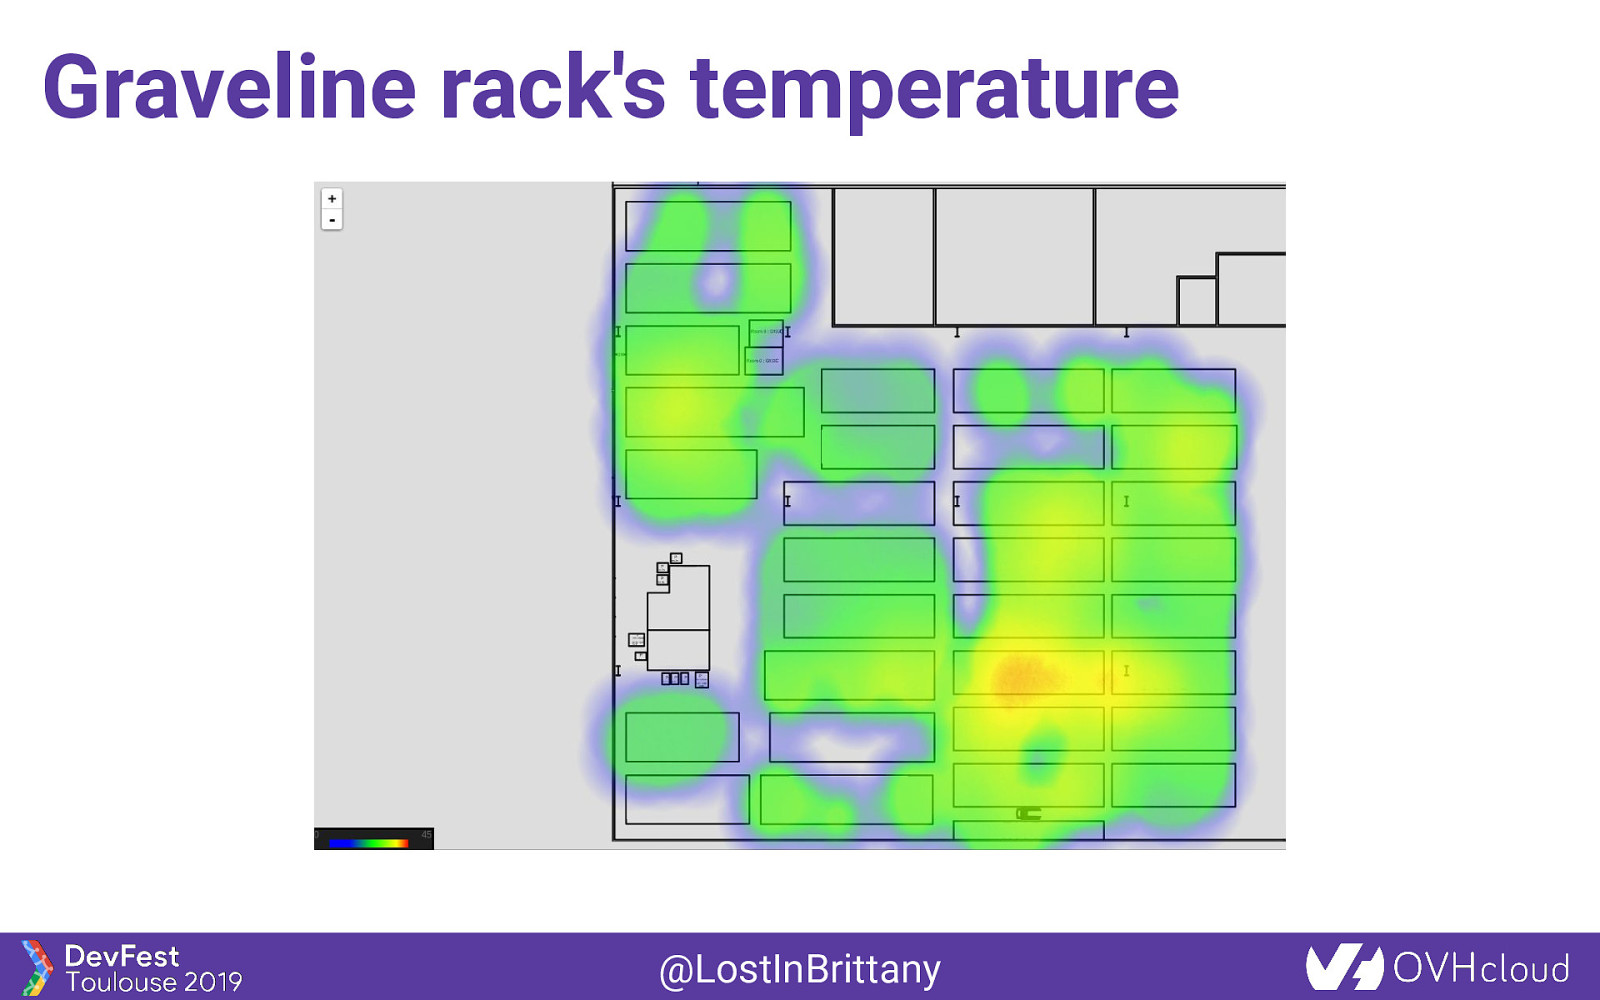
Graveline rack’s temperature @LostInBrittany
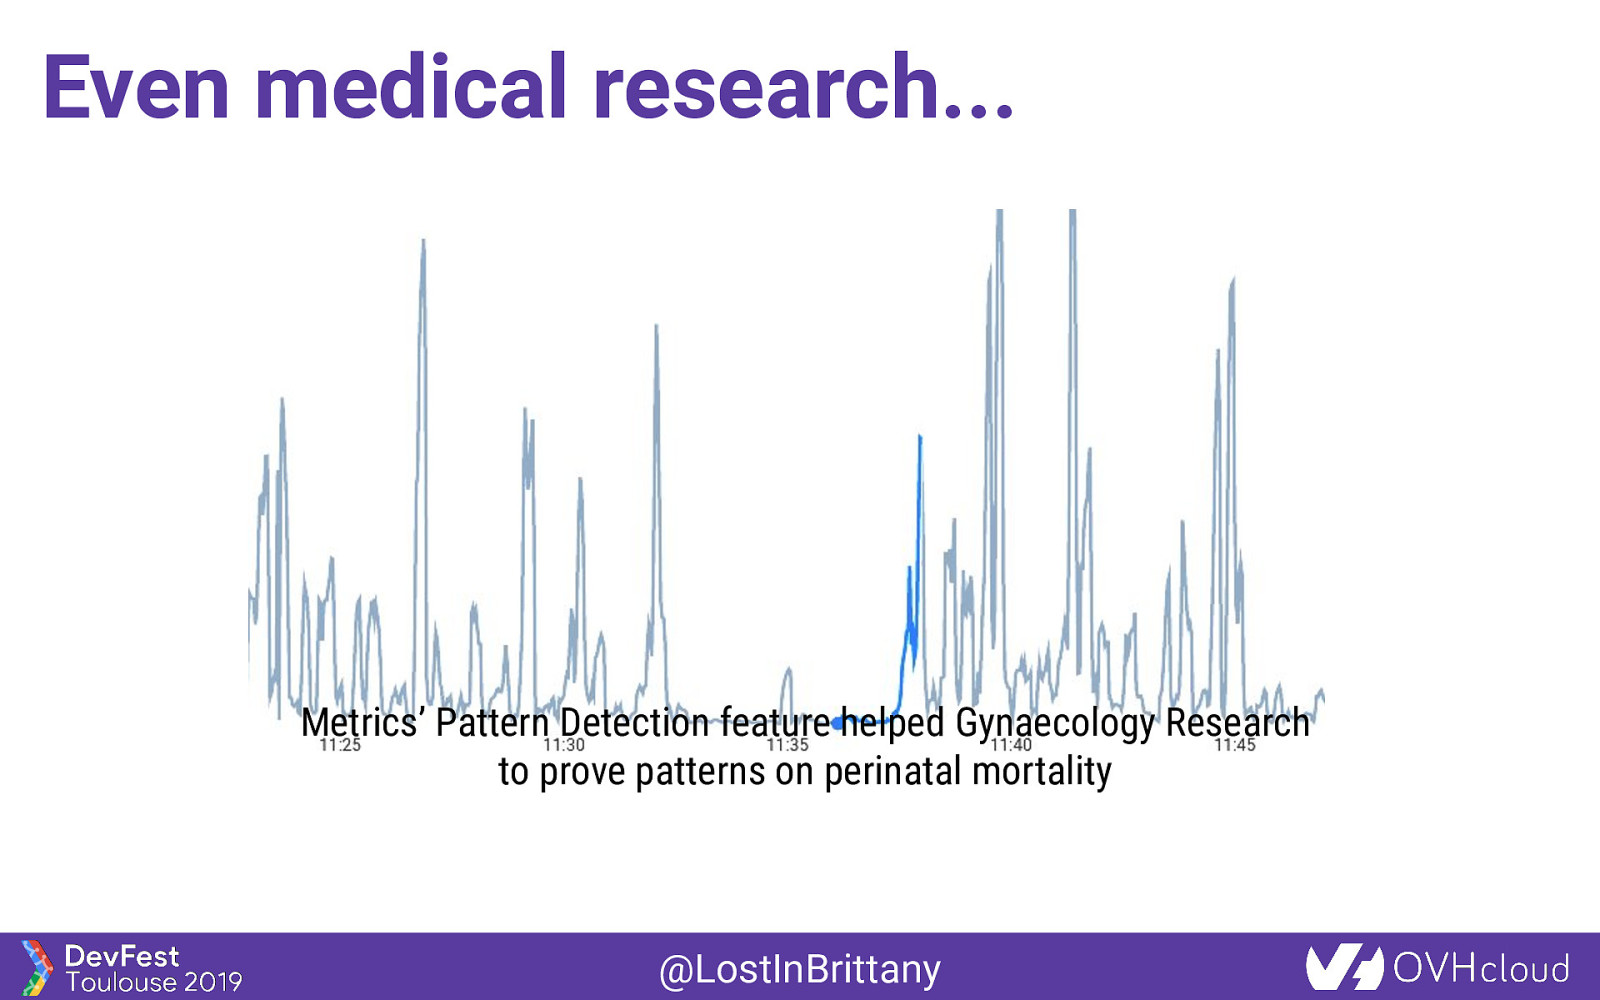
Even medical research… Metrics’ Pattern Detection feature helped Gynaecology Research to prove patterns on perinatal mortality @LostInBrittany
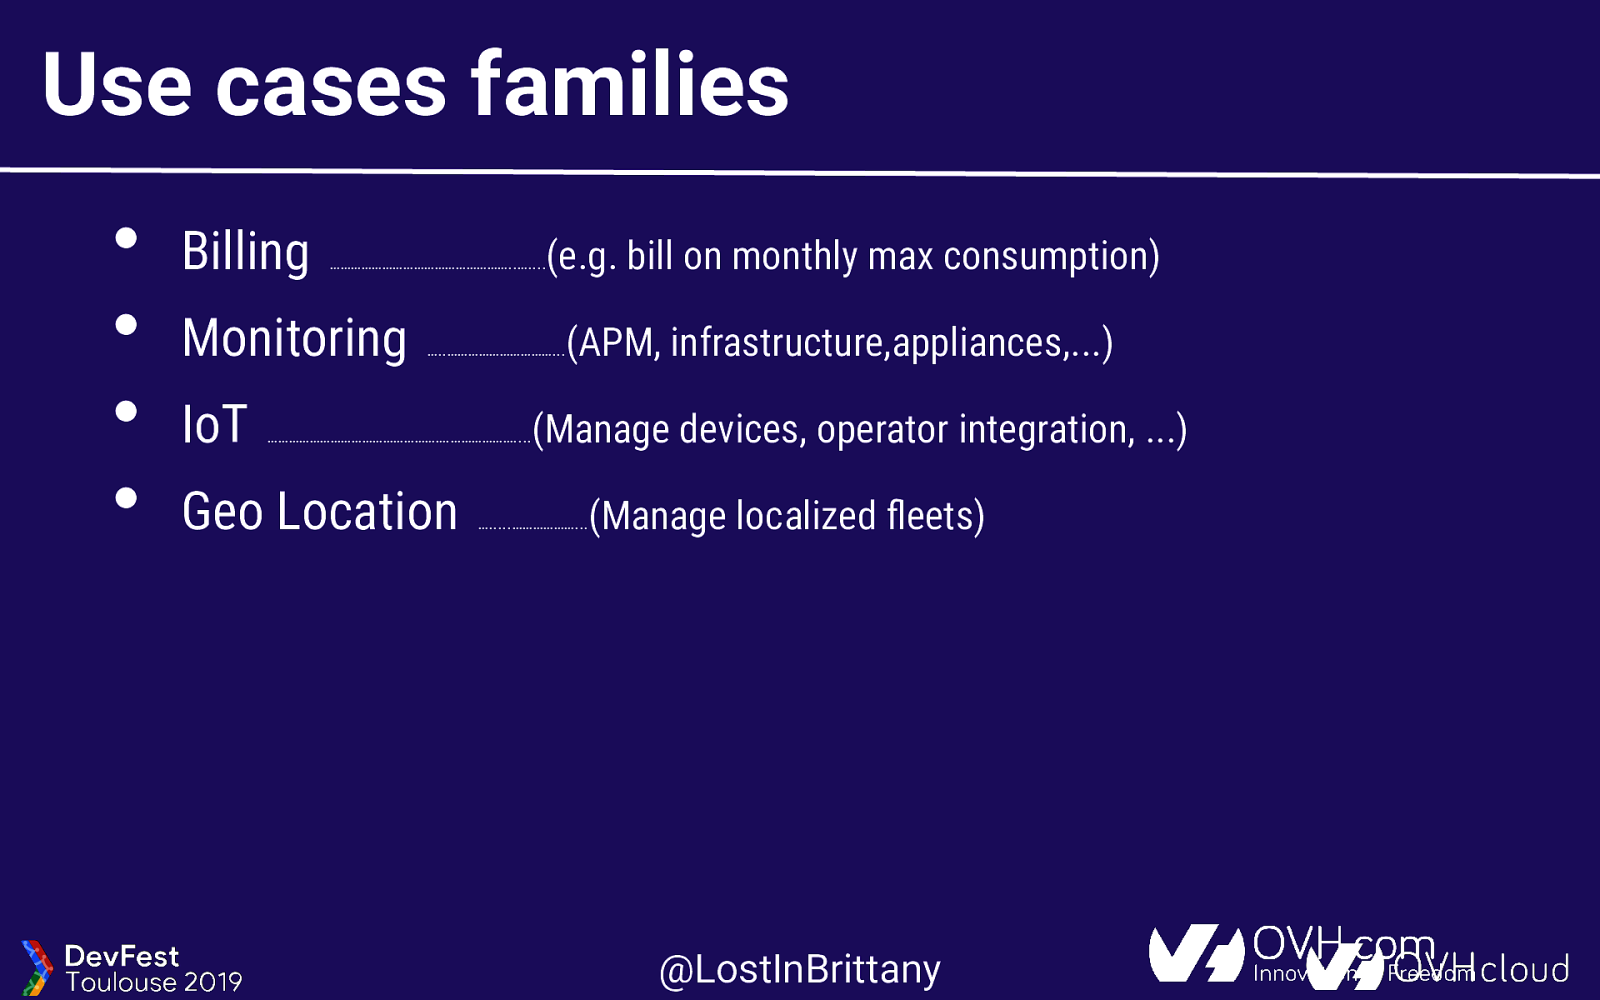
Use cases families • • • • Billing Monitoring IoT (e.g. bill on monthly max consumption) ……………………………………………..……. (APM, infrastructure,appliances,…) …..…………………………… (Manage devices, operator integration, …) …………………………………………….…………………. Geo Location (Manage localized fleets) ……..………………… @LostInBrittany
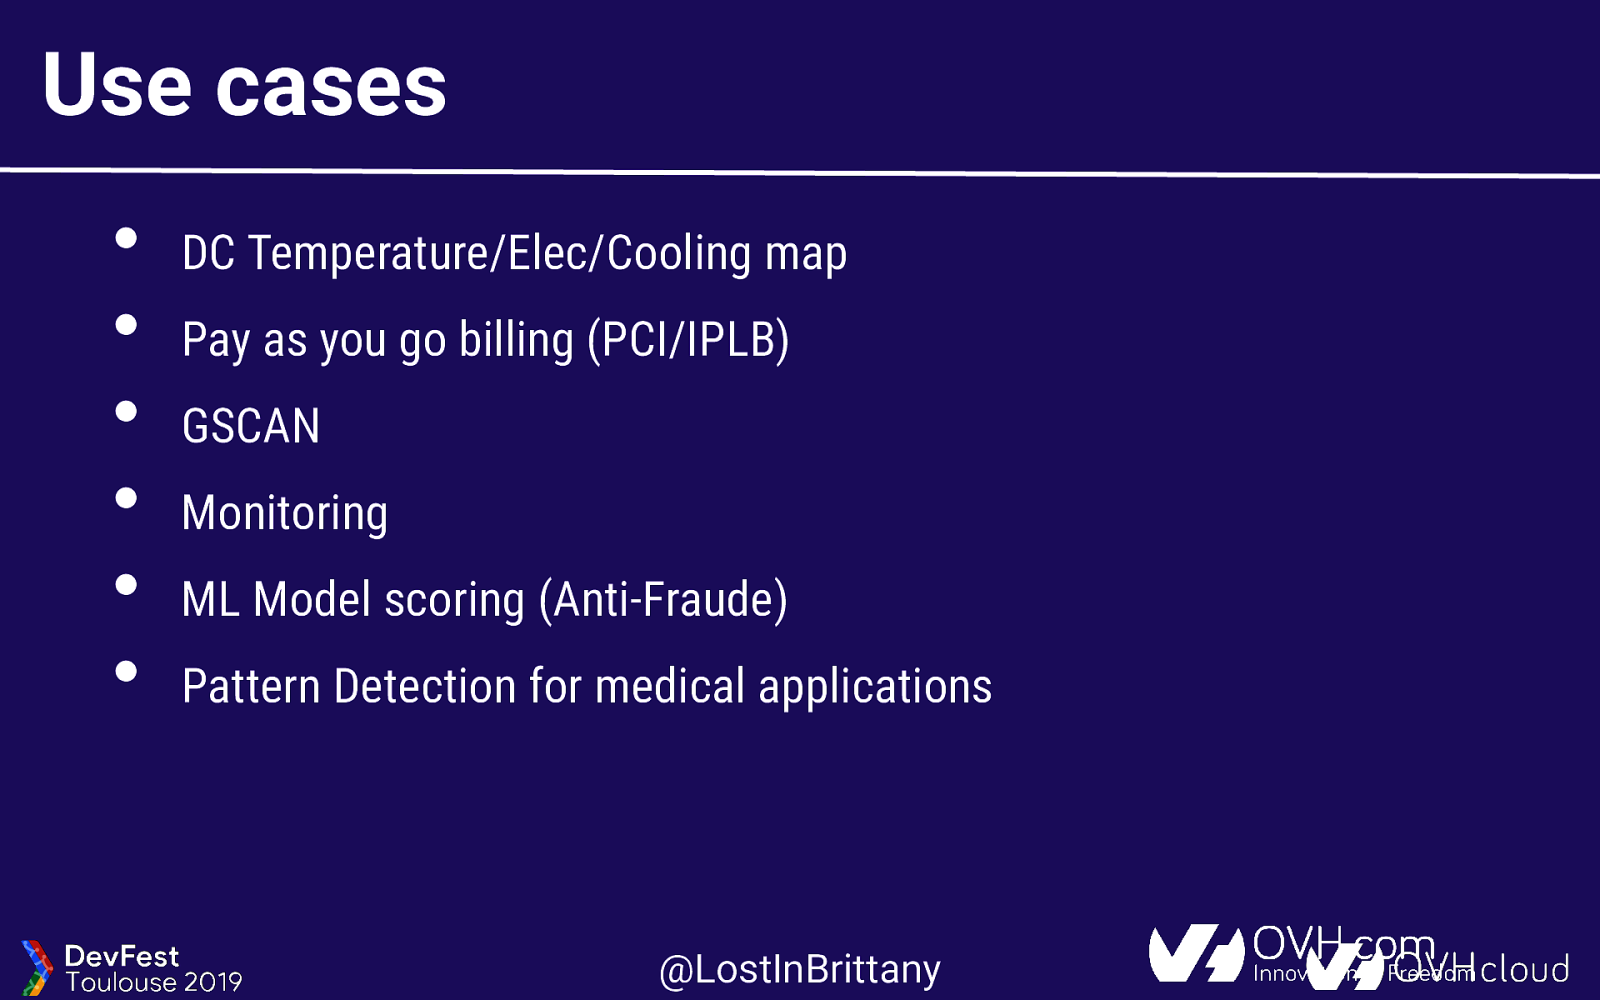
Use cases • • • • • • DC Temperature/Elec/Cooling map Pay as you go billing (PCI/IPLB) GSCAN Monitoring ML Model scoring (Anti-Fraude) Pattern Detection for medical applications @LostInBrittany
SREing Metrics With a great power comes a great responsibility @LostInBrittany
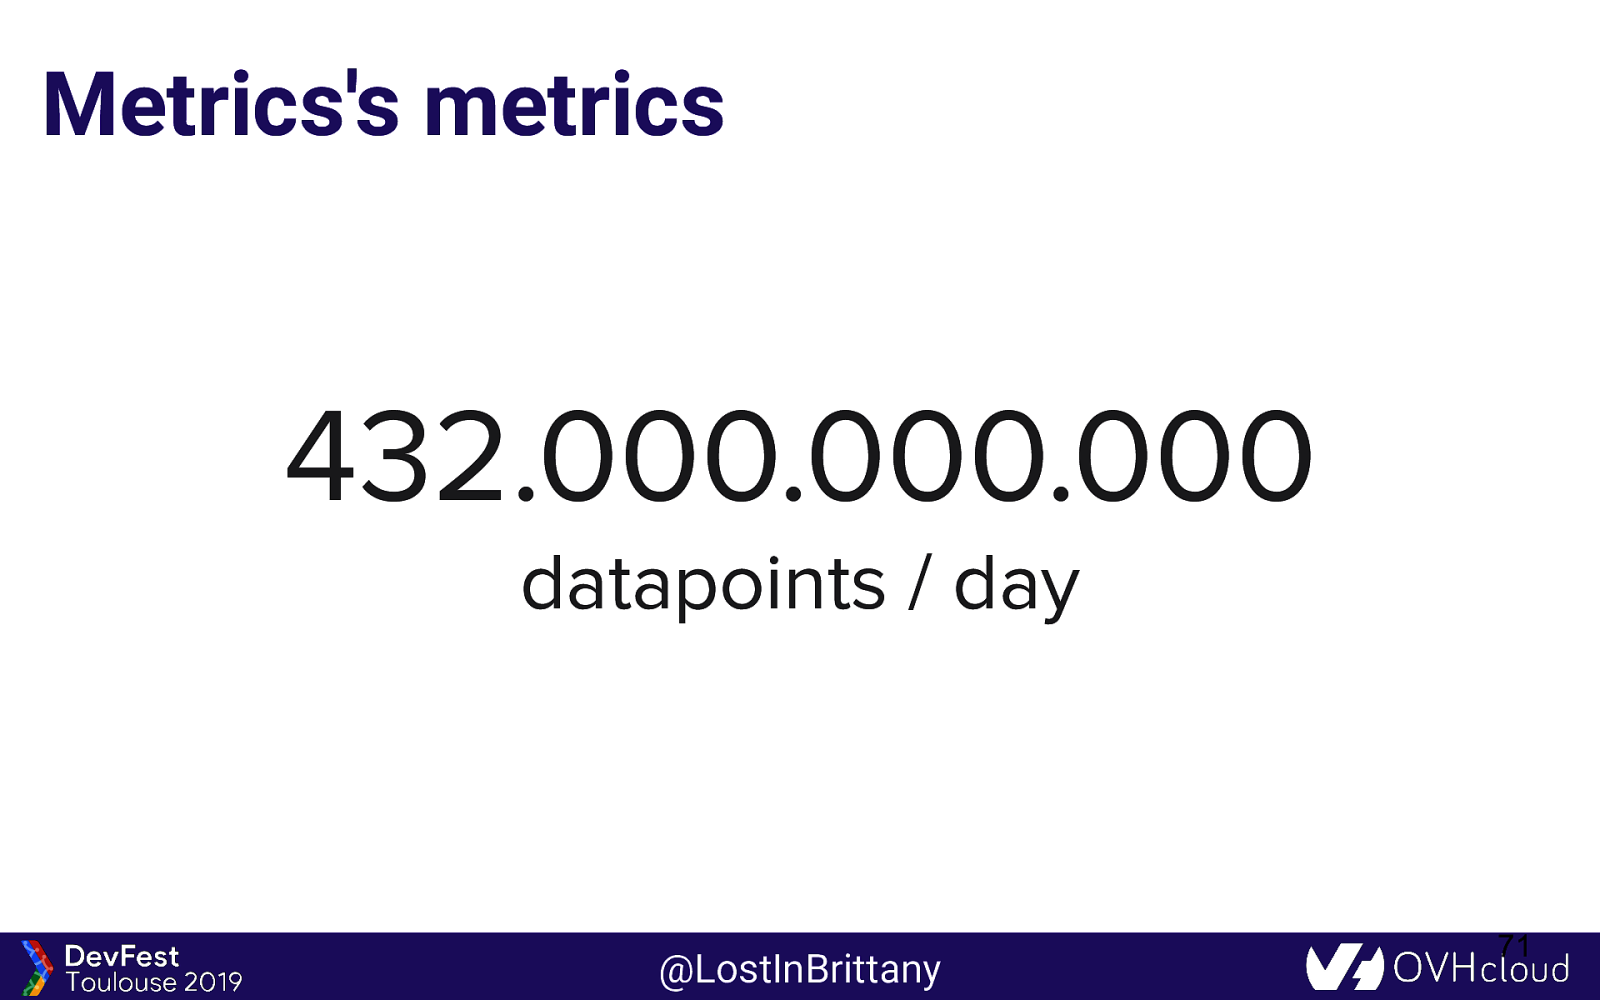
Metrics’s metrics 432.000.000.000 datapoints / day @LostInBrittany 71
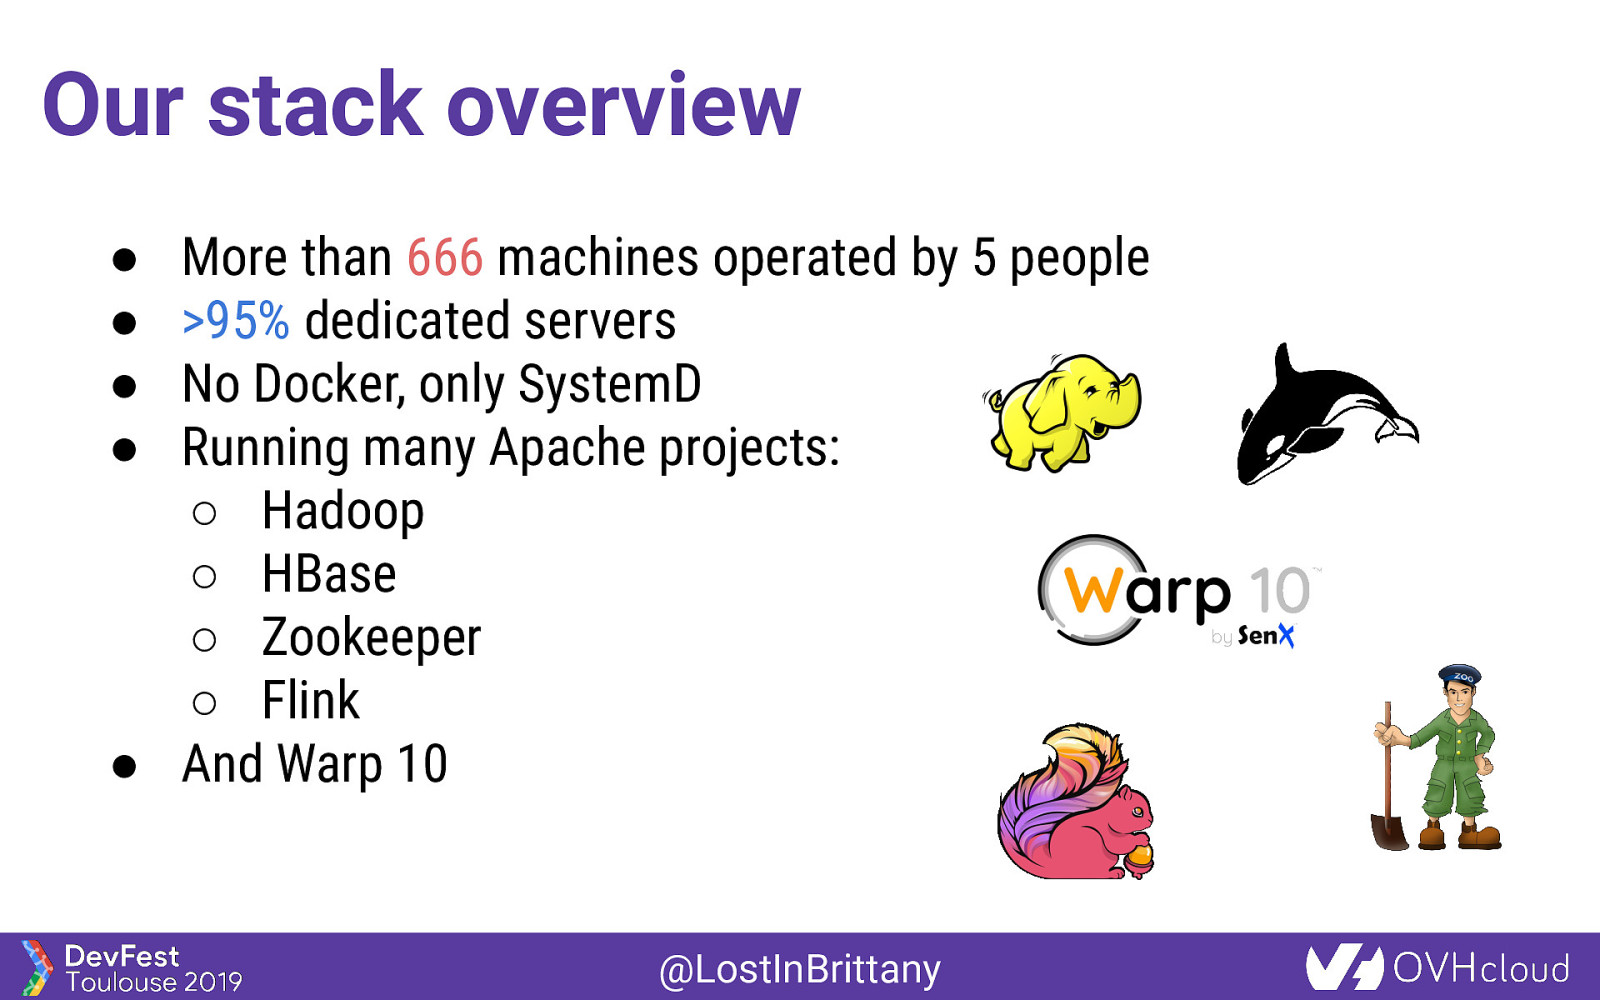
Our stack overview More than 666 machines operated by 5 people >95% dedicated servers No Docker, only SystemD Running many Apache projects: ○ Hadoop ○ HBase ○ Zookeeper ○ Flink ● And Warp 10 ● ● ● ● @LostInBrittany
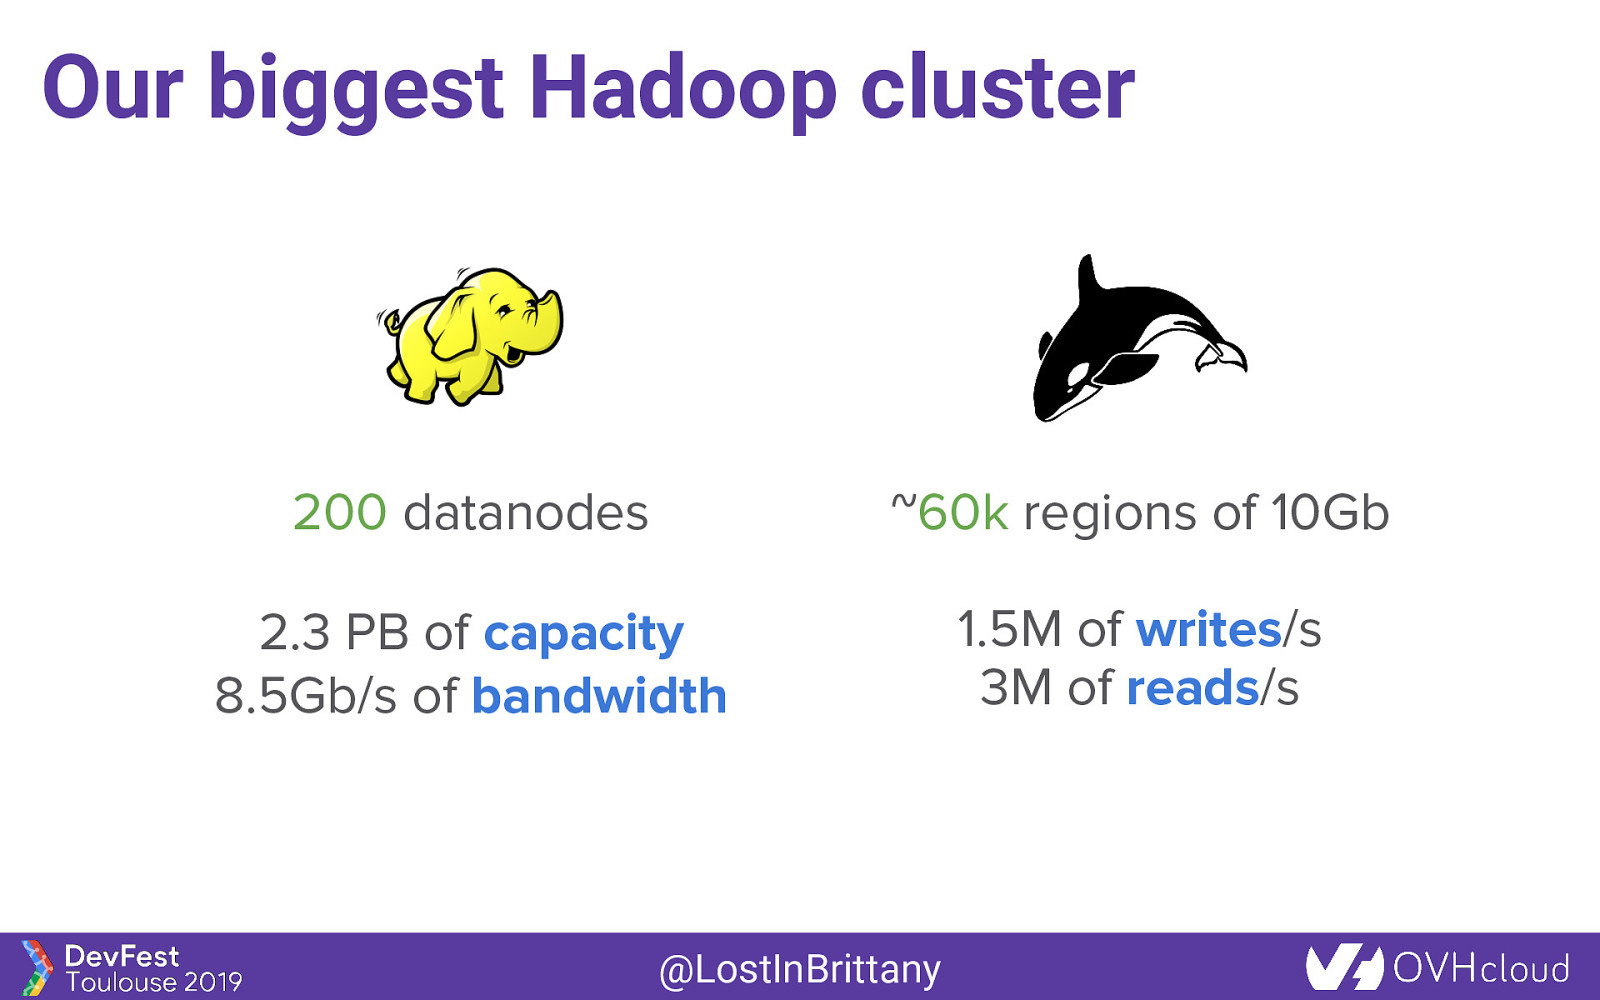
Our biggest Hadoop cluster 200 datanodes ~60k regions of 10Gb 2.3 PB of capacity 8.5Gb/s of bandwidth 1.5M of writes/s 3M of reads/s @LostInBrittany

Hadoop need a lot of @LostInBrittany
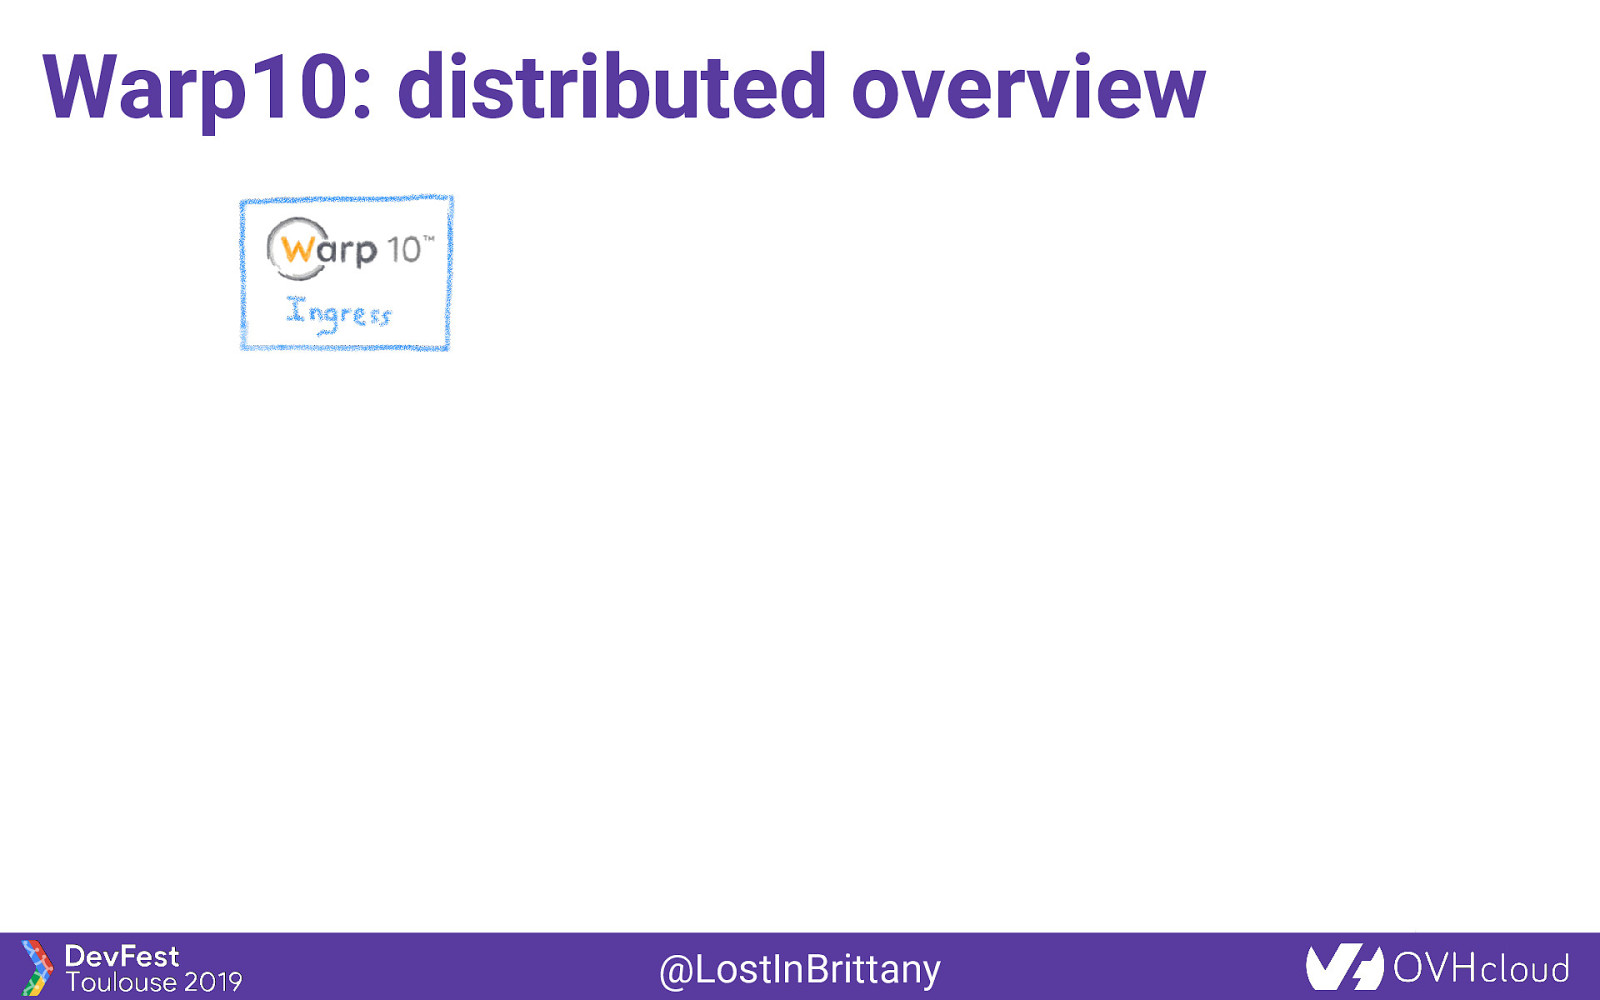
Warp10: distributed overview @LostInBrittany
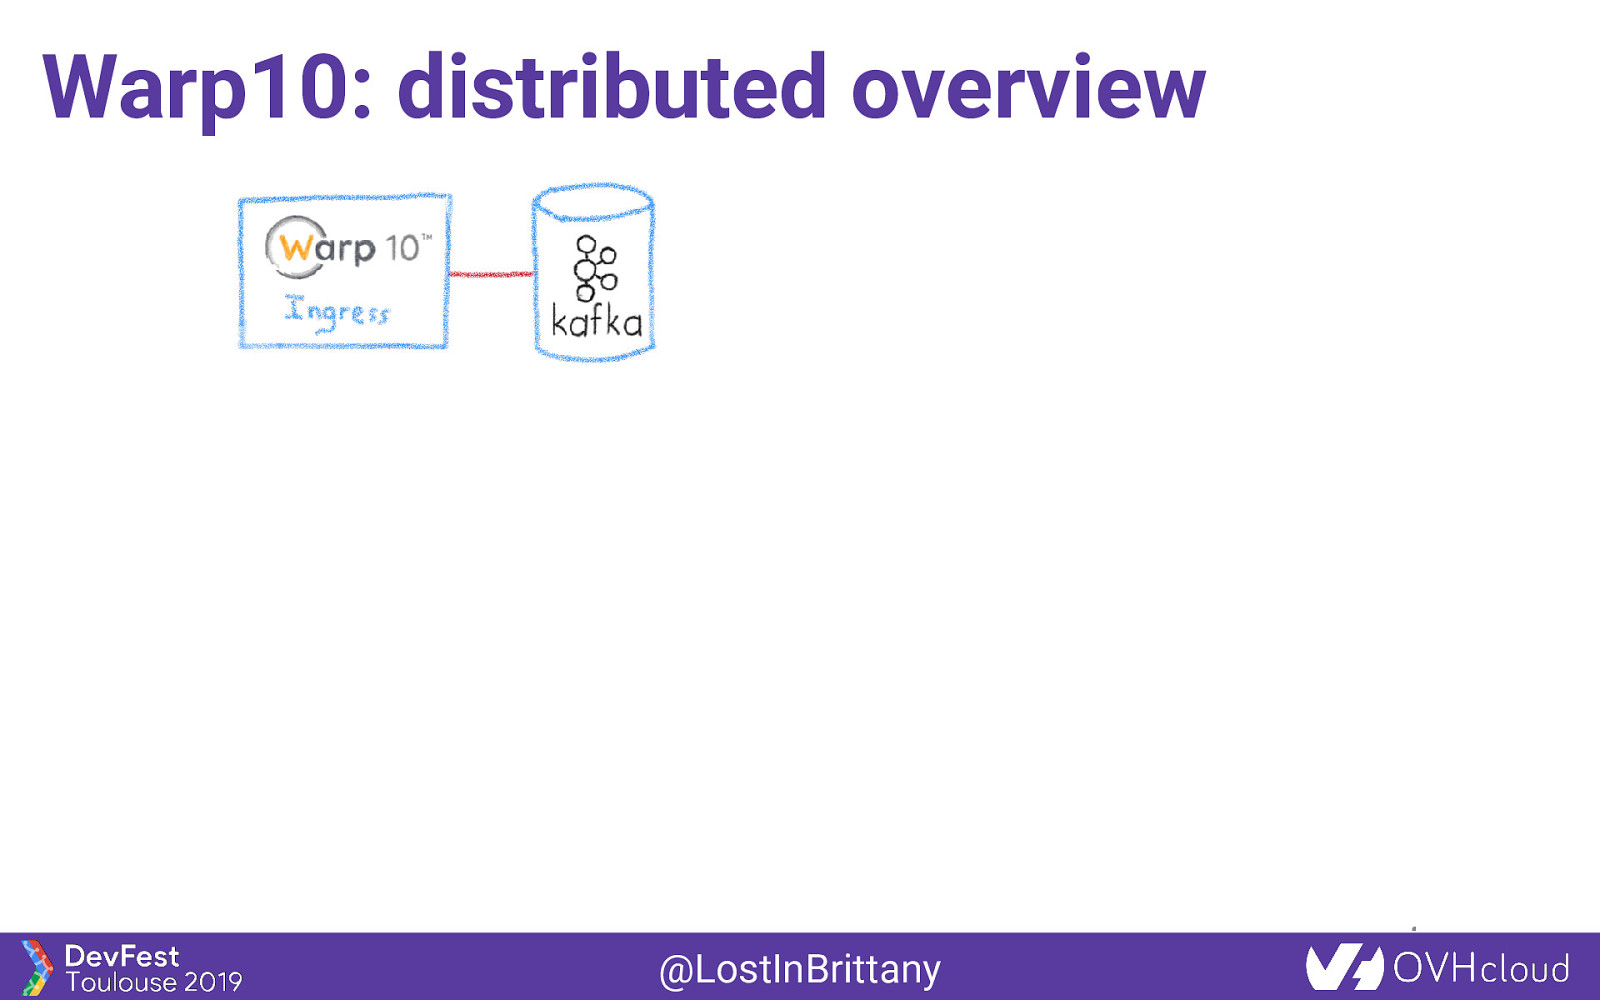
Warp10: distributed overview @LostInBrittany
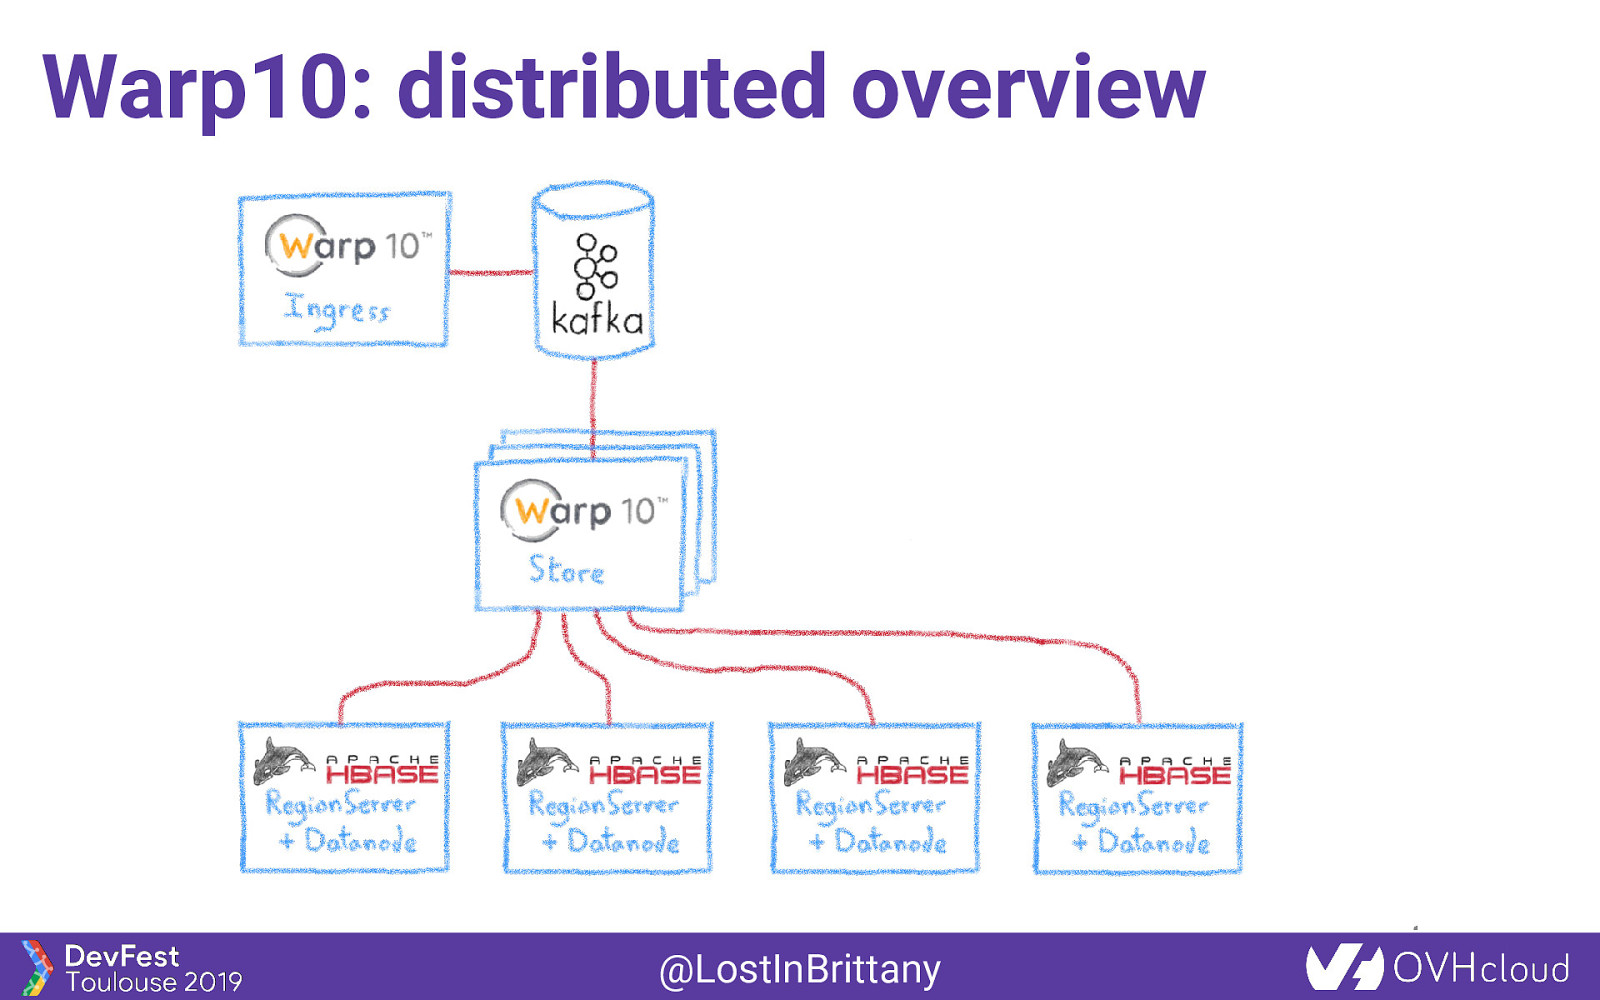
Warp10: distributed overview @LostInBrittany
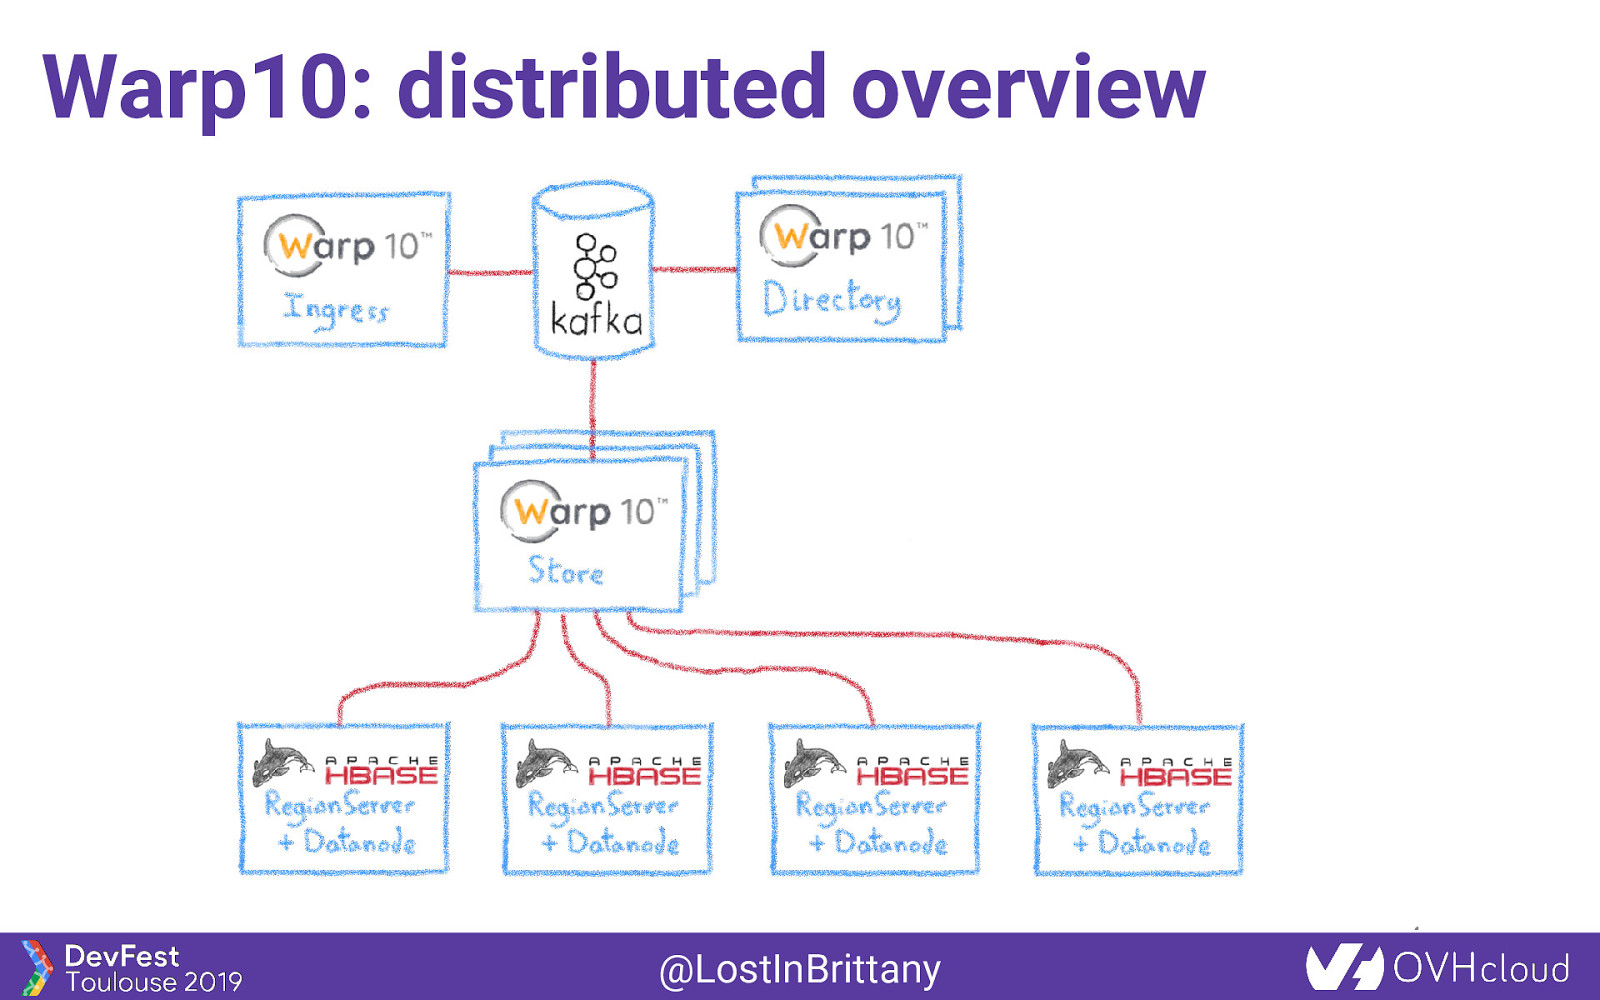
Warp10: distributed overview @LostInBrittany
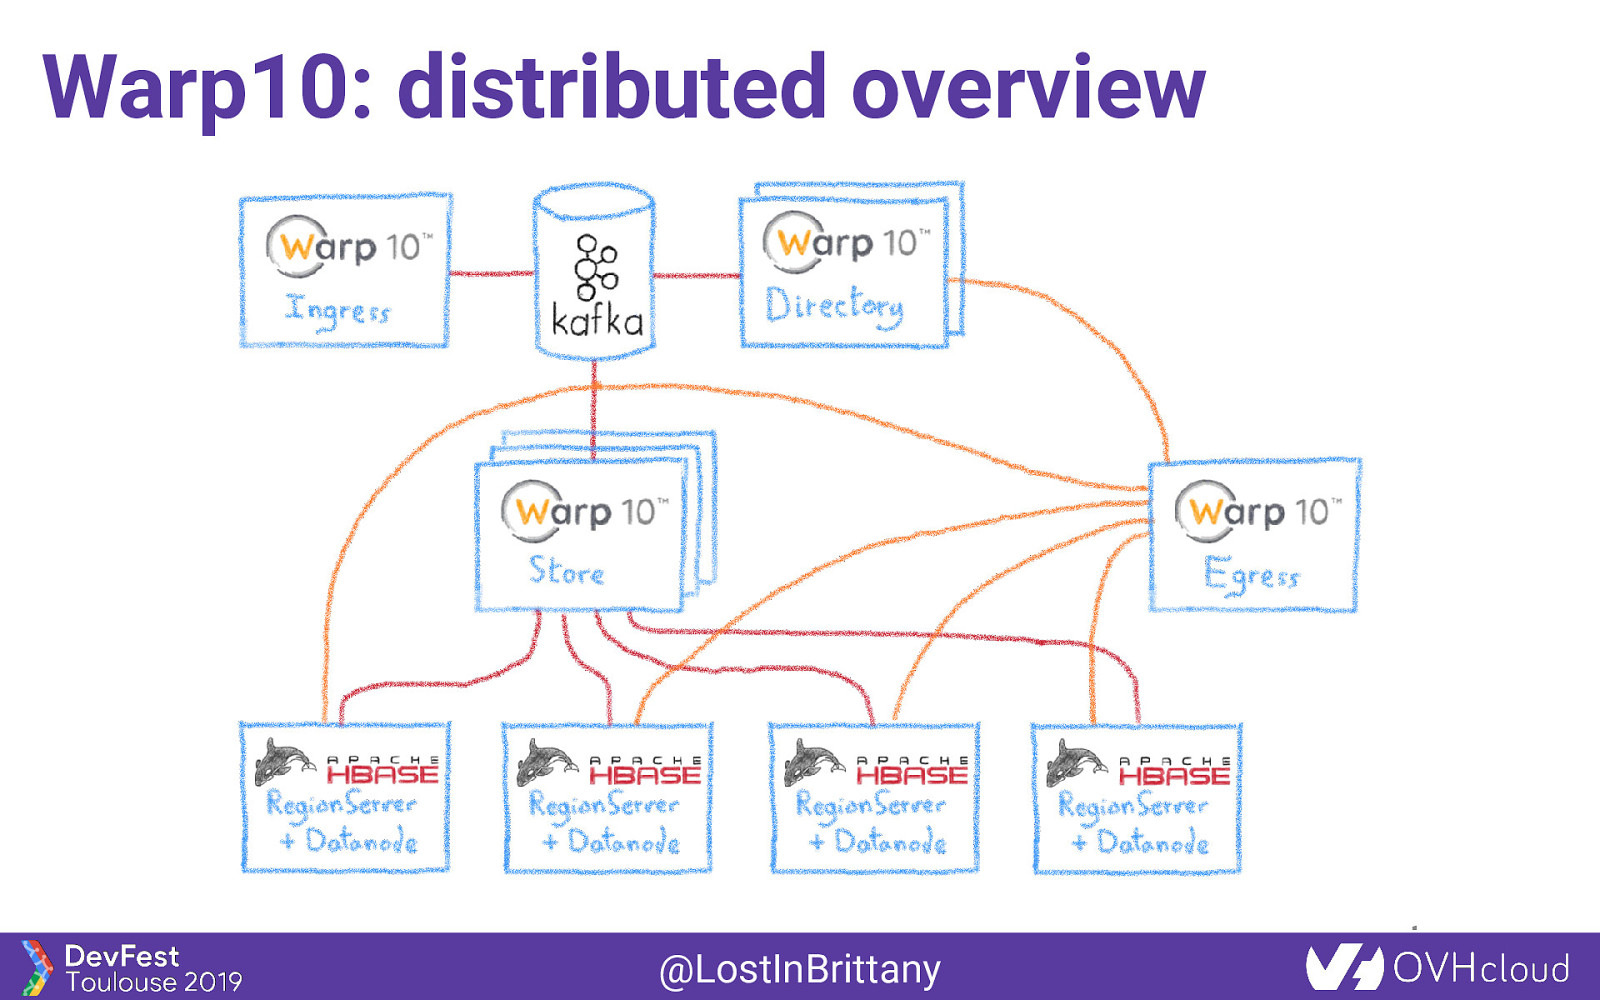
Warp10: distributed overview @LostInBrittany
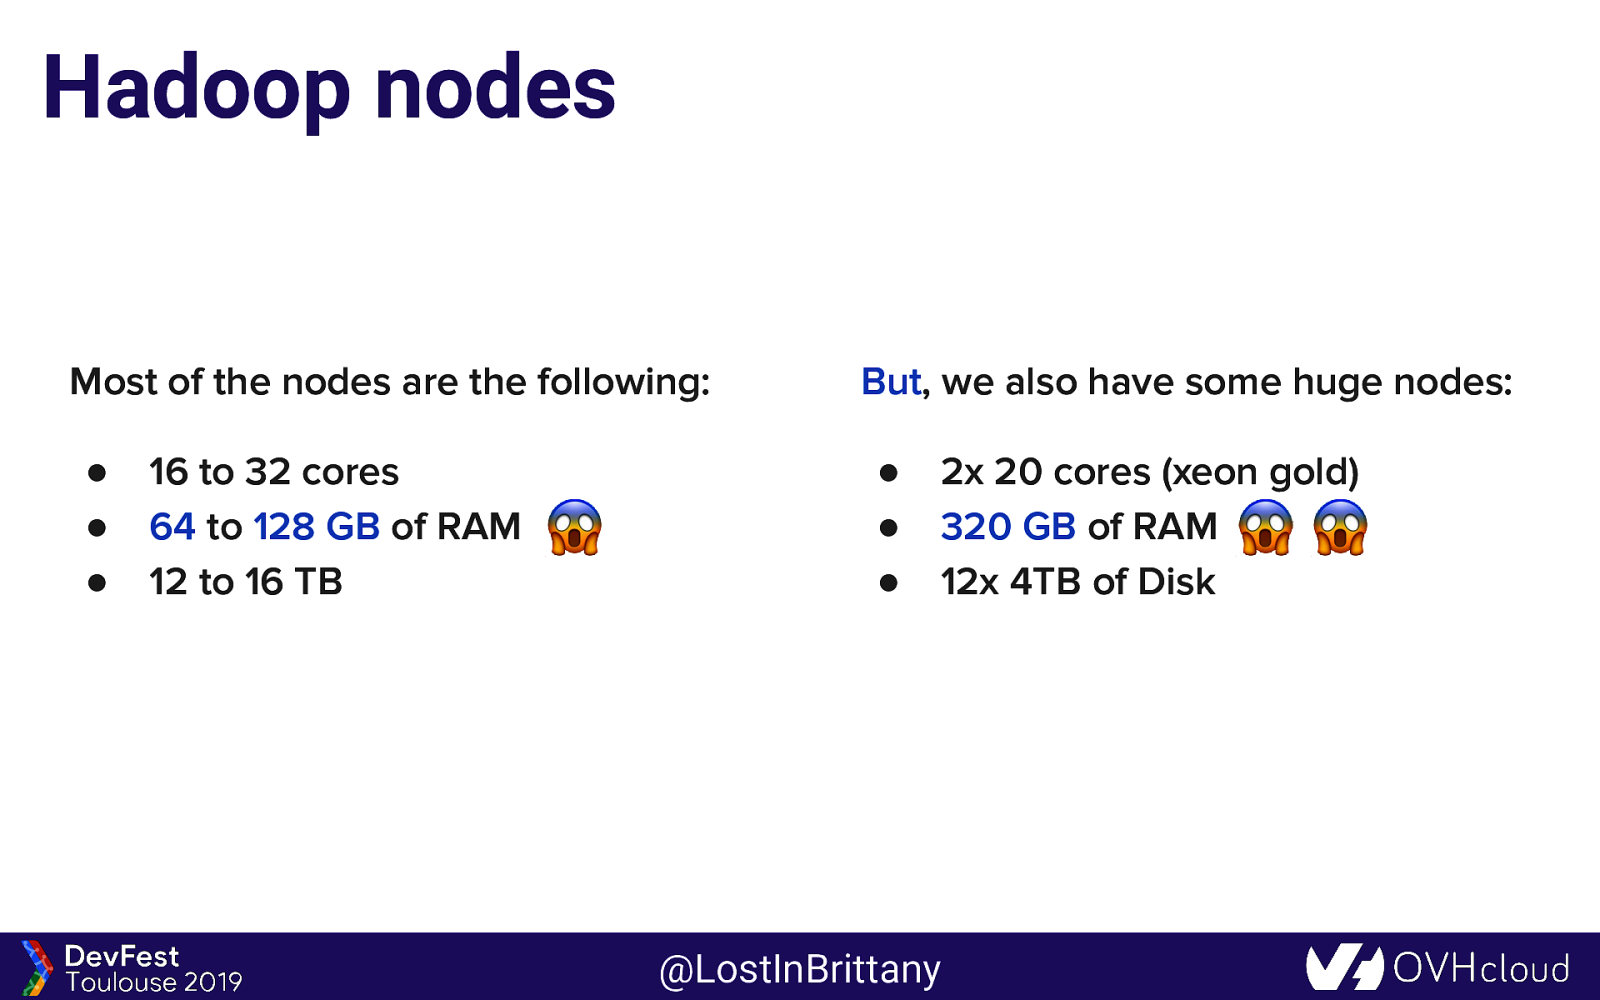
Hadoop nodes Most of the nodes are the following: ● ● ● 16 to 32 cores 64 to 128 GB of RAM 12 to 16 TB But, we also have some huge nodes: ● ● ● 2x 20 cores (xeon gold) 320 GB of RAM 12x 4TB of Disk @LostInBrittany
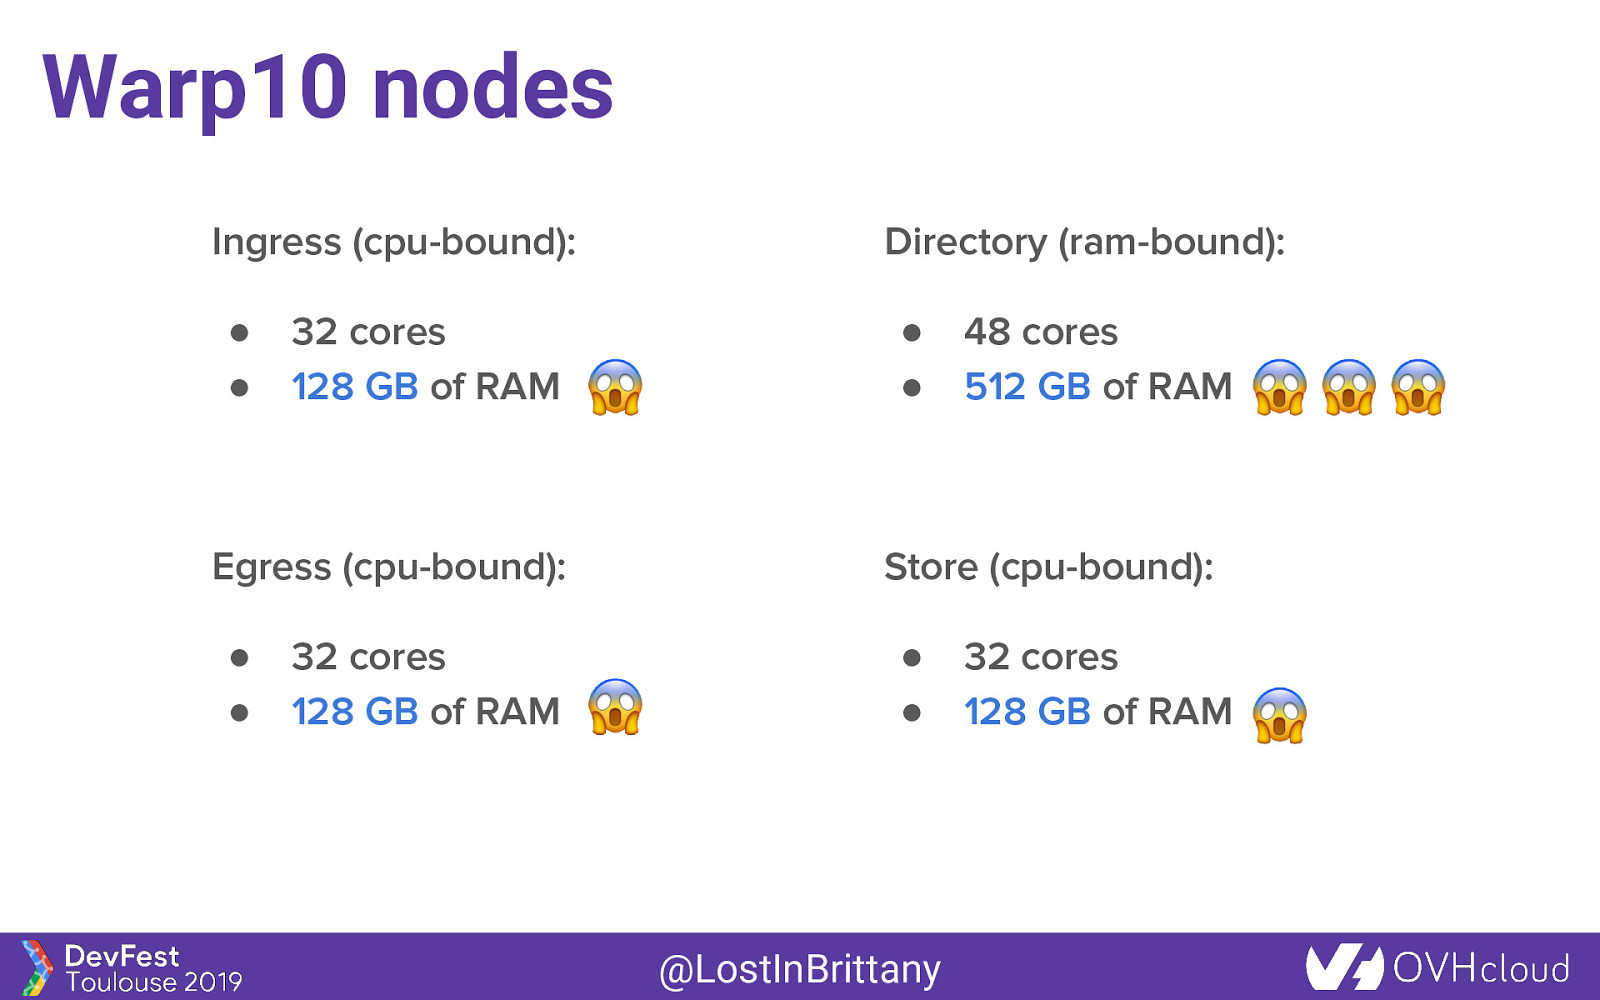
Warp10 nodes Ingress (cpu-bound): ● ● 32 cores 128 GB of RAM Egress (cpu-bound): ● ● 32 cores 128 GB of RAM Directory (ram-bound): ● ● 48 cores 512 GB of RAM Store (cpu-bound): ● ● @LostInBrittany 32 cores 128 GB of RAM
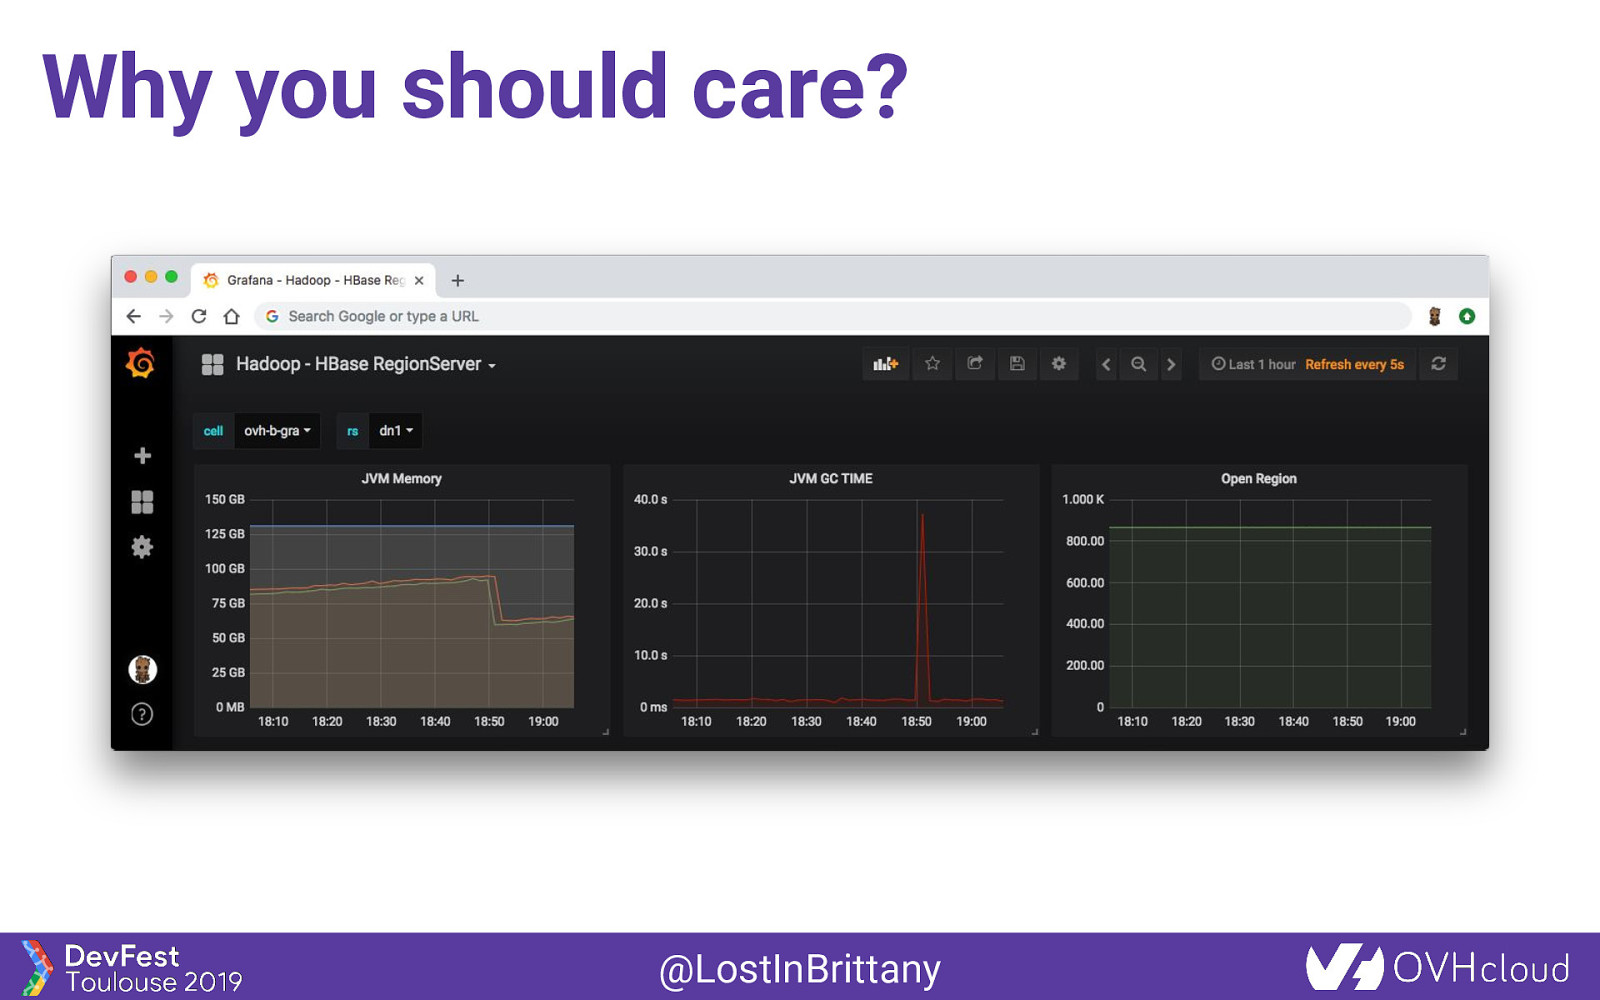
Why you should care? @LostInBrittany
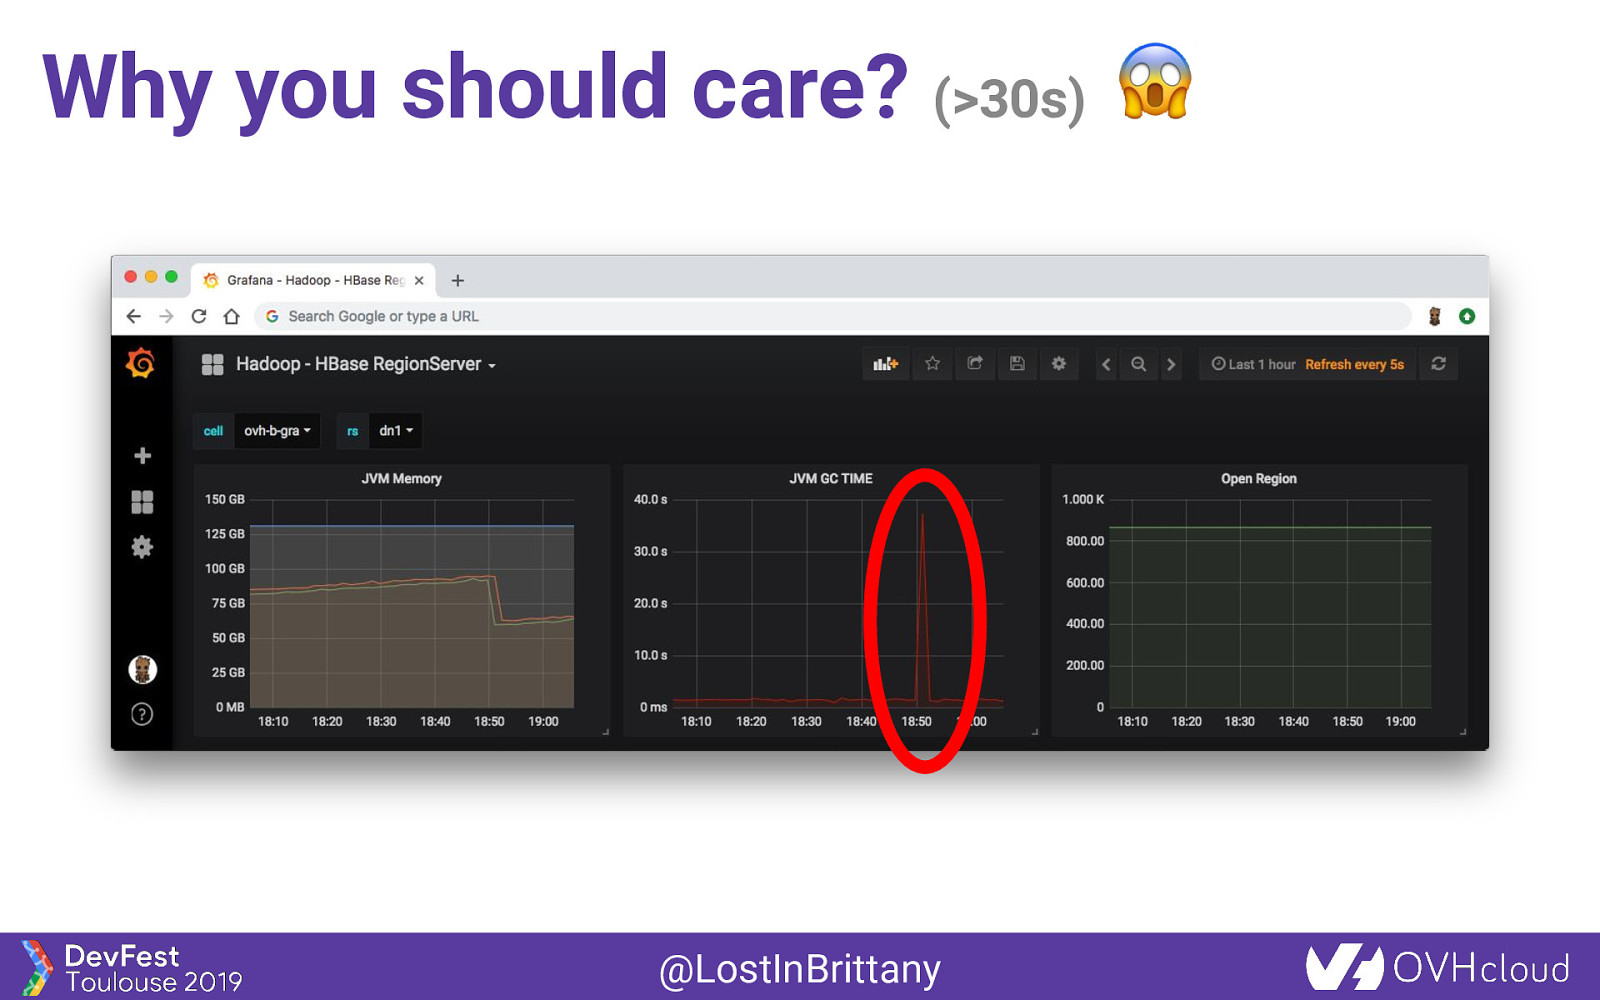
Why you should care? (>30s) @LostInBrittany
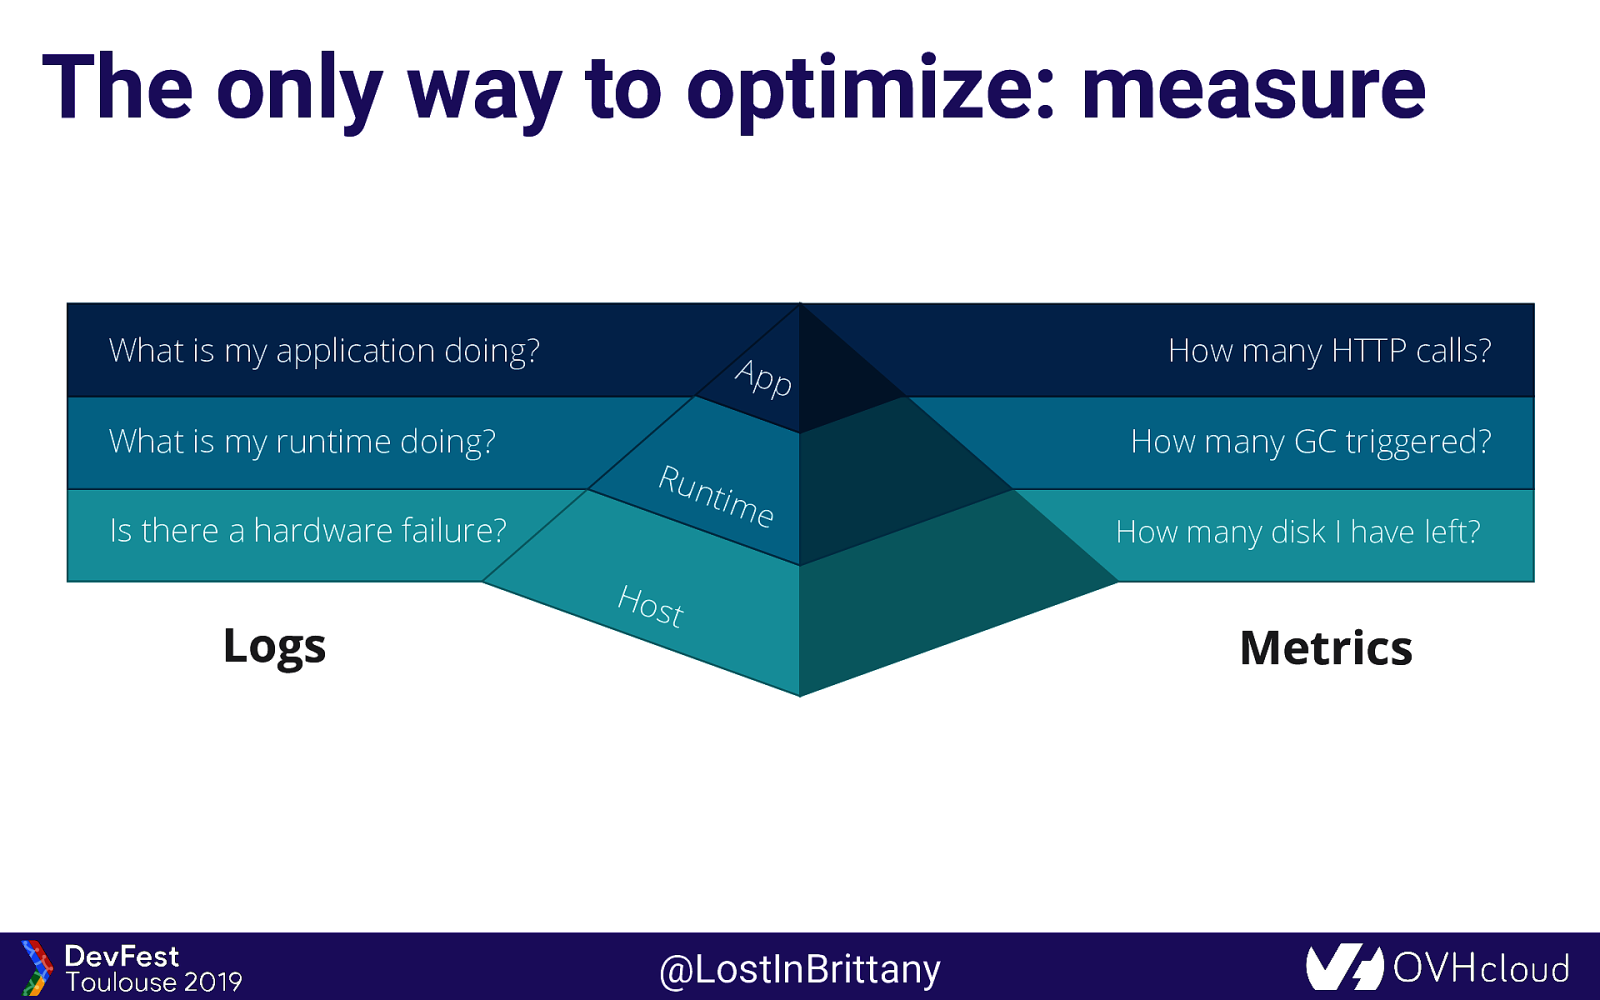
The only way to optimize: measure What is my application doing? App What is my runtime doing? How many GC triggered? Run tim Is there a hardware failure? Logs How many HTTP calls? e Hos t @LostInBrittany How many disk I have left? Metrics
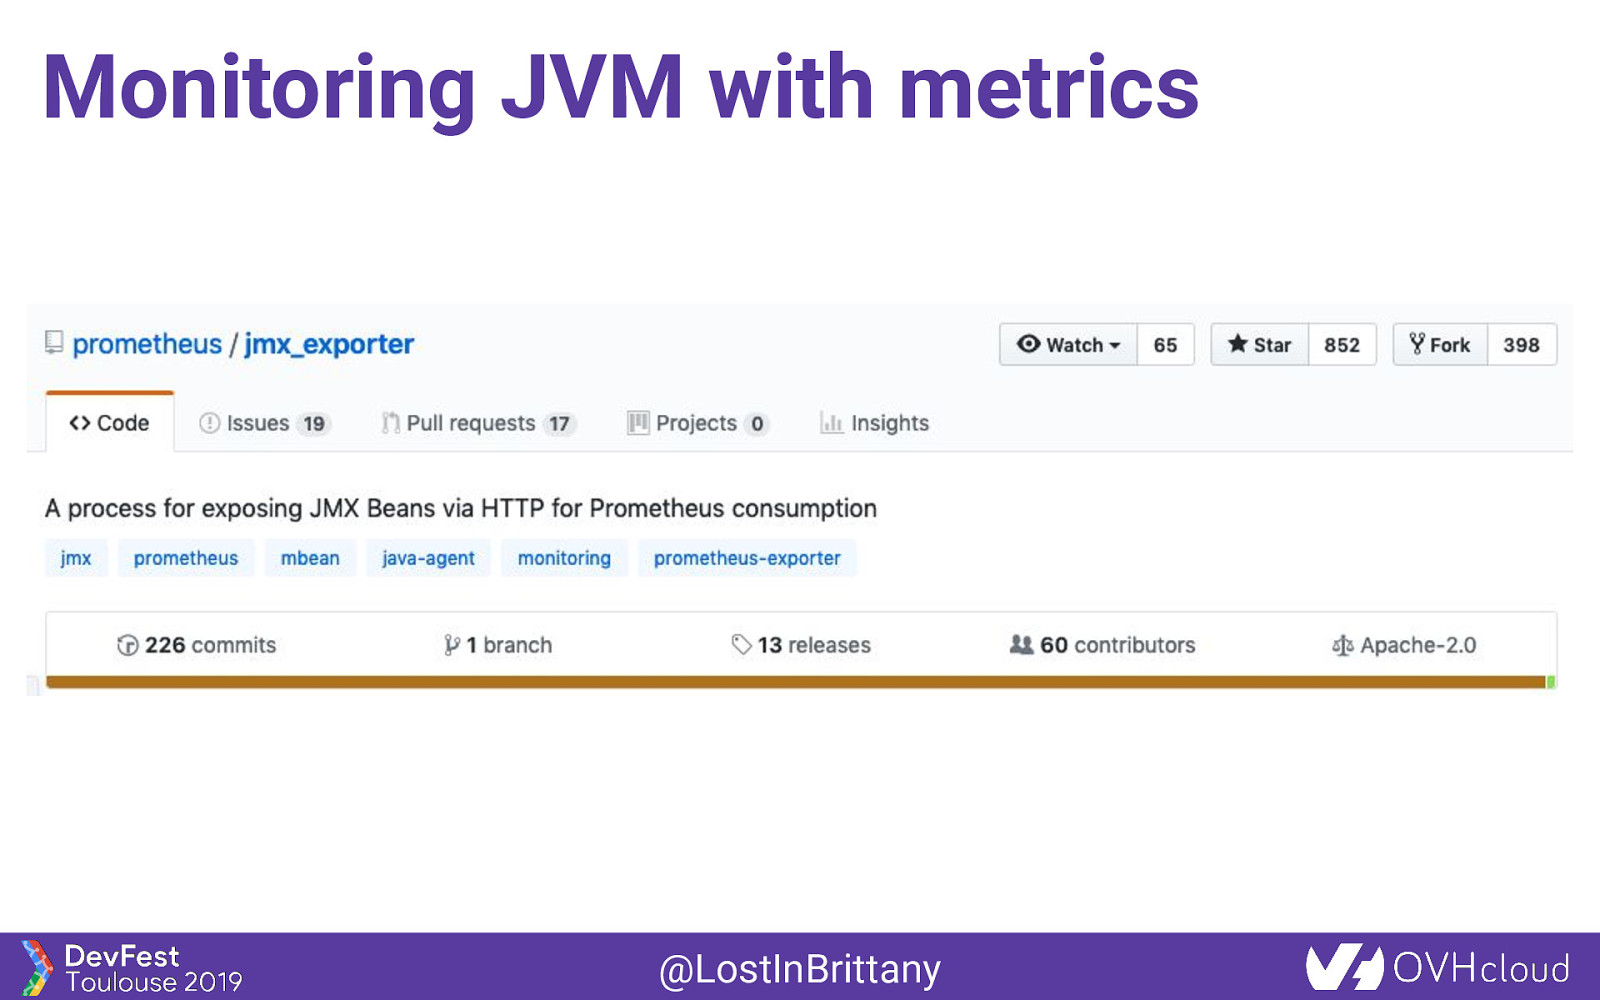
Monitoring JVM with metrics @LostInBrittany
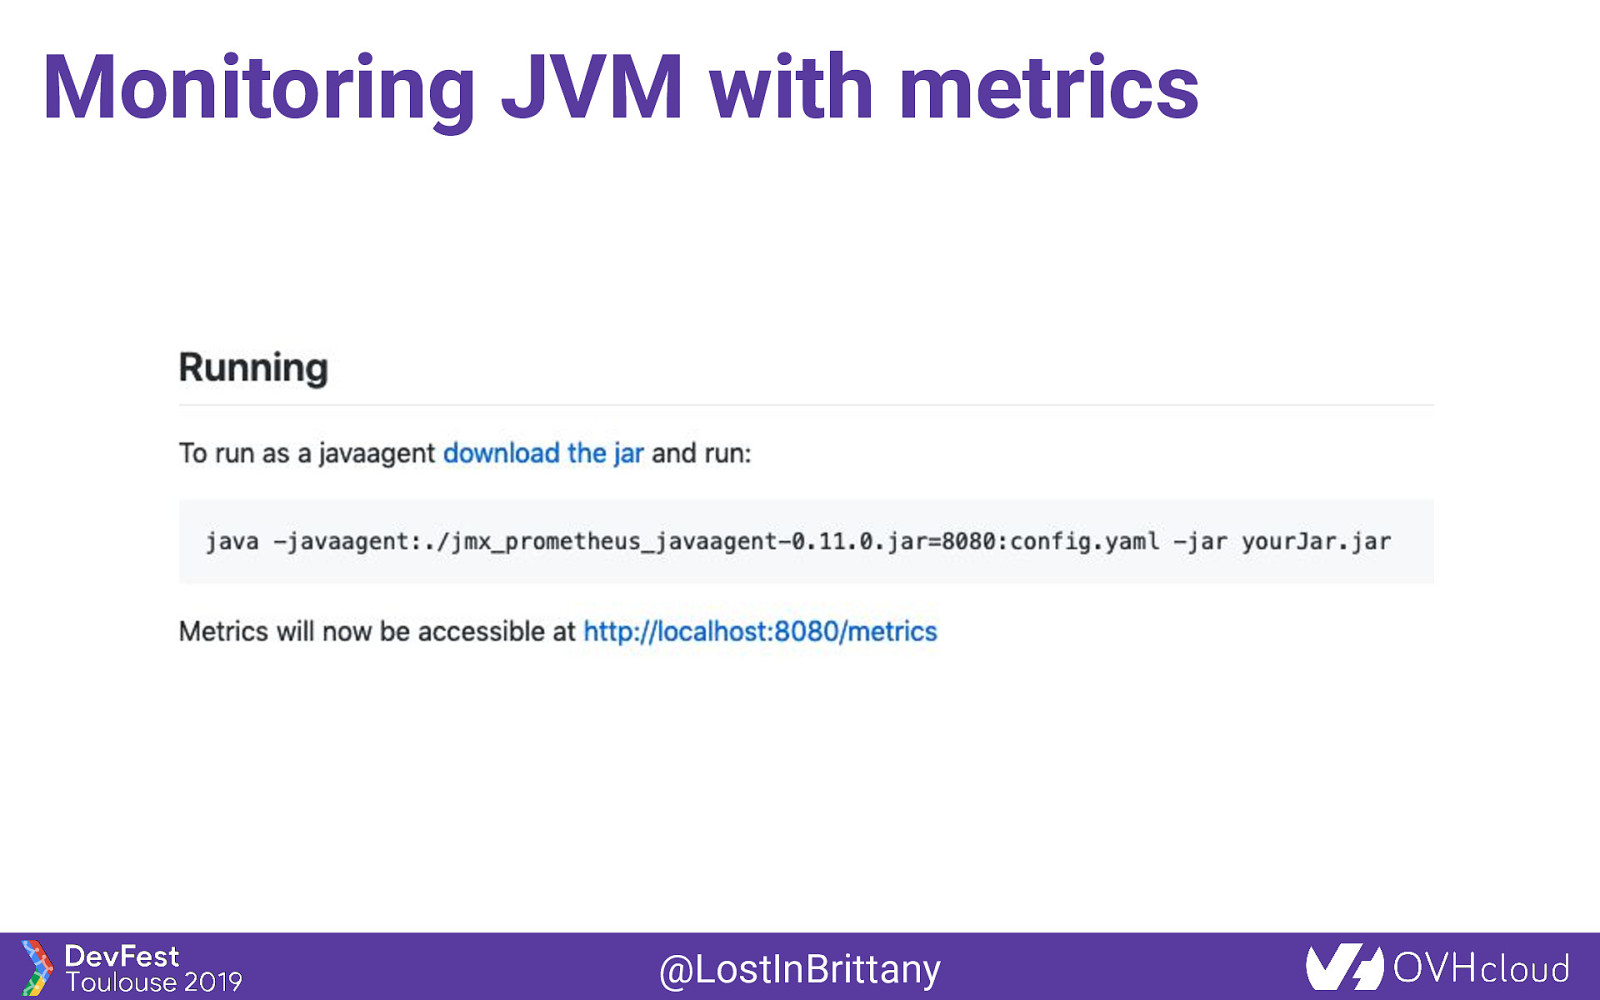
Monitoring JVM with metrics @LostInBrittany
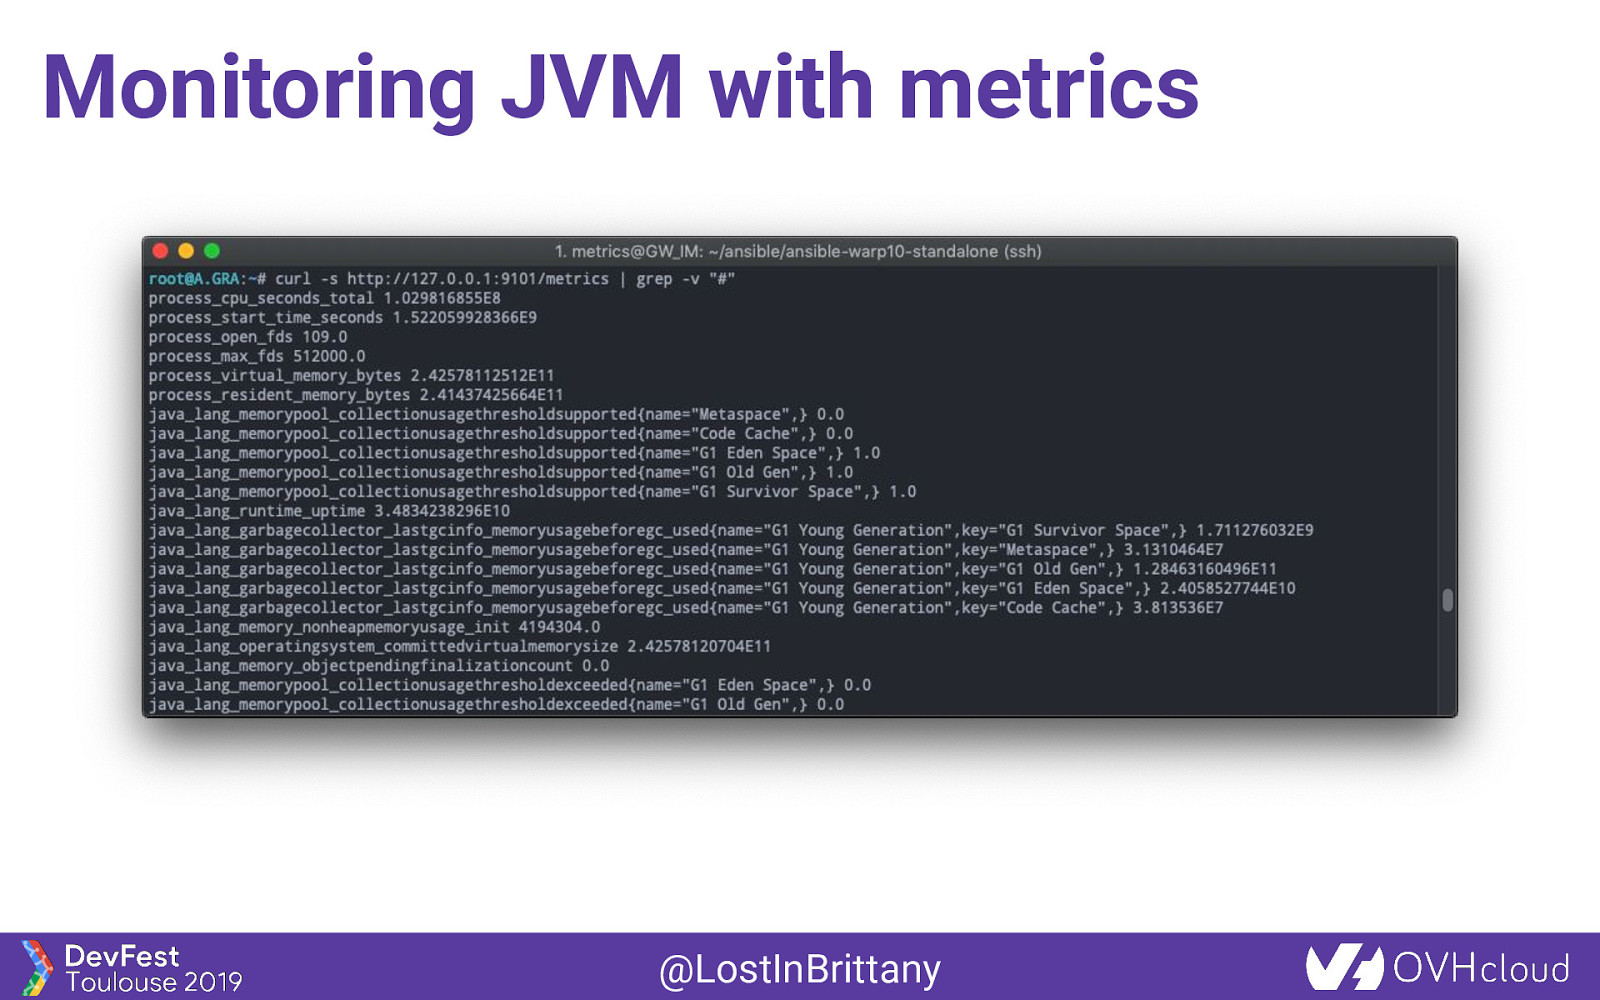
Monitoring JVM with metrics @LostInBrittany
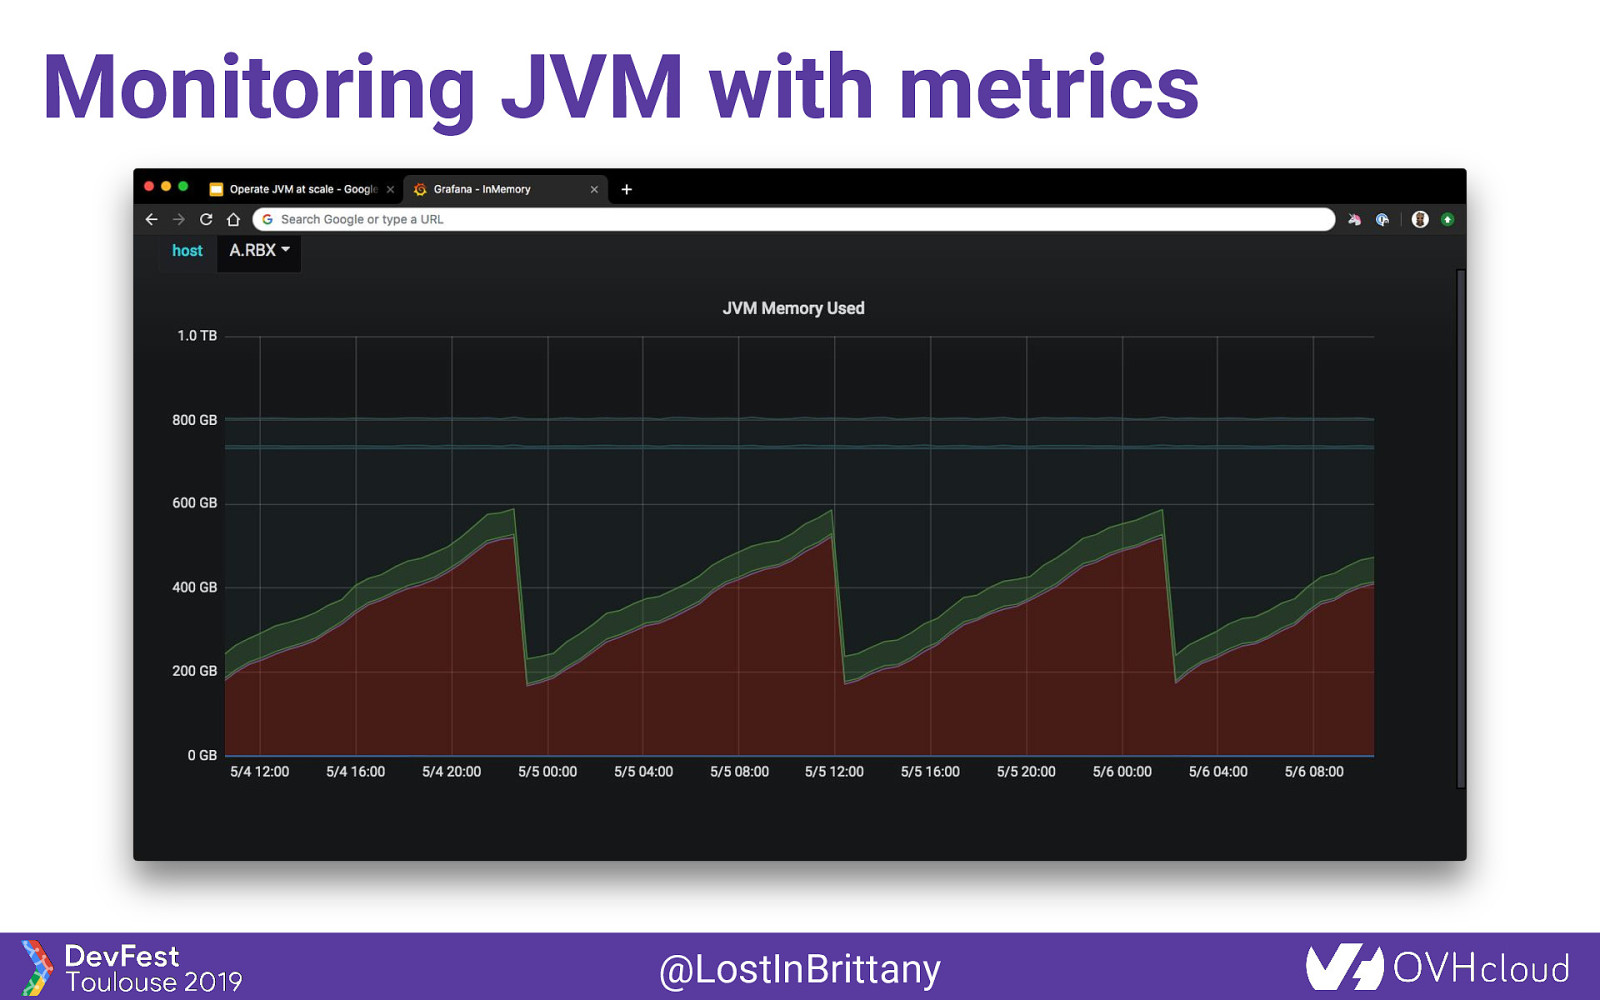
Monitoring JVM with metrics @LostInBrittany
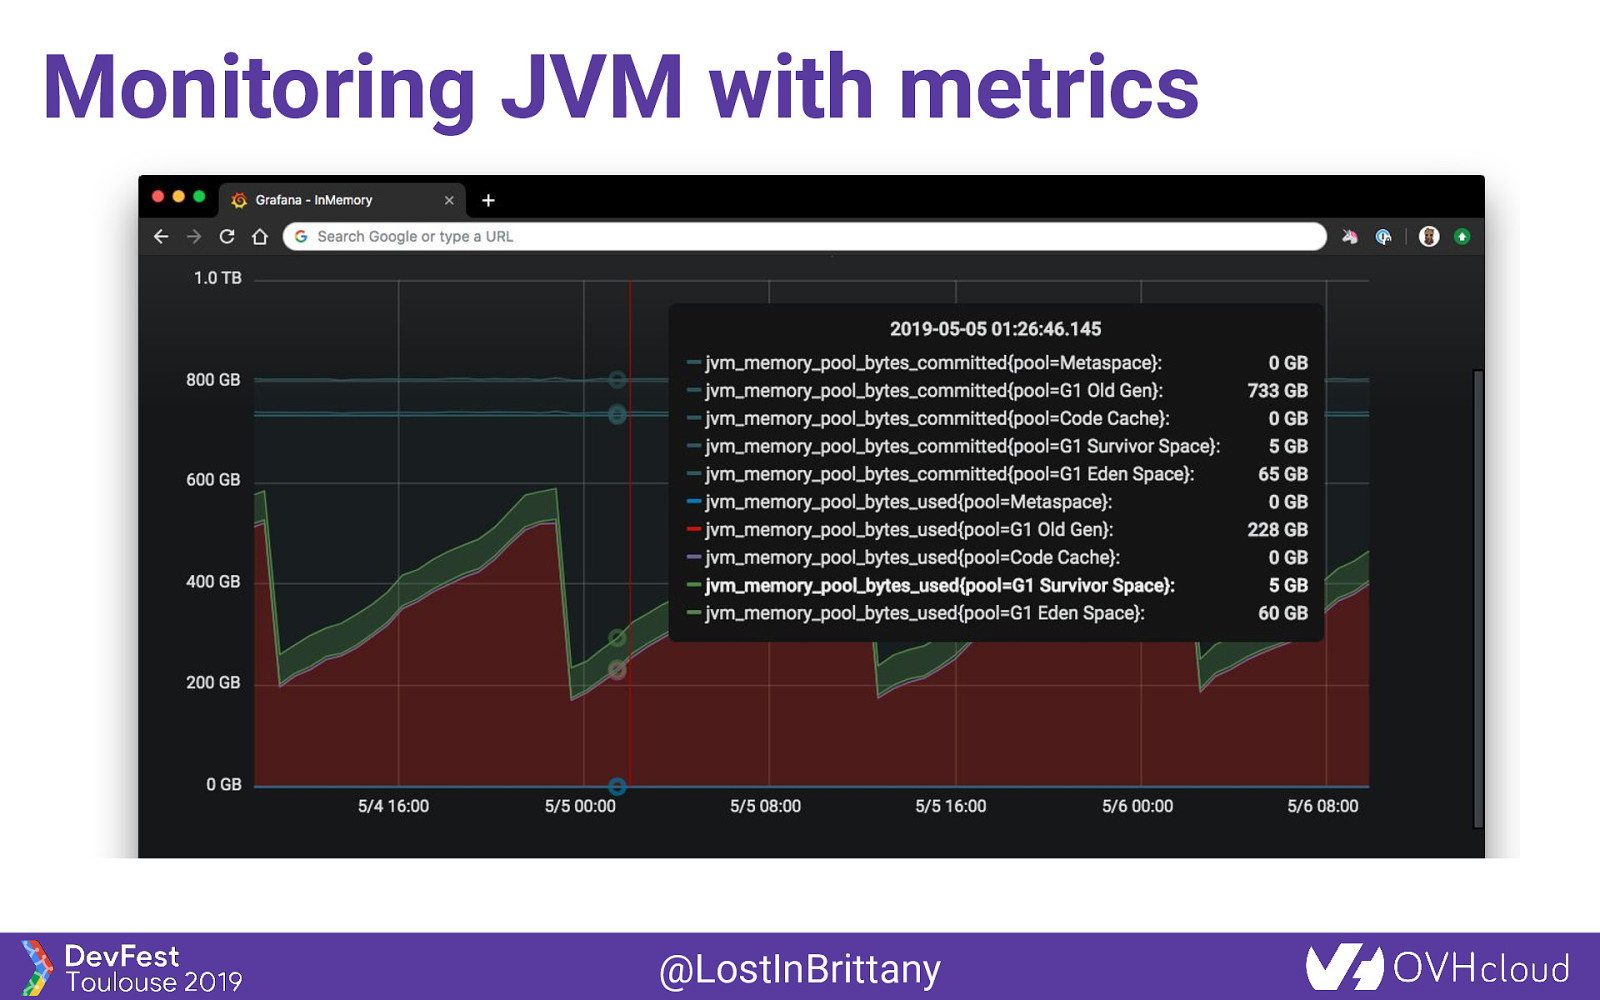
Monitoring JVM with metrics @LostInBrittany
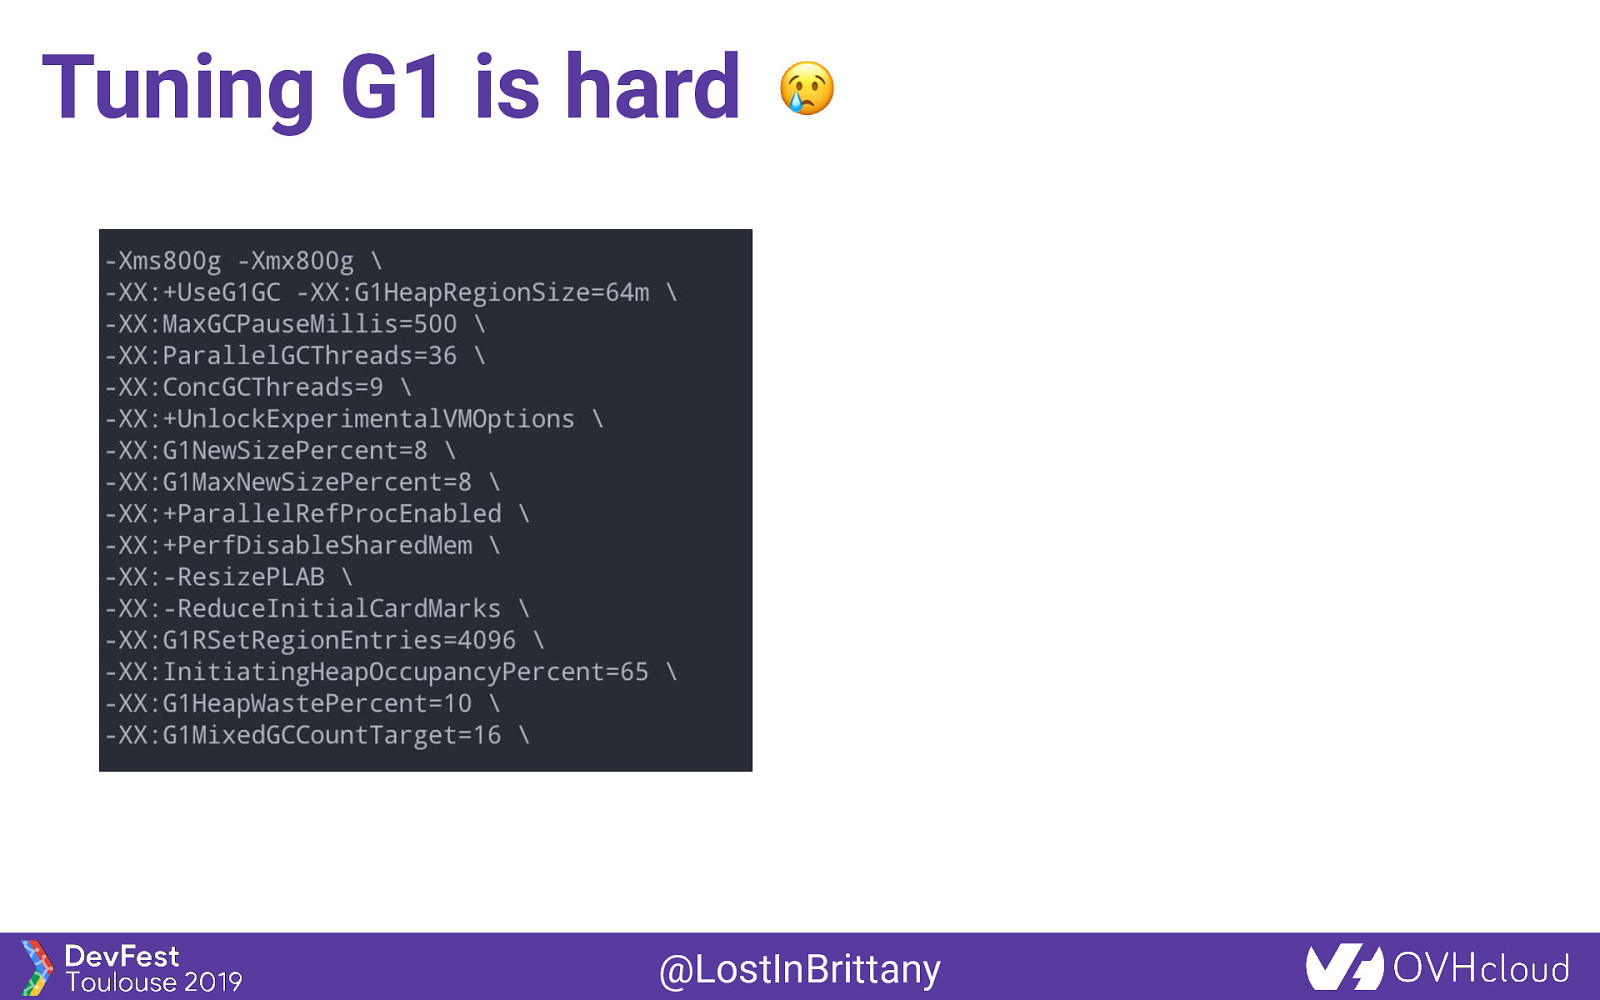
Tuning G1 is hard @LostInBrittany
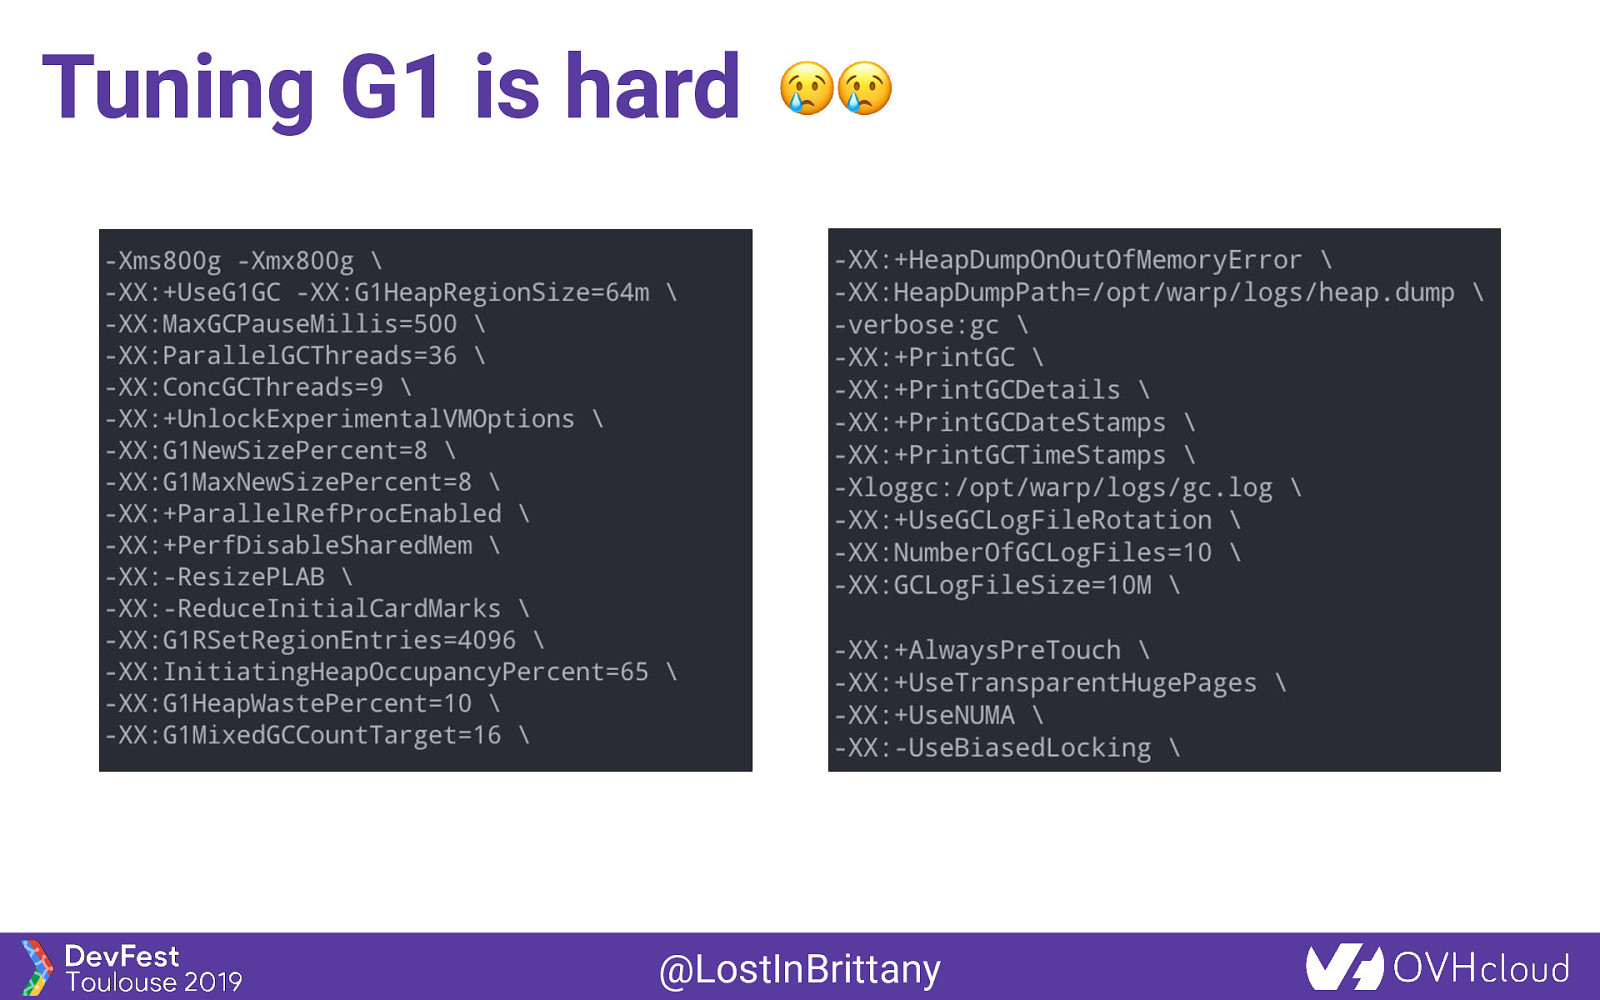
Tuning G1 is hard @LostInBrittany
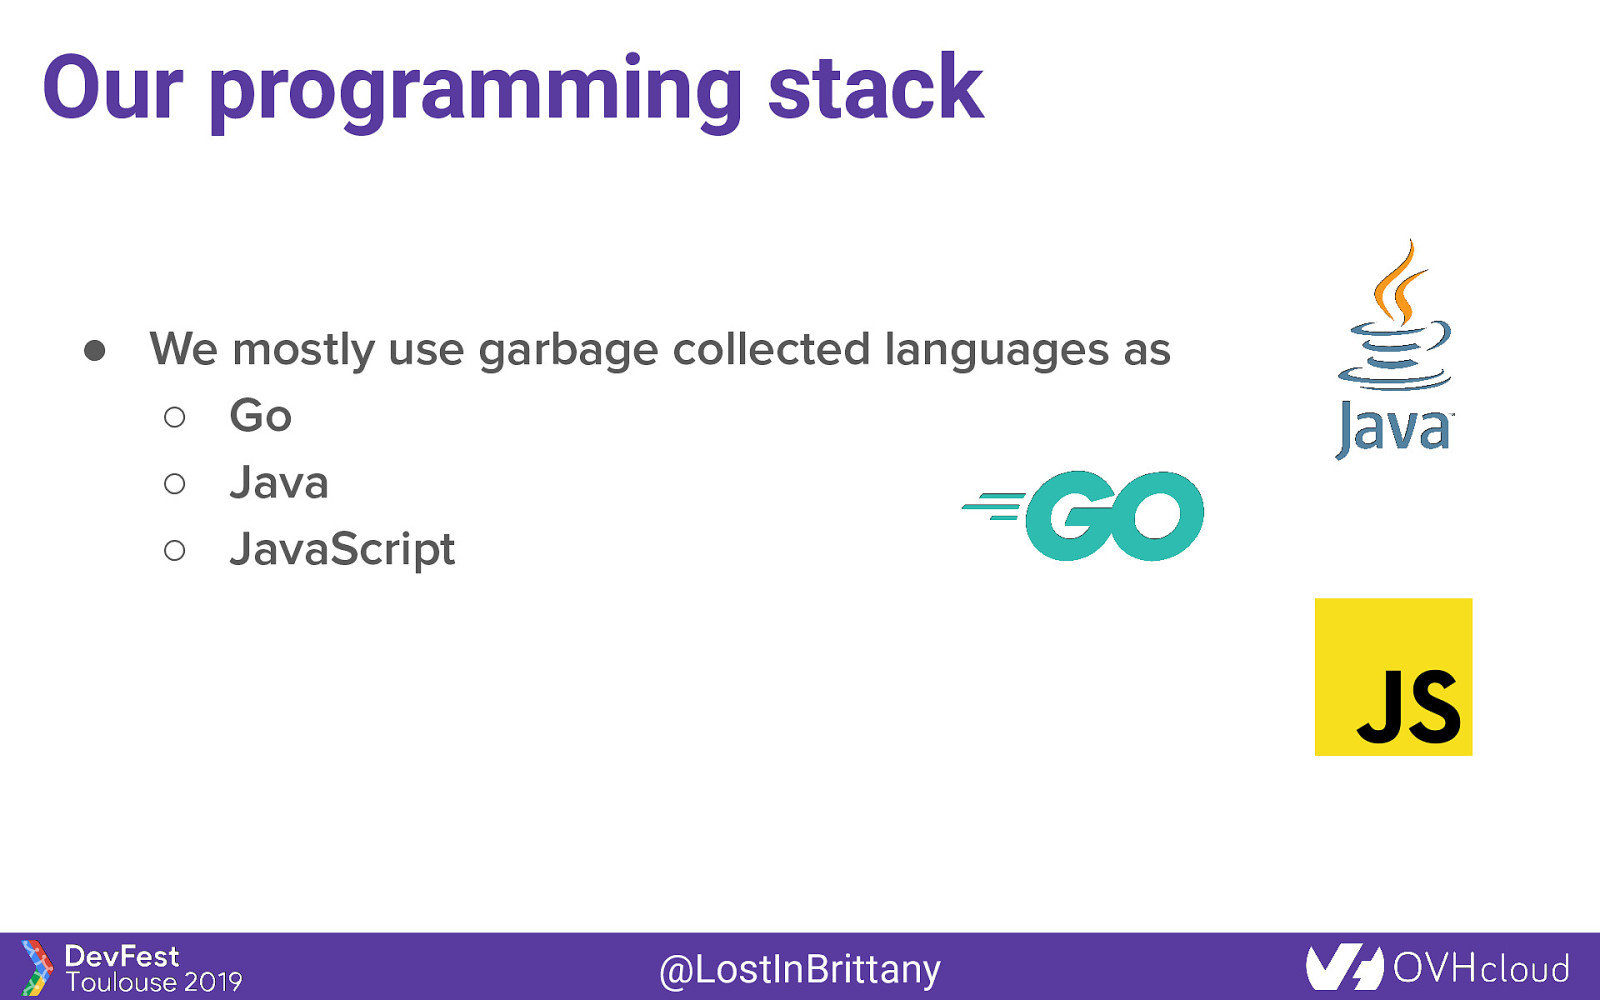
Our programming stack ● We mostly use garbage collected languages as ○ Go ○ Java ○ JavaScript @LostInBrittany
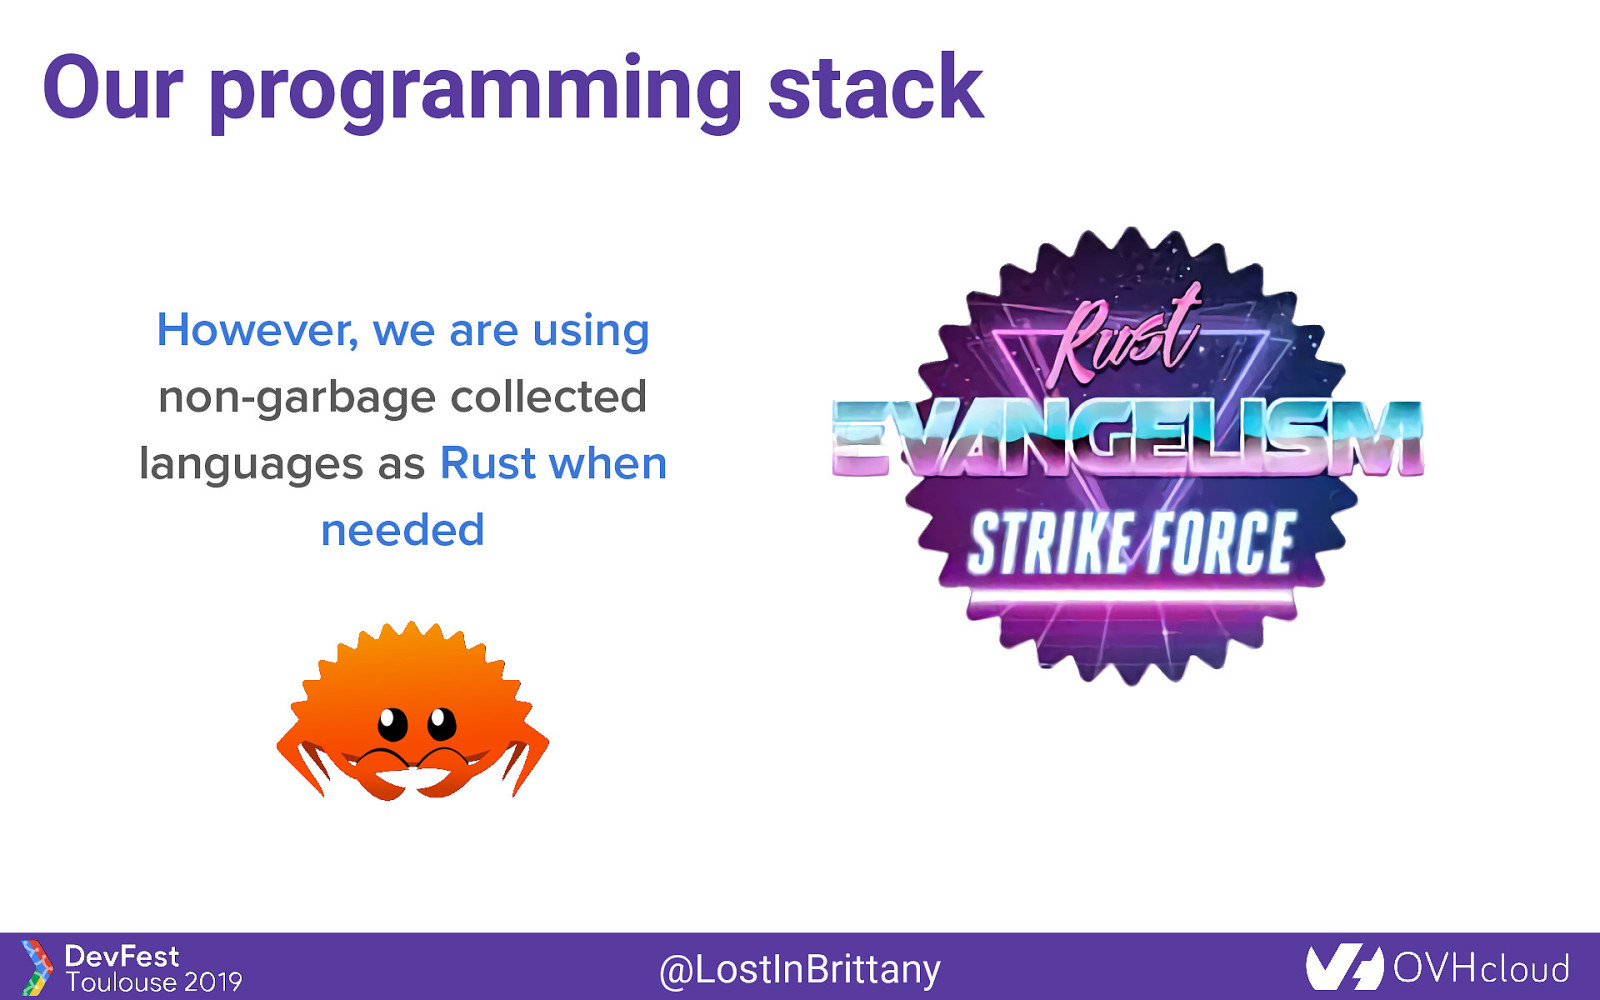
Our programming stack However, we are using non-garbage collected languages as Rust when needed @LostInBrittany
Our friends for µservices @LostInBrittany
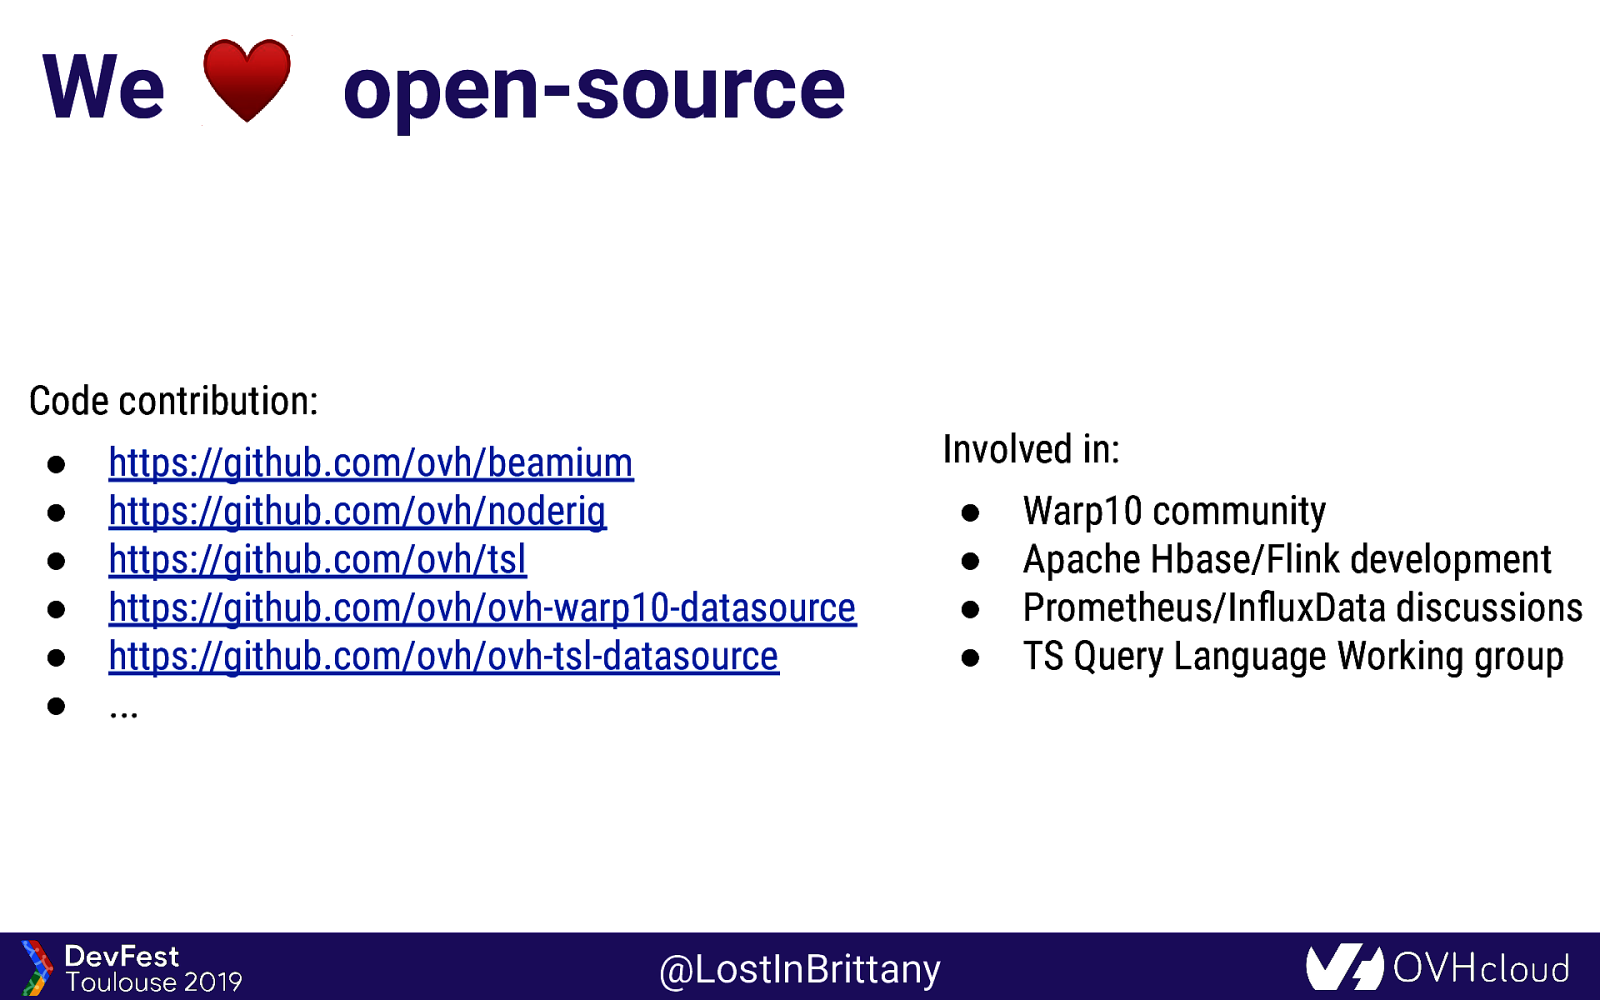
We open-source Code contribution: ● ● ● ● ● ● https://github.com/ovh/beamium https://github.com/ovh/noderig https://github.com/ovh/tsl https://github.com/ovh/ovh-warp10-datasource https://github.com/ovh/ovh-tsl-datasource … @LostInBrittany Involved in: ● ● ● ● Warp10 community Apache Hbase/Flink development Prometheus/InfluxData discussions TS Query Language Working group
Conclusion That’s all folks! @LostInBrittany