Monitoring OVH: 350k servers, 30 DCs… and one Metrics platform Horacio Gonzalez @LostInBrittany

A presentation at GDG Le Mans in January 2020 in Le Mans, France by Horacio Gonzalez
Monitoring OVH: 350k servers, 30 DCs… and one Metrics platform Horacio Gonzalez @LostInBrittany
Who are we? Introducing myself and introducing OVH OVHcloud
Horacio Gonzalez @LostInBrittany Spaniard lost in Brittany, developer, dreamer and all-around geek Flutter
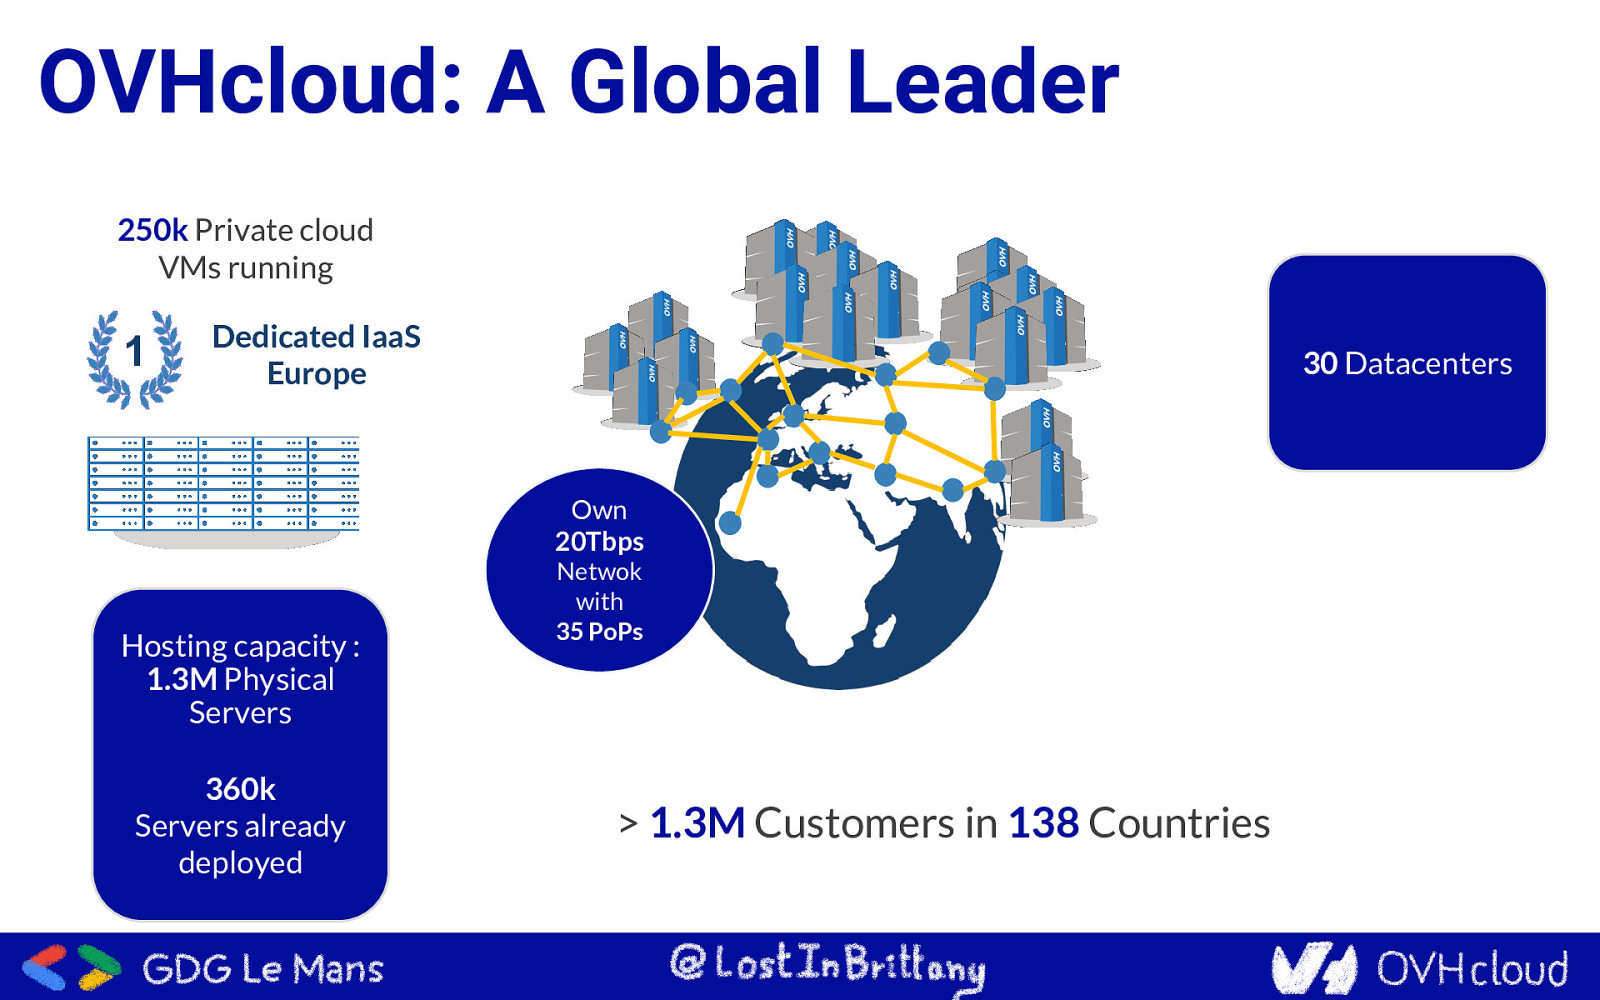
OVHcloud: A Global Leader 250k Private cloud VMs running 1 Dedicated IaaS Europe 30 Datacenters Own 20Tbps Hosting capacity : 1.3M Physical Servers 360k Servers already deployed Netwok with 35 PoPs
1.3M Customers in 138 Countries
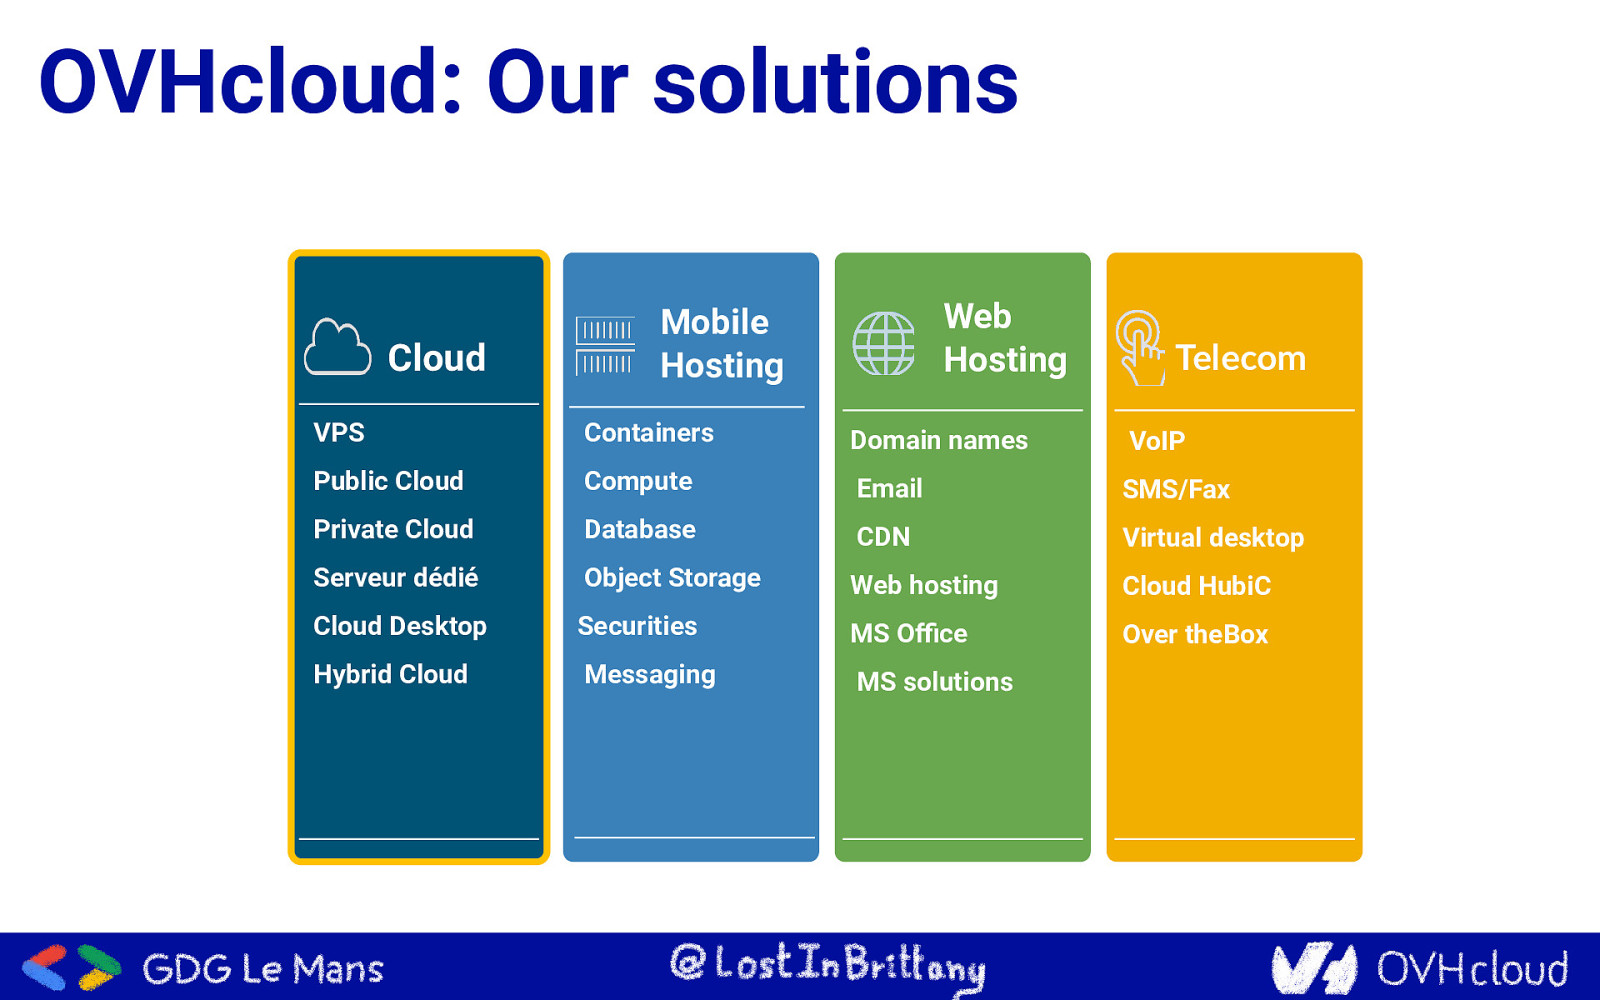
OVHcloud: Our solutions Cloud Web Hosting Mobile Hosting Telecom VPS Containers ▪ Dedicated Server Domain names VoIP Public Cloud Compute ▪ Data Storage Email SMS/Fax Private Cloud ▪ Network and Database CDN Virtual desktop Serveur dédié Security Object Storage Web hosting Cloud HubiC Over theBox ▪ Licences Cloud Desktop Securities MS Office Hybrid Cloud Messaging MS solutions
Once upon a time… Because I love telling tales
This talk is about a tale… A true one nevertheless
And as in most tales It begins with a mission
And a band of heroes Engulfed into the adventure
They fight against mishaps And all kind of foes
They build mighty fortresses Pushing the limits of possible
And defend them day after day Against all odds
But we don’t know yet the end Because this tale isn’t finished yet
It begins with a mission Build a metrics platform for OVH
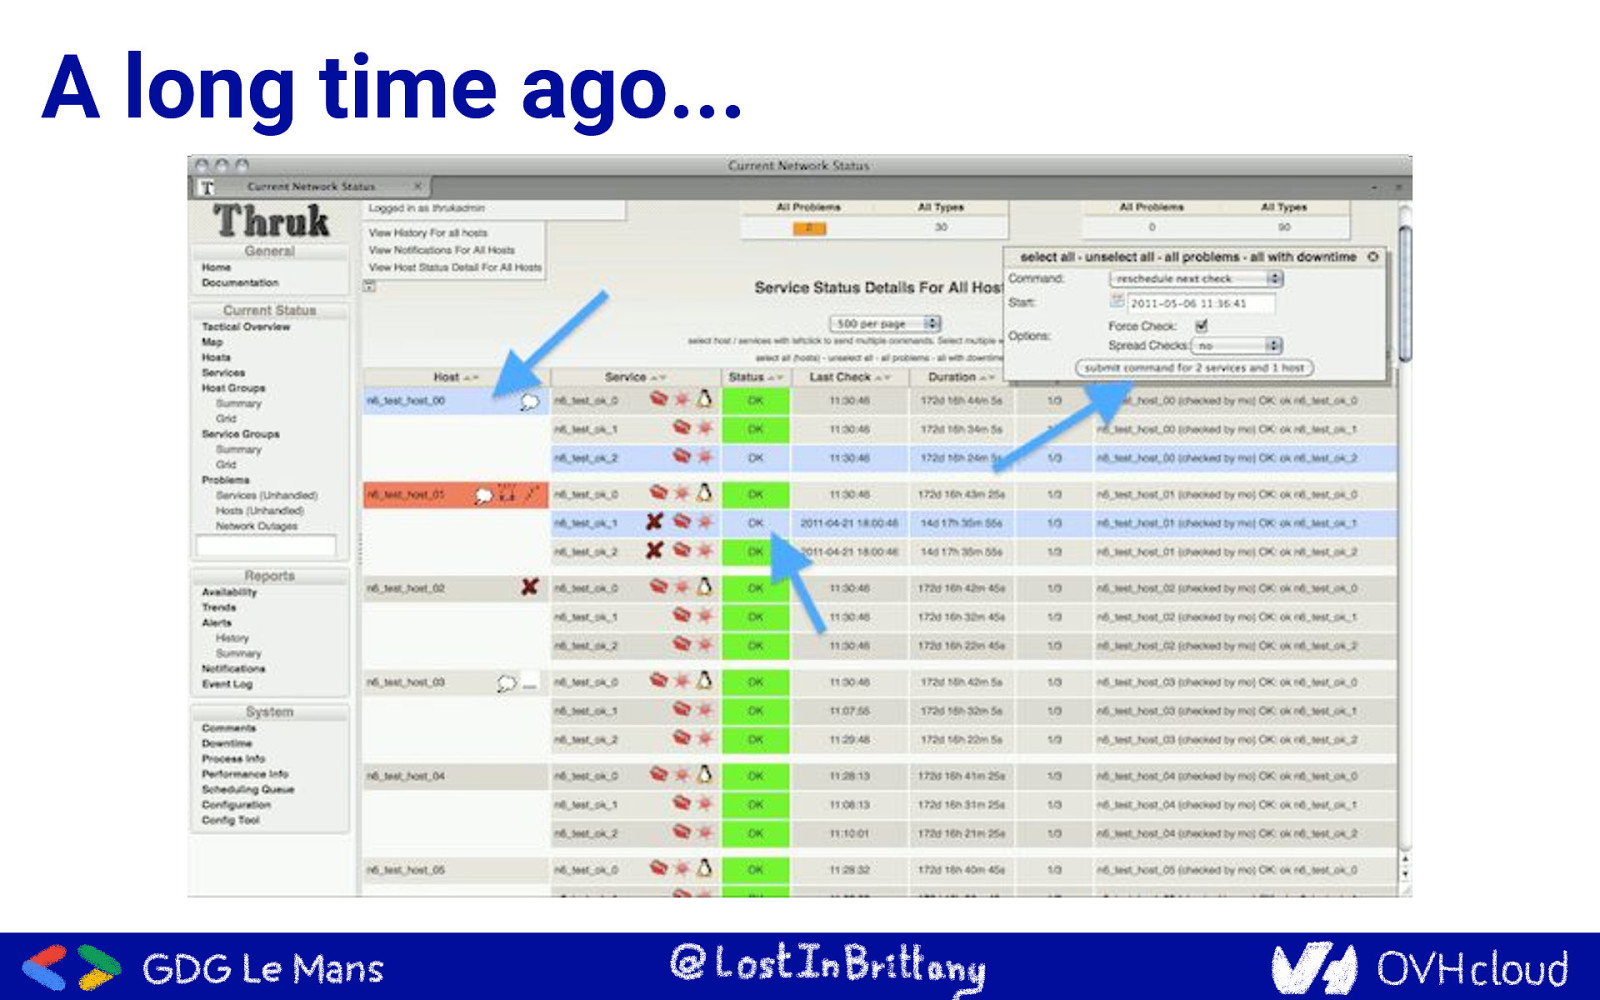
A long time ago…
A long time ago… Monitoring: Does the system works?
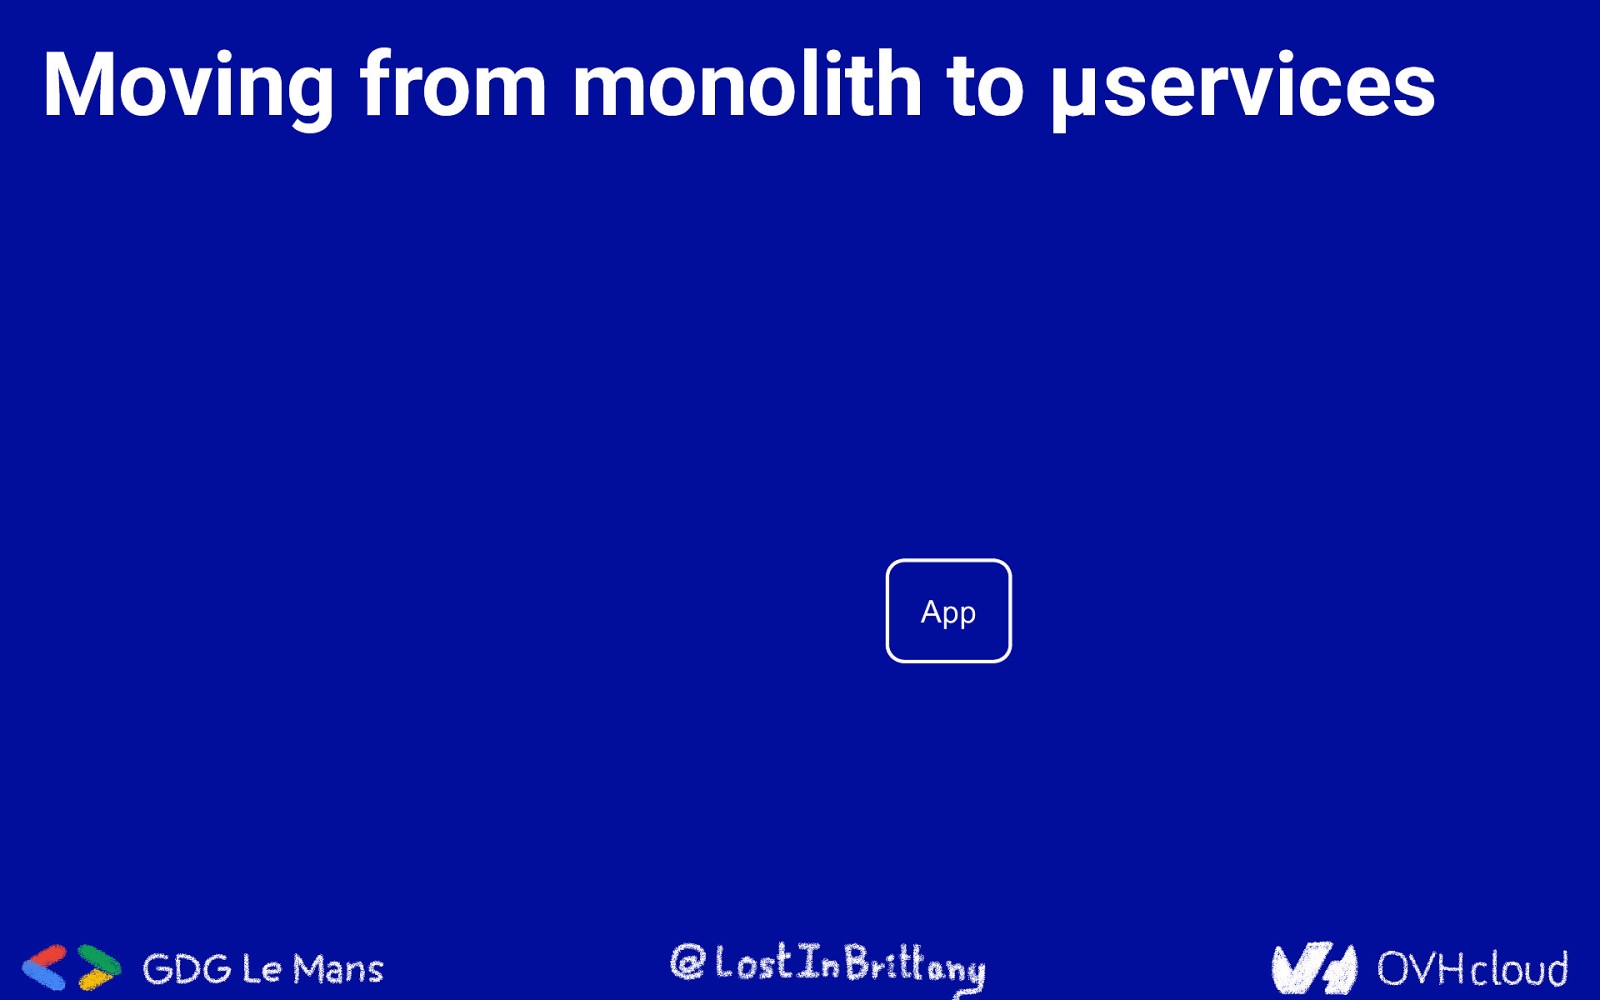
Moving from monolith to μservices App
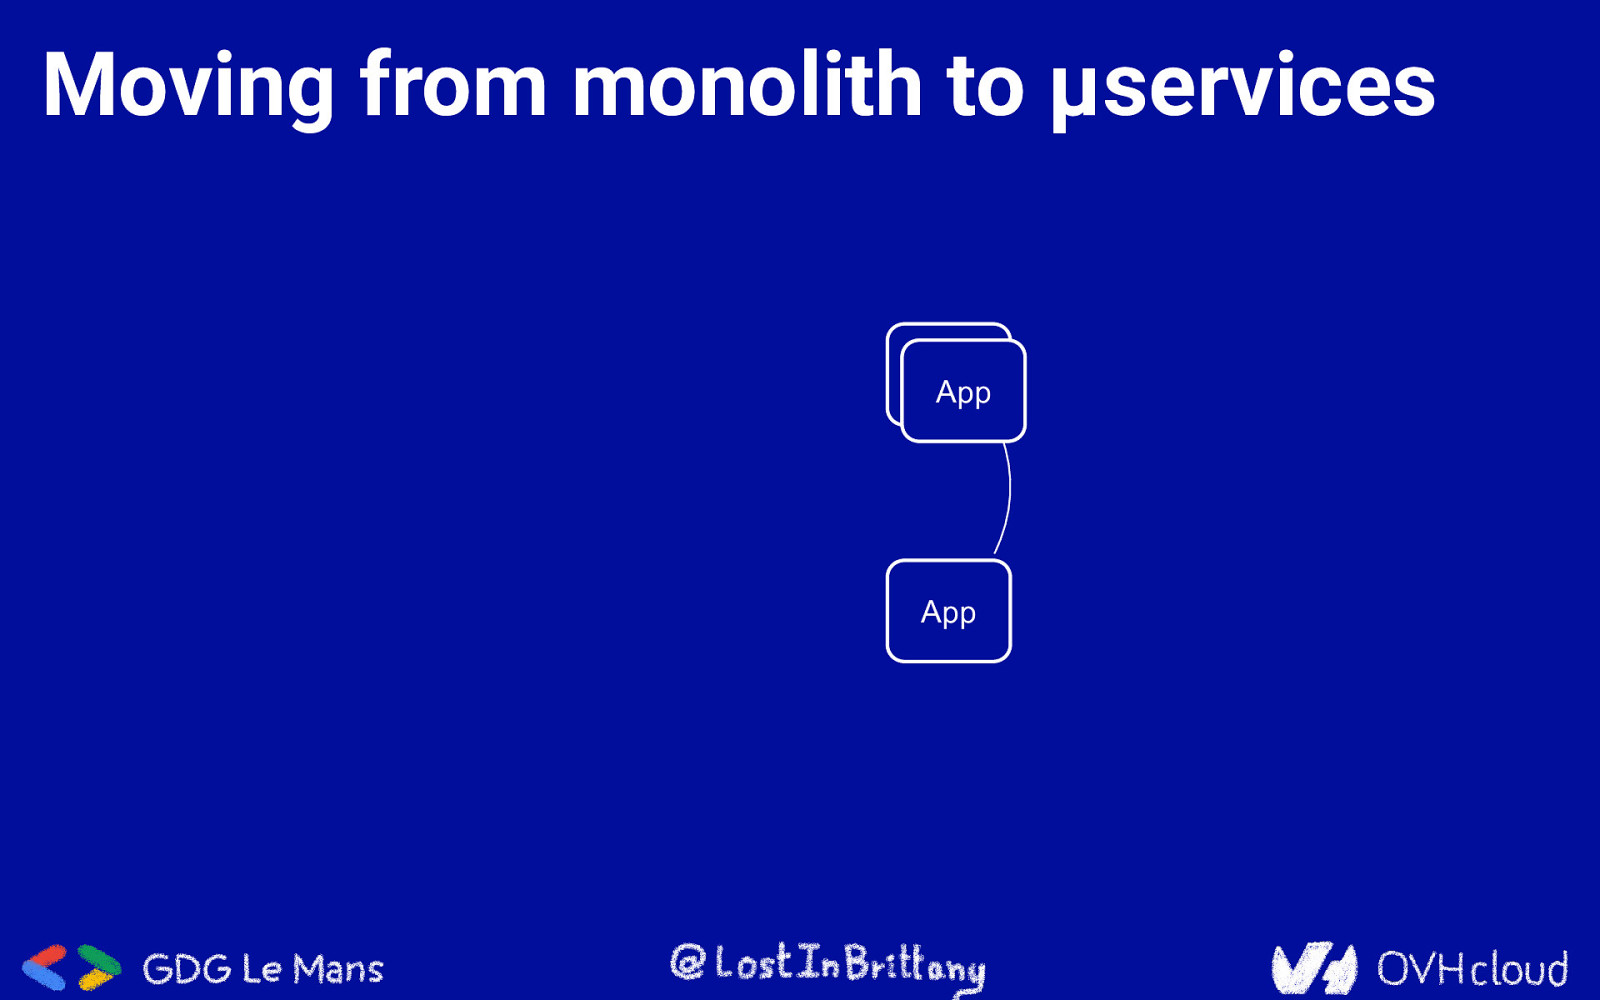
Moving from monolith to μservices App App App
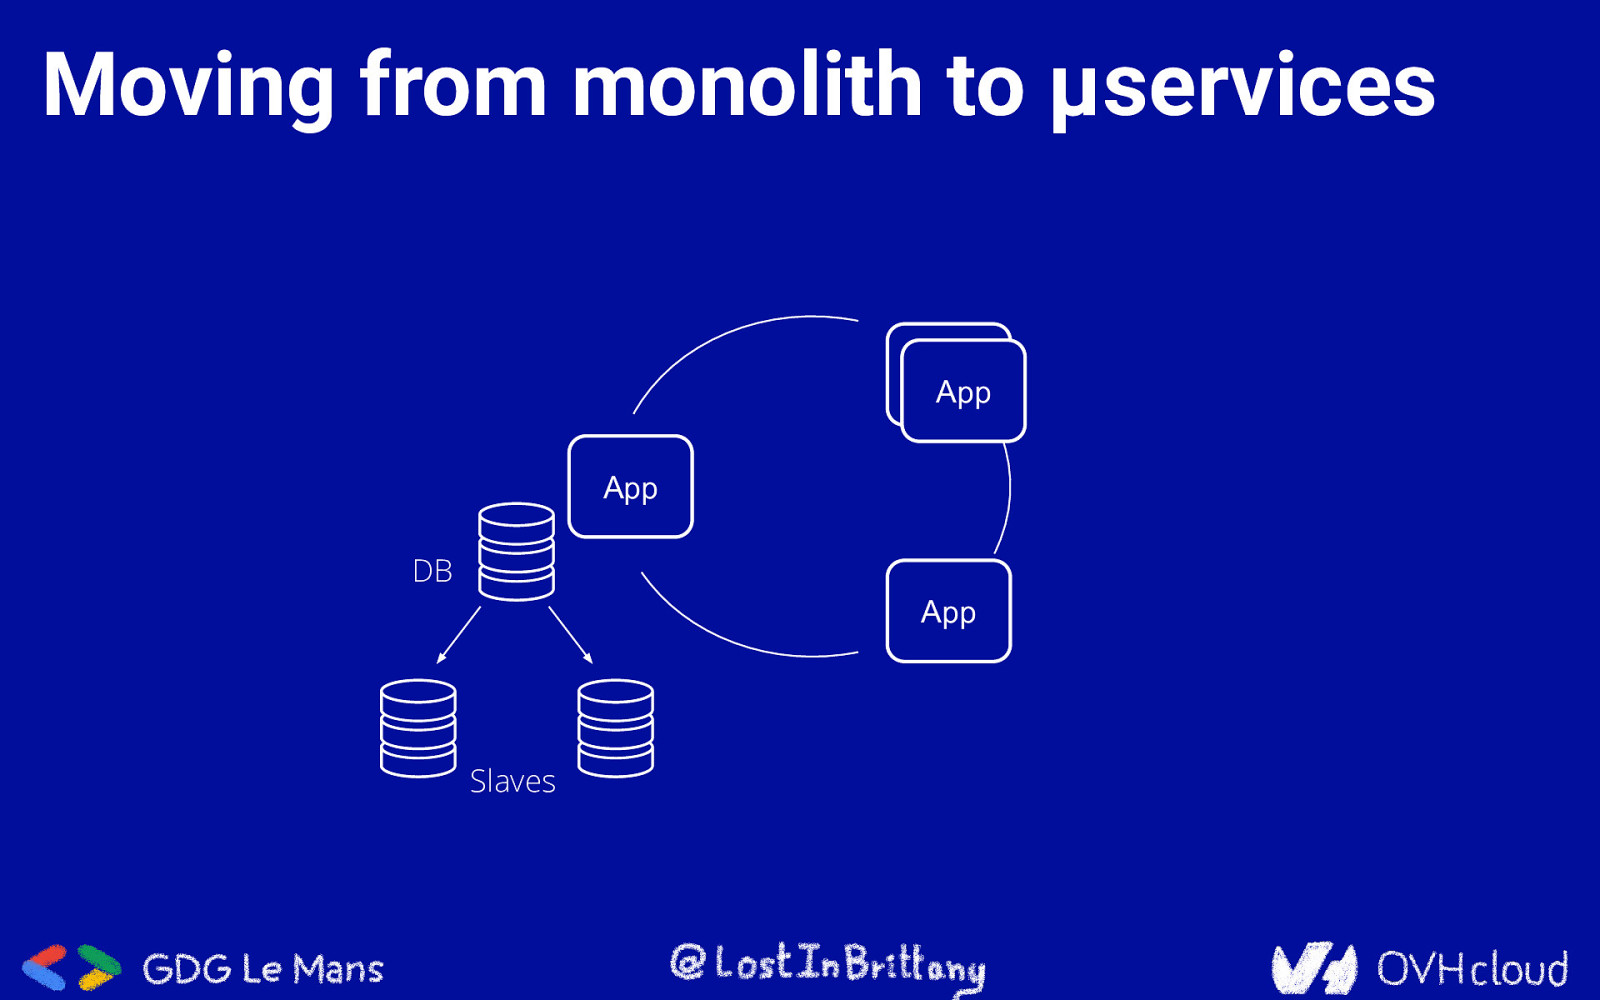
Moving from monolith to μservices App App App DB App Slaves
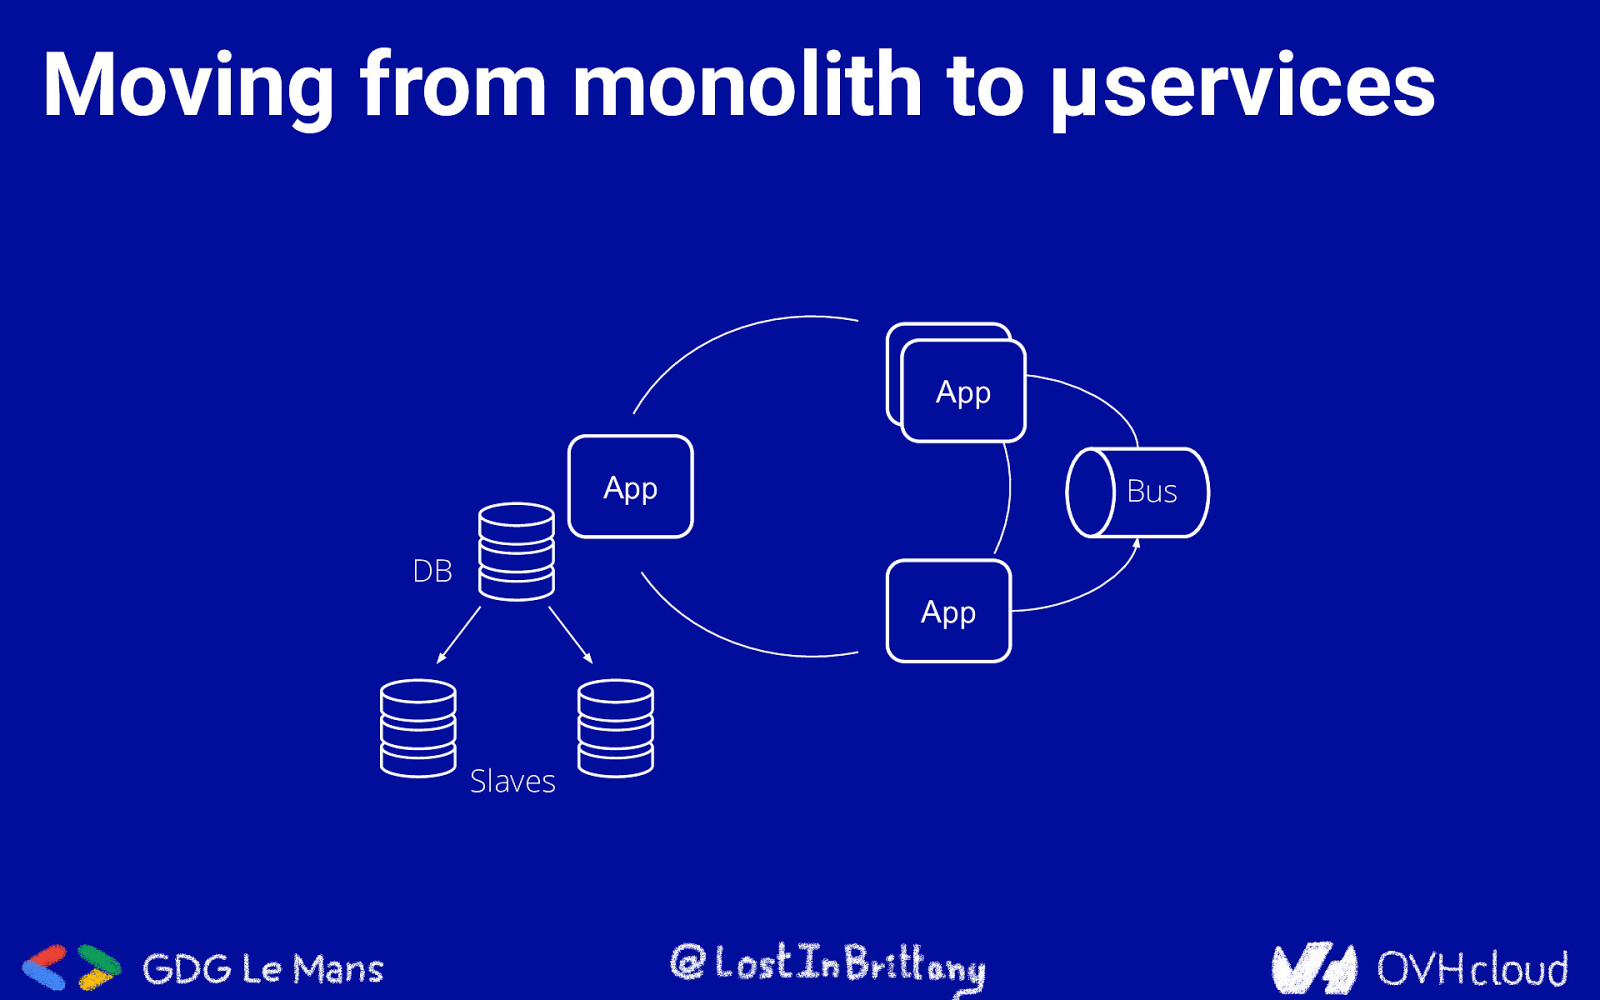
Moving from monolith to μservices App App App Bus DB App Slaves
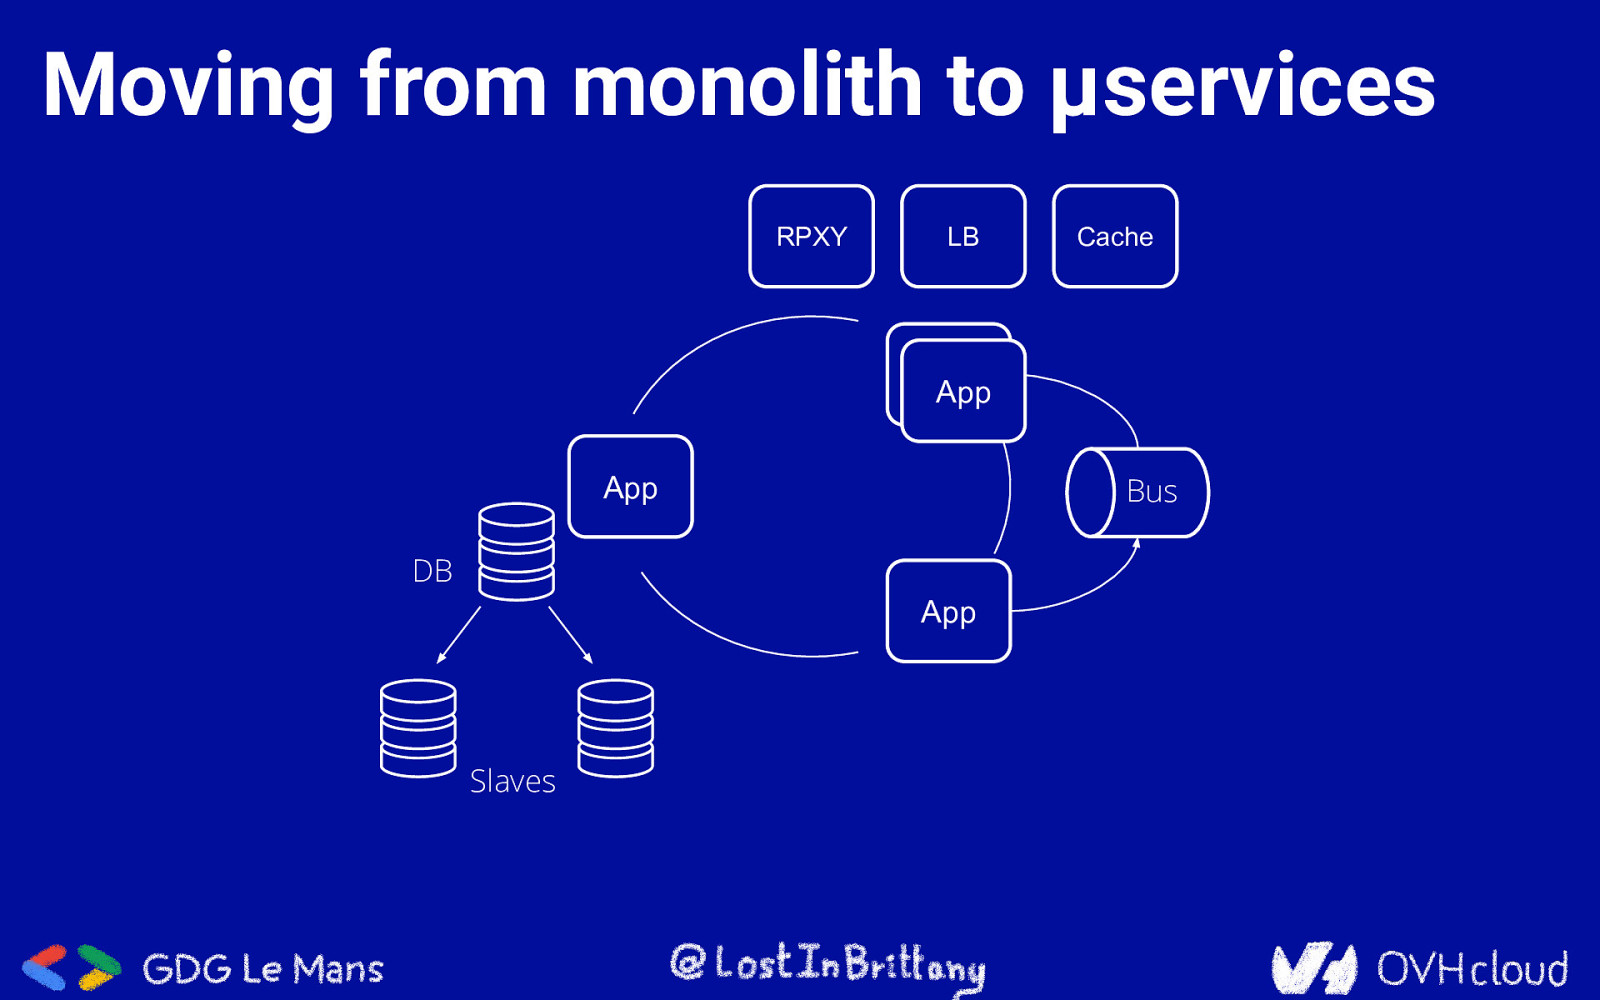
Moving from monolith to μservices RPXY LB Cache App App App Bus DB App Slaves
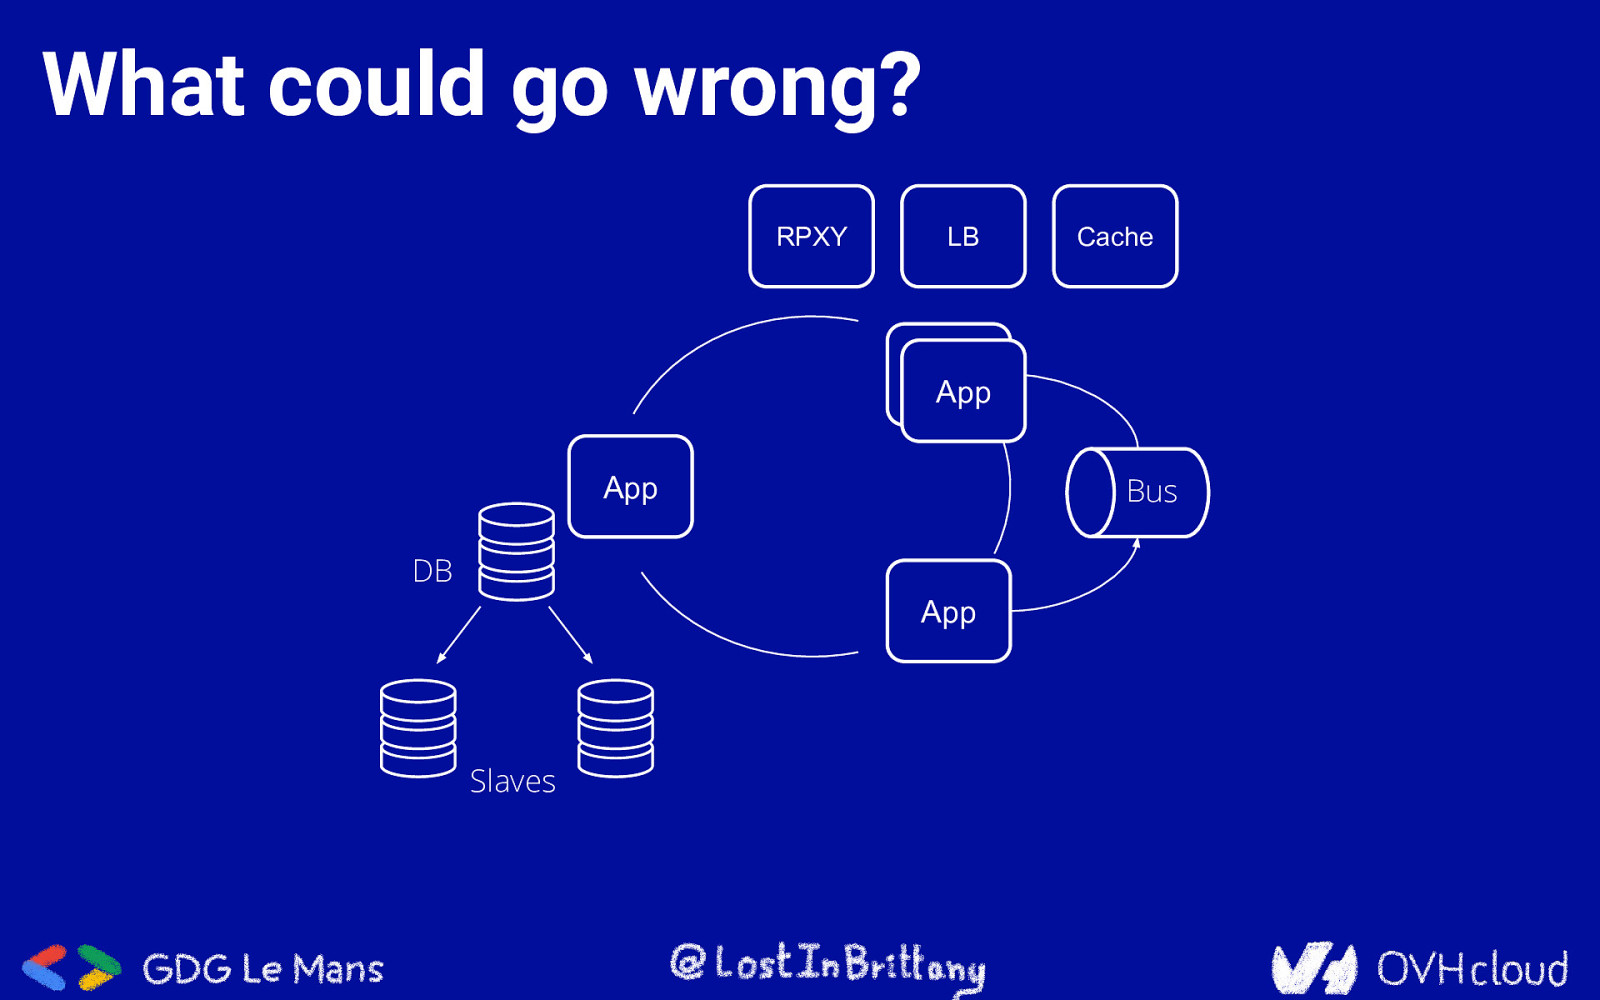
What could go wrong? RPXY LB Cache App App App Bus DB App Slaves
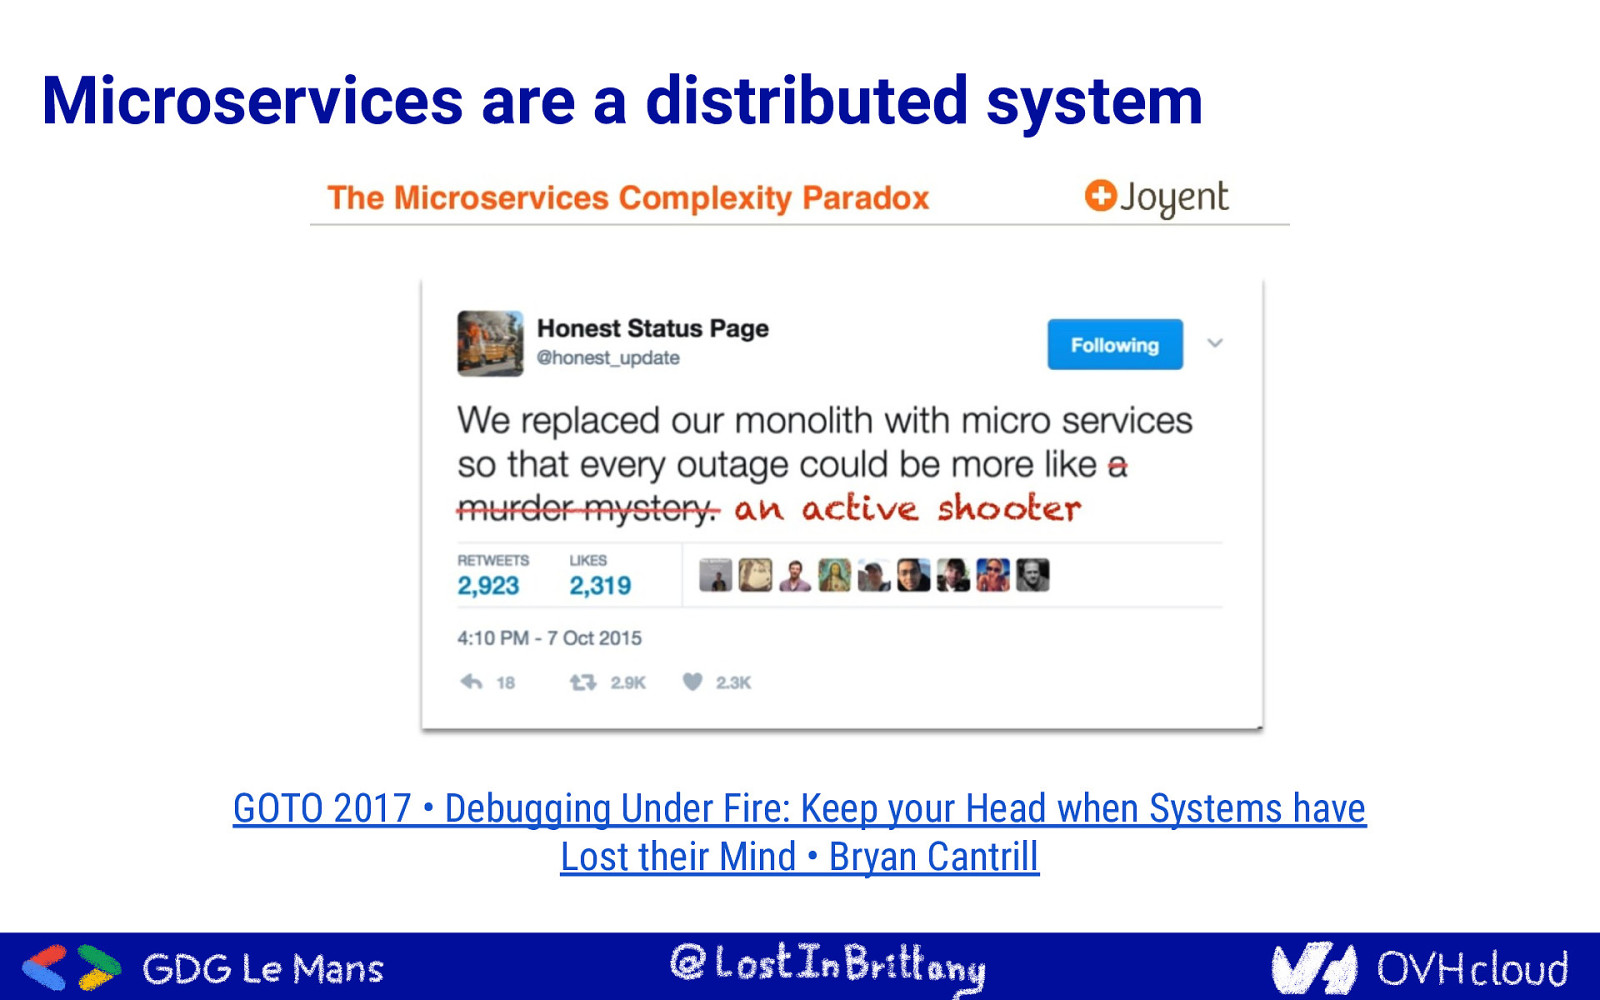
Microservices are a distributed system GOTO 2017 • Debugging Under Fire: Keep your Head when Systems have Lost their Mind • Bryan Cantrill
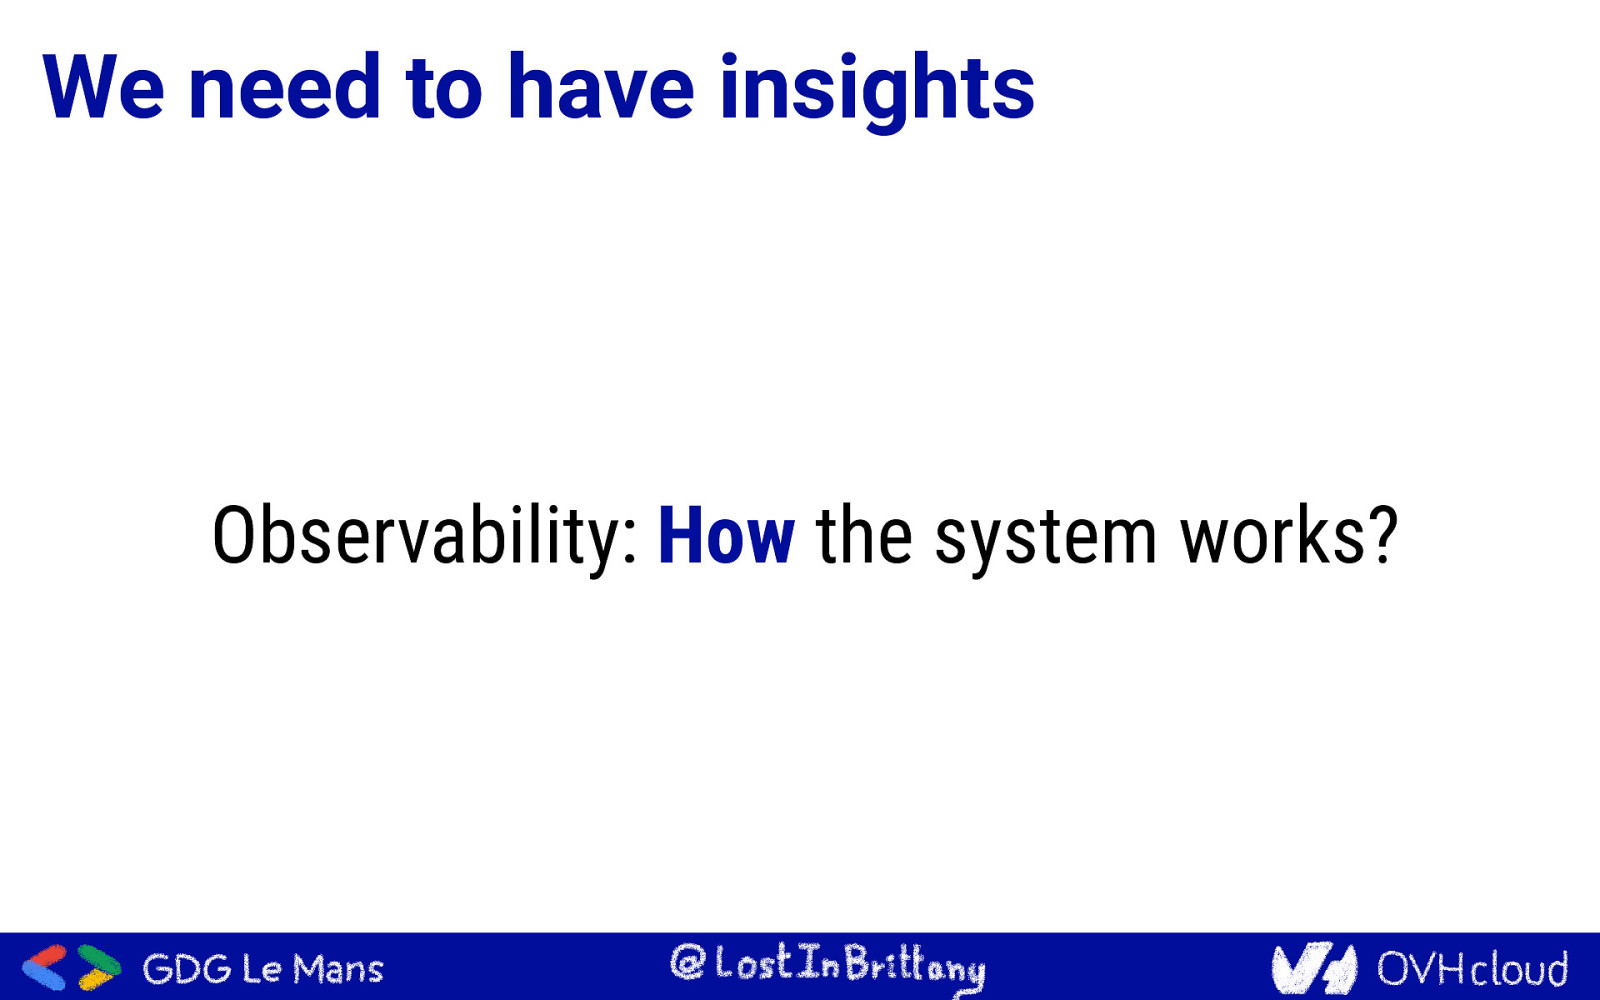
We need to have insights Observability: How the system works?
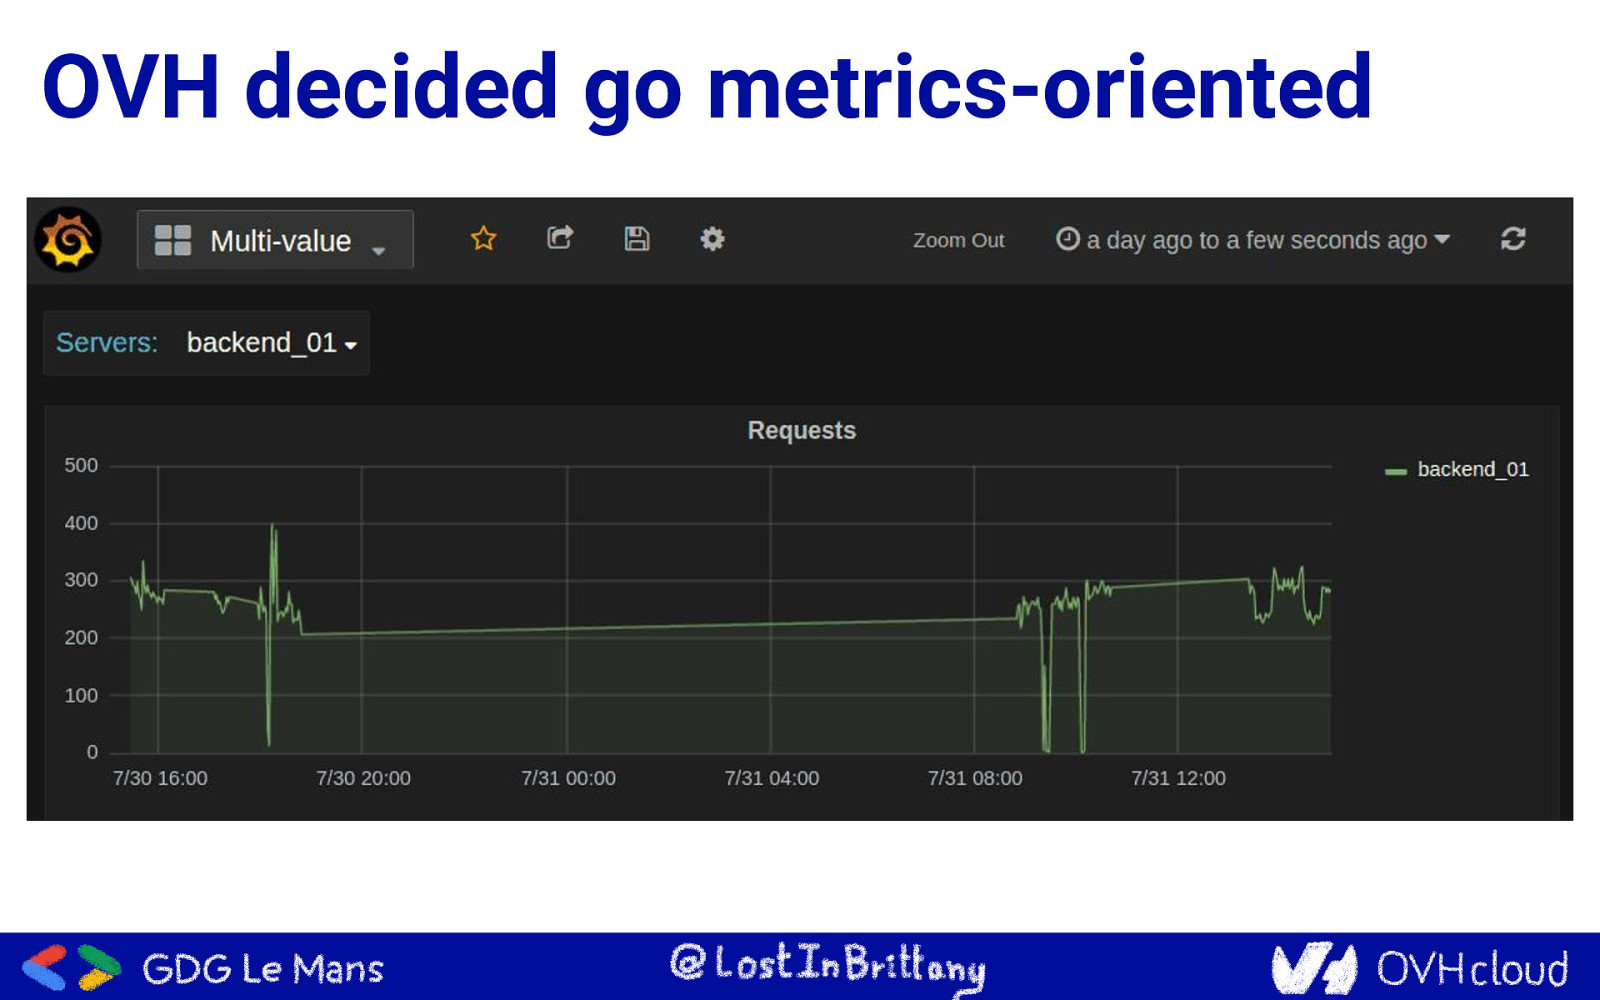
OVH decided go metrics-oriented
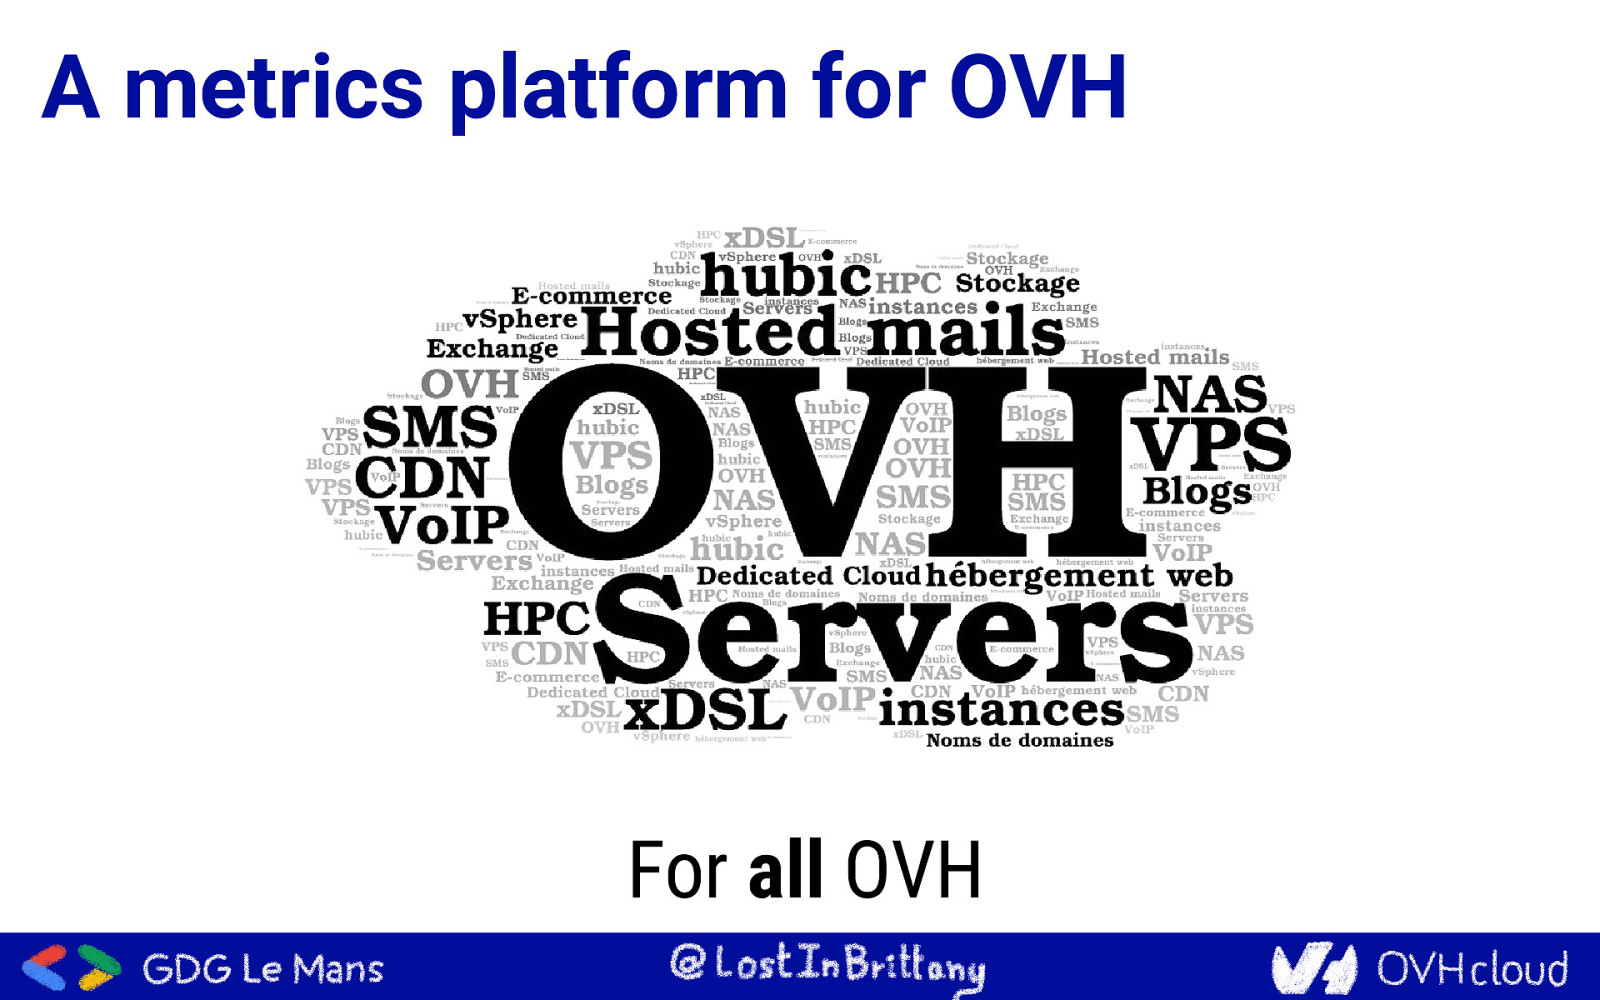
A metrics platform for OVH For all OVH
Building OVH Metrics One Platform to unify them all, One Platform to find them, One Platform to bring them all and in the Metrics monitor them
What is OVH Metrics? Managed Cloud Platform for Time Series
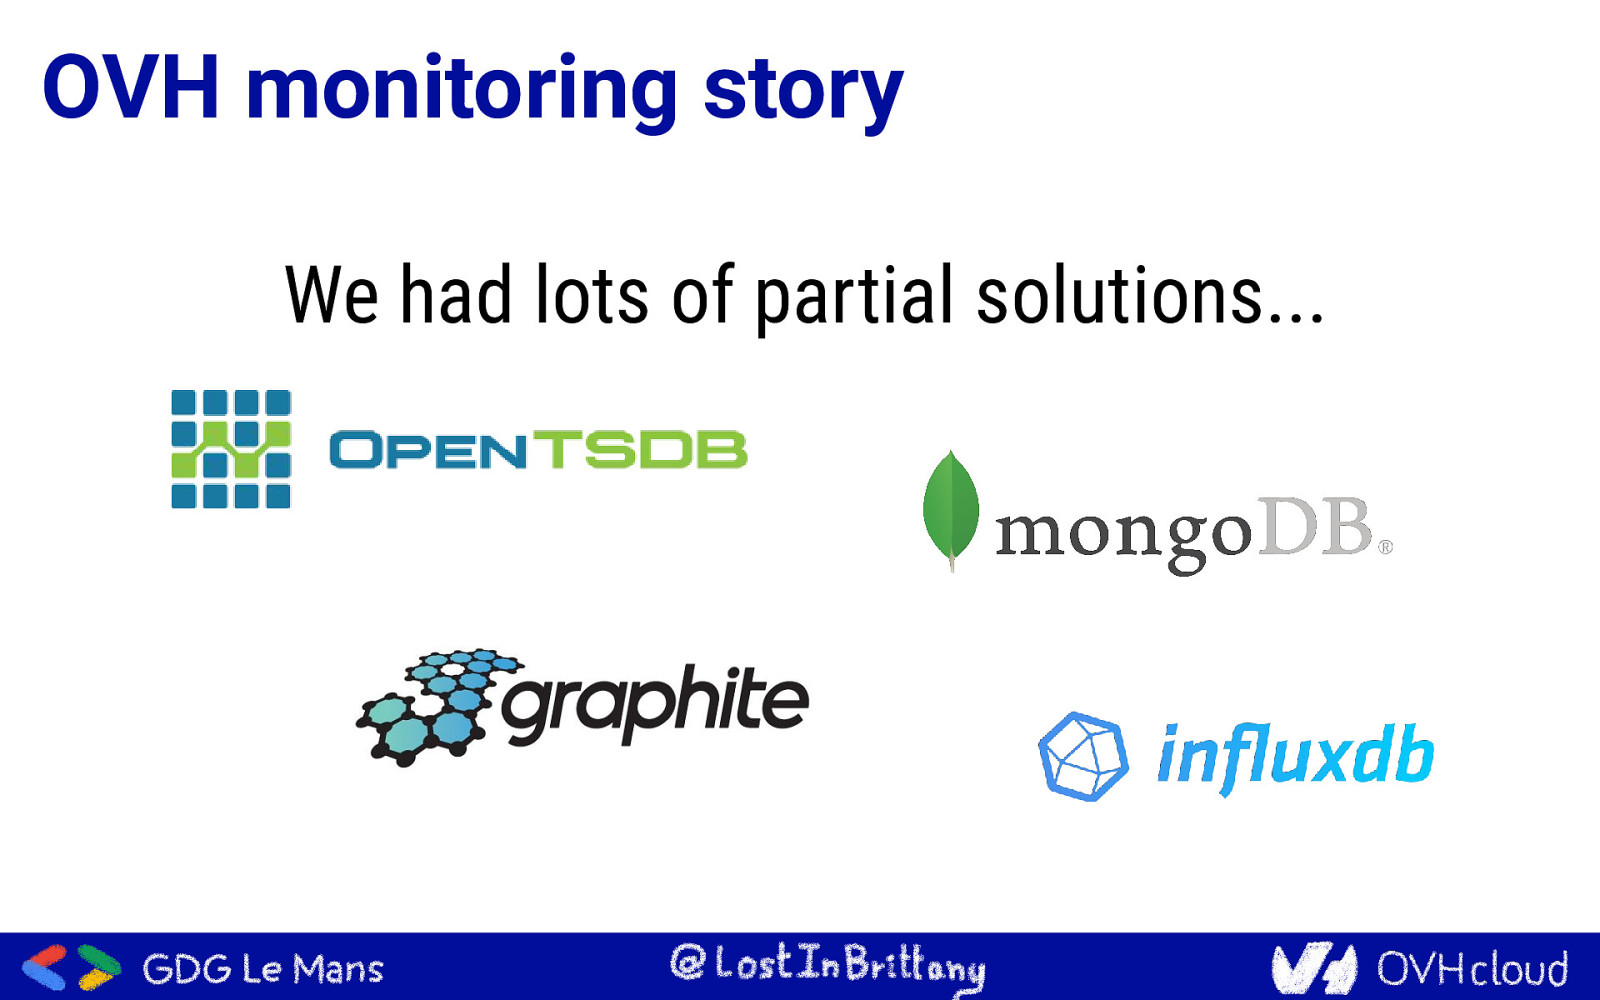
OVH monitoring story We had lots of partial solutions…
OVH monitoring story One Platform to unify them all What should we build it on?
OVH monitoring story Including a really big
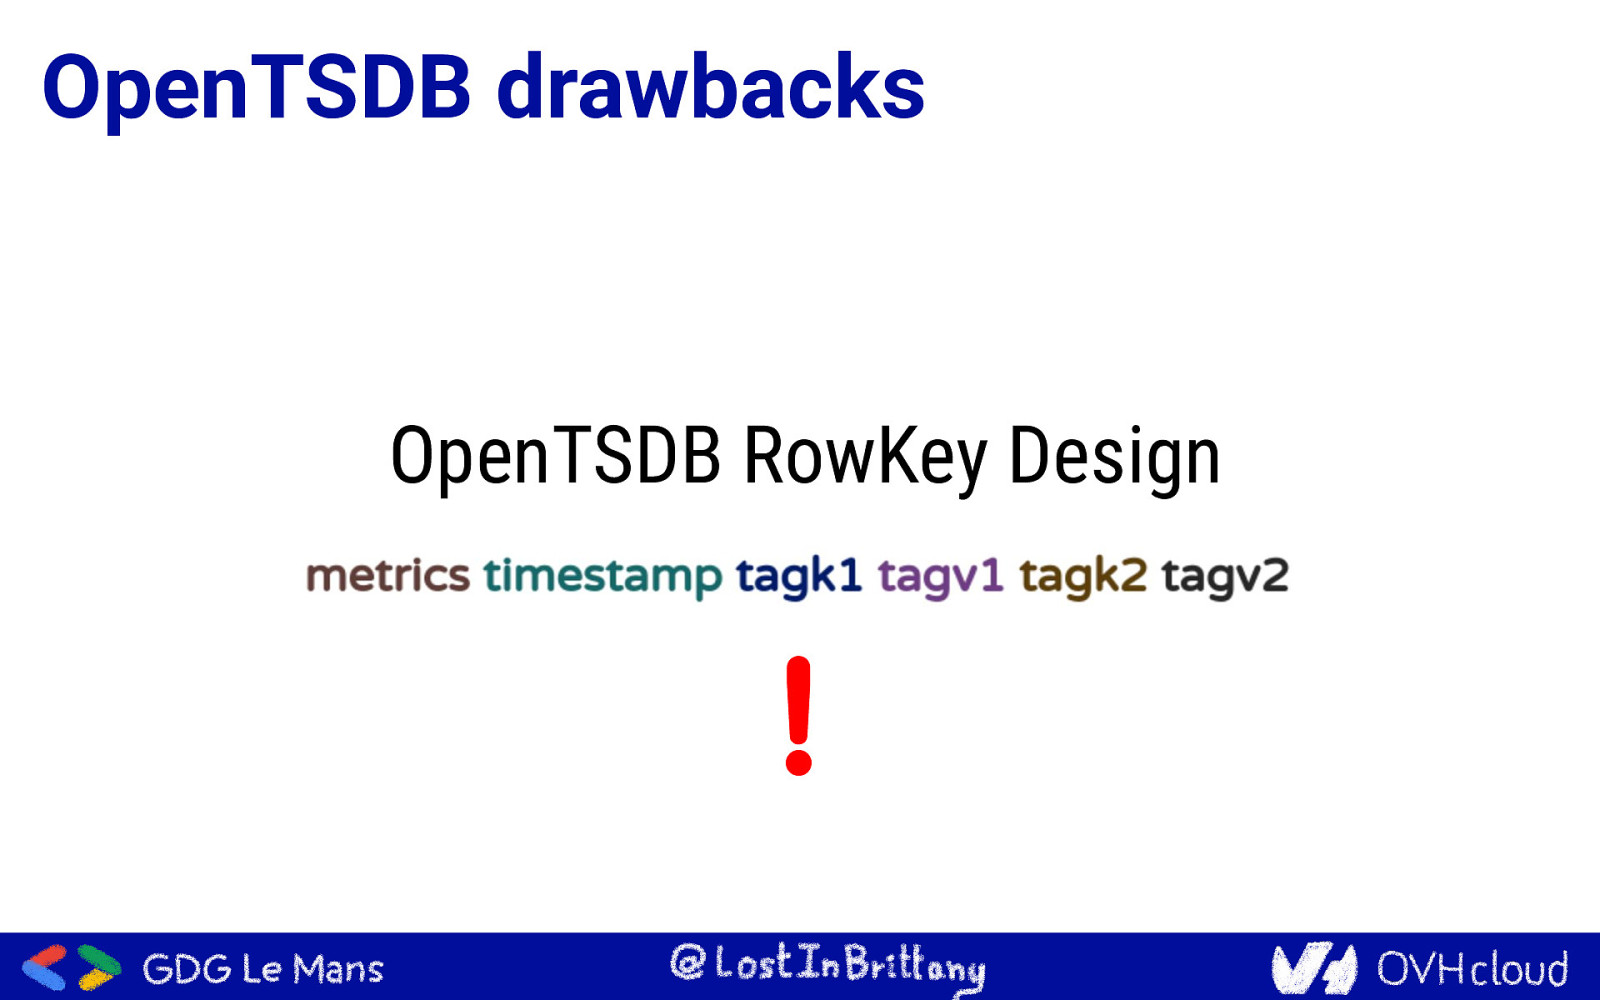
OpenTSDB drawbacks OpenTSDB RowKey Design !
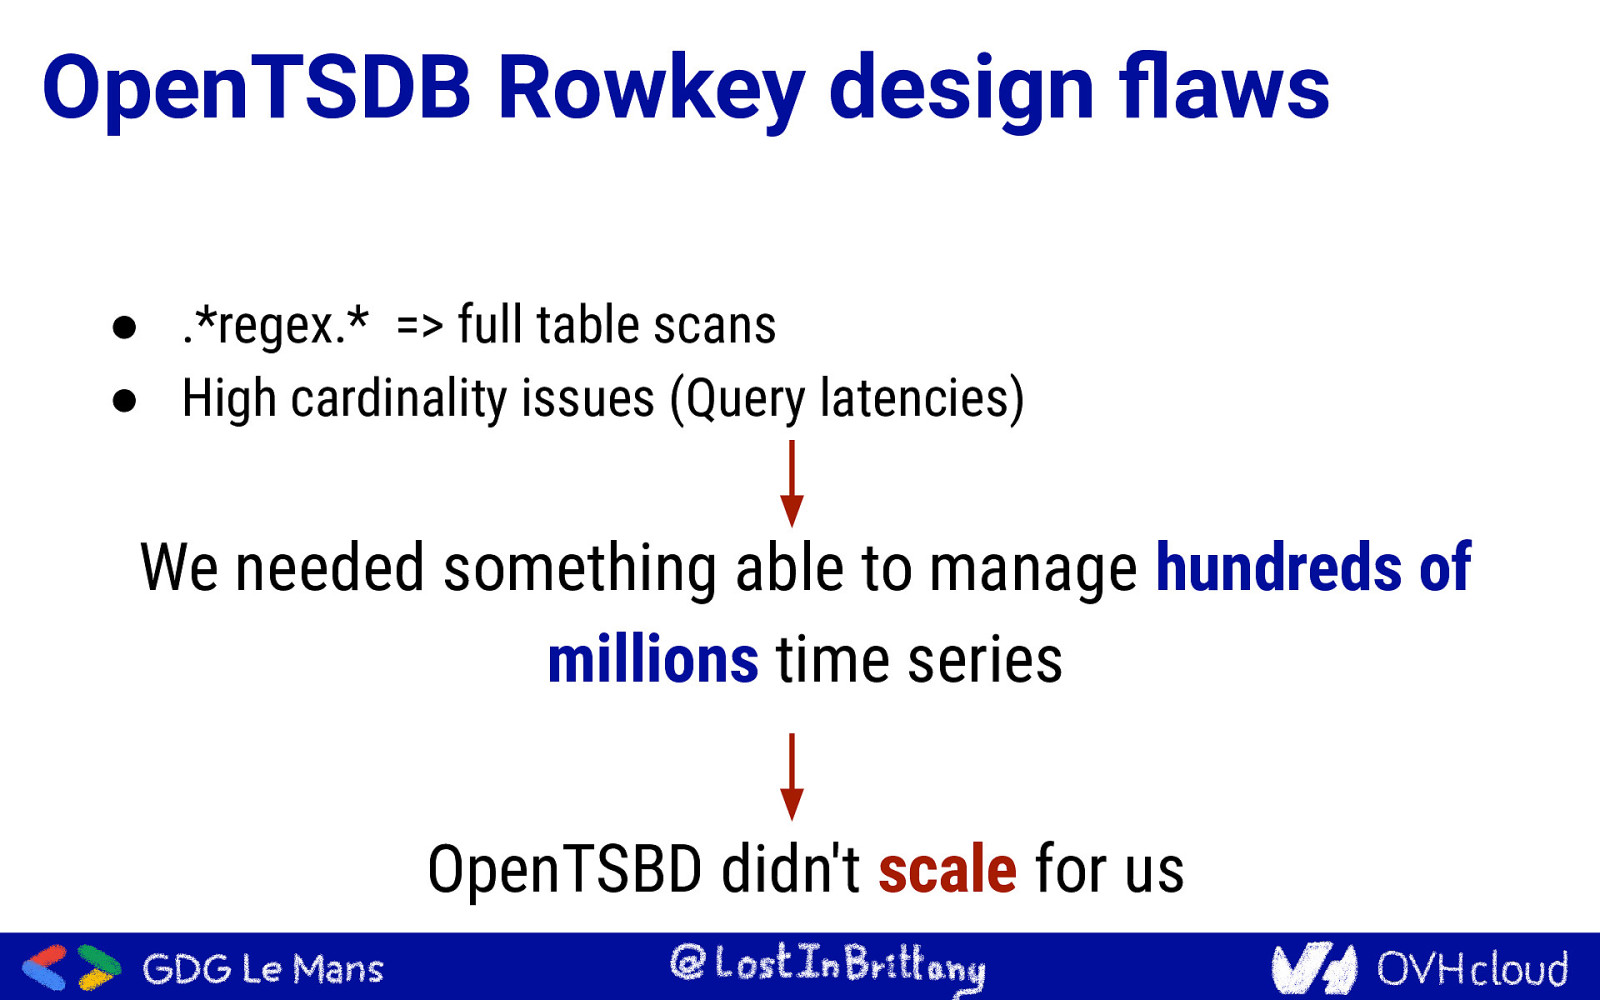
OpenTSDB Rowkey design flaws ● .regex. => full table scans ● High cardinality issues (Query latencies) We needed something able to manage hundreds of millions time series OpenTSBD didn’t scale for us
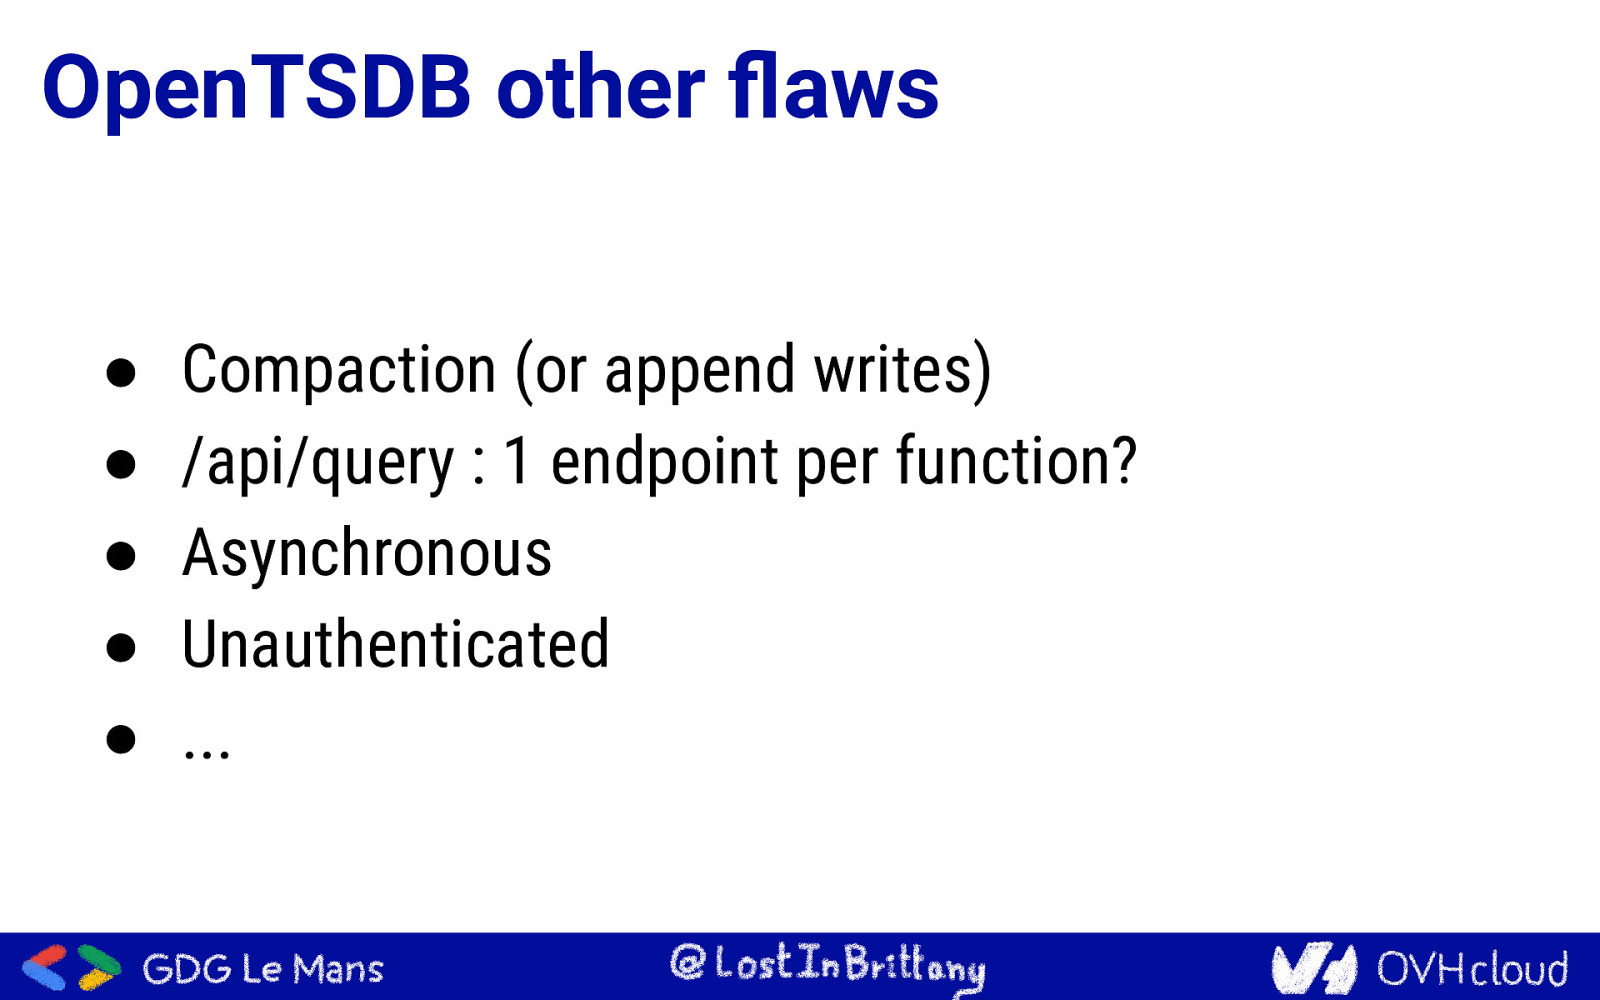
OpenTSDB other flaws ● ● ● ● ● Compaction (or append writes) /api/query : 1 endpoint per function? Asynchronous Unauthenticated …
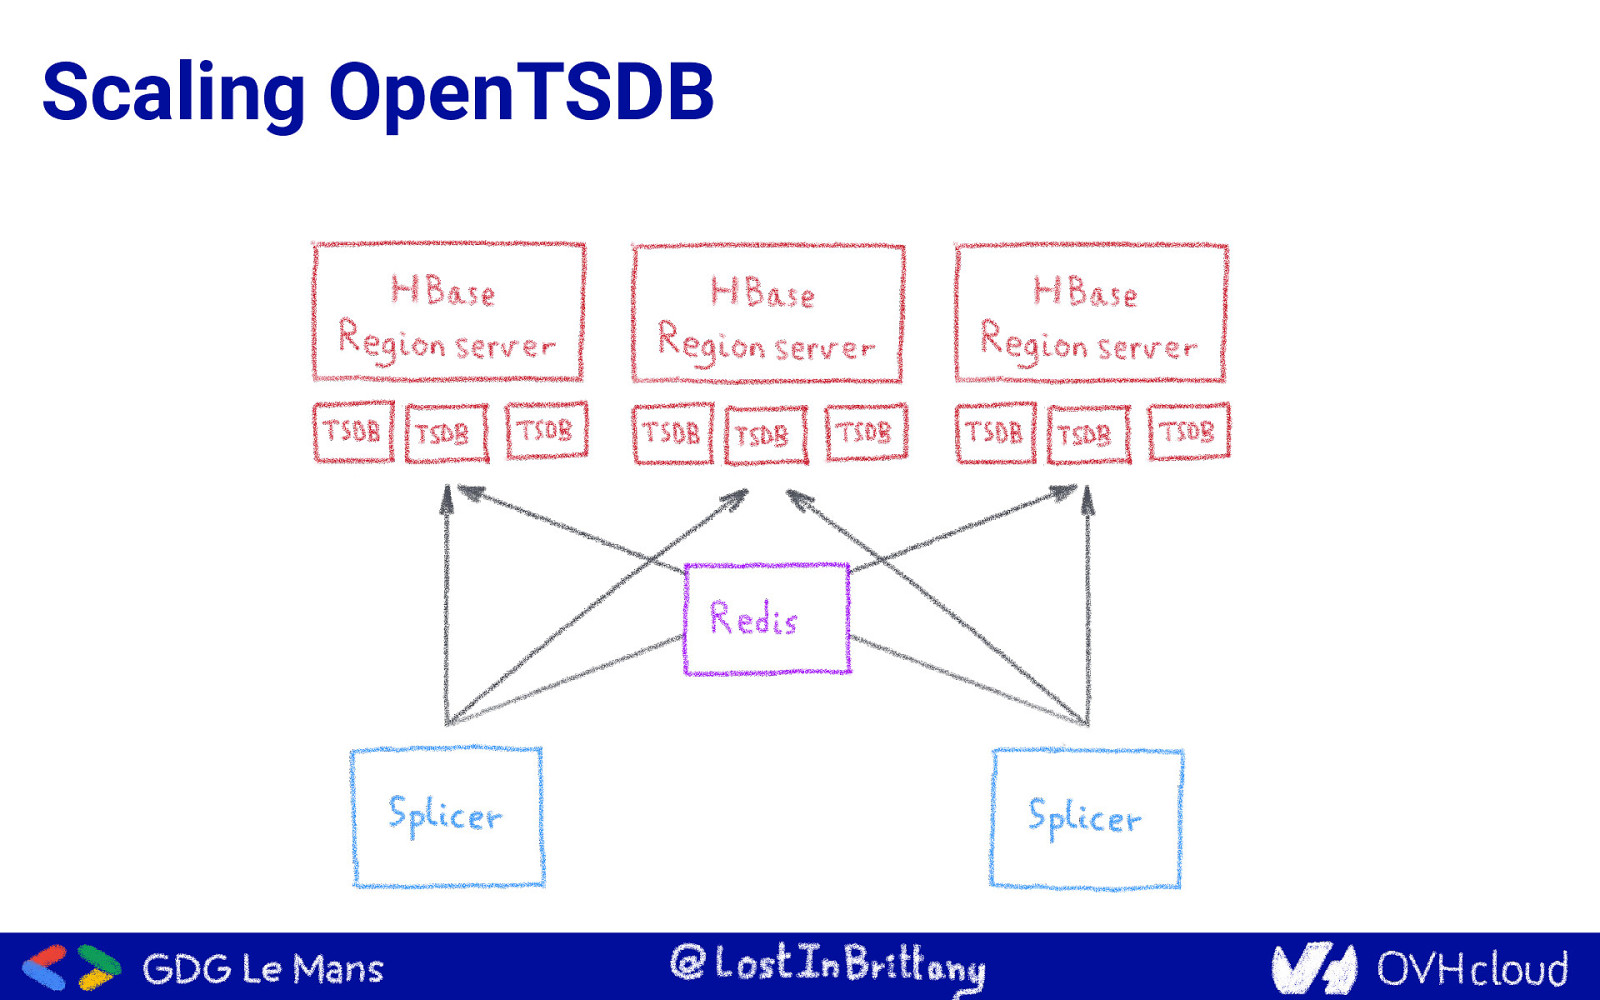
Scaling OpenTSDB
Metrics needs First need: To be massively scalable
Analytics is the key to success Fetching data is only the tip of the iceberg
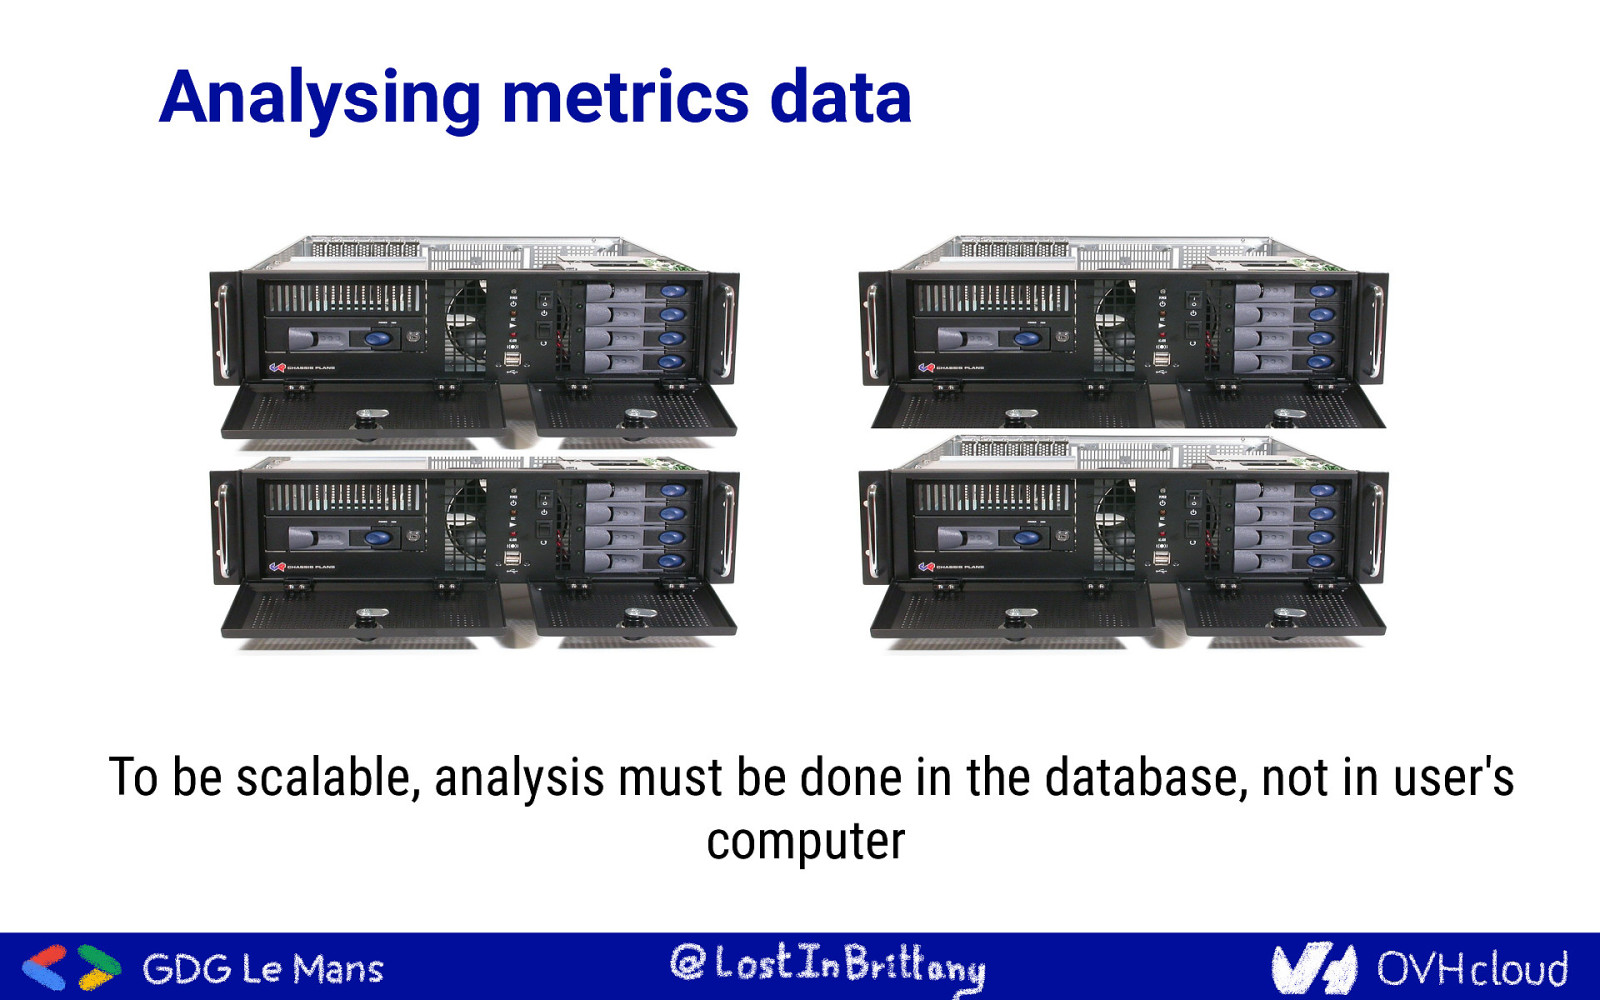
Analysing metrics data To be scalable, analysis must be done in the database, not in user’s computer
Metrics needs Second need: To have rich query capabilities
Enter Warp 10… Open-source Time series Database
More than a Time Series DB Warp 10 is a software platform that ● Ingests and stores time series ● Manipulates and analyzes time series
Manipulating Time Series with Warp 10 A true Time Series analysis toolbox ○ Hundreds of functions ○ Manipulation frameworks ○ Analysis workflow
Manipulating Time Series with Warp 10 A Time Series manipulation language WarpScript
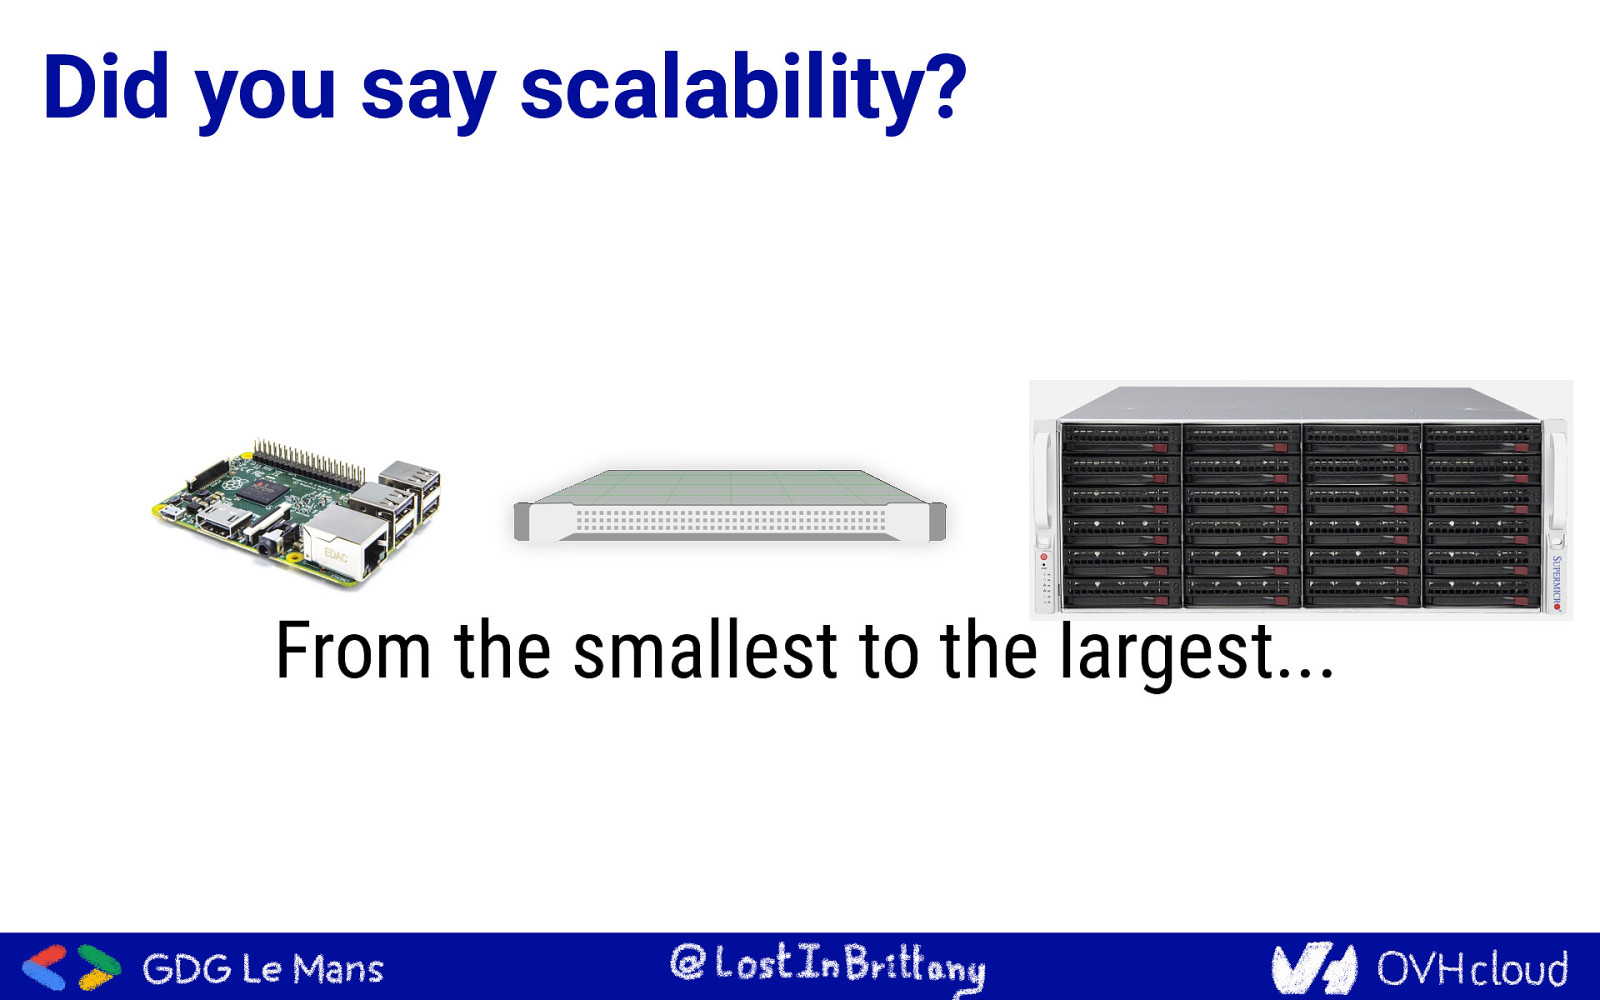
Did you say scalability? From the smallest to the largest…
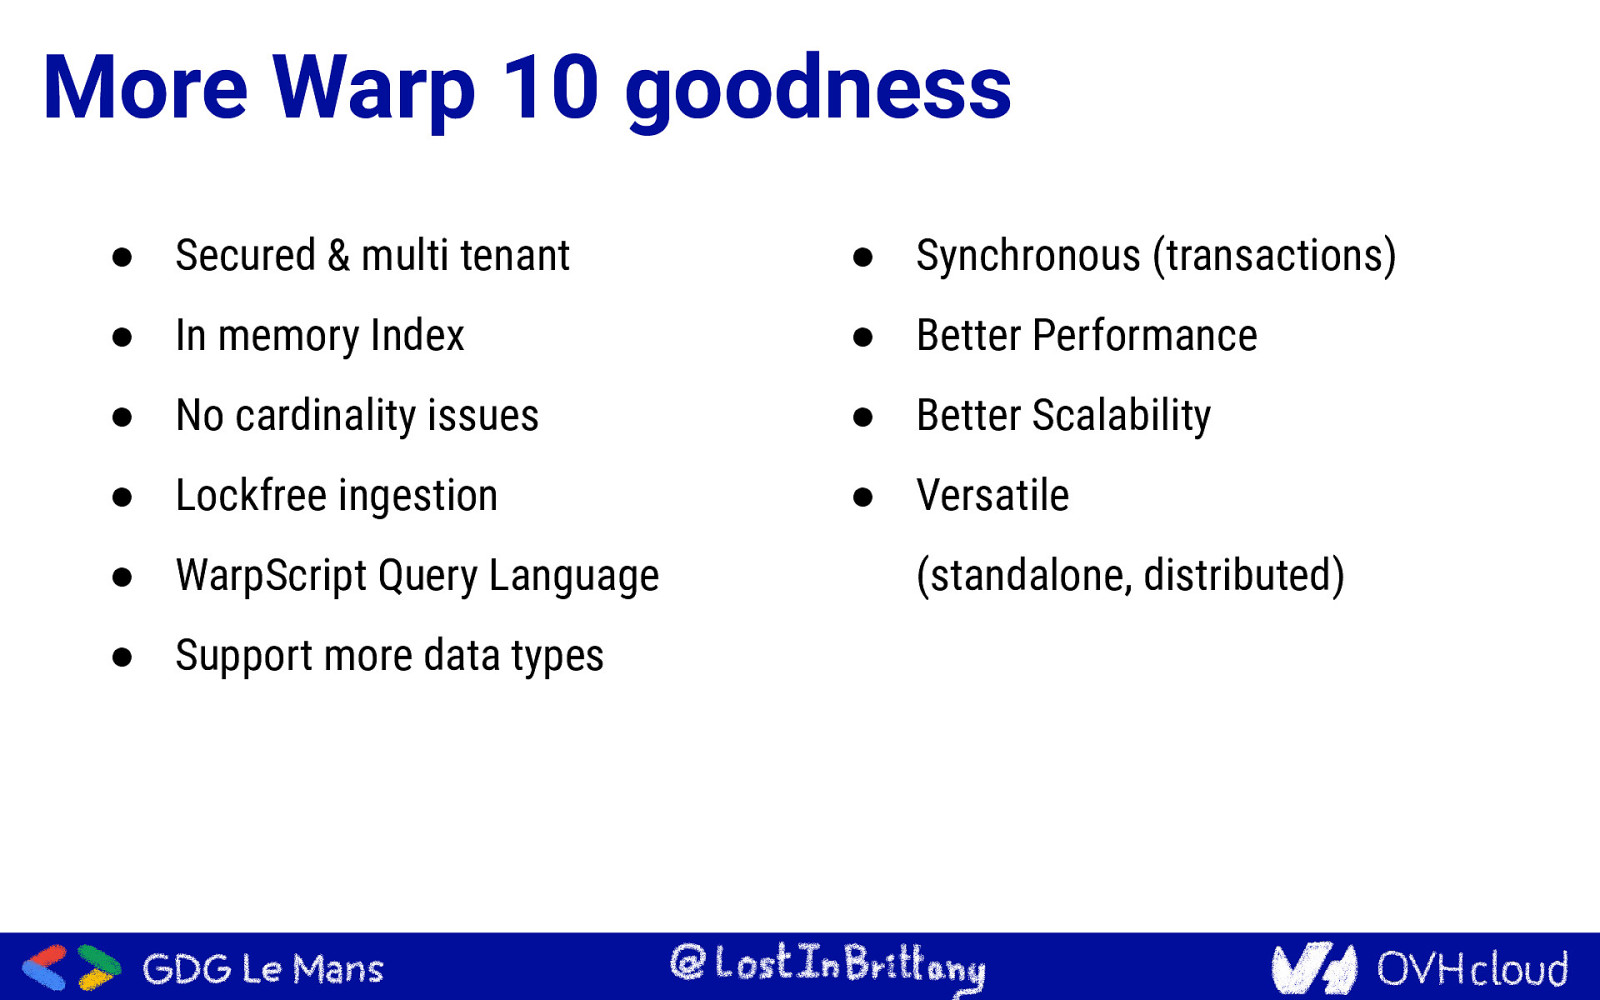
More Warp 10 goodness ● Secured & multi tenant ● Synchronous (transactions) ● In memory Index ● Better Performance ● No cardinality issues ● Better Scalability ● Lockfree ingestion ● Versatile ● WarpScript Query Language ● Support more data types (standalone, distributed)
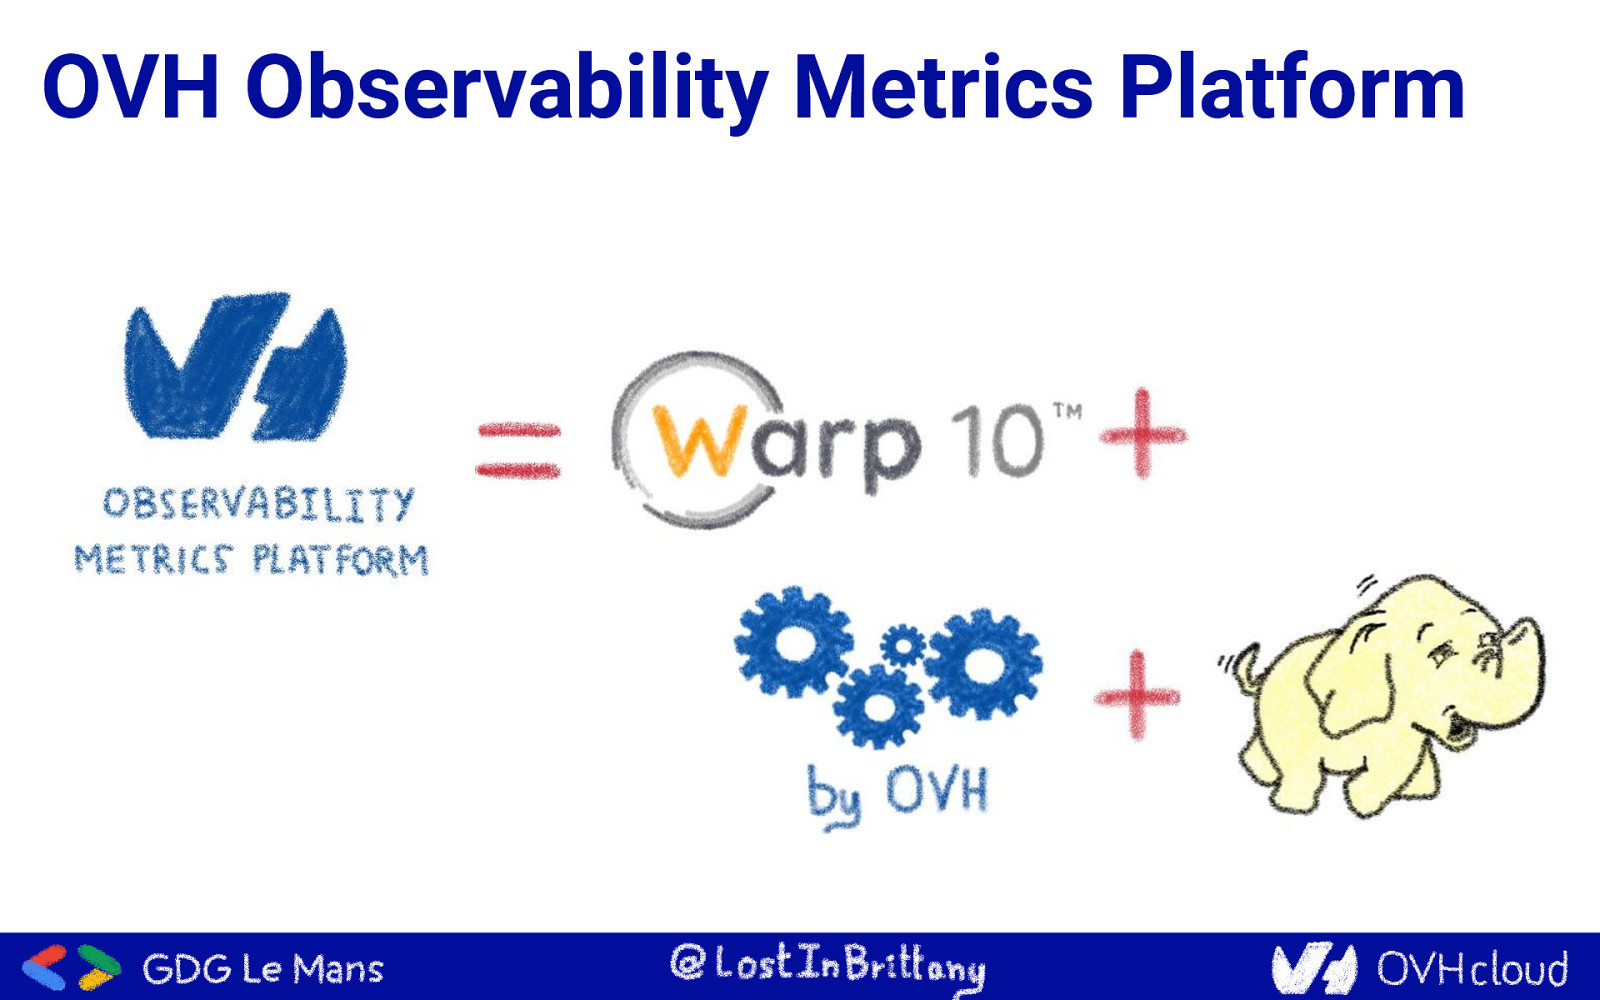
OVH Observability Metrics Platform
Building an ecosystem From Warp 10 to OVH Metrics
What protocols should we support? Who must do the effort?
Open source monitoring tools
Open source monitoring tools
Open source monitoring tools
Open source monitoring tools
Open source monitoring tools
Open source monitoring tools
Open source monitoring tools Why choose? Let’s support all of them!
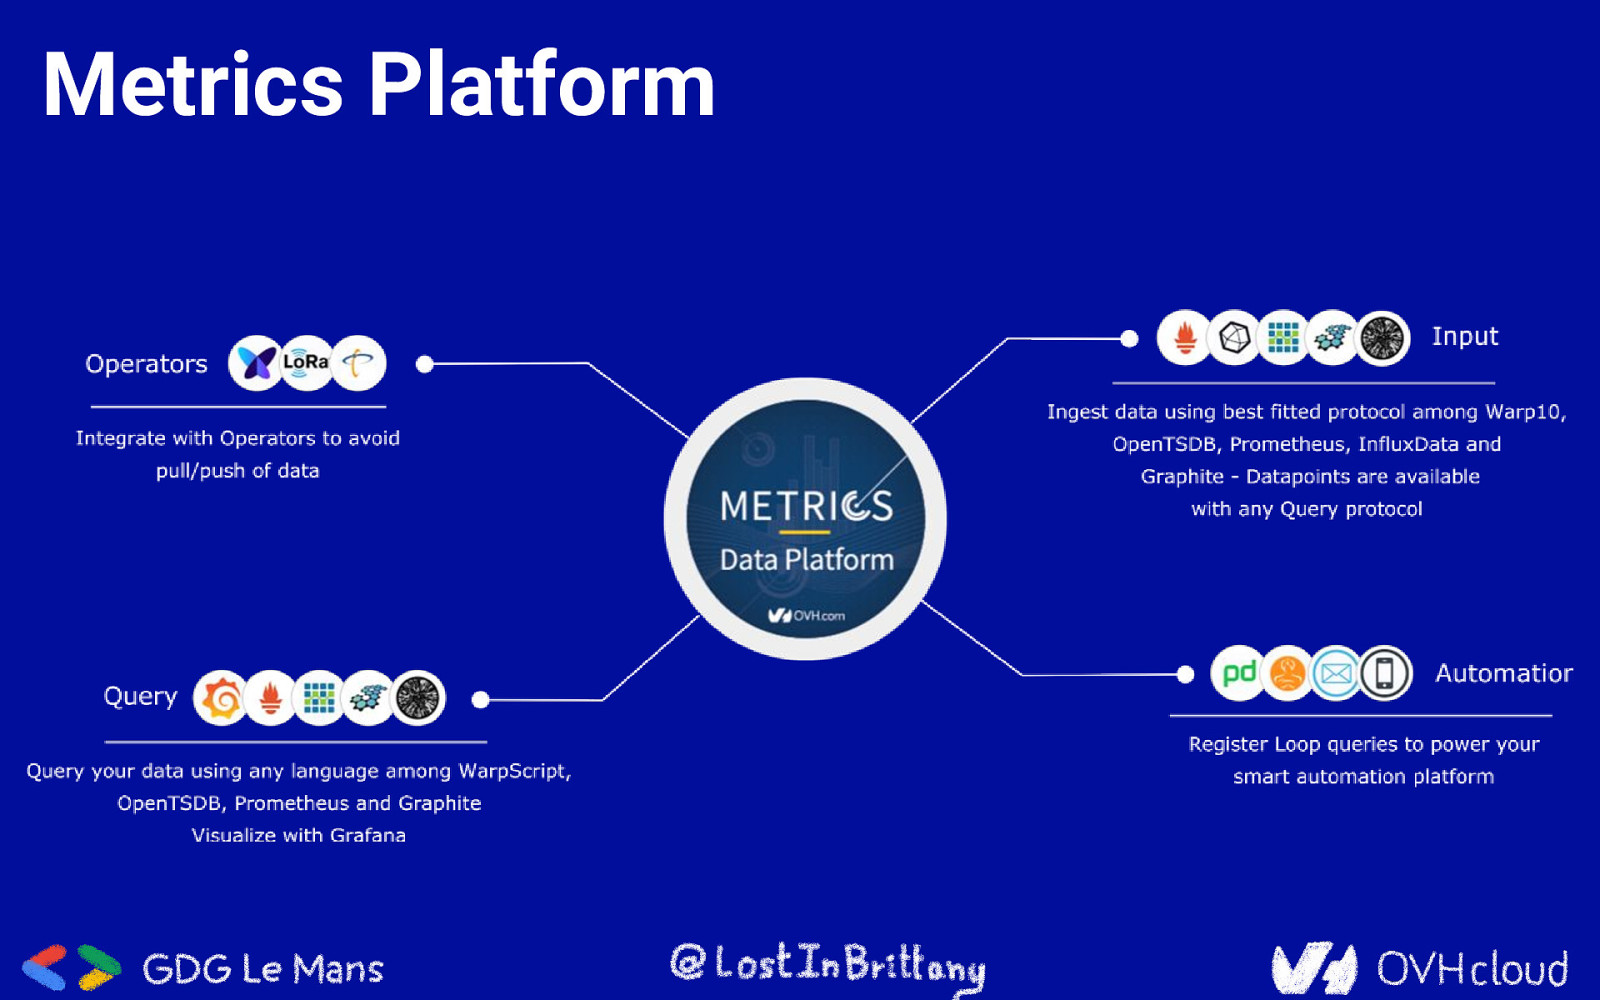
Metrics Platform
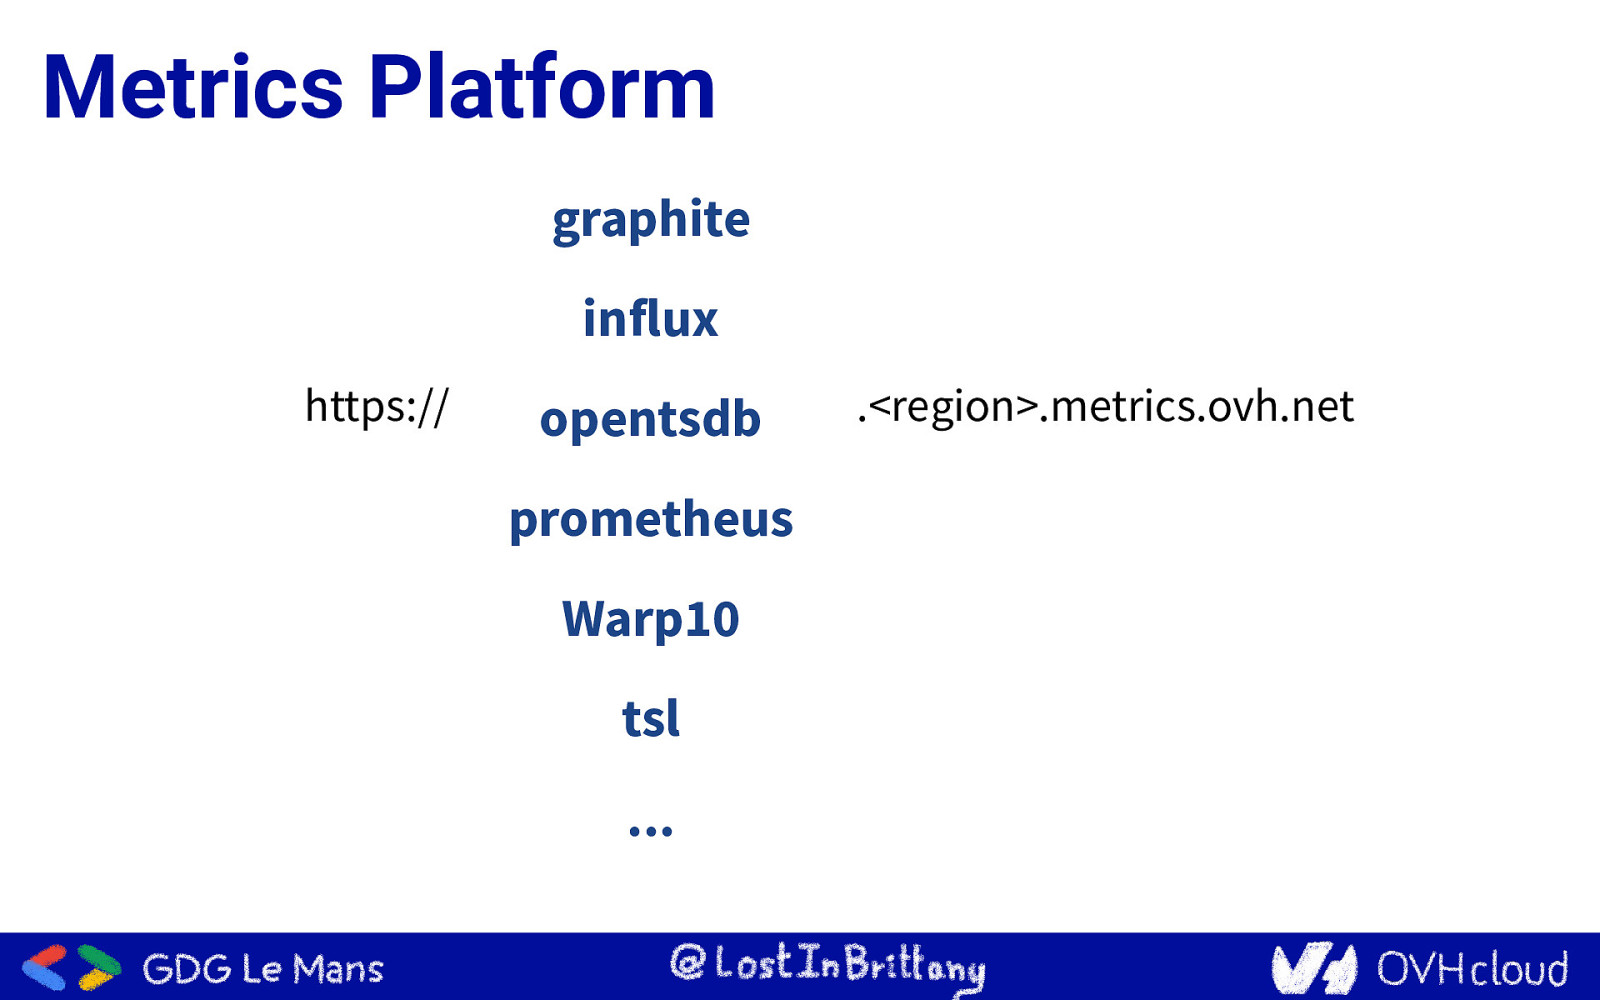
Metrics Platform graphite influx https:// opentsdb prometheus Warp10 tsl … .<region>.metrics.ovh.net
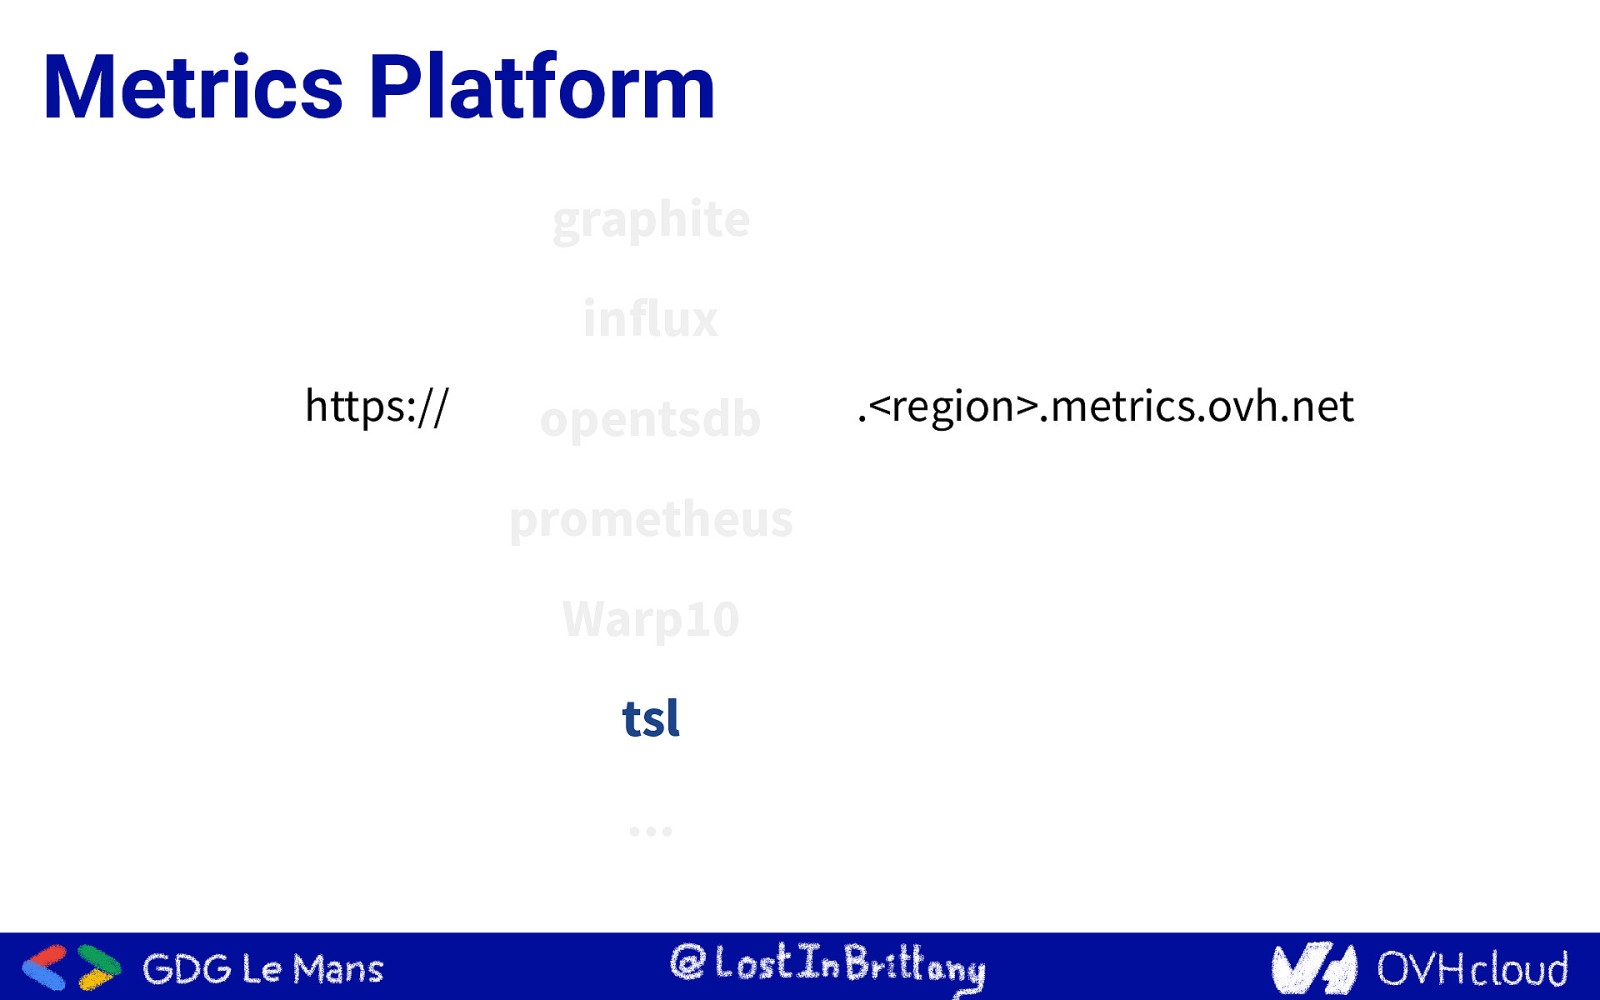
Metrics Platform graphite influx https:// opentsdb prometheus Warp10 tsl … .<region>.metrics.ovh.net
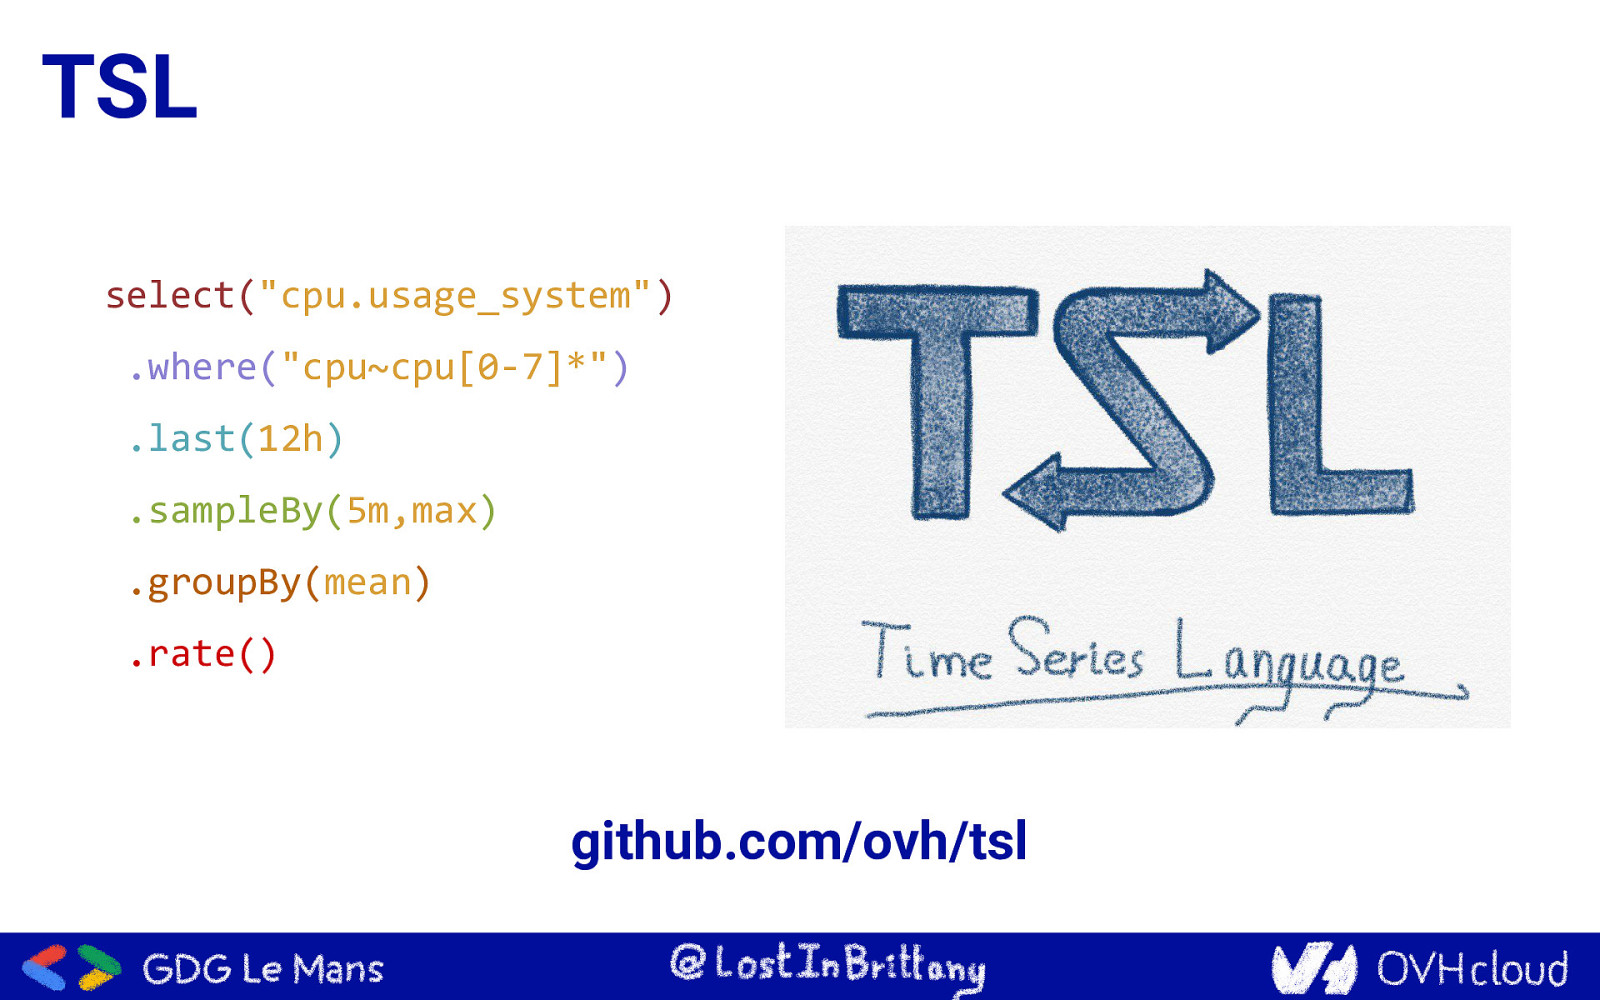
TSL select(“cpu.usage_system”) .where(“cpu~cpu[0-7]*”) .last(12h) .sampleBy(5m,max) .groupBy(mean) .rate() github.com/ovh/tsl
Metrics Live In-memory, high-performance Metrics instances
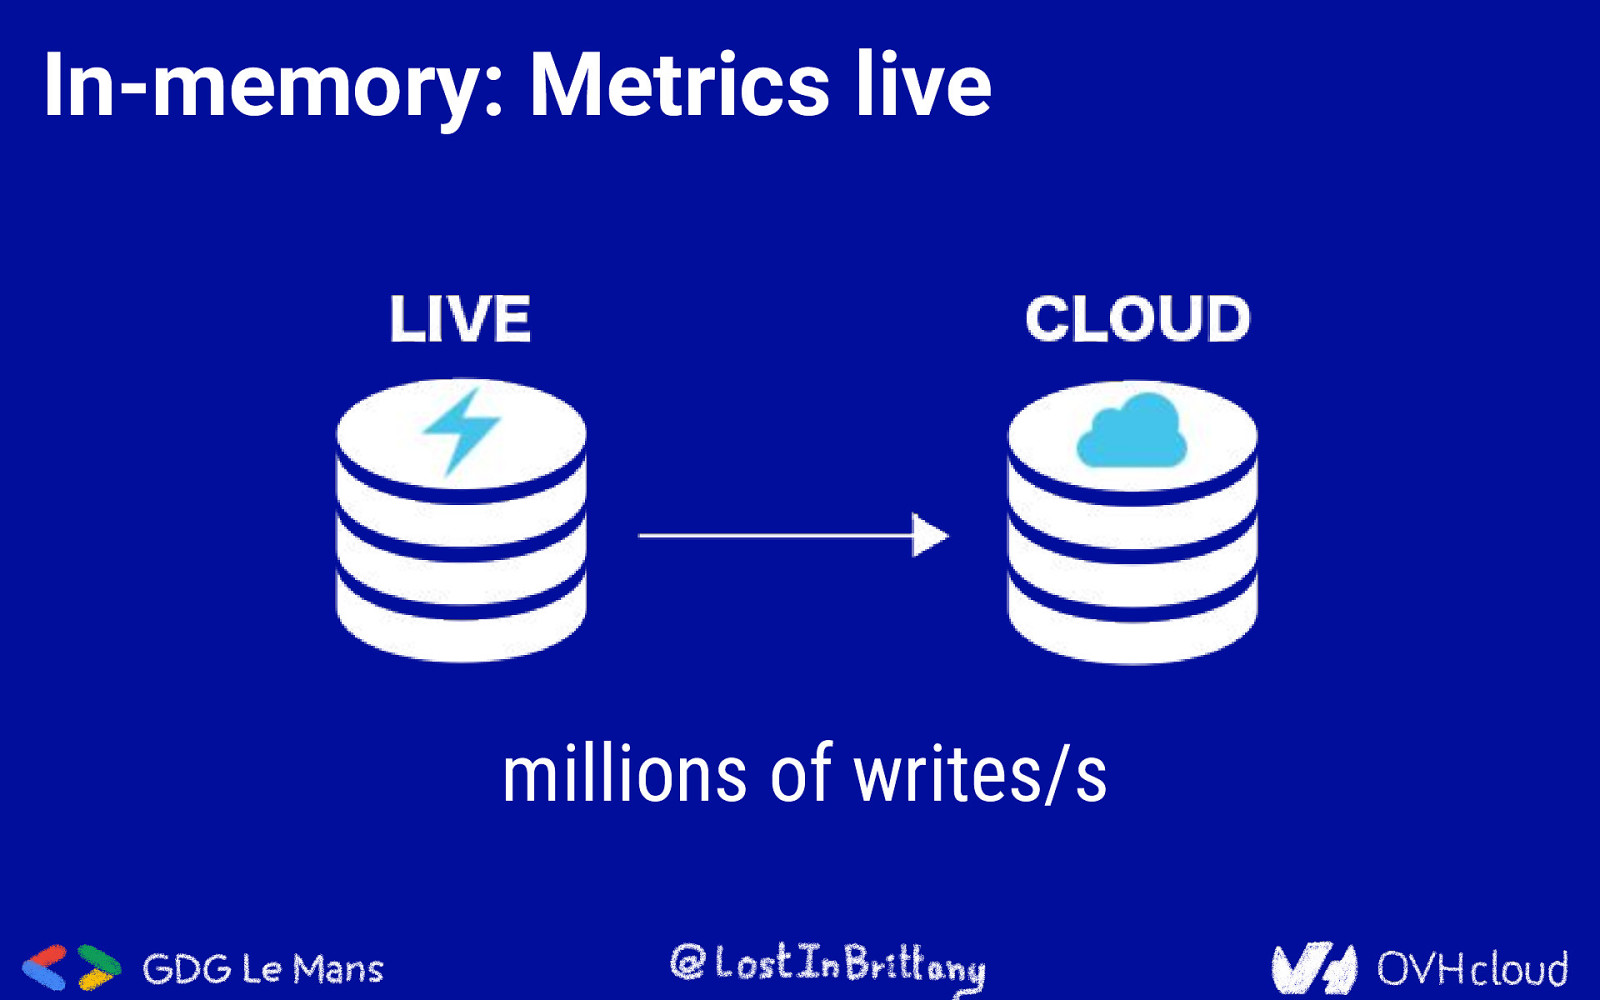
In-memory: Metrics live millions of writes/s
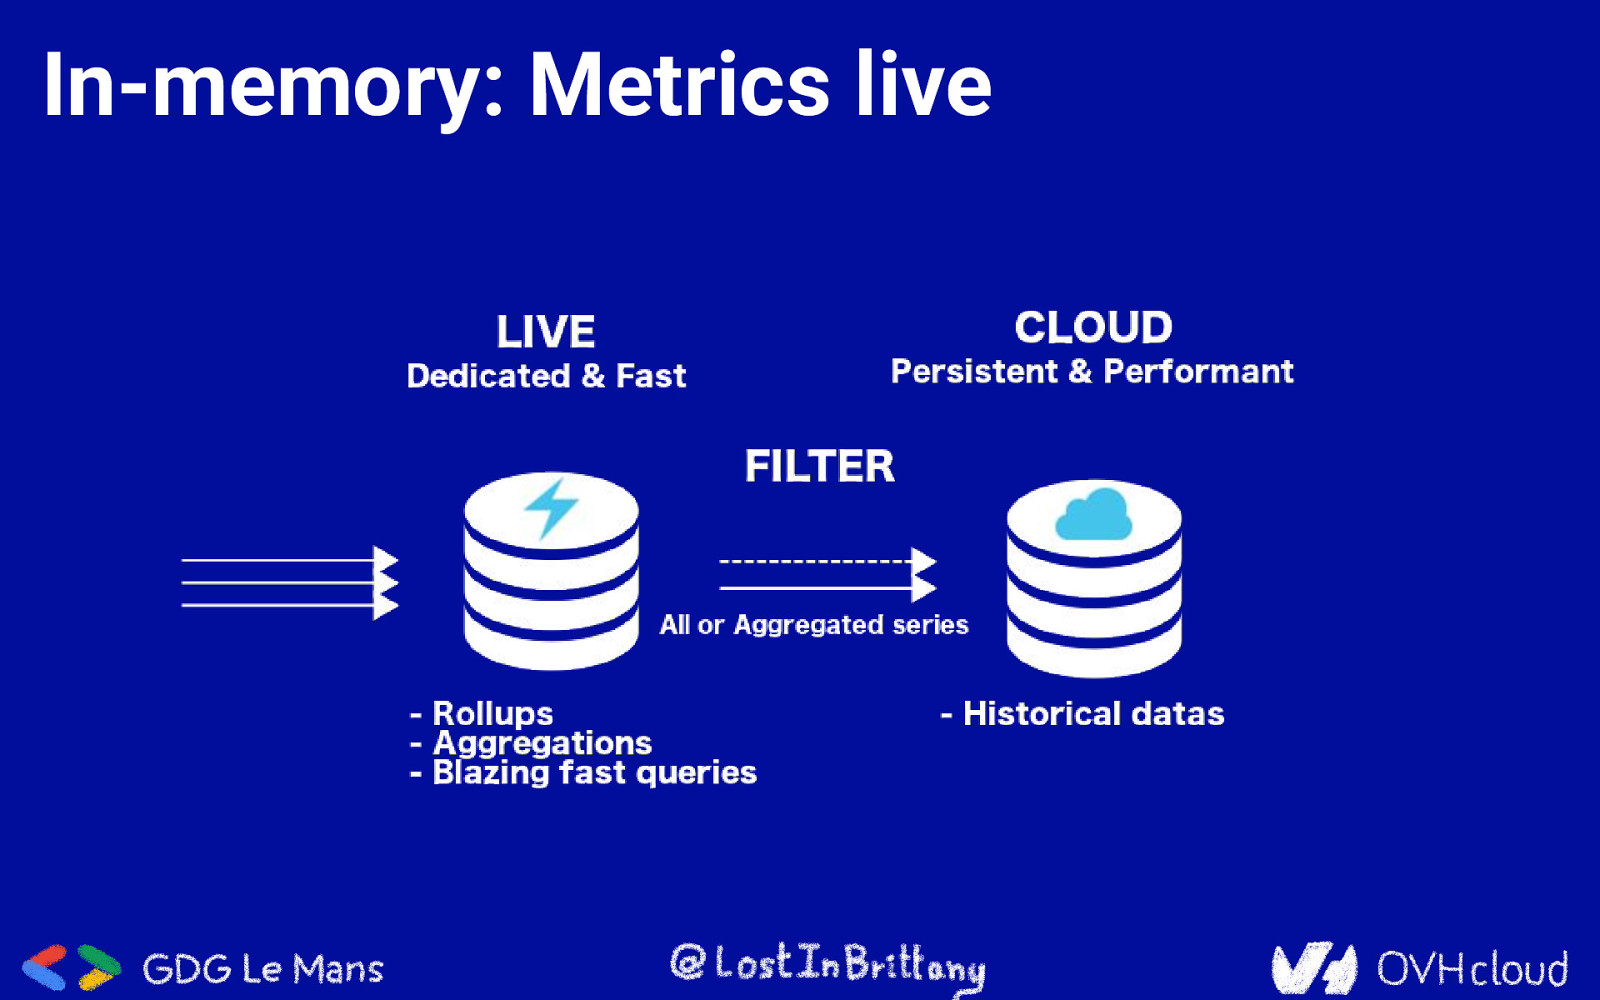
In-memory: Metrics live
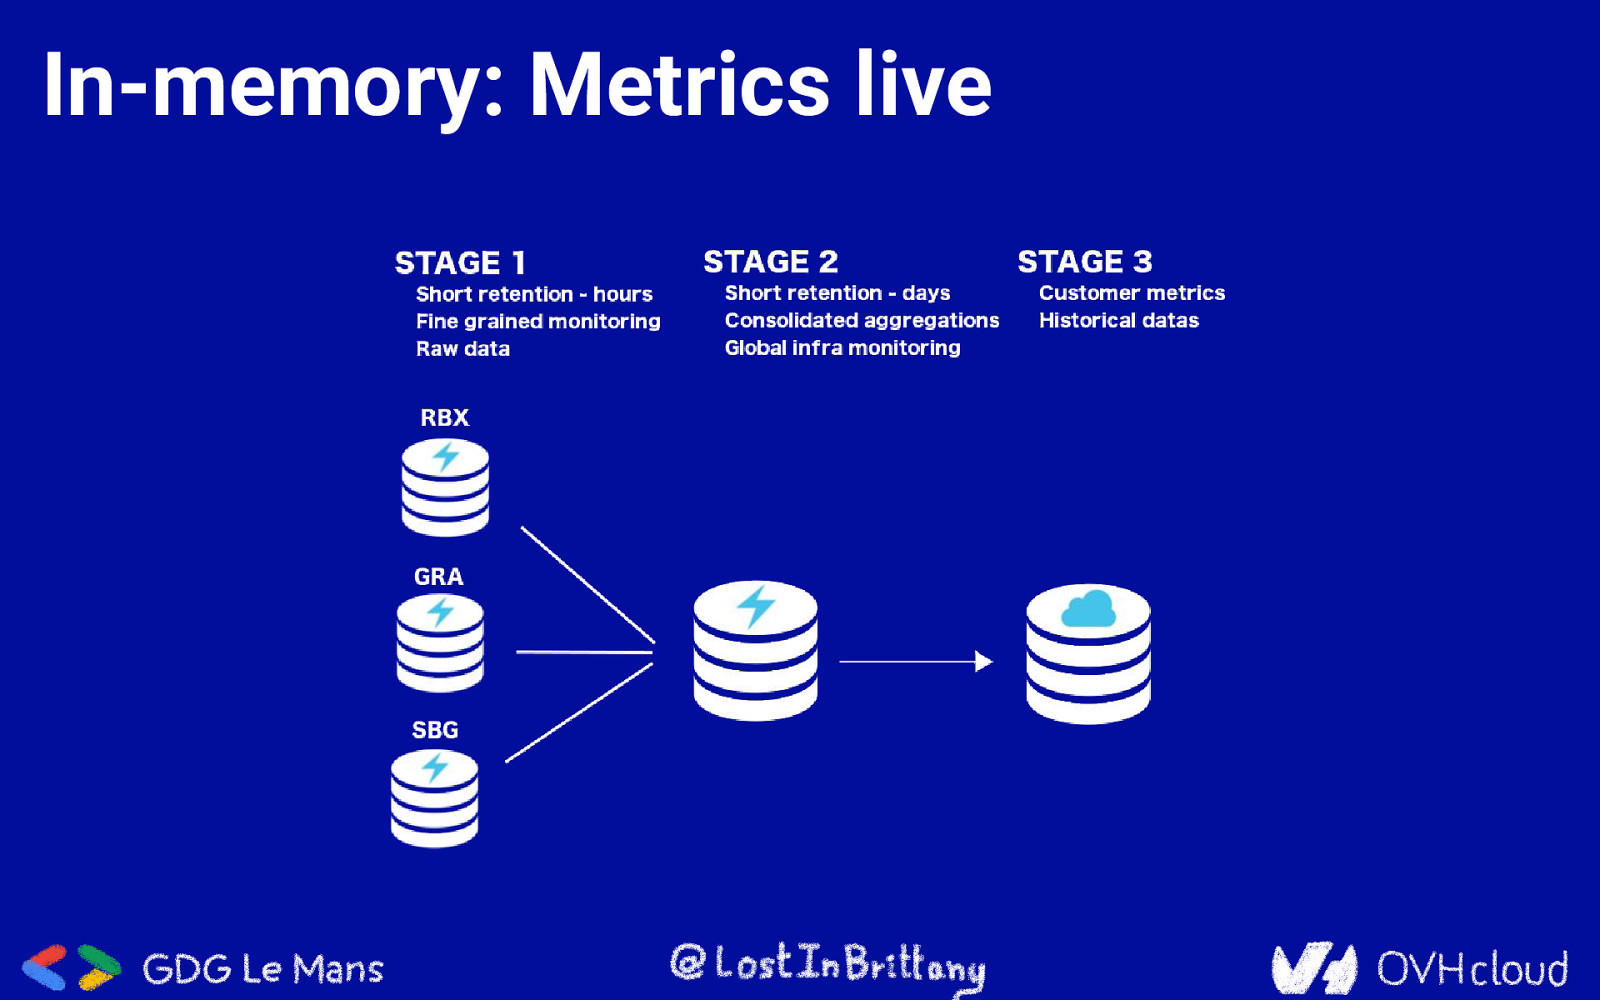
In-memory: Metrics live
Monitoring is only the beginning OVH Metrics answer to many other use cases
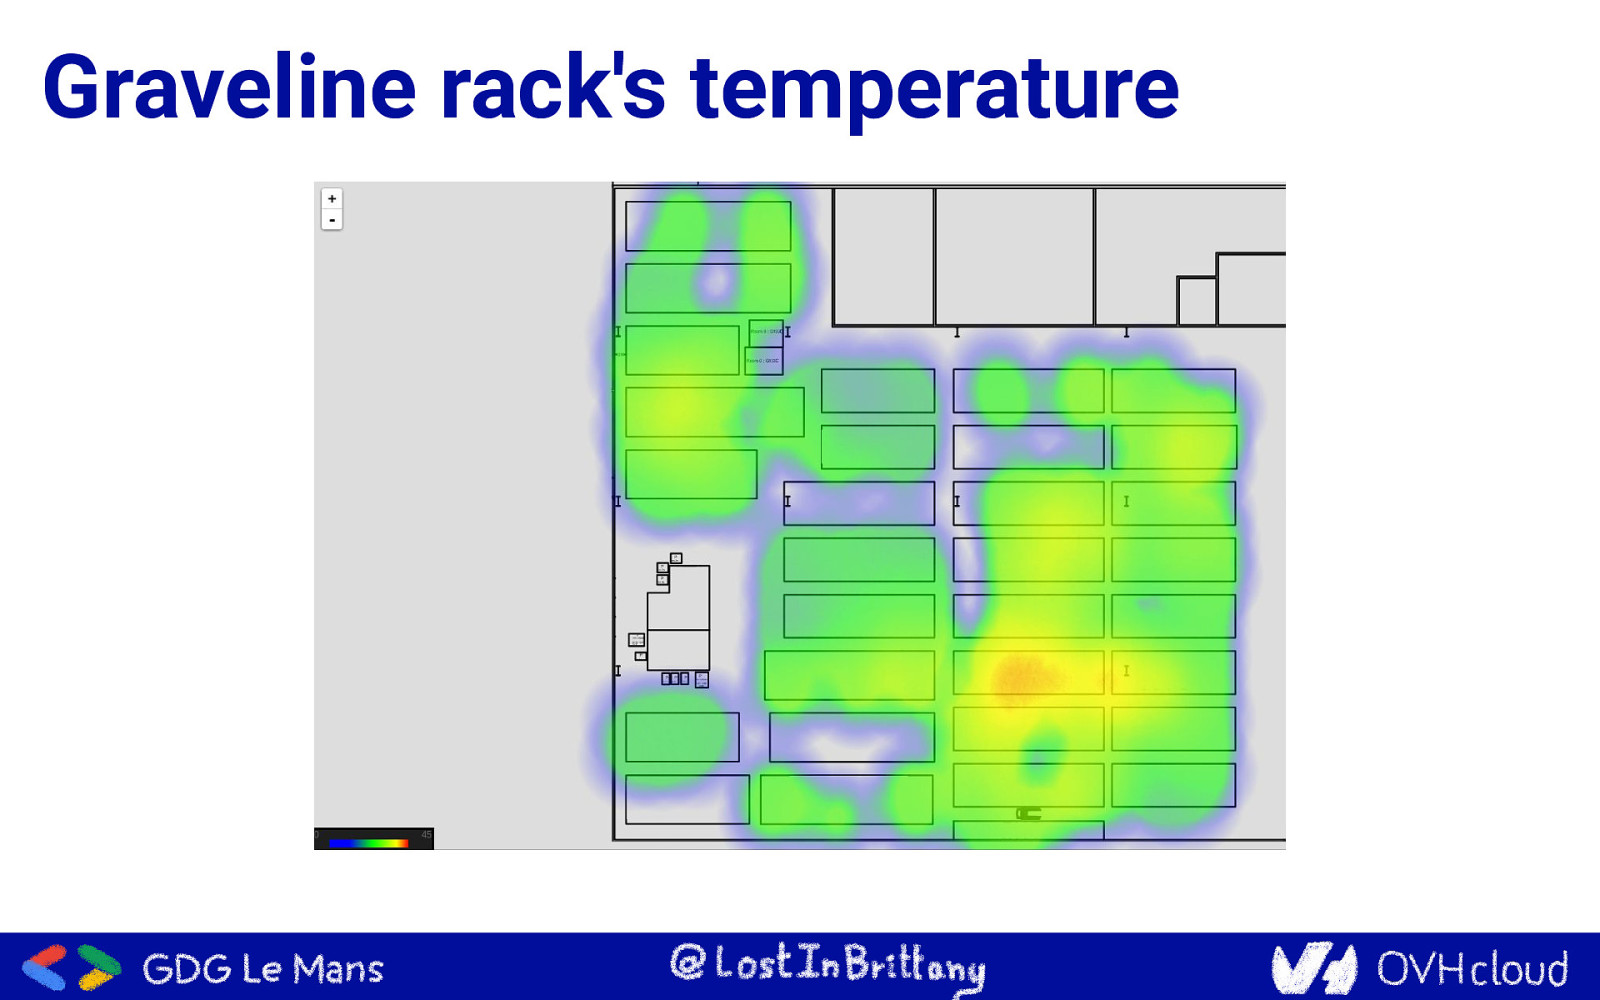
Graveline rack’s temperature
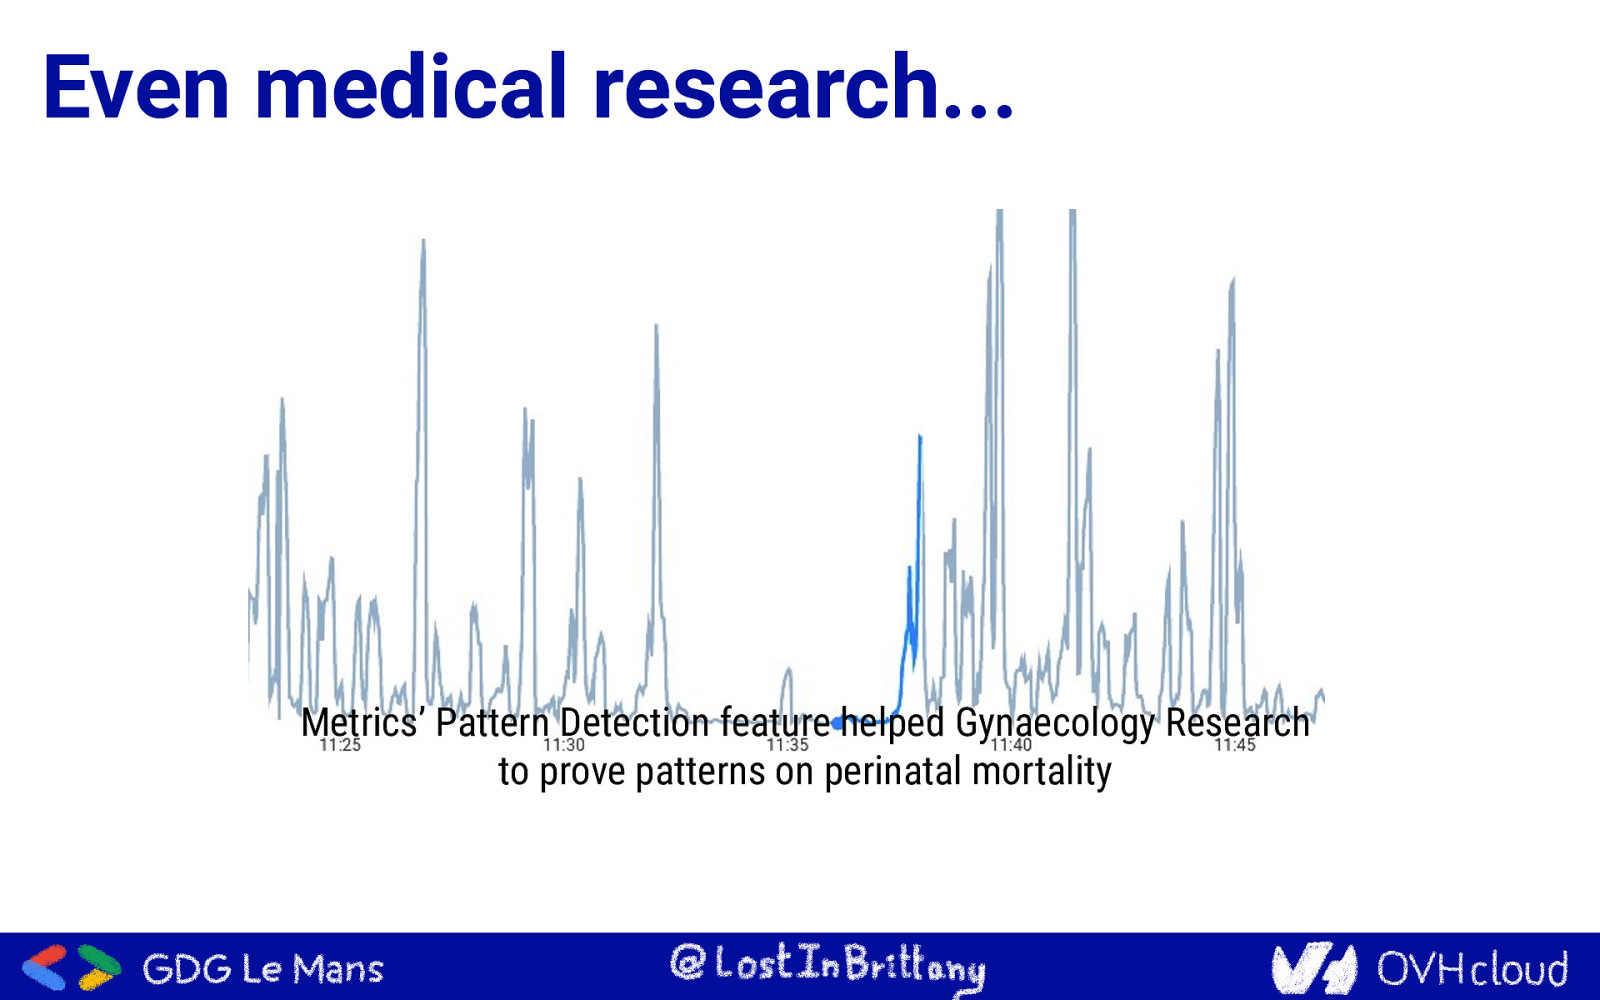
Even medical research… Metrics’ Pattern Detection feature helped Gynaecology Research to prove patterns on perinatal mortality
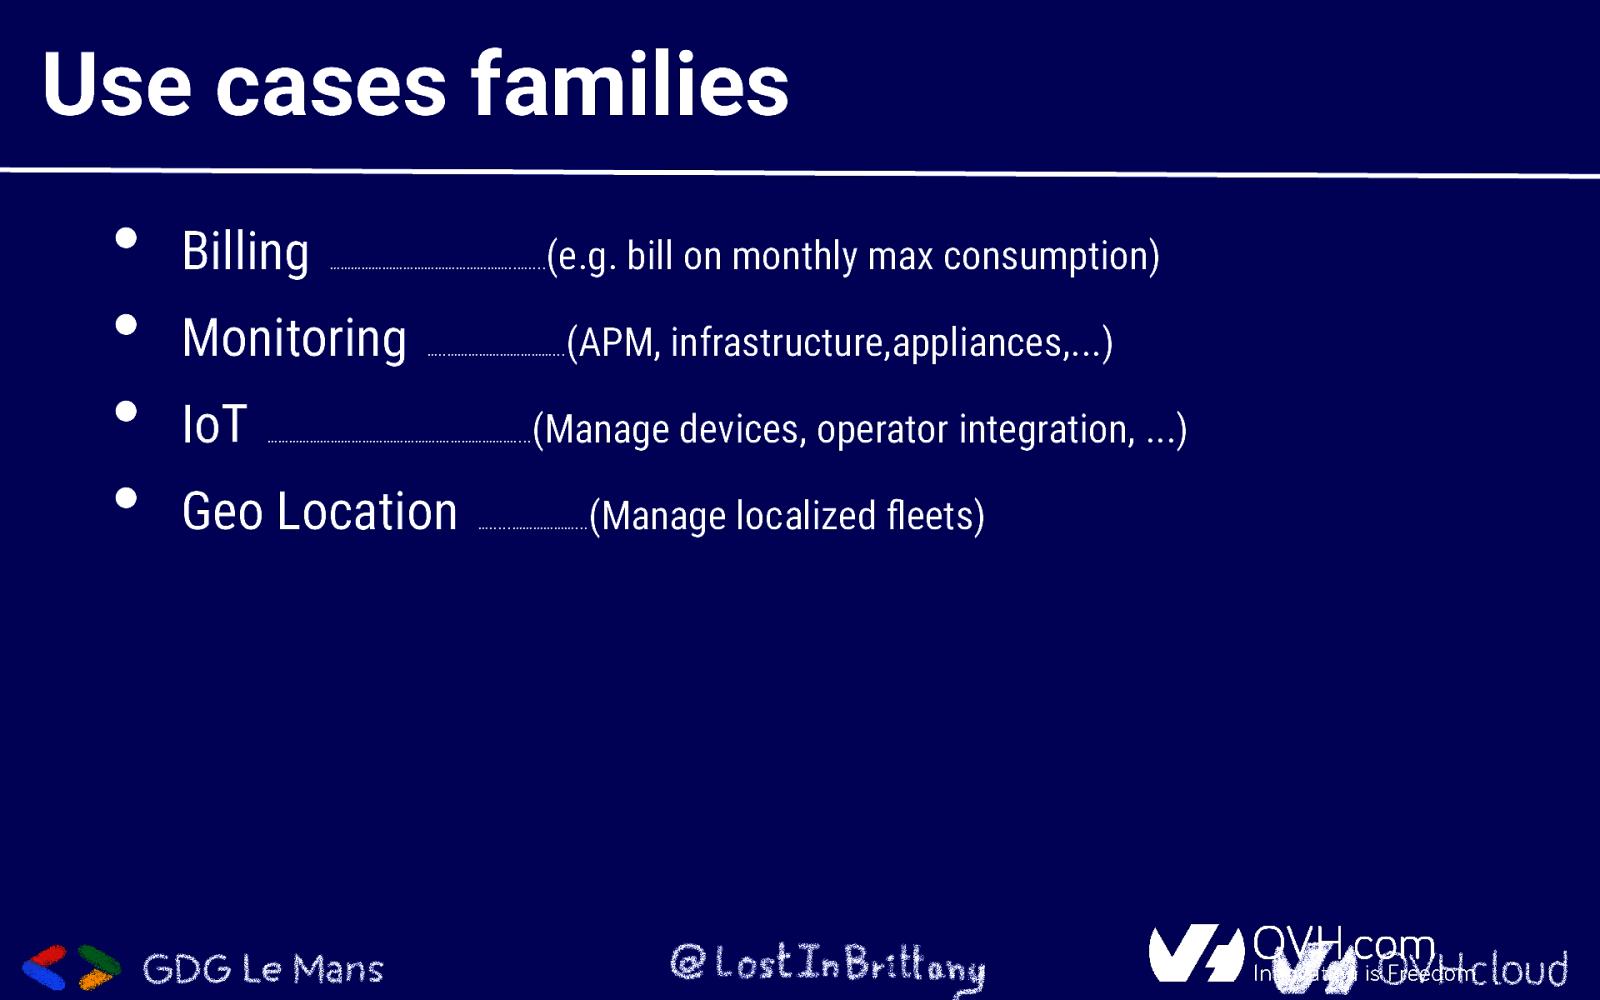
Use cases families • • • • Billing Monitoring IoT (e.g. bill on monthly max consumption) ……………………………………………..……. (APM, infrastructure,appliances,…) …..…………………………… (Manage devices, operator integration, …) …………………………………………….…………………. Geo Location (Manage localized fleets) ……..…………………
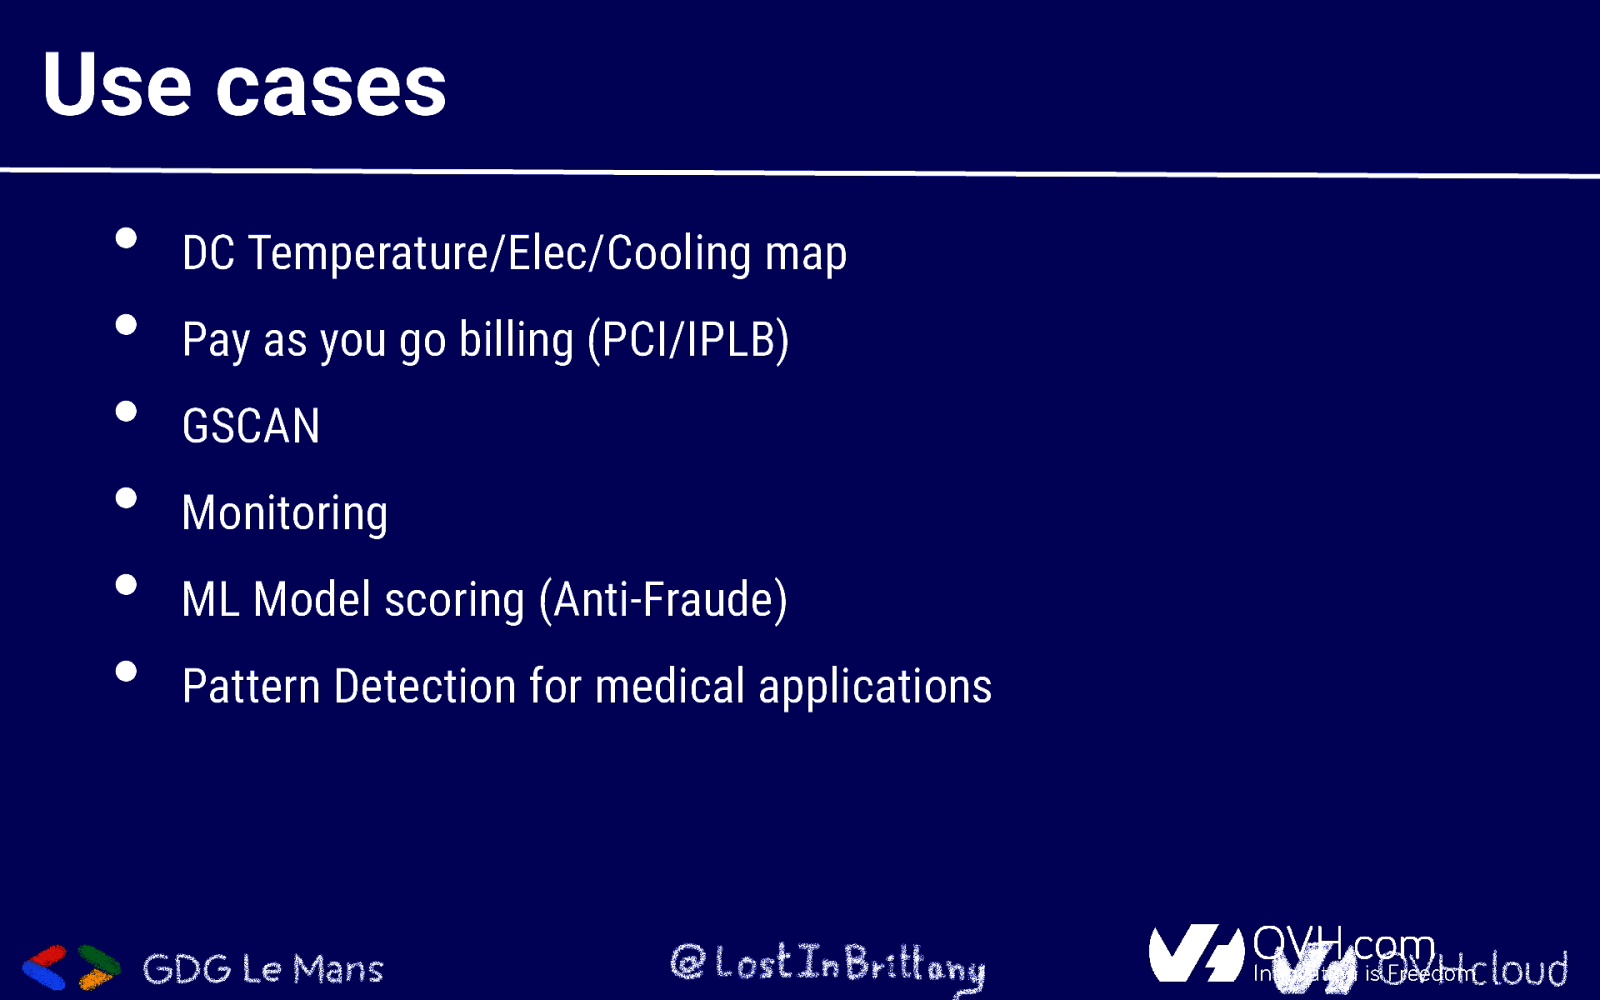
Use cases • • • • • • DC Temperature/Elec/Cooling map Pay as you go billing (PCI/IPLB) GSCAN Monitoring ML Model scoring (Anti-Fraude) Pattern Detection for medical applications
SREing Metrics With a great power comes a great responsibility
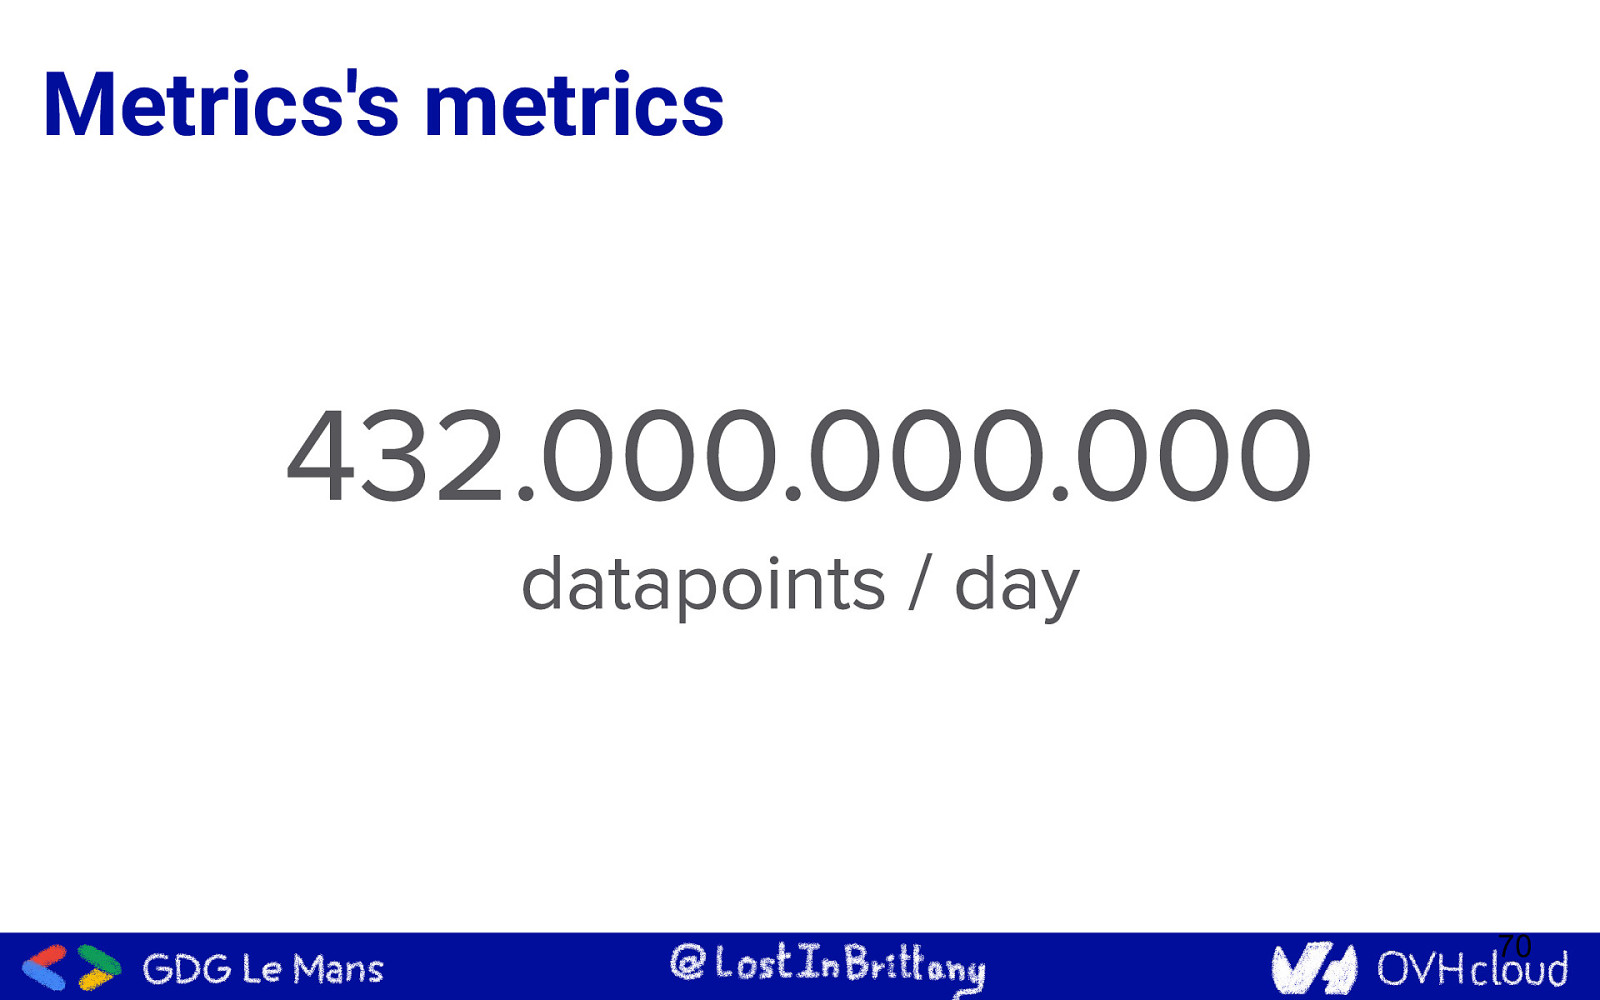
Metrics’s metrics 70
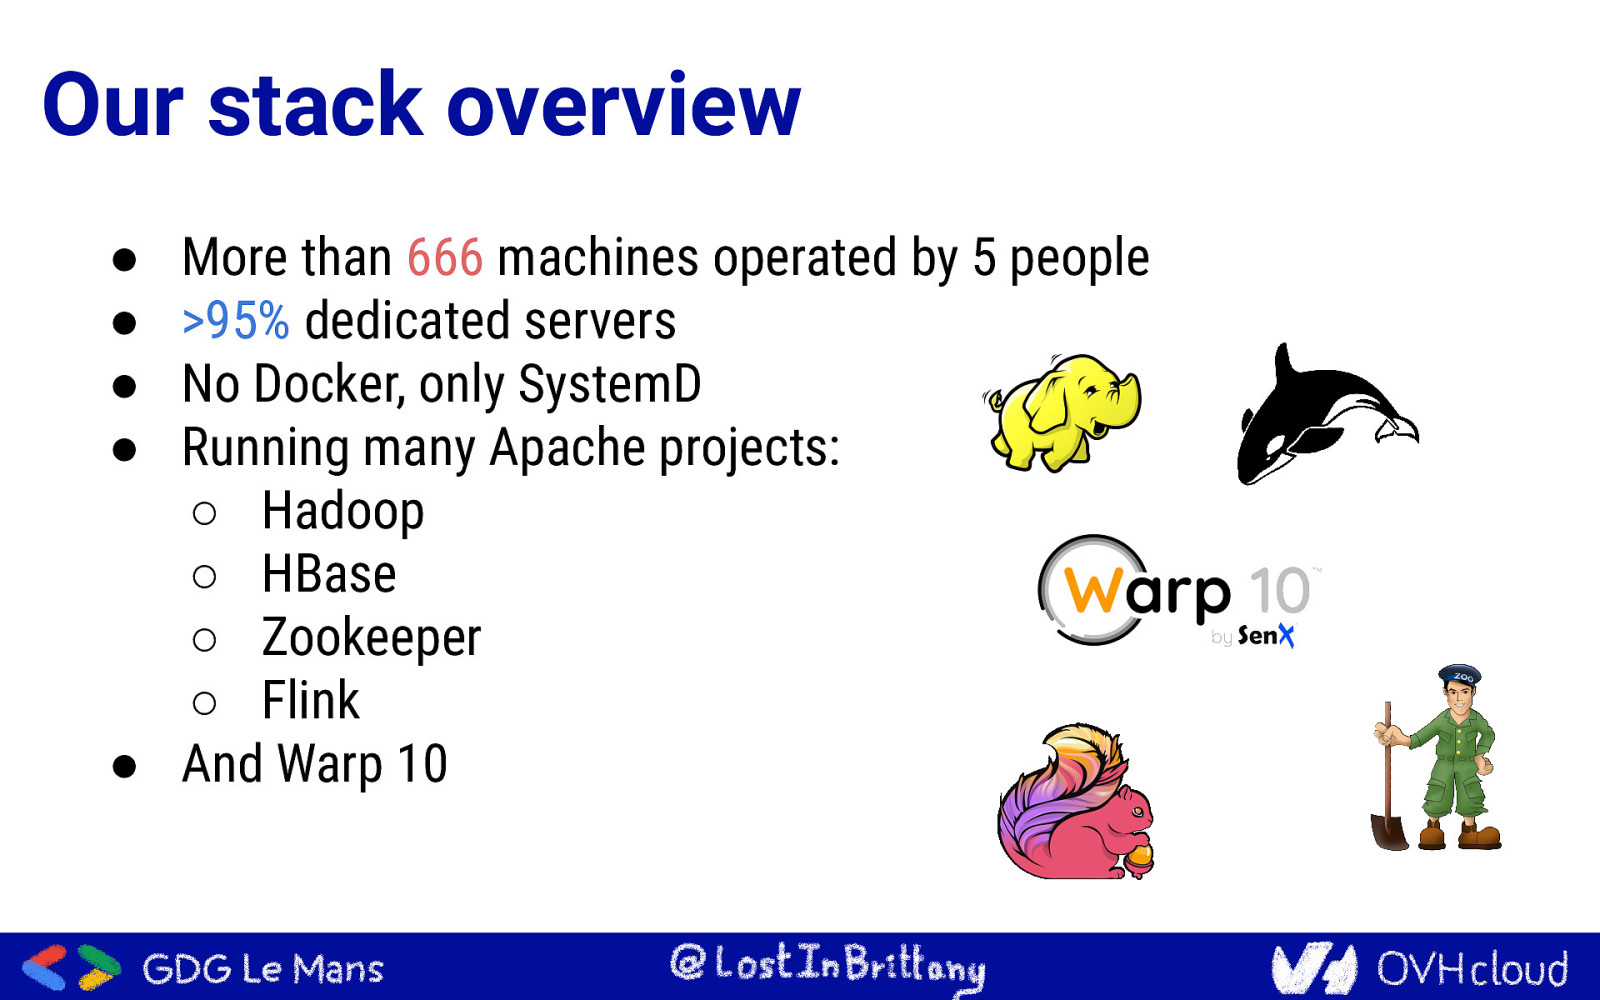
Our stack overview More than 666 machines operated by 5 people >95% dedicated servers No Docker, only SystemD Running many Apache projects: ○ Hadoop ○ HBase ○ Zookeeper ○ Flink ● And Warp 10 ● ● ● ●
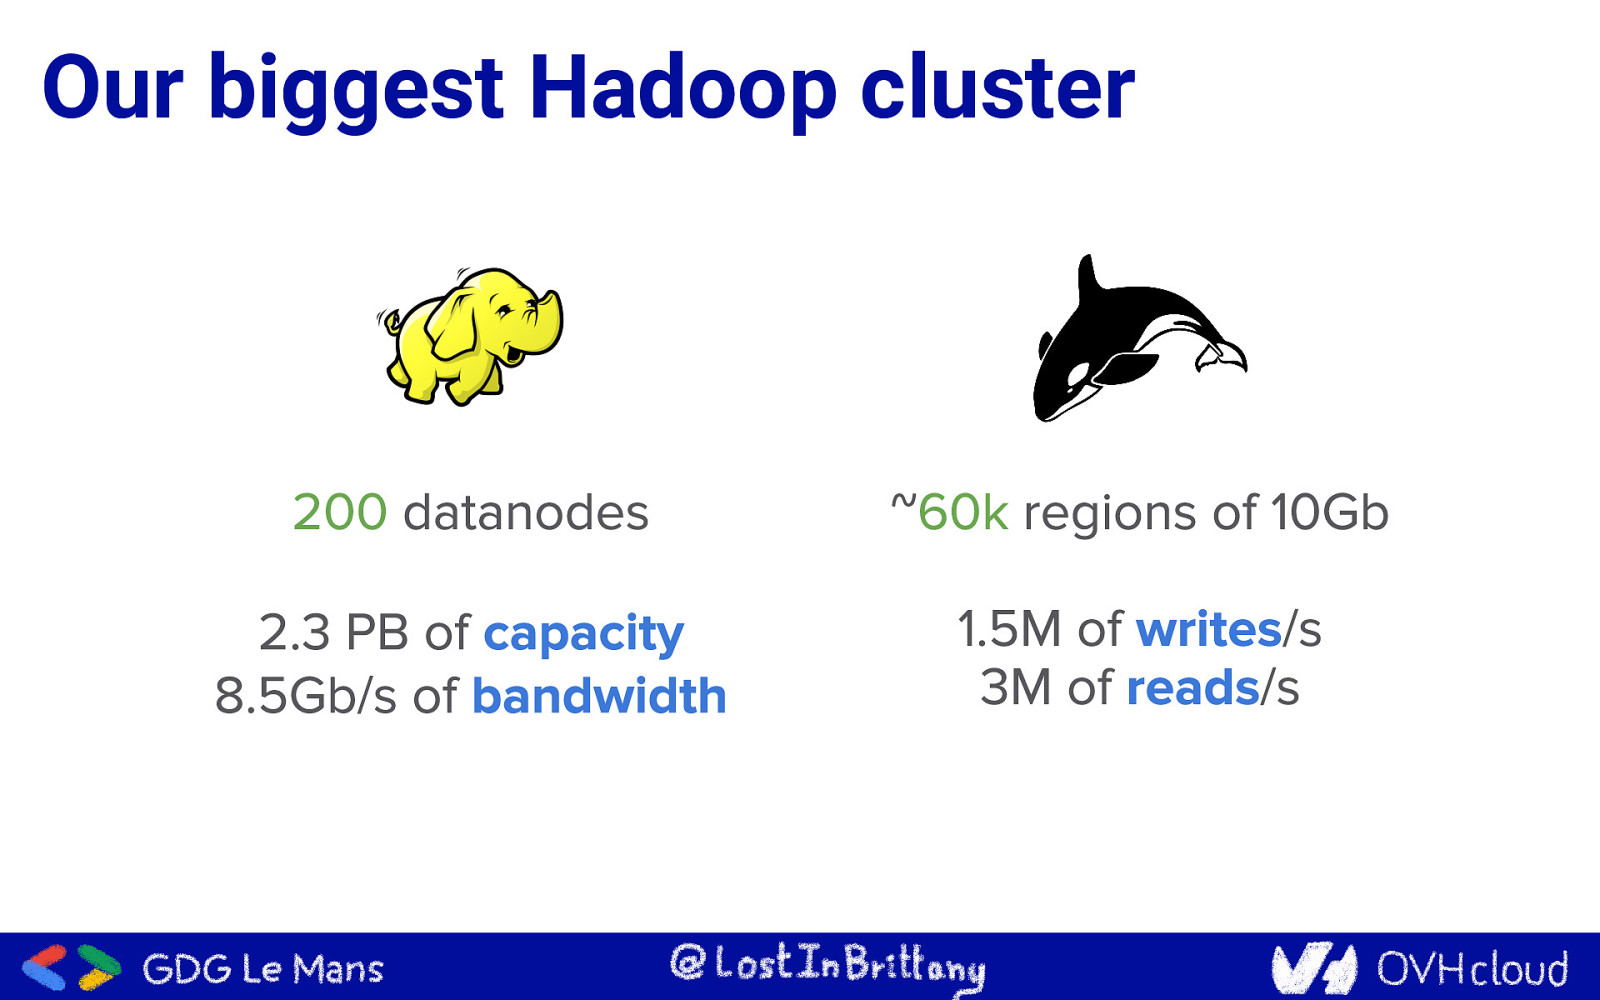
Our biggest Hadoop cluster

Hadoop need a lot of
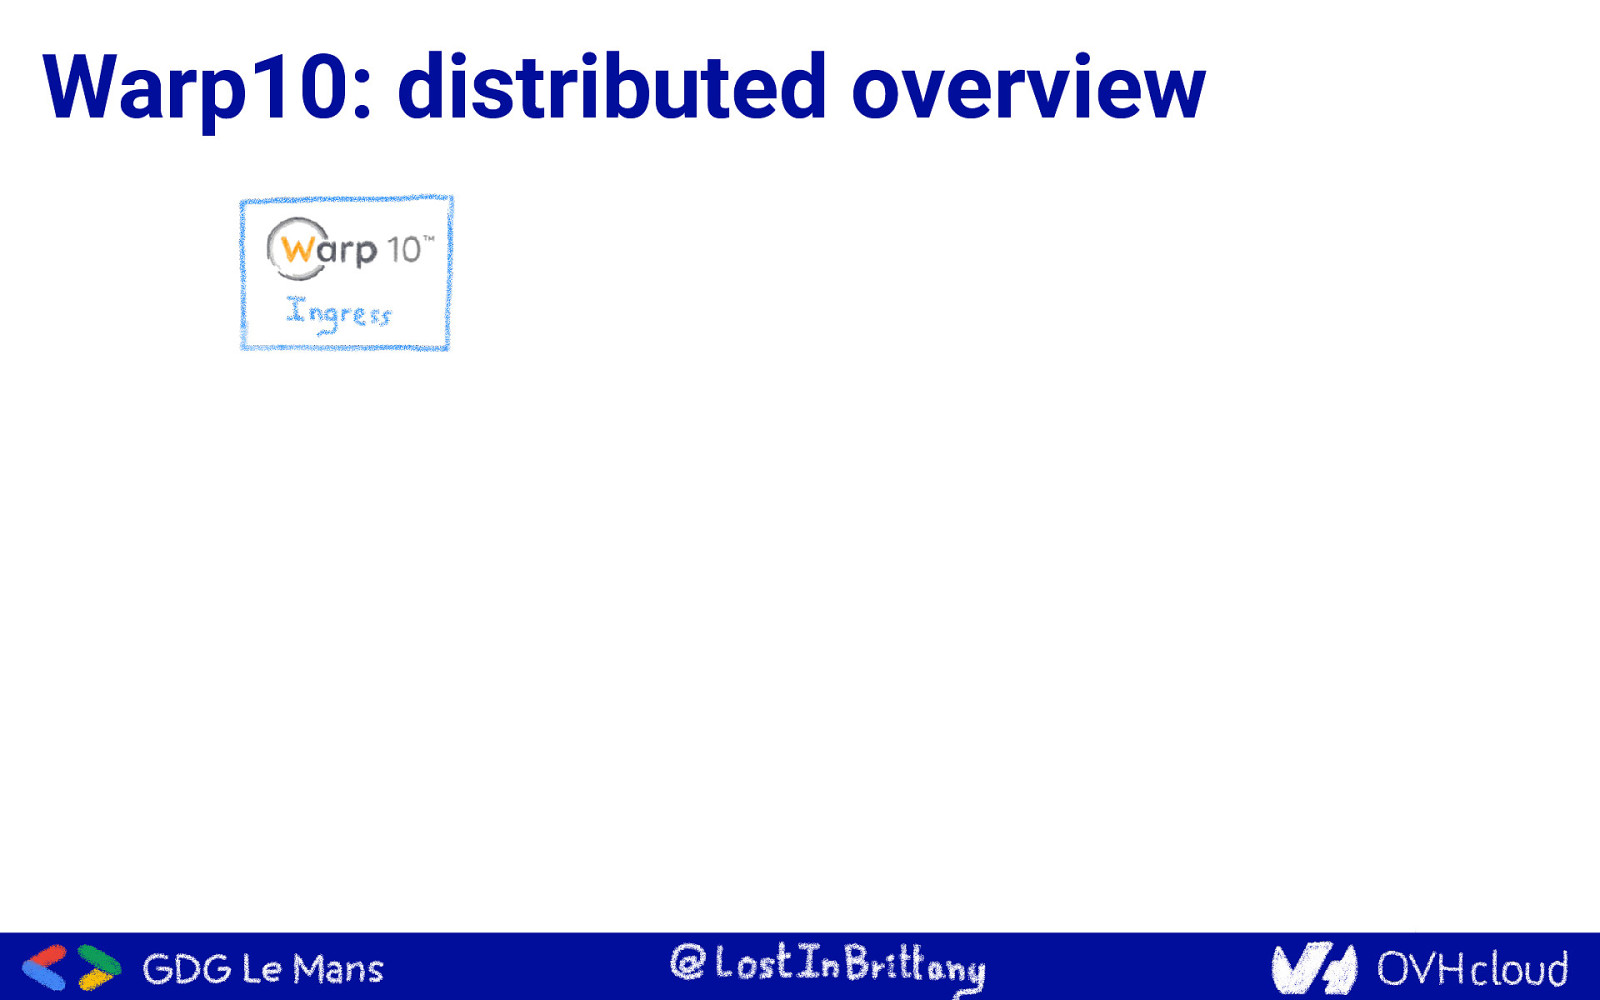
Warp10: distributed overview
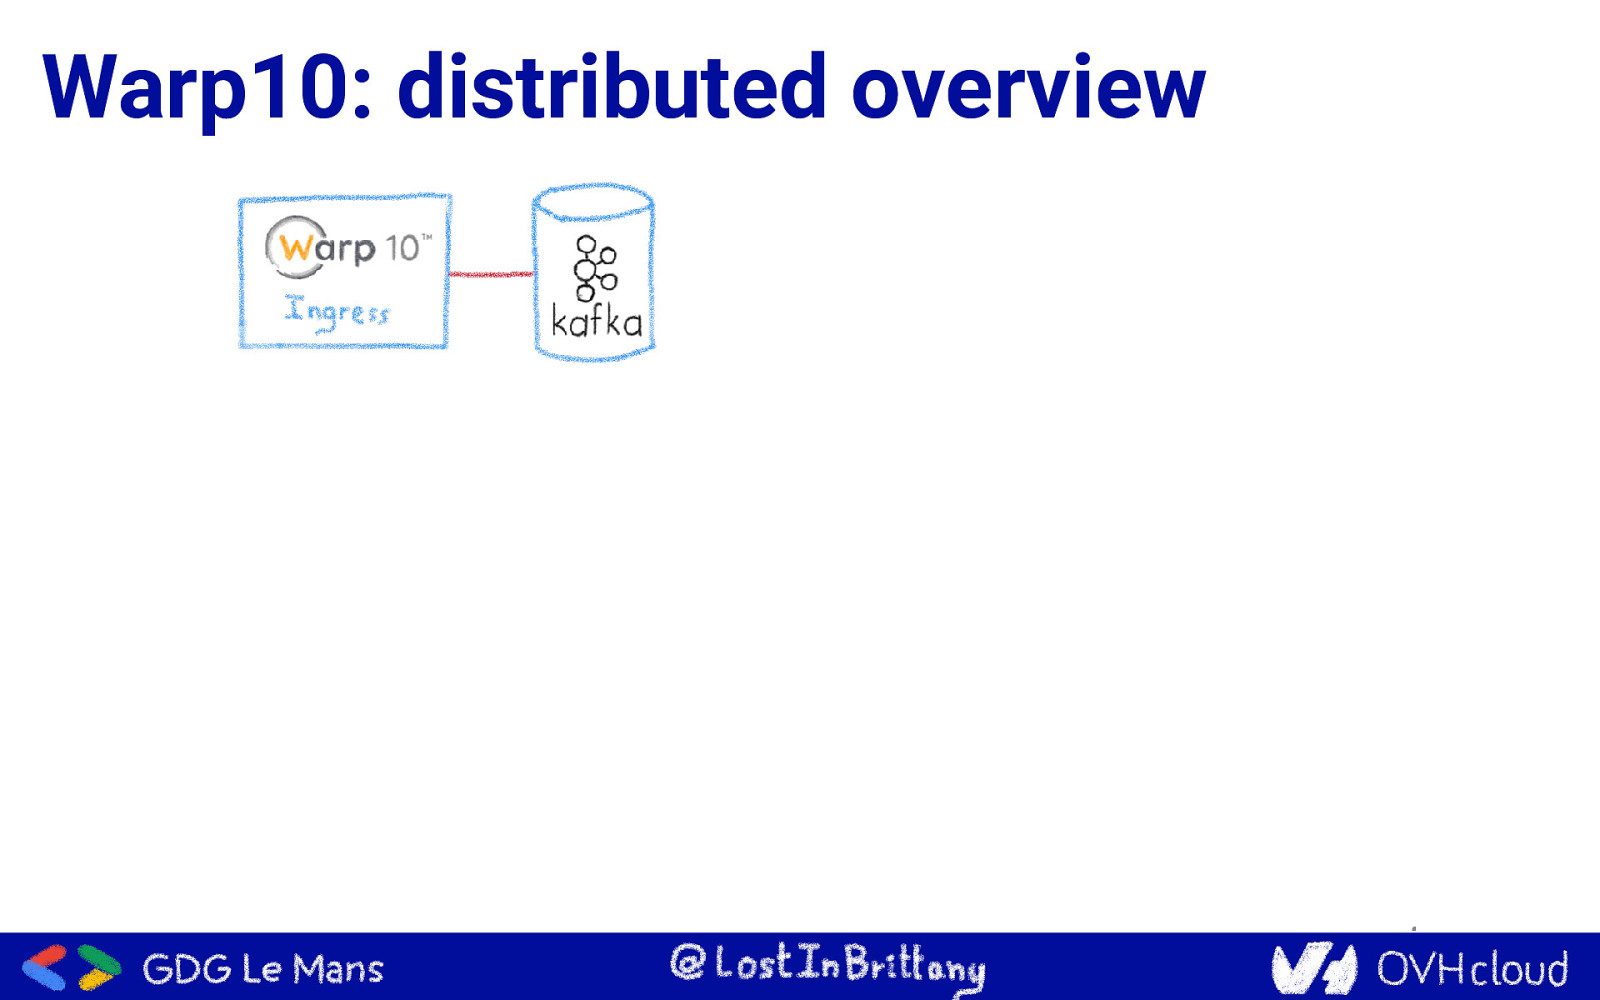
Warp10: distributed overview
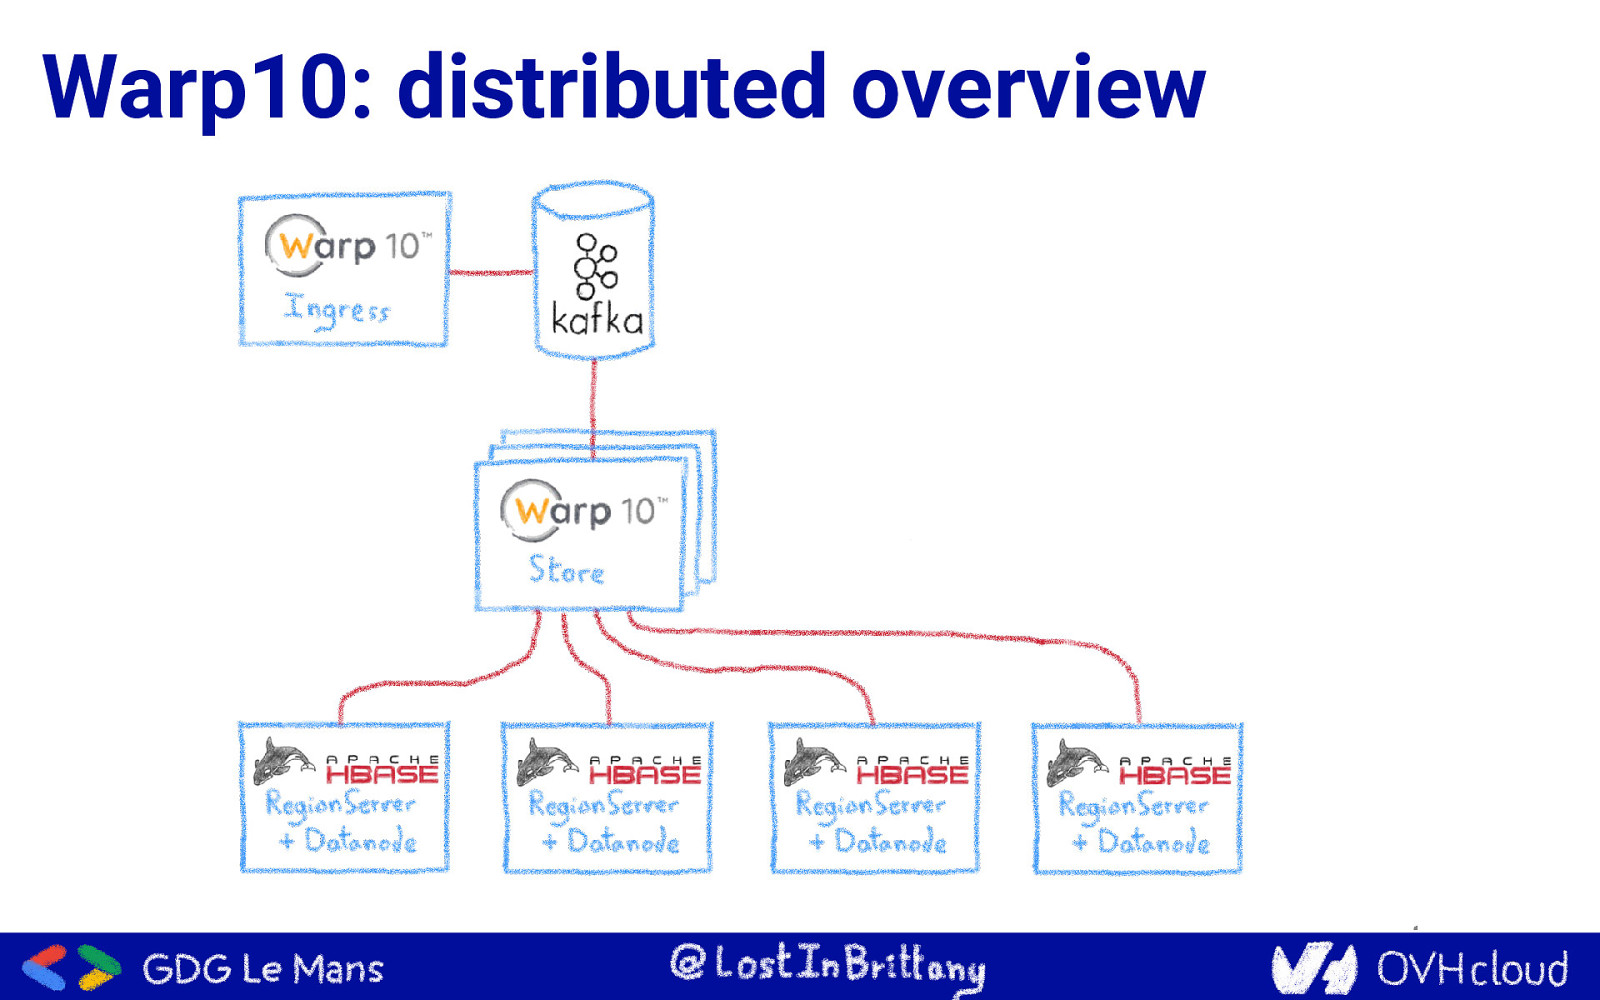
Warp10: distributed overview
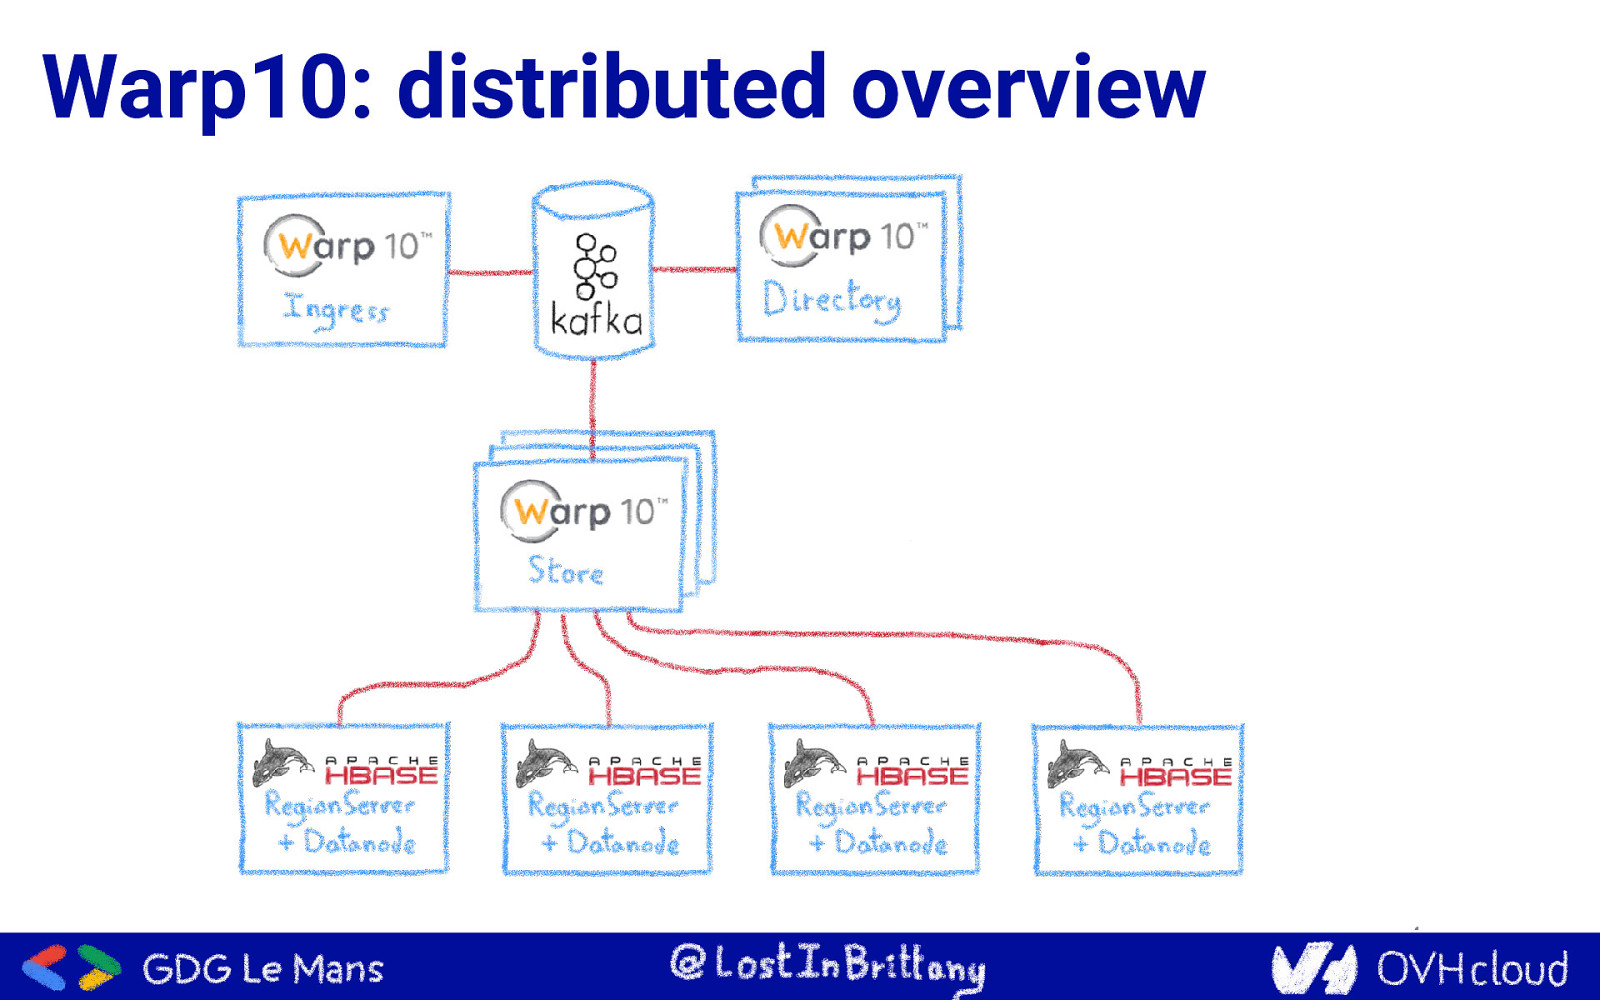
Warp10: distributed overview
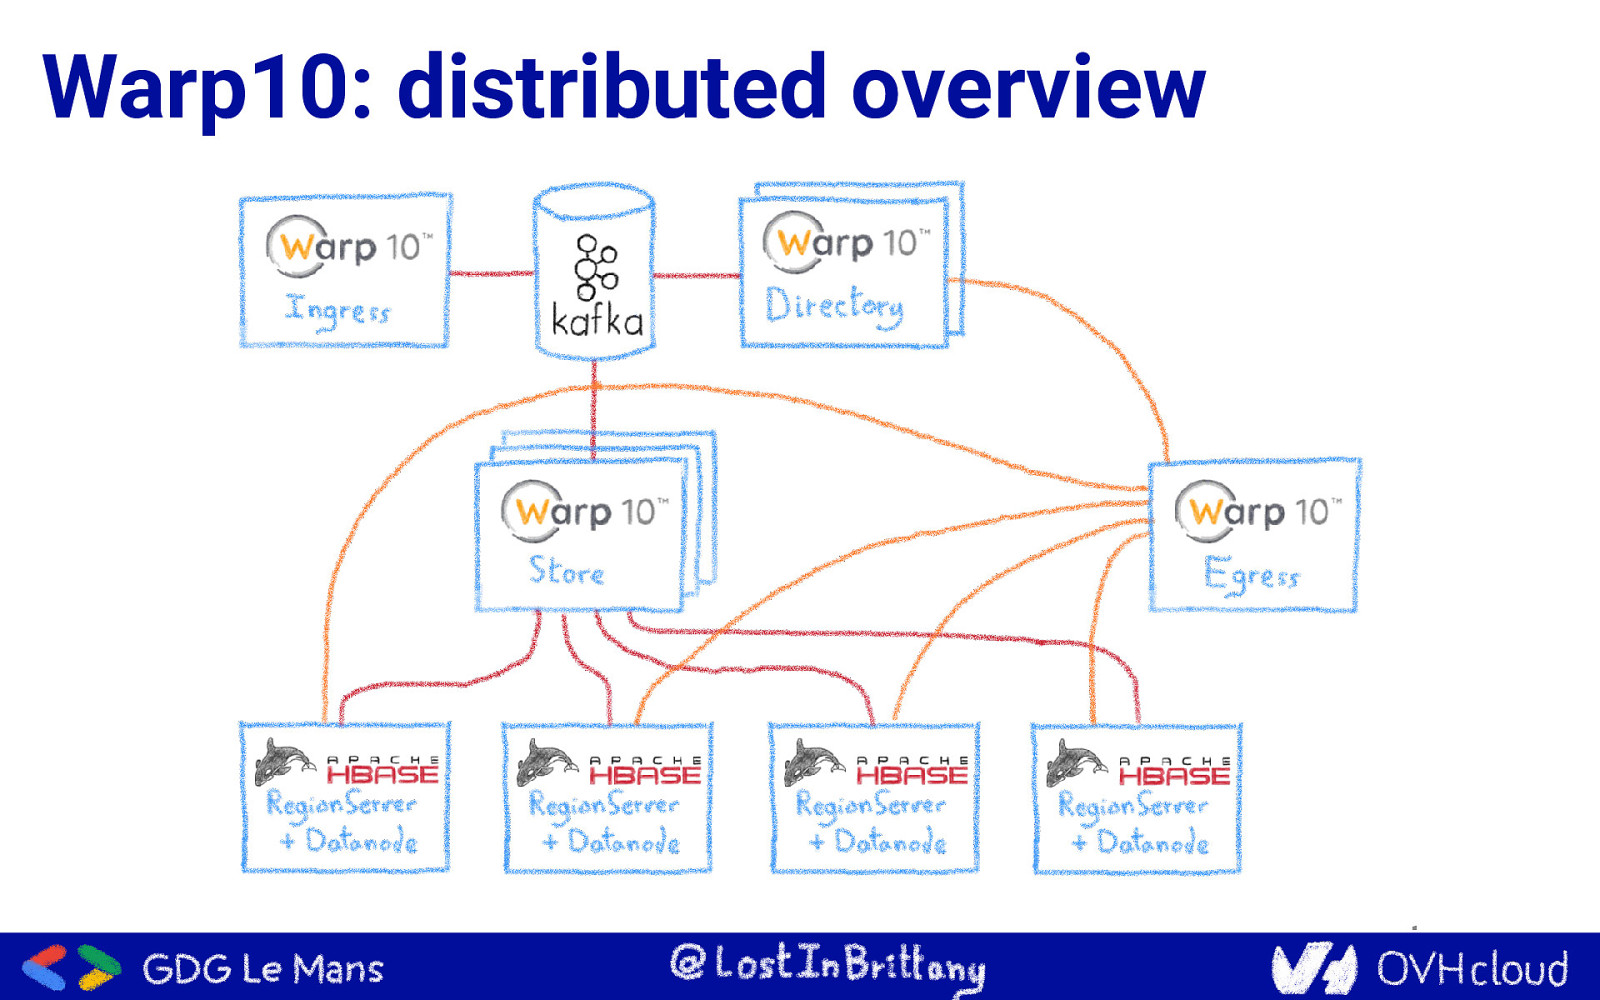
Warp10: distributed overview
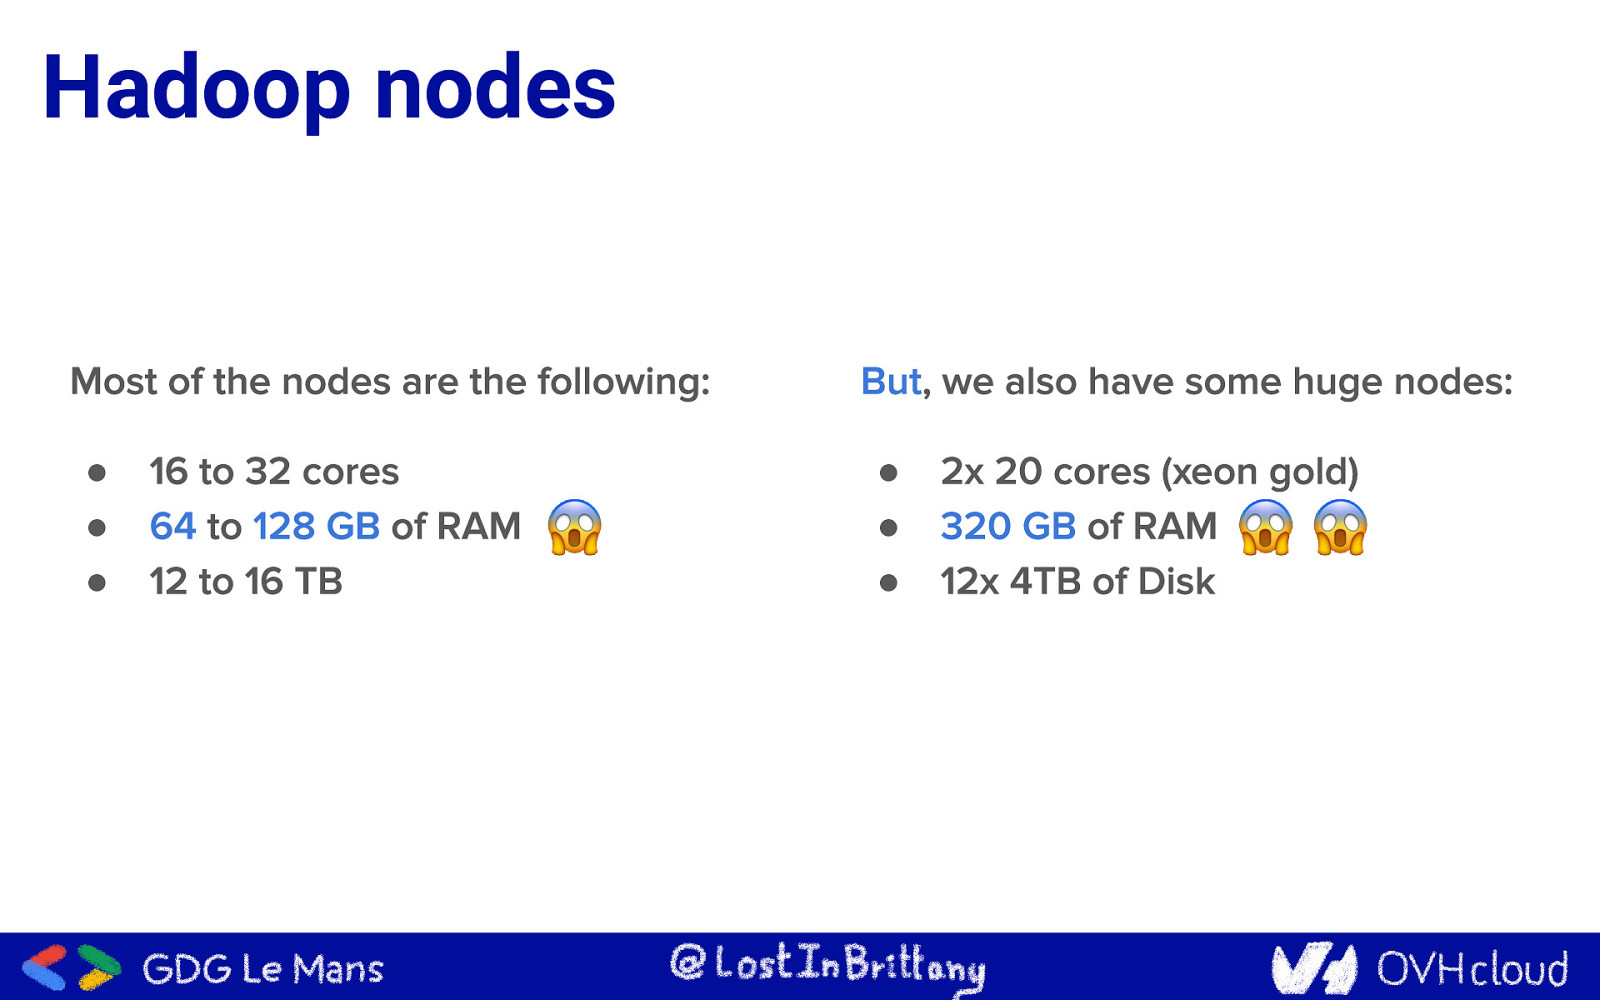
Hadoop nodes ● ● ● ● ● ●
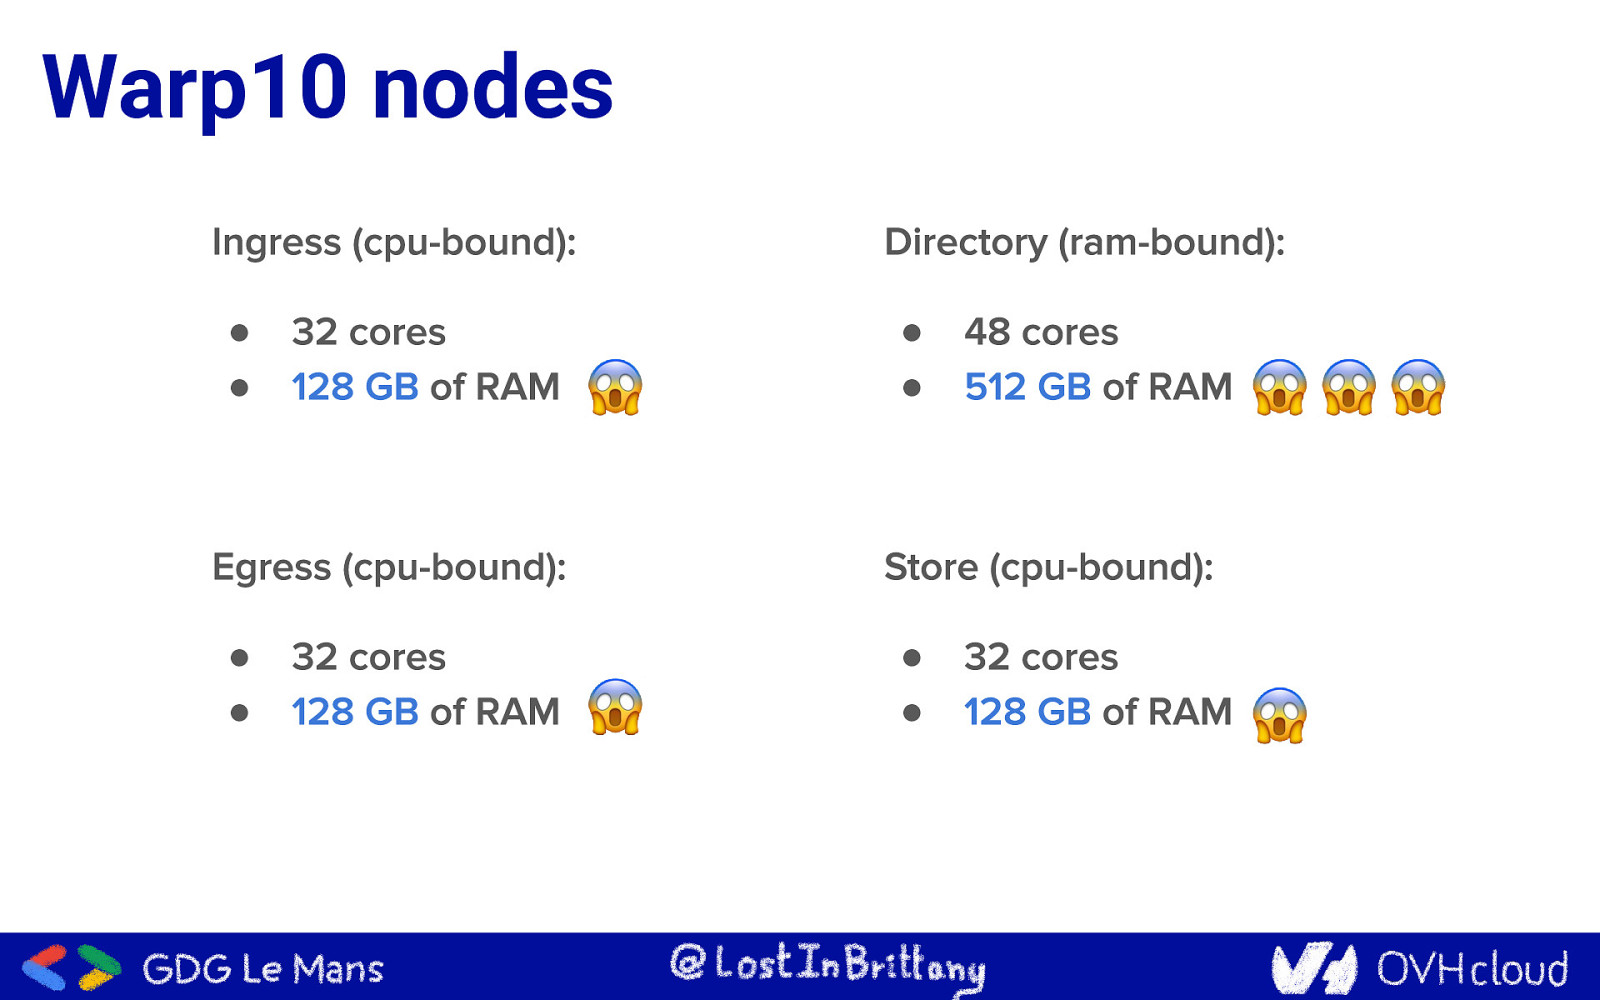
Warp10 nodes ● ● ● ● ● ● ● ●
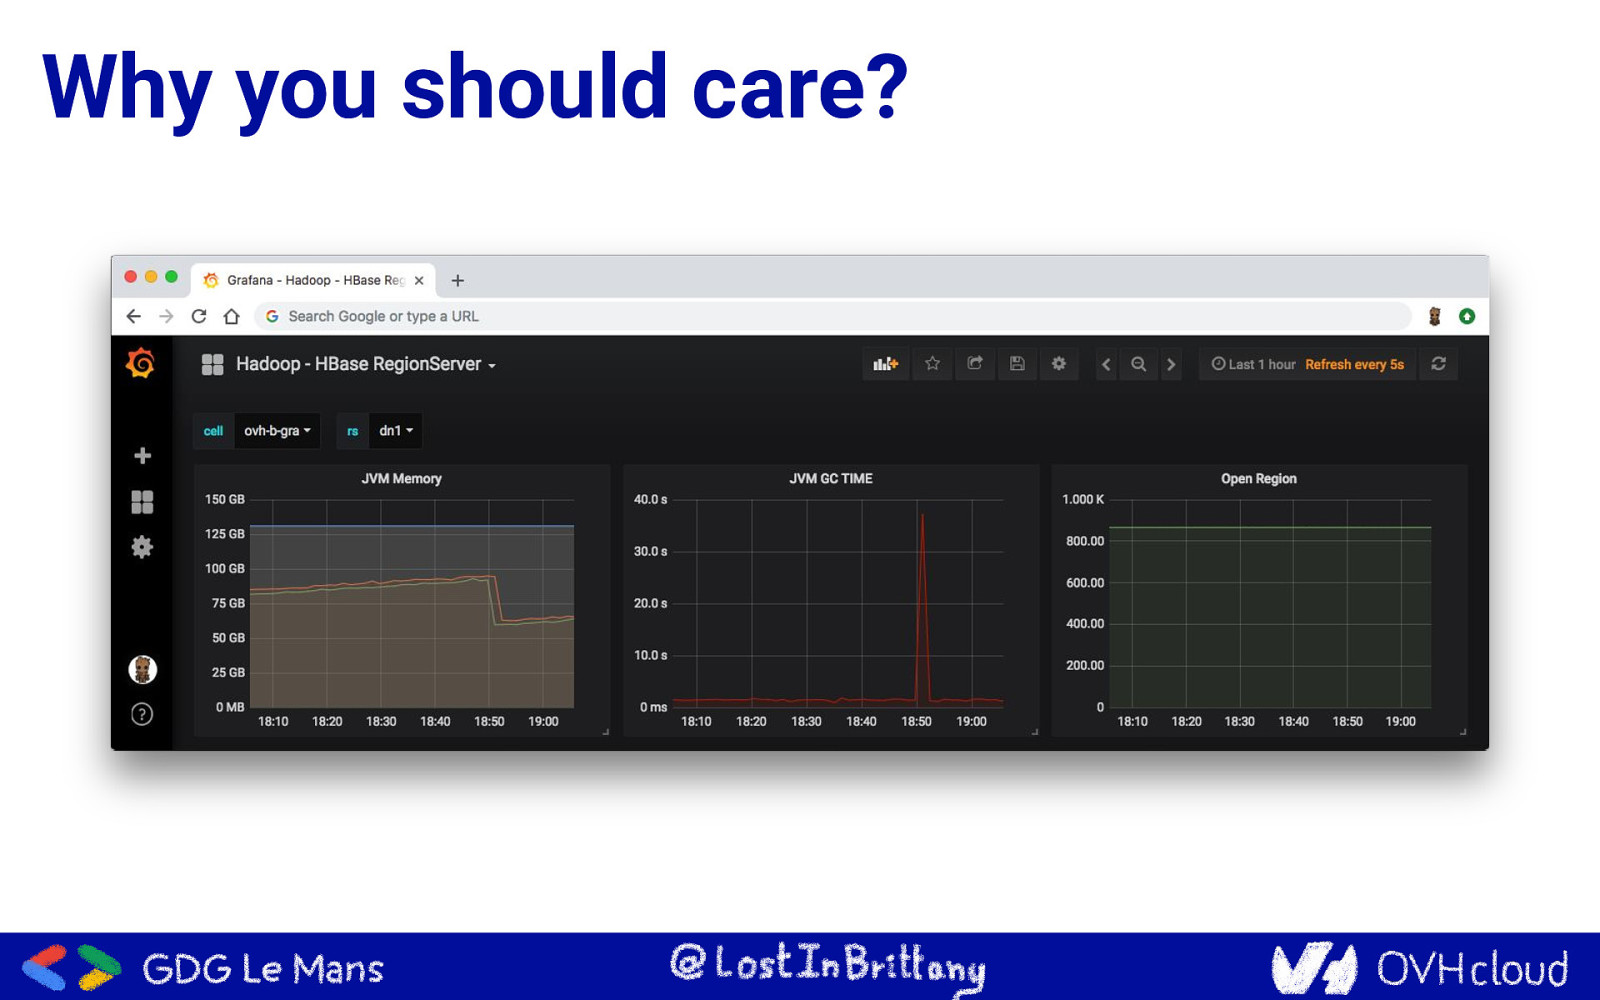
Why you should care?
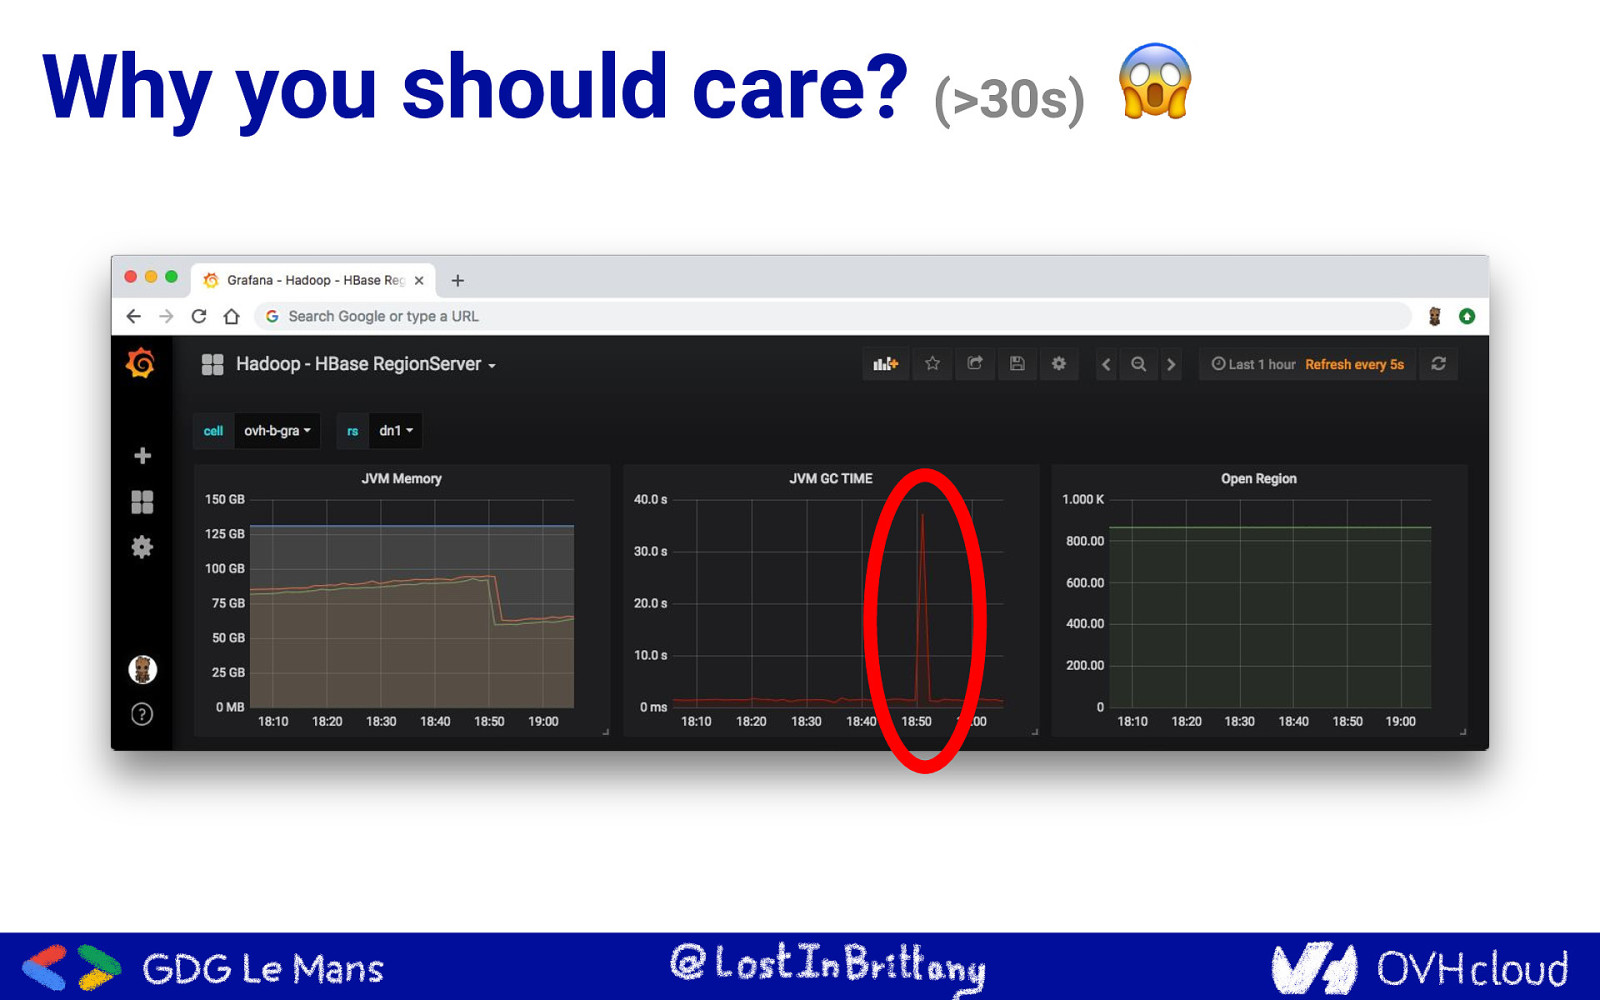
Why you should care? (>30s)
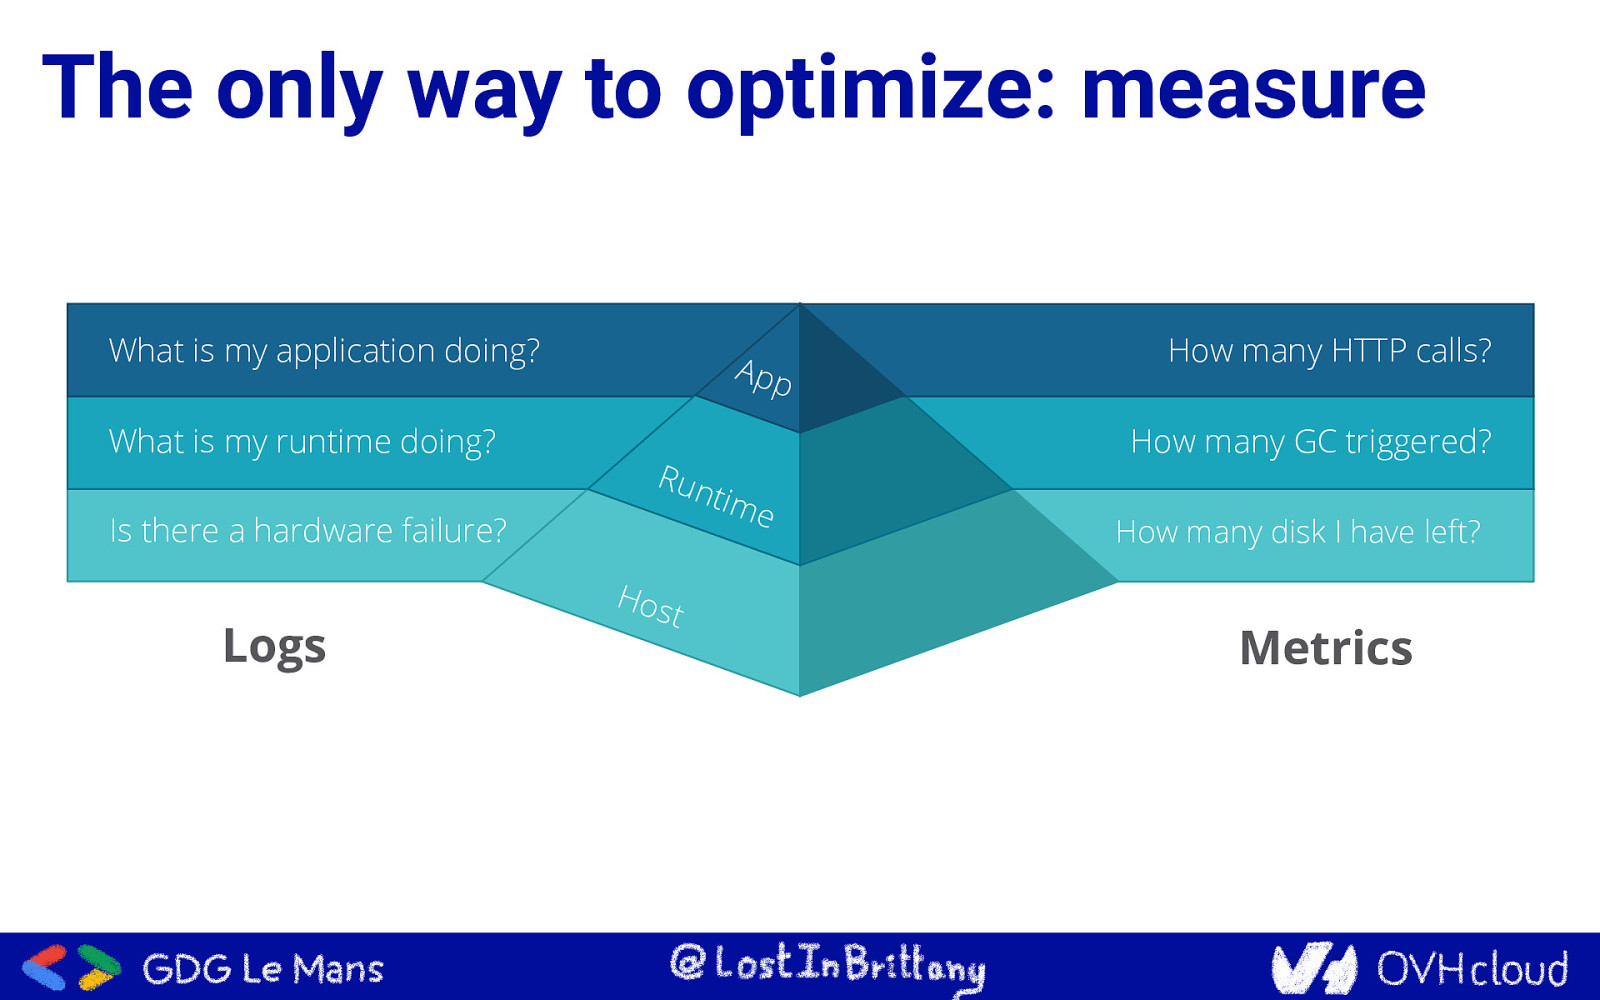
The only way to optimize: measure What is my application doing? App What is my runtime doing? How many GC triggered? Run tim Is there a hardware failure? Logs How many HTTP calls? Hos t e How many disk I have left? Metrics
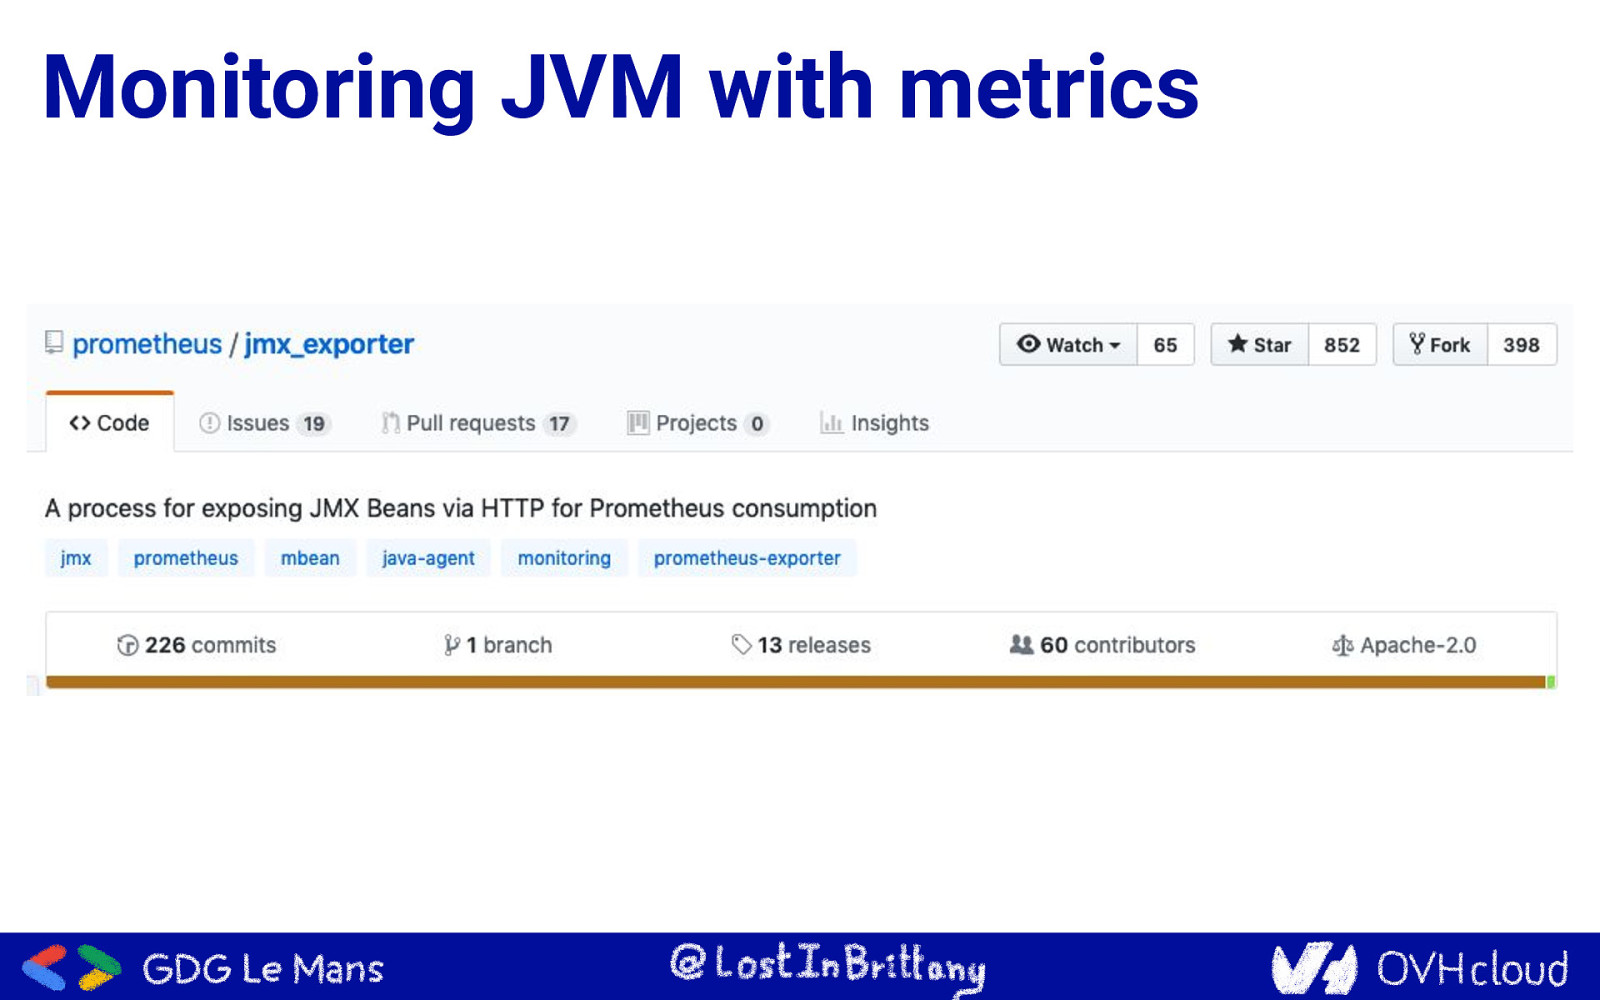
Monitoring JVM with metrics
Monitoring JVM with metrics
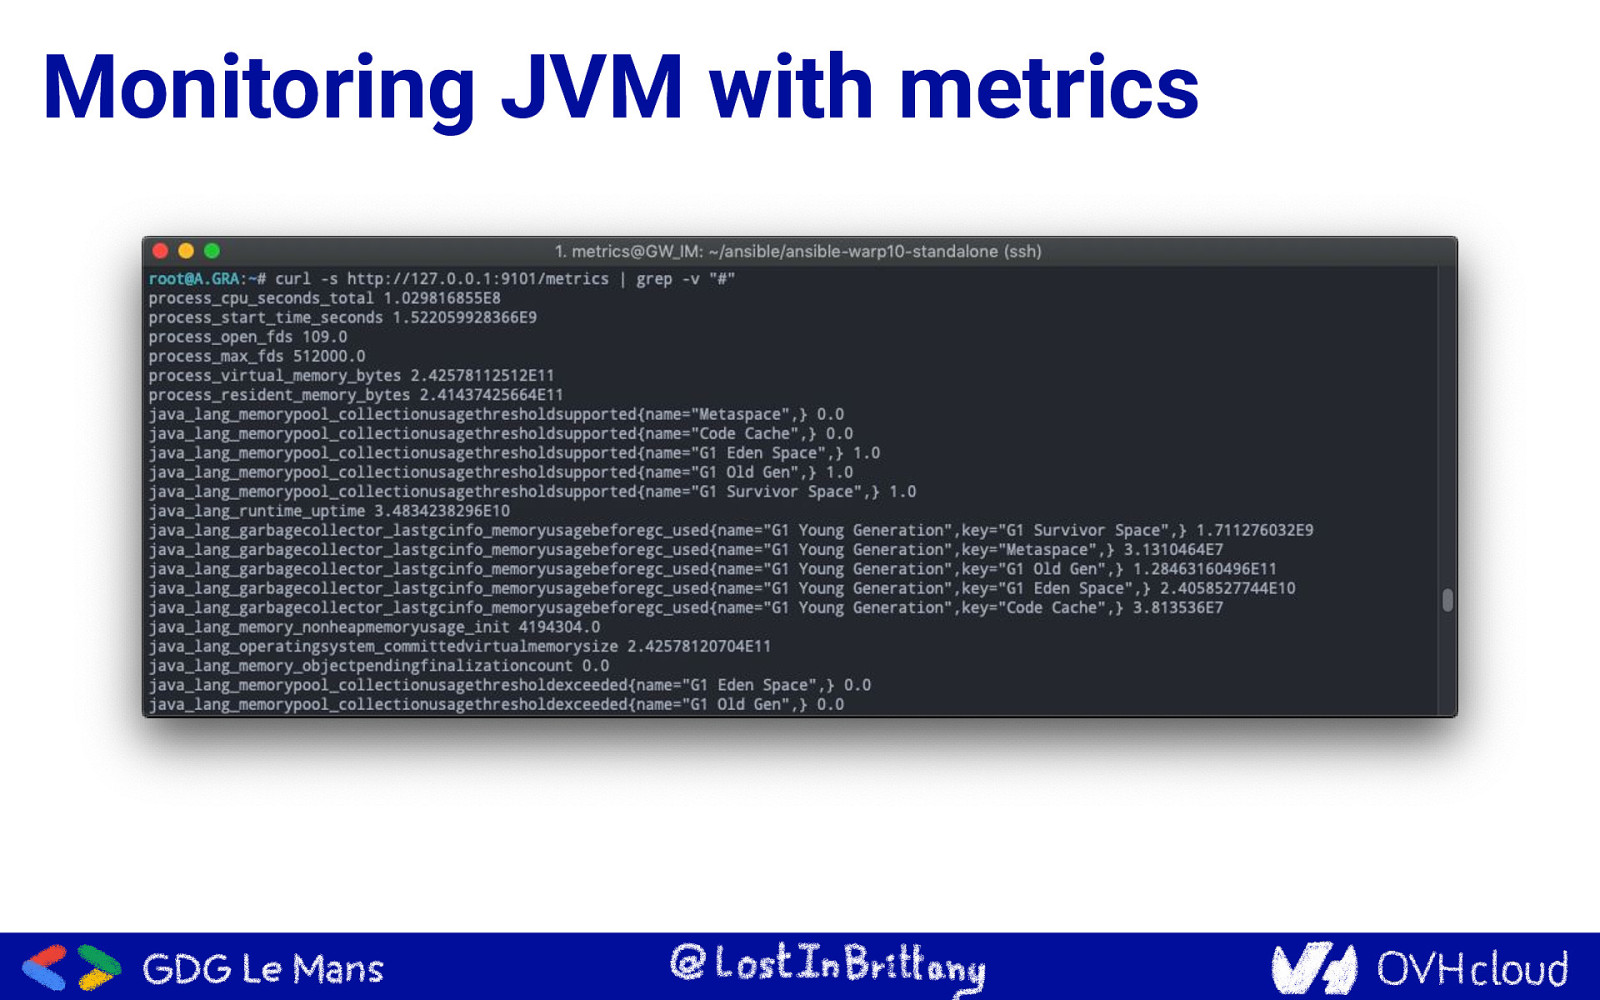
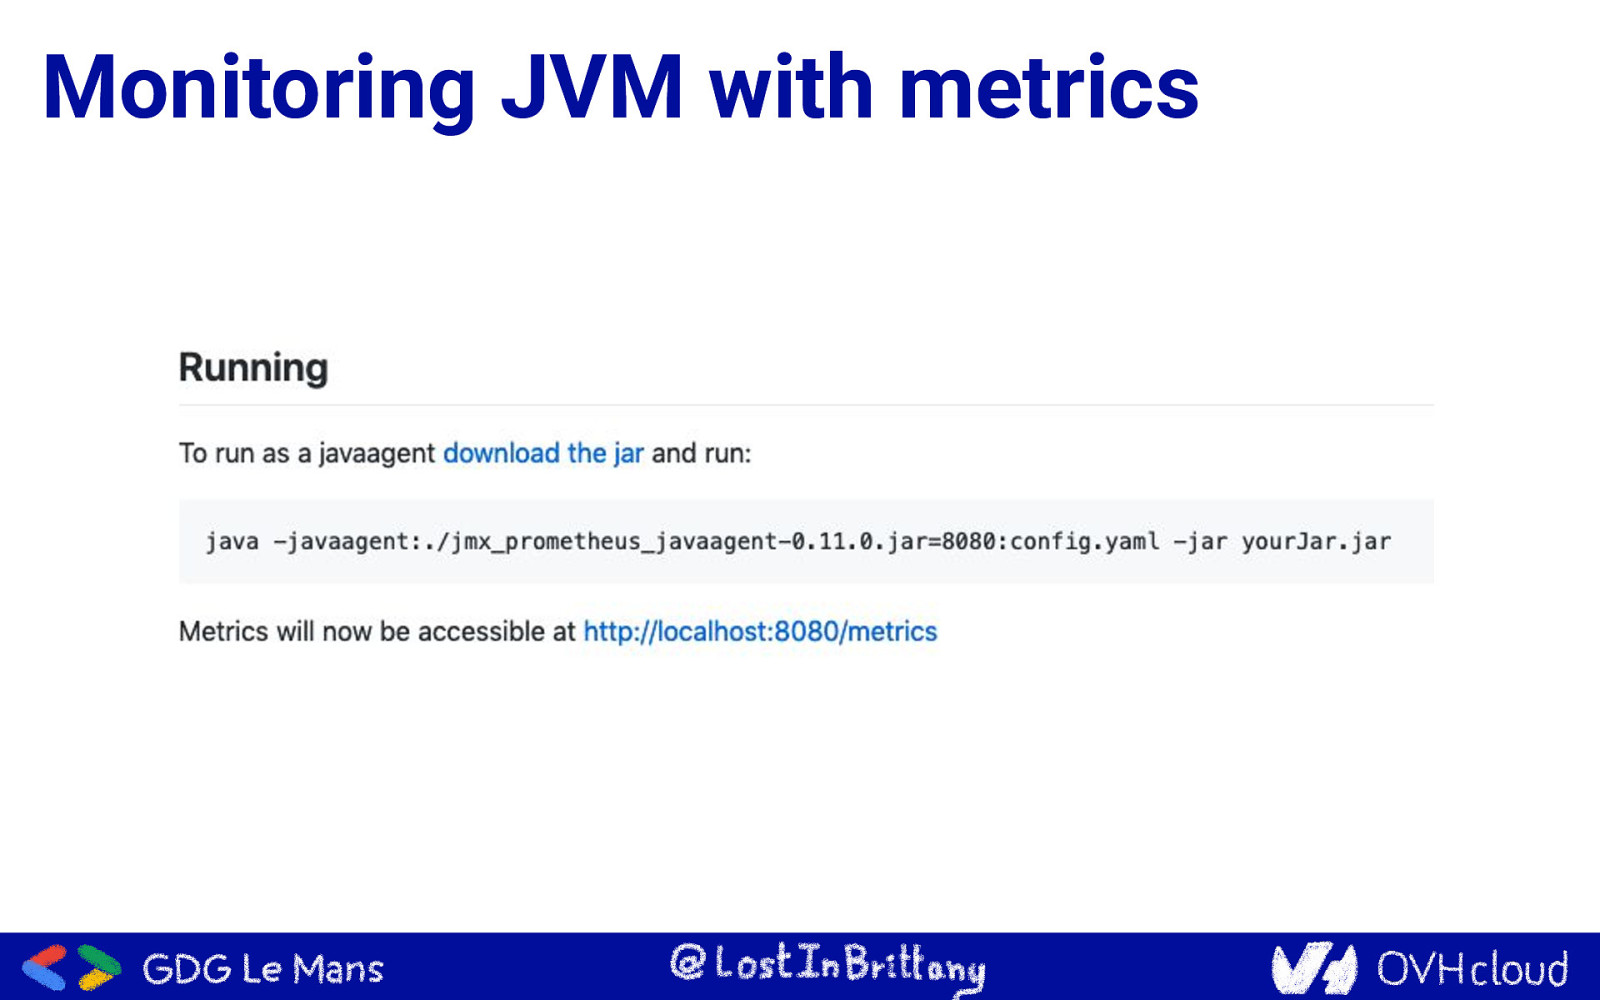
Monitoring JVM with metrics
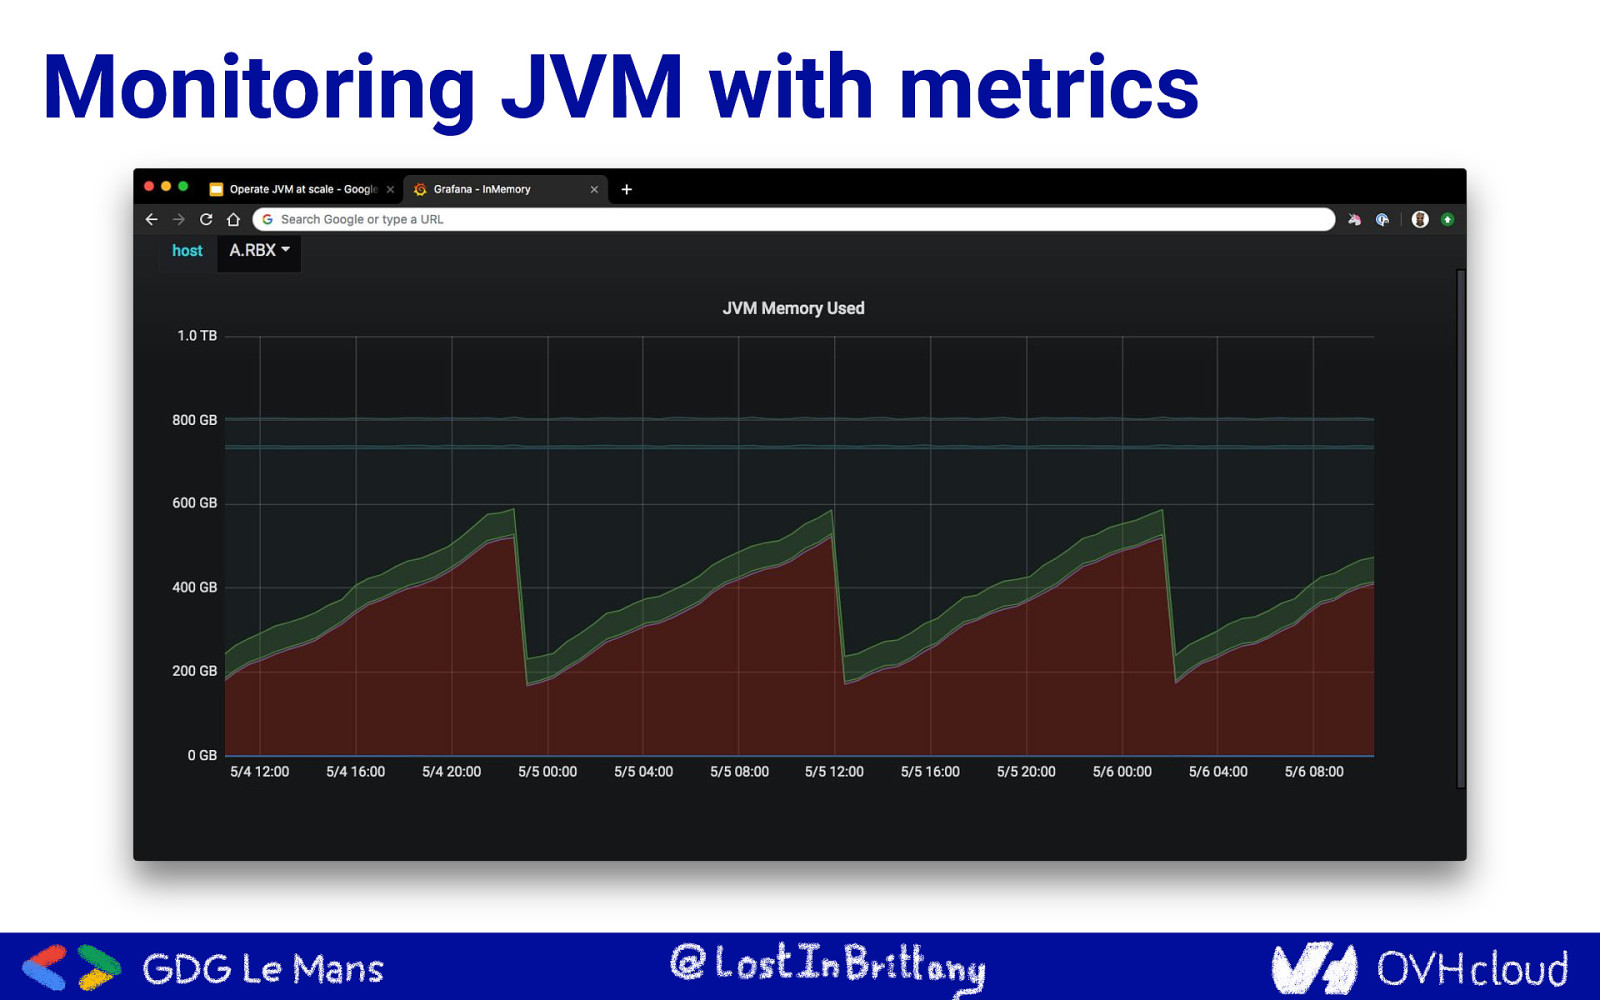
Monitoring JVM with metrics
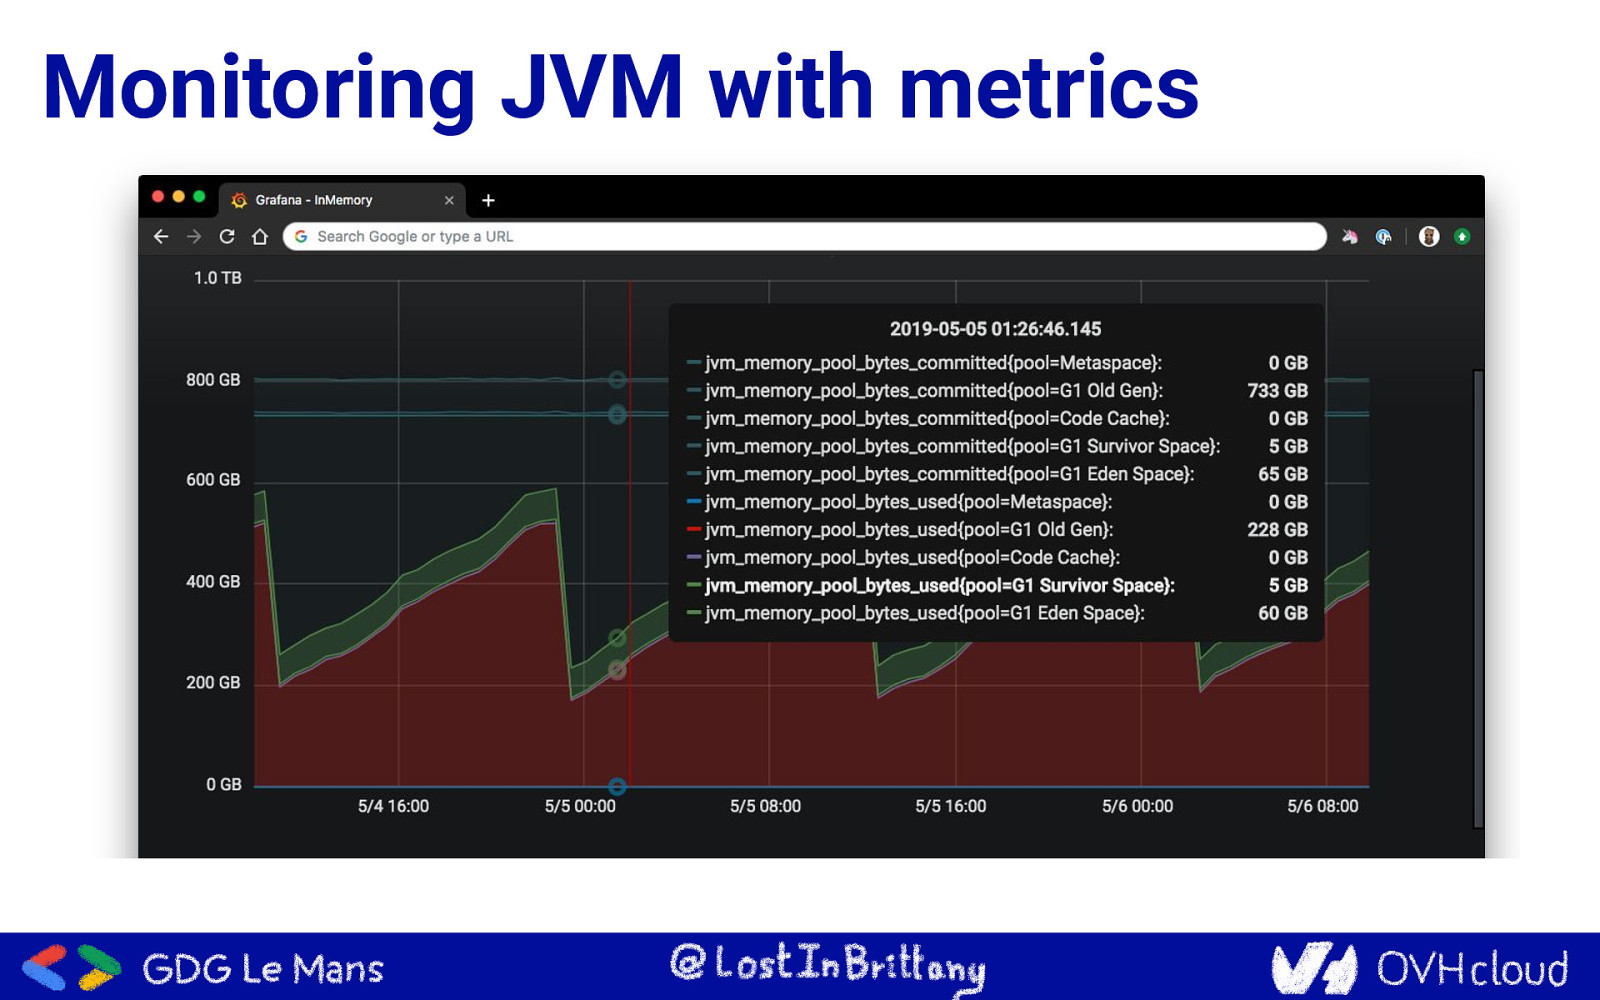
Monitoring JVM with metrics
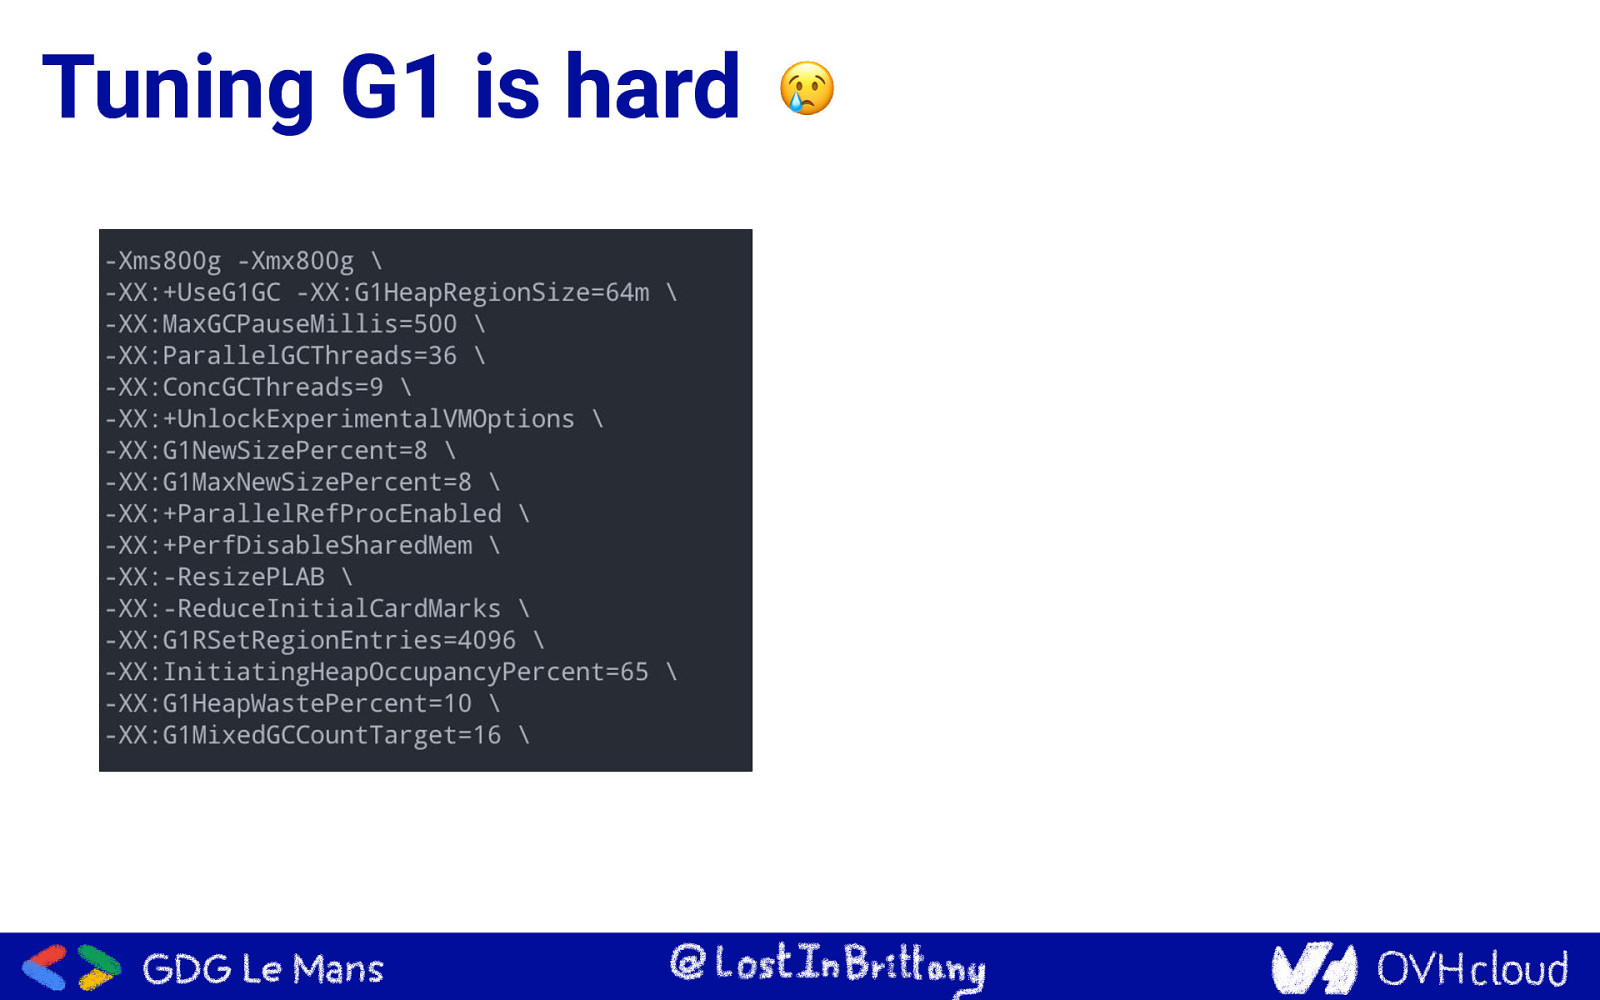
Tuning G1 is hard
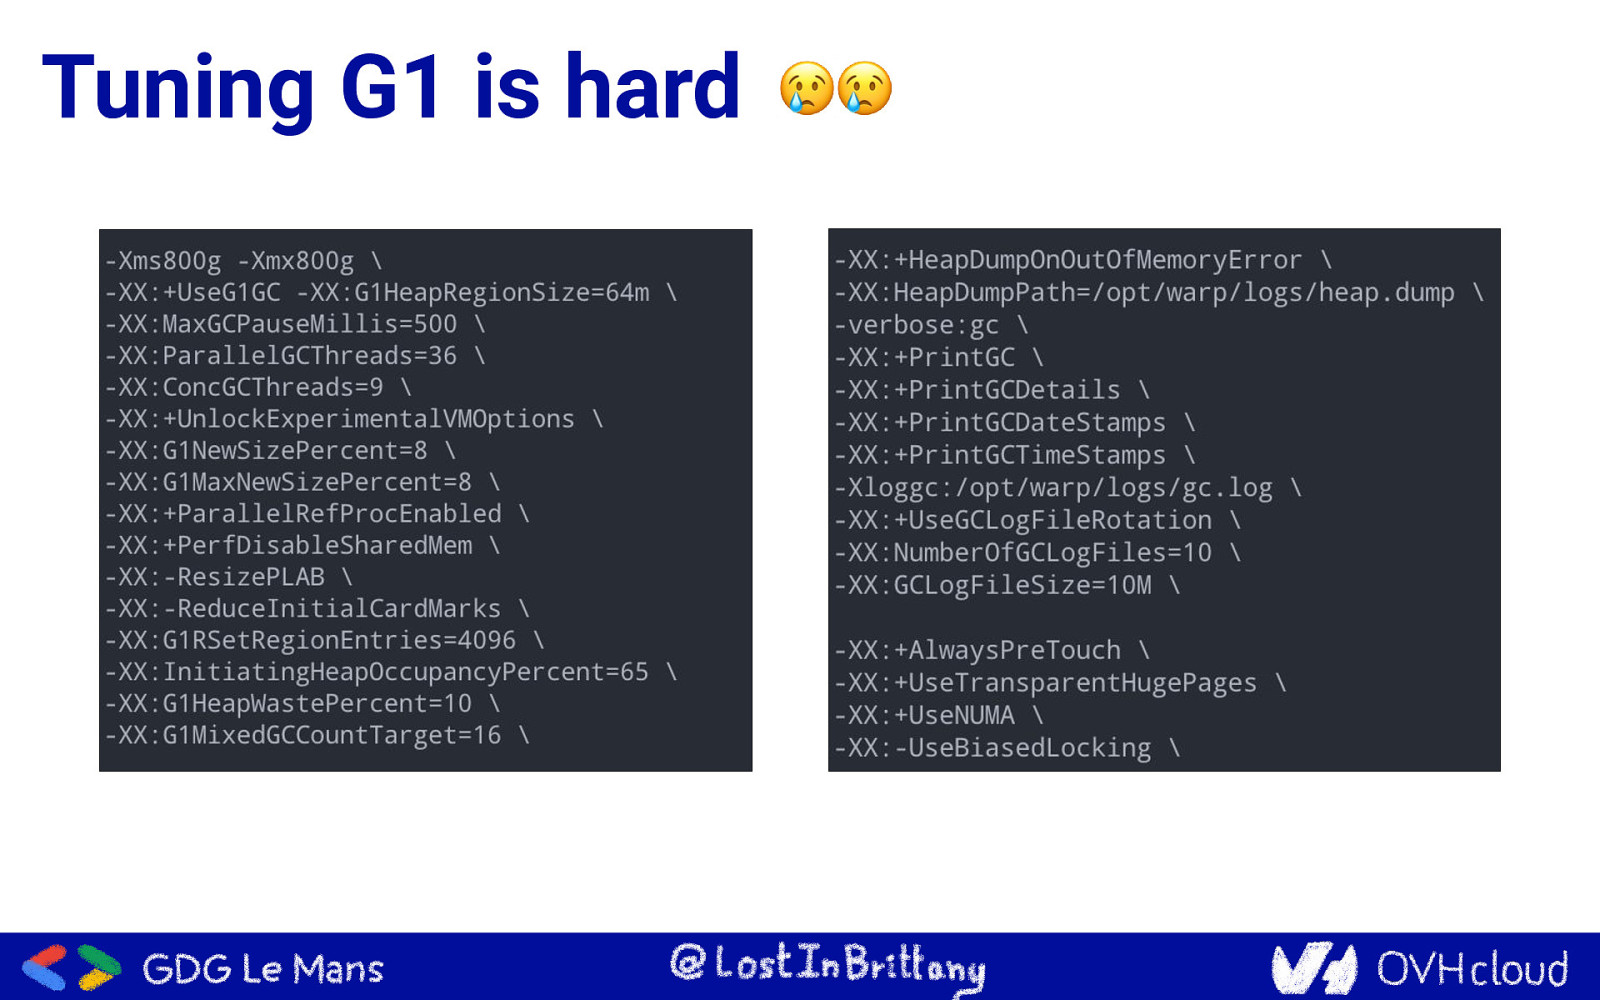
Tuning G1 is hard
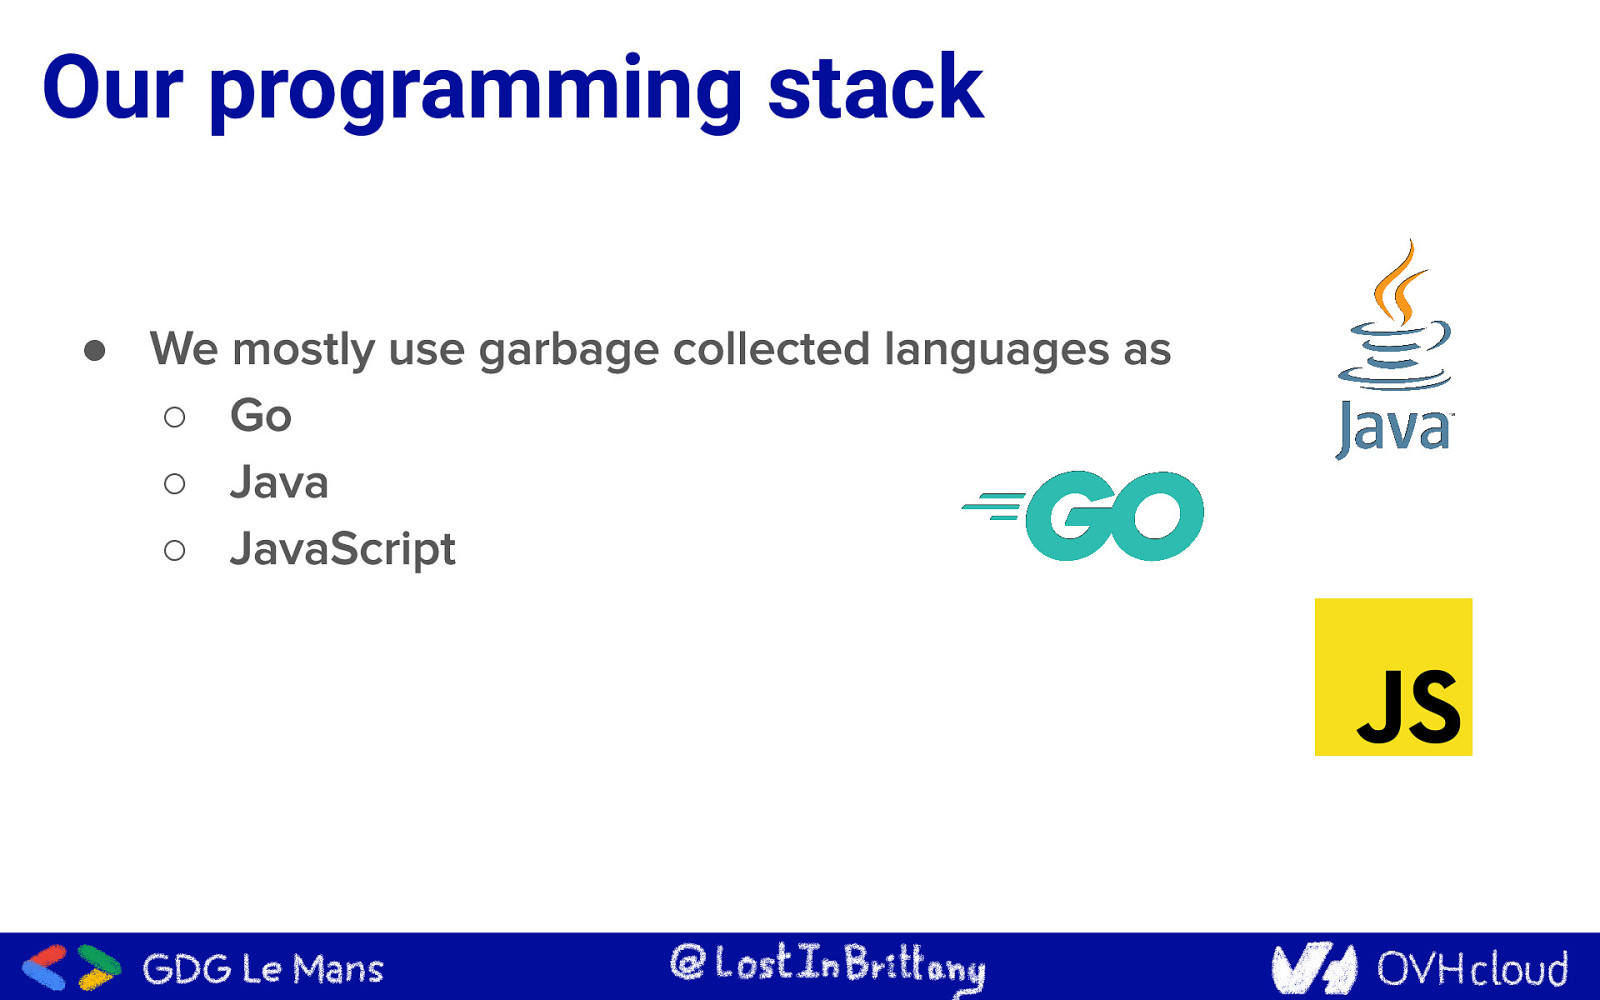
Our programming stack ● ○ ○ ○
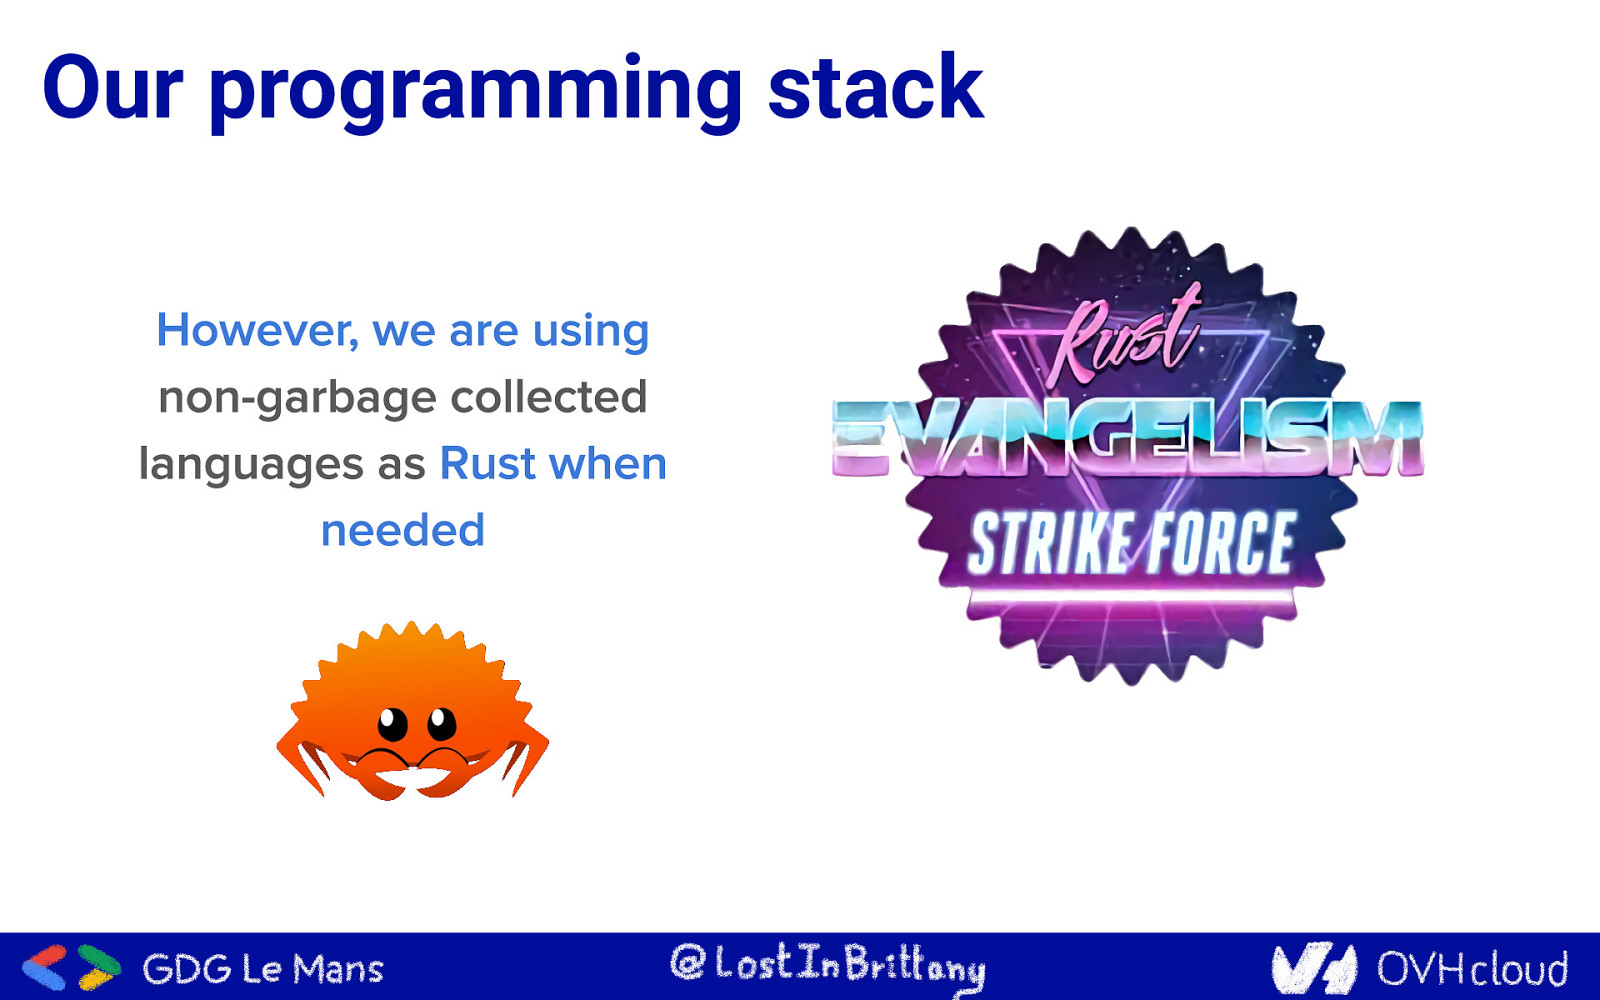
Our programming stack
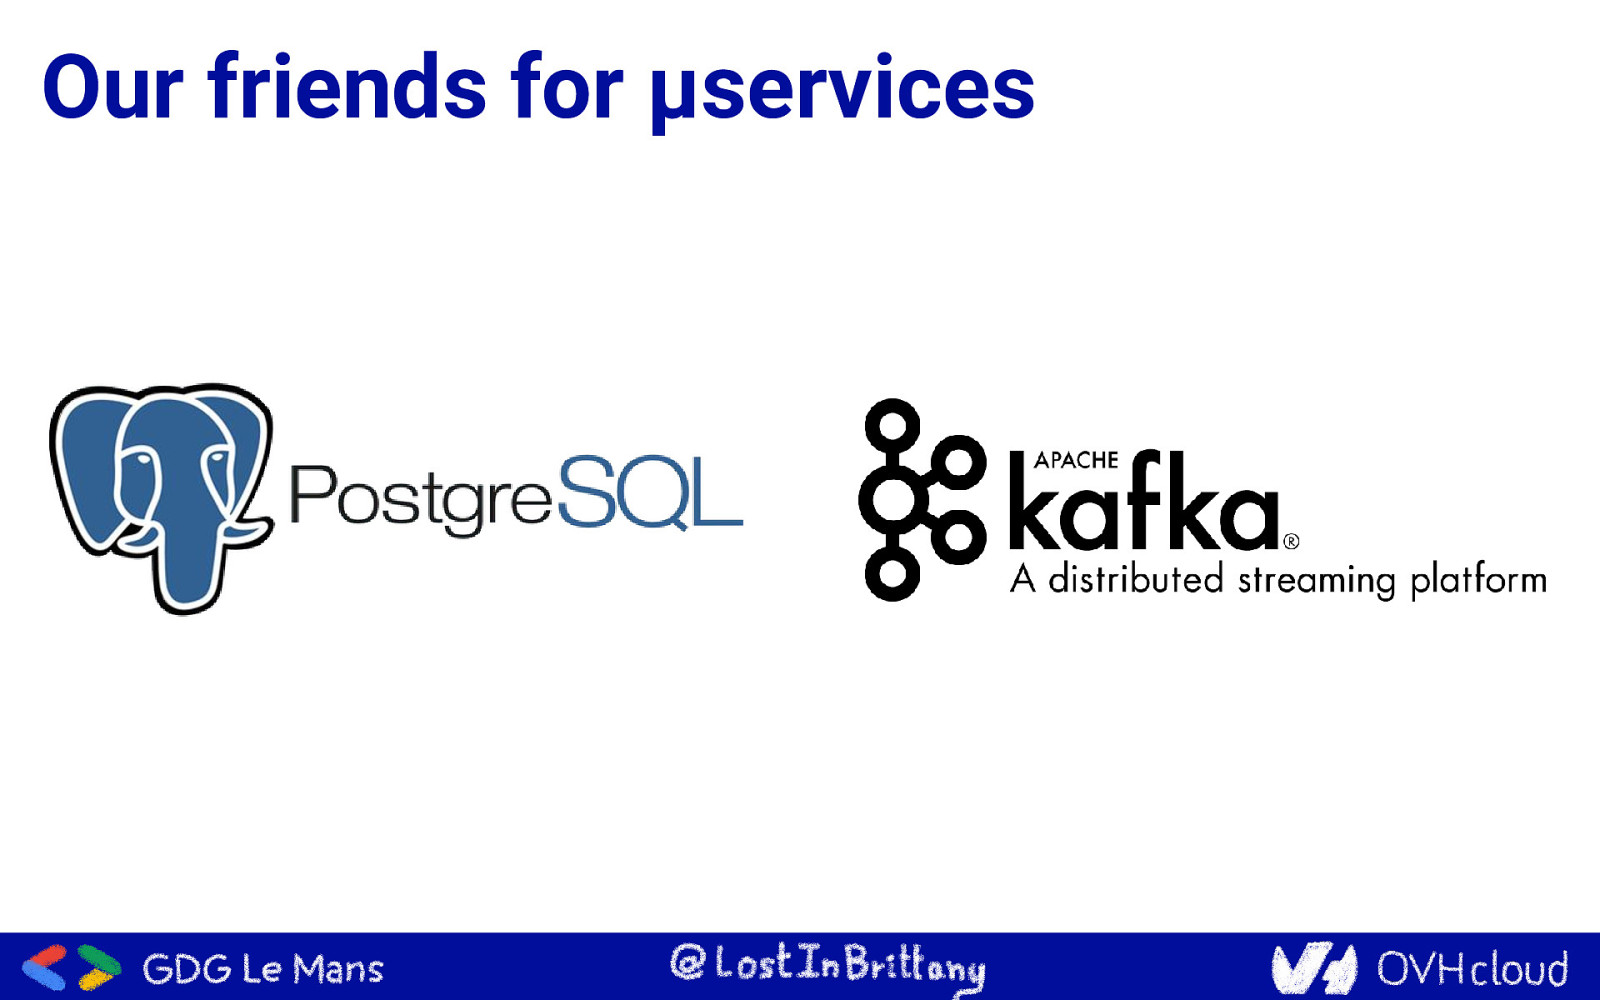
Our friends for µservices
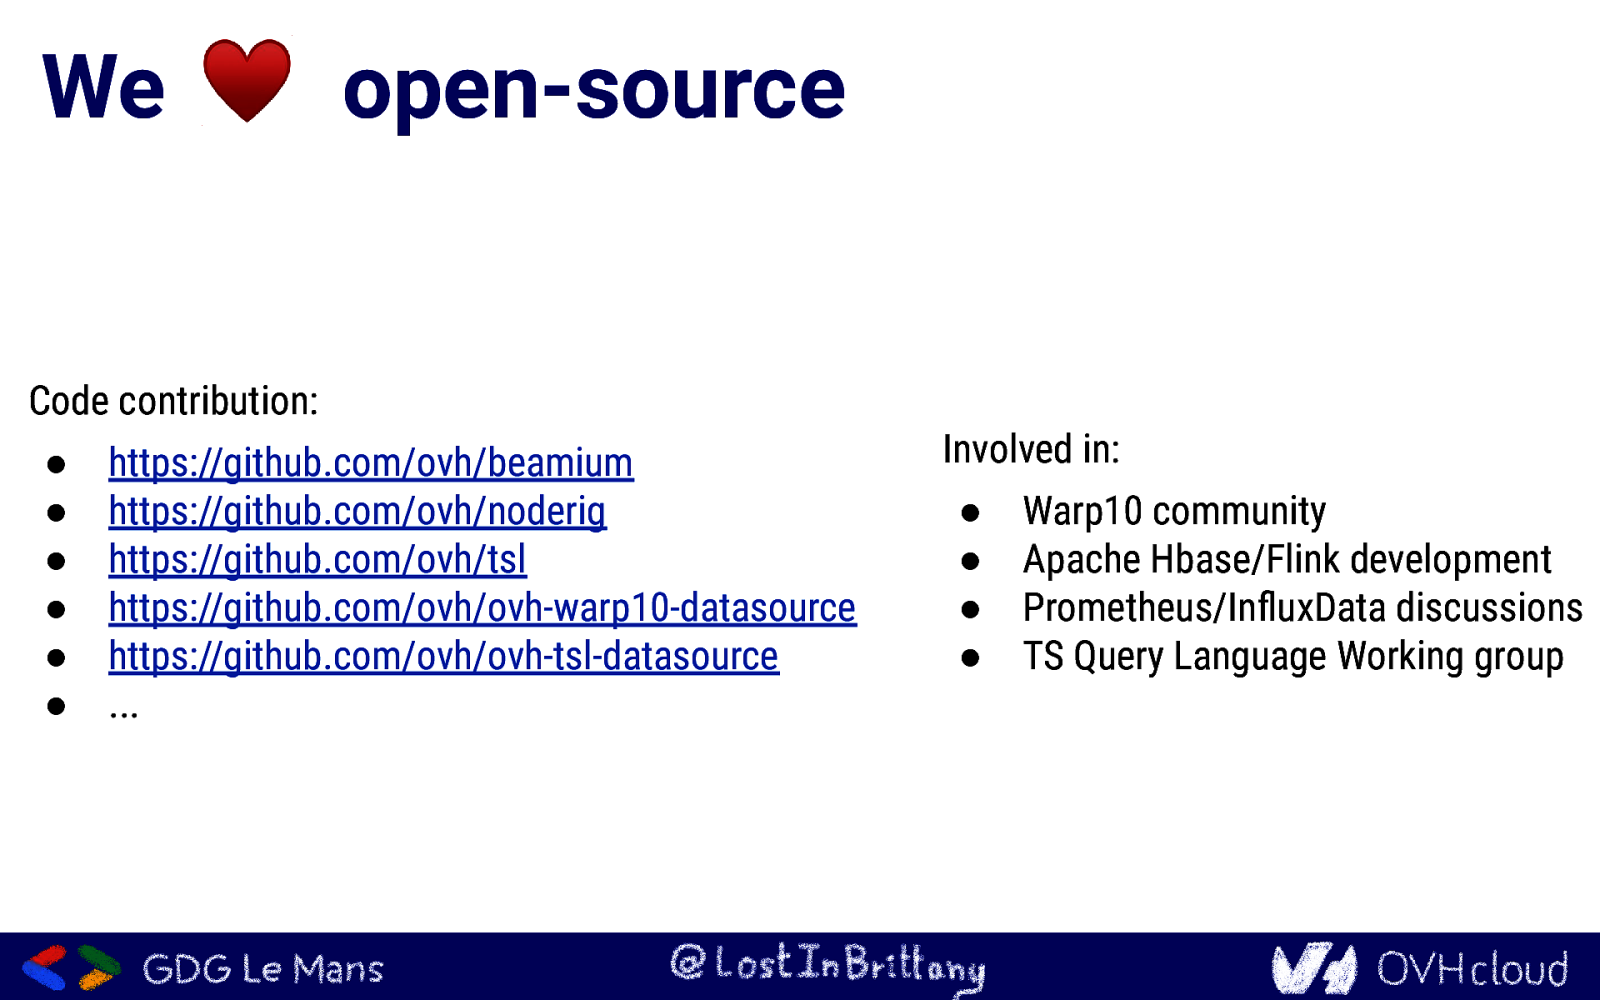
We open-source Code contribution: ● ● ● ● ● ● https://github.com/ovh/beamium https://github.com/ovh/noderig https://github.com/ovh/tsl https://github.com/ovh/ovh-warp10-datasource https://github.com/ovh/ovh-tsl-datasource … Involved in: ● ● ● ● Warp10 community Apache Hbase/Flink development Prometheus/InfluxData discussions TS Query Language Working group
Conclusion That’s all folks!