@rawkode Good Afternoon David McKay @rawkode Developer Advocate @InfluxDB | #InfluxDB PHPUK 2020

A presentation at PHPUK 2020 in February 2020 in England, UK by David McKay
@rawkode Good Afternoon David McKay @rawkode Developer Advocate @InfluxDB | #InfluxDB PHPUK 2020
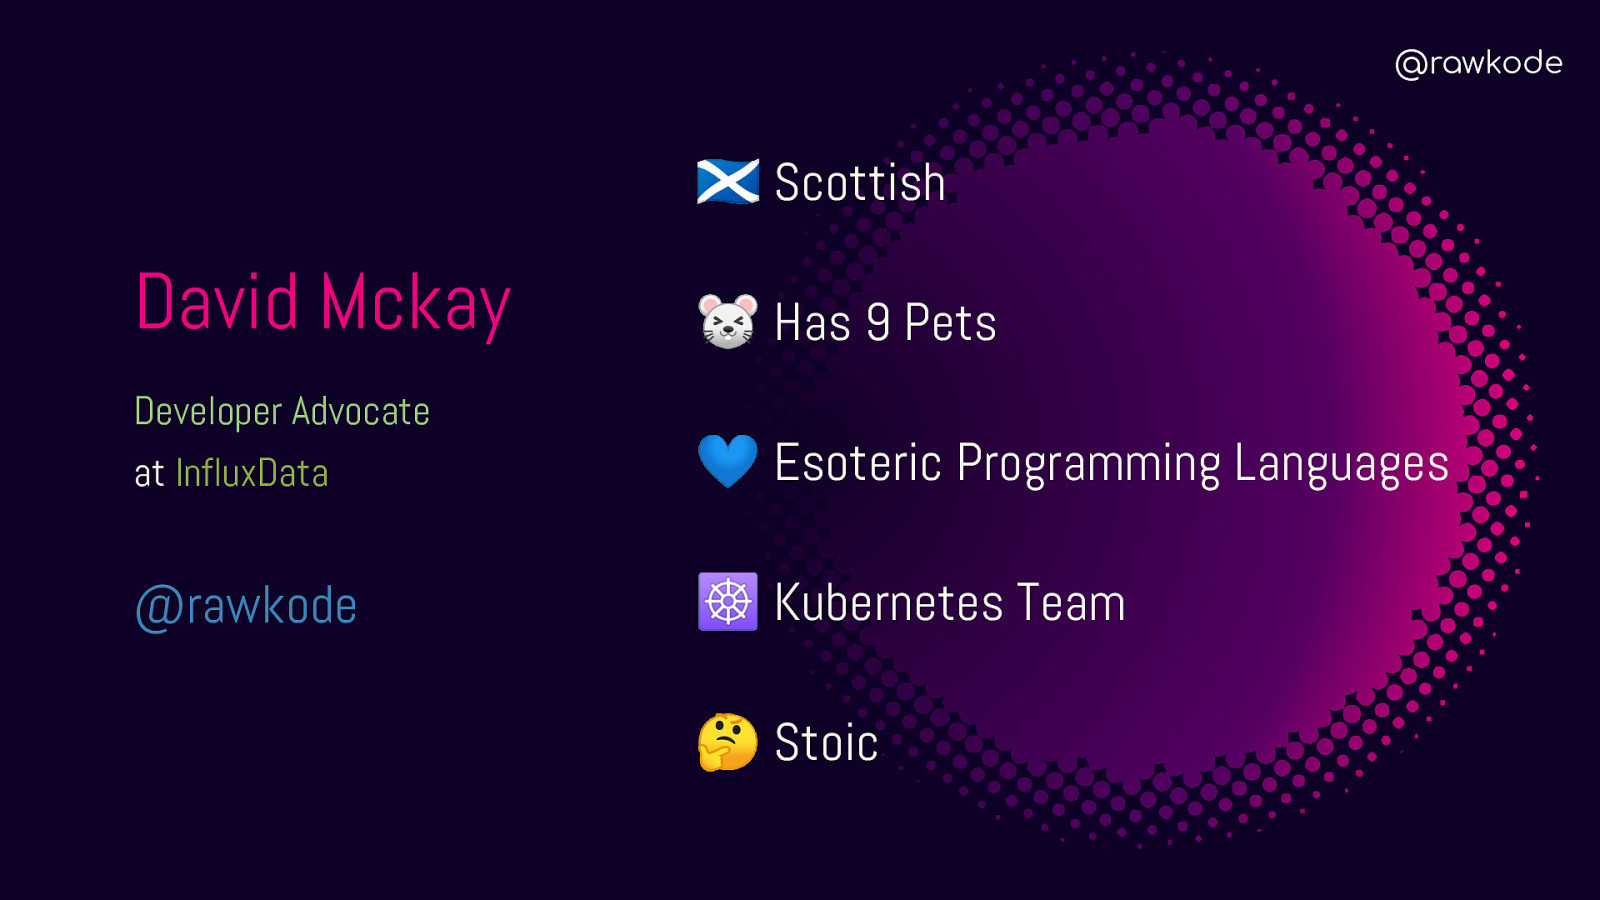
@rawkode 🏴 Scottish David Mckay Developer Advocate 🐭 Has 9 Pets at InfluxData 💙 Esoteric Programming Languages @rawkode ☸ Kubernetes Team 🤔 Stoic


Introduction to Time Series

@rawkode Before we begin …

@rawkode Pop Quiz “Invented” When?

@rawkode Encoding First Used … 410 ? BC

@rawkode Encoding “Documented” in The Lives of the Noble Grecians and Romans, by Roman historian Plutarch.
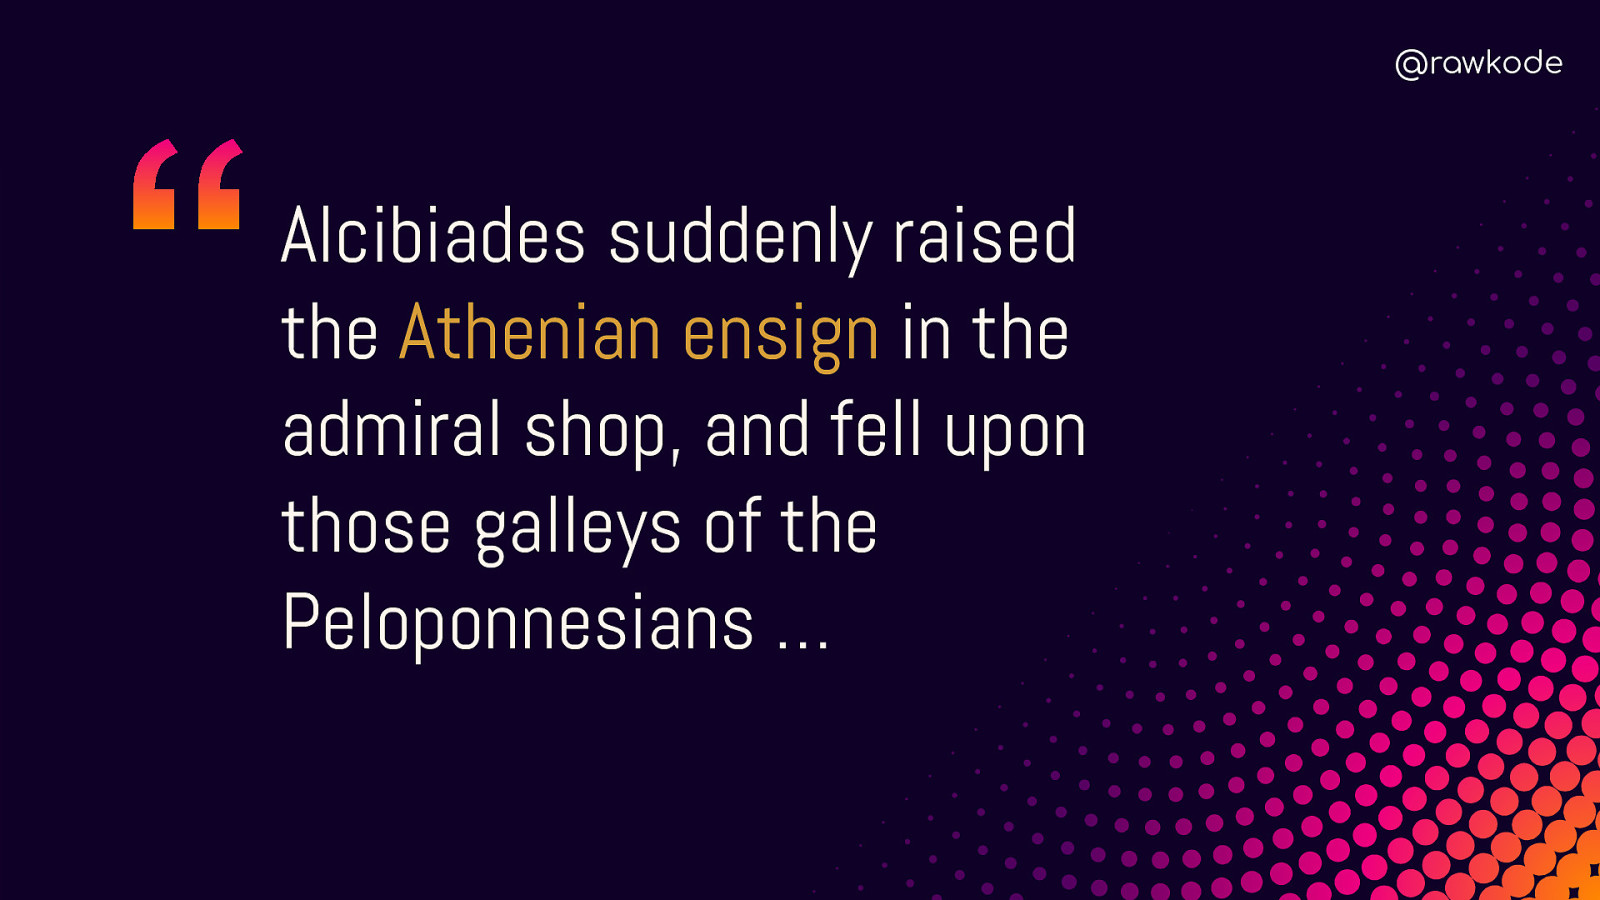
@rawkode Alcibiades suddenly raised the Athenian ensign in the admiral shop, and fell upon those galleys of the Peloponnesians …

@rawkode Encoding In the 14th century, things hadn’t actually advanced much more. The Black Book of Admiralty listed 2 signals: 1 flag or 2 flags

@rawkode Encoding By the 15th century there were 15 flags, each with a single meaning.

@rawkode Encoding Finally, in the late 17th century; a French system existed (Mahé de la Bourdonnais) with 10 coloured flags, representing 0-9

@rawkode Sharding First Used … 150 ? BC
@rawkode Sharding First “documented” example was in ~150 AD, invented and described by Polybius.

@rawkode We take the alphabet and divide it into five parts, each consisting of five letters.

@rawkode
@rawkode

History of Time Series
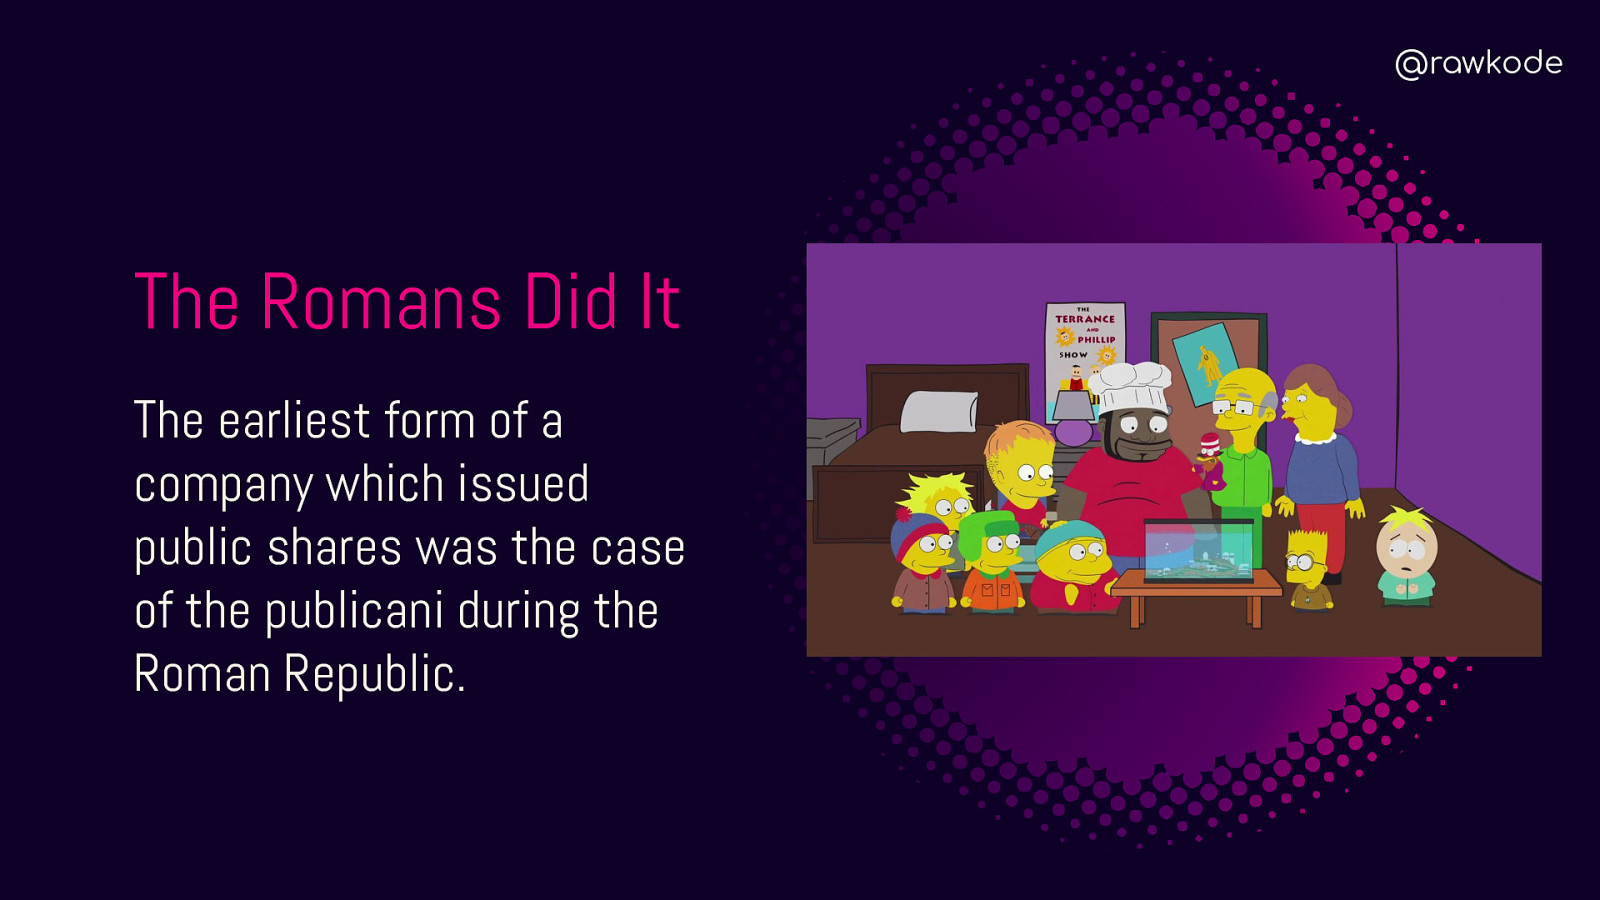
@rawkode The Romans Did It The earliest form of a company which issued public shares was the case of the publicani during the Roman Republic.

@rawkode Like modern joint-stock companies, the publicani were legal bodies independent of their members whose ownership was divided into shares, or partes. There is evidence that these shares were sold to public investors and traded in a type of over-the-counter market in the Forum, near the Temple of Castor and Pollux. The shares fluctuated in value, encouraging the activity of speculators, or quaestors.
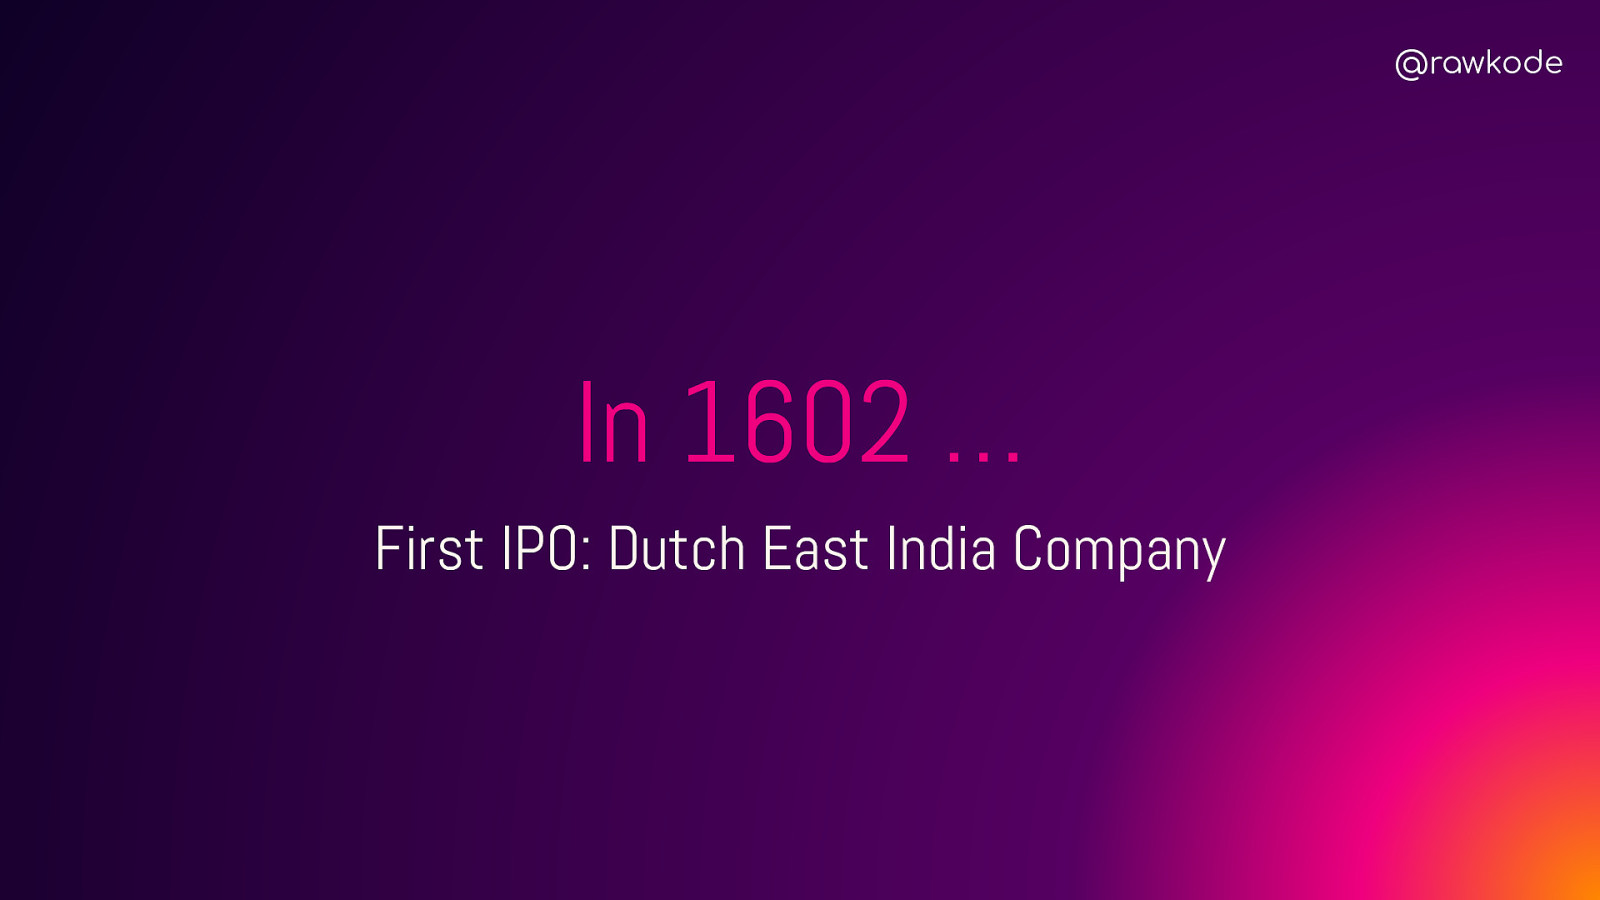
@rawkode In 1602 … First IPO: Dutch East India Company
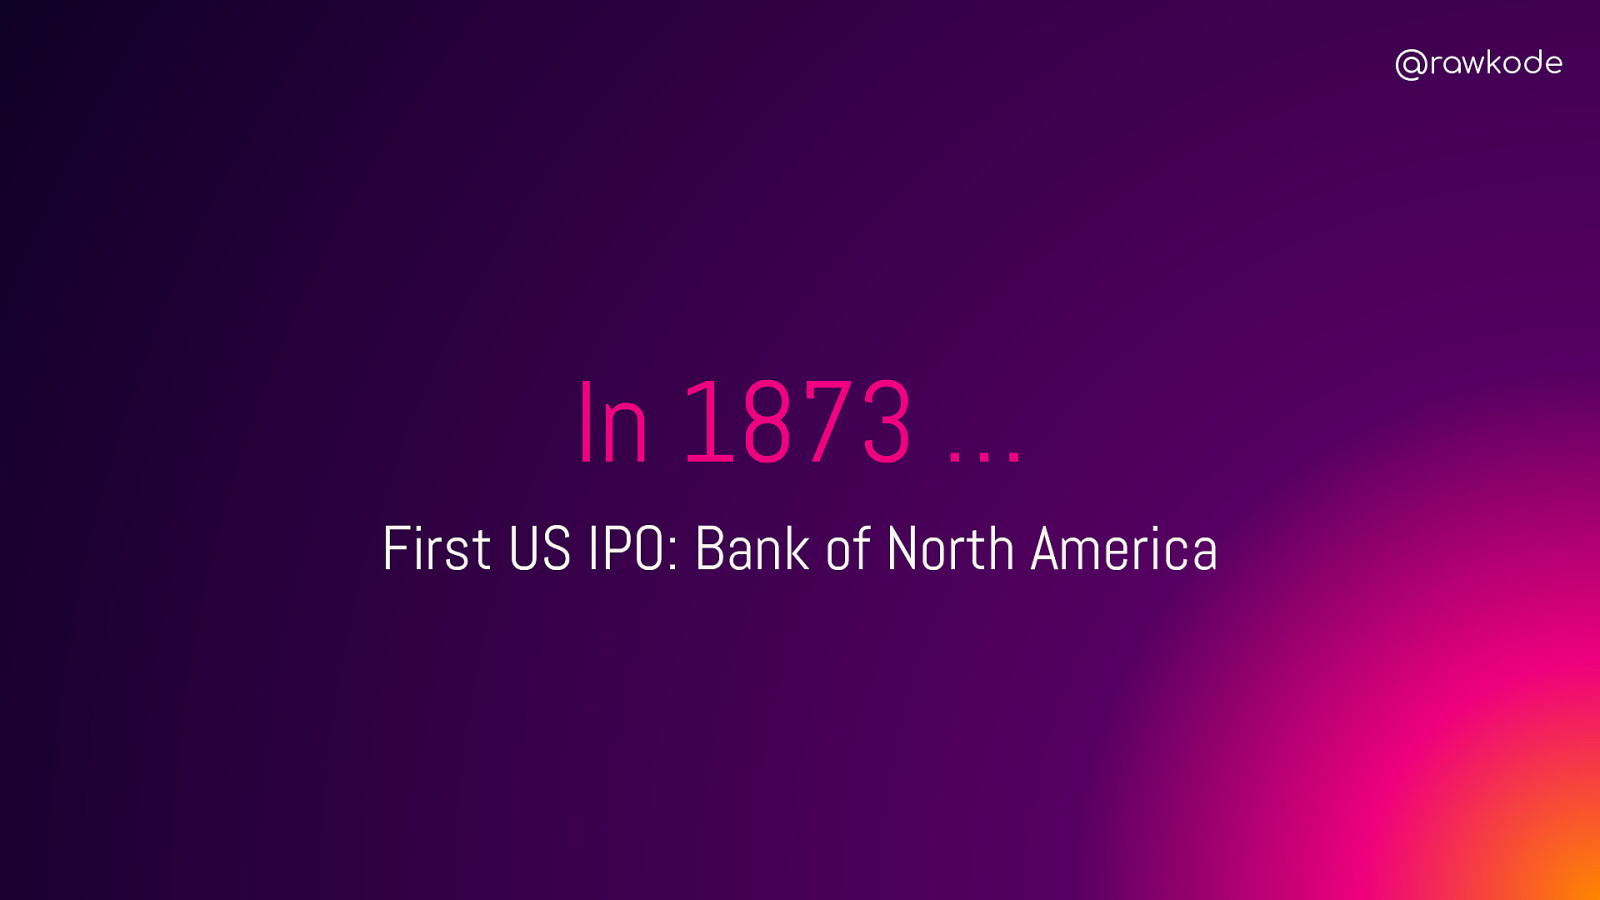
@rawkode In 1873 … First US IPO: Bank of North America

@rawkode In 1884 … What was the price of wheat?
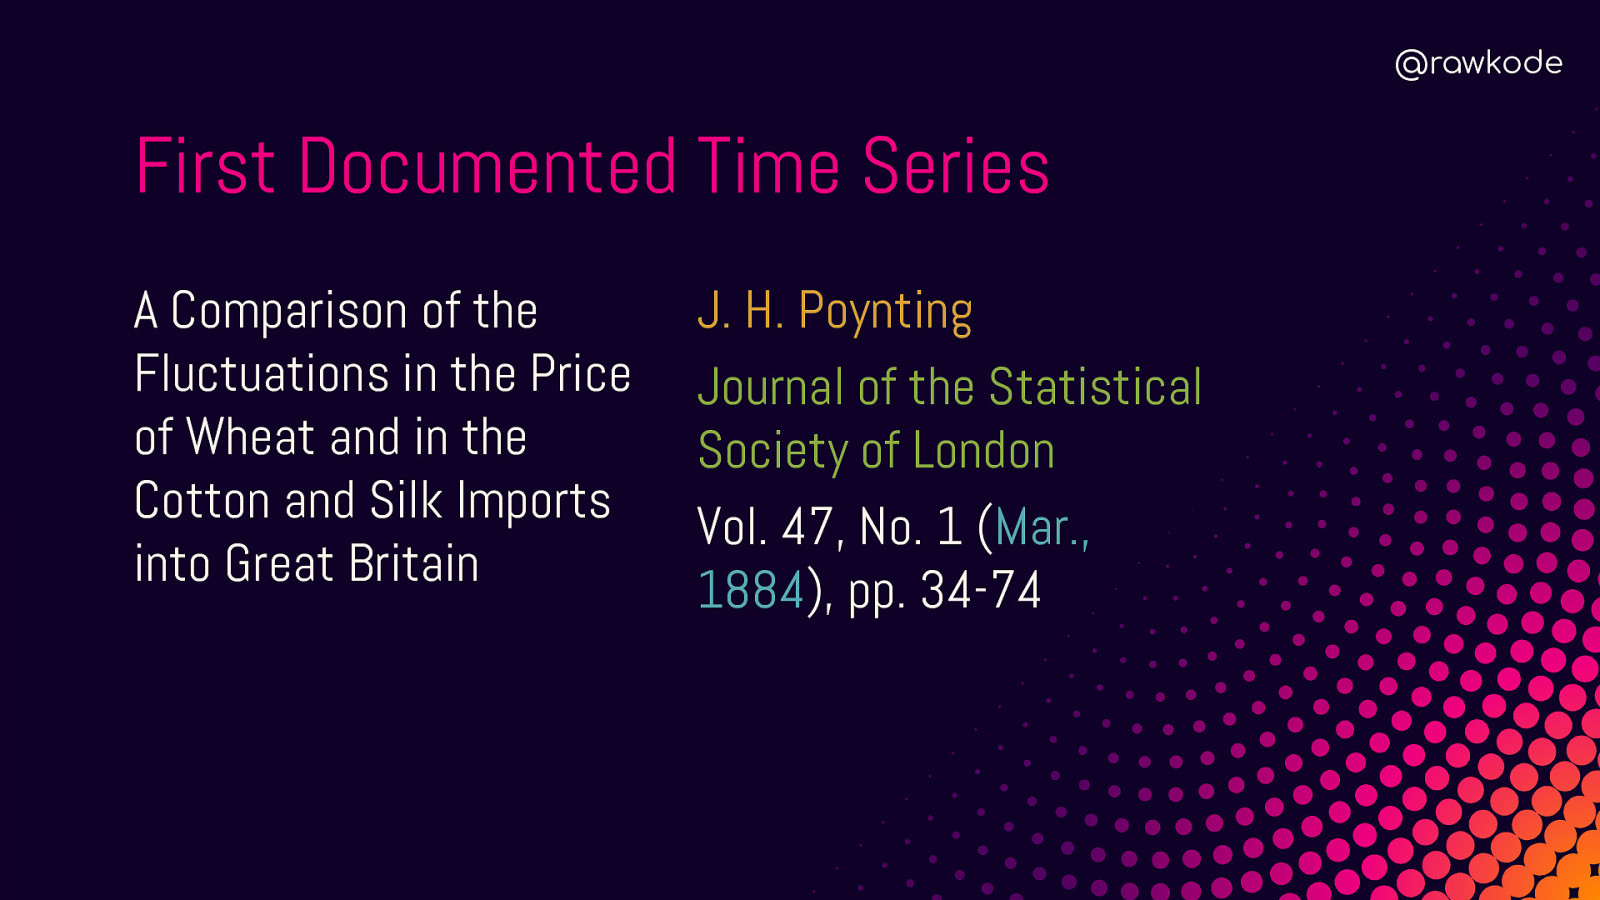
@rawkode First Documented Time Series A Comparison of the Fluctuations in the Price of Wheat and in the Cotton and Silk Imports into Great Britain J. H. Poynting Journal of the Statistical Society of London Vol. 47, No. 1 (Mar., 1884), pp. 34-74

@rawkode What is all this? This is the first (or one of) paper that added the dimension of time to statistical mathematics
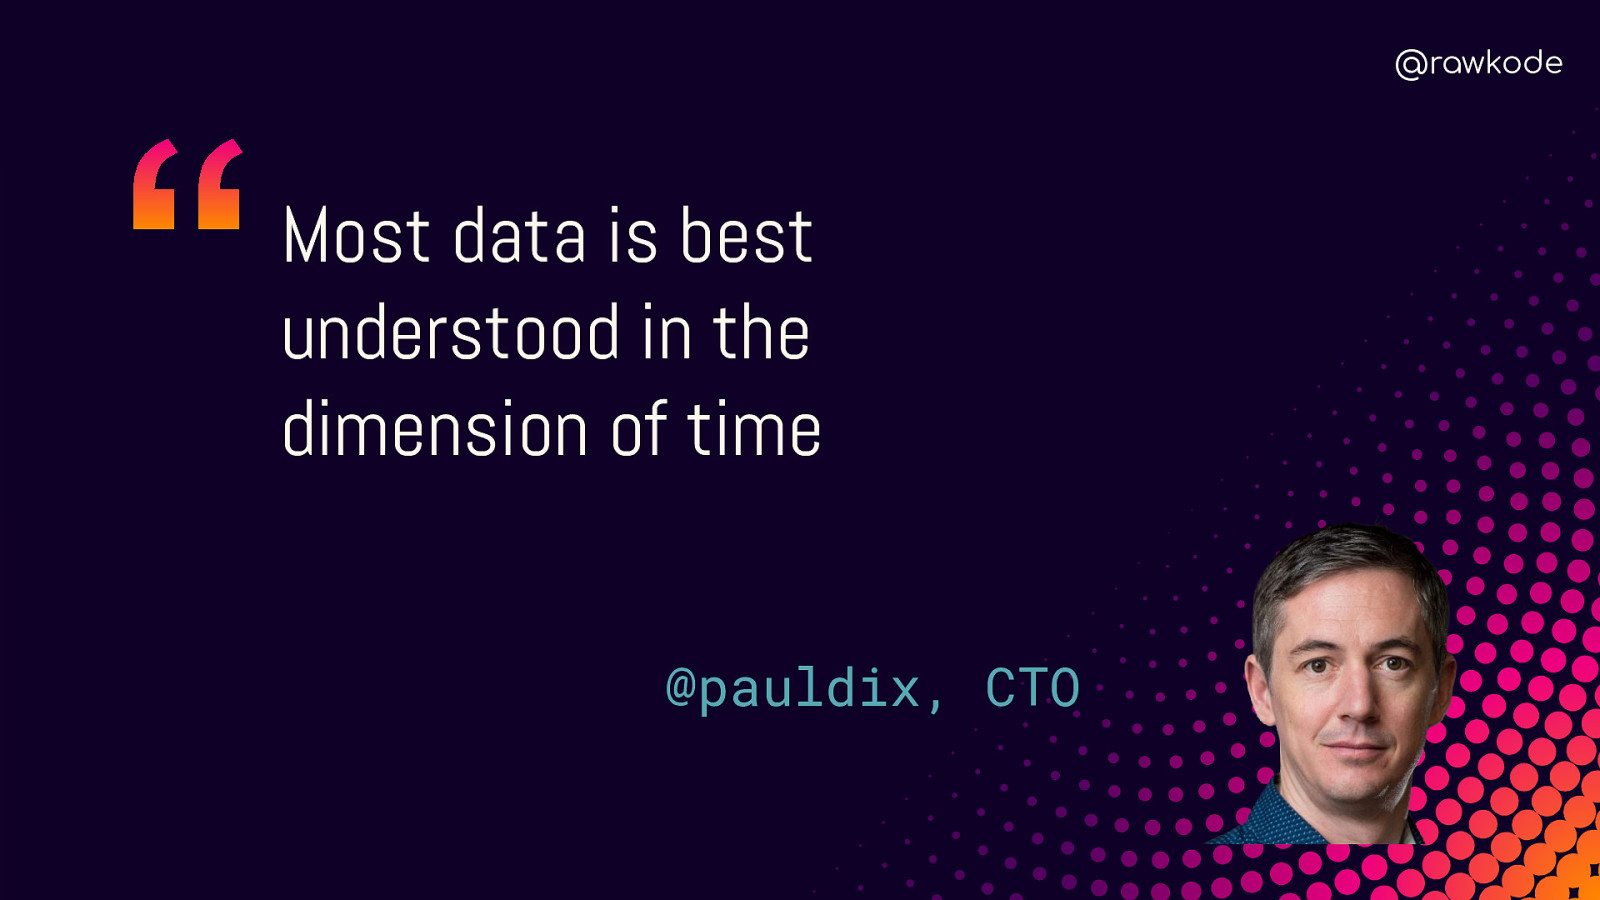
@rawkode Most data is best understood in the dimension of time @pauldix, CTO

Introduction to Time Series
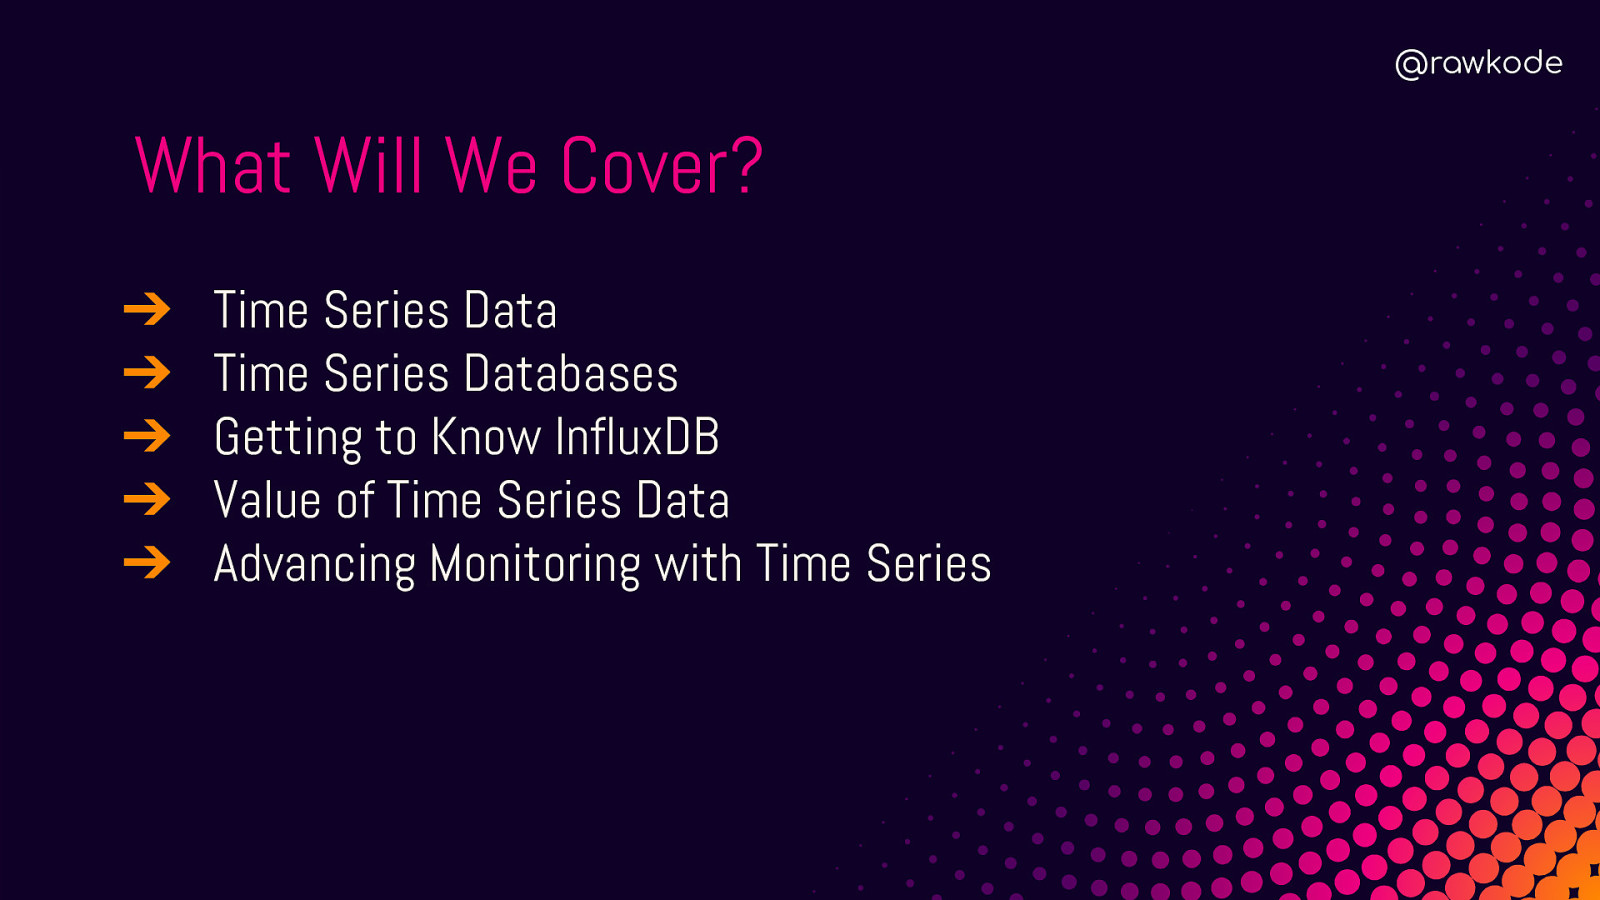
@rawkode What Will We Cover? ➔ ➔ ➔ ➔ ➔ Time Series Data Time Series Databases Getting to Know InfluxDB Value of Time Series Data Advancing Monitoring with Time Series
Time Series Data What is it?
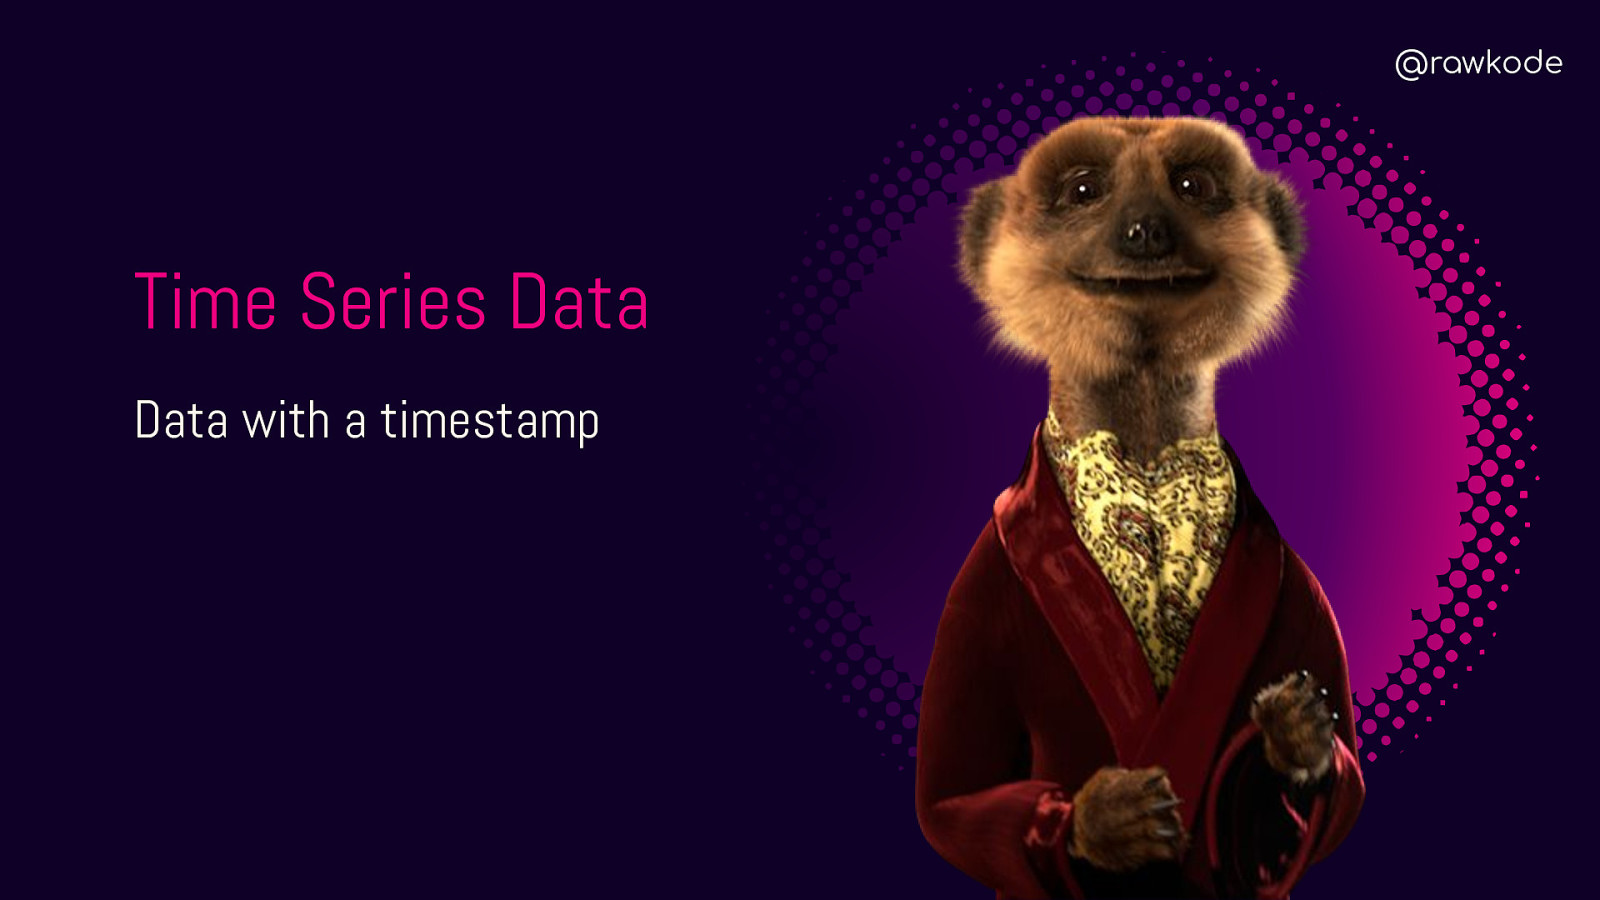
@rawkode Time Series Data Data with a timestamp
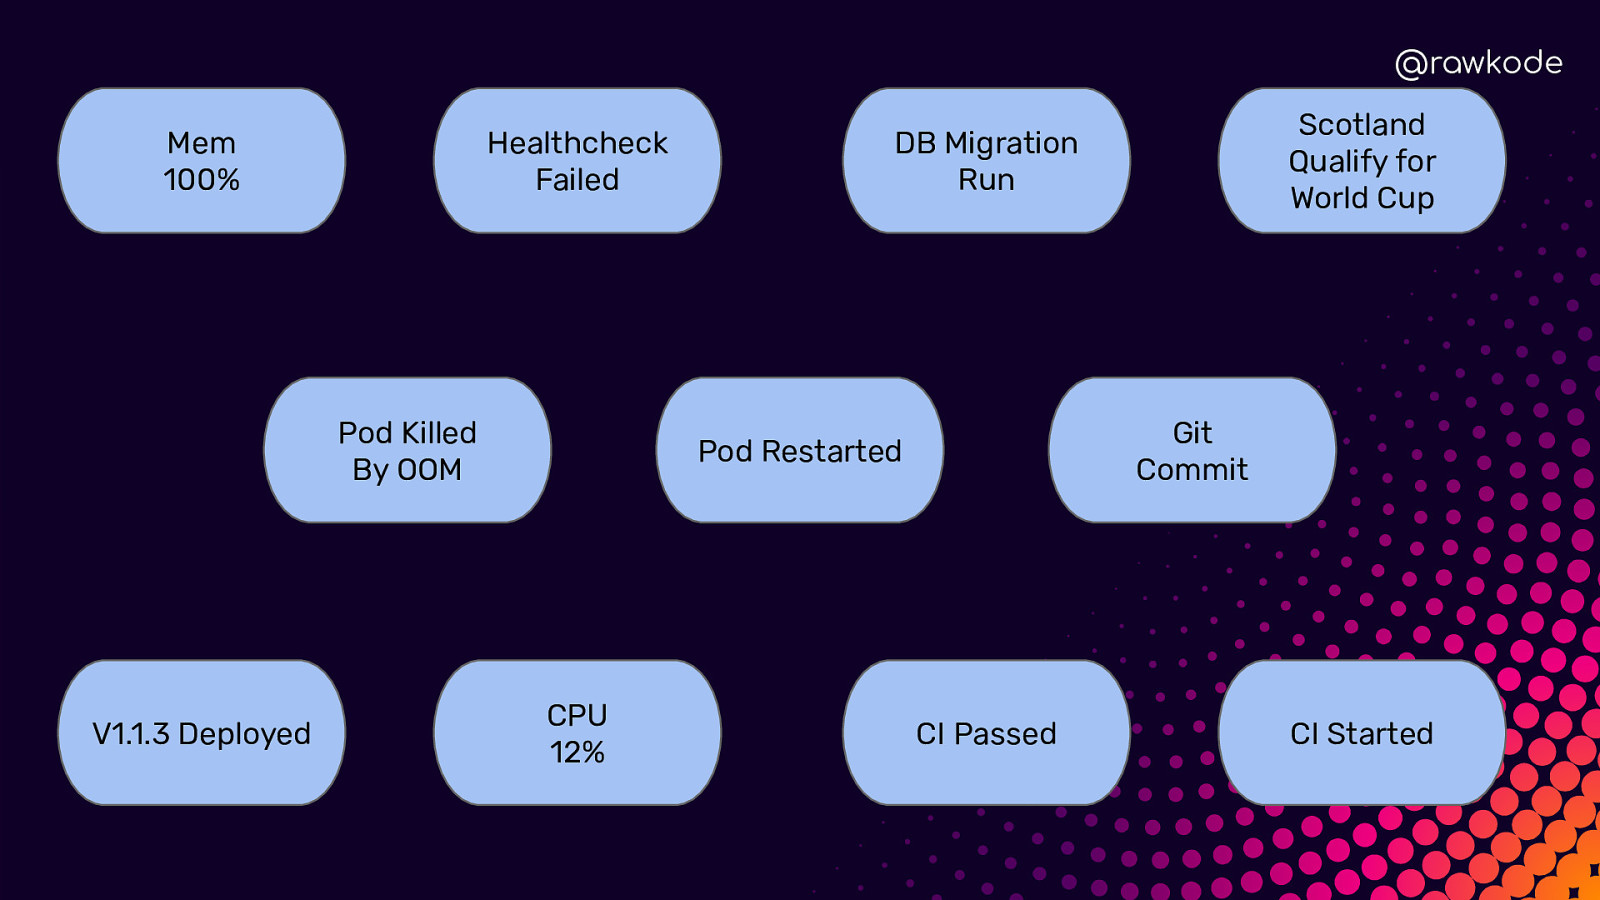
@rawkode Mem 100% Healthcheck Failed Pod Killed By OOM V1.1.3 Deployed Git Commit Pod Restarted CPU 12% Scotland Qualify for World Cup DB Migration Run CI Passed CI Started
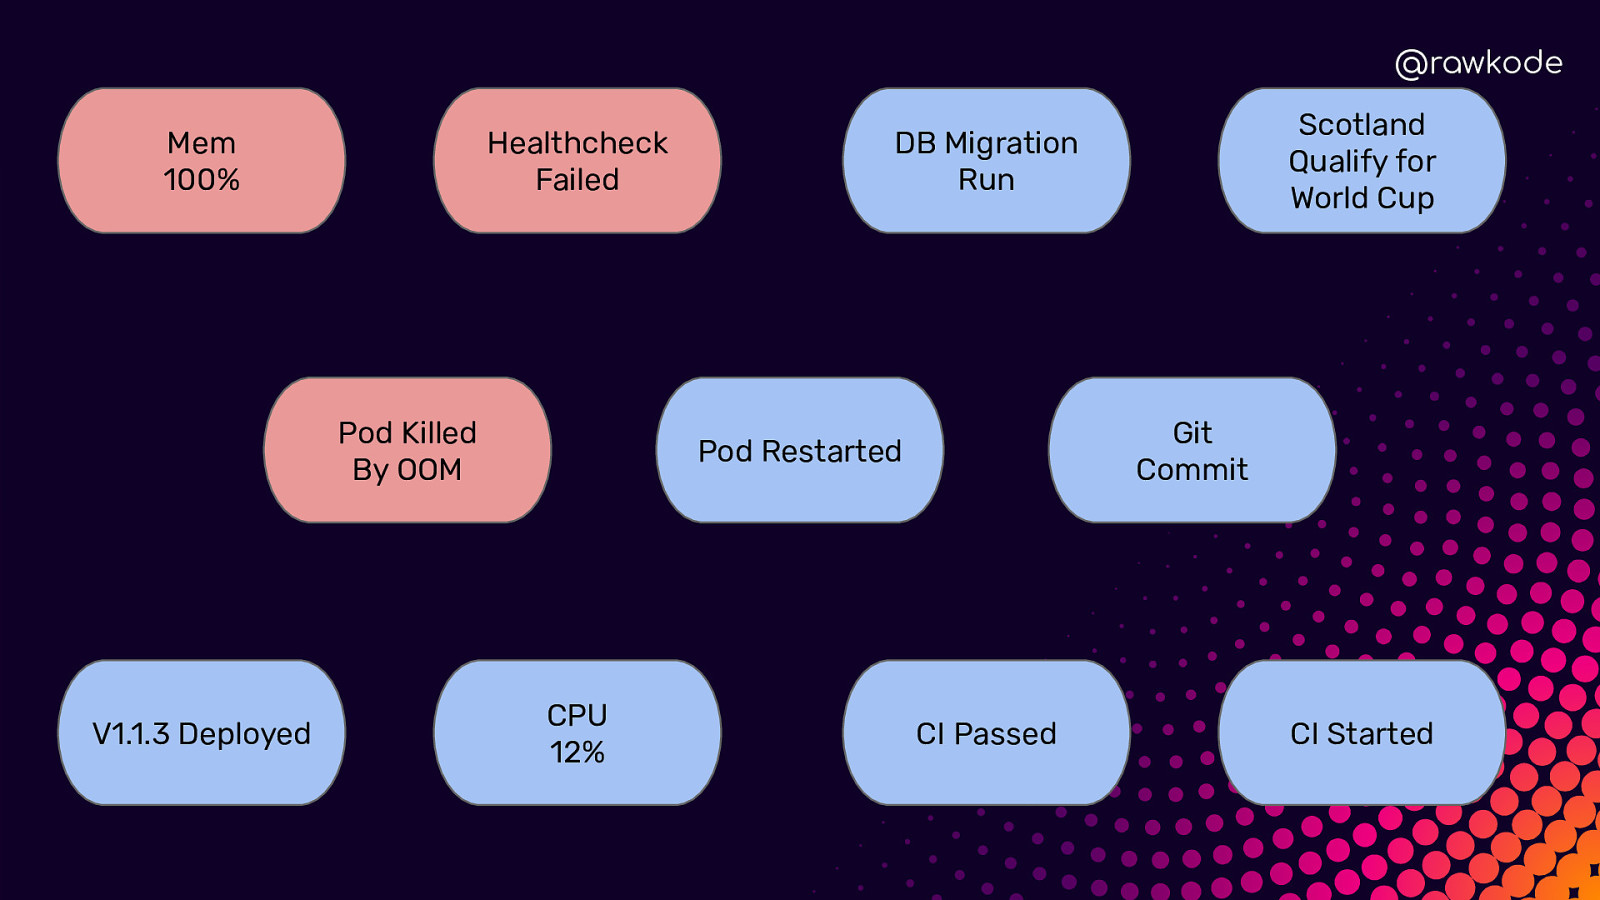
@rawkode Mem 100% Healthcheck Failed Pod Killed By OOM V1.1.3 Deployed Git Commit Pod Restarted CPU 12% Scotland Qualify for World Cup DB Migration Run CI Passed CI Started
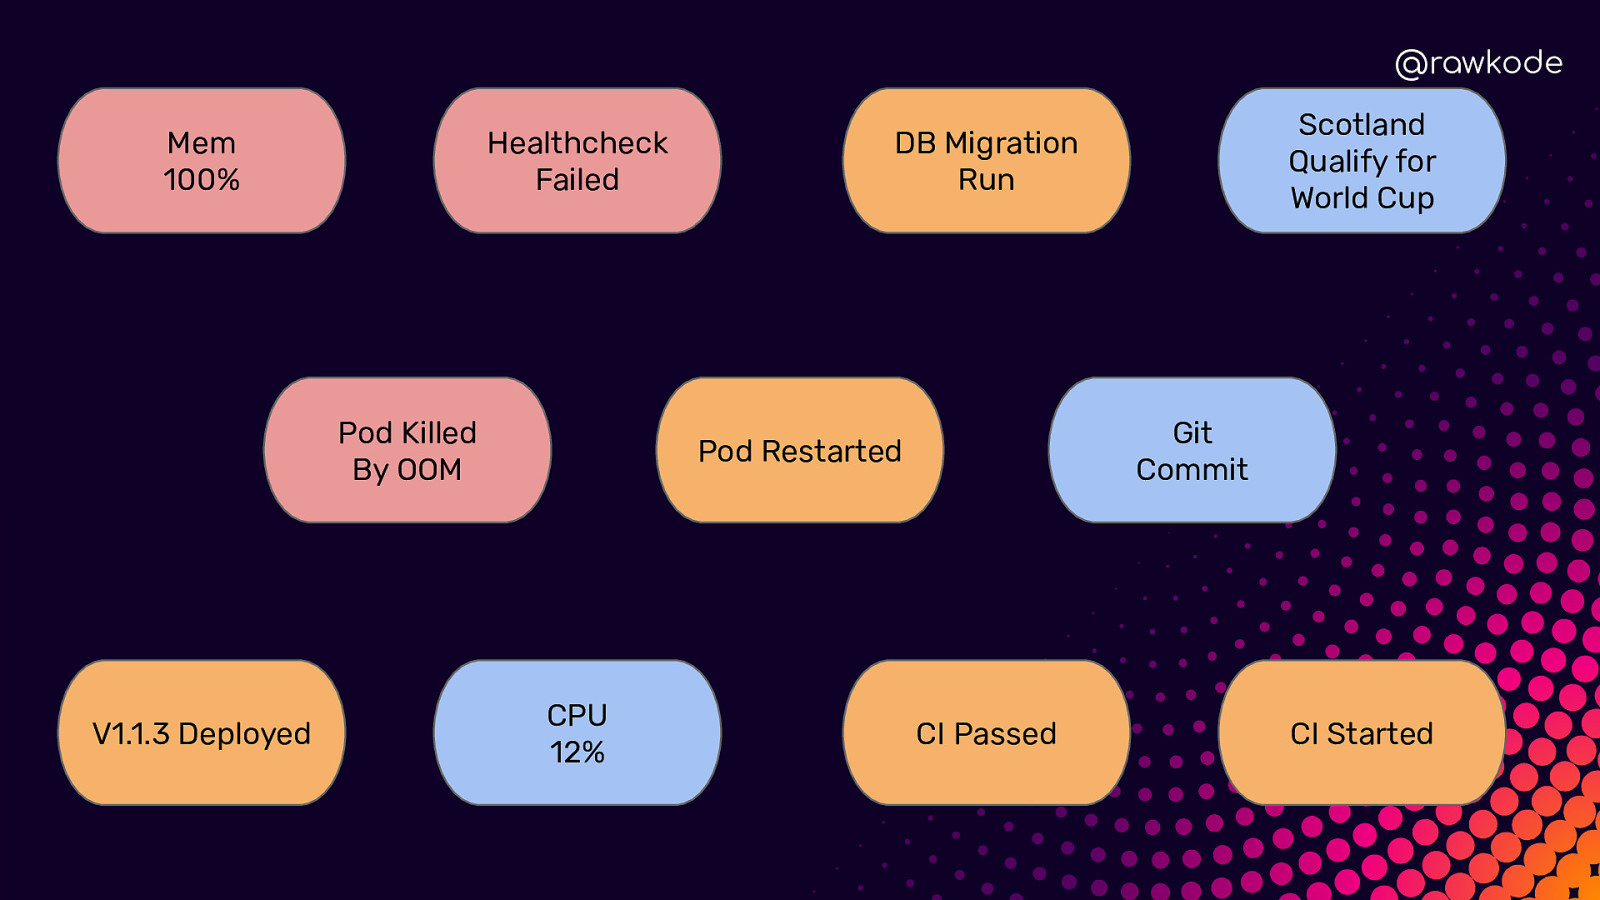
@rawkode Mem 100% Healthcheck Failed Pod Killed By OOM V1.1.3 Deployed Git Commit Pod Restarted CPU 12% Scotland Qualify for World Cup DB Migration Run CI Passed CI Started
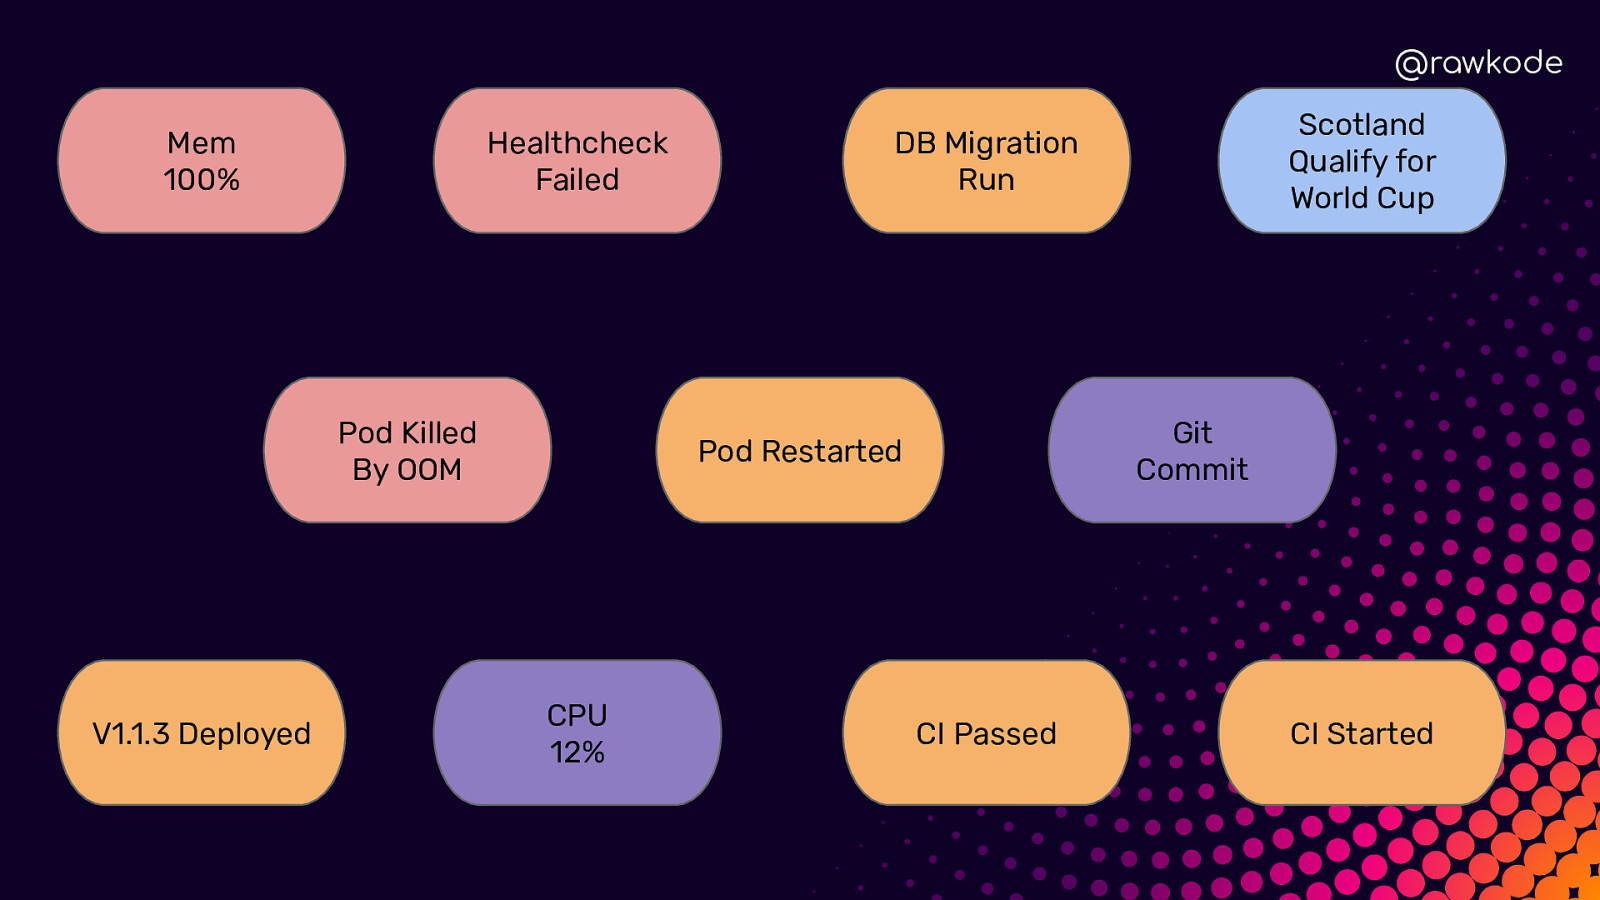
@rawkode Mem 100% Healthcheck Failed Pod Killed By OOM V1.1.3 Deployed Git Commit Pod Restarted CPU 12% Scotland Qualify for World Cup DB Migration Run CI Passed CI Started
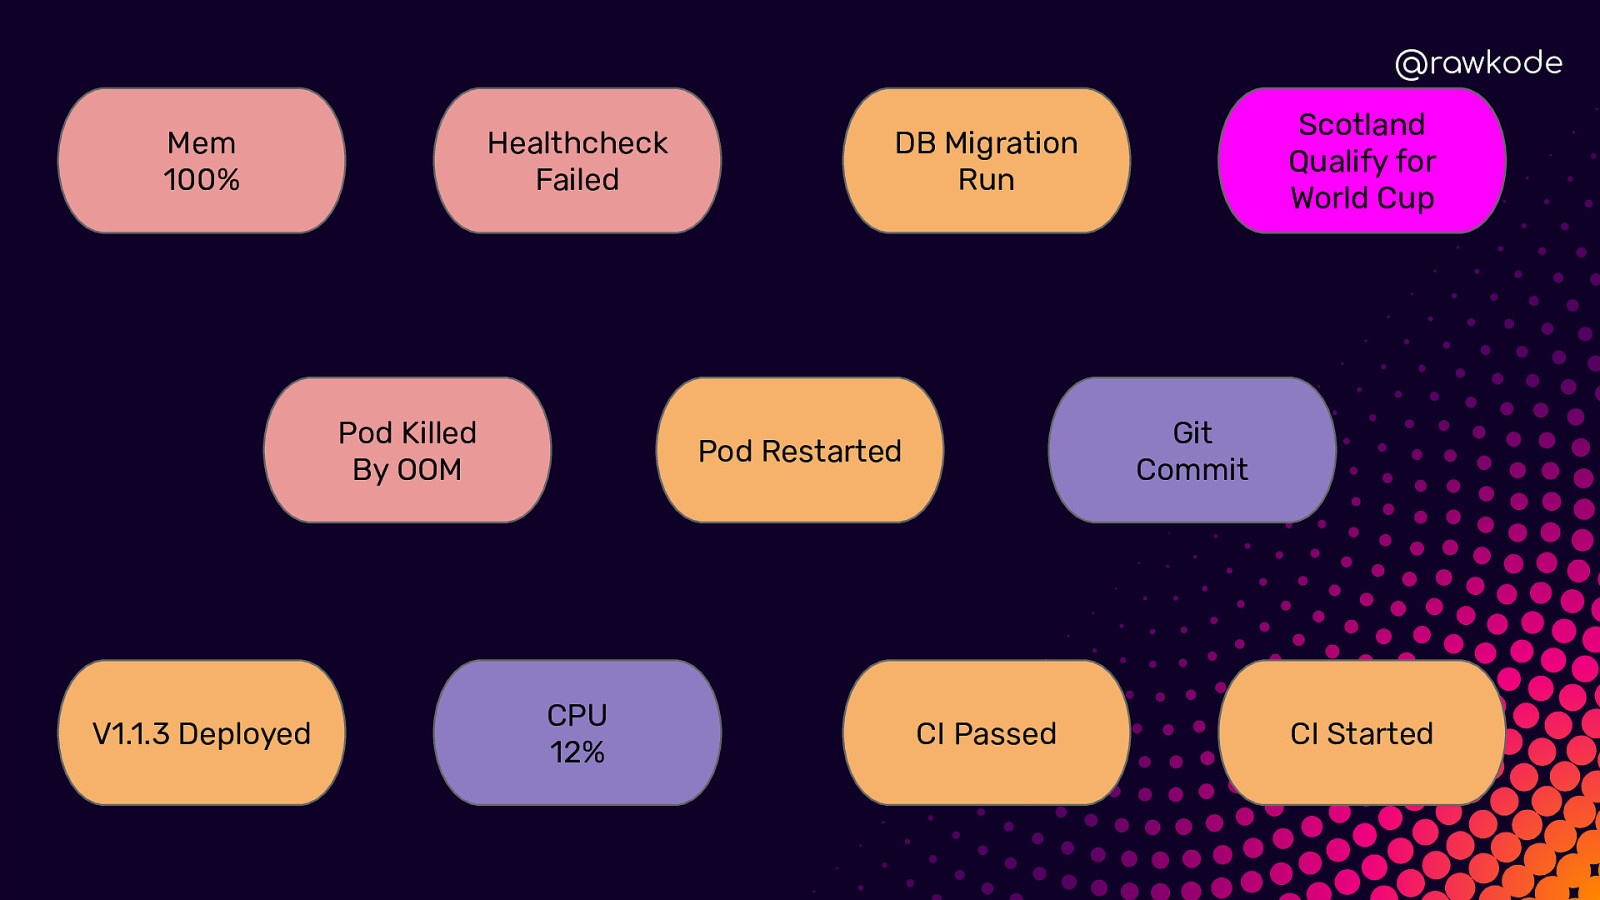
@rawkode Mem 100% Healthcheck Failed Pod Killed By OOM V1.1.3 Deployed Git Commit Pod Restarted CPU 12% Scotland Qualify for World Cup DB Migration Run CI Passed CI Started
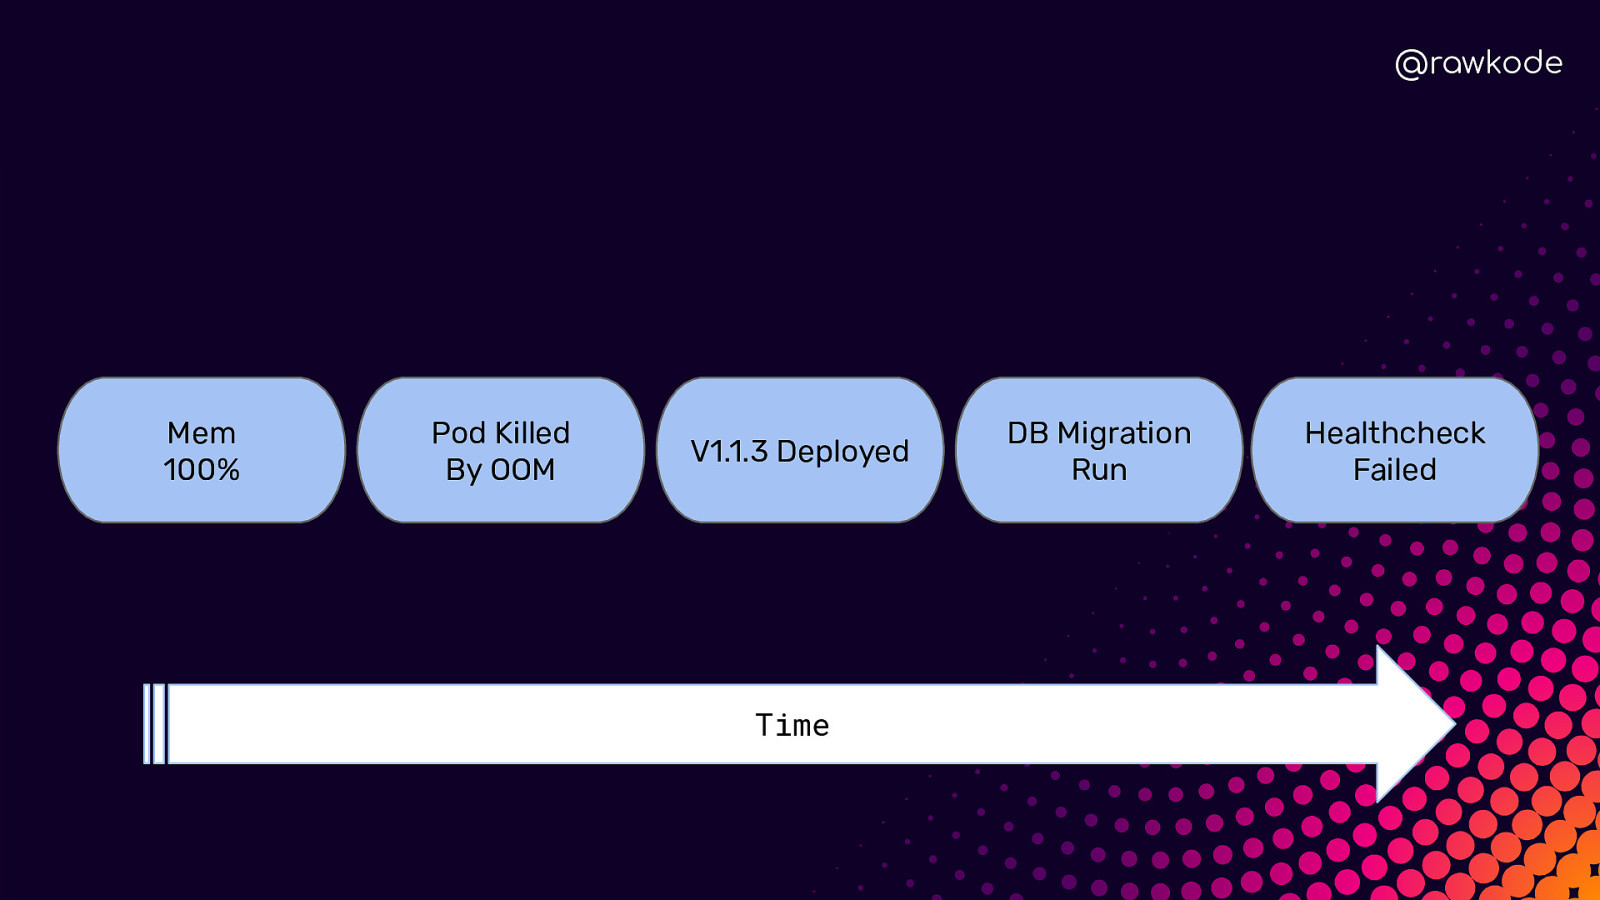
@rawkode Mem 100% Pod Killed By OOM V1.1.3 Deployed Time DB Migration Run Healthcheck Failed
@rawkode What is Time Series Data?
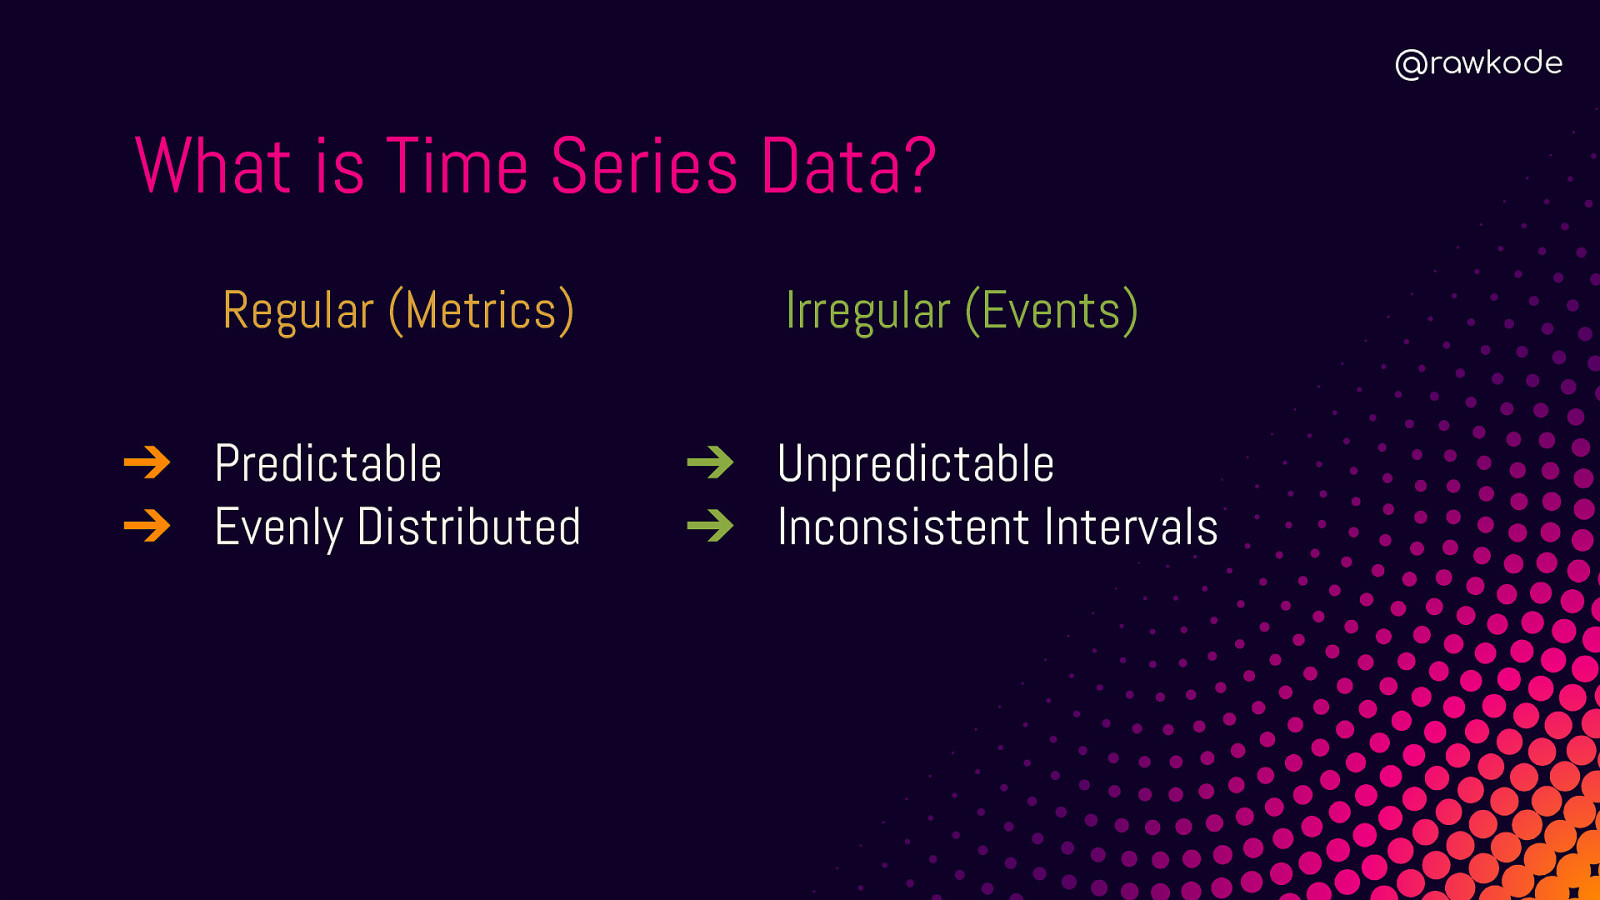
@rawkode What is Time Series Data? Regular (Metrics) ➔ Predictable ➔ Evenly Distributed Irregular (Events) ➔ Unpredictable ➔ Inconsistent Intervals

@rawkode Regular / Metrics ★ ★ ★ ★ CPU Usage Memory Usage Ping Time for Google.com Number of Processes

@rawkode Irregular / Events ★ ★ ★ ★ User Clicked Login Authentication Failed CI Published v1.3.1 Network Cable Unplugged

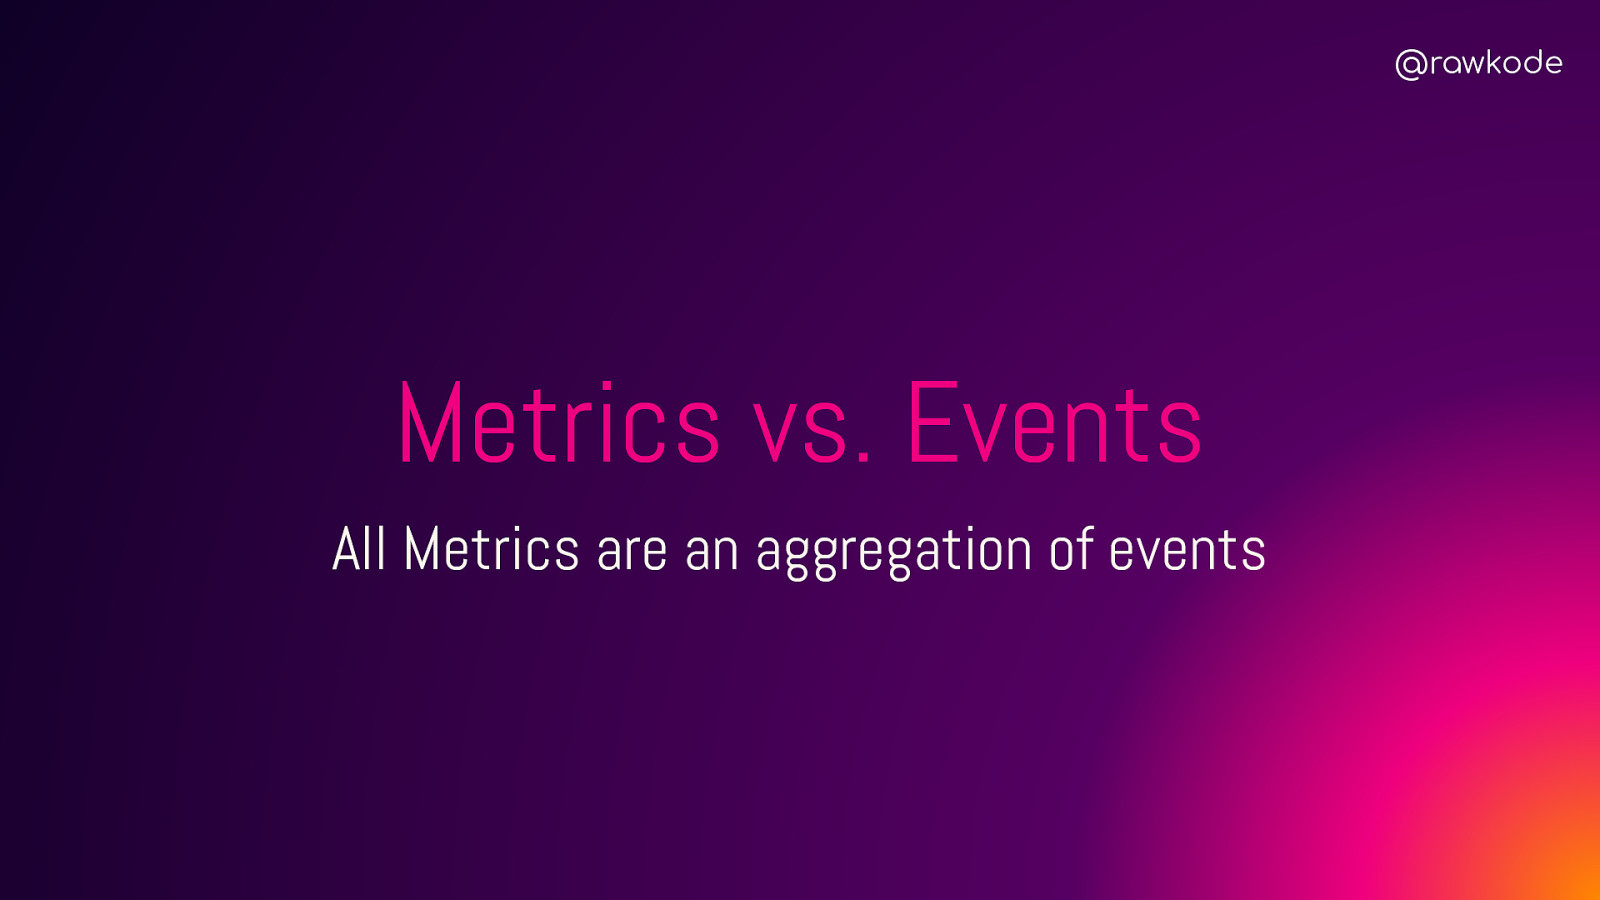
@rawkode Metrics vs. Events All Metrics are an aggregation of events
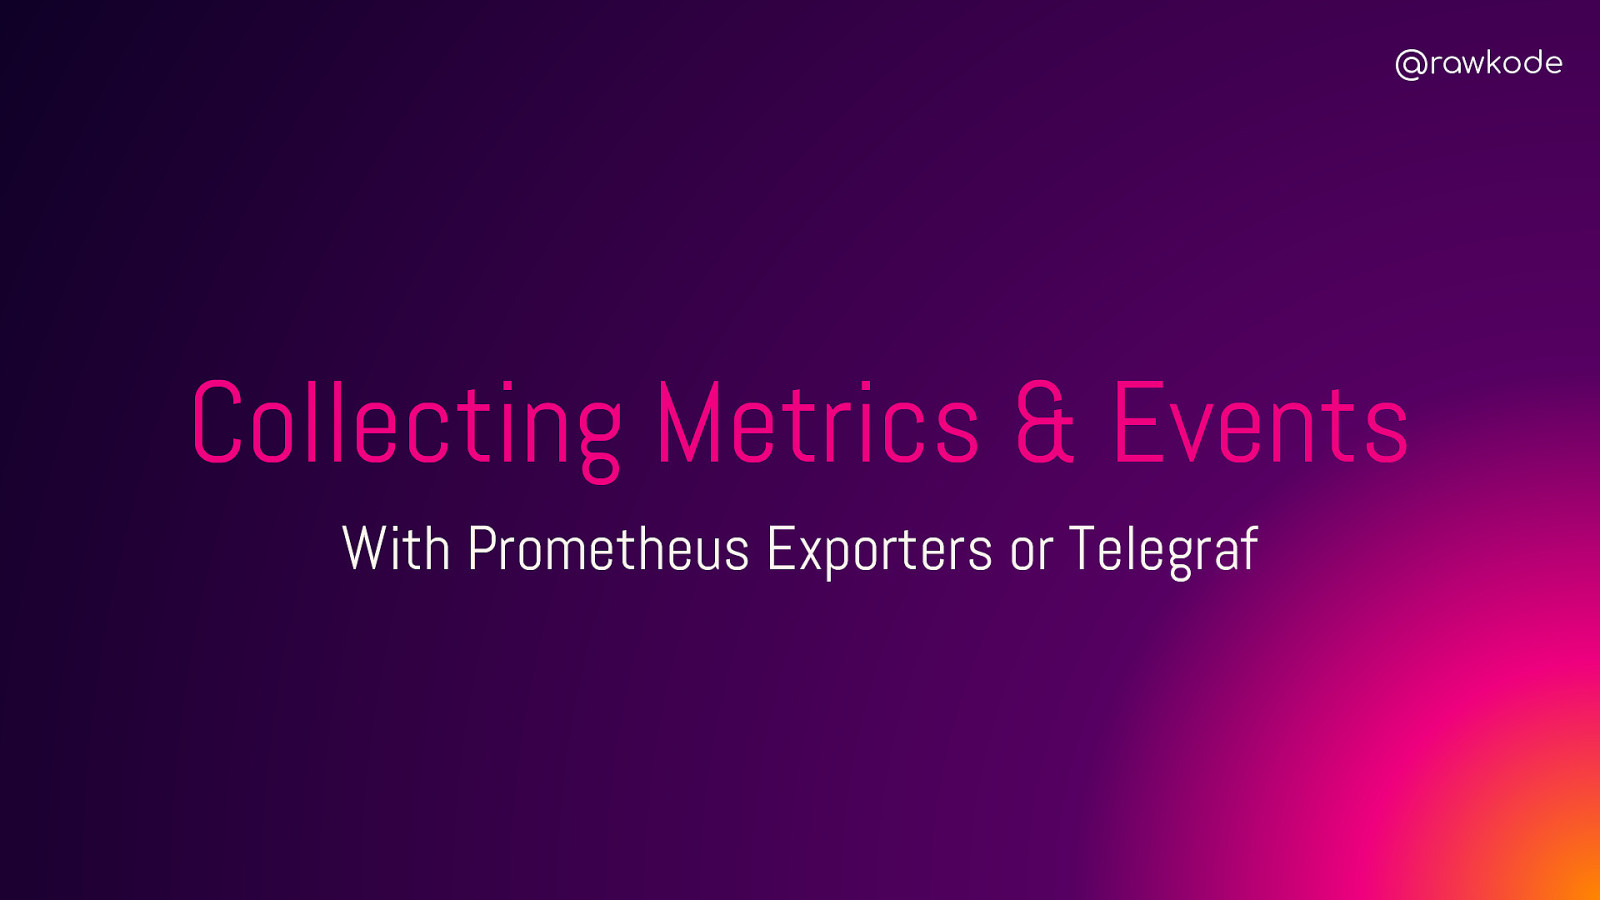
@rawkode Collecting Metrics & Events With Prometheus Exporters or Telegraf
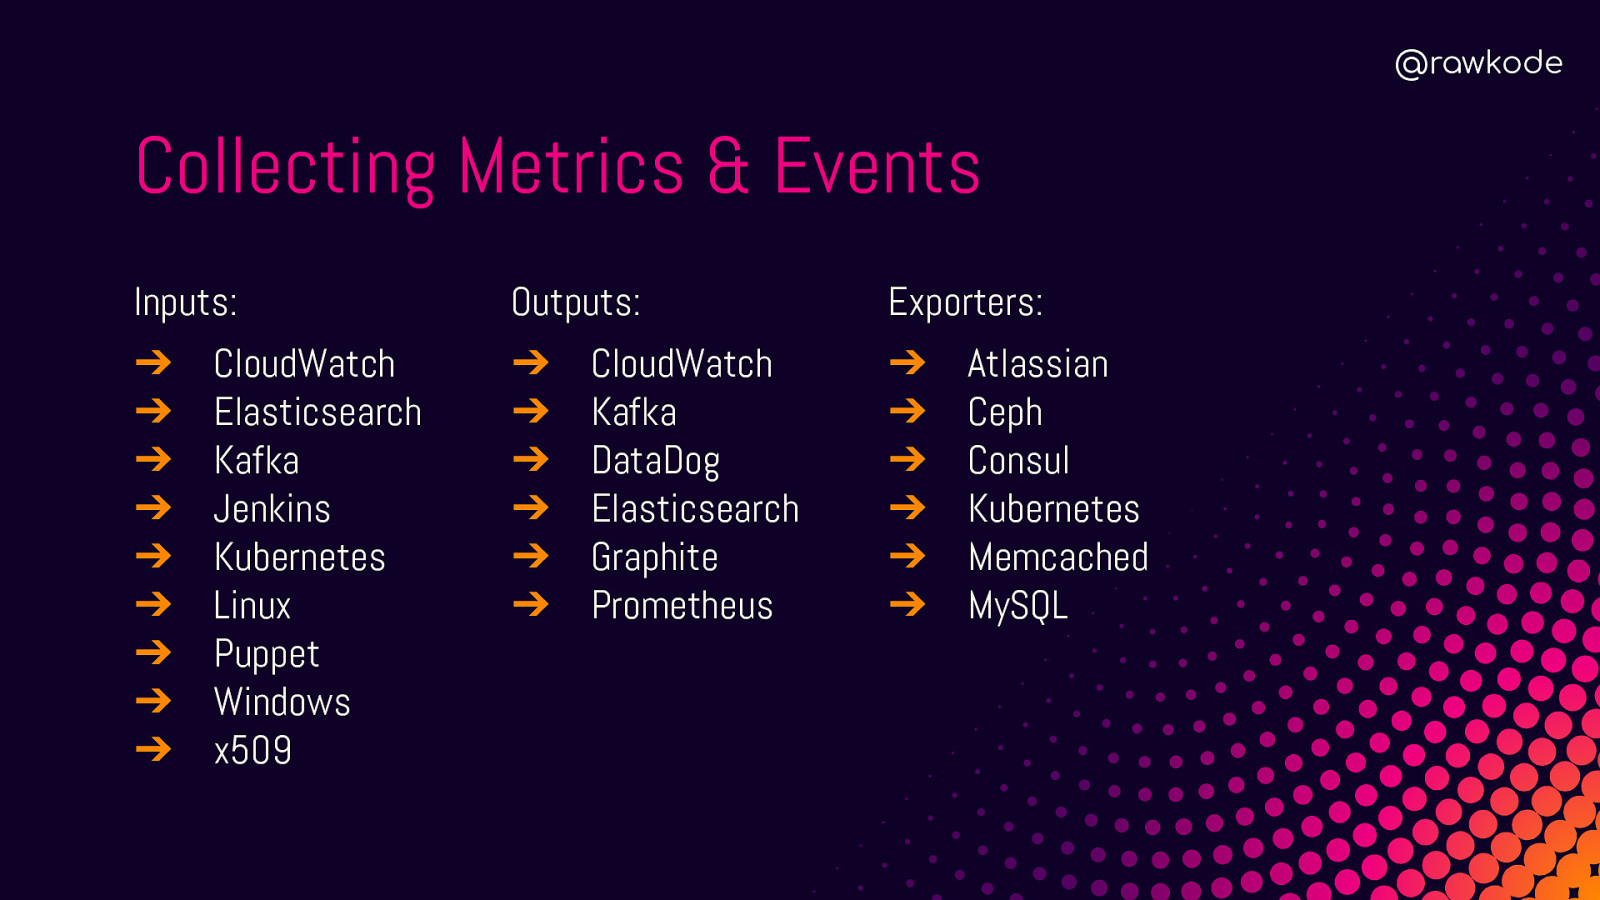
@rawkode Collecting Metrics & Events Inputs: ➔ ➔ ➔ ➔ ➔ ➔ ➔ ➔ ➔ CloudWatch Elasticsearch Kafka Jenkins Kubernetes Linux Puppet Windows x509 Outputs: ➔ ➔ ➔ ➔ ➔ ➔ CloudWatch Kafka DataDog Elasticsearch Graphite Prometheus Exporters: ➔ ➔ ➔ ➔ ➔ ➔ Atlassian Ceph Consul Kubernetes Memcached MySQL

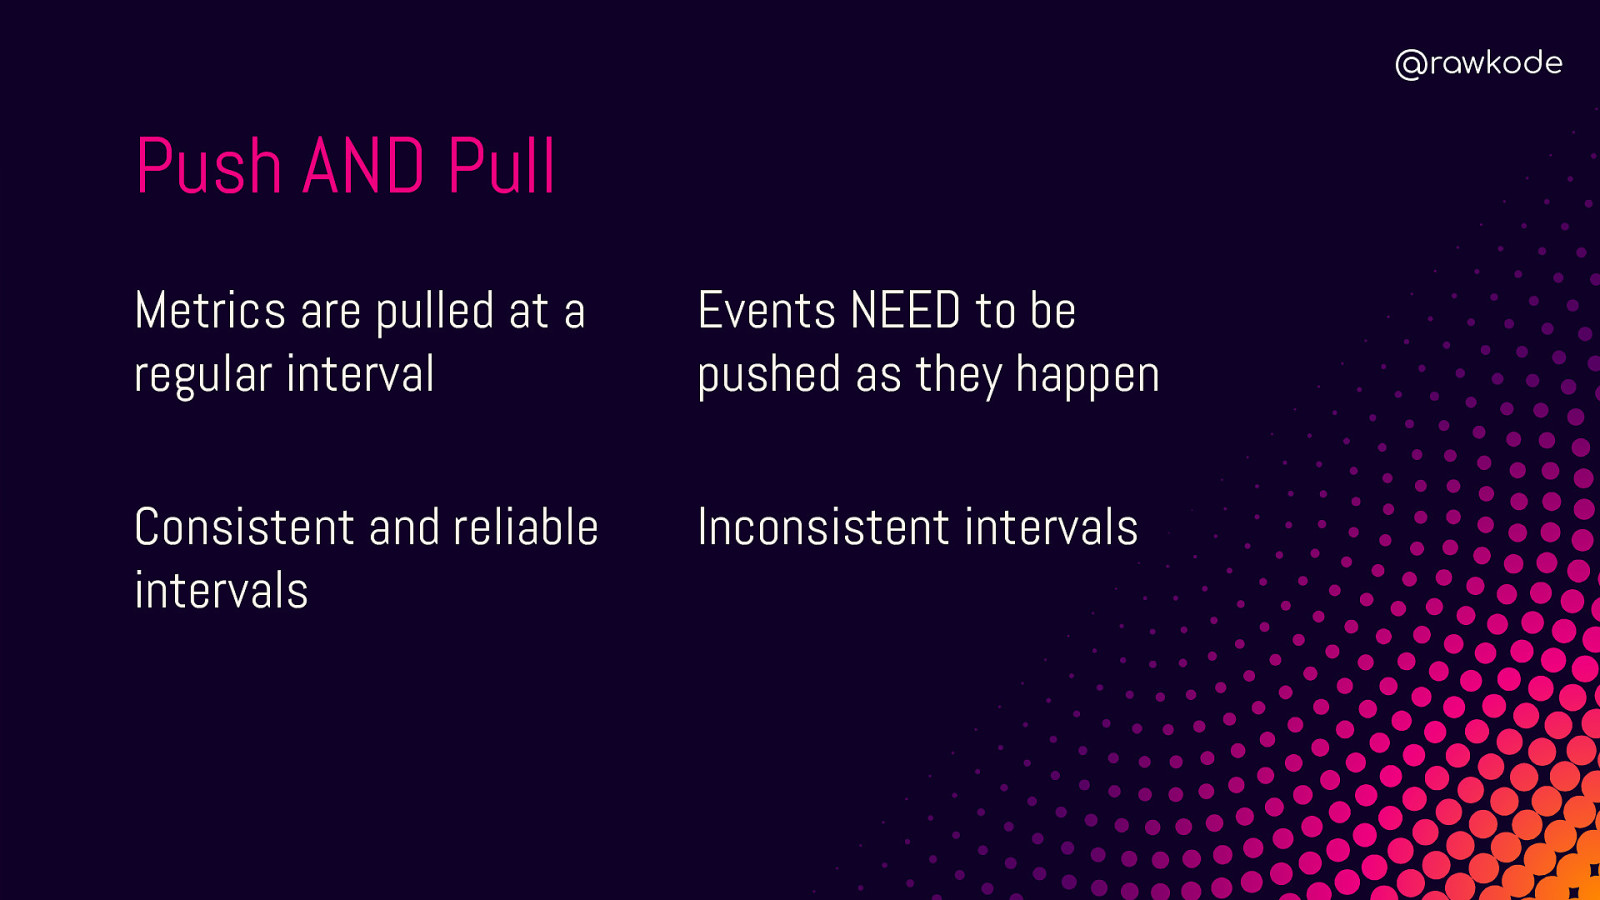
@rawkode Push AND Pull Metrics are pulled at a regular interval Events NEED to be pushed as they happen Consistent and reliable intervals Inconsistent intervals
@rawkode Time Series Data Use Cases
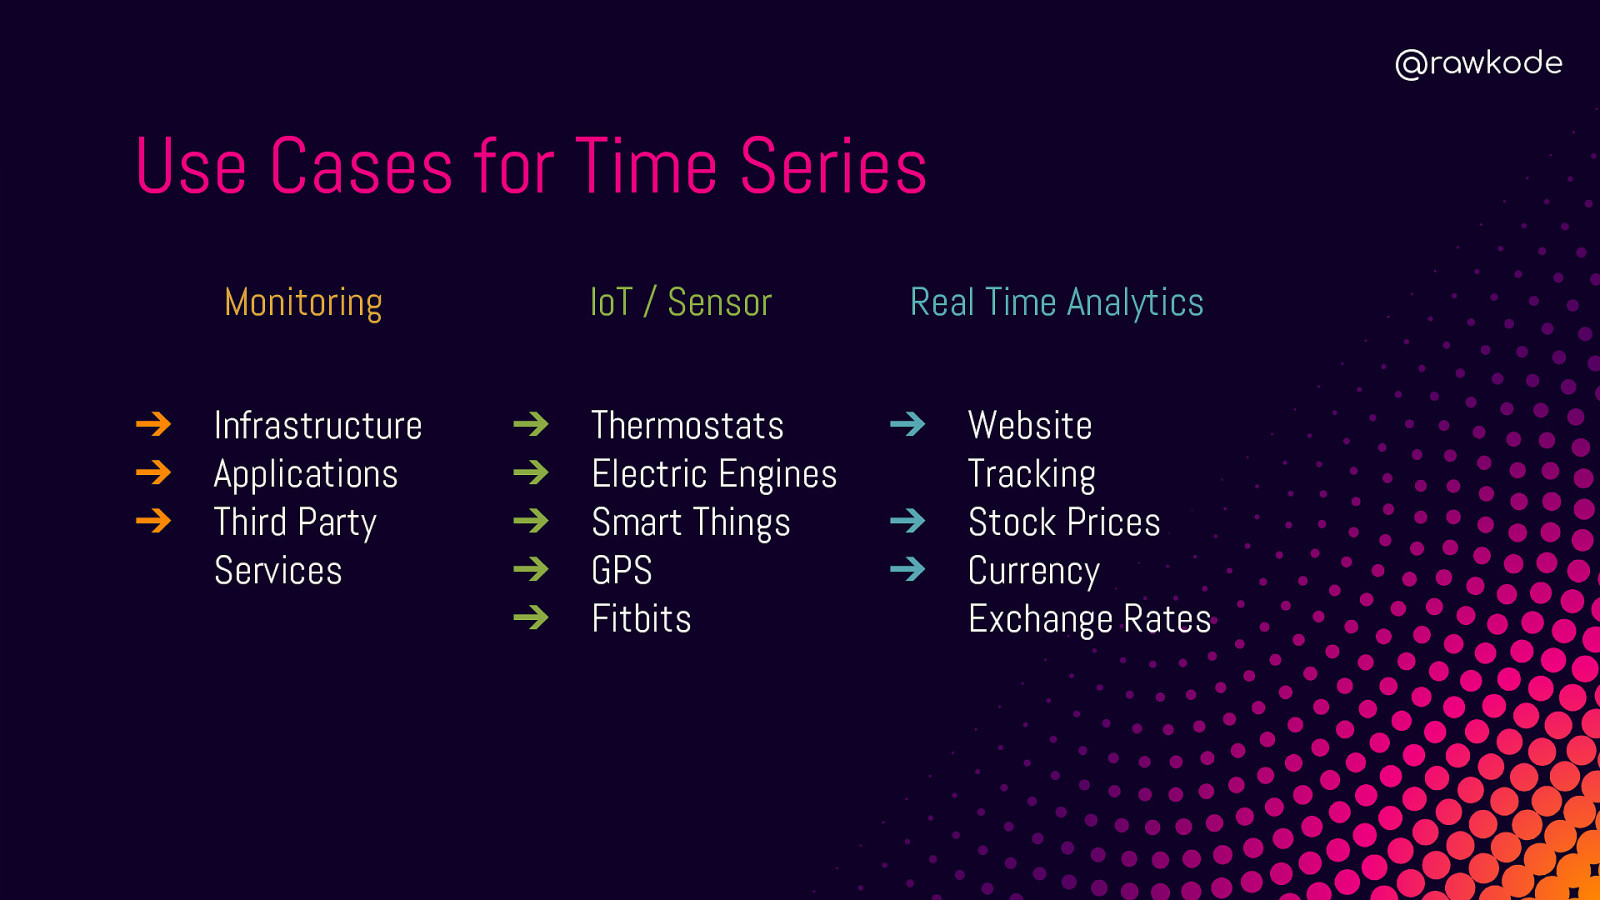
@rawkode Use Cases for Time Series Monitoring ➔ ➔ ➔ Infrastructure Applications Third Party Services IoT / Sensor ➔ ➔ ➔ ➔ ➔ Thermostats Electric Engines Smart Things GPS Fitbits Real Time Analytics ➔ ➔ ➔ Website Tracking Stock Prices Currency Exchange Rates
Time Series Databases TSDB’s
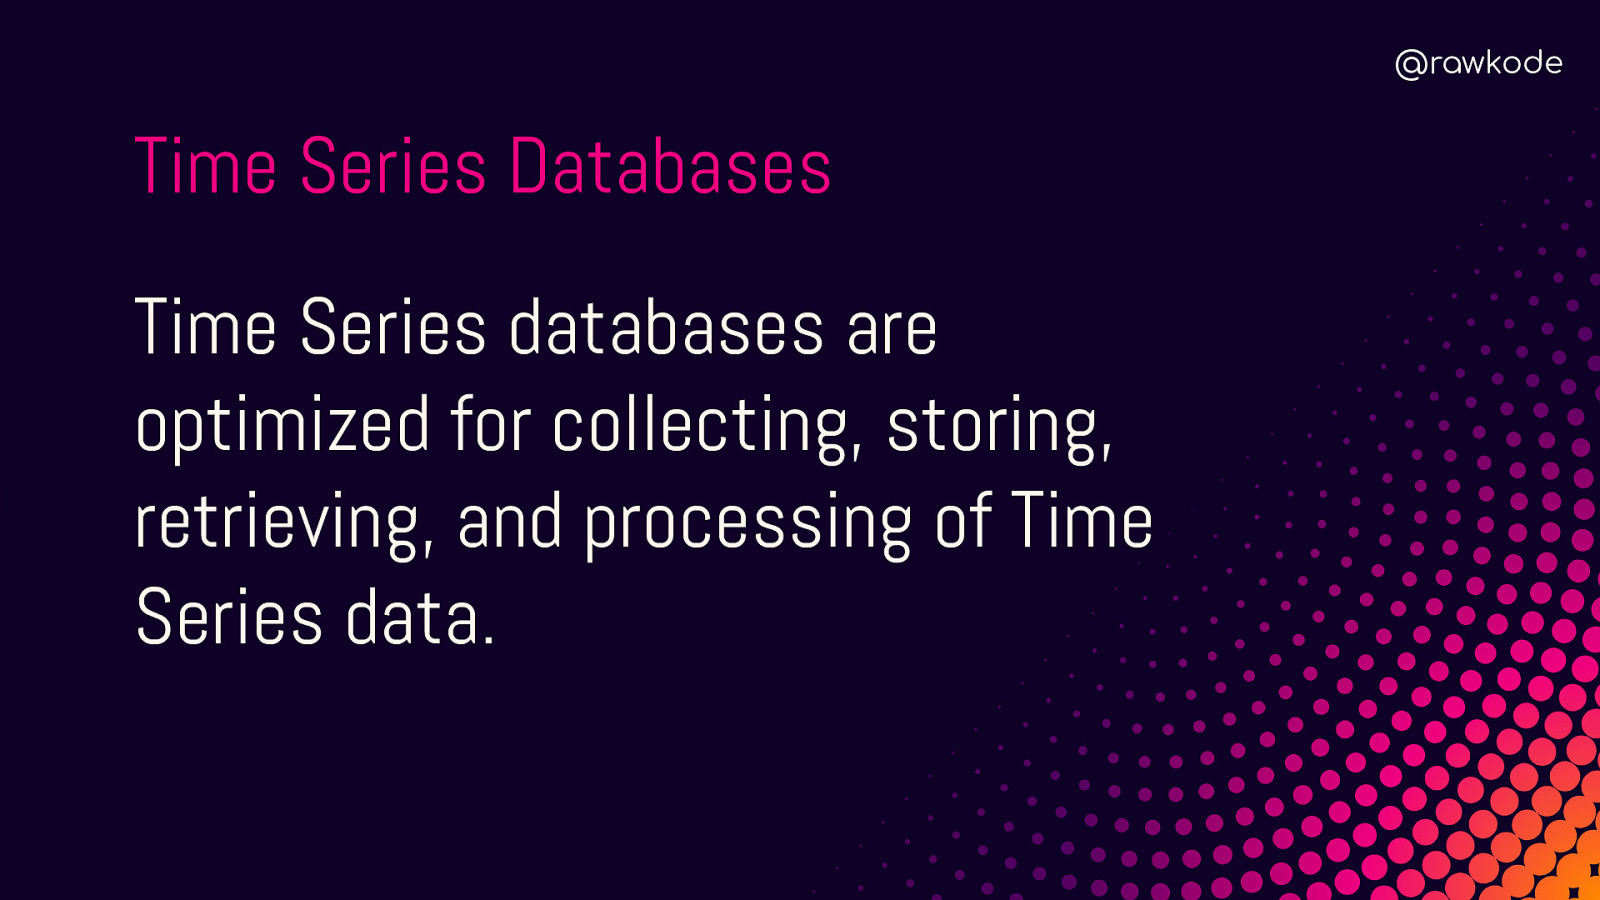
@rawkode Time Series Databases Time Series databases are optimized for collecting, storing, retrieving, and processing of Time Series data.
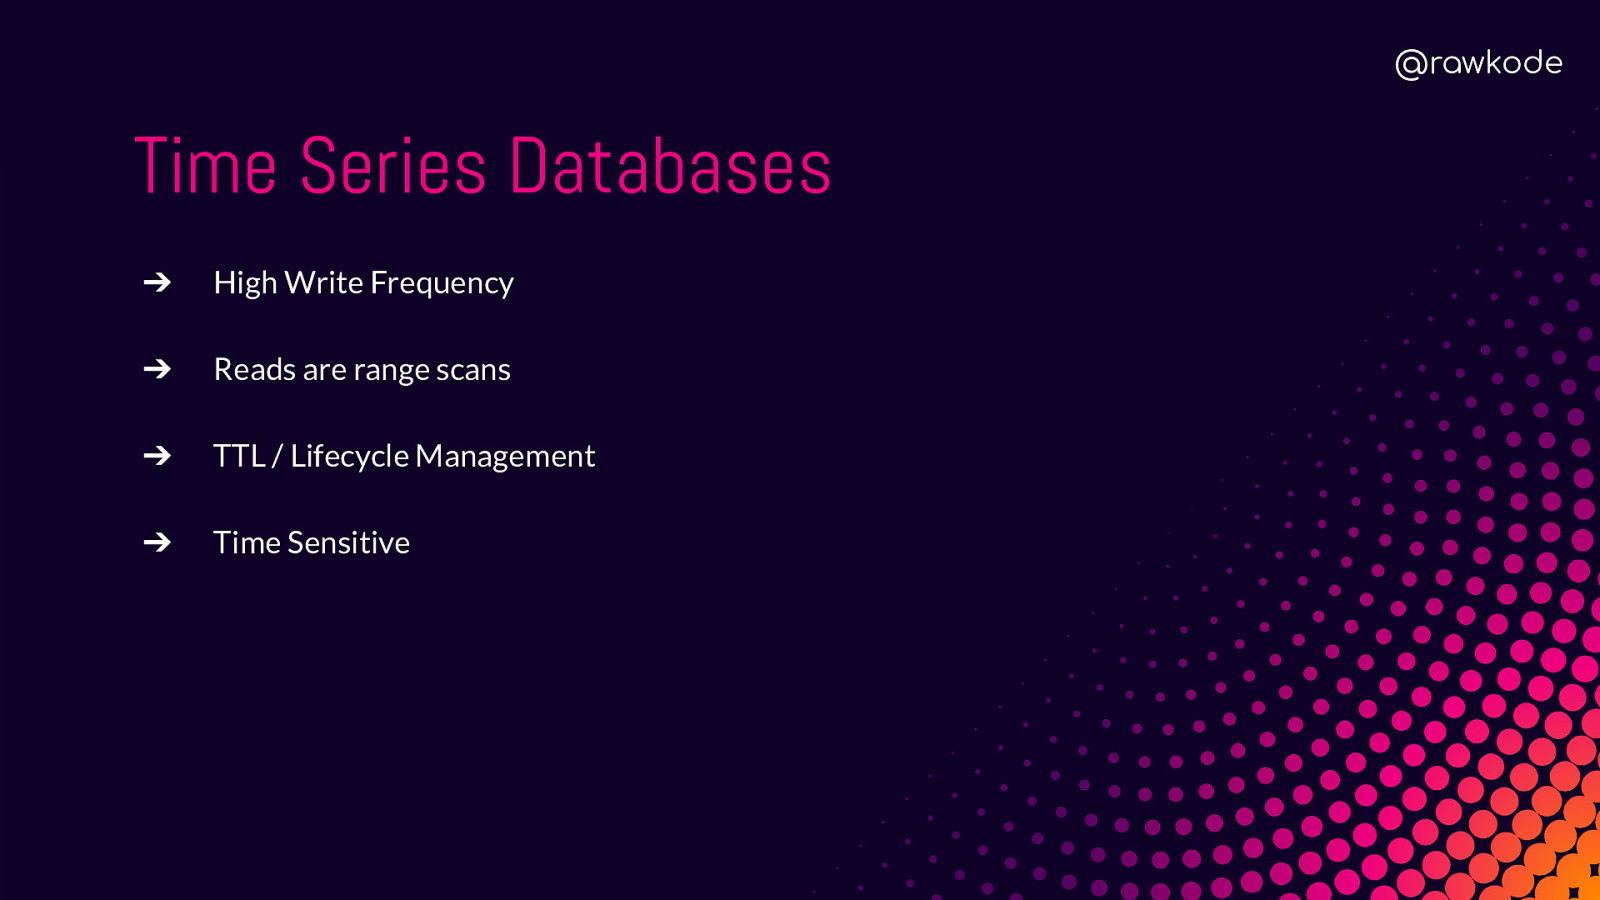
@rawkode Time Series Databases ➔ High Write Frequency ➔ Reads are range scans ➔ TTL / Lifecycle Management ➔ Time Sensitive
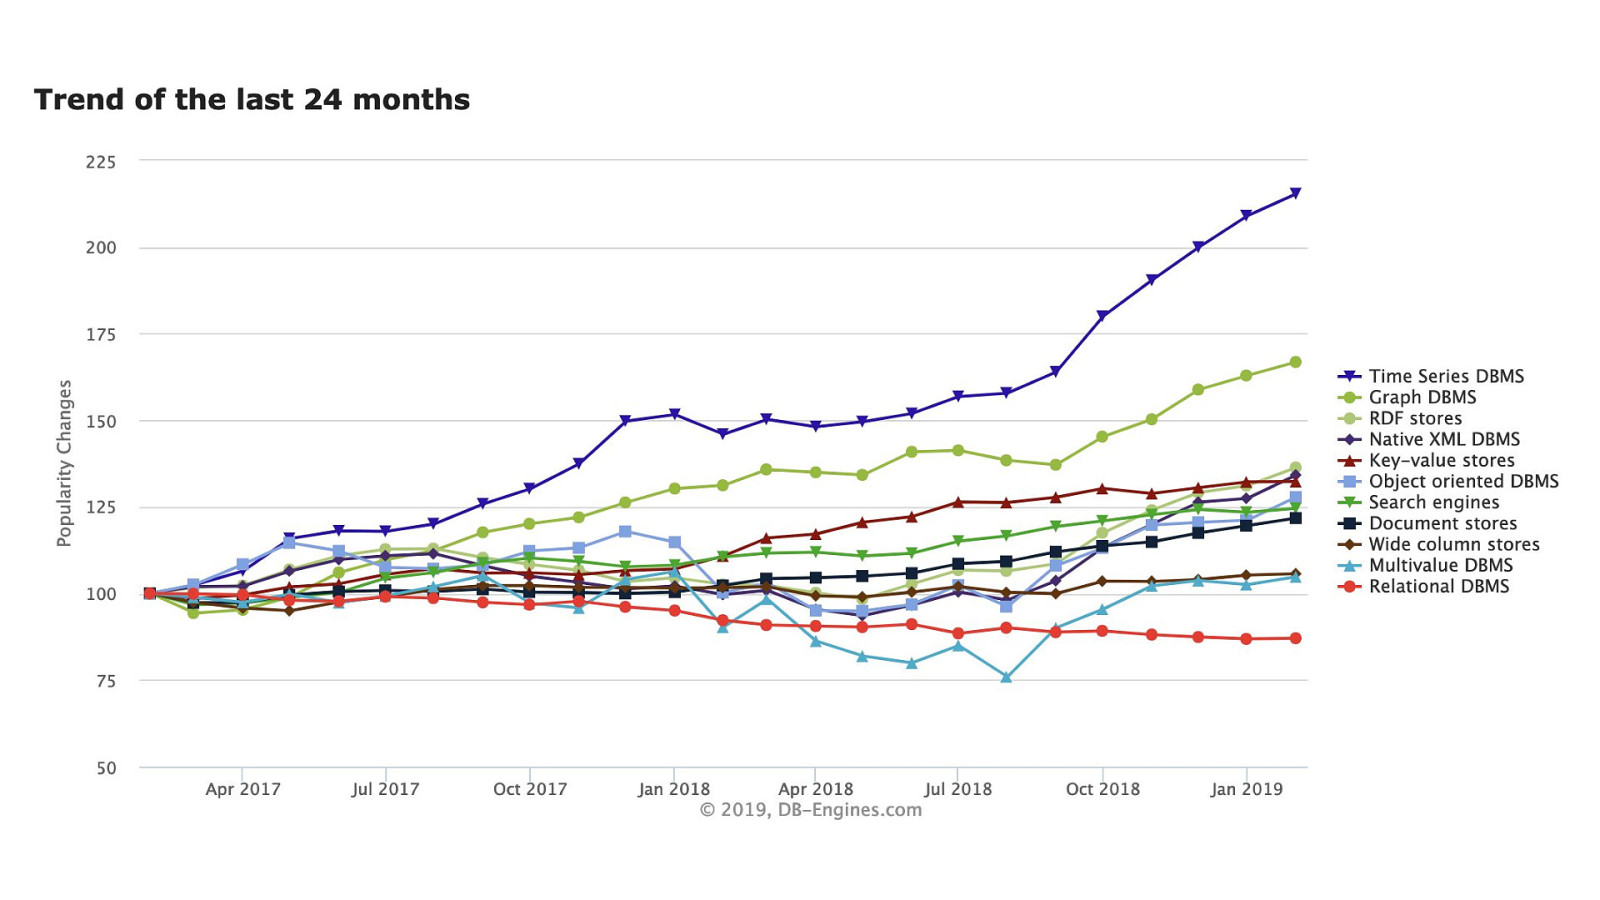
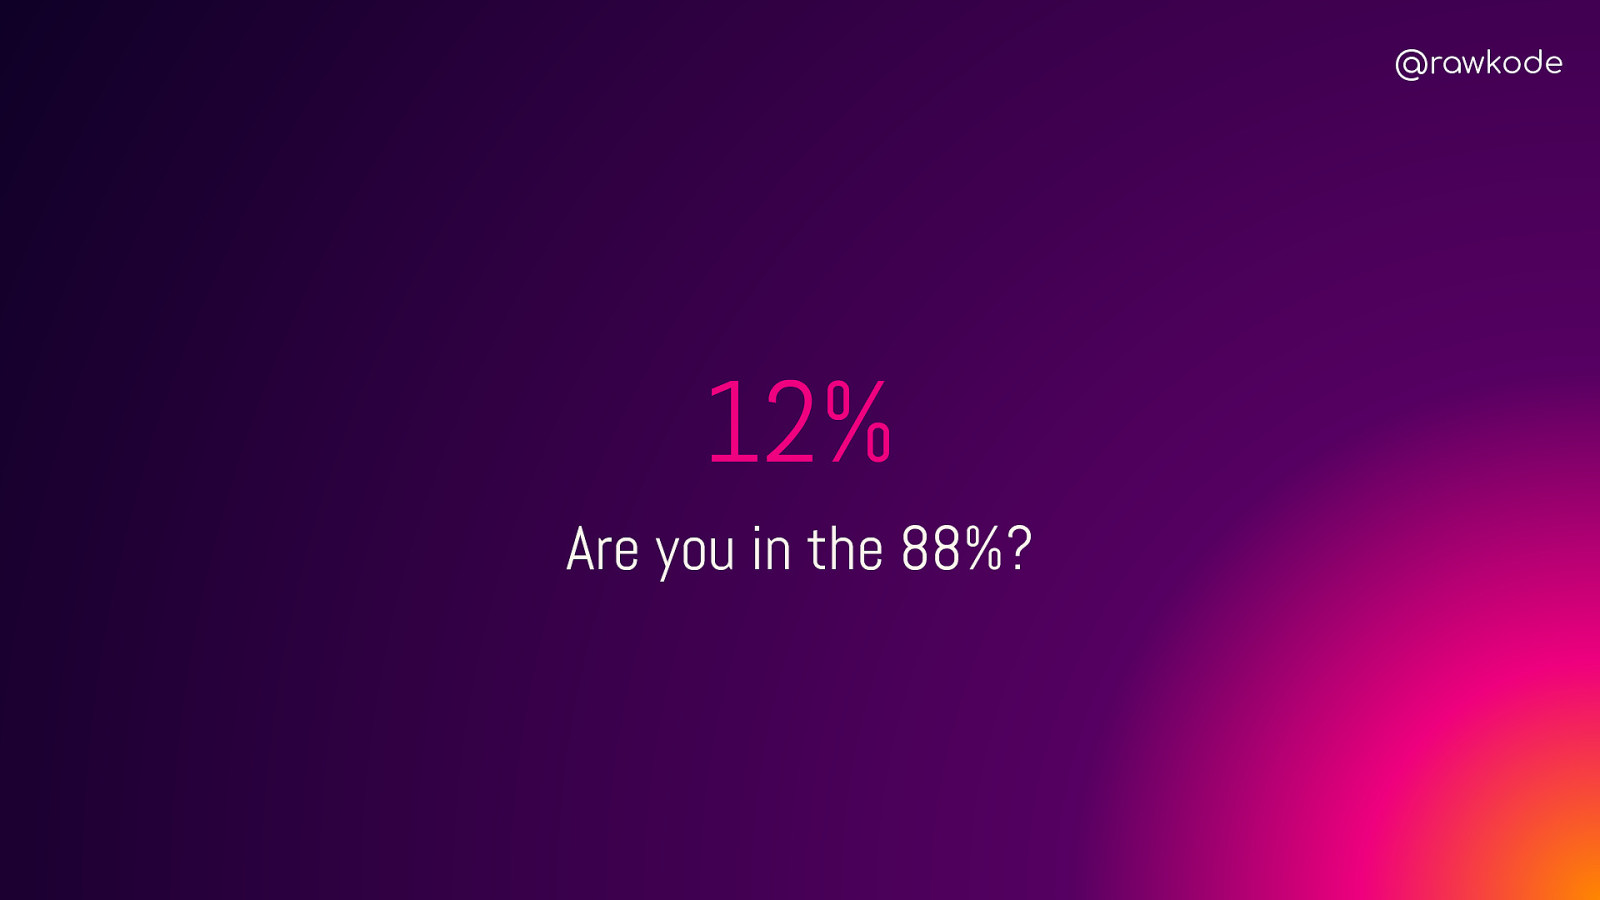
@rawkode 12% Are you in the 88%?


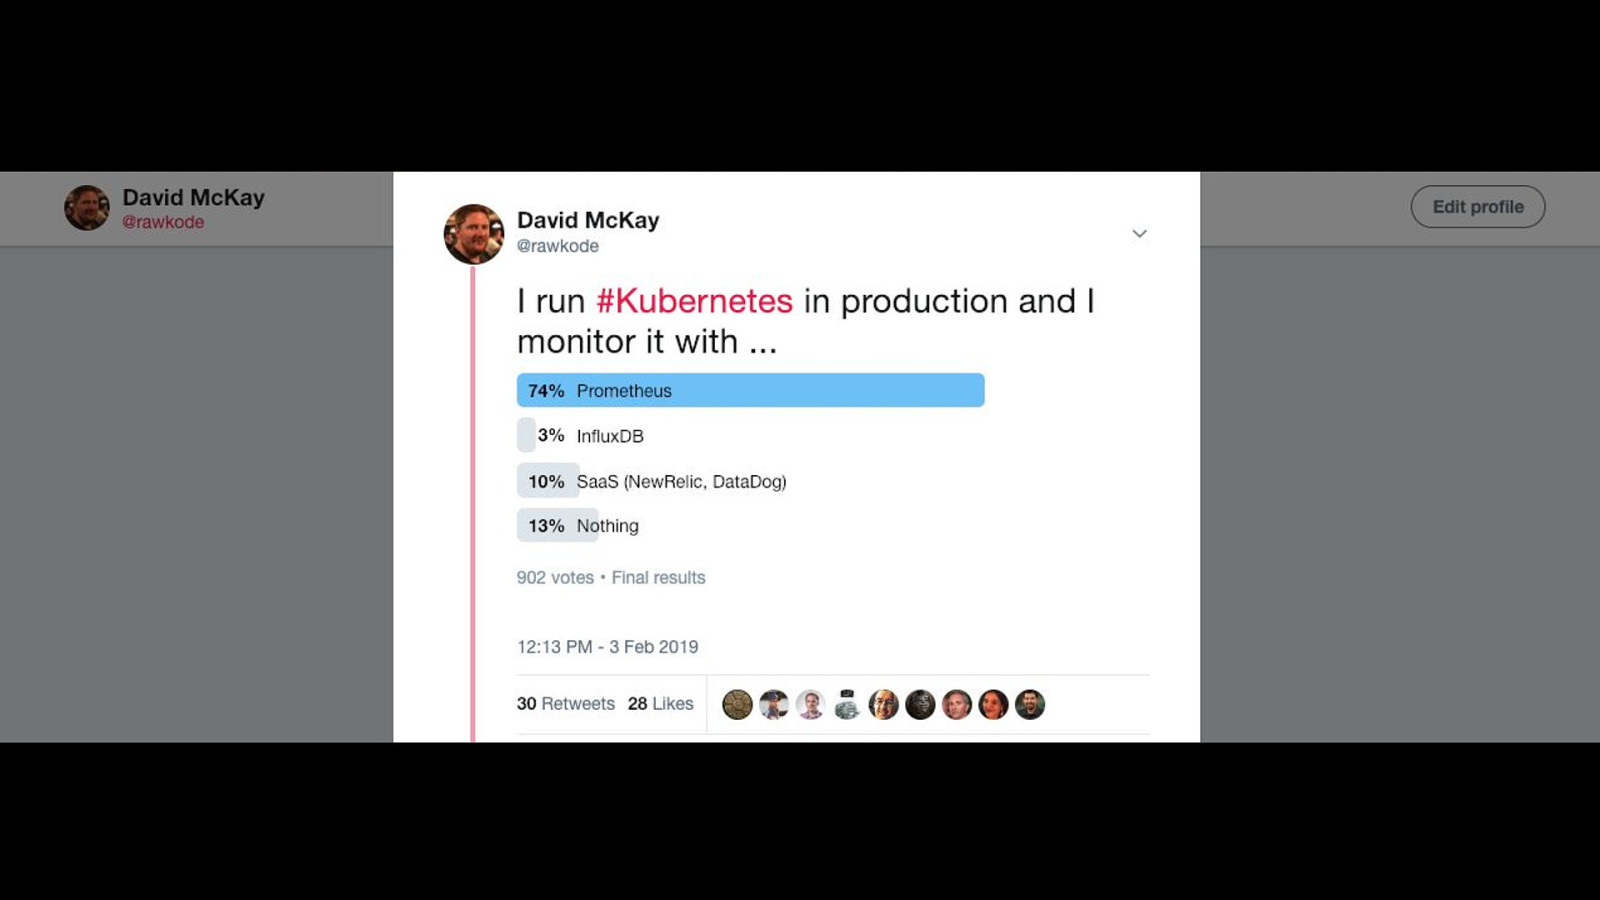
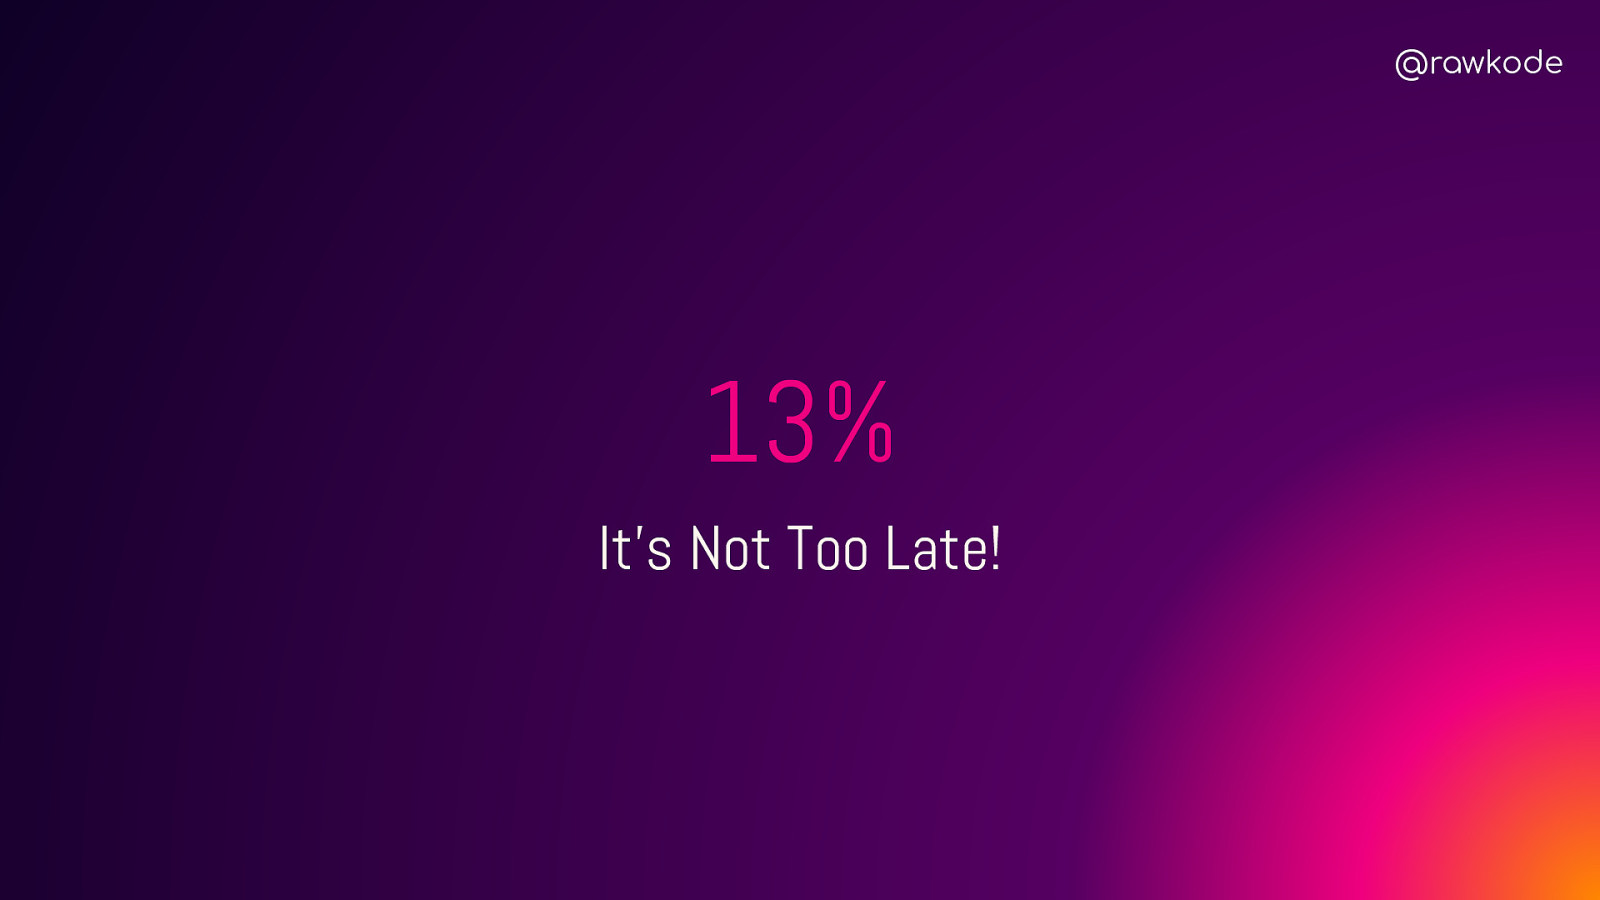
@rawkode 13% It’s Not Too Late!

@rawkode
@rawkode Disclaimer Most of this isn’t unique to InfluxDB
InfluxDB Introductions
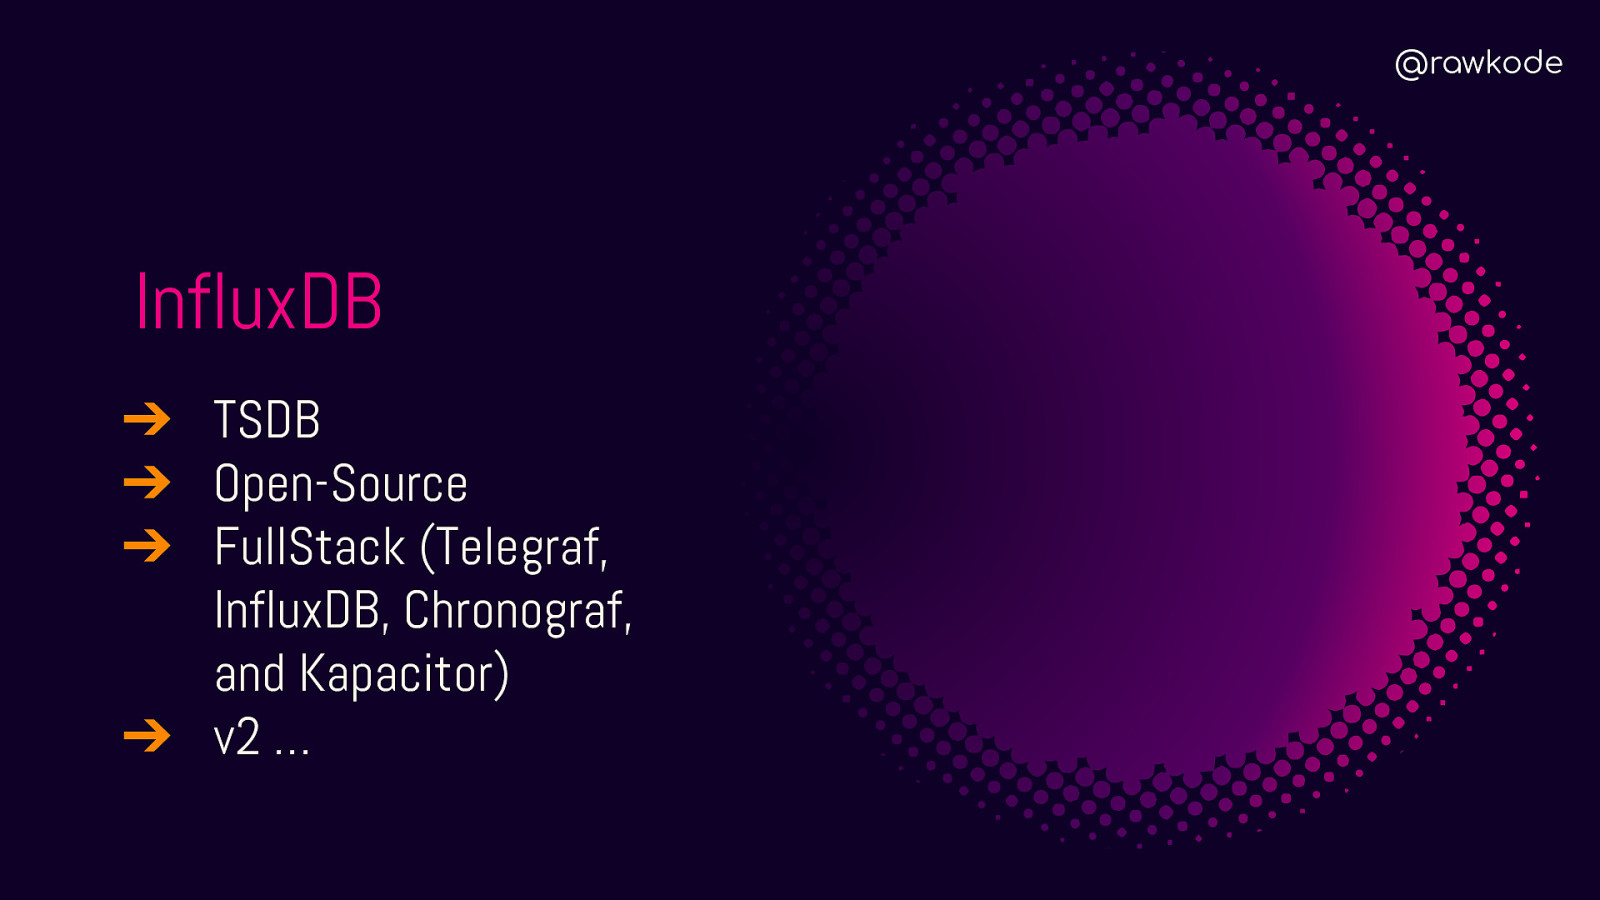
@rawkode InfluxDB ➔ TSDB ➔ Open-Source ➔ FullStack (Telegraf, InfluxDB, Chronograf, and Kapacitor) ➔ v2 …

@rawkode Points At any point in time, this value was N
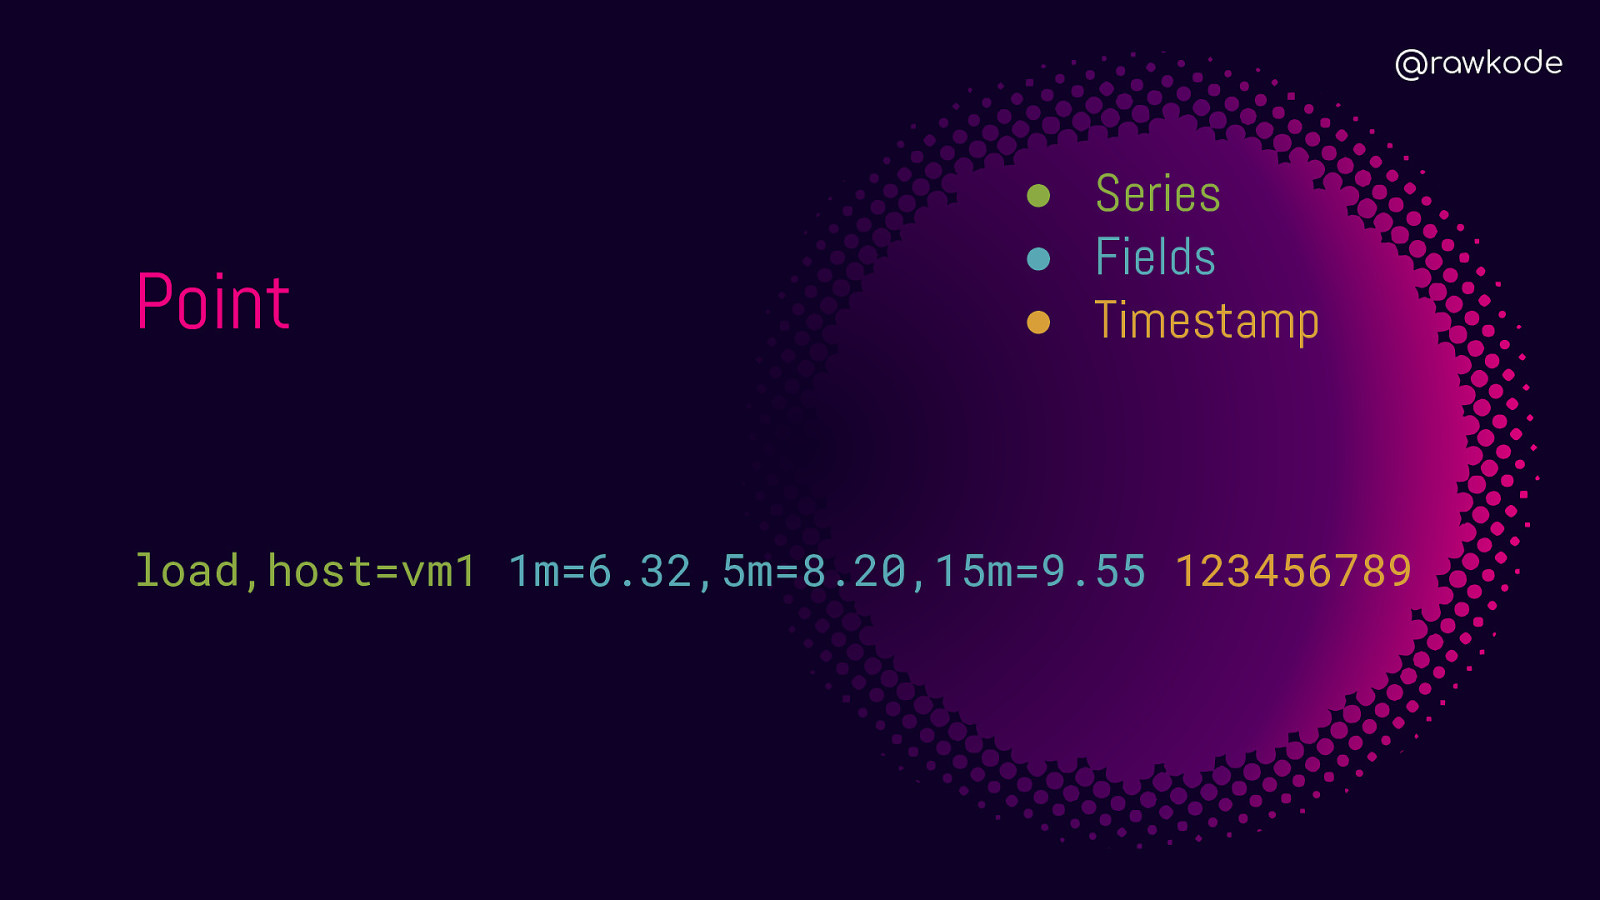
@rawkode Point ● Series ● Fields ● Timestamp load,host=vm1 1m=6.32,5m=8.20,15m=9.55 123456789
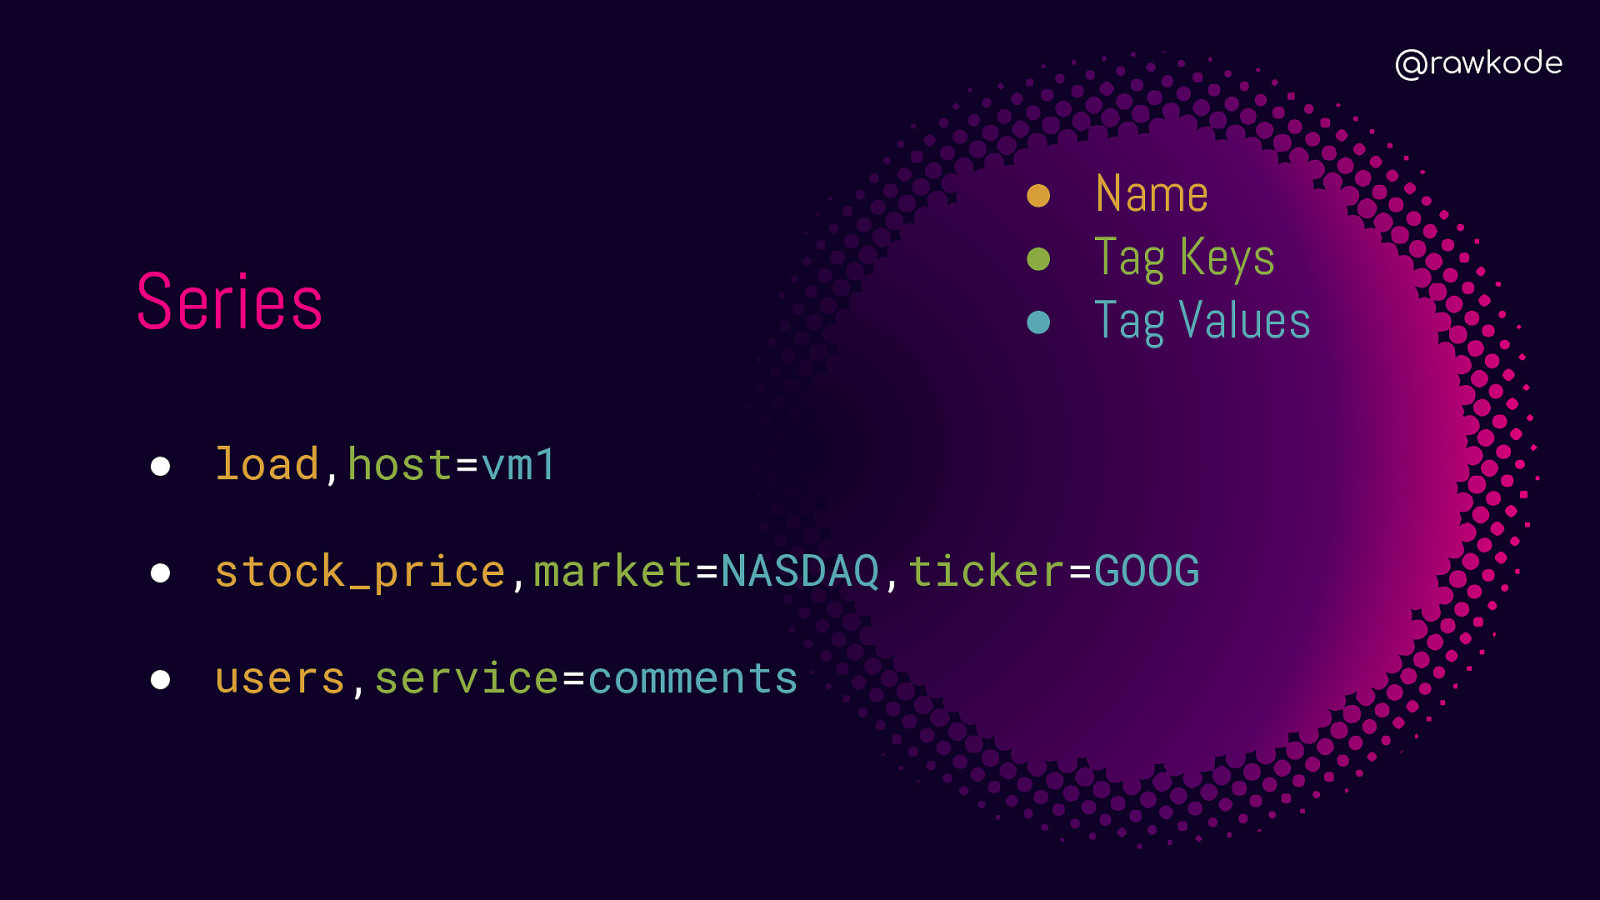
@rawkode Series ● Name ● Tag Keys ● Tag Values ● load,host=vm1 ● stock_price,market=NASDAQ,ticker=GOOG ● users,service=comments
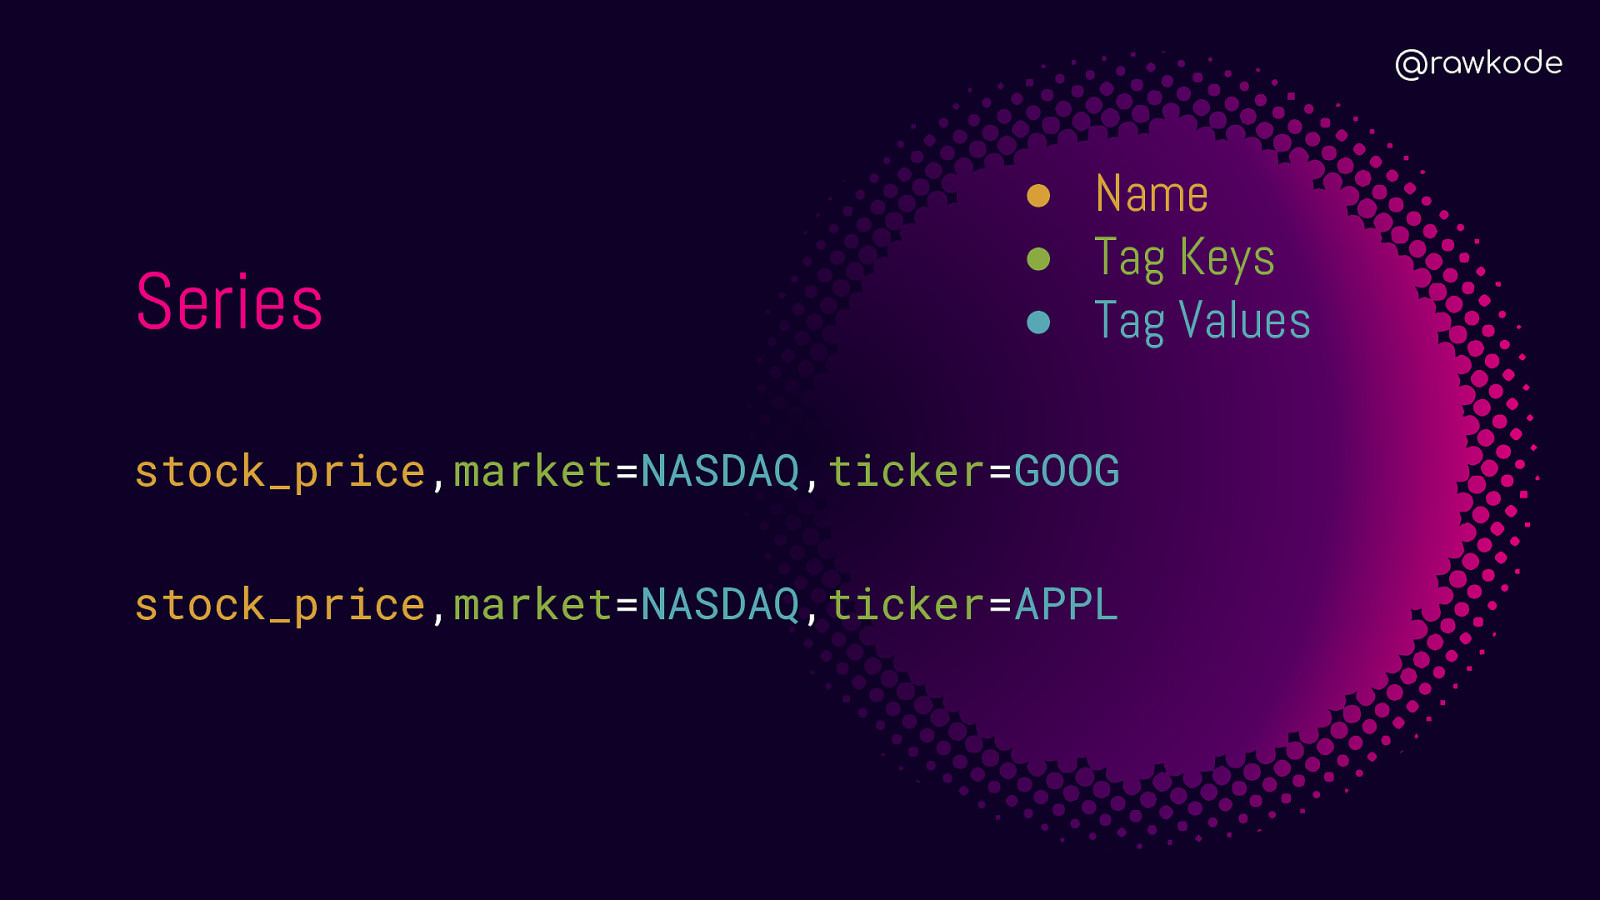
@rawkode Series ● Name ● Tag Keys ● Tag Values stock_price,market=NASDAQ,ticker=GOOG stock_price,market=NASDAQ,ticker=APPL
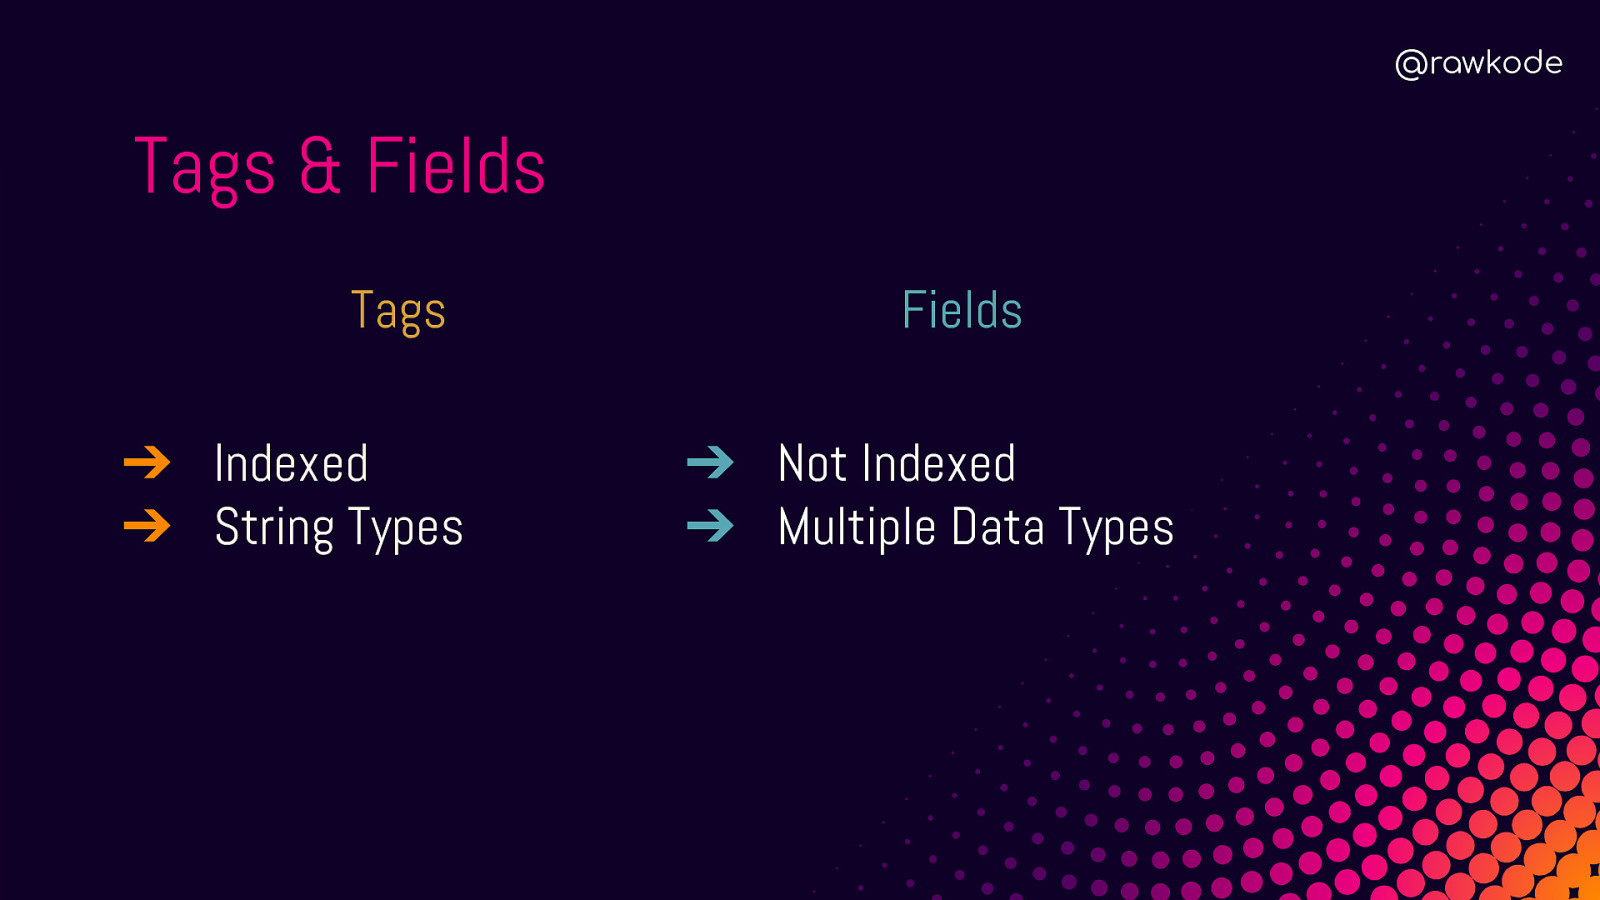
@rawkode Tags & Fields Tags ➔ Indexed ➔ String Types Fields ➔ Not Indexed ➔ Multiple Data Types
Value of Time Series Data Isn’t It Valuable Forever?

@rawkode Resolution The predictable interval at which we will collect our time series data
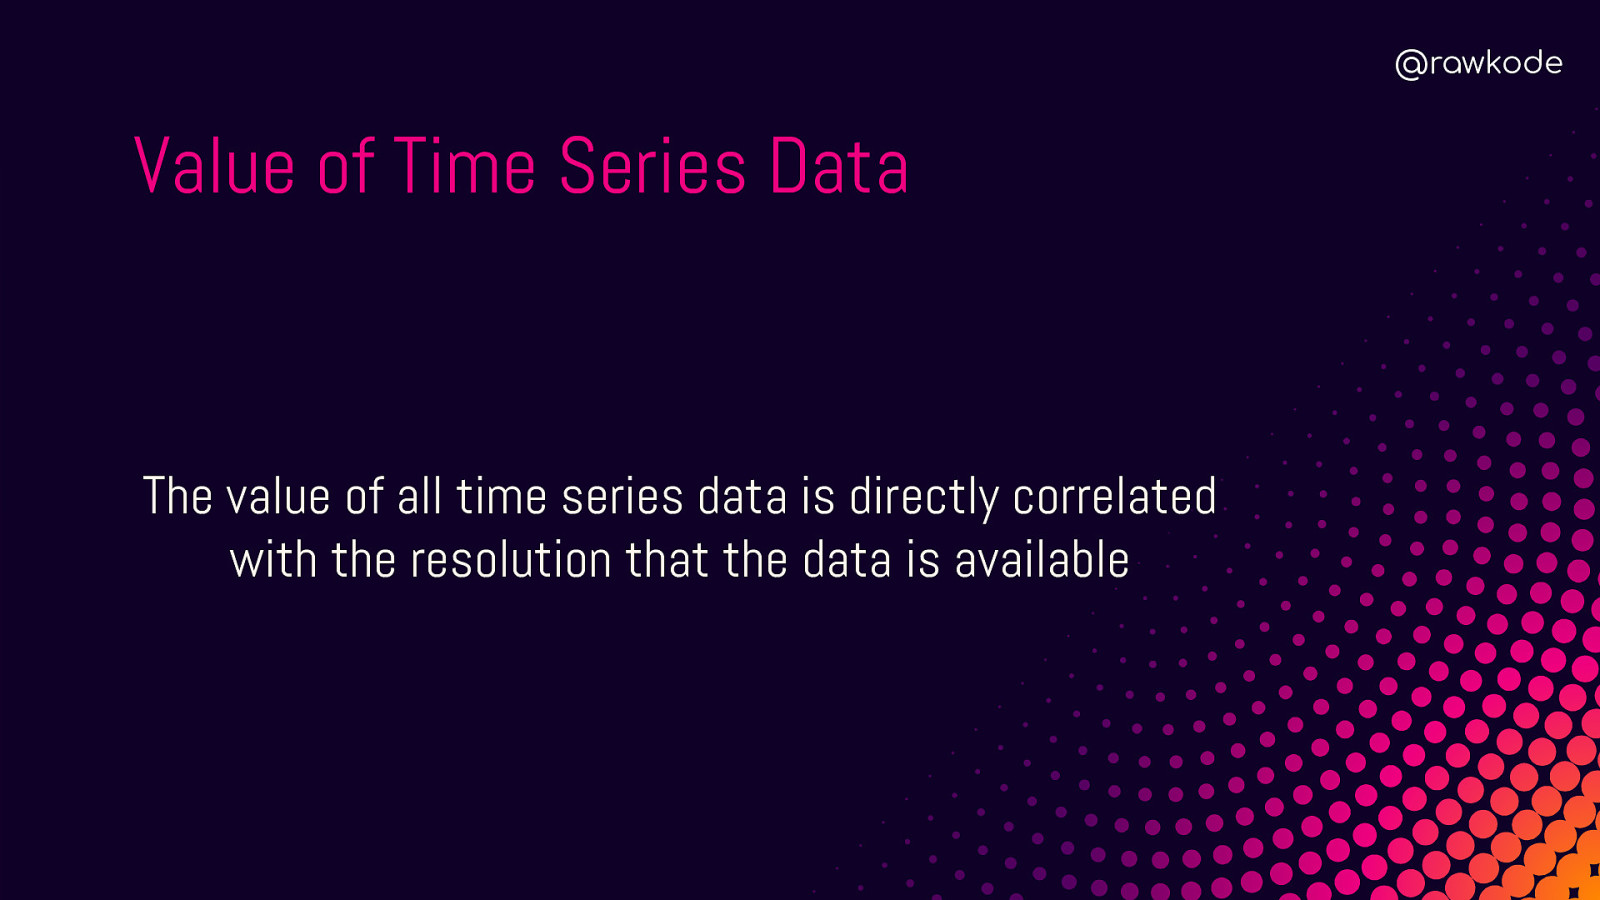
@rawkode Value of Time Series Data The value of all time series data is directly correlated with the resolution that the data is available
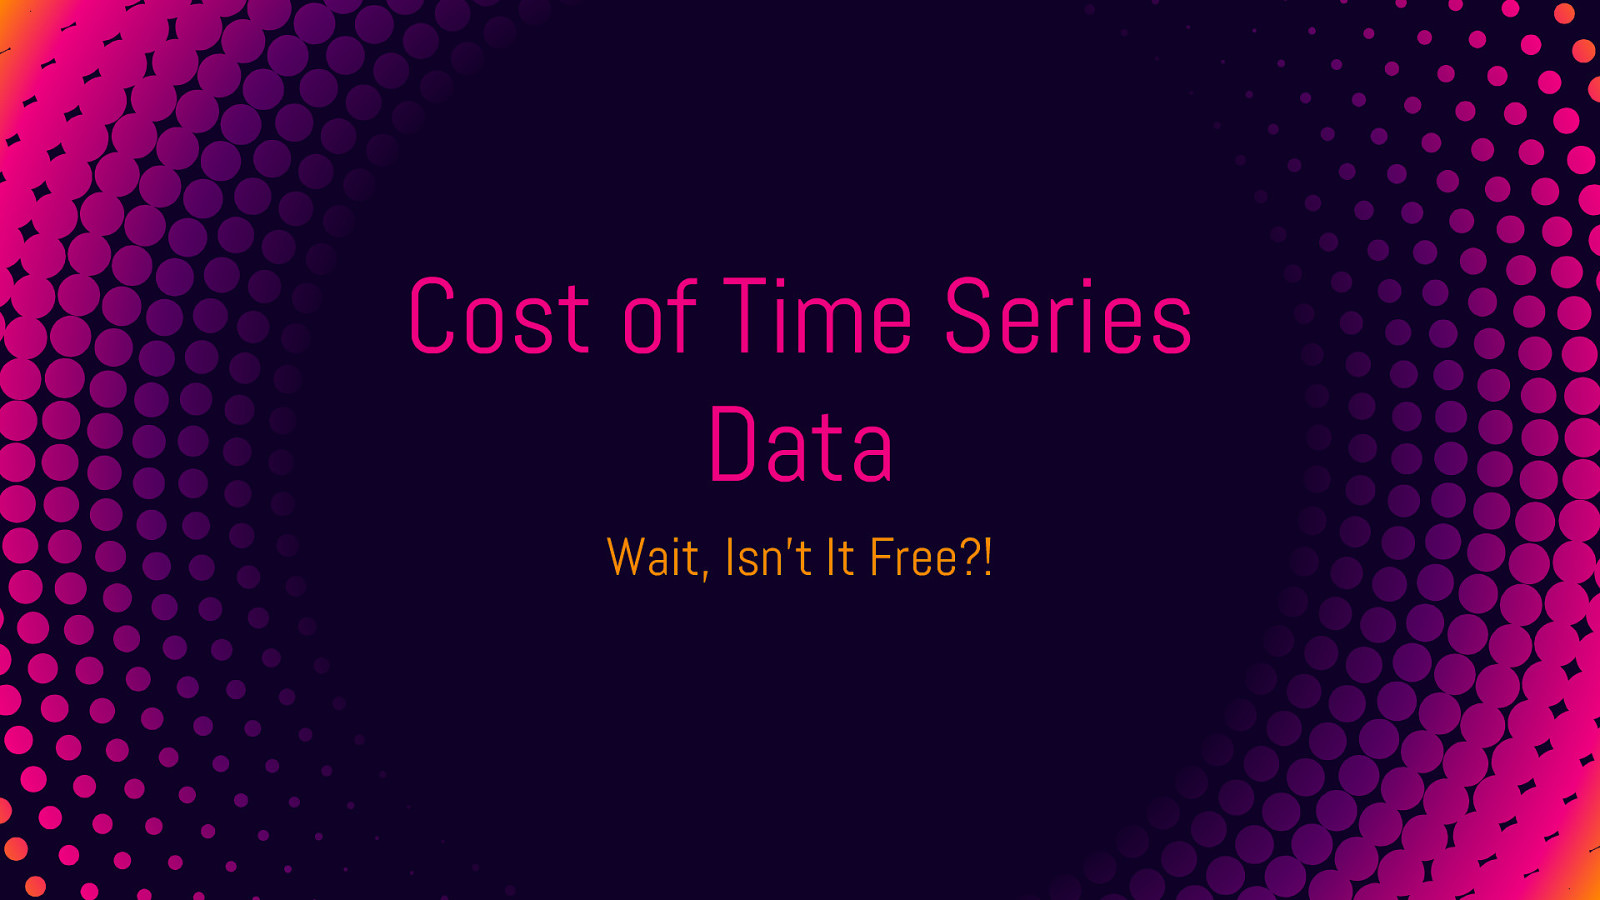
Cost of Time Series Data Wait, Isn’t It Free?!
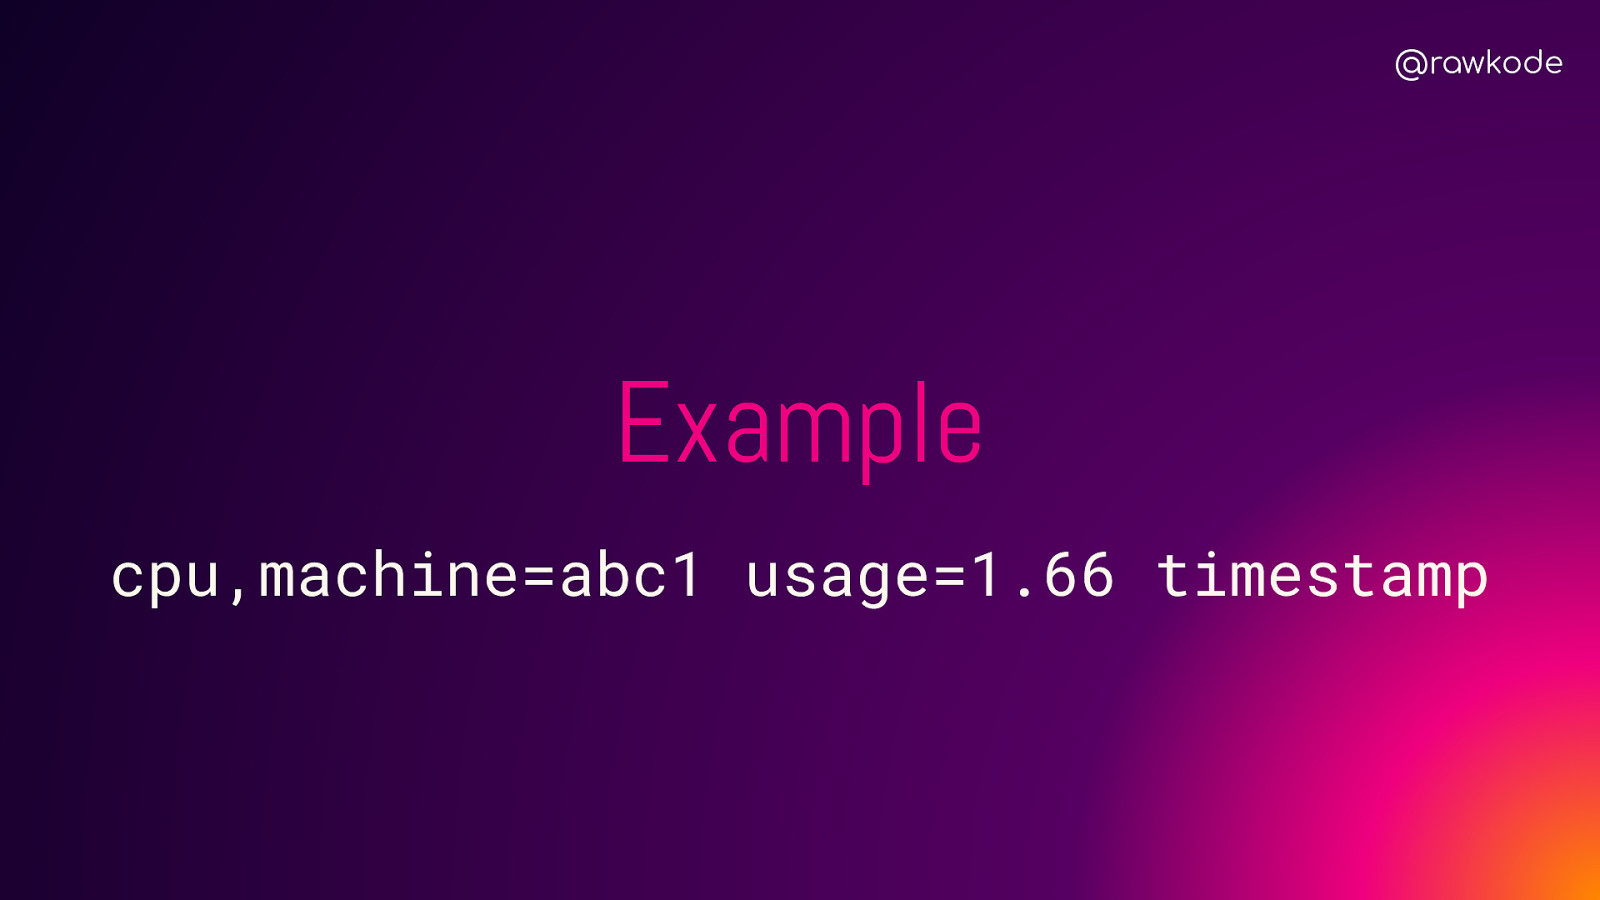
@rawkode Example cpu,machine=abc1 usage=1.66 timestamp

@rawkode Resolution ➔ 1 Measurement ➔ 1 Series ➔ 1s Resolution 86400 Points Per Day

@rawkode Resolution ➔ 1 Measurement ➔ 2 Series ➔ 1s Resolution 172800 Points Per Day

@rawkode Resolution ➔ 5 Measurement ➔ 10 Series ➔ 1s Resolution 4320000 Points Per Day
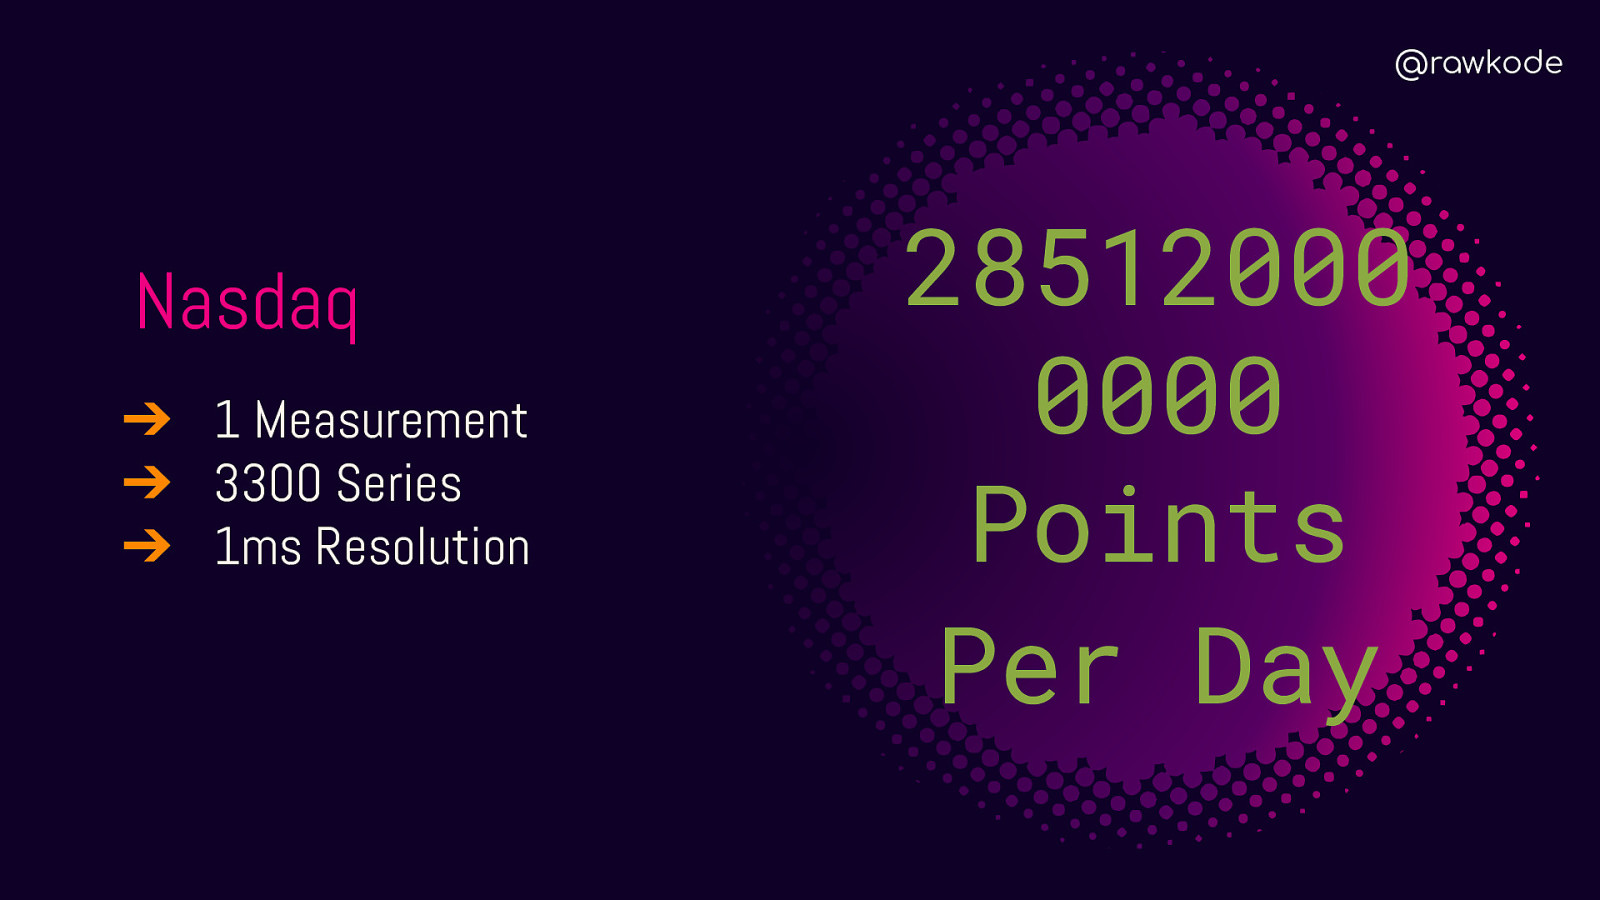
@rawkode Nasdaq ➔ 1 Measurement ➔ 3300 Series ➔ 1ms Resolution 28512000 0000 Points Per Day

@rawkode Nasdaq ➔ 1 Measurement ➔ 3300 Series ➔ 1m Resolution 4752000 Points Per Day

@rawkode Nasdaq ➔ 1 Measurement ➔ 3300 Series ➔ 1h Resolution 79200 Points Per Day

@rawkode Nasdaq ➔ 1 Measurement ➔ 3300 Series ➔ 6h Resolution 13200 Points Per Day
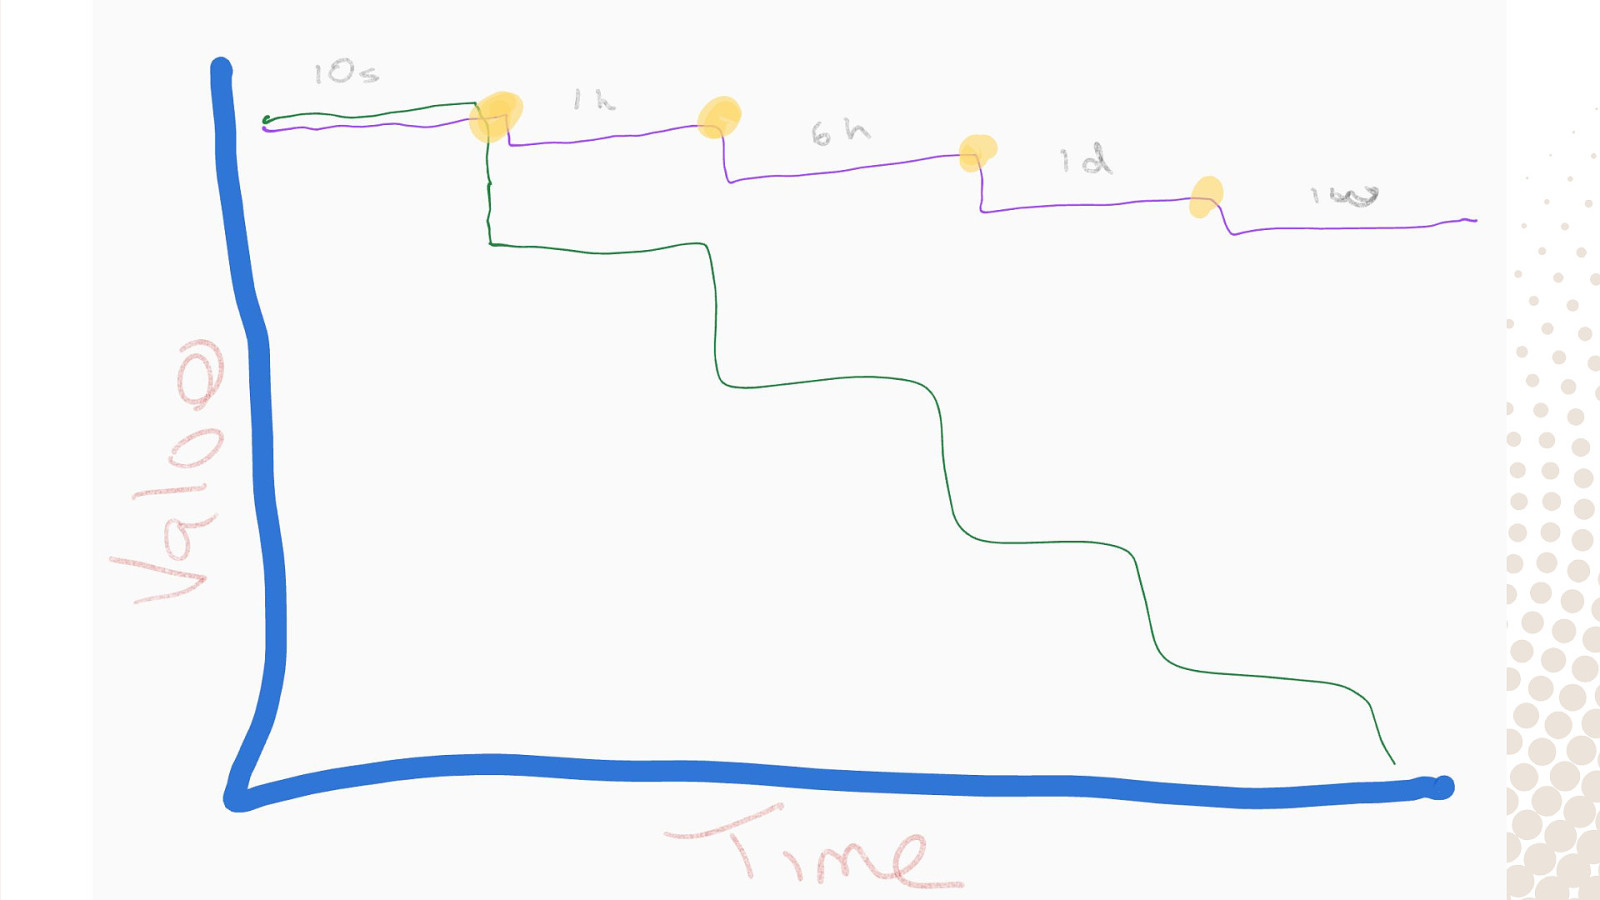
@rawkode Downsampling Lowering the Resolution
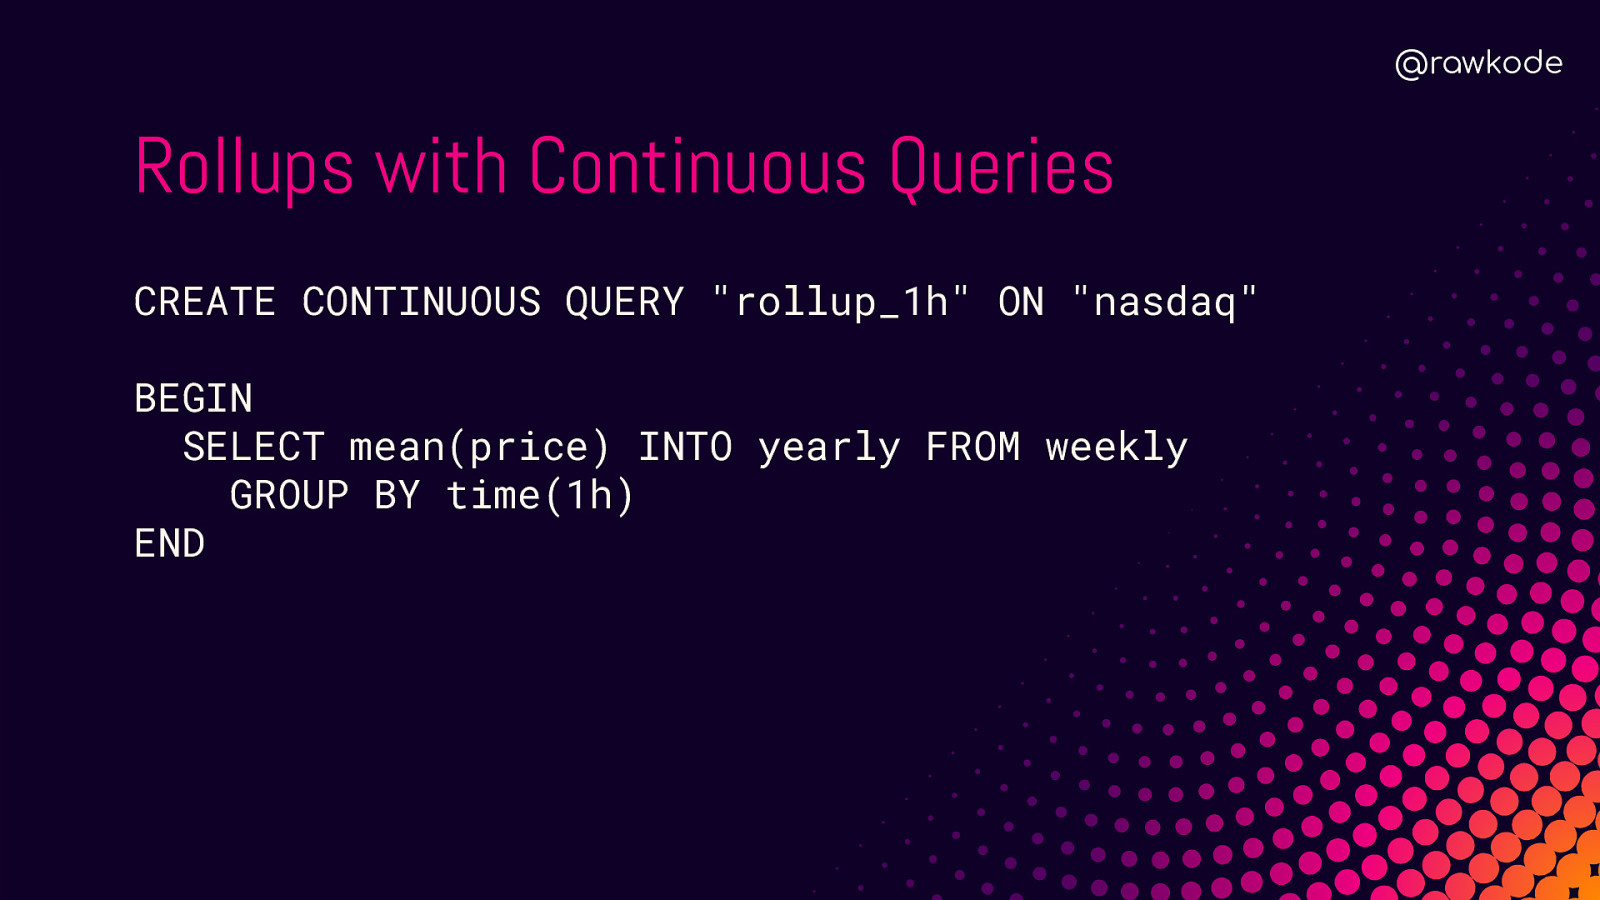
@rawkode Rollups with Continuous Queries CREATE CONTINUOUS QUERY “rollup_1h” ON “nasdaq” BEGIN SELECT mean(price) INTO yearly FROM weekly GROUP BY time(1h) END

@rawkode Events? Outlier / Anomaly Detection InfluxDB Anomaly Detection
Advancing Monitoring with Time Series Taking Small Steps for Giant Leaps
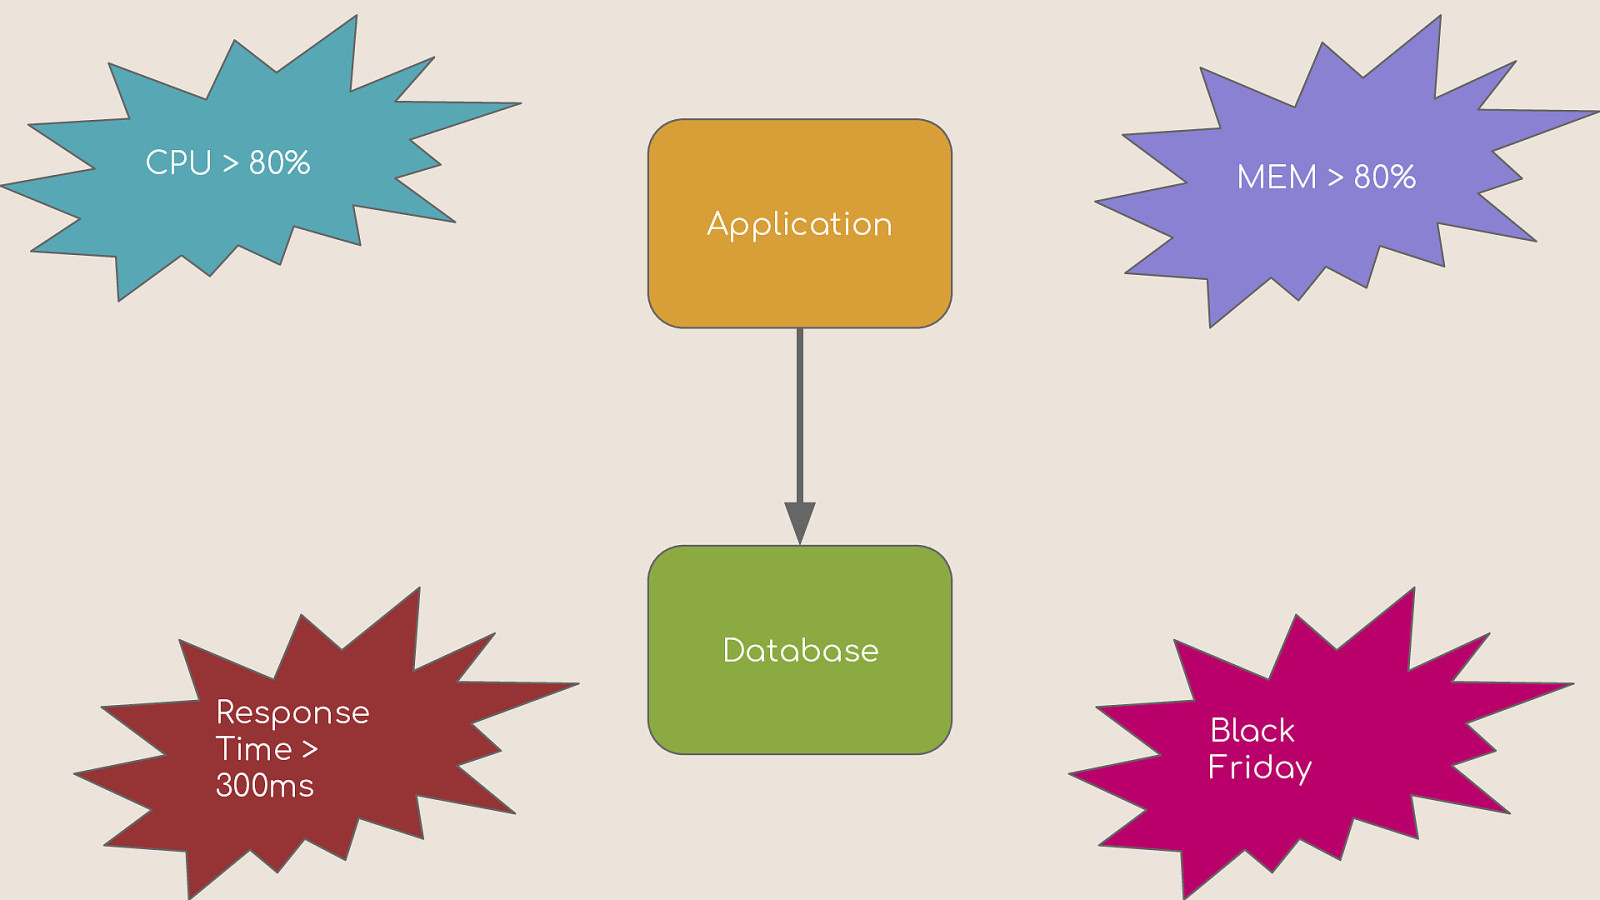
CPU > 80% MEM > 80% Application Database Response Time > 300ms Black Friday
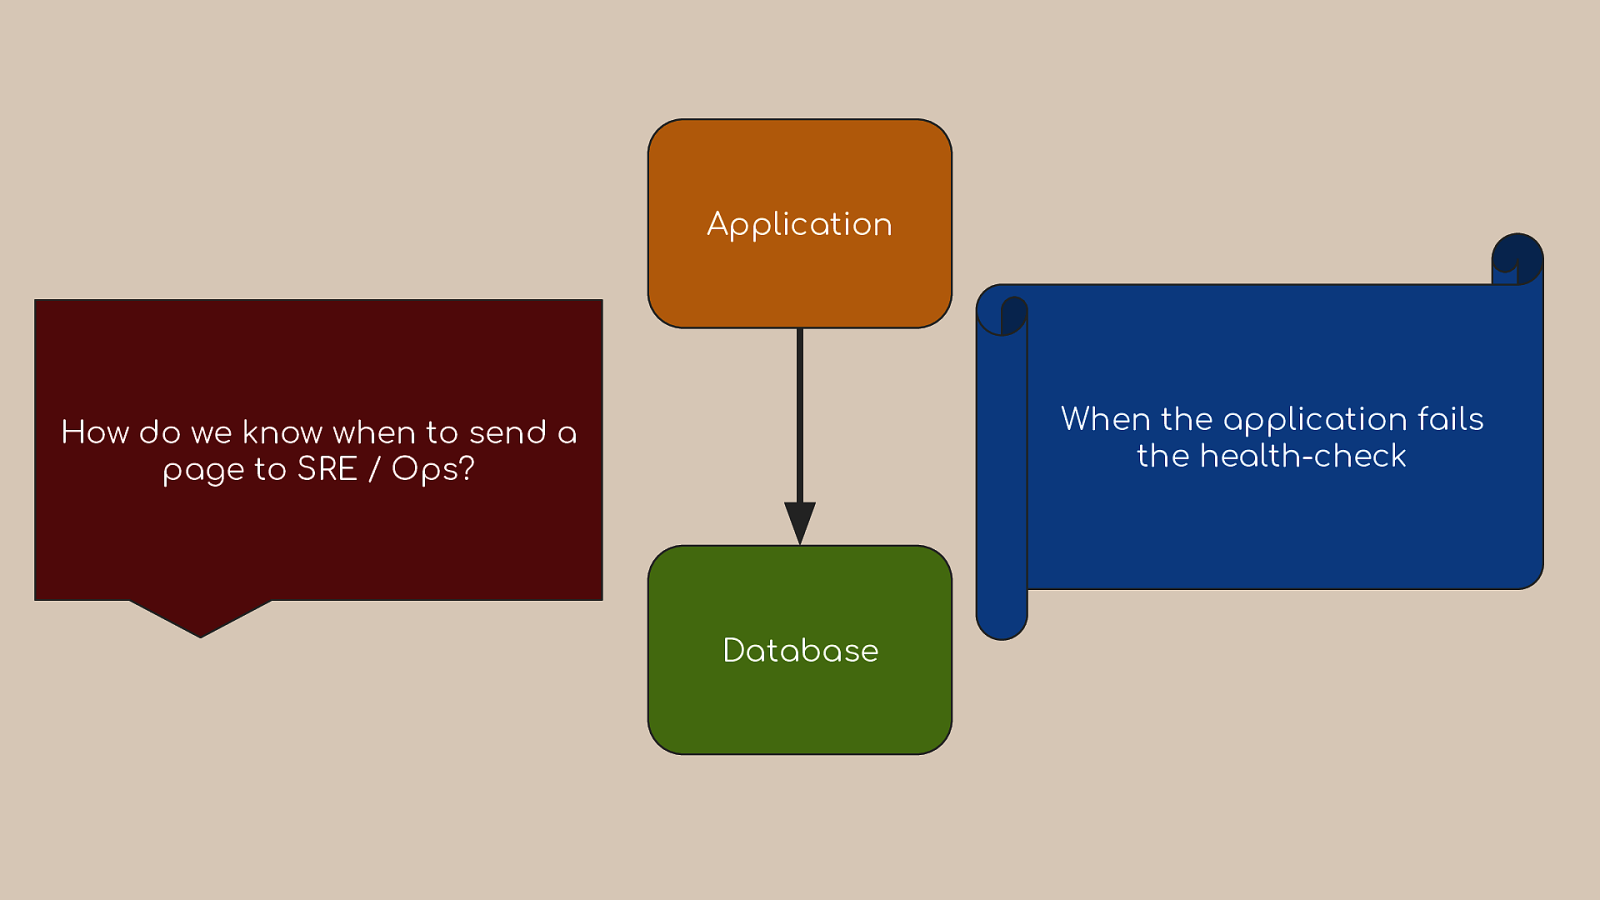
Application When the application fails the health-check How do we know when to send a page to SRE / Ops? Database
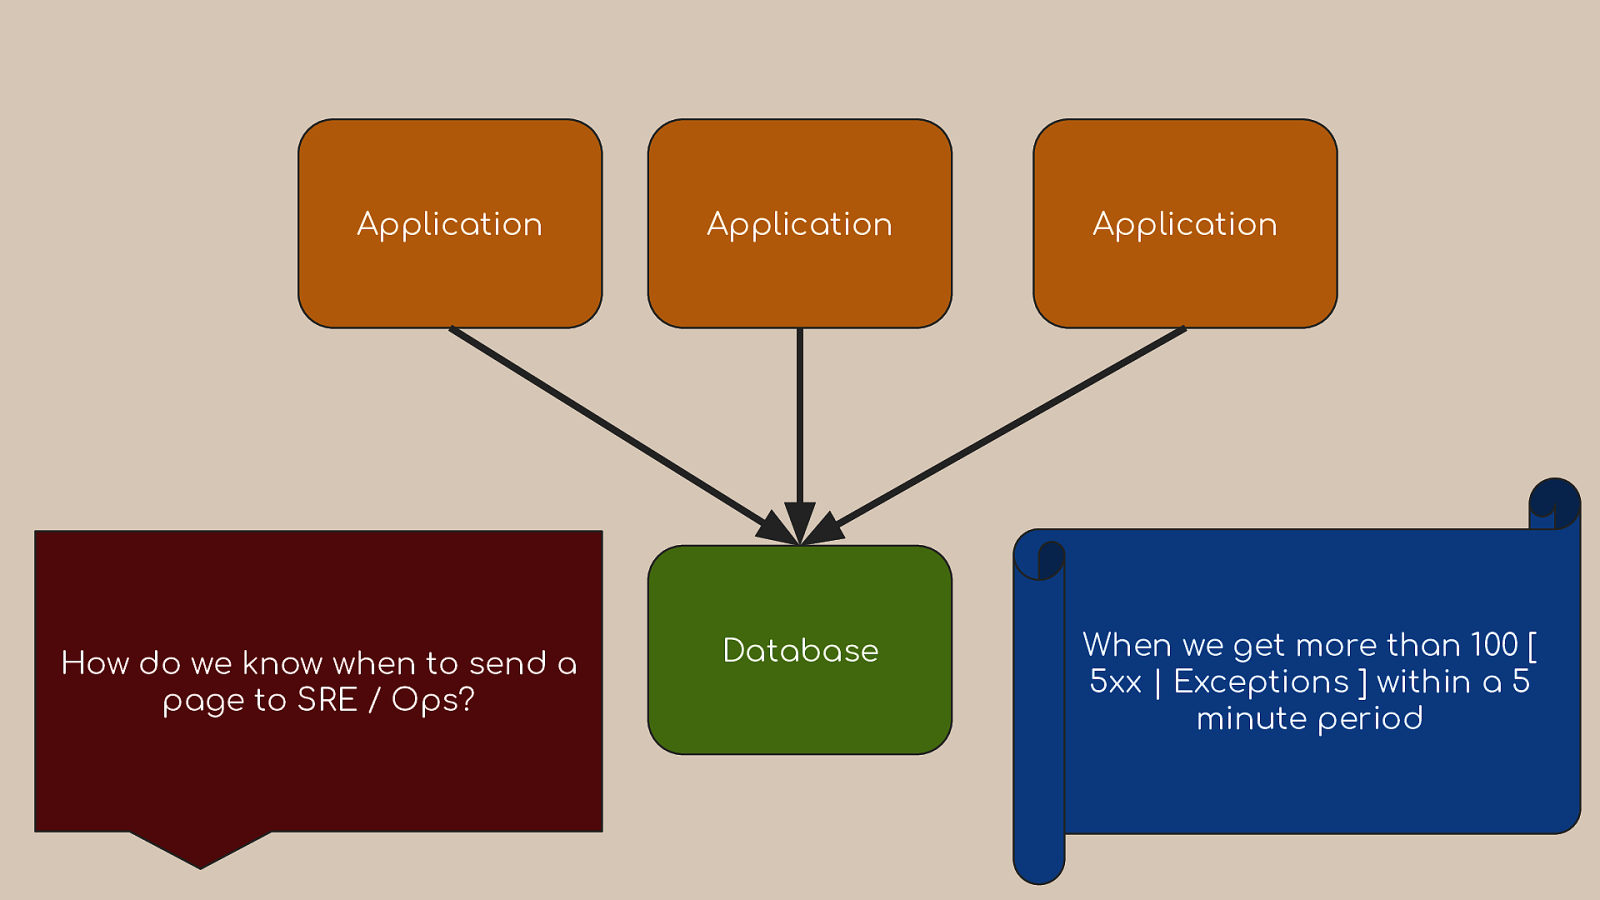
Application How do we know when to send a page to SRE / Ops? Application Database Application When we get more than 100 [ 5xx | Exceptions ] within a 5 minute period
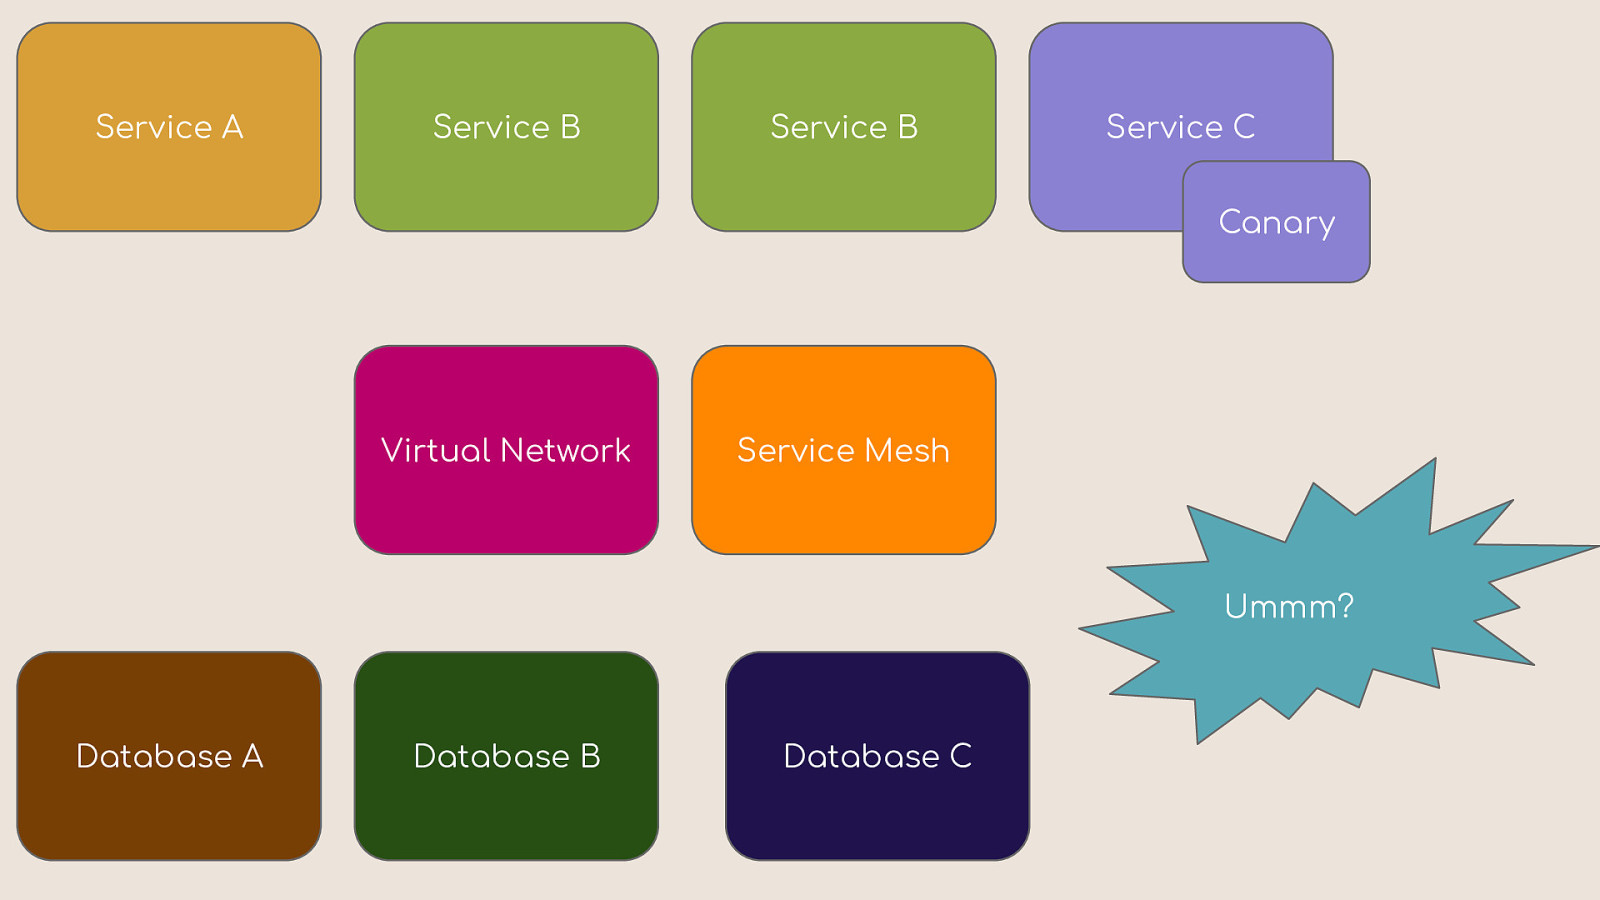
Service A Service B Service B Service C Canary Virtual Network Service Mesh Ummm? Database A Database B Database C
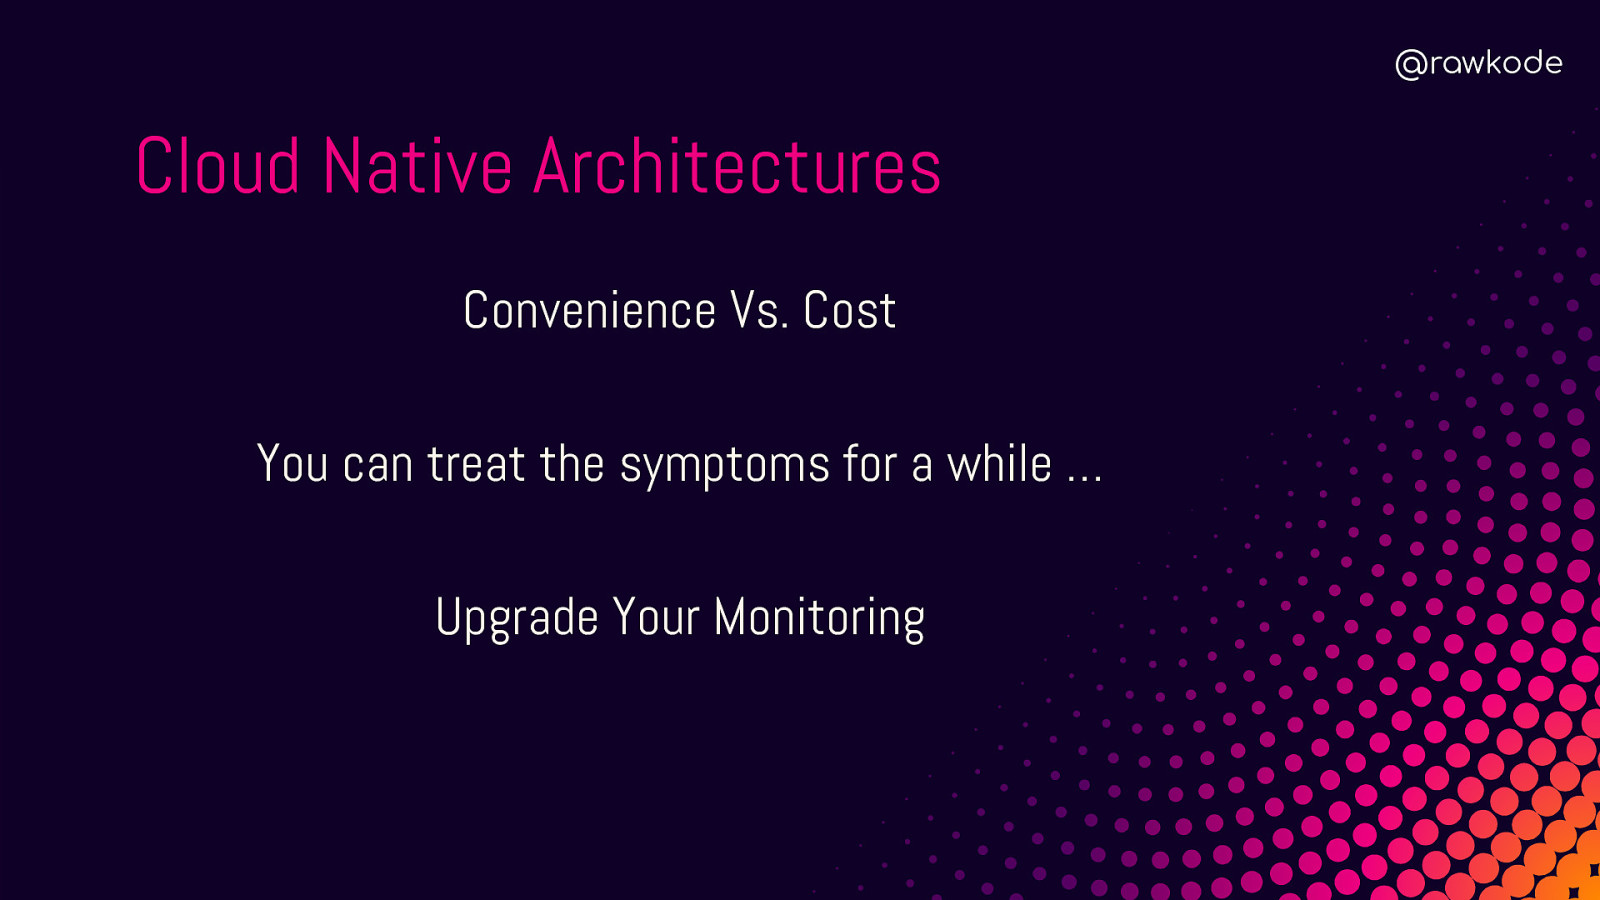
@rawkode Cloud Native Architectures Convenience Vs. Cost You can treat the symptoms for a while … Upgrade Your Monitoring

@rawkode Causality Treating the Disease
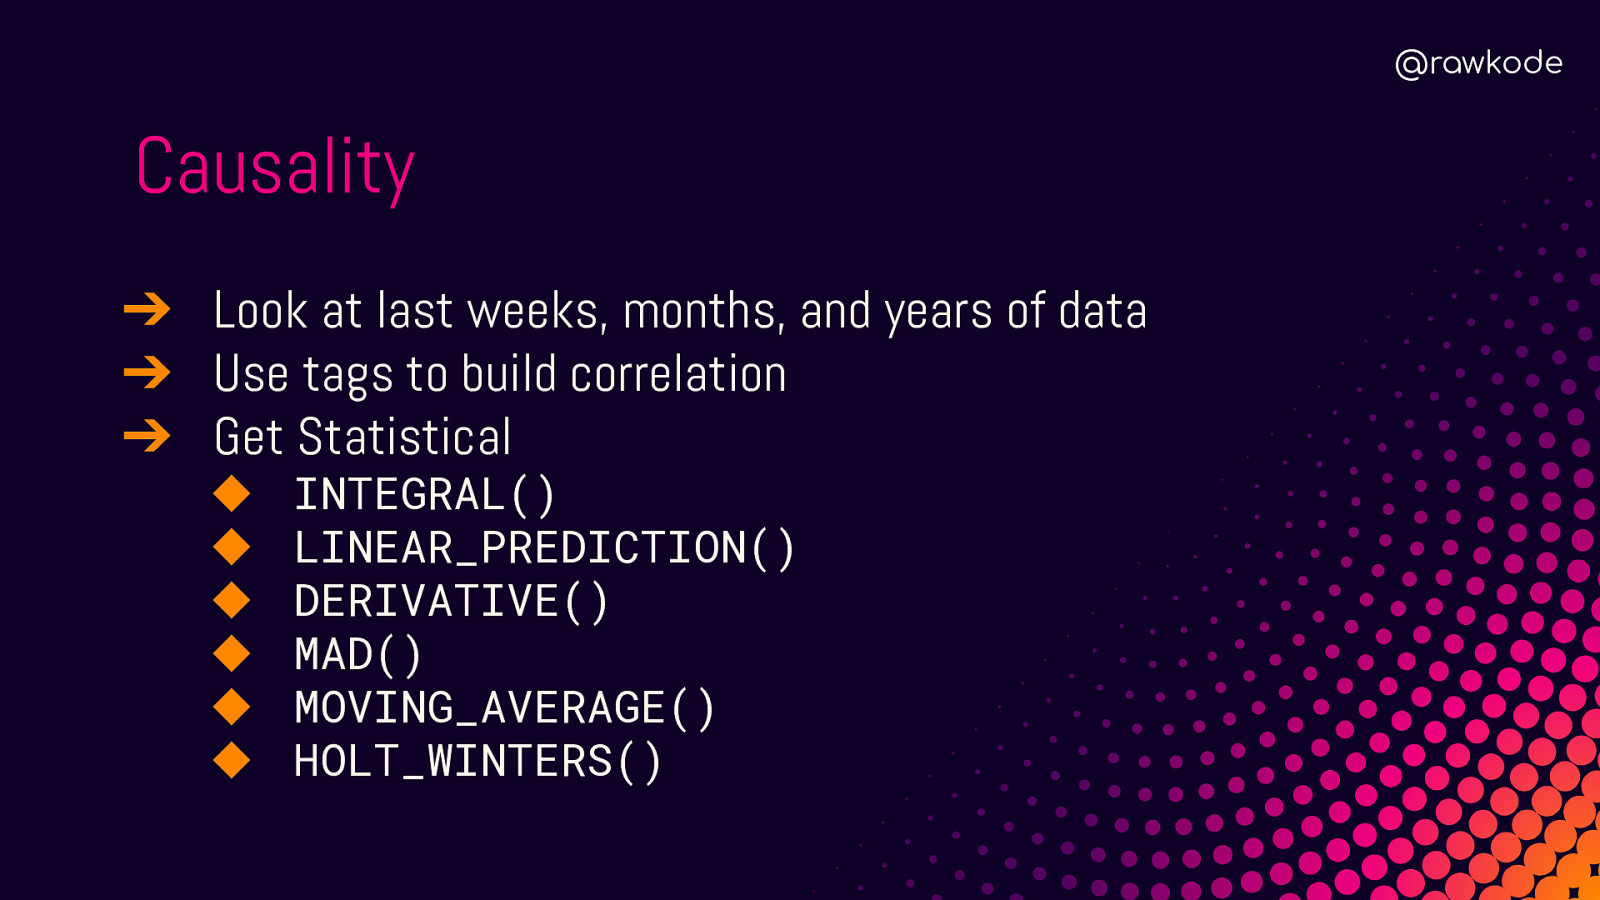
@rawkode Causality ➔ Look at last weeks, months, and years of data ➔ Use tags to build correlation ➔ Get Statistical ◆ ◆ ◆ ◆ ◆ ◆ INTEGRAL() LINEAR_PREDICTION() DERIVATIVE() MAD() MOVING_AVERAGE() HOLT_WINTERS()
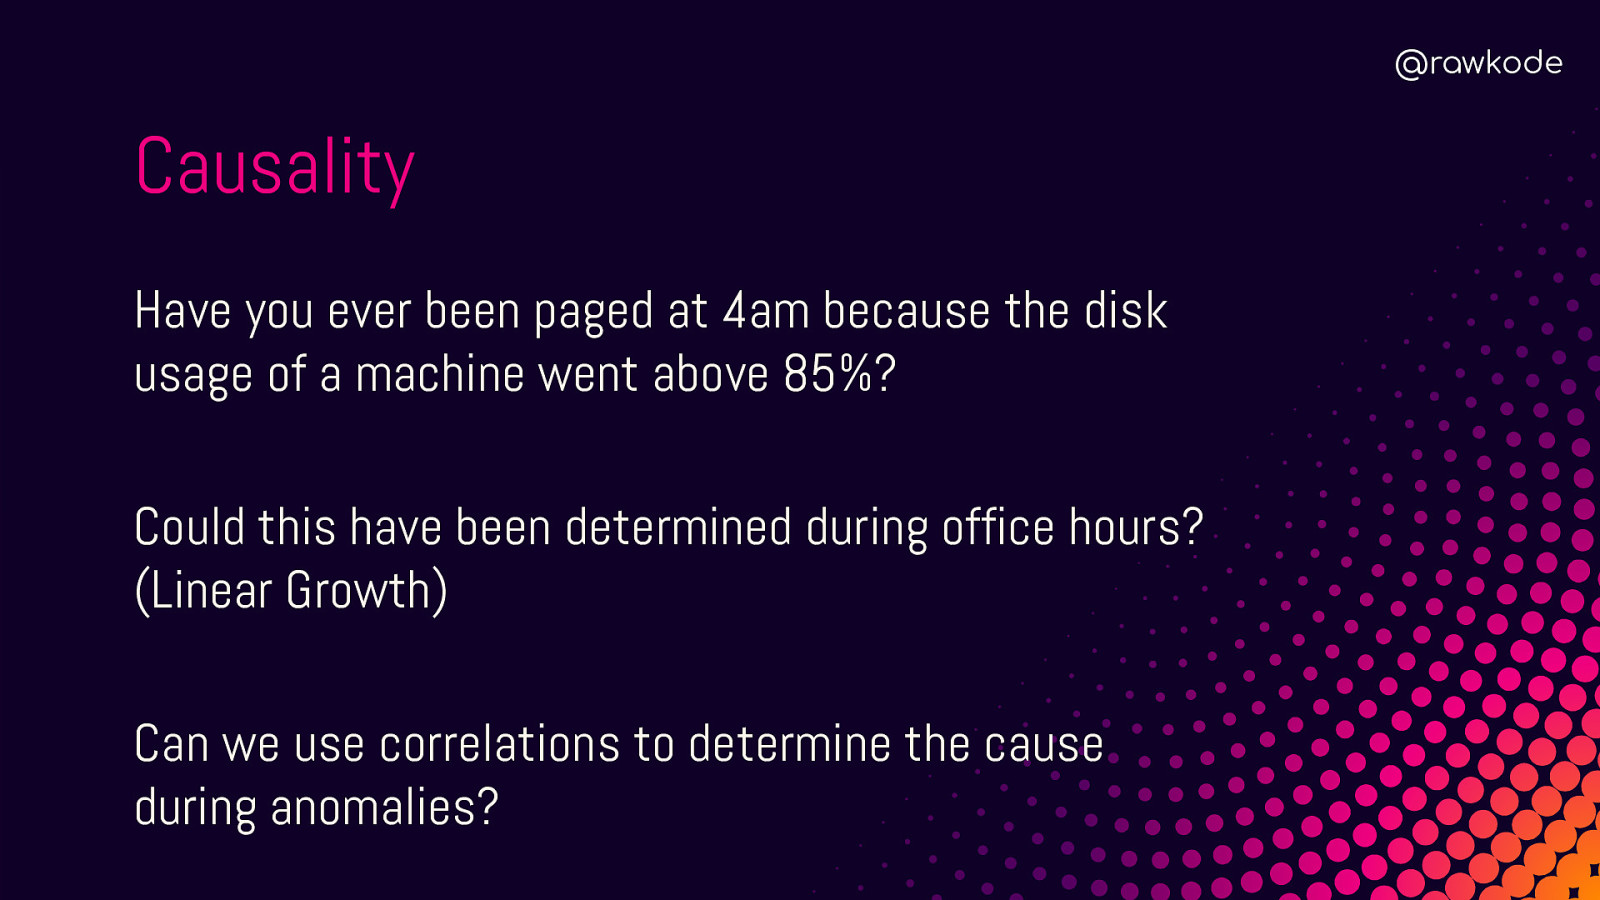
@rawkode Causality Have you ever been paged at 4am because the disk usage of a machine went above 85%? Could this have been determined during office hours? (Linear Growth) Can we use correlations to determine the cause during anomalies?
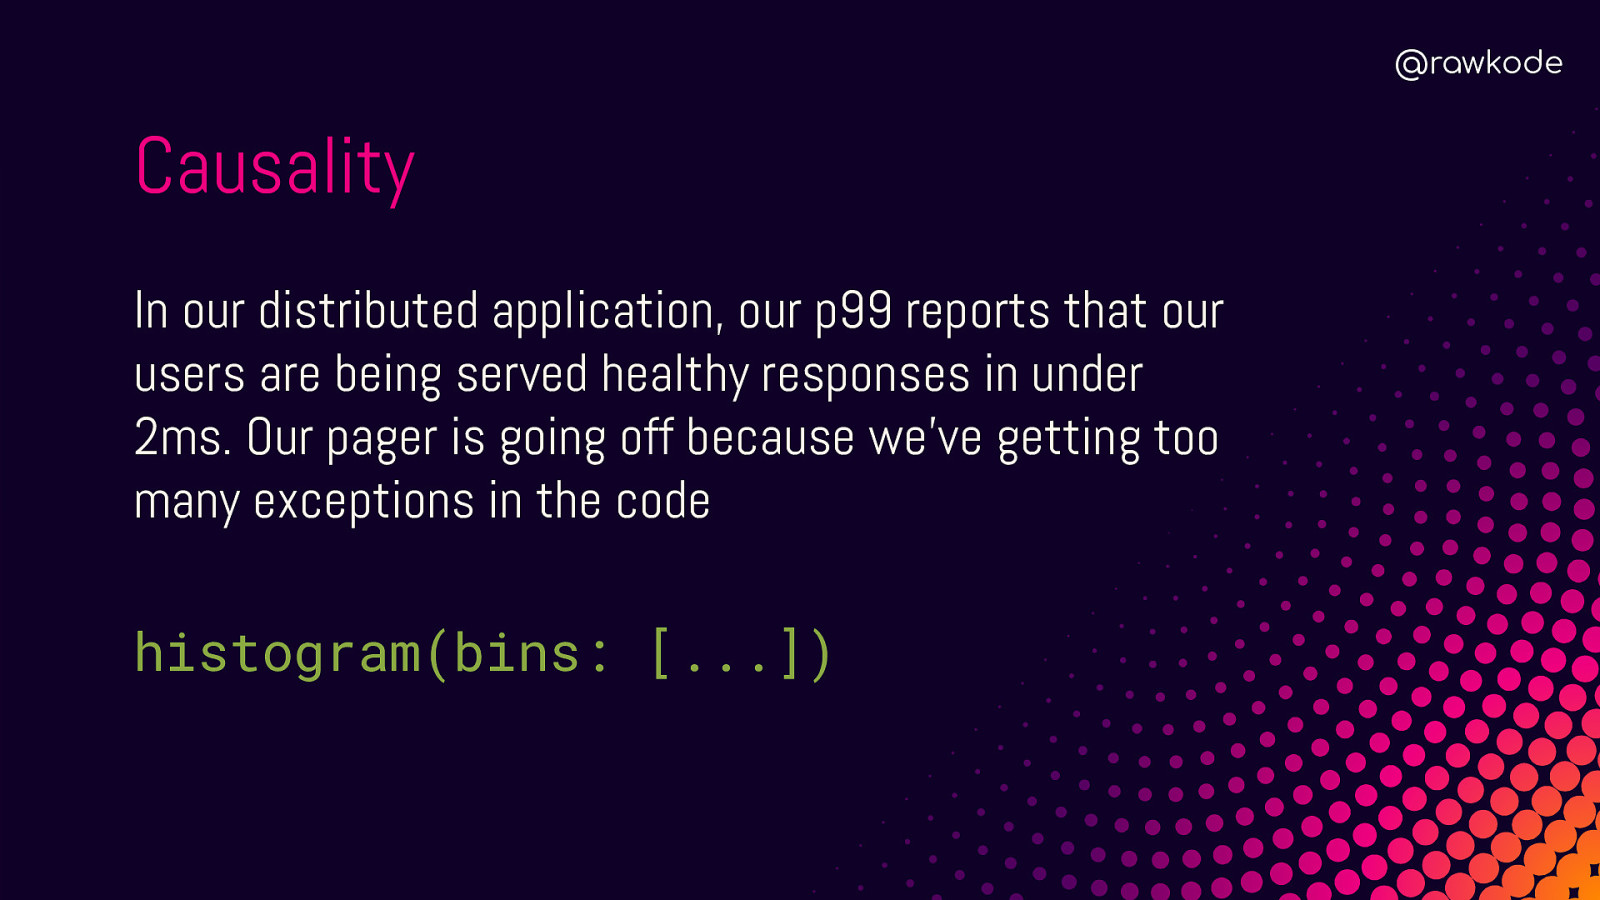
@rawkode Causality In our distributed application, our p99 reports that our users are being served healthy responses in under 2ms. Our pager is going off because we’ve getting too many exceptions in the code histogram(bins: […])
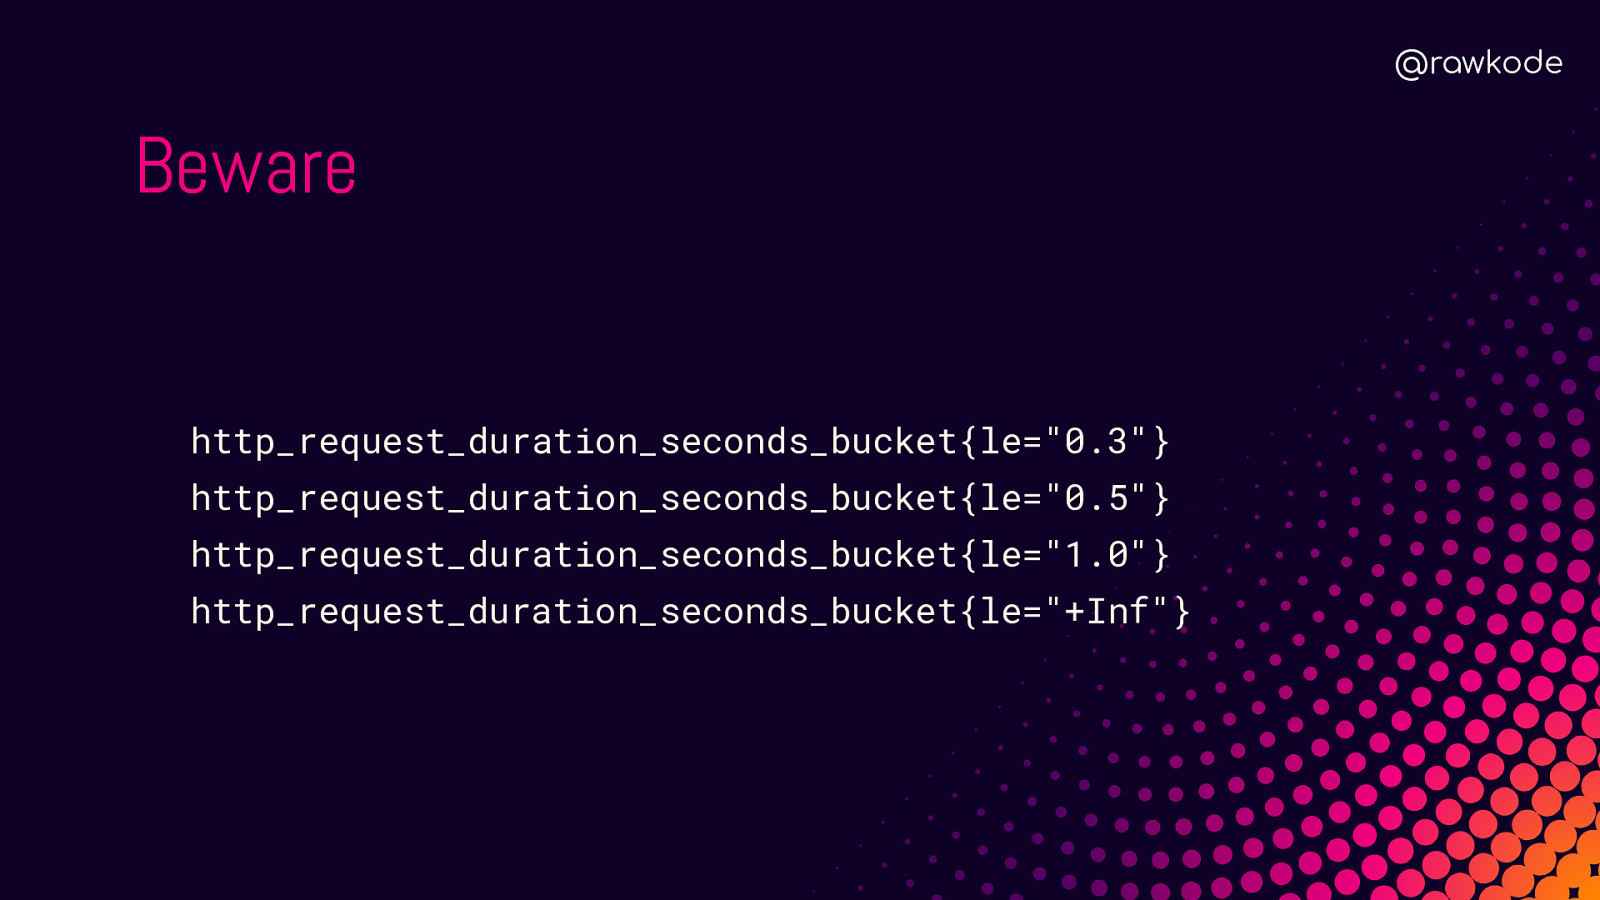
@rawkode Beware http_request_duration_seconds_bucket{le=”0.3”} http_request_duration_seconds_bucket{le=”0.5”} http_request_duration_seconds_bucket{le=”1.0”} http_request_duration_seconds_bucket{le=”+Inf”}
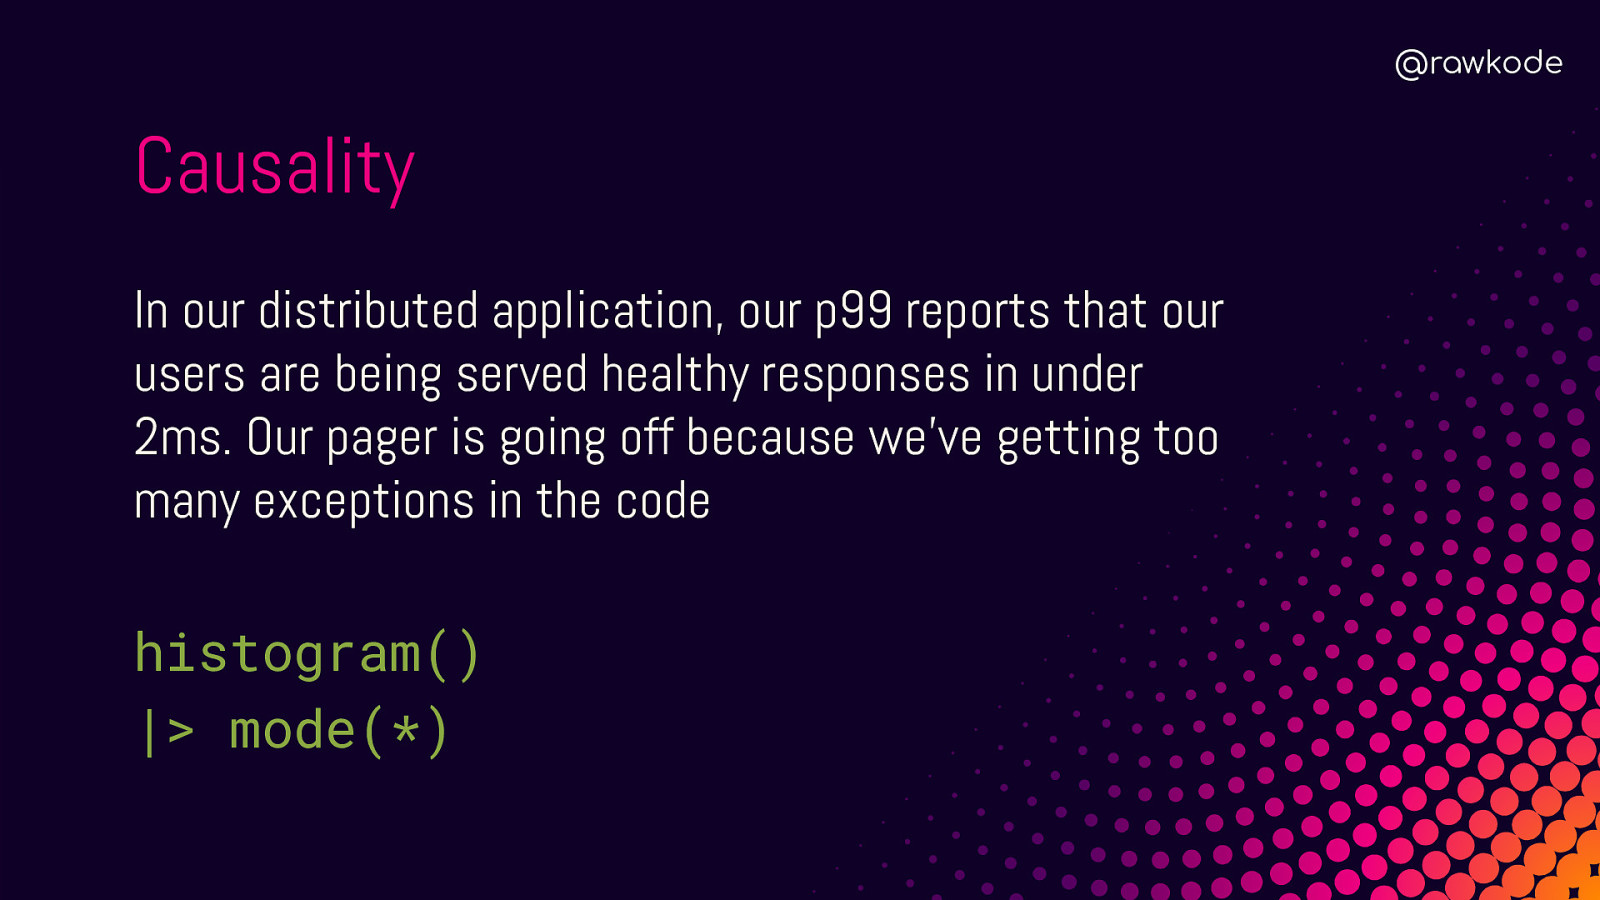
@rawkode Causality In our distributed application, our p99 reports that our users are being served healthy responses in under 2ms. Our pager is going off because we’ve getting too many exceptions in the code histogram() |> mode(*)
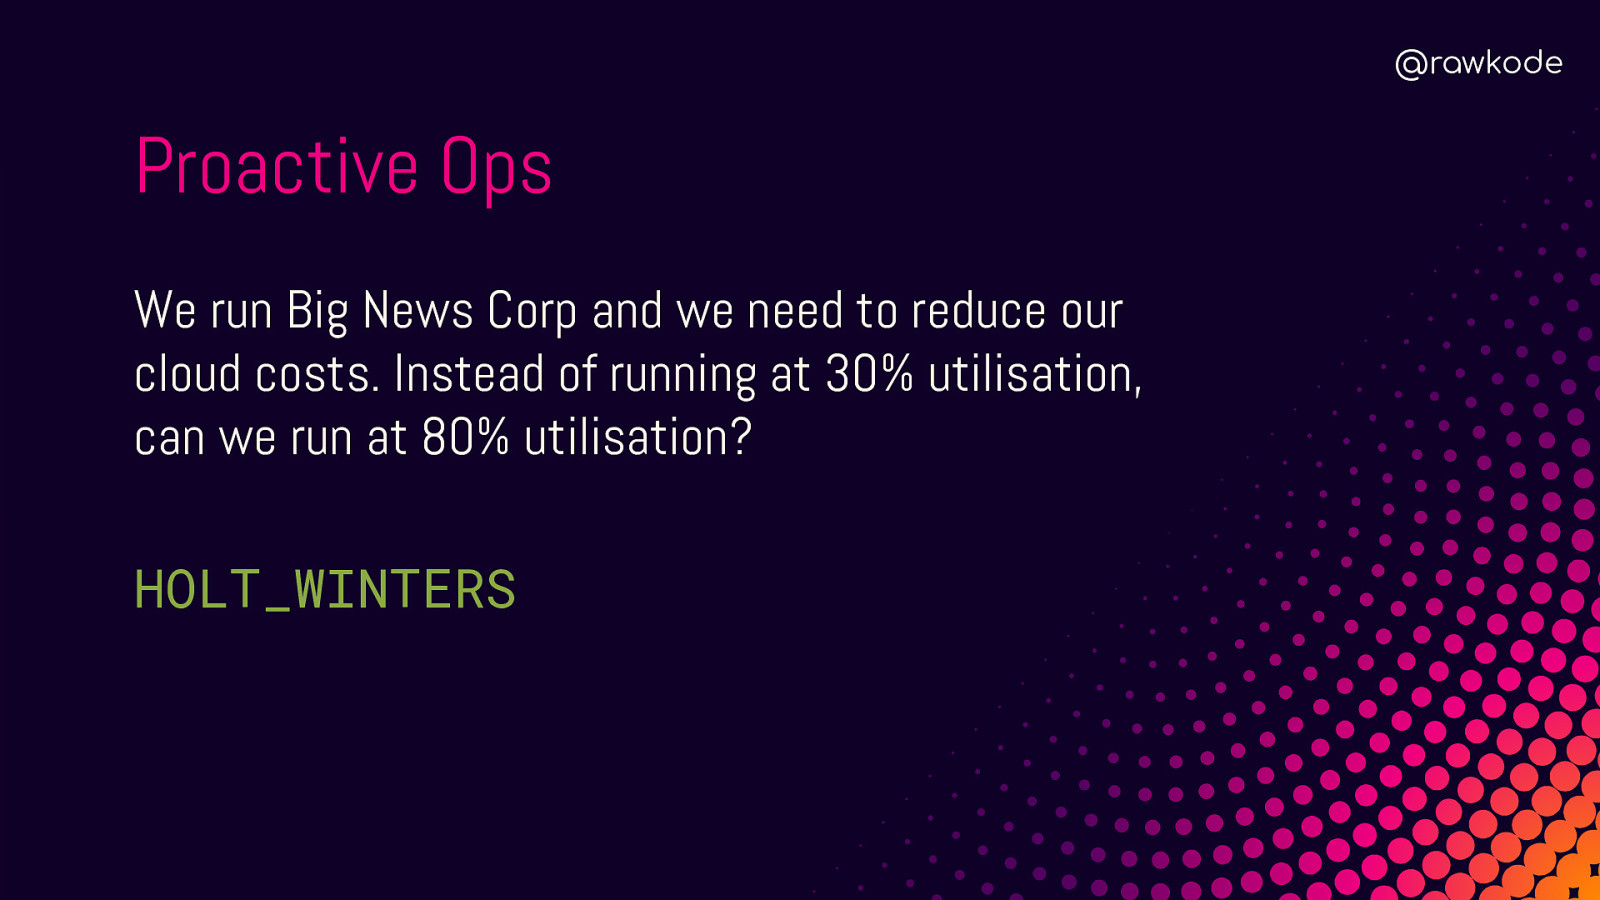
@rawkode Proactive Ops We run Big News Corp and we need to reduce our cloud costs. Instead of running at 30% utilisation, can we run at 80% utilisation? HOLT_WINTERS

@rawkode Build Automation Through Causality, Historical Data, Prediction, and ML
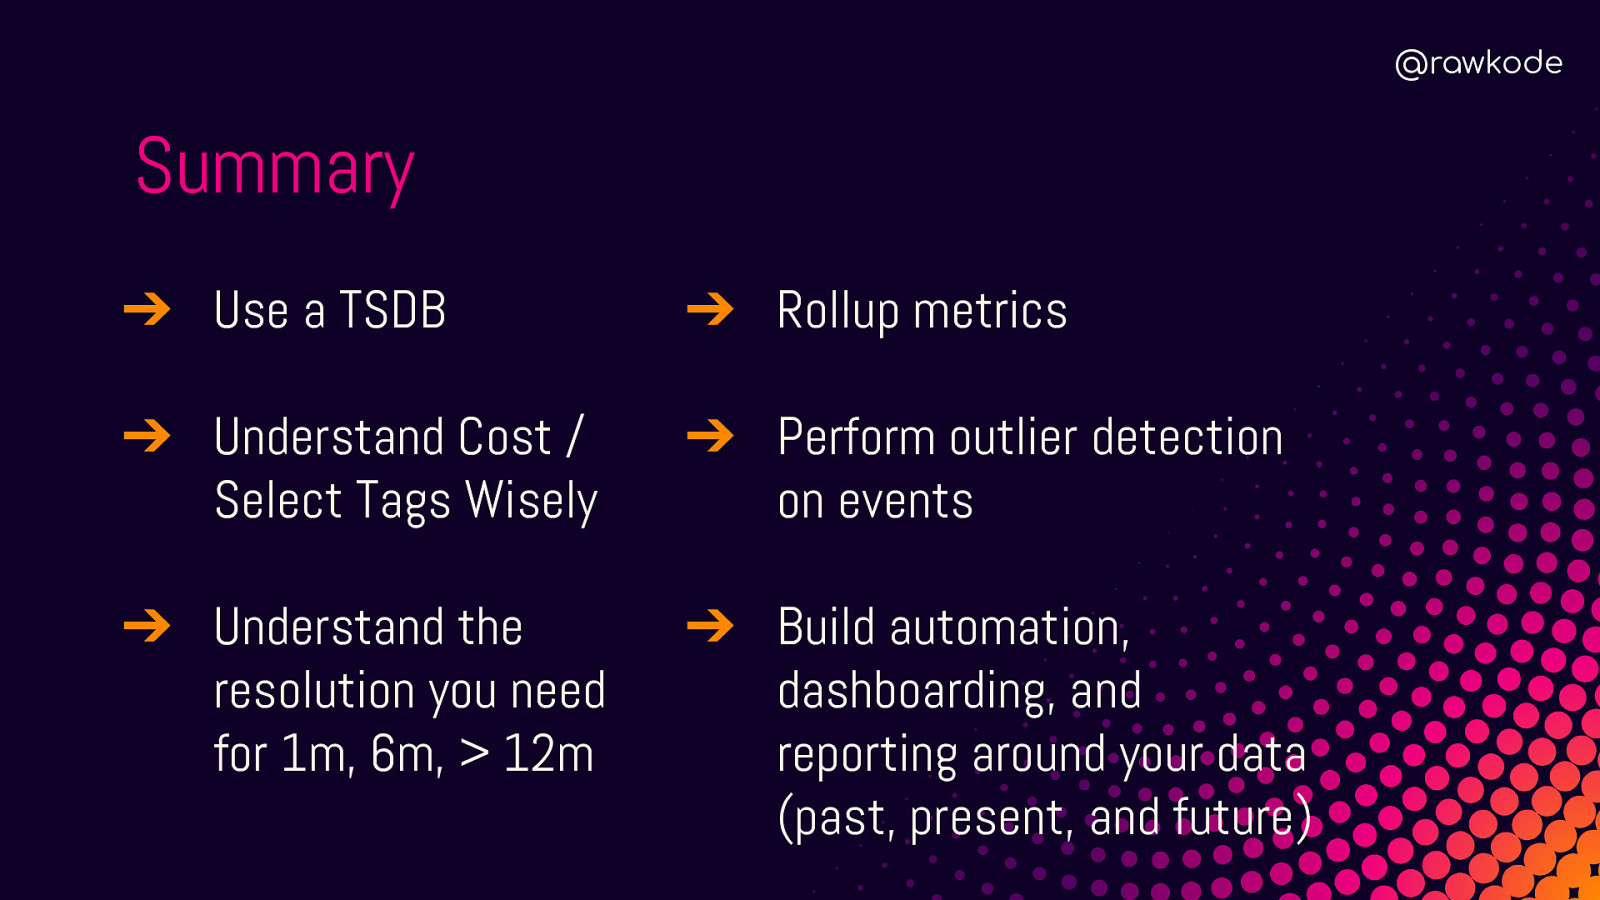
@rawkode Summary ➔ Use a TSDB ➔ Rollup metrics ➔ Understand Cost / Select Tags Wisely ➔ Perform outlier detection on events ➔ Understand the resolution you need for 1m, 6m, > 12m ➔ Build automation, dashboarding, and reporting around your data (past, present, and future)
@rawkode Cheers! David McKay @rawkode Developer Advocate @InfluxDB | #InfluxDB That’s All Folks!