Getting technical with maps Shane Hudson JS Summit 2016 [timer start next slide]

A presentation at JavaScript Summit 2016 in February 2016 in by Shane Hudson
Getting technical with maps Shane Hudson JS Summit 2016 [timer start next slide]

Getting technical with maps Shane Hudson JS Summit 2016 This title is slightly misleading, while I was working on the slides I realised that hardly anyone really needs to make complicated 3D maps and if they do then they can probably work it out themselves. It is also not too fun to look at code on slides without going into massive detail, and the projects I work on tend to be far too big to go into detail. So instead I want to take a look at how to approach projects, through the viewpoint of some maps that I’ve worked on.
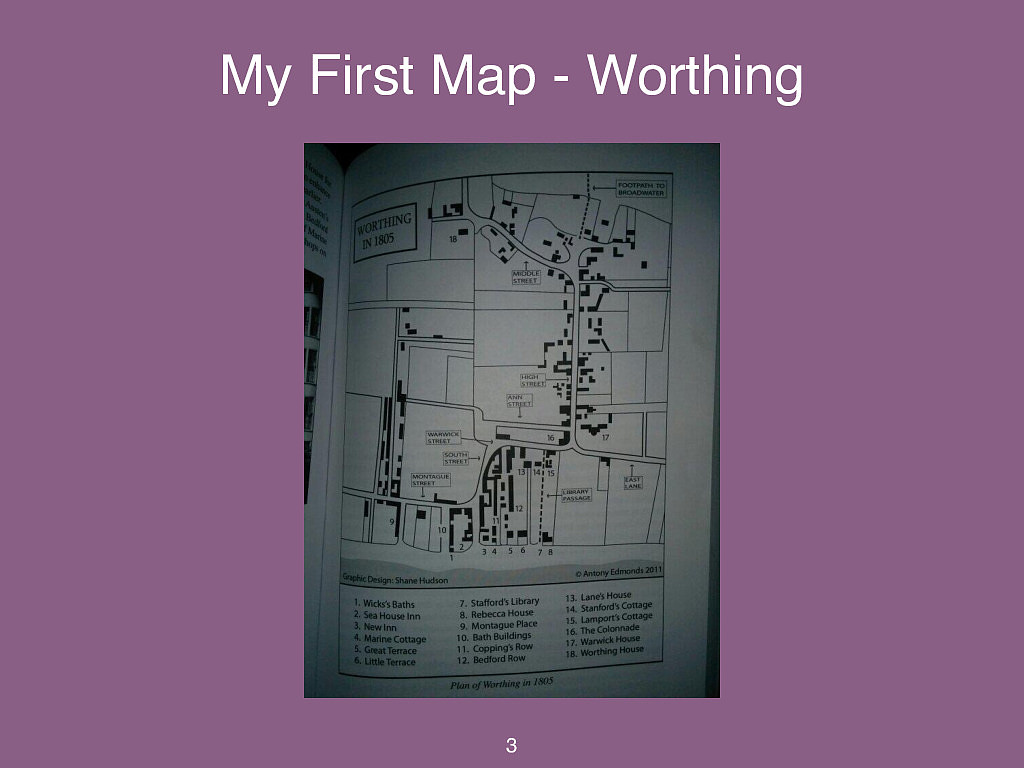
� 3 My First Map - Worthing The first map I ever made was for a book by the Jane Austen society, about her time in Worthing. It was also one of the first books my name was in so I was very proud of it. Antony Edmonds approached my college asking for a student that could help him modify an existing map from nearly the same year. We scanned it in and the task was to both recreate it as well as modify it show the correct buildings and roads for that year. We read history books and old newspapers to see which roads would have been there in 1805.
Reif Larsen, The Selected Works of T.S. Spivet “ A map does not just chart, it unlocks and formulates meaning; it forms bridges between here and there, between disparate ideas that we did not know were previously connected. ” � 4 This is one of my favourite quotes of all time, as it takes a very well understood concept of a map and quickly explains what makes maps so important. Context.
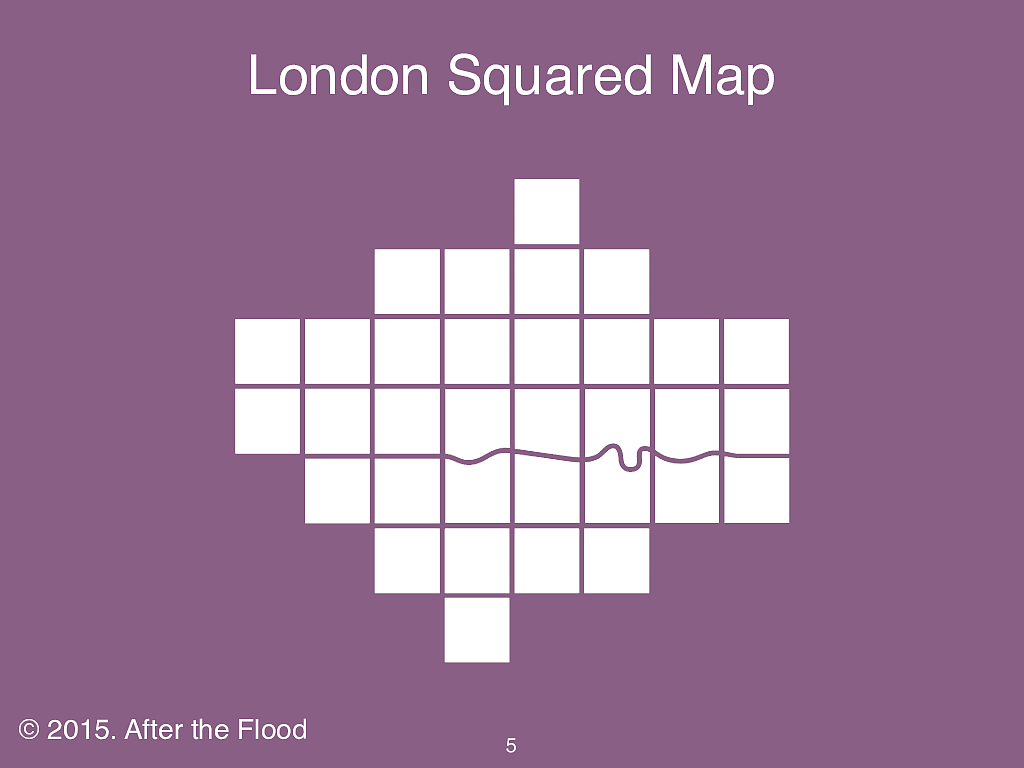
London Squared Map © 2015. After the Flood � 5 I’ve spoken in the past about how important context is to providing the ideal experience with maps and data visualisation in general.
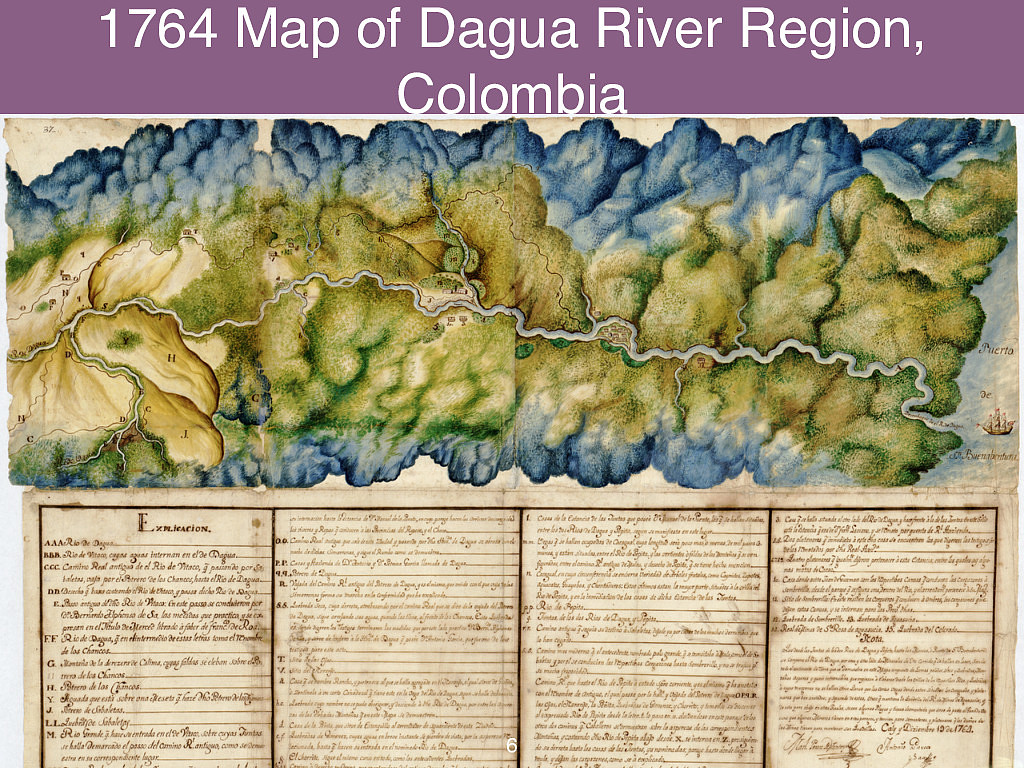
1764 Map of Dagua River Region, Colombia � 6 I’ve also spoken about how fascinating they are, looking at historical maps to show just how creative and beautiful maps can be. Today I would like to take a different route, by looking at some of the challenges I’ve had in my own projects and just generally how to tackle the interesting projects that you might usually avoid.
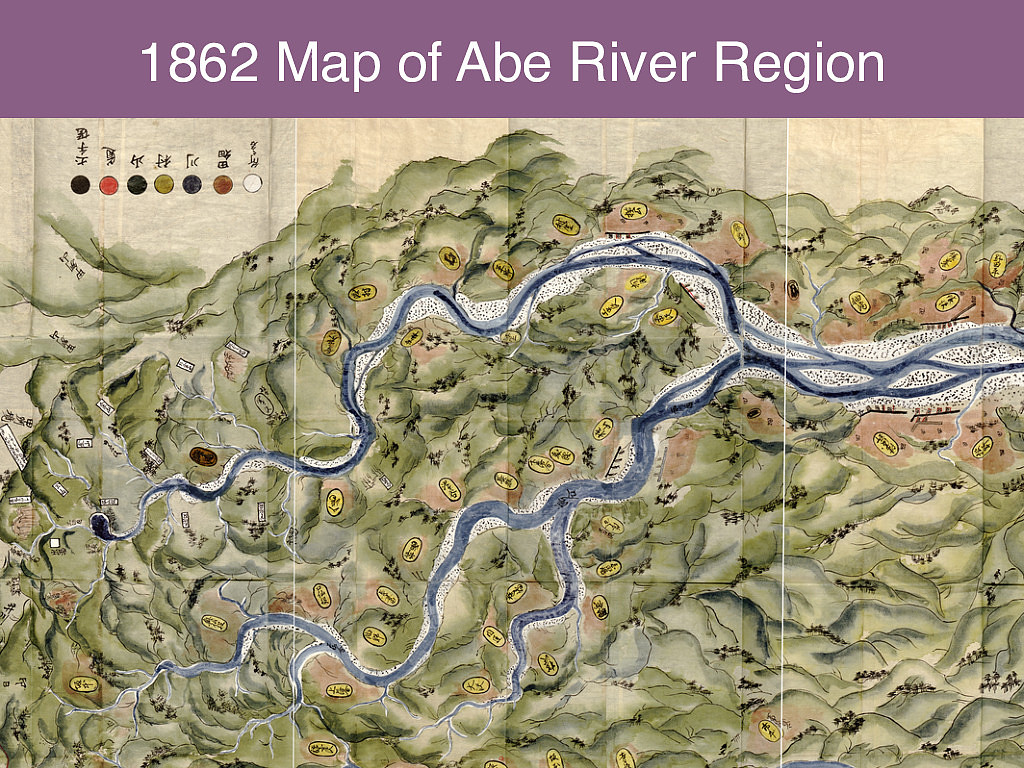
� 7 1862 Map of Abe River Region We will be looking at a 3D project I’ve worked on, but I find it fascinating how incredible these two maps look. They are both 2D but have such details in the hills that it feels 3D, we get a sense of elevation.

� 8 “But I don’t make maps!” I know half of you are wondering what any of this has to do with you. You use maps to find the nearest bar. You make websites not maps. When you do need a map, you just go to Google Maps and it is all done. And that is fine, but there are times when you need tools that you have more control over.
� 9 You can sell the best to anyone, and the worst just to those who deserve better. I have a client who rents rooms that are very cheap and other rooms that royal families around the world have stayed at. They asked how they can target both demographics. I replied by saying if royalty is going to like it, then if a normal person can afford it then they will absolutely love it. I understand that isn’t always true and things have to be targeted carefully but in general, it is better to go higher quality.
� 10 The more we consider, the better we will be The same goes for web development. The more we consider, the better we will be. It is quite simple. The concept of a map is incredible, it is both powerful in the way the quote explains and also technically brilliant. When you search for a location, it takes the entire world into consideration. When you change the colour palette, the entire world changes colour. It may not be important to you, but thinking on a larger scale and how to approach interesting projects will help you even if you just build 3 page static sites. Because it gets you thinking about the big picture.
✓ Context and the beauty of maps • Real life clients • Resources • Tackling crazy projects • Takeaways Agenda � 11
Real Life Clients � 12
• Prototype • Data shows various chemicals at various elevations under ground, in multiple locations • Use spin plots to visualise the data on a 3D map The Brief � 13
• Cylinder for each data point • Extruded edges • Colour scale What is a Spin Plot? � 14 I had no idea, and google wasn’t much help. So I had to ask my client and they said it is essentially a 2D graph spun around a point. The extruded edges and colour scale both represent the same data. when it is fat it is darker when it is thin it is lighter. Thin is 0 fat is max.
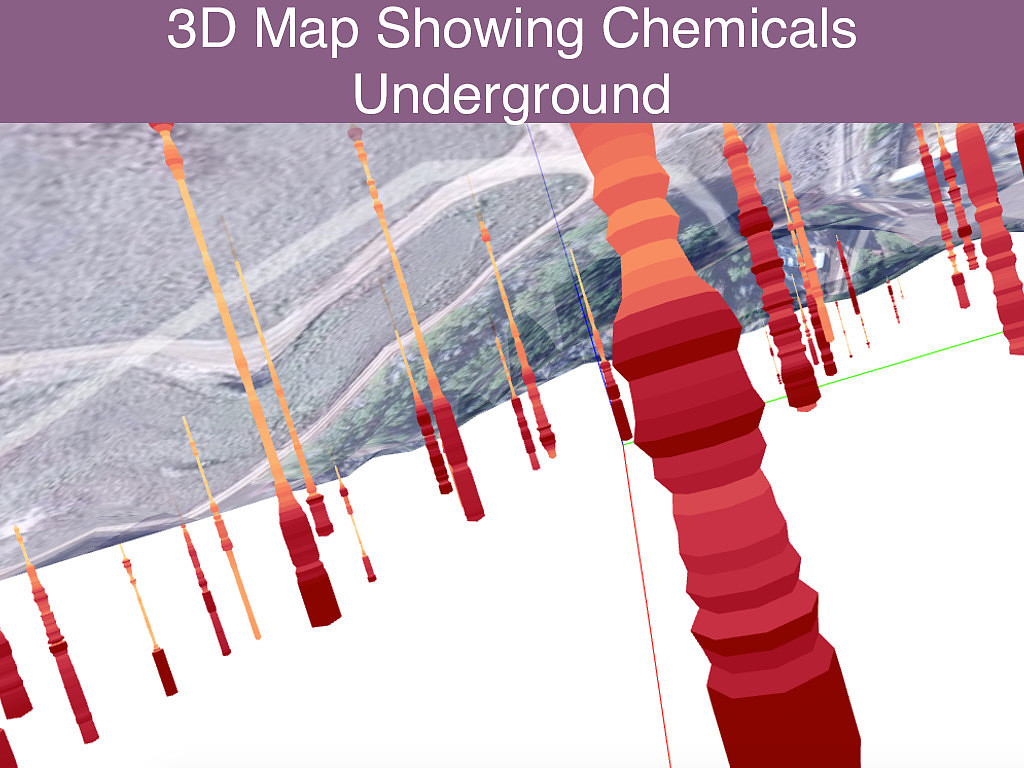
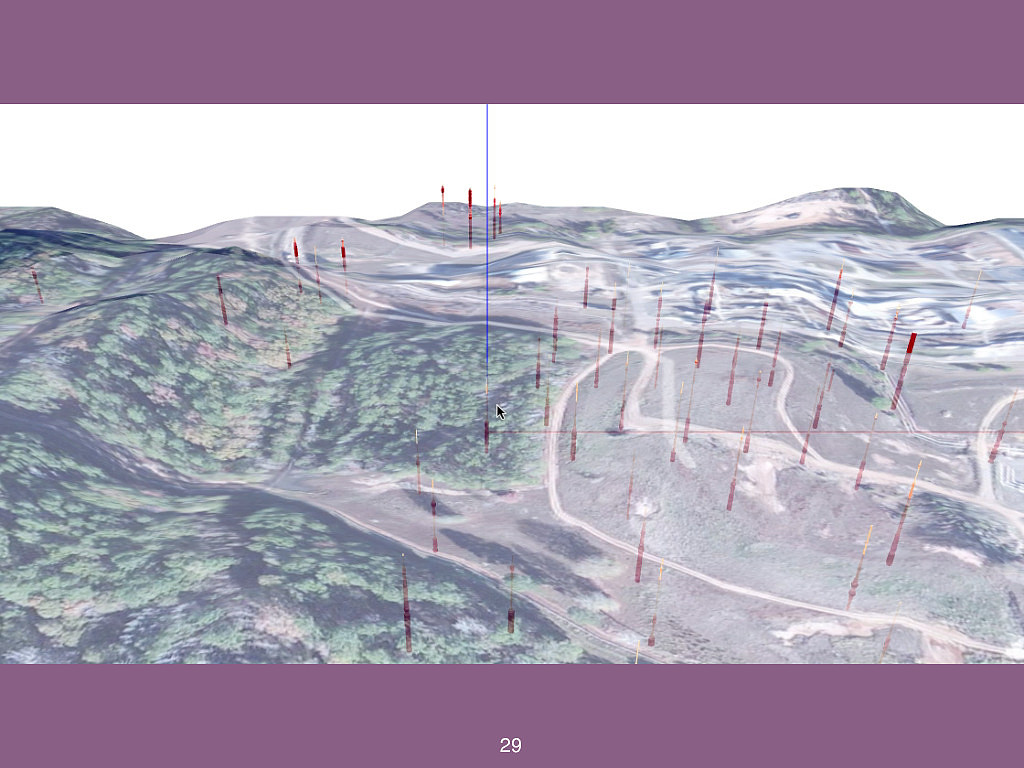
3D Map Showing Chemicals Underground � 15
� 16 Where do we start making a 3D geospatial data visualisation? With the data.
�
17
"coords":{
“lng": -93.31106031513241,
“lat": 33.25493416782391
},
“elevation": 200,
“name": "borehole0",
"data":[
{
“Depth": 0,
"SampleID": “FE33-22-s“,
"SiteName": “afakeplace",
"StationName": "E323",
"Date": "7/3/14 0:10",
"FillColor": "#bebada",
"Color": "#40c5f4",
“Temp": 258.38934245
"Basis": "Wet",
"Matrix": "Soil",
"Compound": "Fluoromethane",
"Dilution": "1",
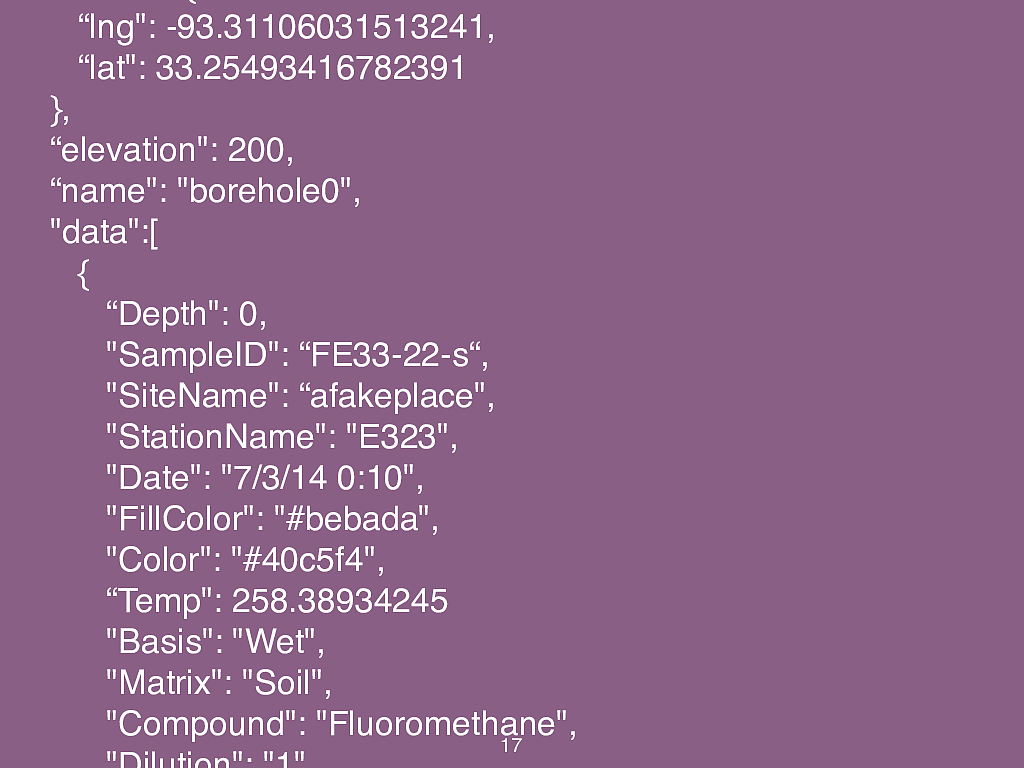
My client’s data is confidential so I’m quickly thrown together a mock version. The firs thing I always find when a client sends me a data file is that I never understand it.
Ever.
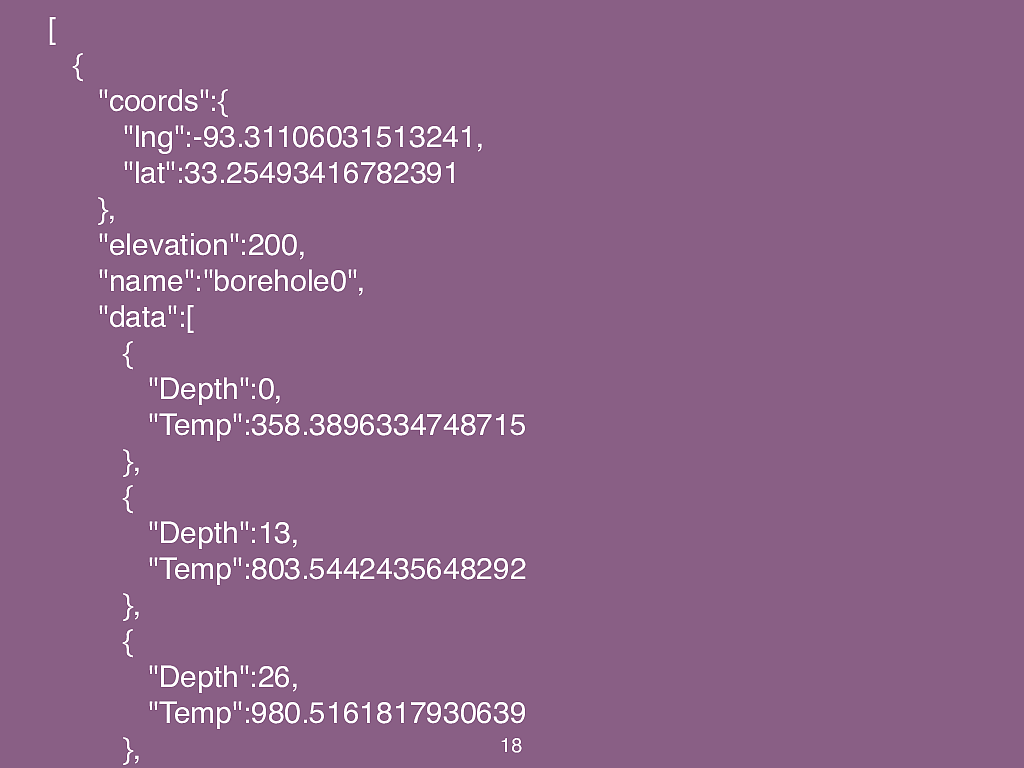
� 18 [ { "coords":{ "lng":-93.31106031513241, "lat":33.25493416782391 }, "elevation":200, "name":"borehole0", "data":[ { "Depth":0, "Temp":358.3896334748715 }, { "Depth":13, "Temp":803.5442435648292 }, { "Depth":26, "Temp":980.5161817930639 }, { So the first thing I always try to do is figure out which data is useful. Sometimes this is a middleware parser, sometimes it is a python script or a dirty hack in a javascript console. Being a prototype, it doesn’t matter too much. For the main system you can make sure the API has the correct output in most situations. For this prototype we want the coordinates of the boreholes and the data we want to visualise. We don’t need to know anything about the chemical compounds or the type of soil. We just want the variable, in this case temperature, and the depth that is at.
� 19 Ok excellent, we have data. Now what? Figure out the tech. This is not really a tutorial on how to make 3D on the web or even really about maps, it is about how to tackle projects.
There are loads of libraries we could use to do this. I decided to settle on Three.js because I didn’t want to get bogged down in WebGL but I also didn’t want to get stuck trying to make my code work with other people’s libraries. This is a prototype afterall, the code was never going to be perfect!

� 20 Three.js You all know about three.js but as a quick summary - it is a way of dealing with 3D as basic objects with helper functions instead of writing GLSL from scratch.
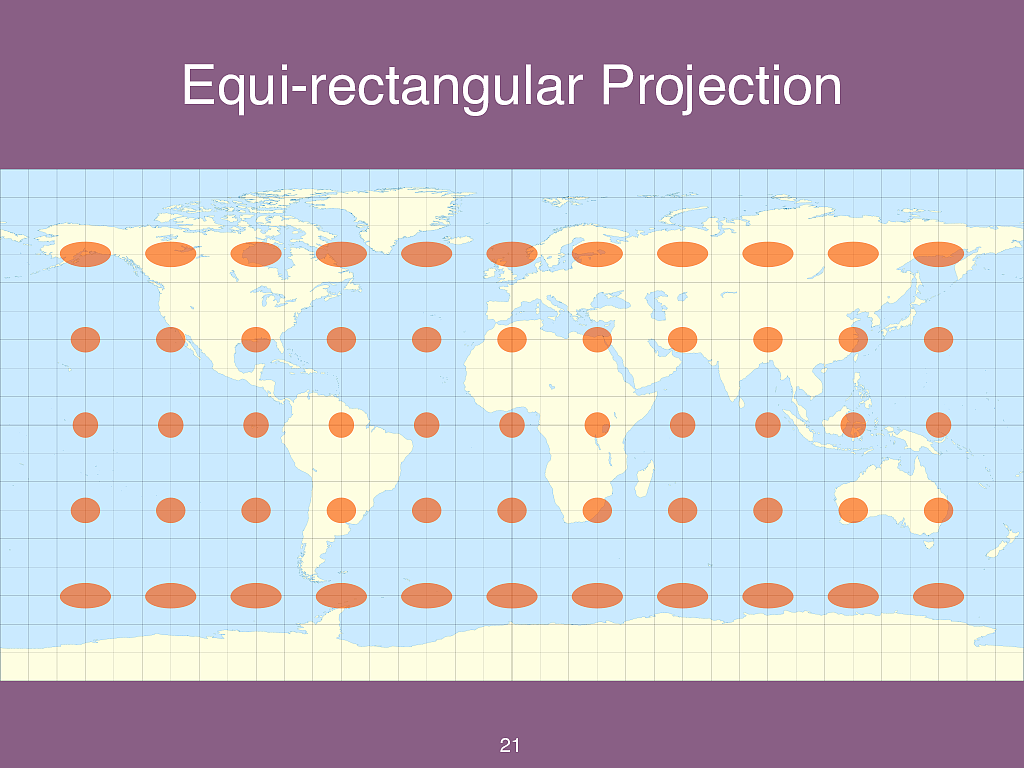
� 21 Equi-rectangular Projection For the prototype I decided to use the Equi-rectangular Projection by Marinus of Tyre, which is one of the simplest. As you can see in the image, which shows Tissot's indicatrix, everything is slightly squished by relatively ok for most places. Since my client was in America, I was confident that it would not skew the results too much.
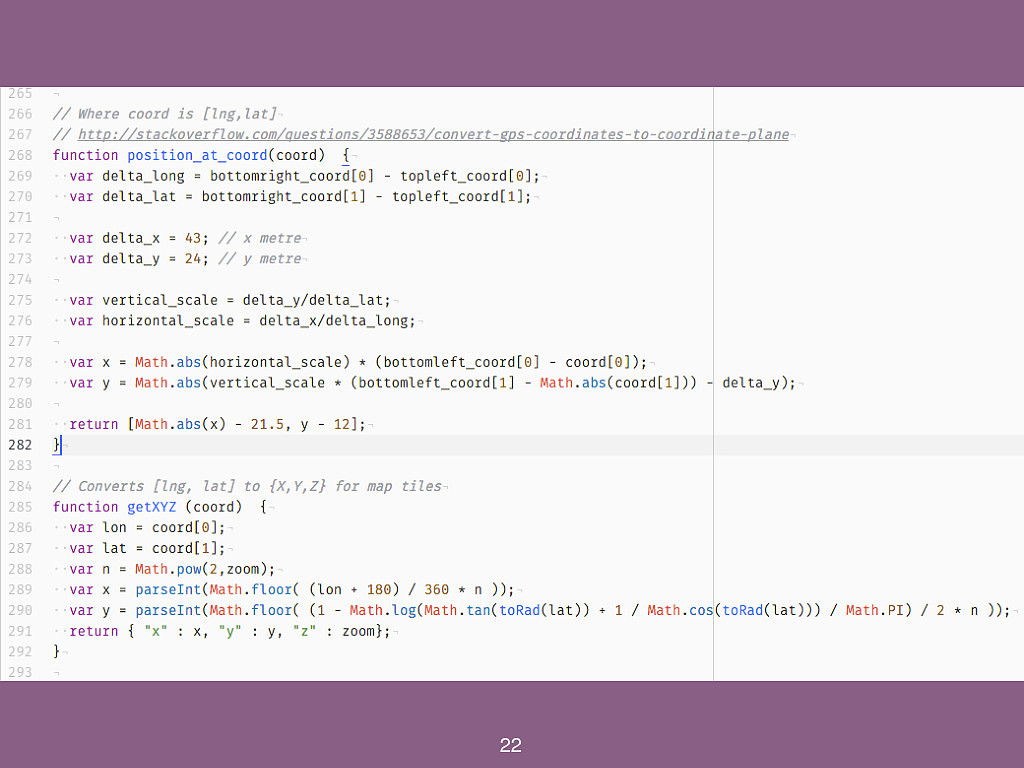
� 22 This is not an example of good code. But it does show how to convert from a lat/long to the coordinate on the plane.
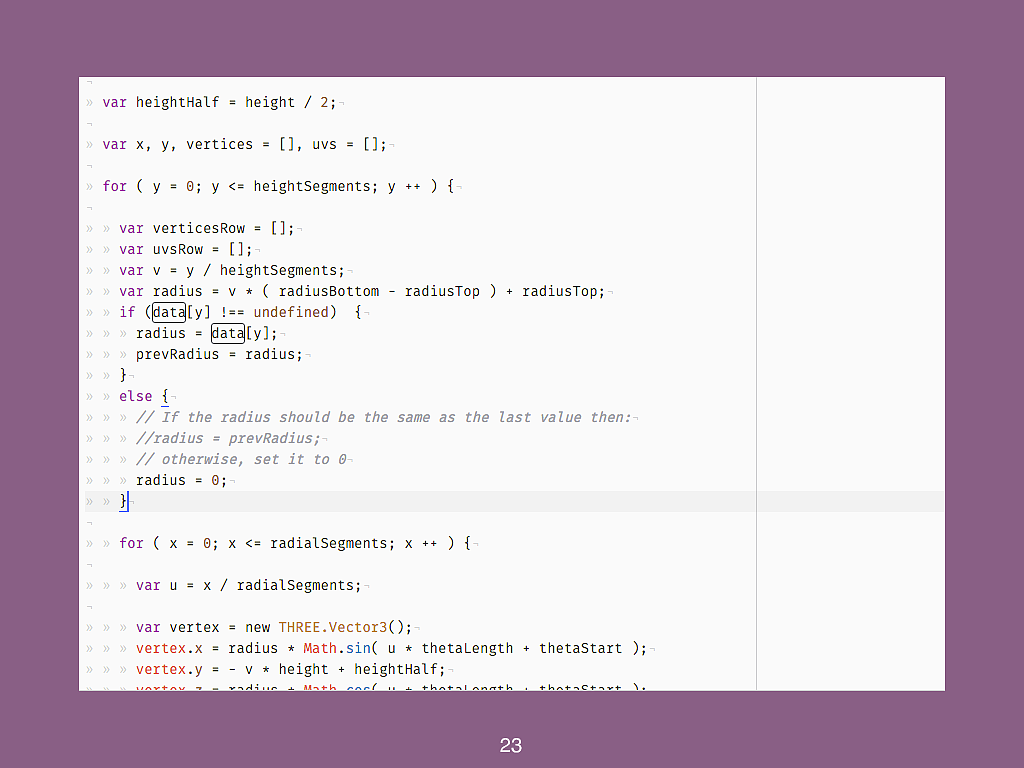
� 23 I mentioned I had to modify the CylinderGeometry to SpinGeometry. This is because when I got around to putting the data on the map, I realised that showing the data in the right place was relatively easy but it took me a while to figure out how to show the data changing with the elevation.
I’m not going to go through the code, as it was quickly hacked together for the prototype. I can put this file online if anyone would like me to. The changes I made were essentially to set the radius to match the data, scaled throughout, on each height segment and to change the vertex colours to match also match the data, relative to a colour spectrum.
� 24 You’re forgetting something… Terrain This is not really a tutorial on how to make 3D on the web or even really about maps, it is about how to tackle projects.
There are loads of libraries we could use to do this. I decided to settle on Three.js because I didn’t want to get bogged down in WebGL but I also didn’t want to get stuck trying to make my code work with other people’s libraries. This is a prototype afterall, the code was never going to be perfect!
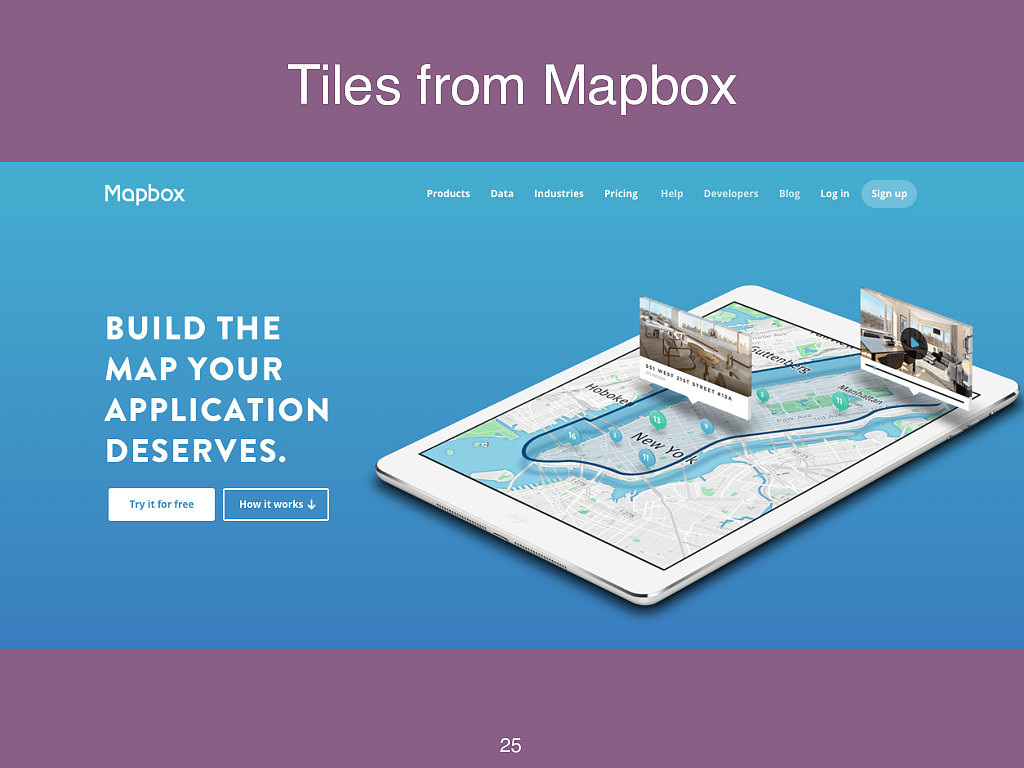
� 25 Tiles from Mapbox Hindsight is always best. I had a 2D plane, a flat piece of paper essentially, in my 3D world which I tend draped with map tiles from mapbox. I used my getXYZ function to position them accordingly. And it worked but it was very temperamental. I think if we make this prototype into a production version I would instead try to incorporate some kind of mapping library like OpenLayers to drape over the top, or use something like ViziCities and add the 3D terrain to that.
� 26
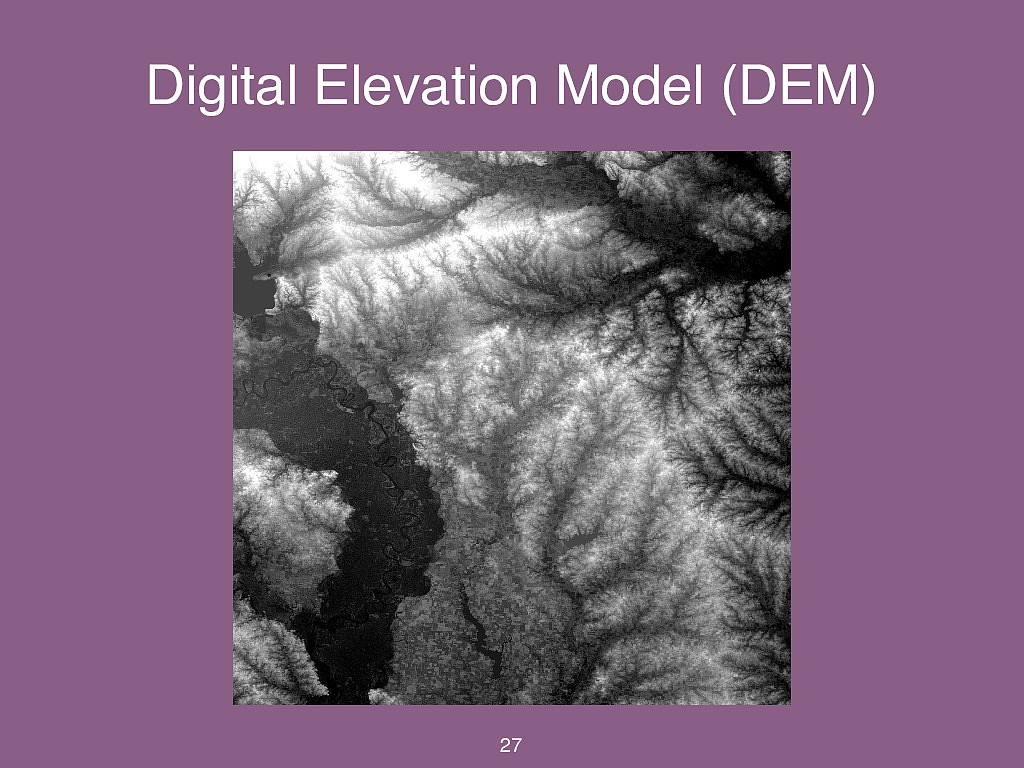
� 27 Digital Elevation Model (DEM) DEM, GDAL etc.
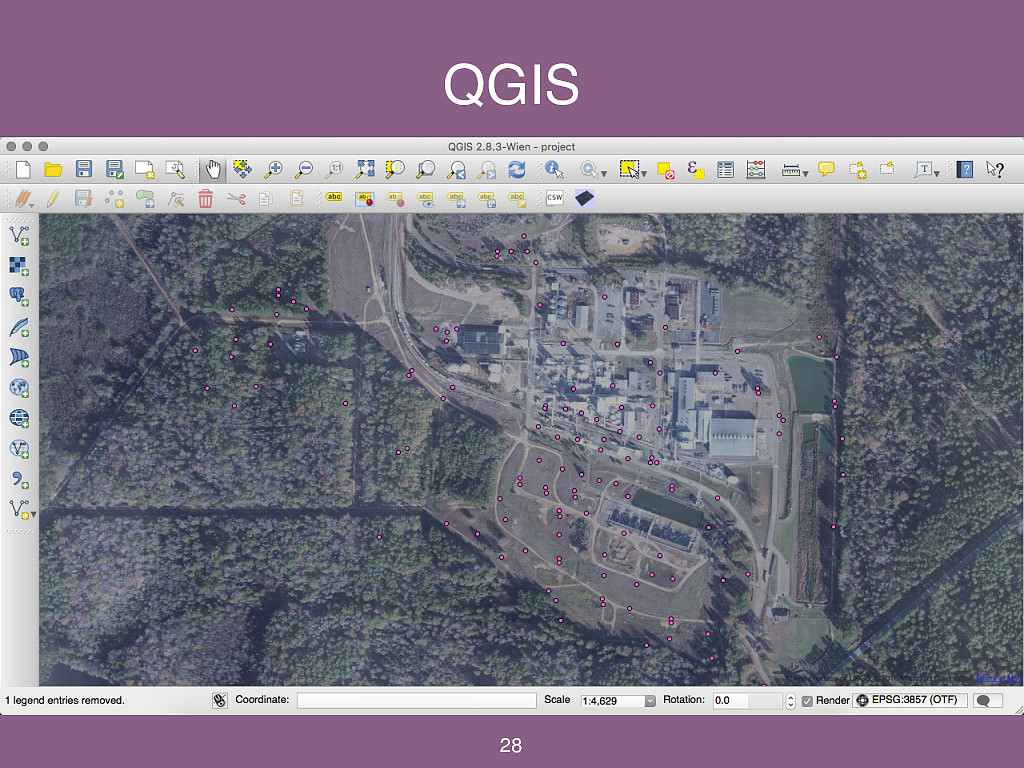
� 28 QGIS Although JavaScript is really powerful, sometimes it is easier to use other techniques to check things work correctly. So to make sure my projection maths was correct, I compared visually between my results and a QGIS project that I overplayed the original data onto a map. This also let me compare elevation, in 2D as in the previous picture.
� 29

✓ Context and the beauty of maps ✓ Real life clients • Resources • Tackling crazy projects • Takeaways Agenda � 30
Resources � 31 The geospatial community is incredible and over recent years they have been developing lots of libraries and useful resources for the web. This is just a small selection. I’ve been trying to get across the point that this is not all about maps, it is about transforming raw data into useful information. I started by briefly talking about the context of maps and it really is crucial. So there are resources here for all kinds of data exploration.
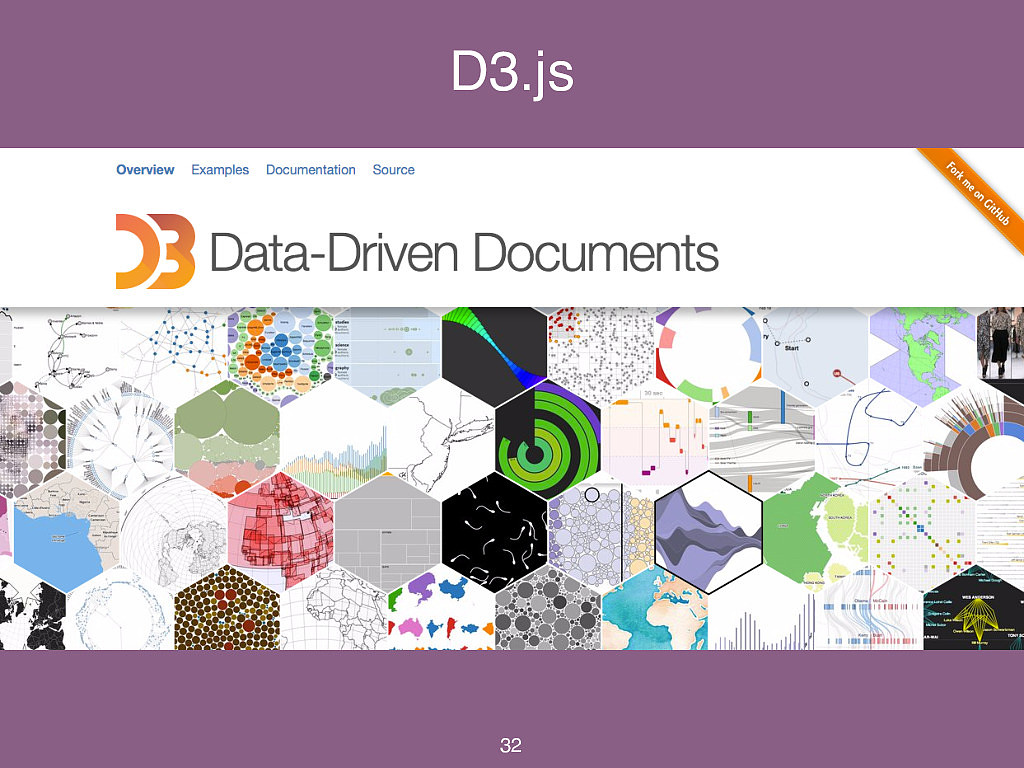
� 32 D3.js
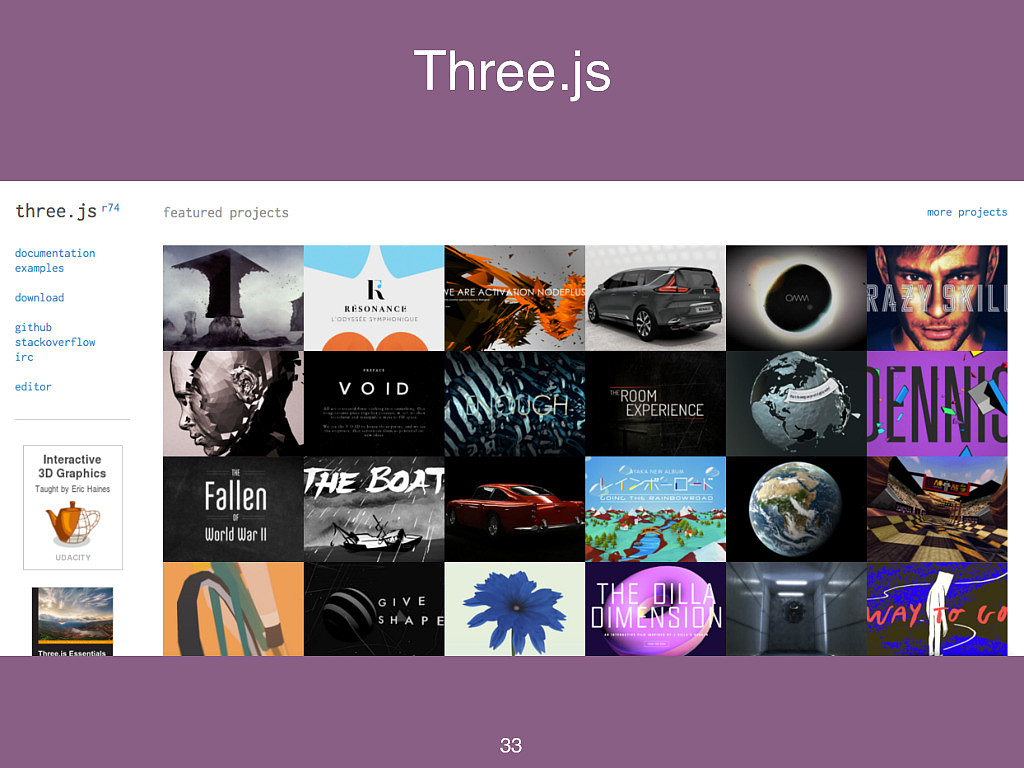
� 33 Three.js You all know about three.js but as a quick summary - it is a way of dealing with 3D as basic objects with helper functions instead of writing GLSL from scratch.
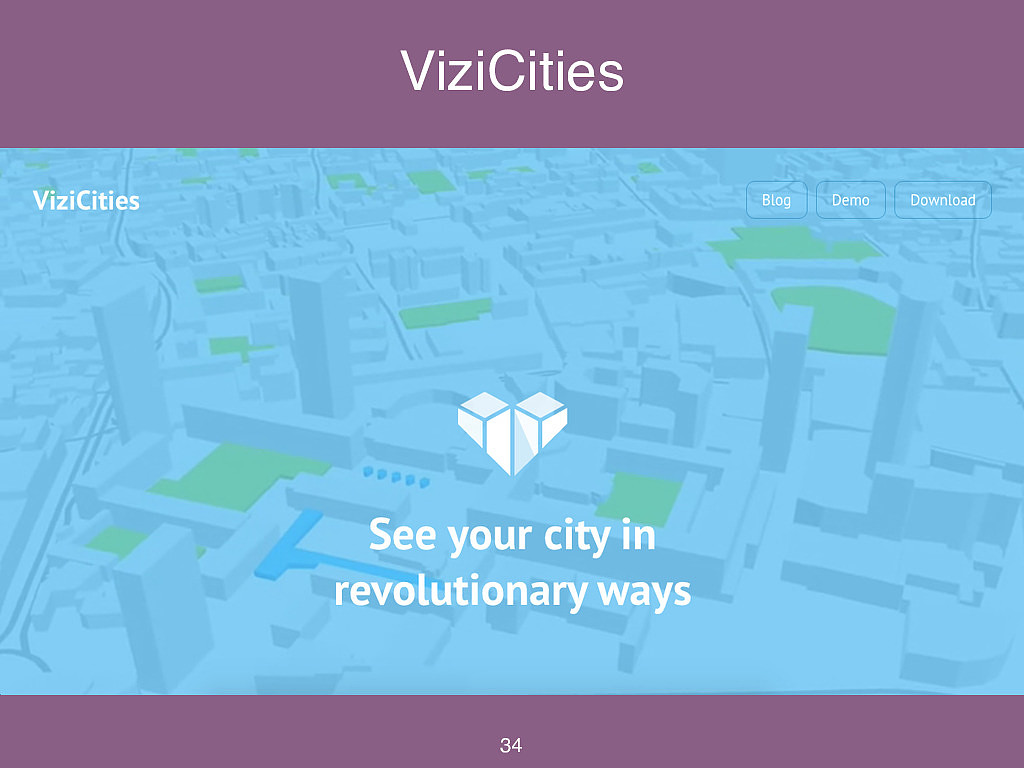
� 34 ViziCities Vizicities, mention Robin is doing loads of great things
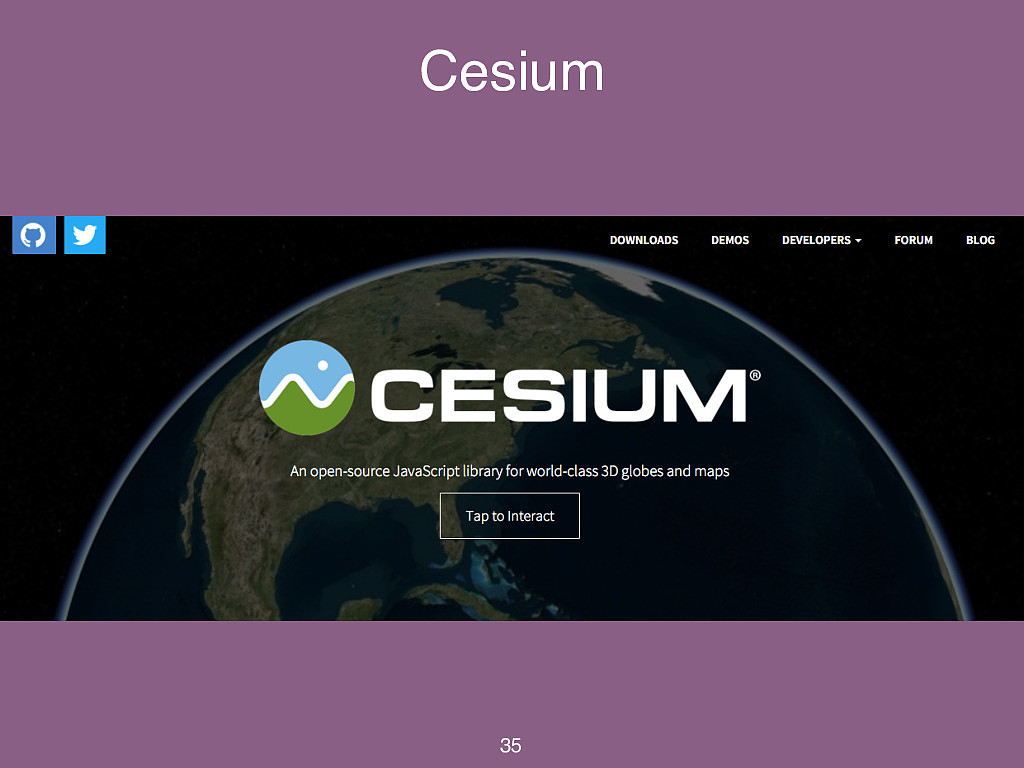
� 35 Cesium
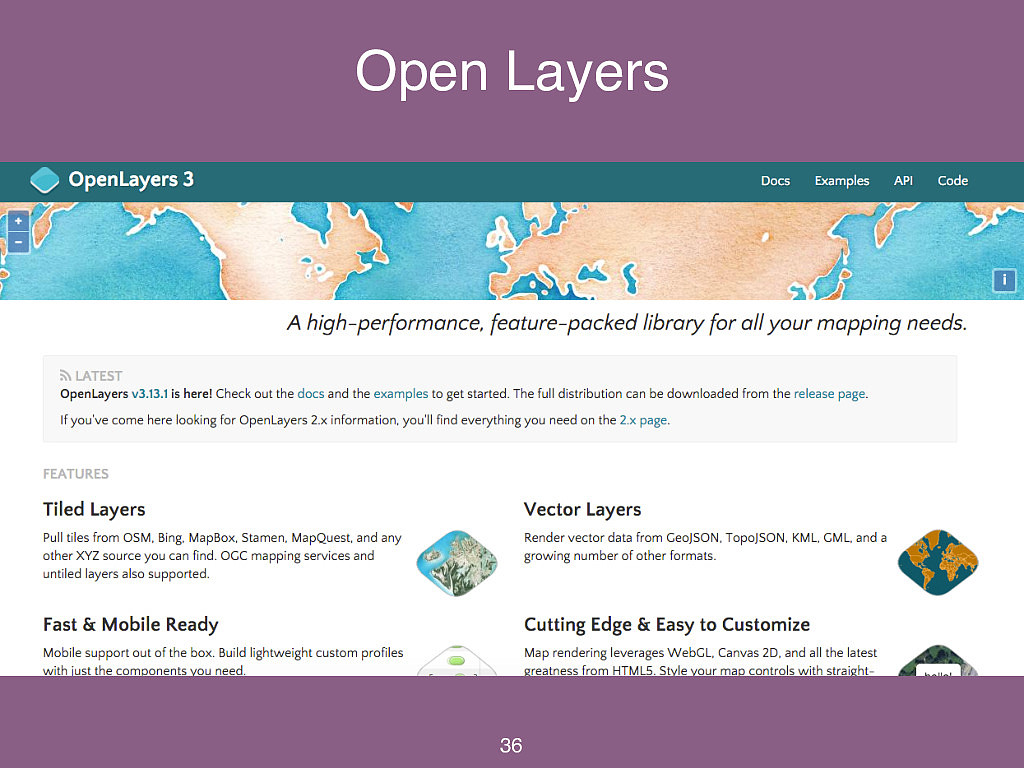
� 36 Open Layers
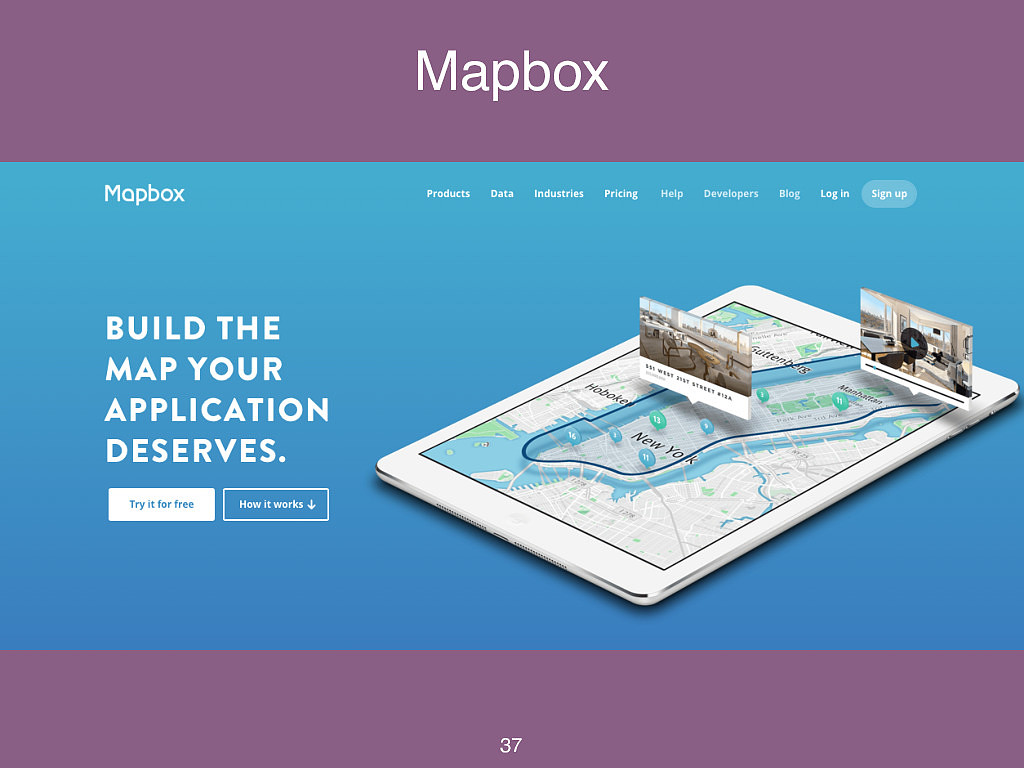
� 37 Mapbox Mapbox is a company that specialise in maps on the web, they have lots of paid services but the part I find most interesting is Mapbox studio which is free. It allows you to style base maps essentially using CSS.
https://www.mapbox.com/
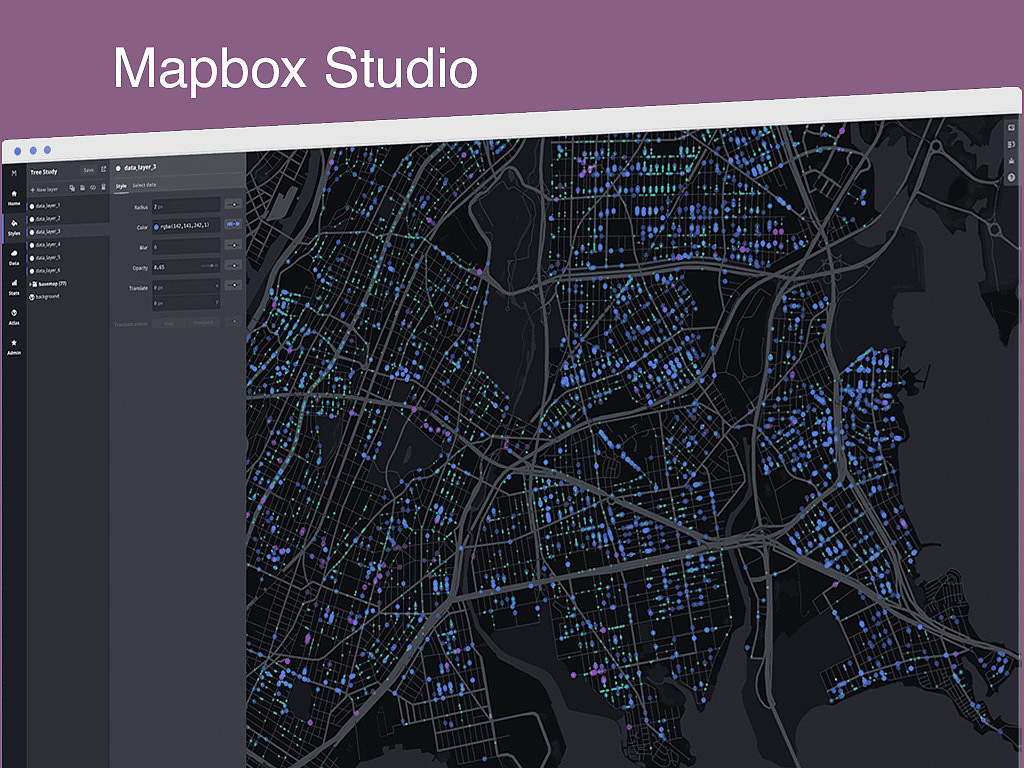
� 38 Mapbox Studio For example, to change the colour of all labels you simply do label { color: #fff; }. You can also target zoom levels, which gives a lot of power to specify the context in which they see the map.
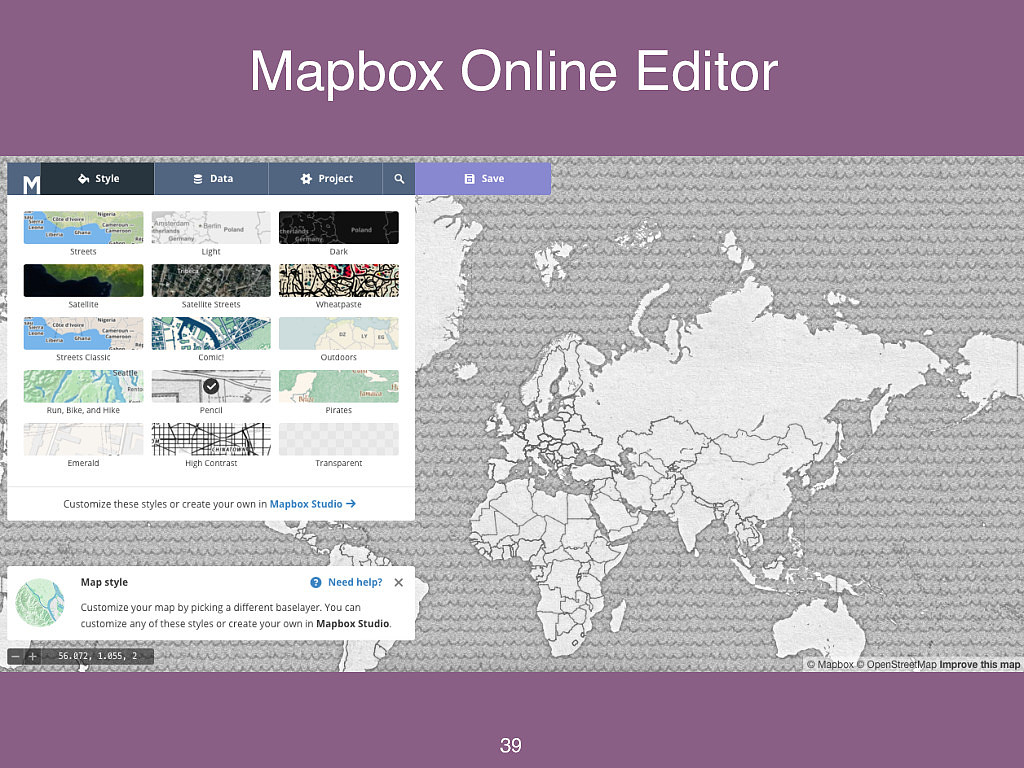
� 39 Mapbox Online Editor As well as Mapbox studio, they also have an online editor that is really quick and simple. Their products are not for everybody but they have such a low barrier to entry that they have really changed how maps can be created on the web.

✓ Context and the beauty of maps ✓ Real life clients ✓ Resources • Tackling crazy projects • Takeaways Agenda � 40
“Crazy” Projects � 41 My website currently uses the word “interesting” a lot when it talks about the kinds of projects I enjoy working out. A lot of people I speak to about it calls them crazy. Essentially the projects are experimental, research and development kind of projects. Those clients tend to have the most potential, whenever I get an email saying I have a “crazy idea, I’ve got the budget and I want to work with you”… I love getting emails like that. It’s not every day but it does happen.
I can’t discuss all my client work but the prototype we went through at the beginning was a good example. So now I want to look at the big picture a bit and take a look at how I approach projects like that. Hopefully it will give everybody some insight no matter what your job role or experience is.
� 42 The Email Hey, it is Tony Stark here. I was wondering if you could build me a HTML5 JavaScript 3D WebGL product customisation tool for my Iron Man suits. They need to come in various colour varieties and it needs to work on phones. I have an open budget. Thanks! It is very rare to get an email from someone saying they have any budget, let alone an open one. It is even rarer for that person to be Iron Man. But let’s roll with it, that’s similar to the example I have in the contact form on my website!
Although I’ve never worked with Iron Man, I have worked on tools like this. And they are very interesting.
� 43
� 44
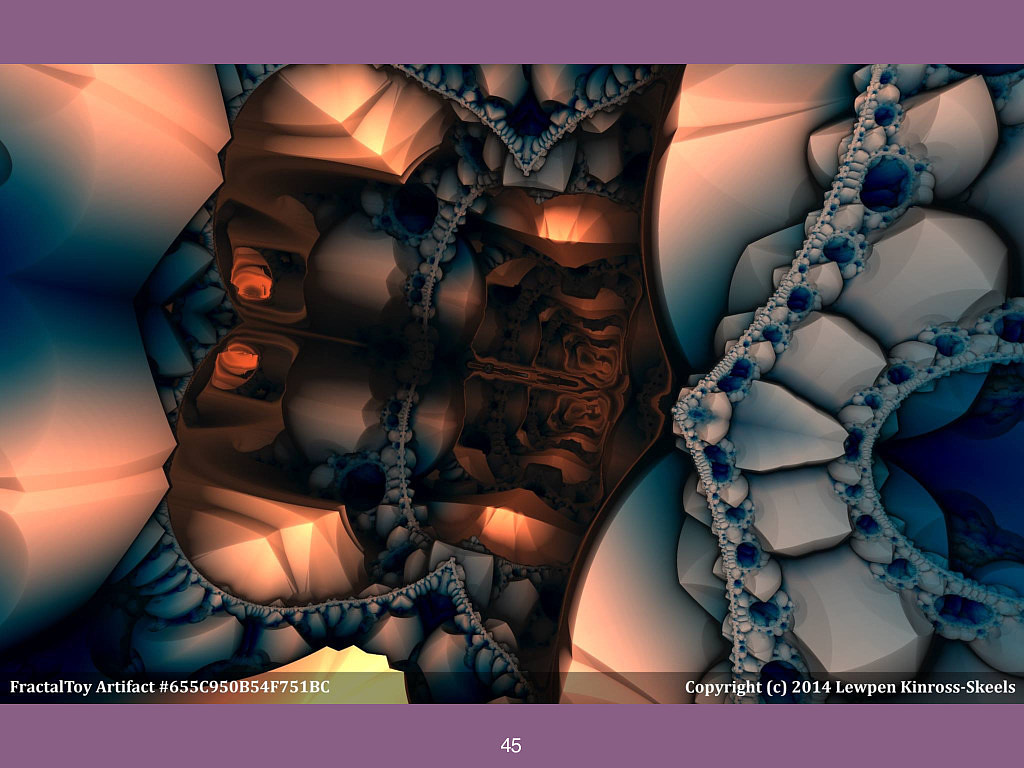
� 45 I mentioned on Twitter that I had no projects on so Lewpen got in touch and said he would like to add virtual reality to his FractalToy project. I had never done much virtual reality, certainly not with raytracers and fractals on the Oculus Rift but he said that it was fine to learn on the job so I did. Wow. It really was an experience!
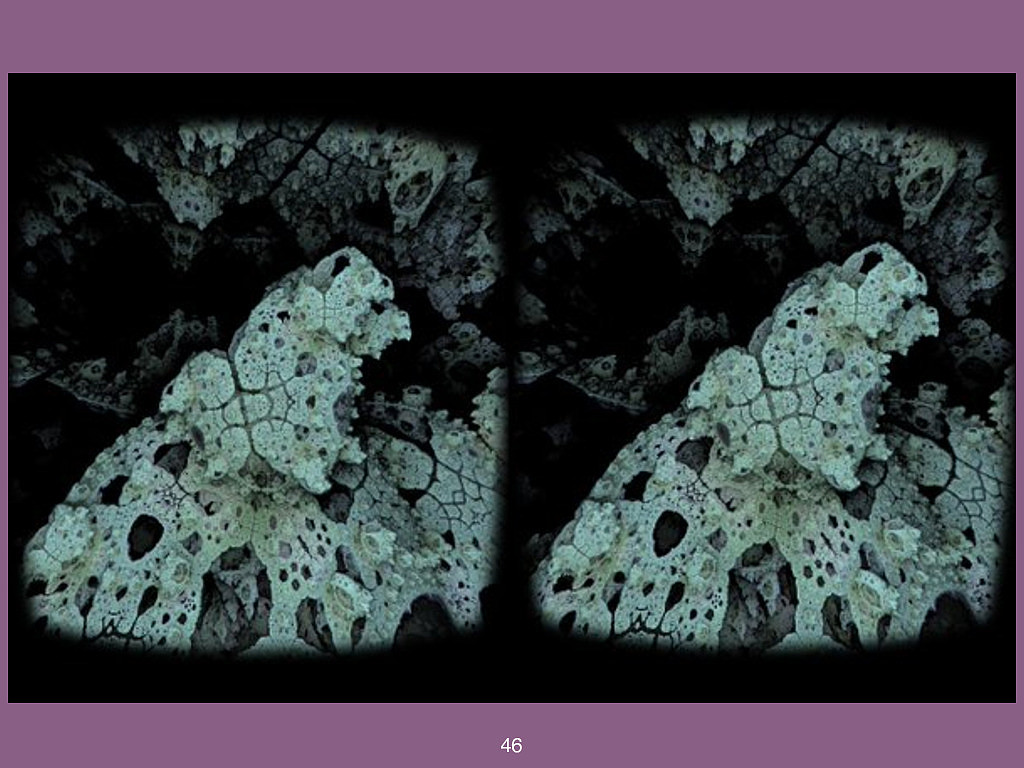
� 46
✓ Context and the beauty of maps ✓ Real life clients ✓ Resources ✓ Tackling crazy projects • Takeaways Agenda � 47
Takeaways � 48
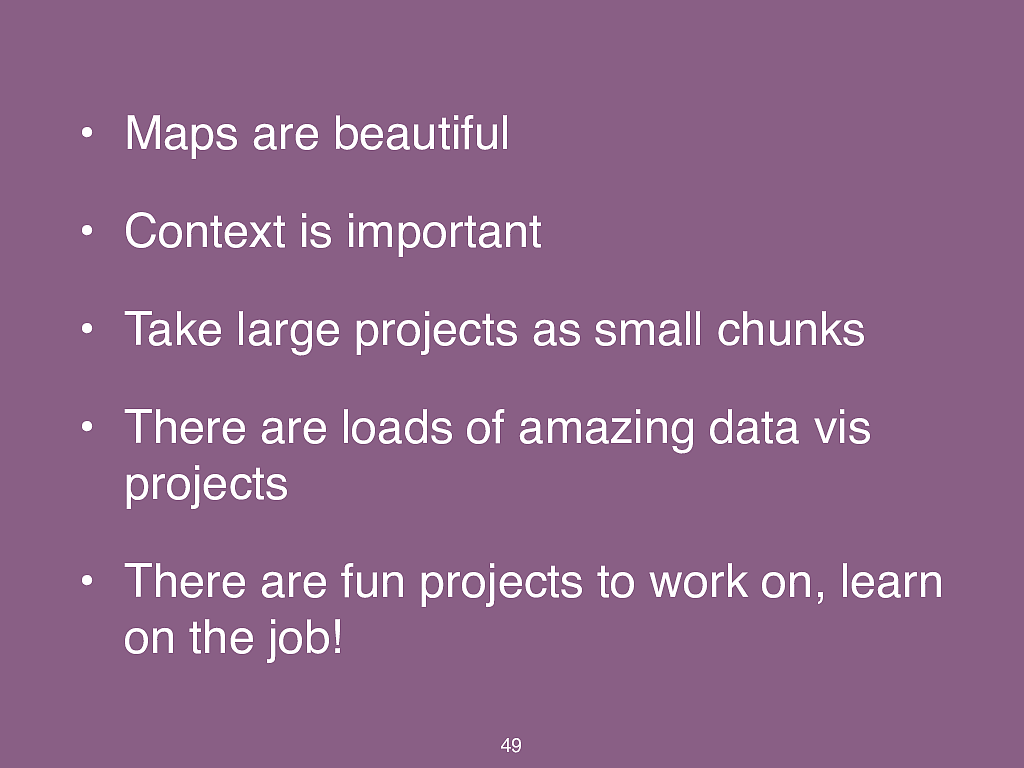
� 49 • Maps are beautiful • Context is important • Take large projects as small chunks • There are loads of amazing data vis projects • There are fun projects to work on, learn on the job!
Thank You! JS Summit 2016 @shanehudson shanehudson.net