
A presentation at Velocity Conference in in Amsterdam, Netherlands by Simon Hearne
Beyond the waterfall
A picture is worth a thousand words,
storytellers
and we are all
A picture is worth a thousand words,
salespeople
and we are all
perfmatters
webperf
devops
sitespeed
@ VelocityConf
http:// www.slideshare.net/soasta
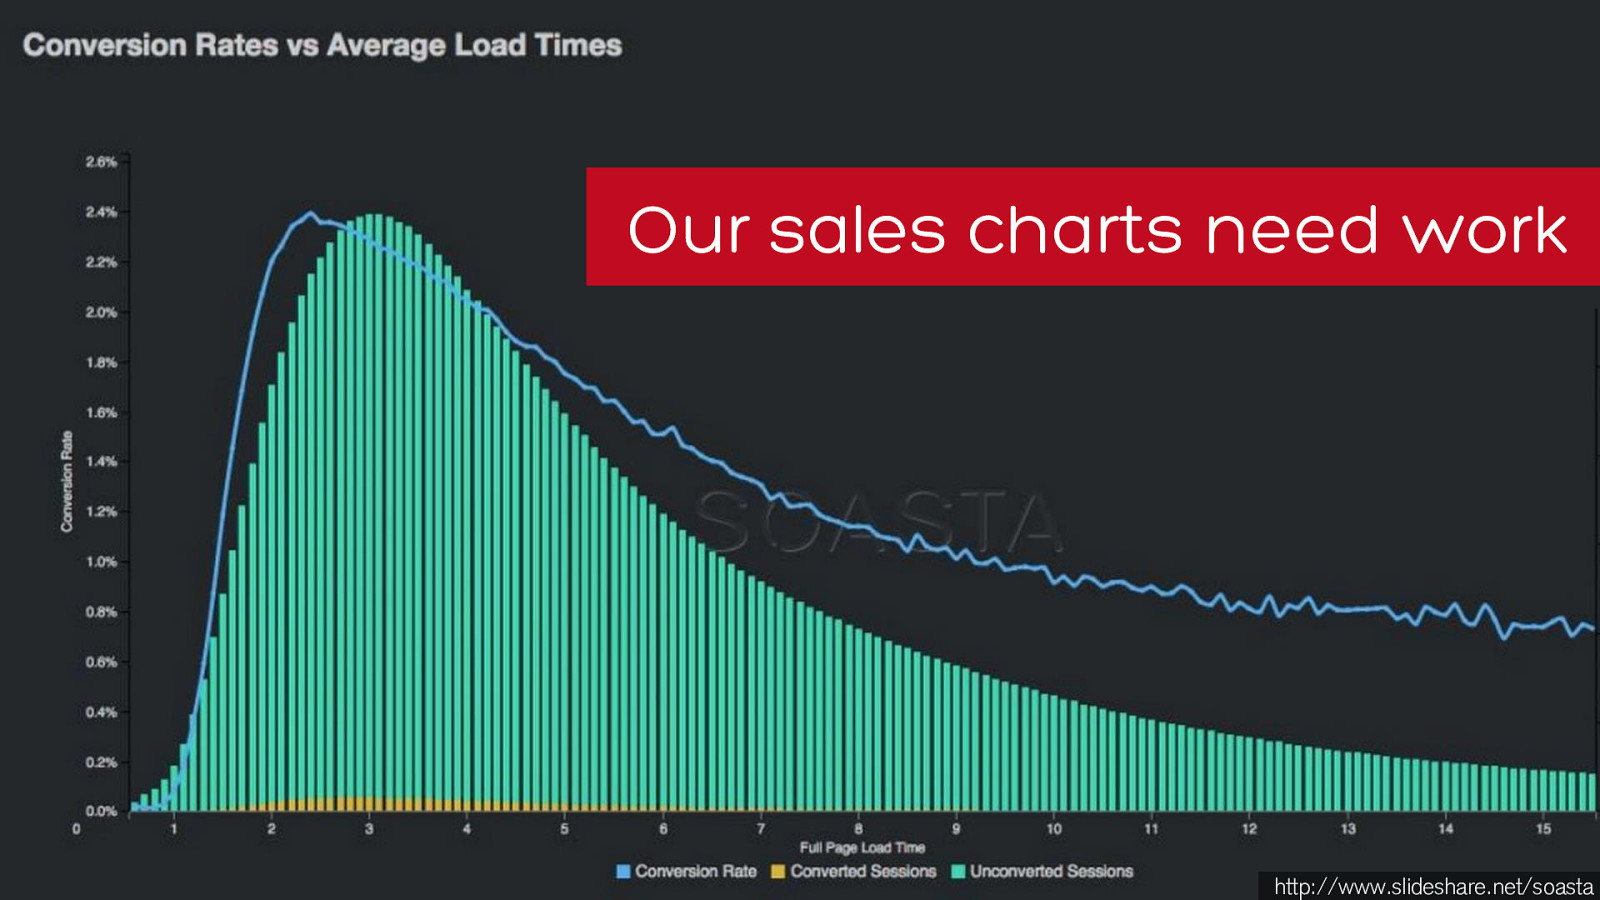
Our sales charts need work
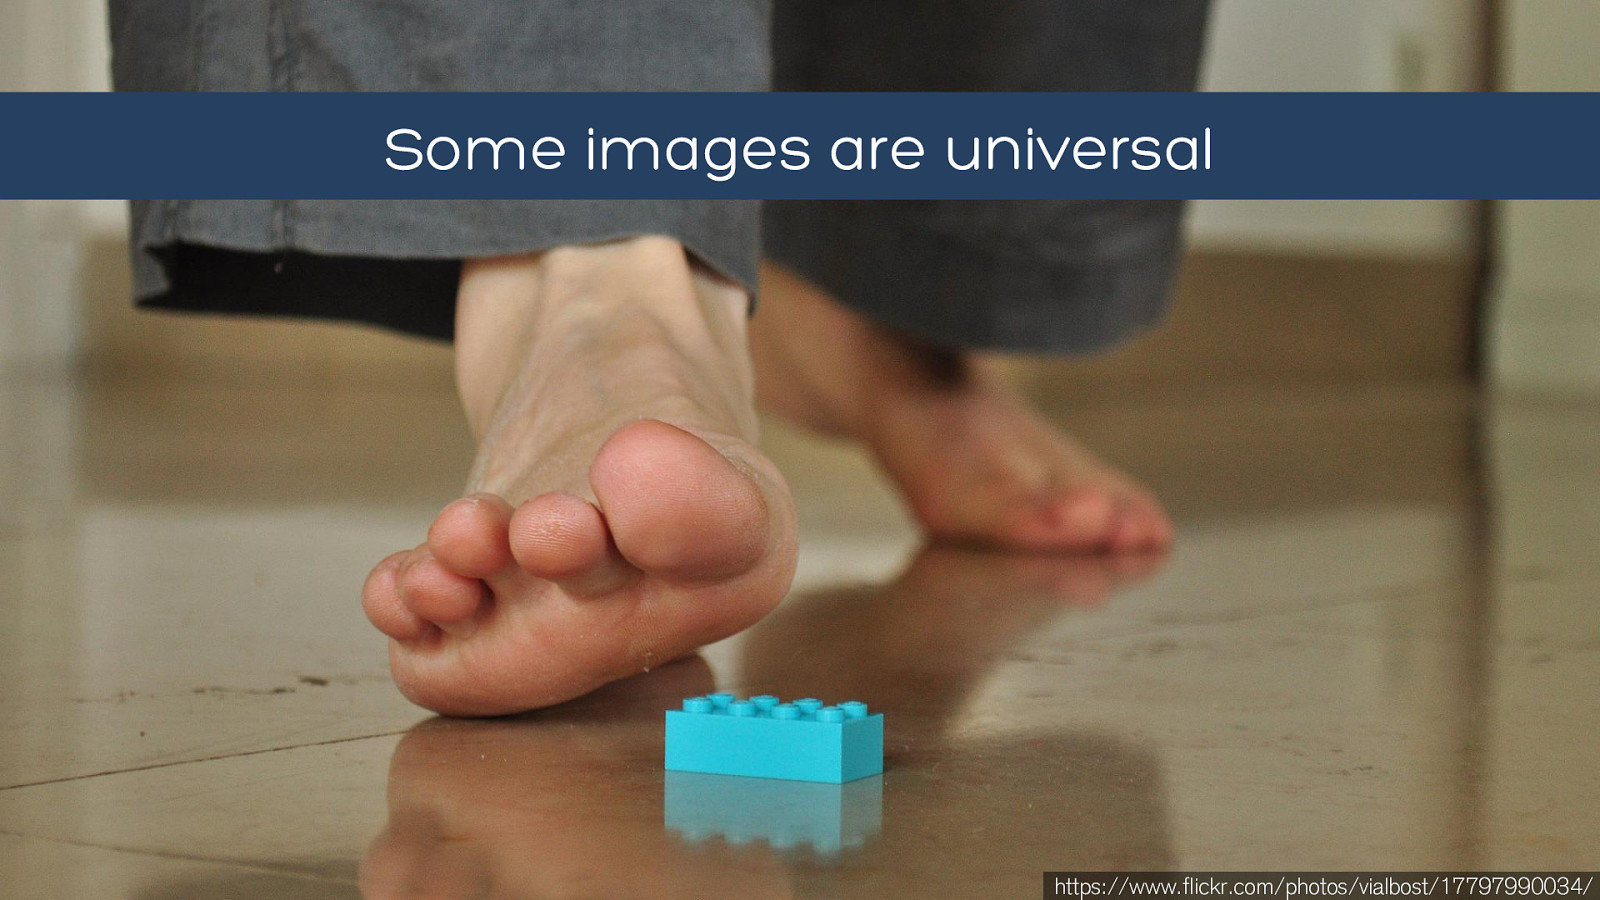
Some images are universal
https:// www.flickr.com/photos/vialbost/17797990034/
Some images are universal
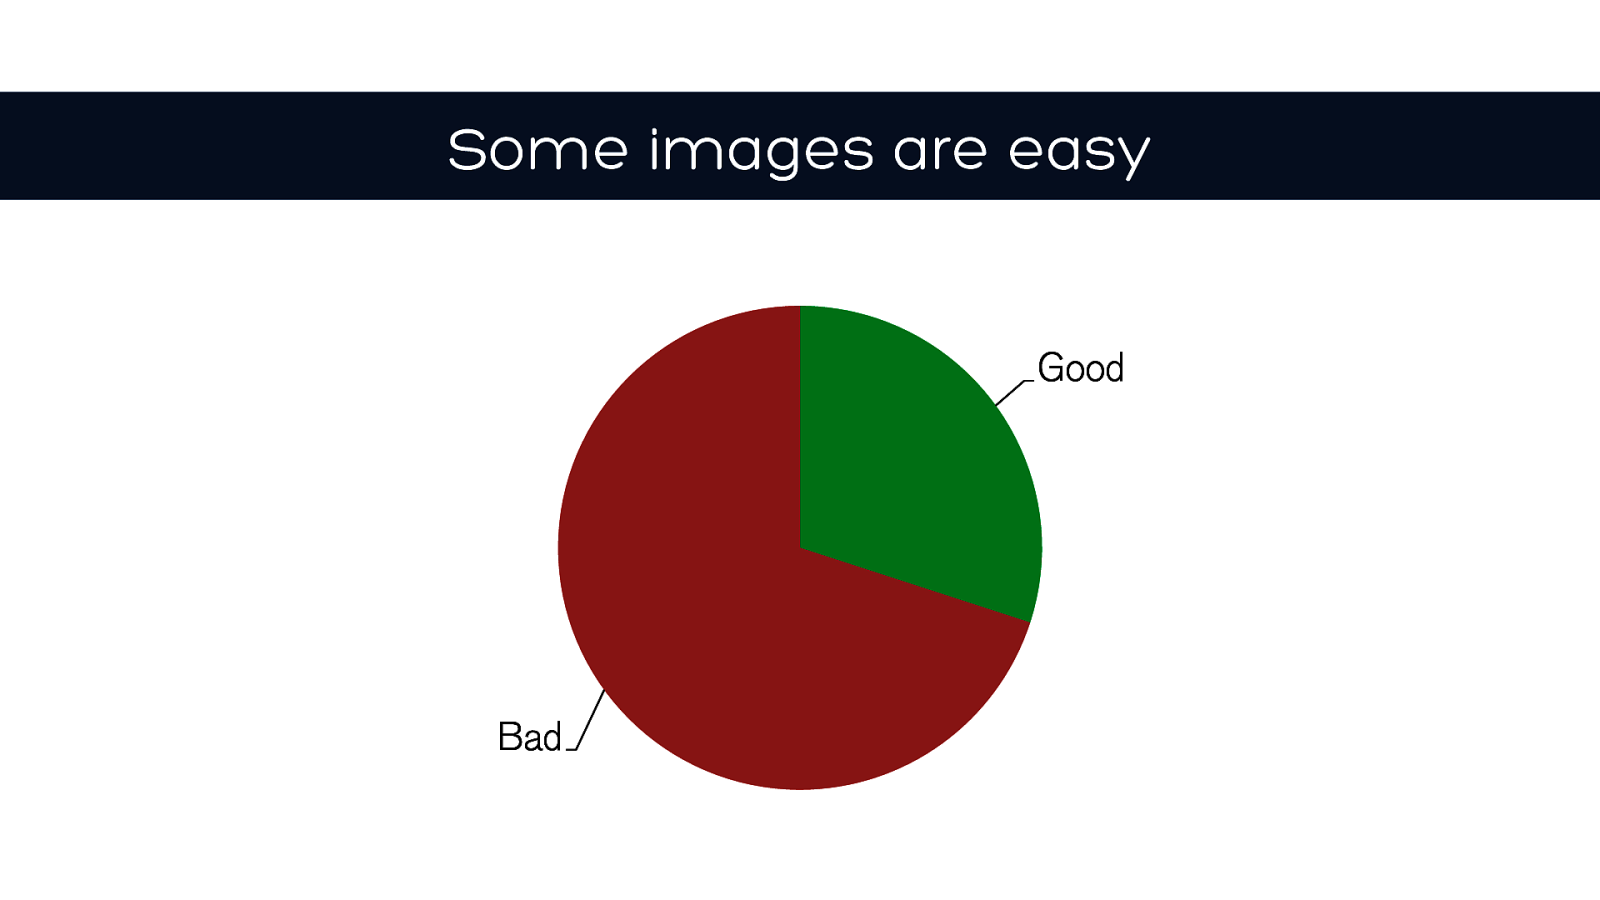
Some images are easy
Good
Bad
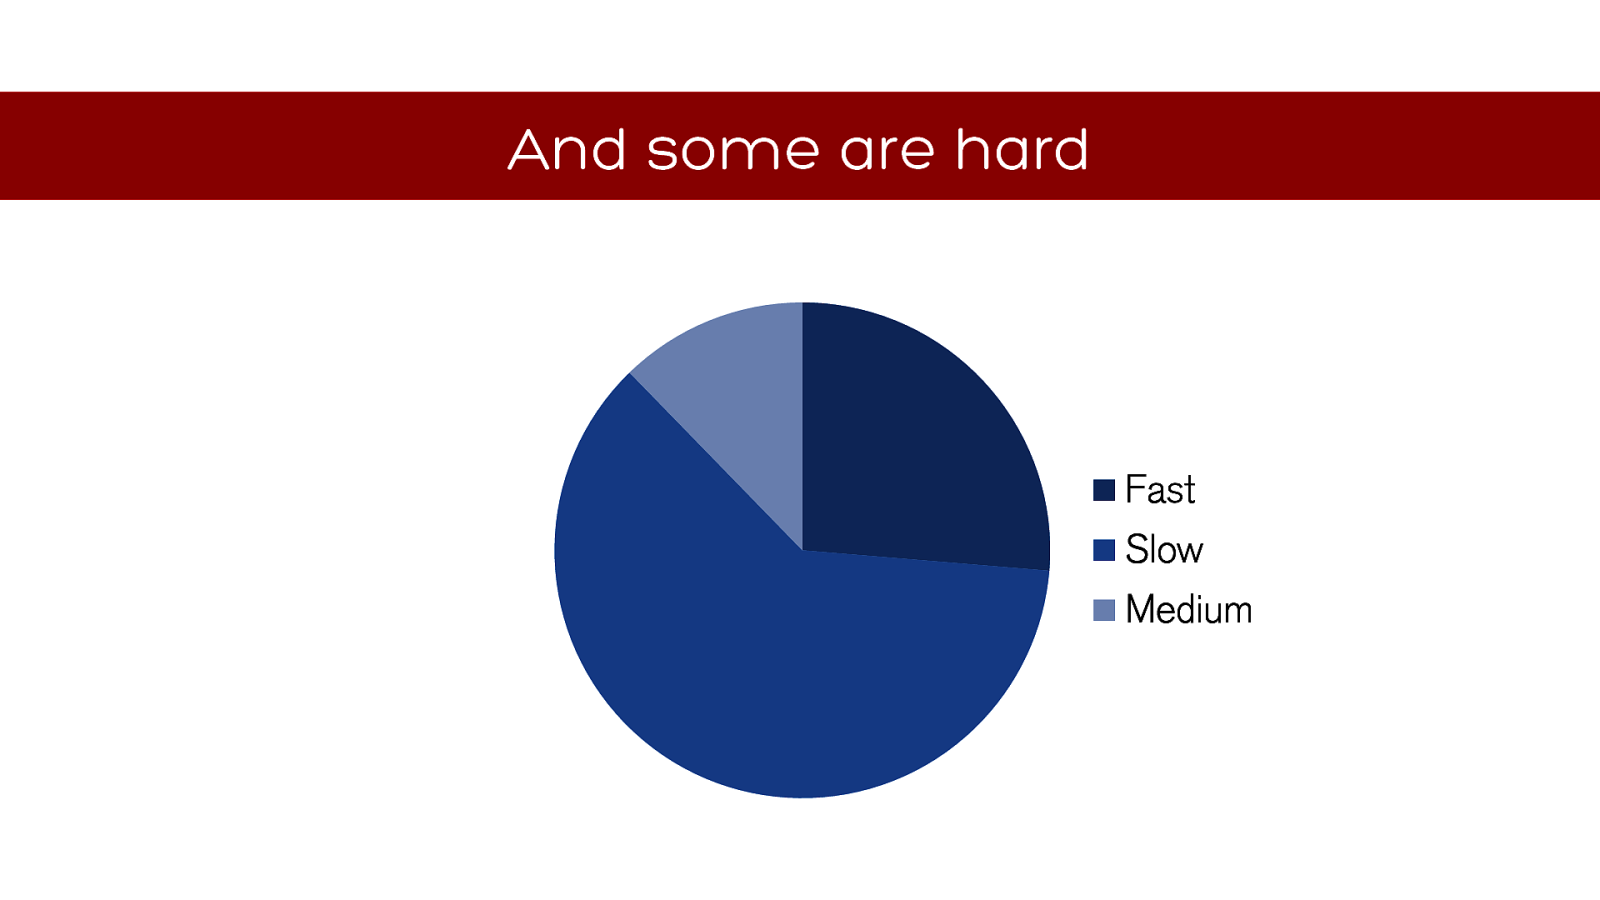
And some are hard
Fast Slow Medium
it is our job to find the best visualisations to support our story
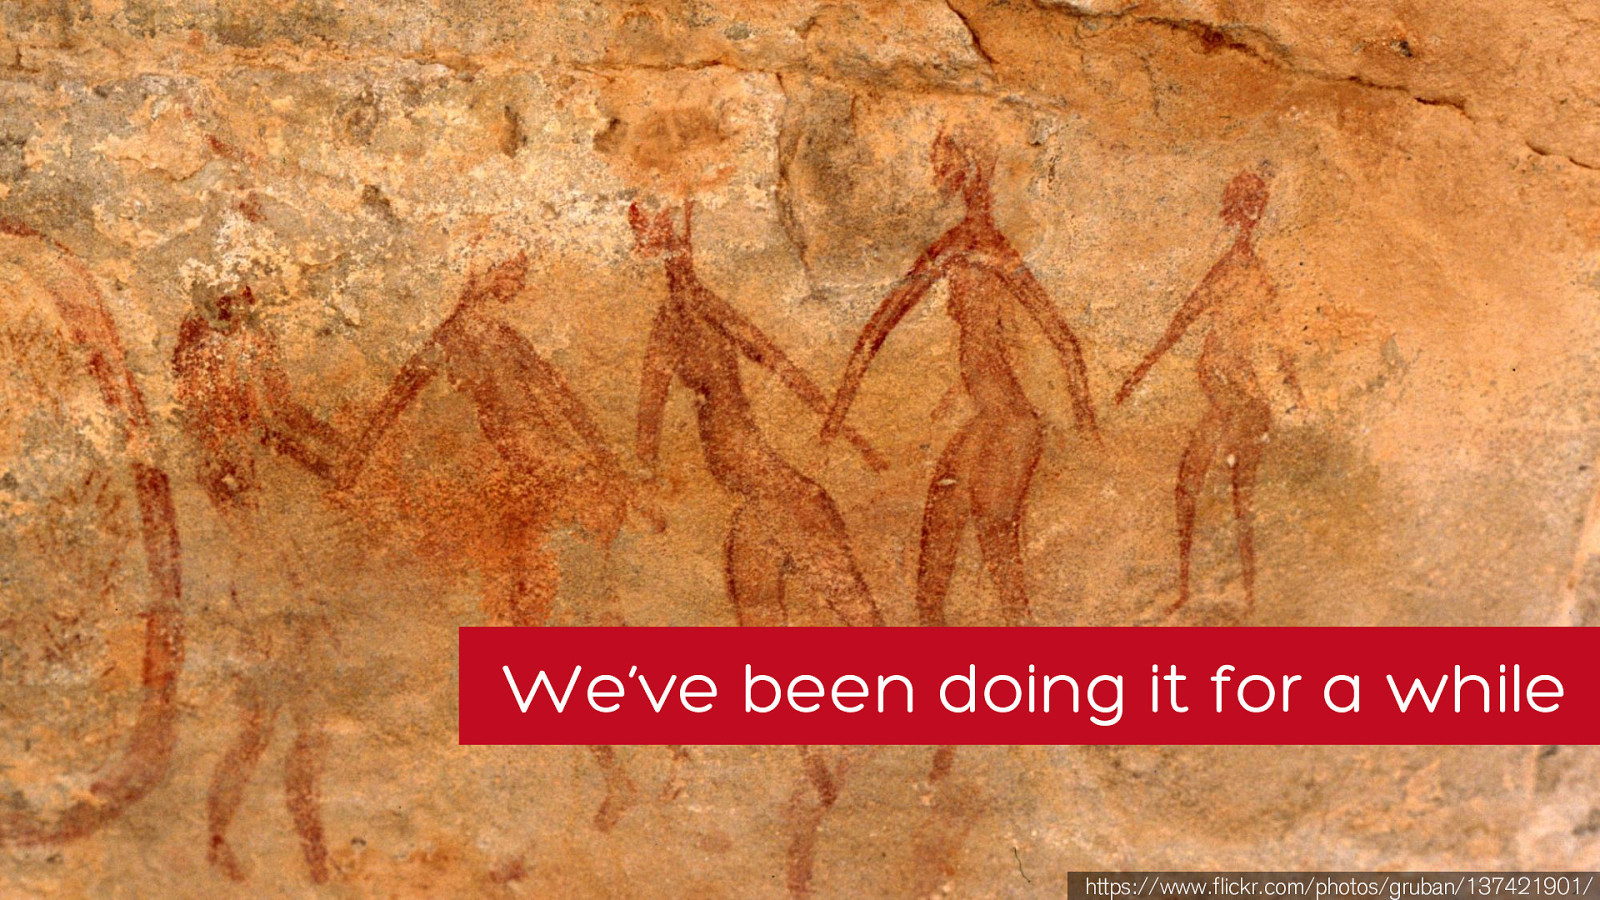
We’ve been doing it for a while
https:// www.flickr.com/photos/gruban/137421901/
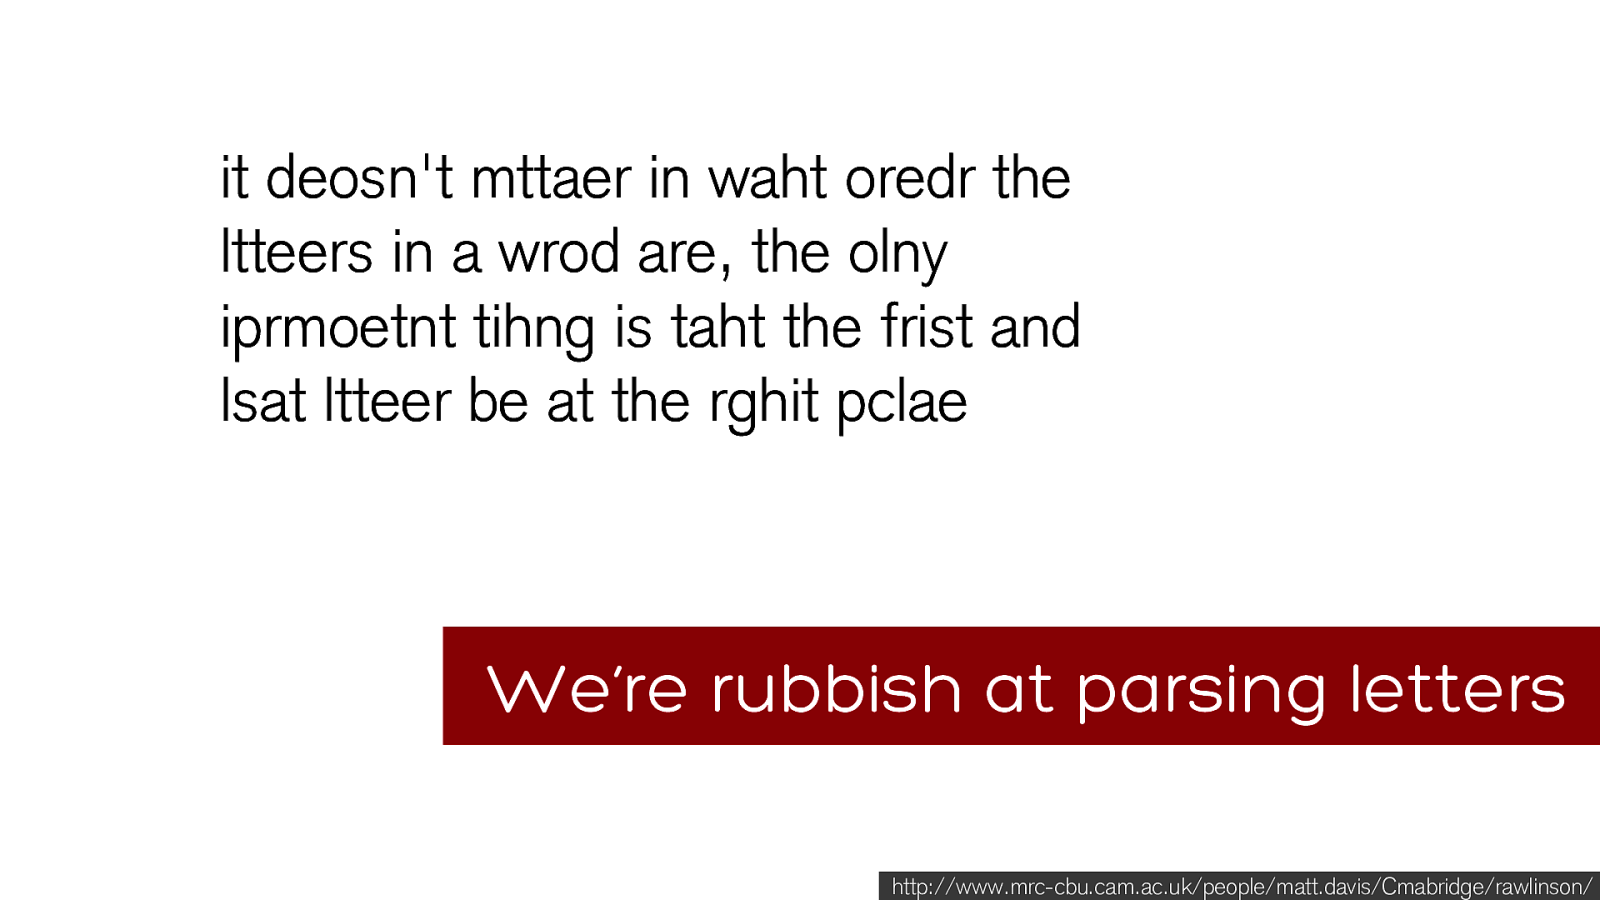
We’re rubbish at parsing letters
cbu.cam.ac.uk/people/matt.davis/Cmabridge/rawlinson/
it deosn't
mttaer
in waht
oredr
the ltteers
in a wrod
are, the olny
iprmoetnt
tihng
is taht
the frist
and lsat
ltteer
be at the rghit
pclae
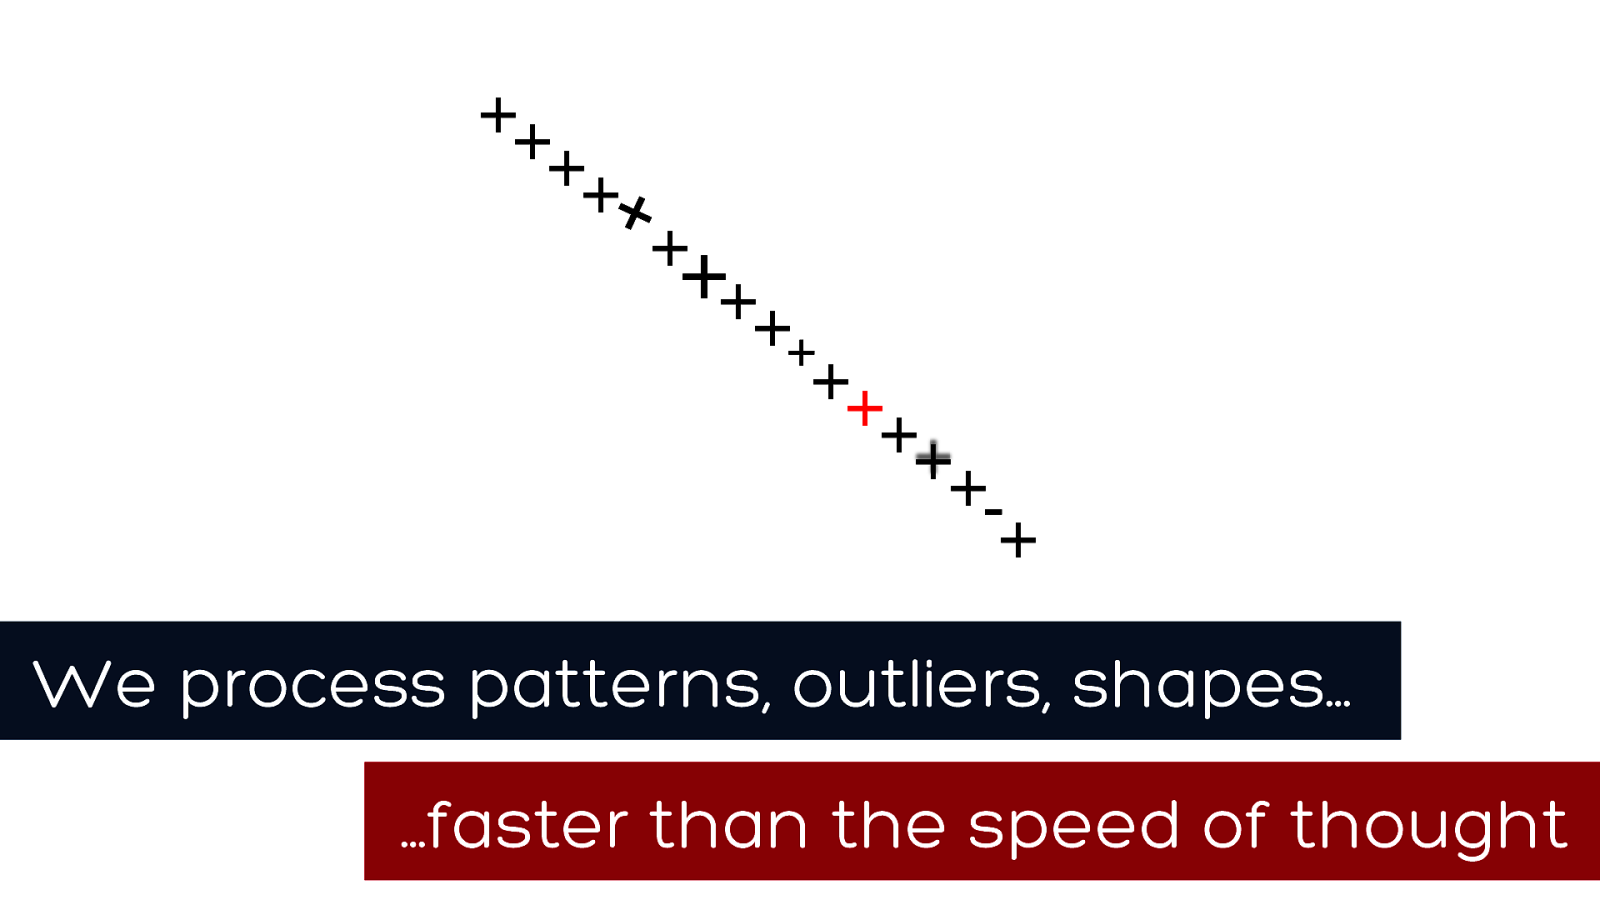
We process patterns, outliers, shapes…
…faster than the speed of thought
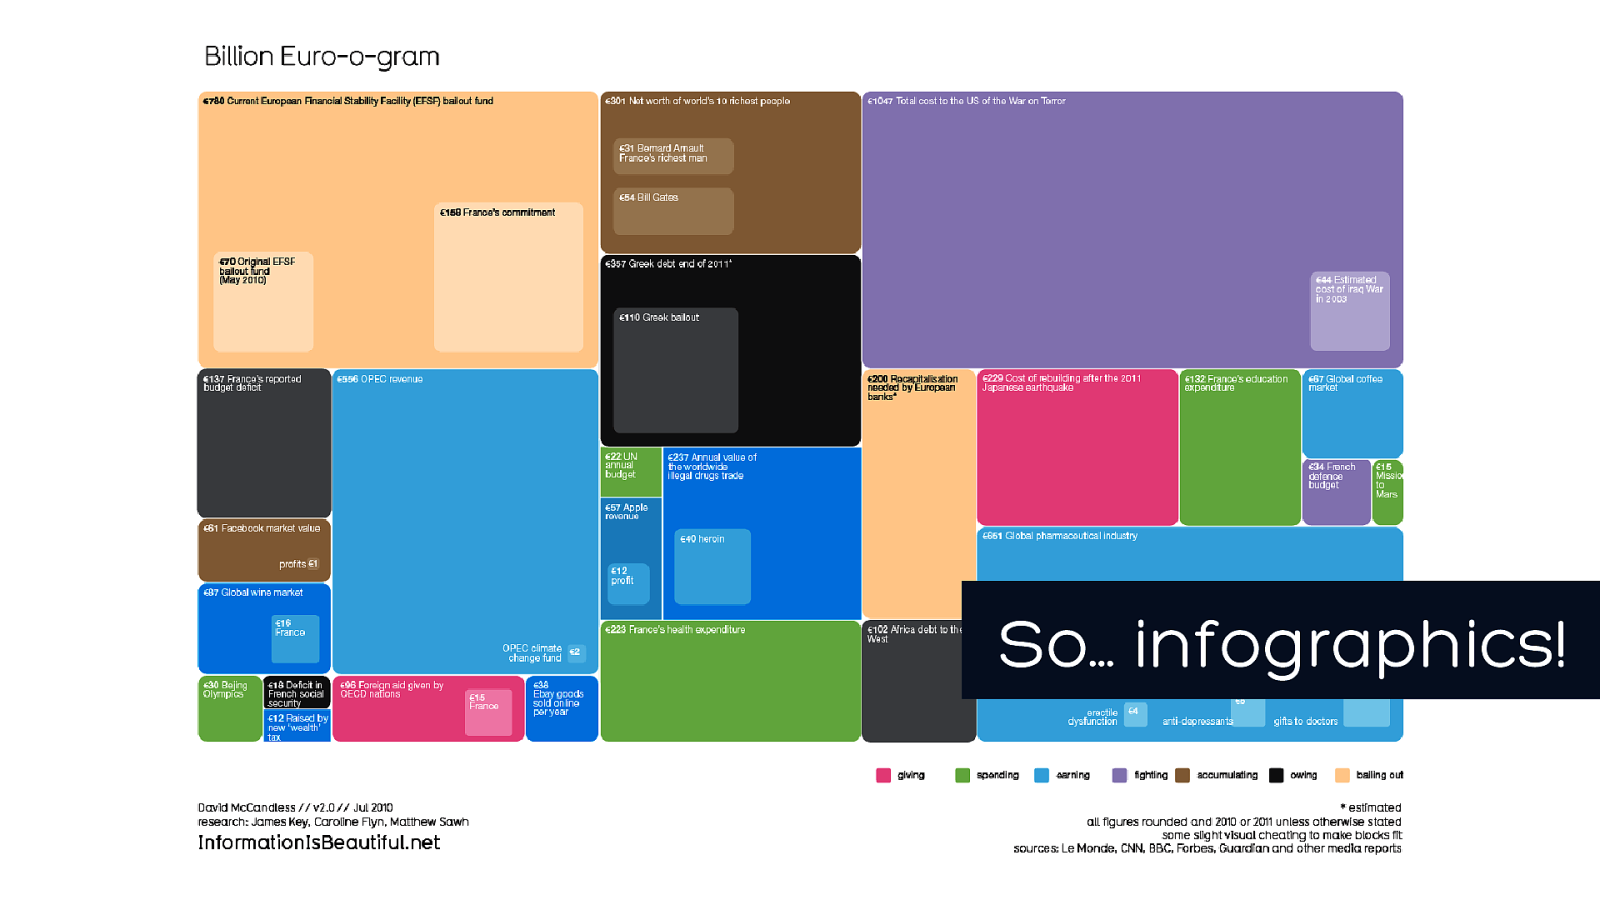
So… infographics !
made
made
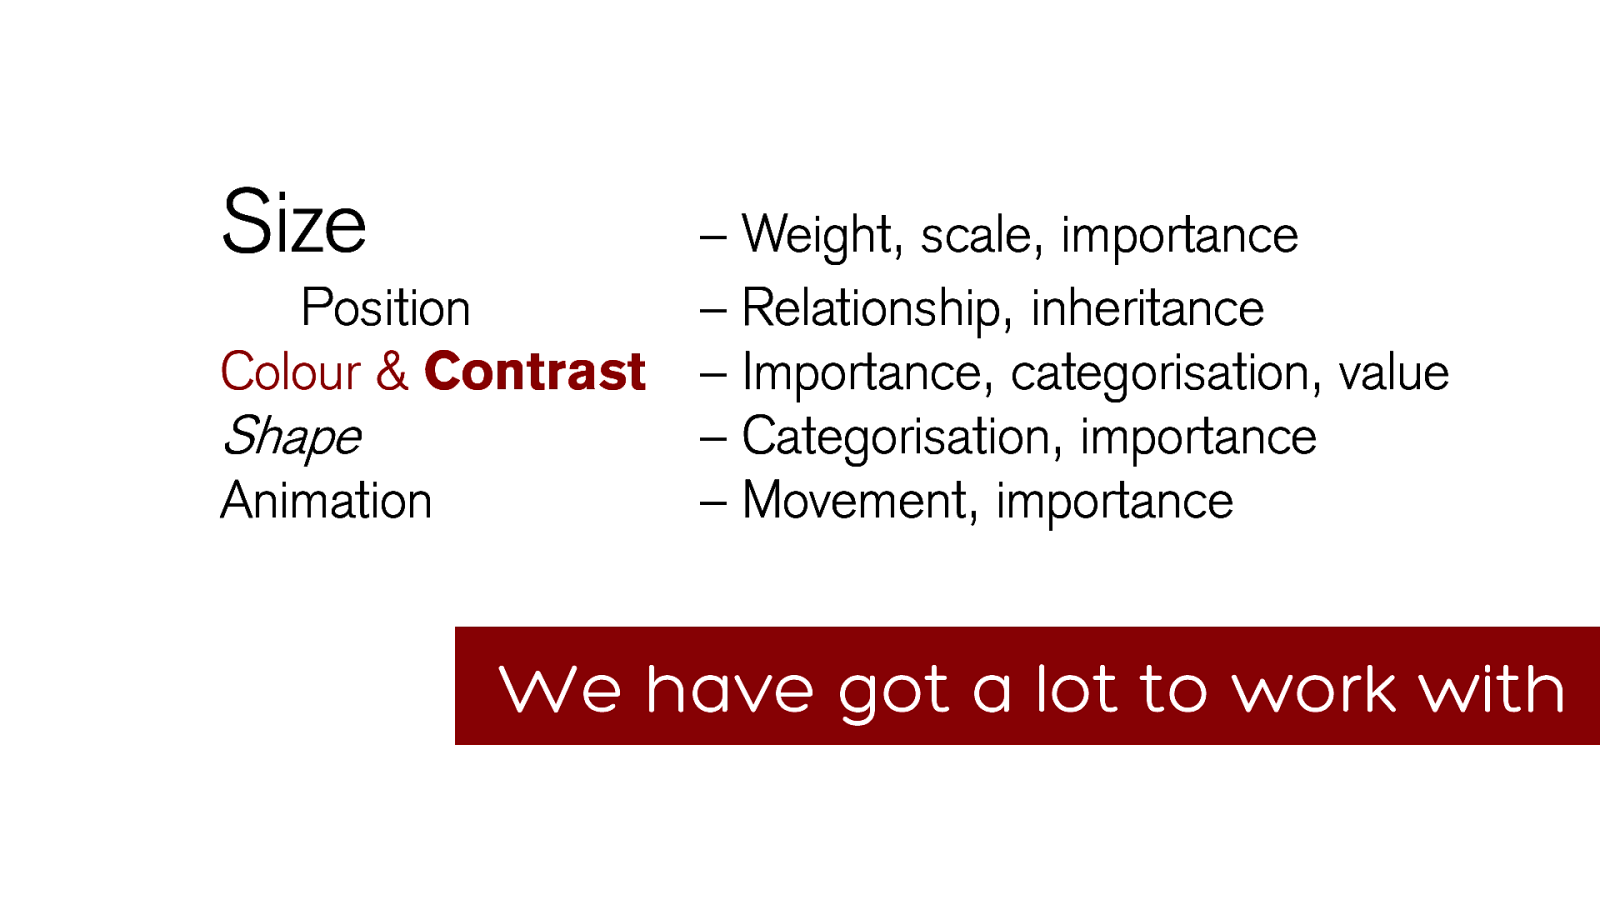
Size
–
Weight, scale, importance
Position
–
Relationship, inheritance
Colour & Contrast
–
Importance, categorisation, value
Shape
–
Categorisation, importance
Animation
–
Movement, importance
We have got a lot to work with
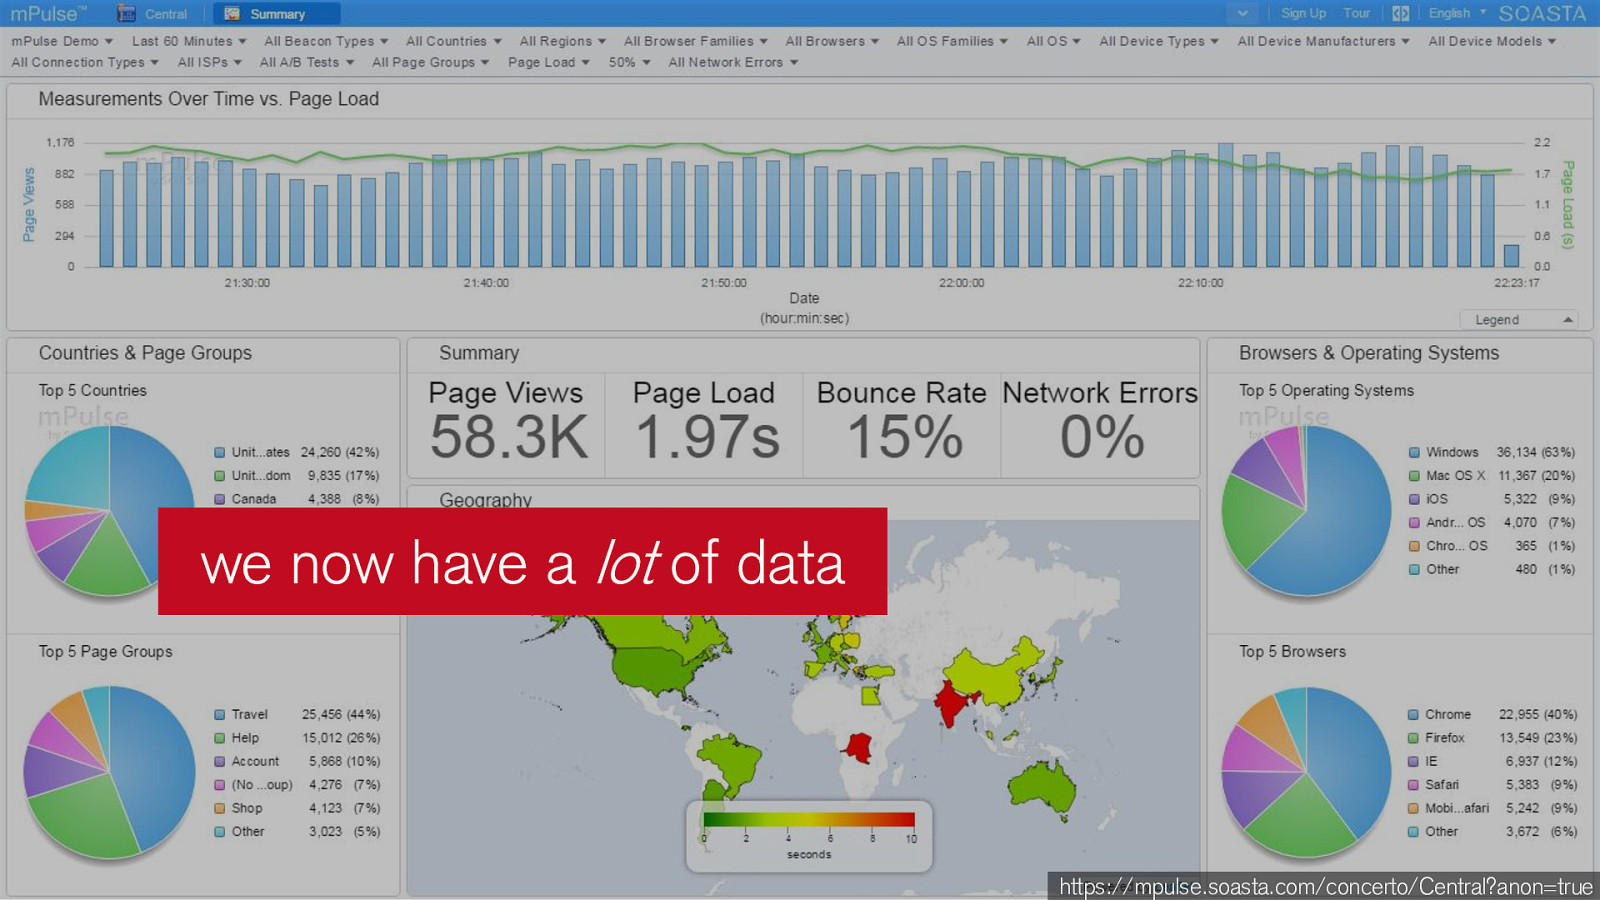
So what about web performance?
we now have a lot
of data
https://mpulse.soasta.com/concerto/Central?anon=true
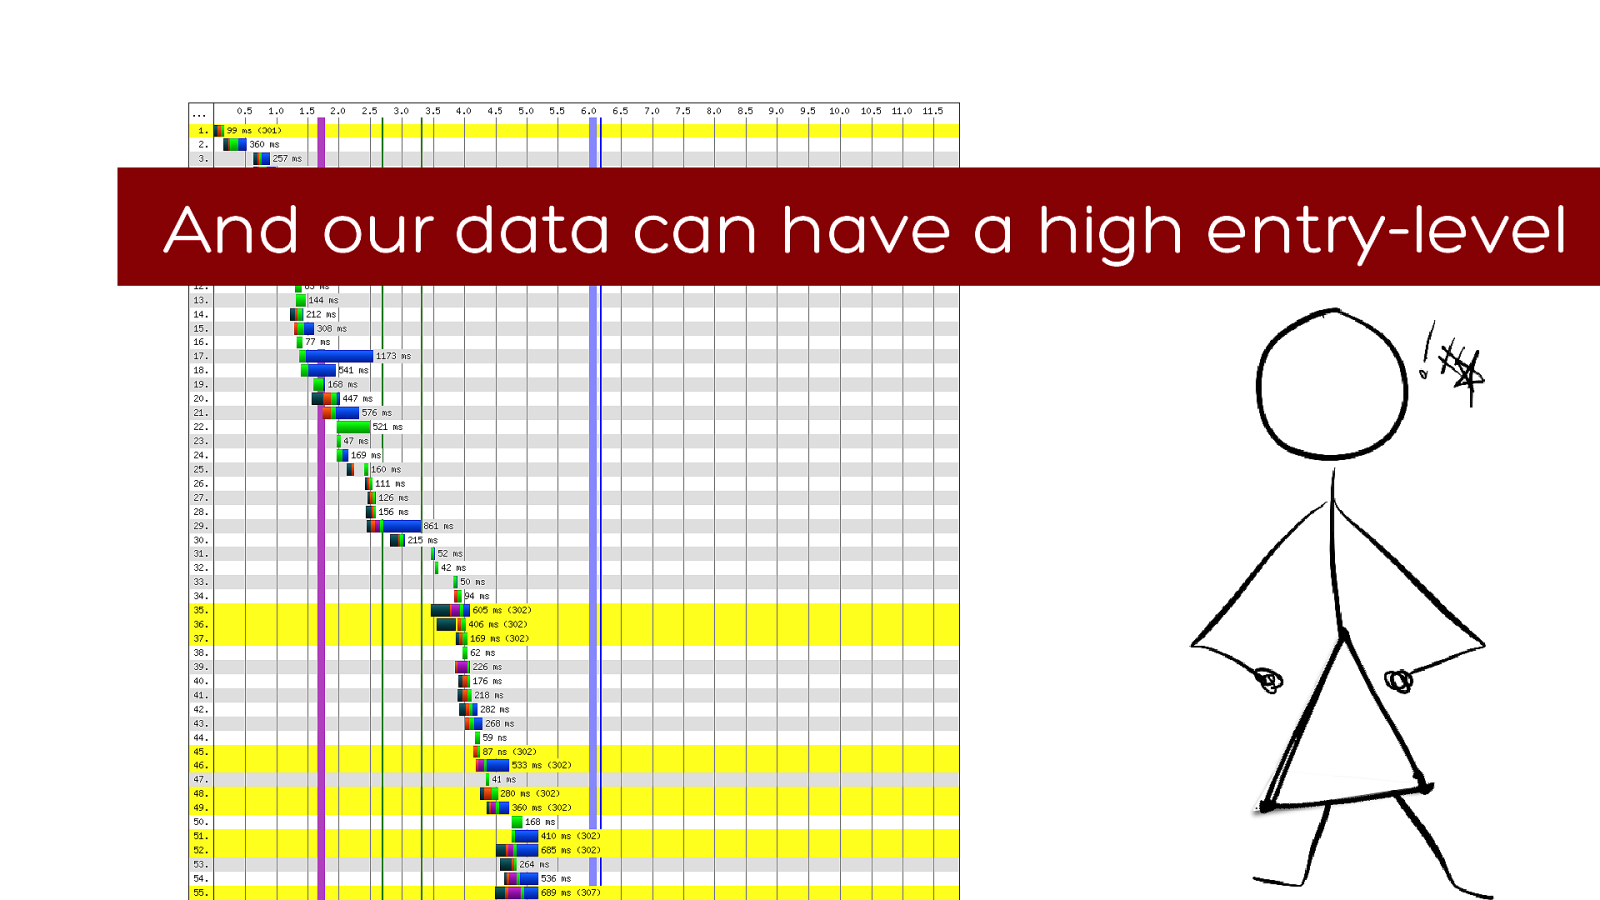
level
It doesn’t have to be this way…
it is imperative that we present our data well in a business context
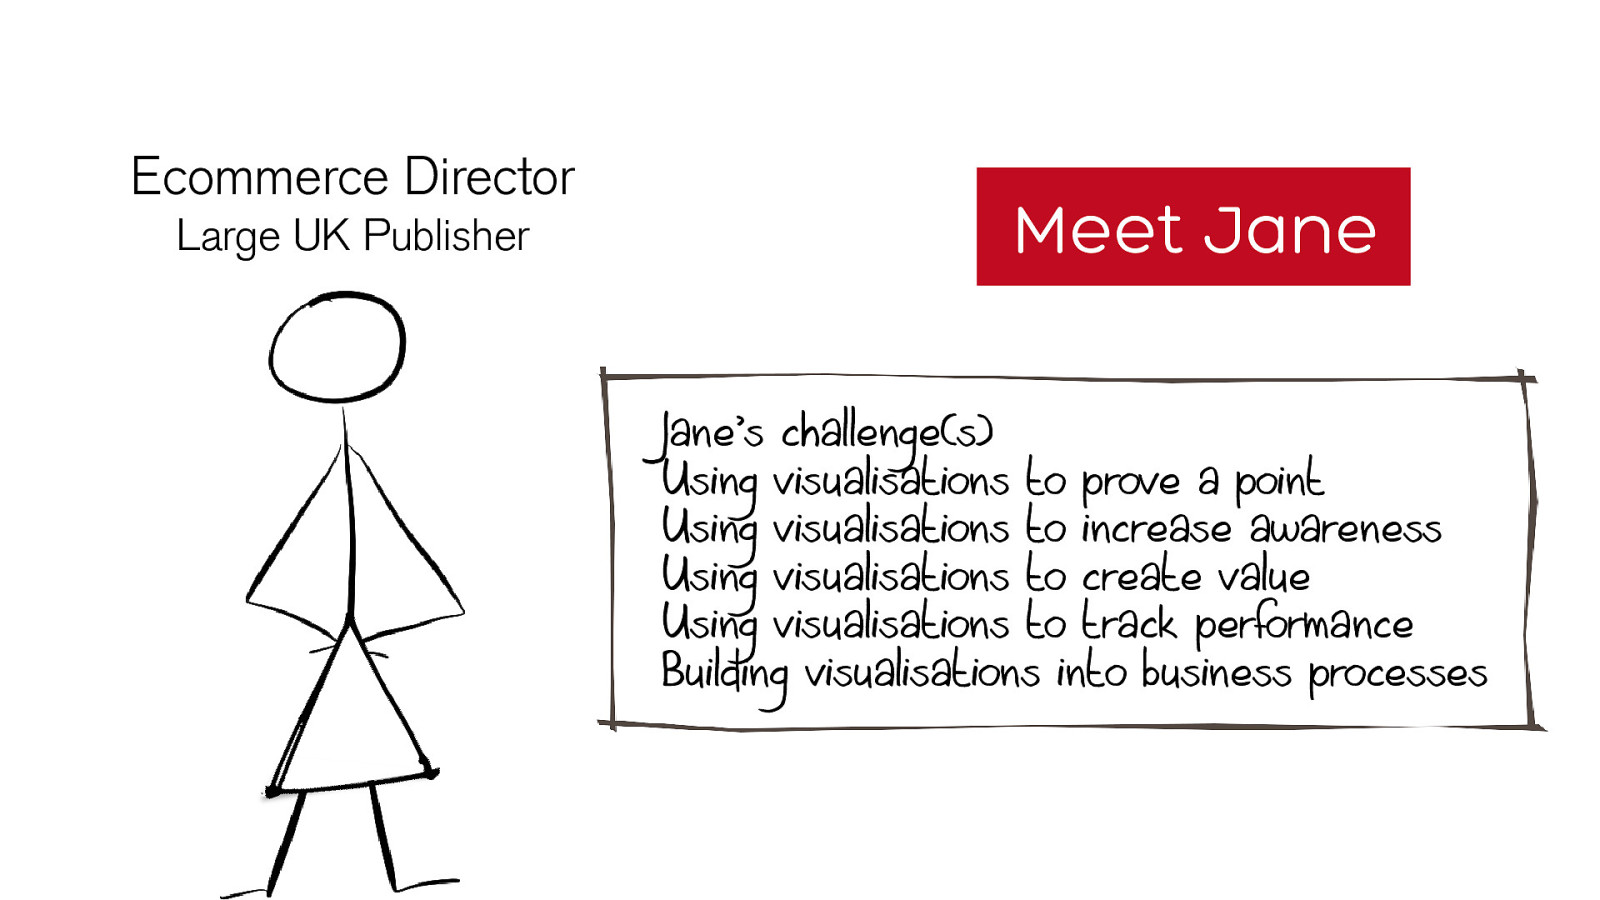
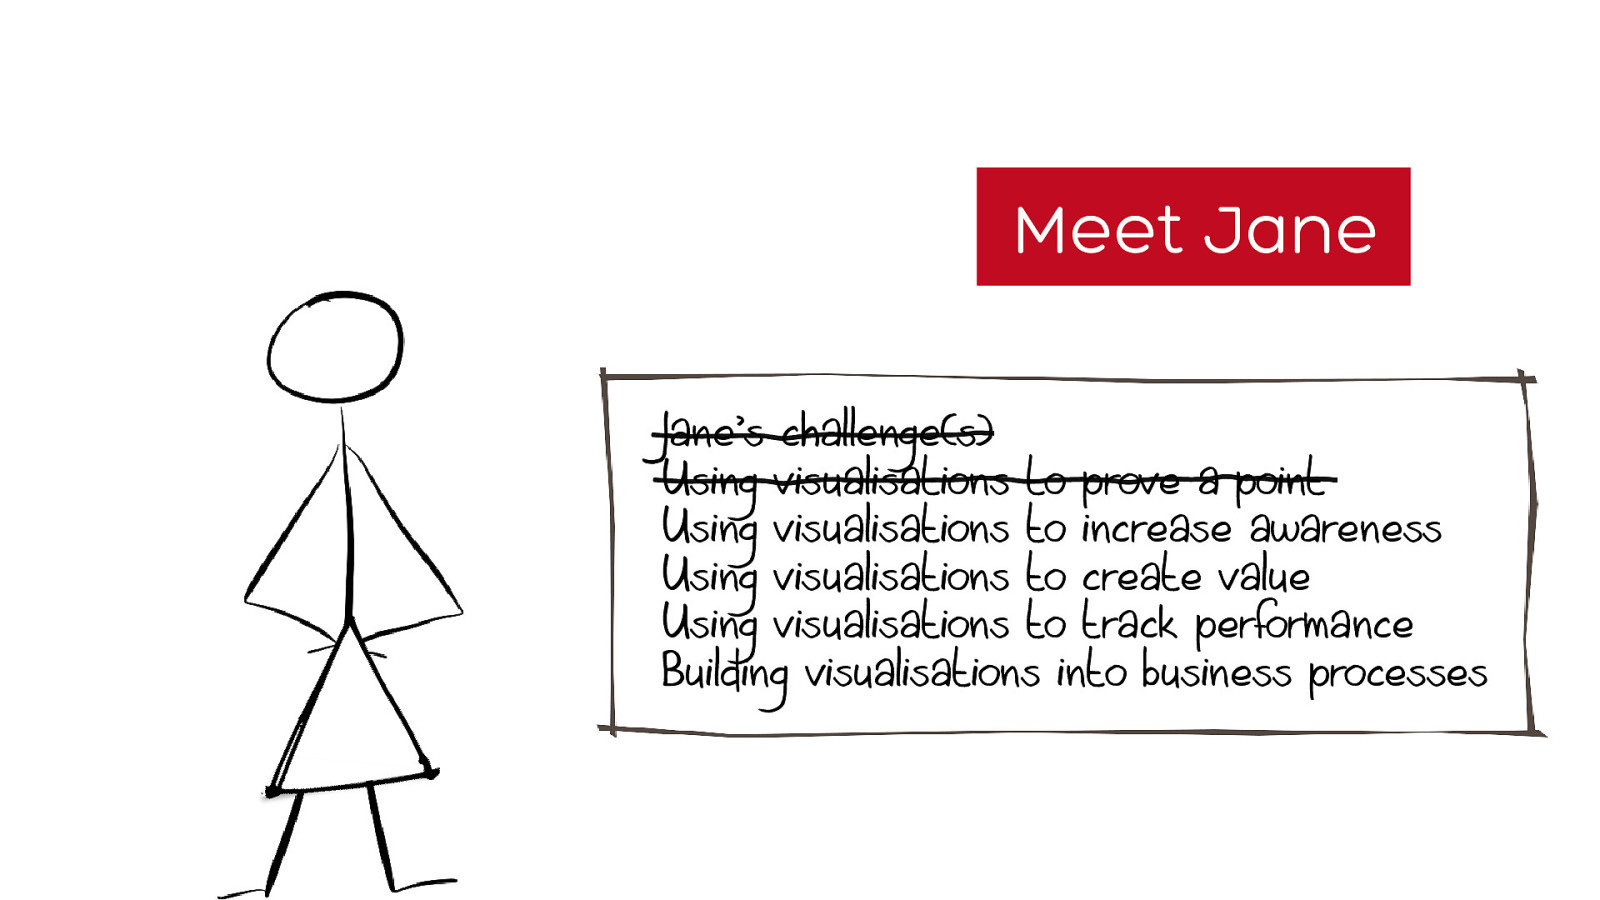
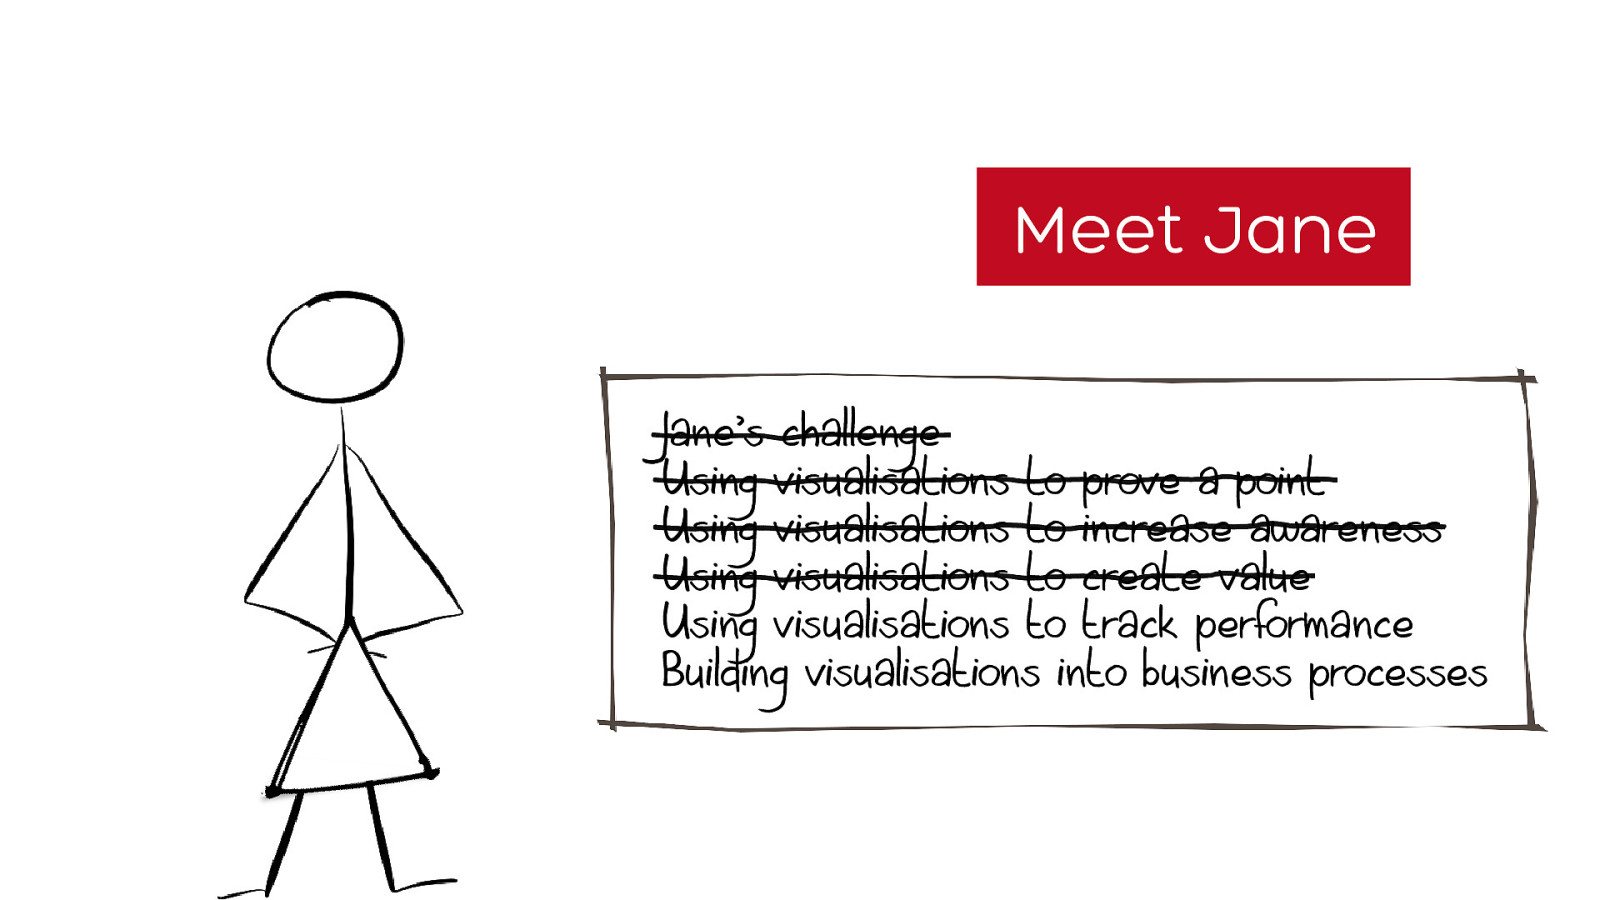
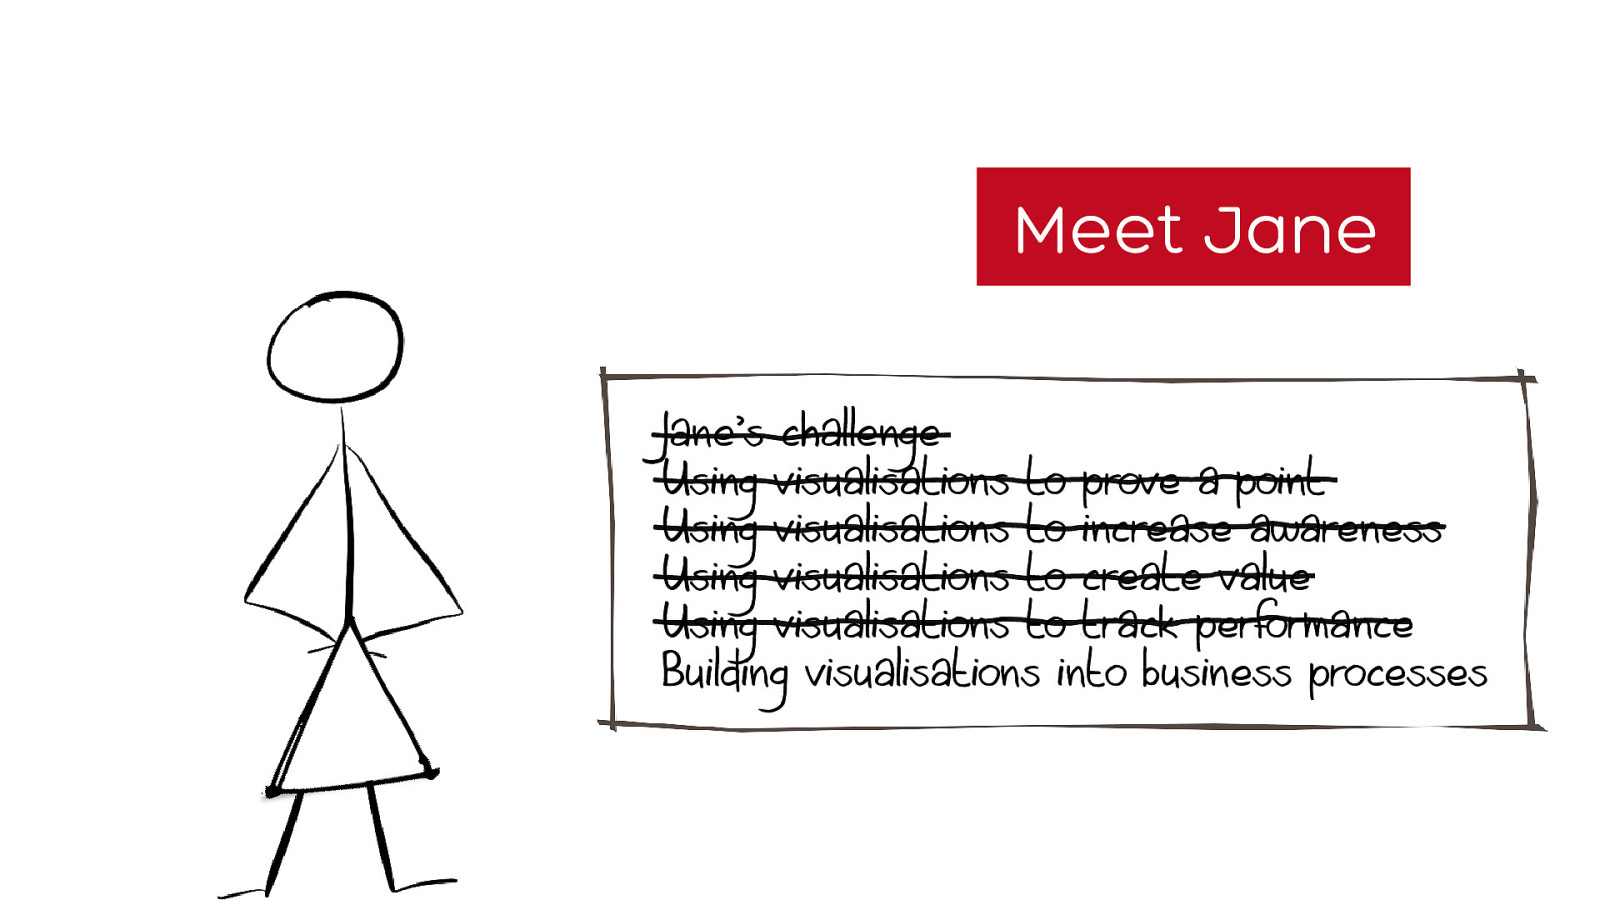
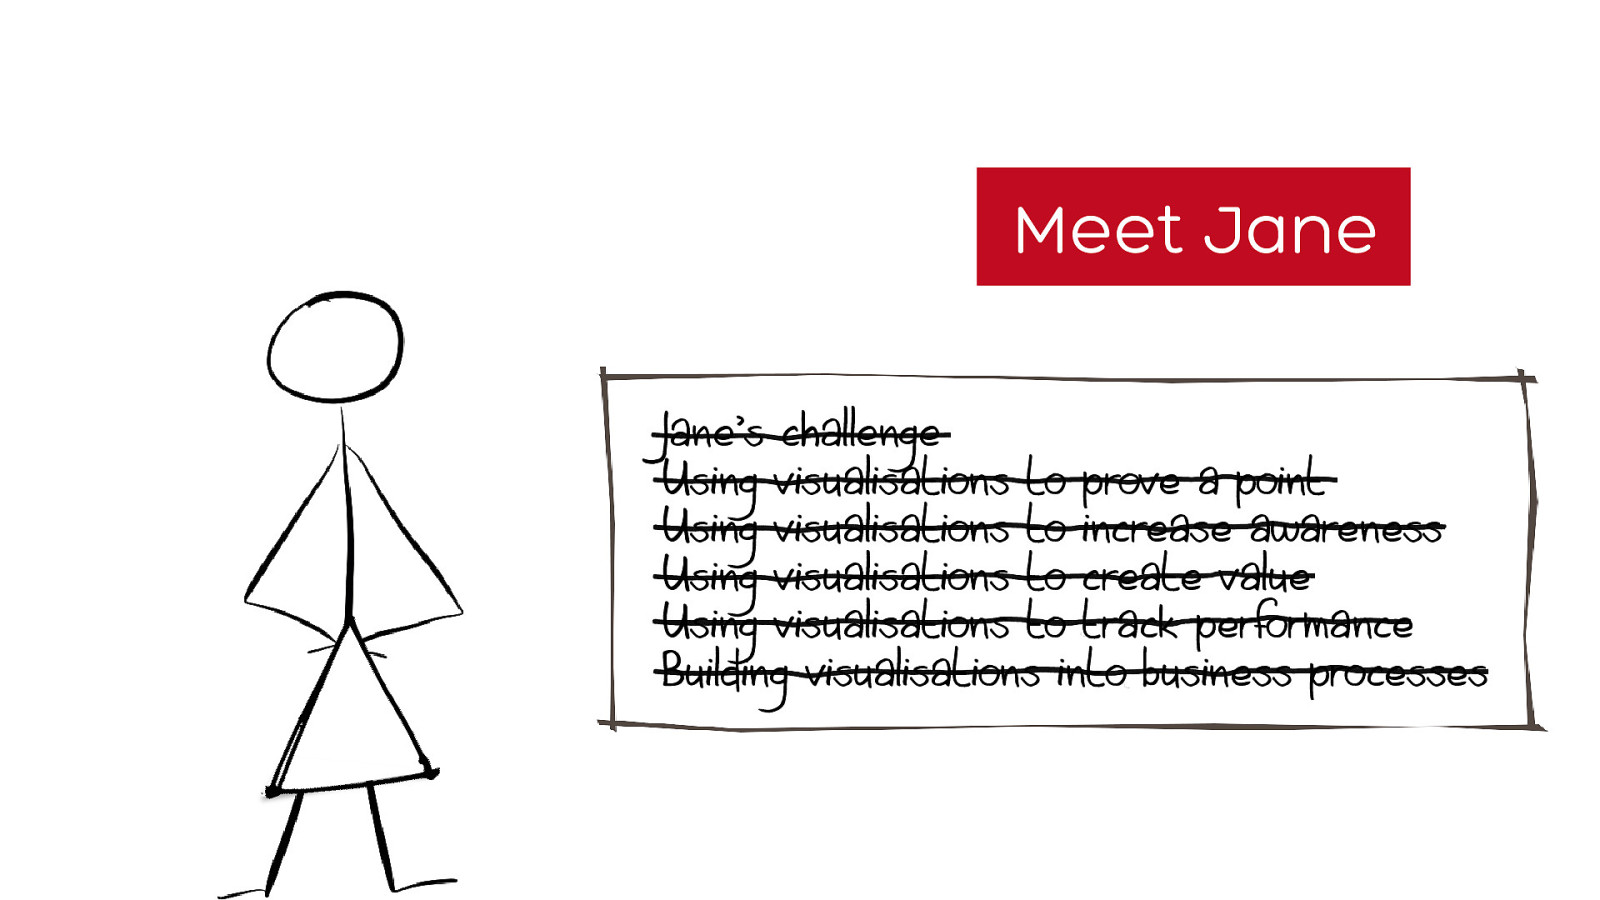
Meet Jane
Jane’s challenge(s)
Using visualisations to prove a point
Using visualisations to increase awareness
Using visualisations to create value
Using visualisations to track performance
Building visualisations into business processes
Ecommerce Director
Large UK Publisher
Publishing is changing
party management strategy”
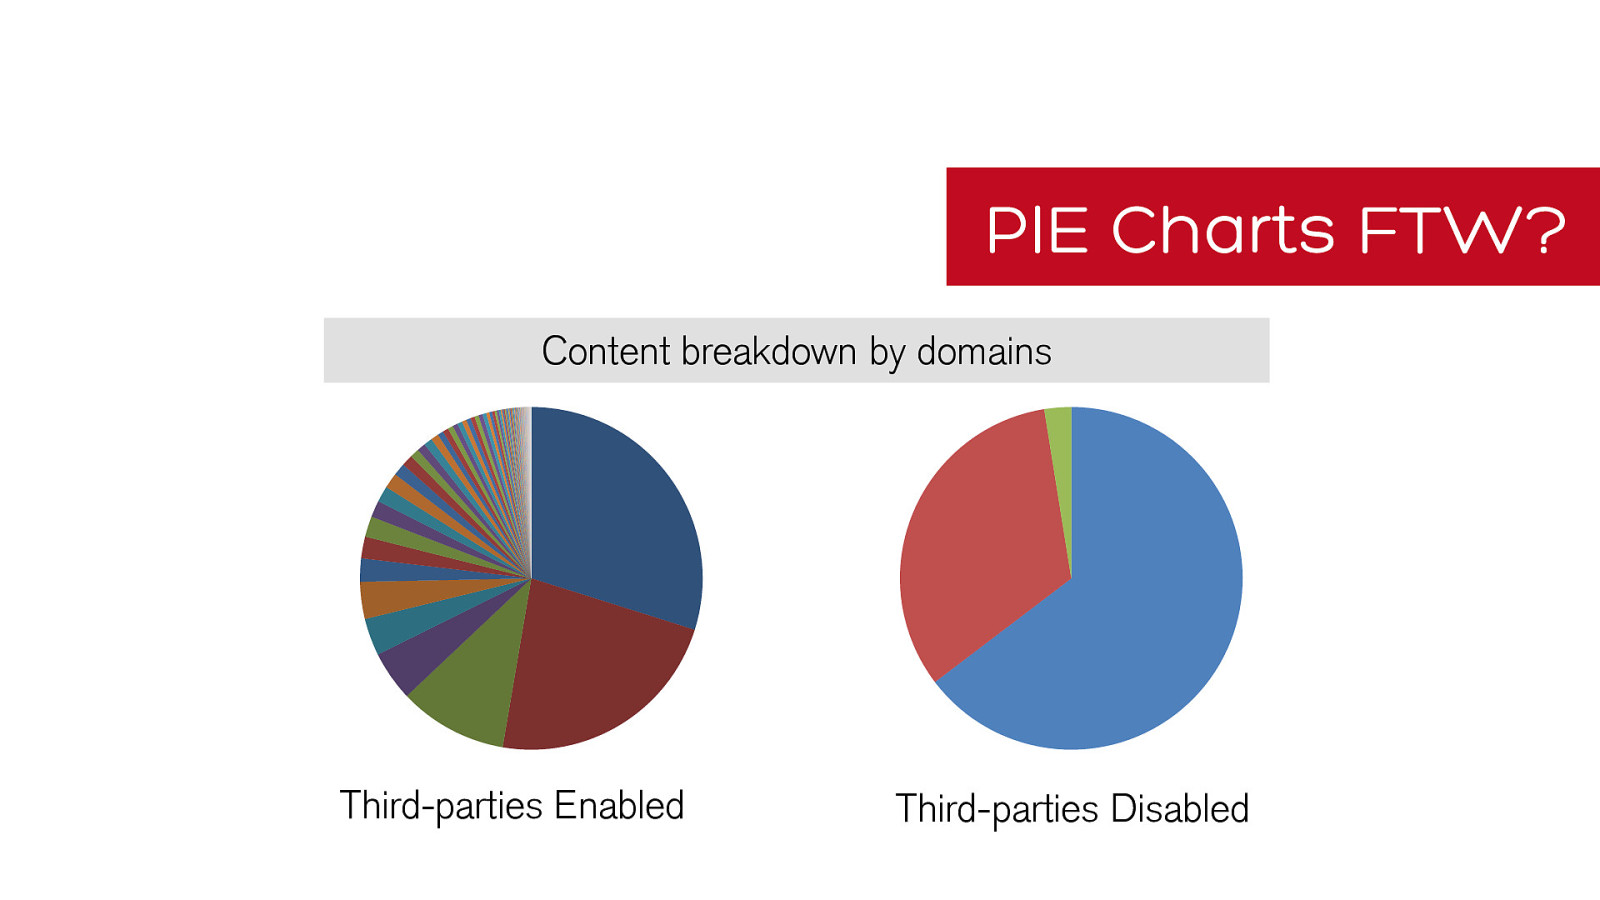
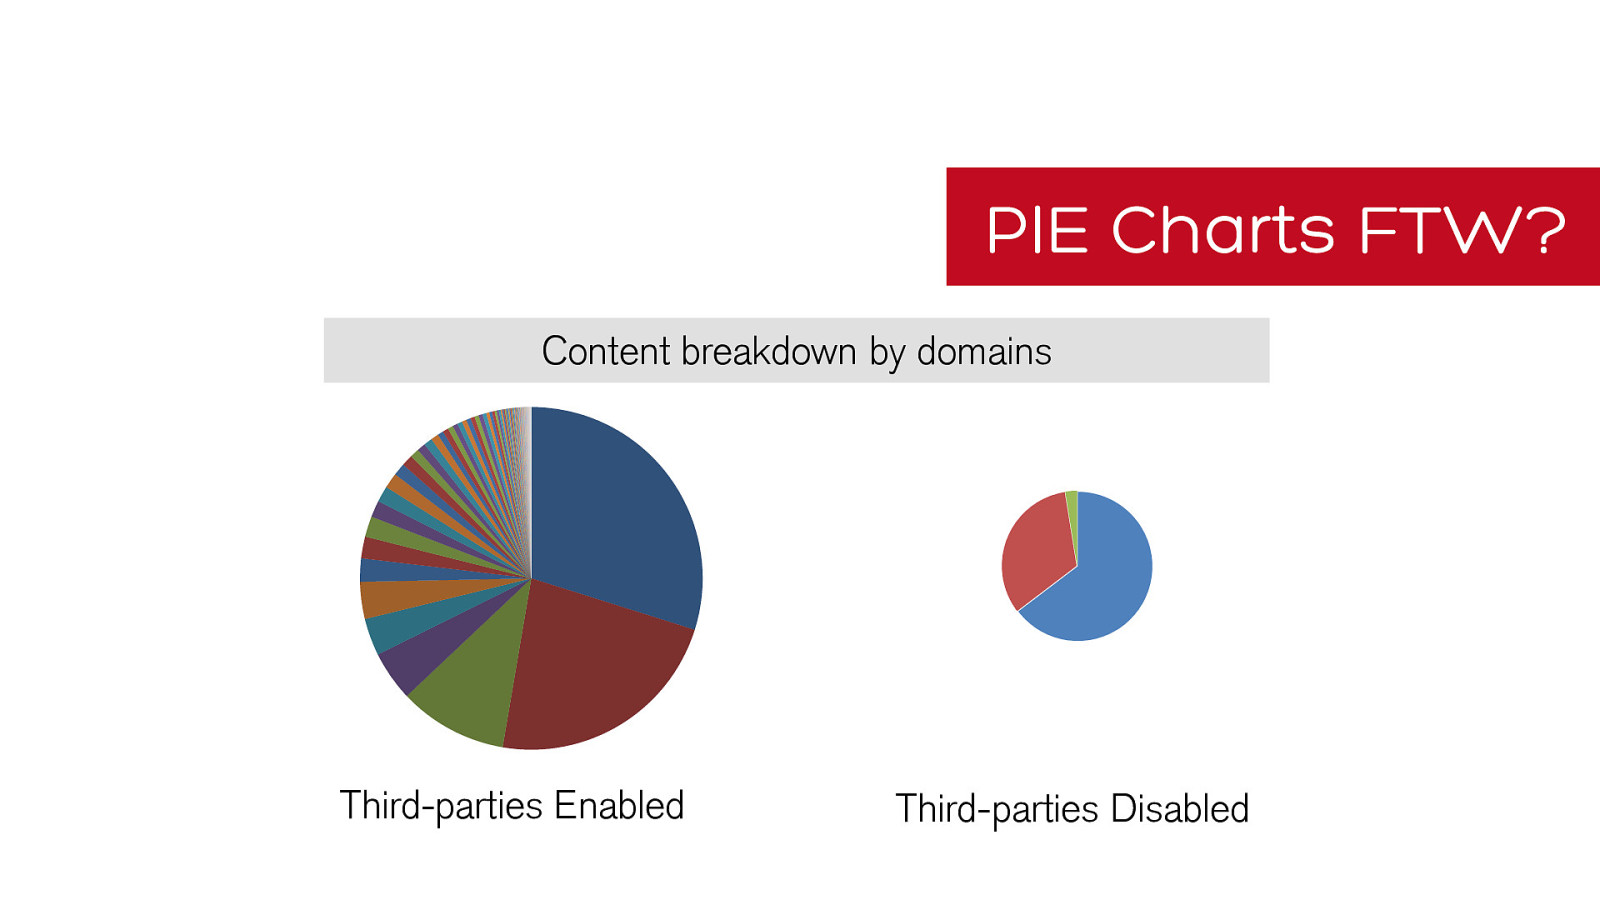
PIE Charts FTW?
parties Enabled
parties Disabled
Content breakdown by domains
PIE Charts FTW?
parties Enabled
parties Disabled
Content breakdown by domains
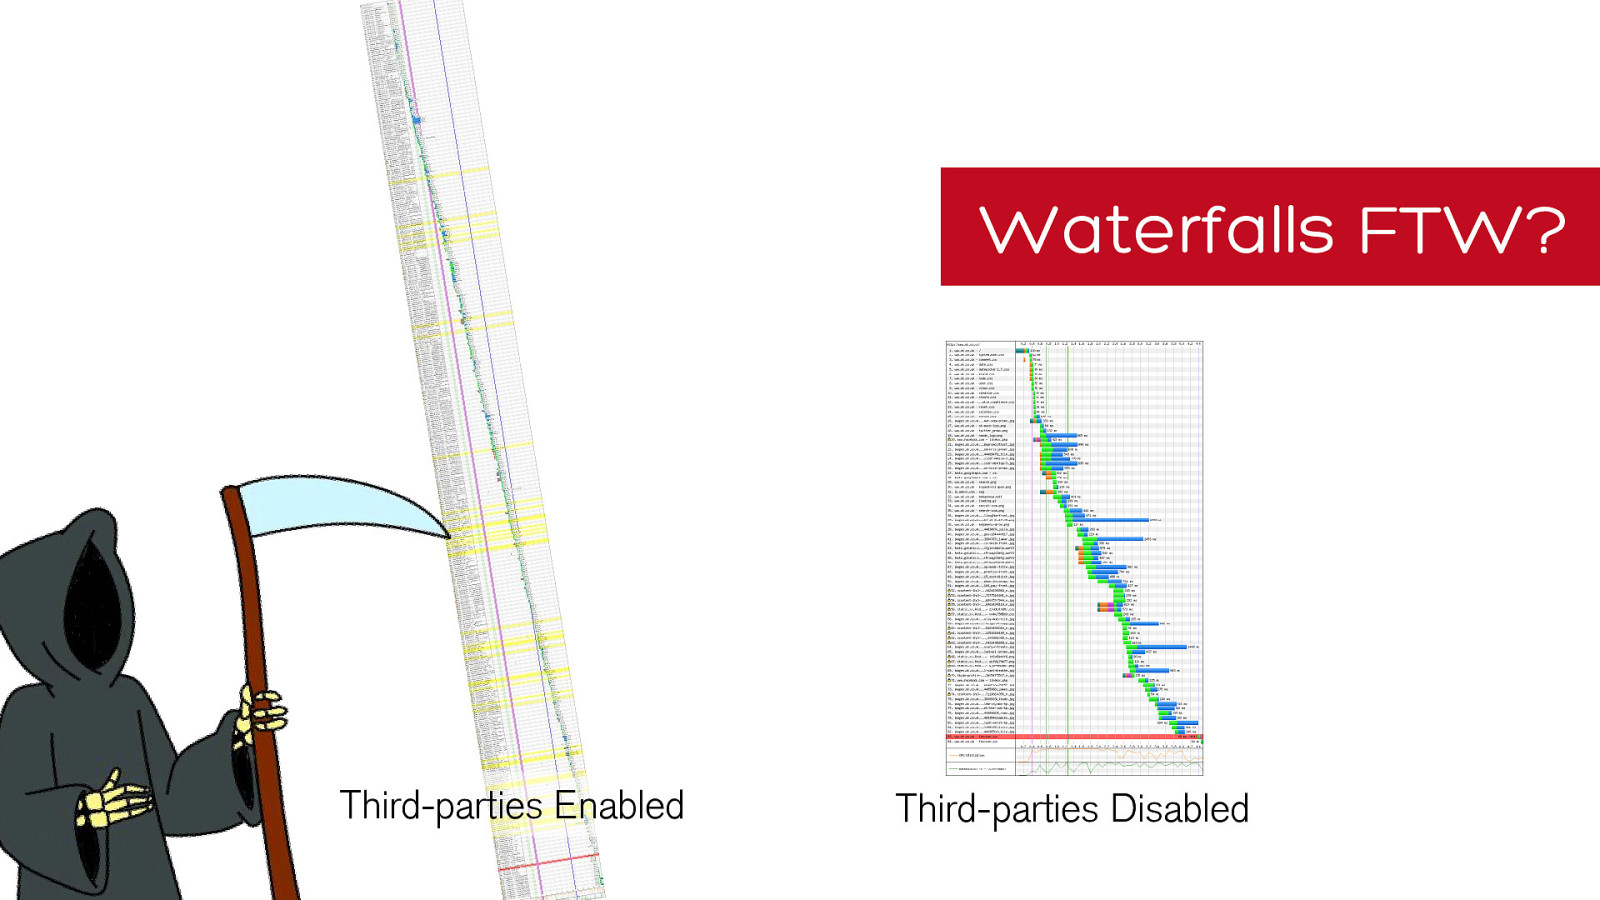
Waterfalls FTW?
parties Enabled
parties Disabled
Domain cloud by # requests
wordle.net
wordle.net
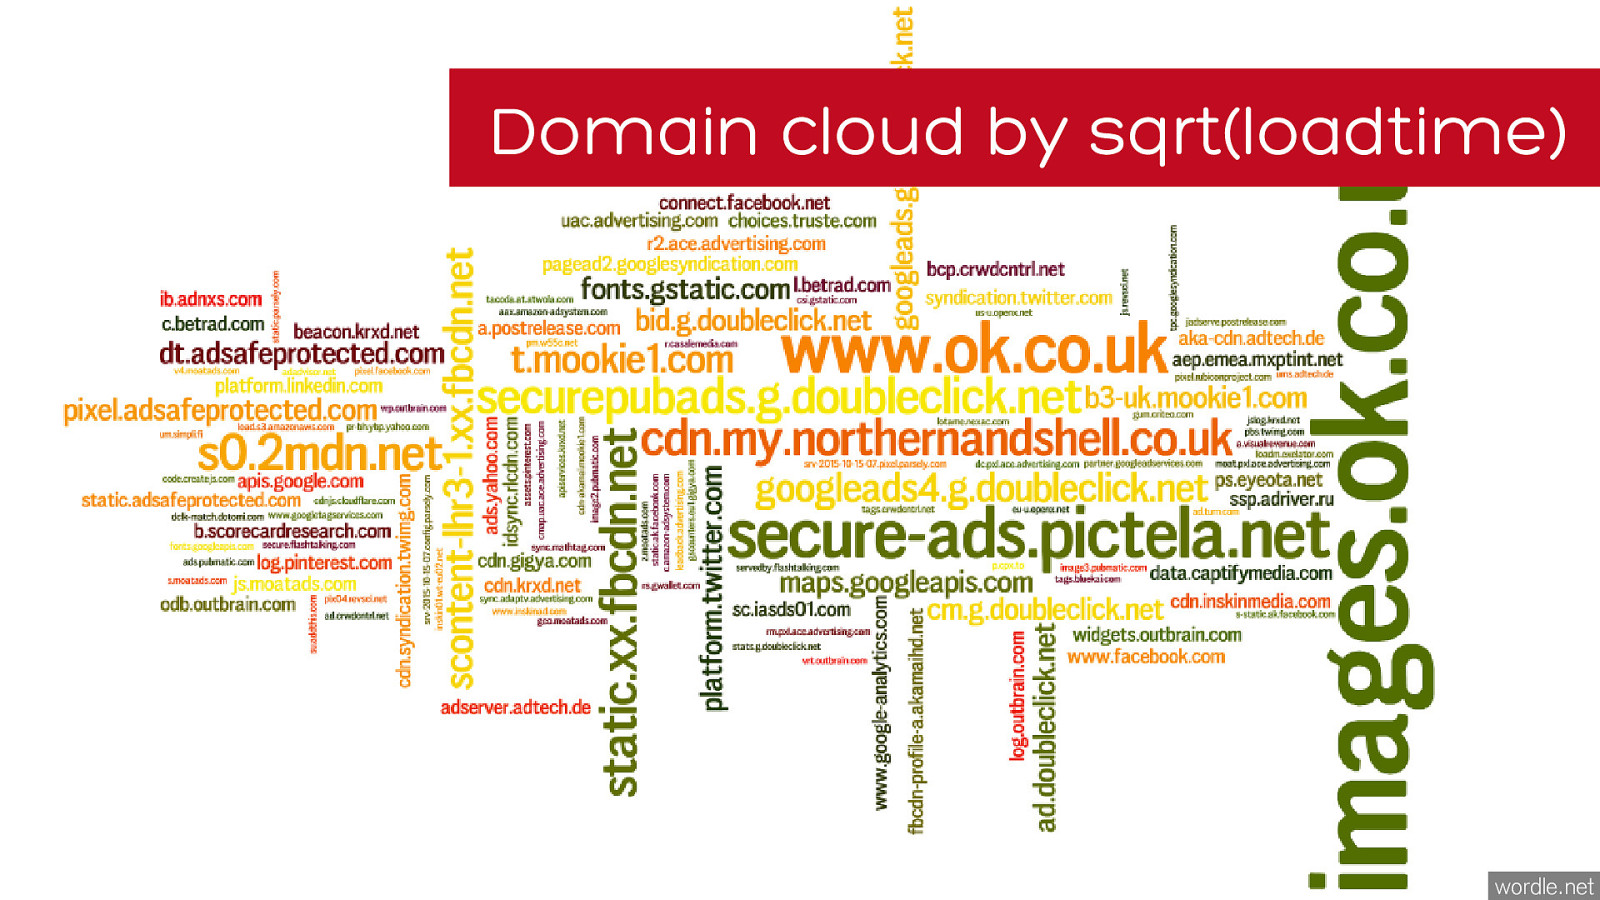
Domain cloud by sqrt ( loadtime )
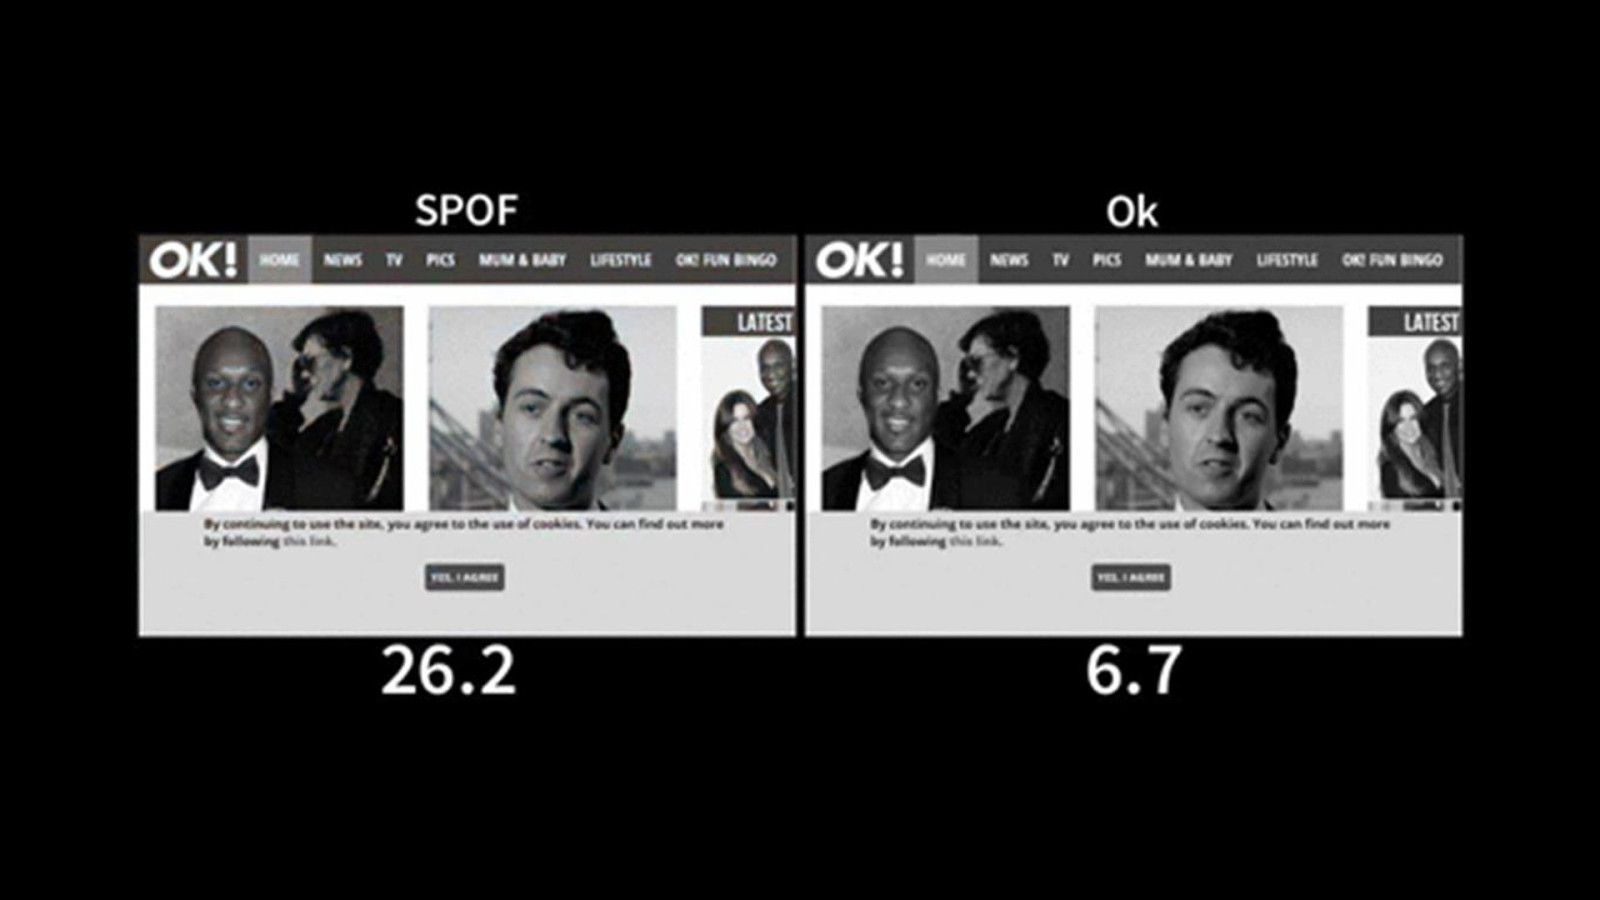
“The Last Resort”
Success!
Meet Jane
Jane’s challenge(s)
Using visualisations to prove a point
Using visualisations to increase awareness
Using visualisations to create value
Using visualisations to track performance
Building visualisations into business processes
parties!”
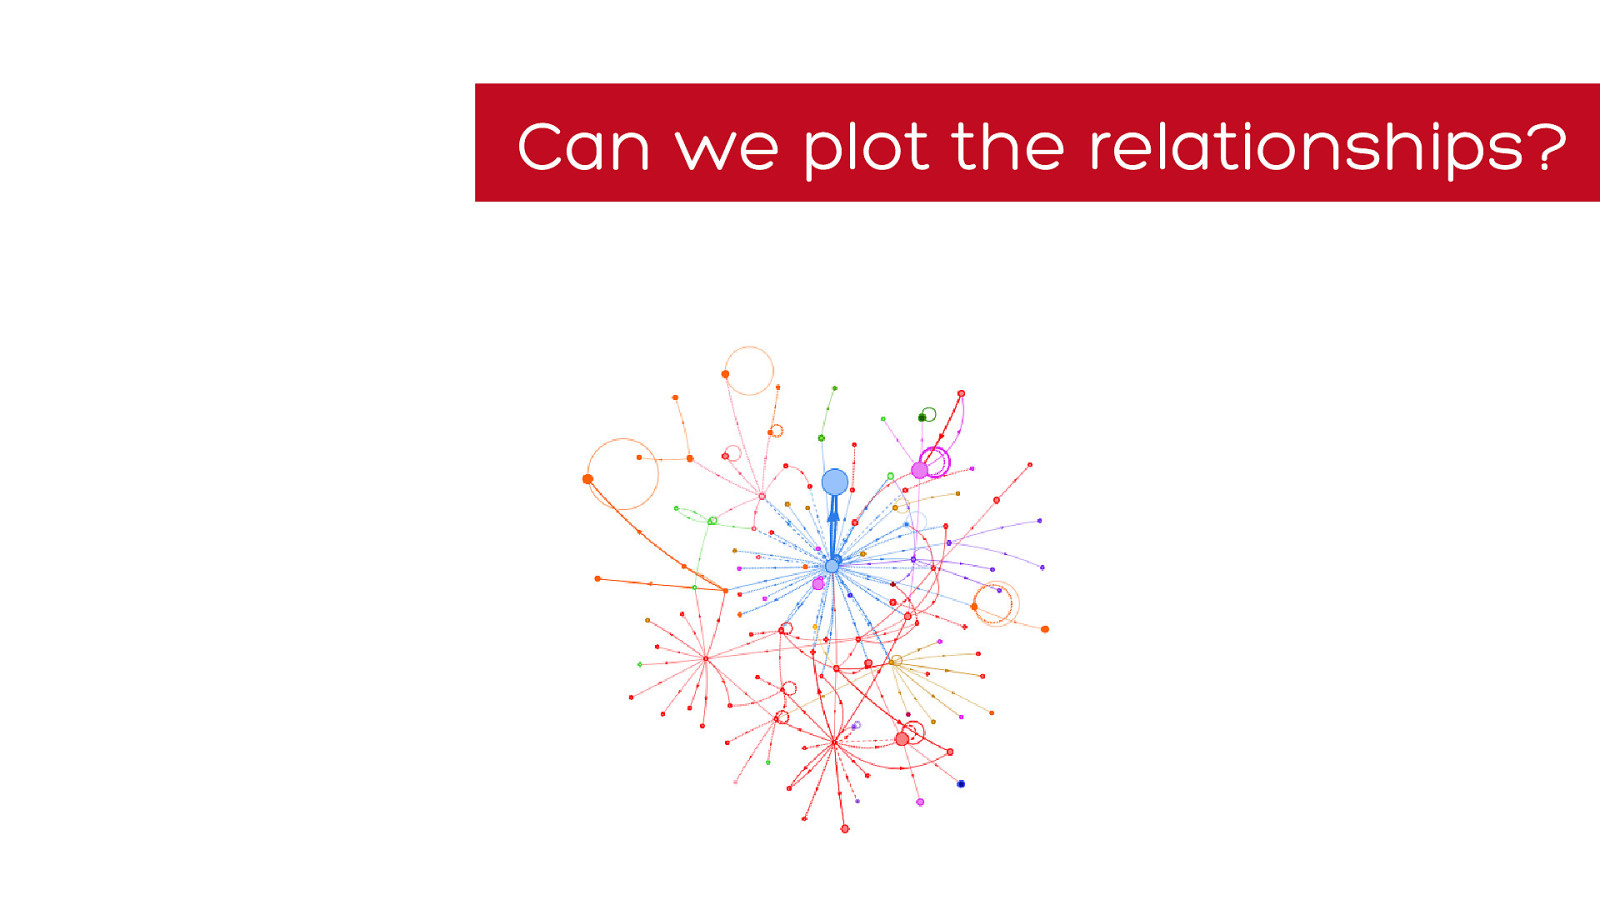
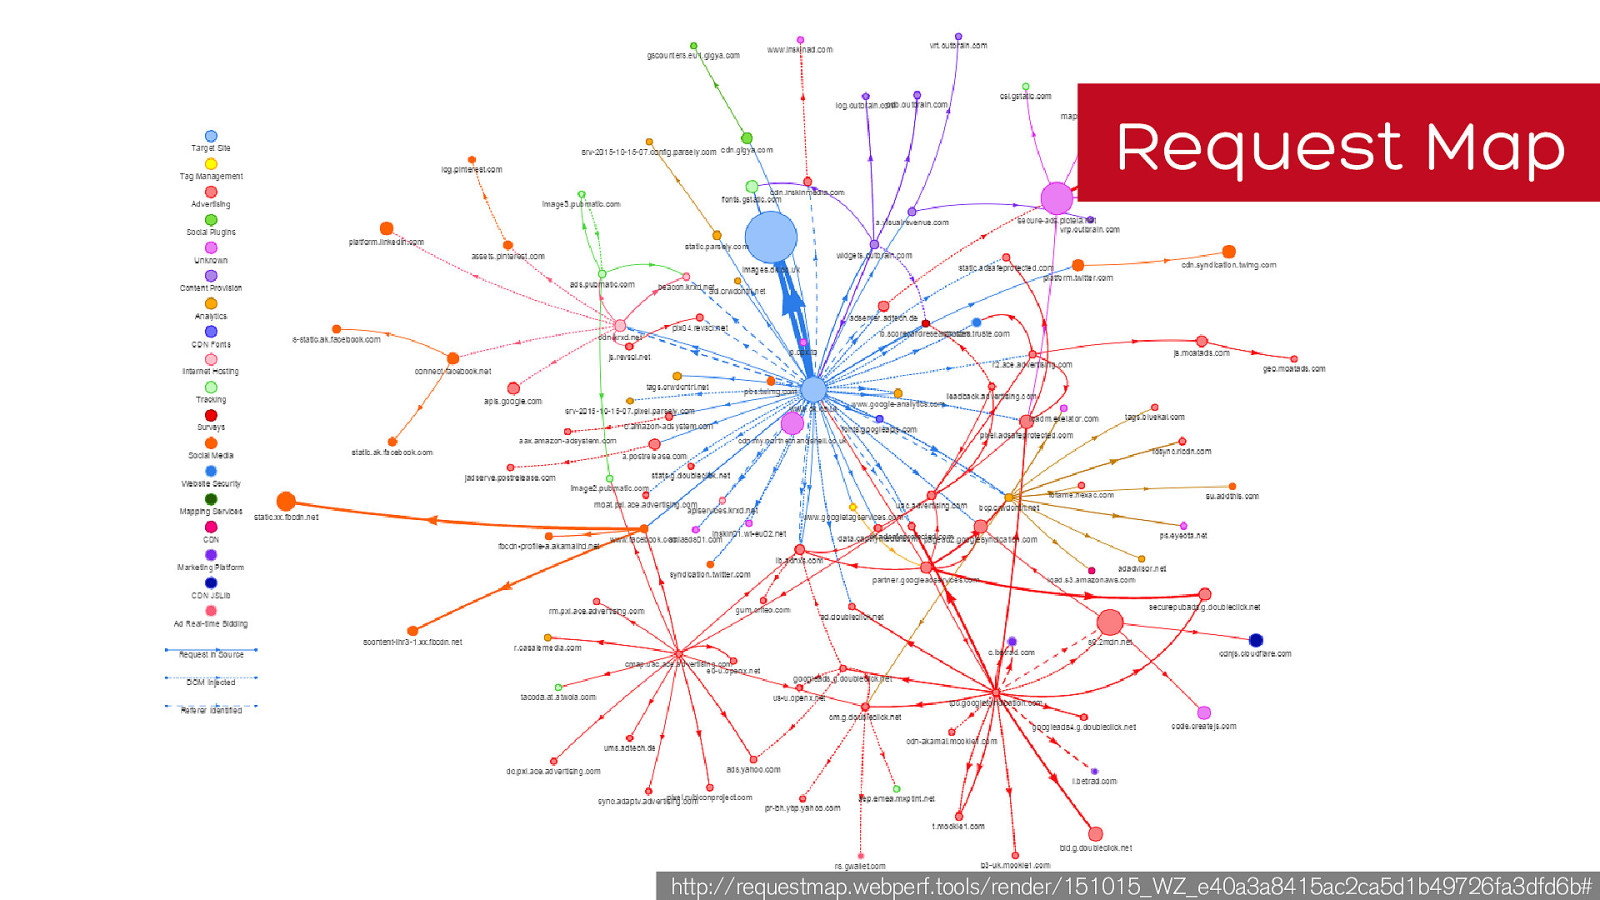
Can we plot the relationships?
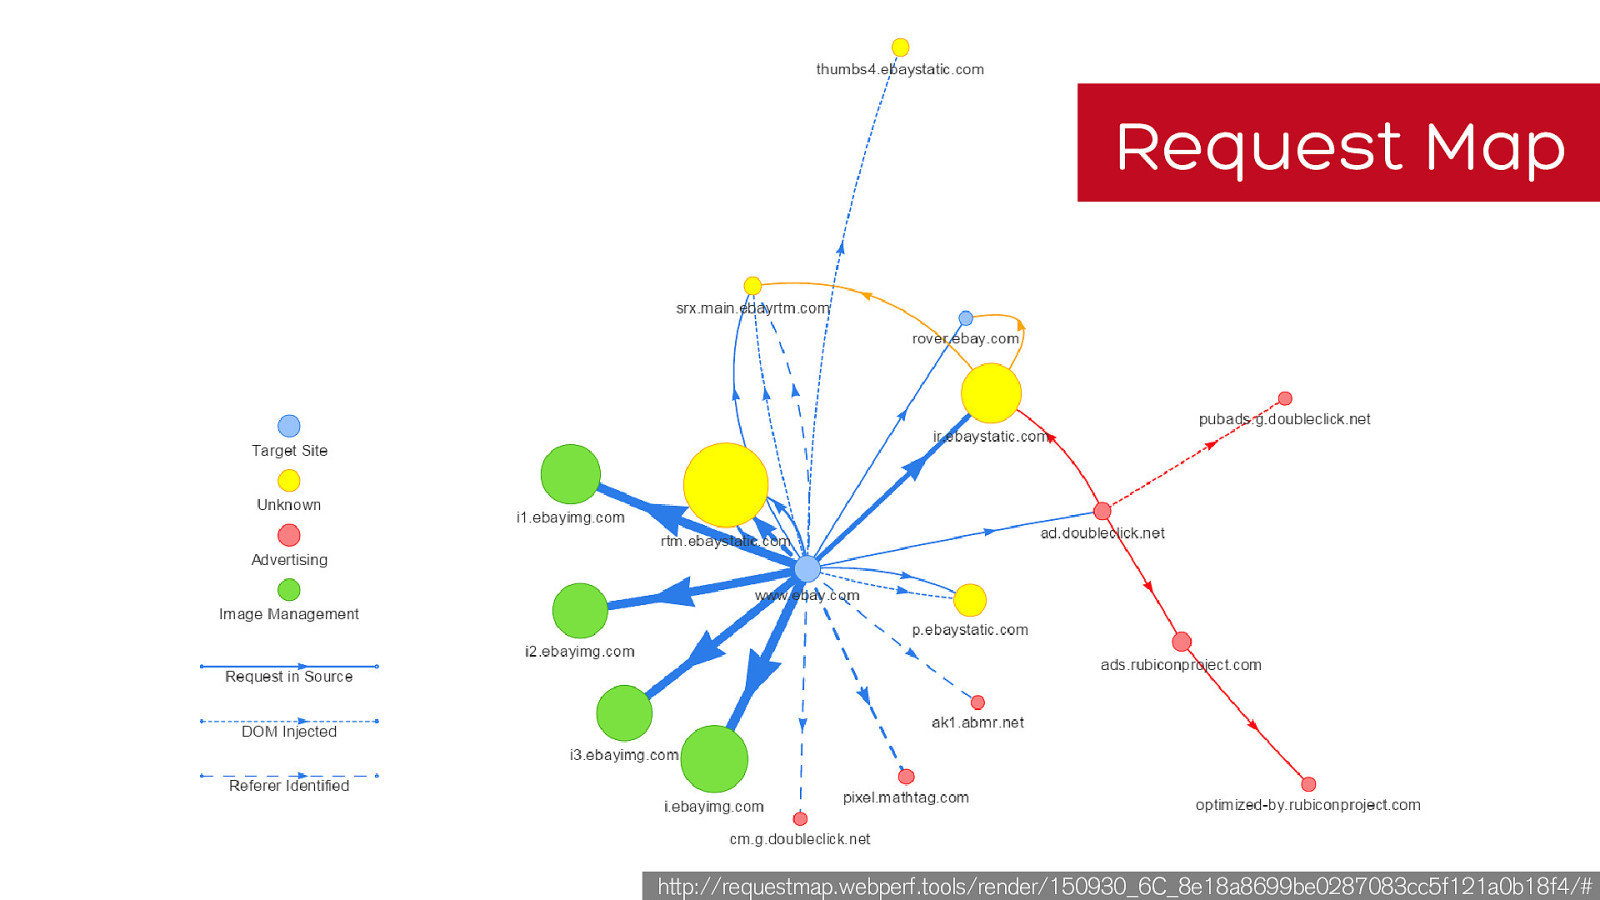
Request Map
http://requestmap.webperf.tools/render/150930_6C_8e18a8699be0287083cc5f121a0b18f4/#
Request Map
http://requestmap.webperf.tools/render/151015_WZ_e40a3a8415ac2ca5d1b49726fa3dfd6b#
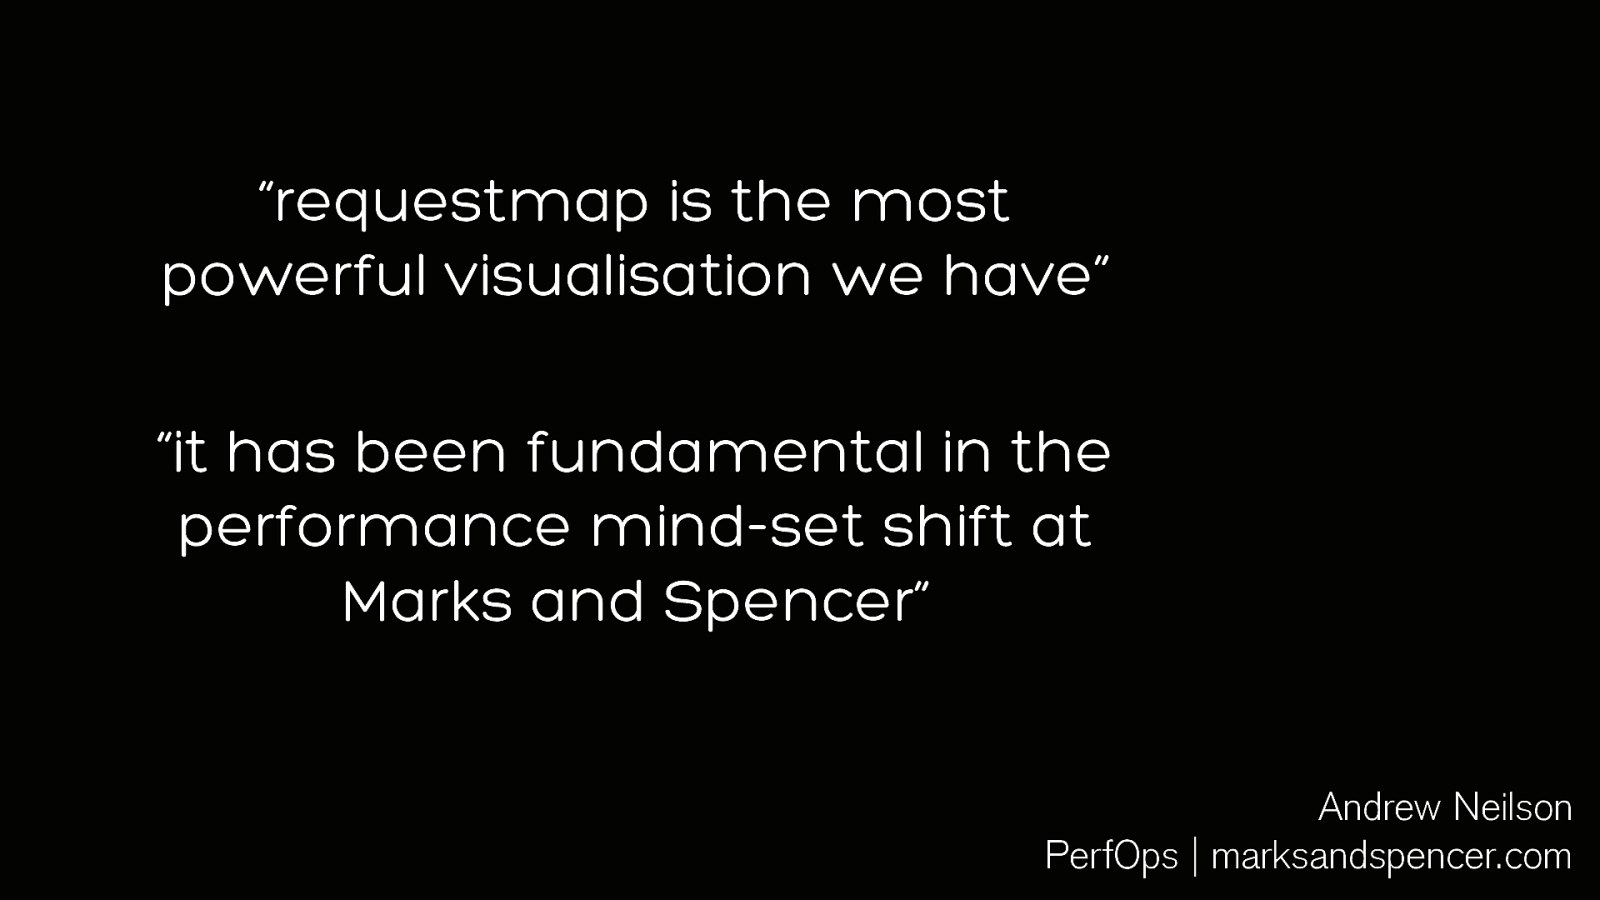
“ requestmap
is the most powerful visualisation we have”
set shift at Marks and Spencer”
Andrew Neilson
PerfOps
| marksandspencer.com
Meet Jane
Jane’s challenge
Using visualisations to prove a point
Using visualisations to increase awareness
Using visualisations to create value
Using visualisations to track performance
Building visualisations into business processes
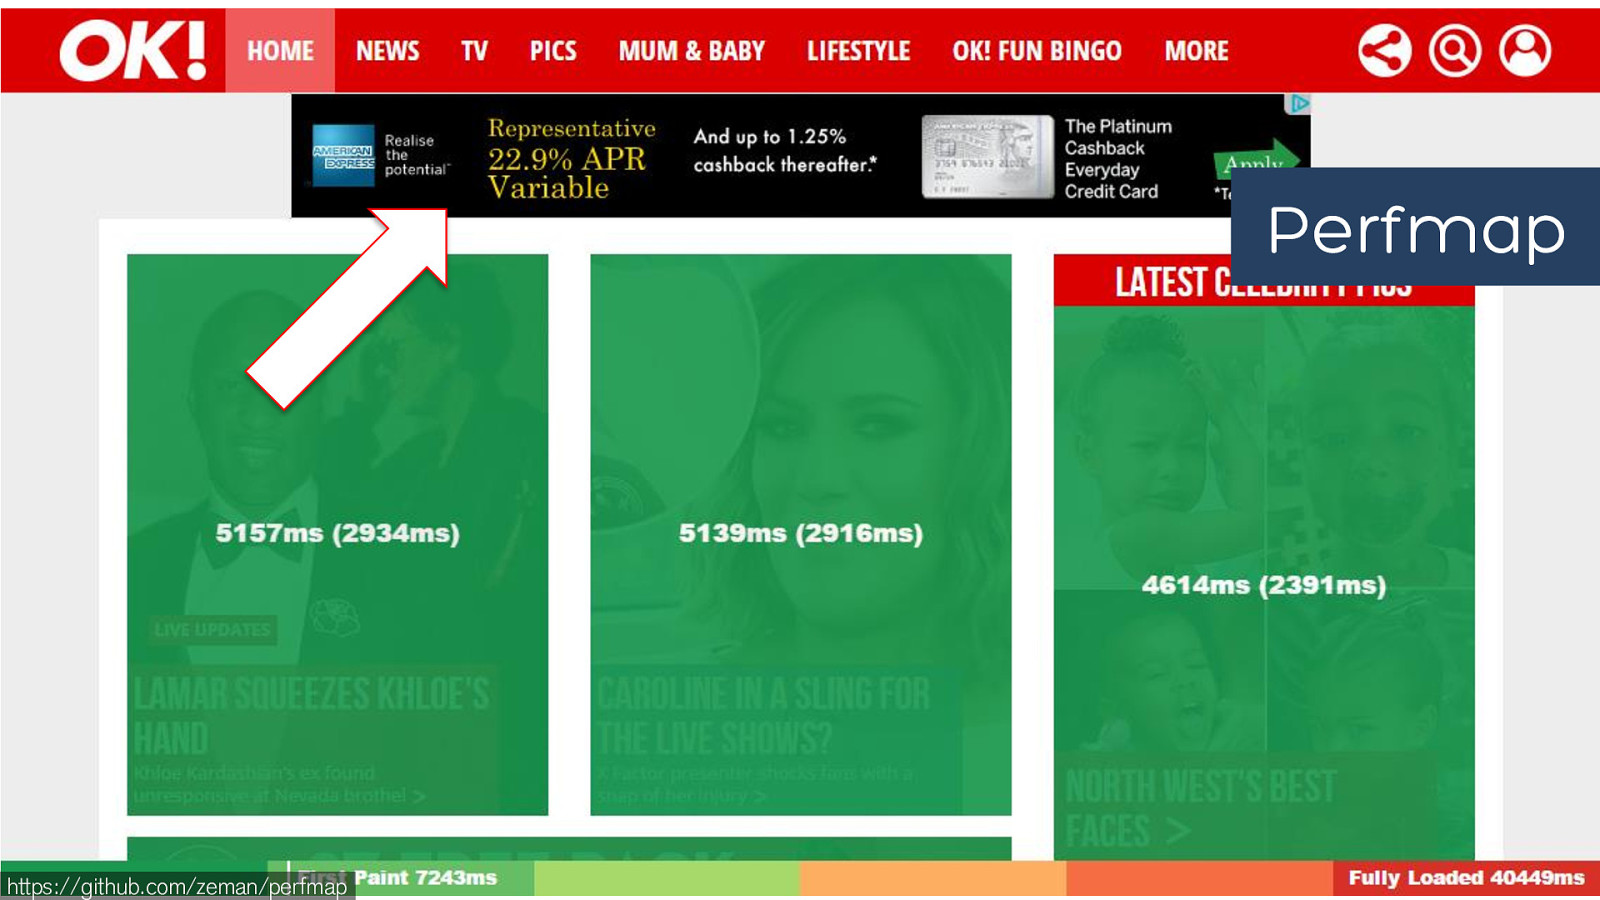
We need the ads for revenue
$$$
Can we show when the ads appear?
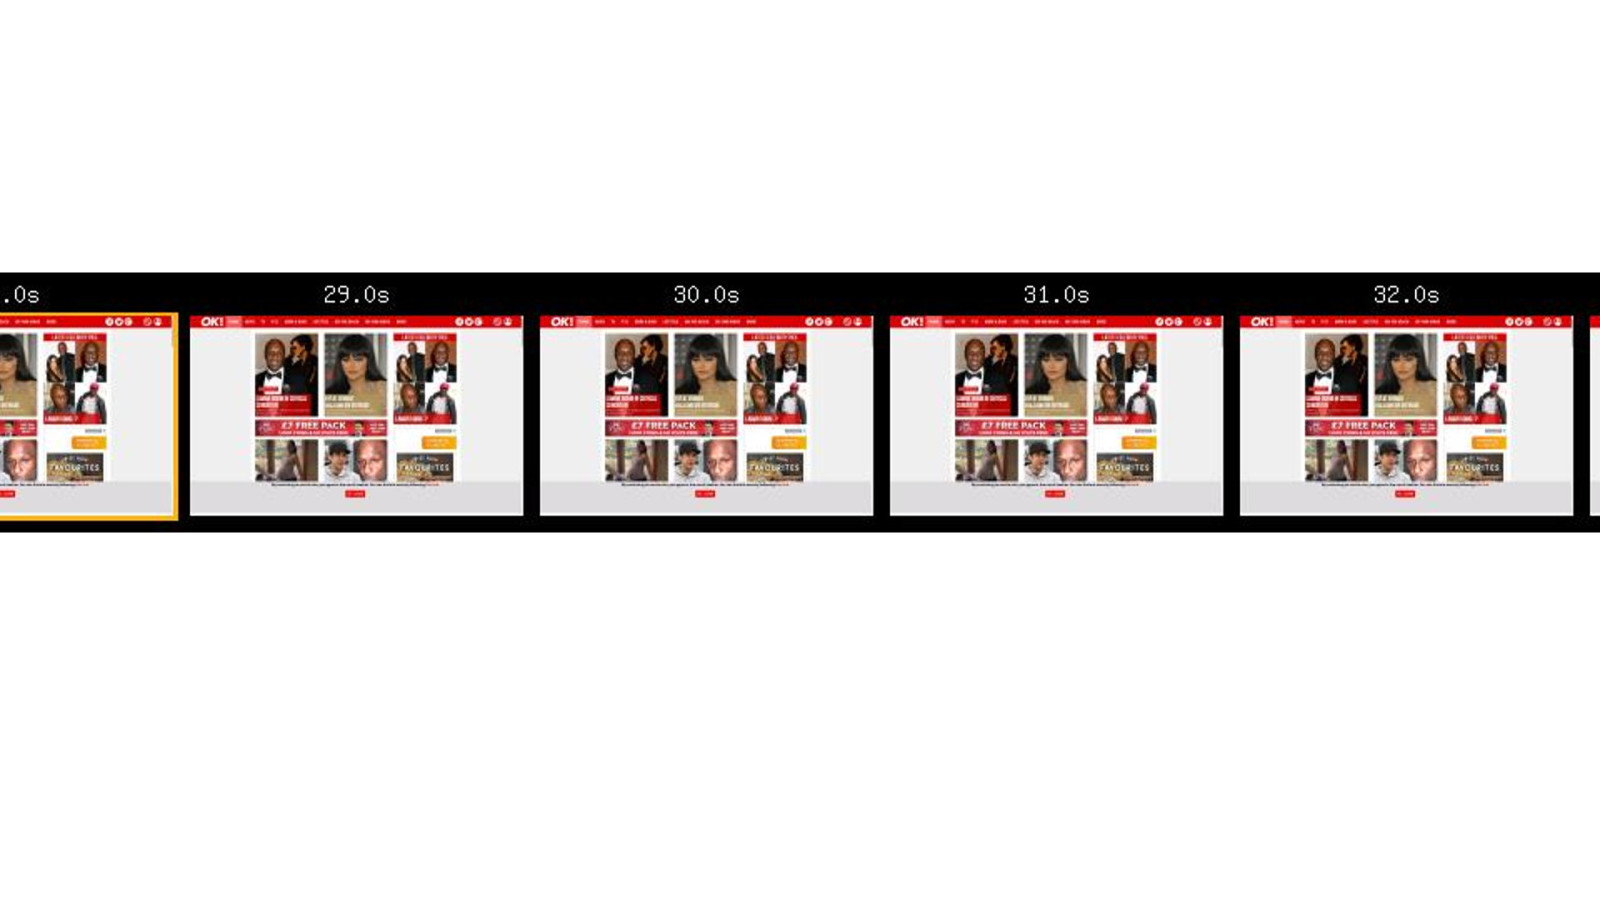
…without trawling filmstrips…
https://github.com/zeman/perfmap
Perfmap
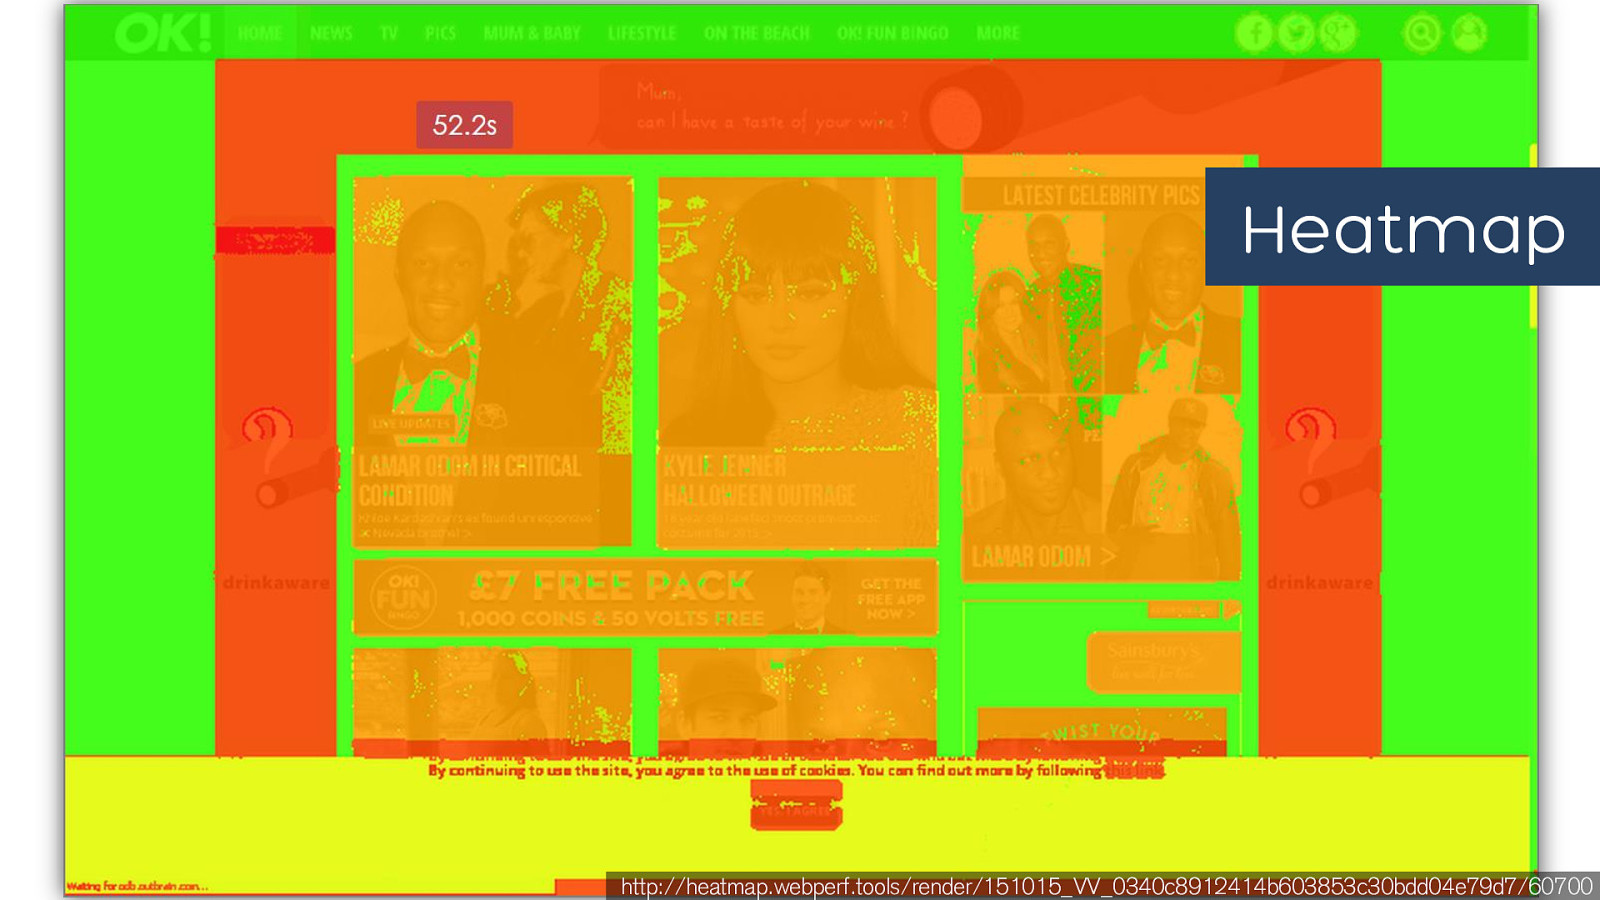
Heatmap
http://heatmap.webperf.tools/render/151015_VV_0340c8912414b603853c30bdd04e79d7/60700
sold to business
Meet Jane
Jane’s challenge
Using visualisations to prove a point
Using visualisations to increase awareness
Using visualisations to create value
Using visualisations to track performance
Building visualisations into business processes
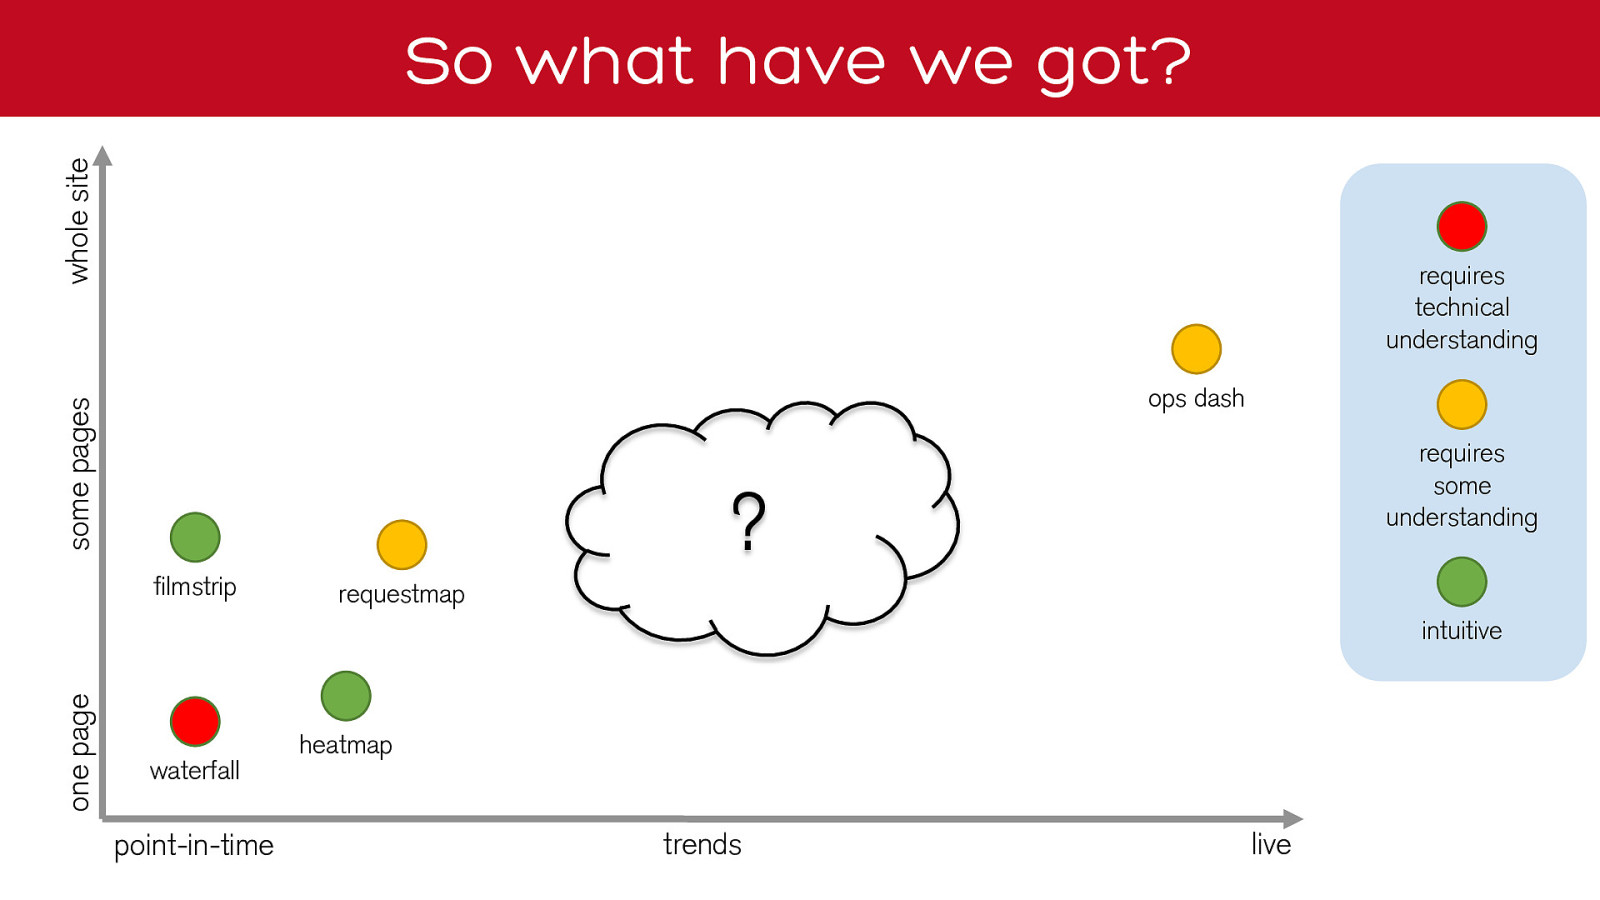
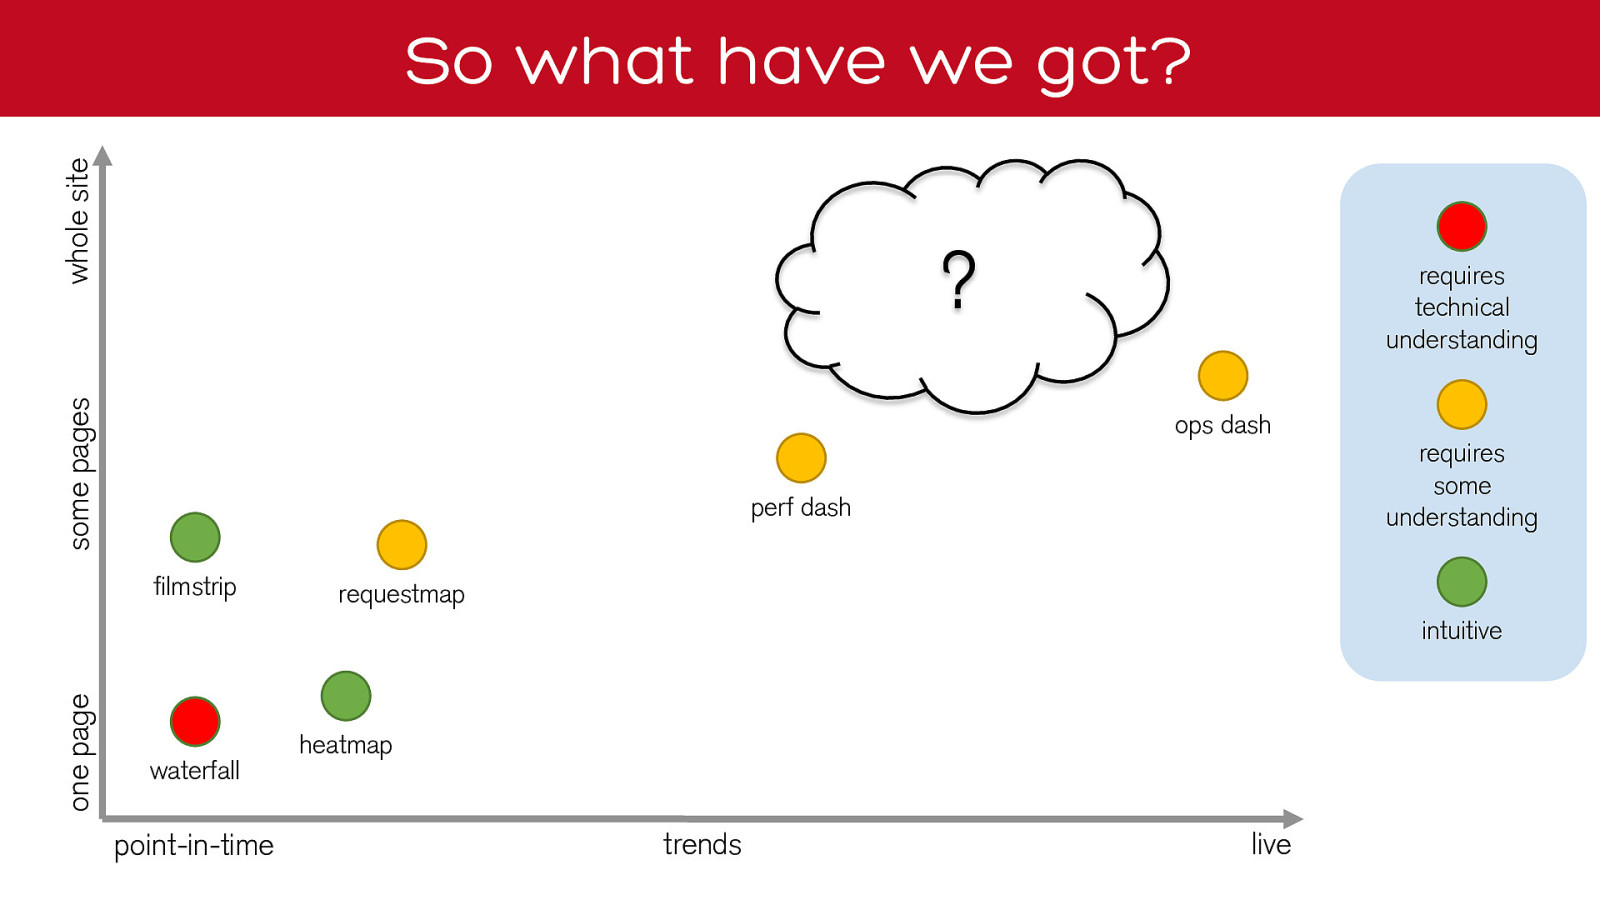
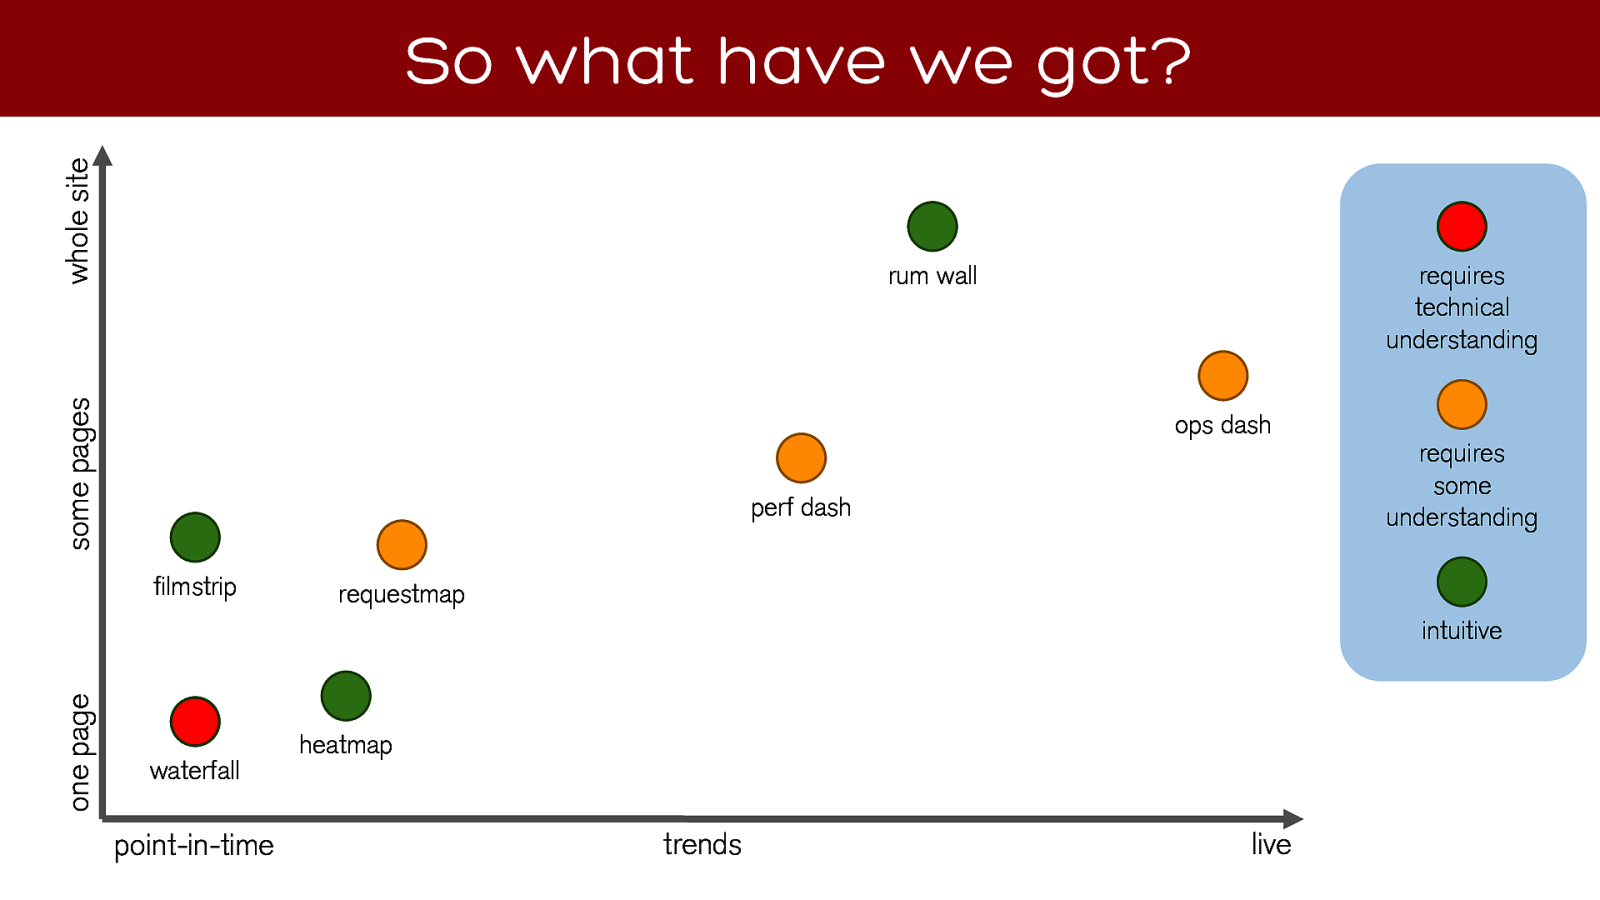
So what have we got?
time
live
trends
one page
whole site
some pages
requires
technical
understanding
requires
some
understanding
intuitive
waterfall
filmstrip
heatmap
requestmap
ops dash
?
metrics/
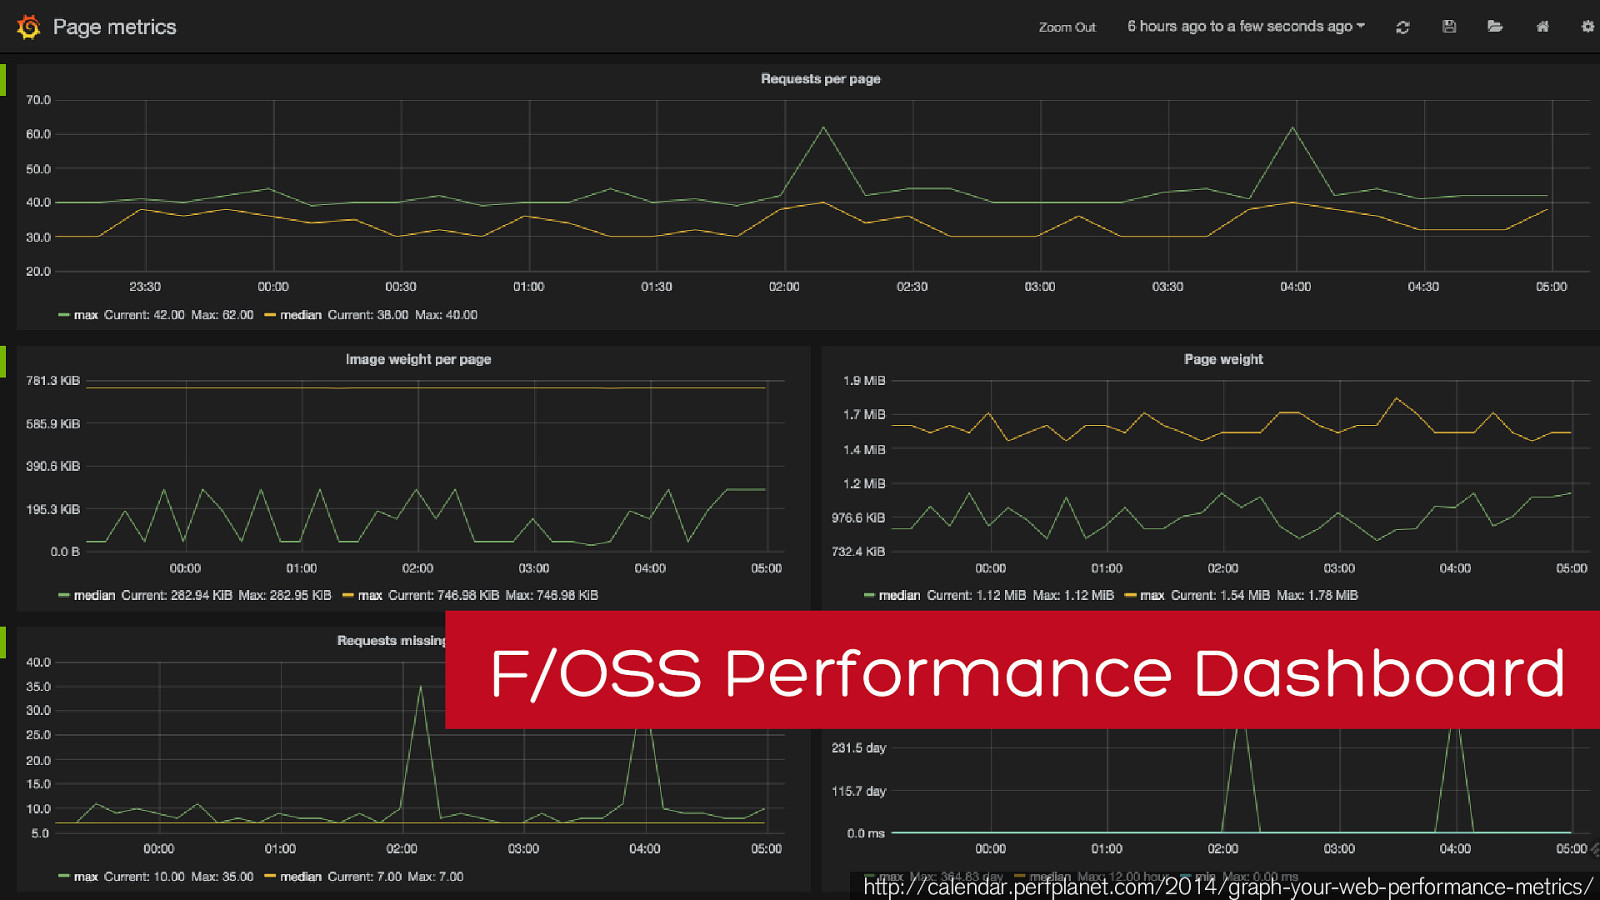
F/OSS Performance Dashboard
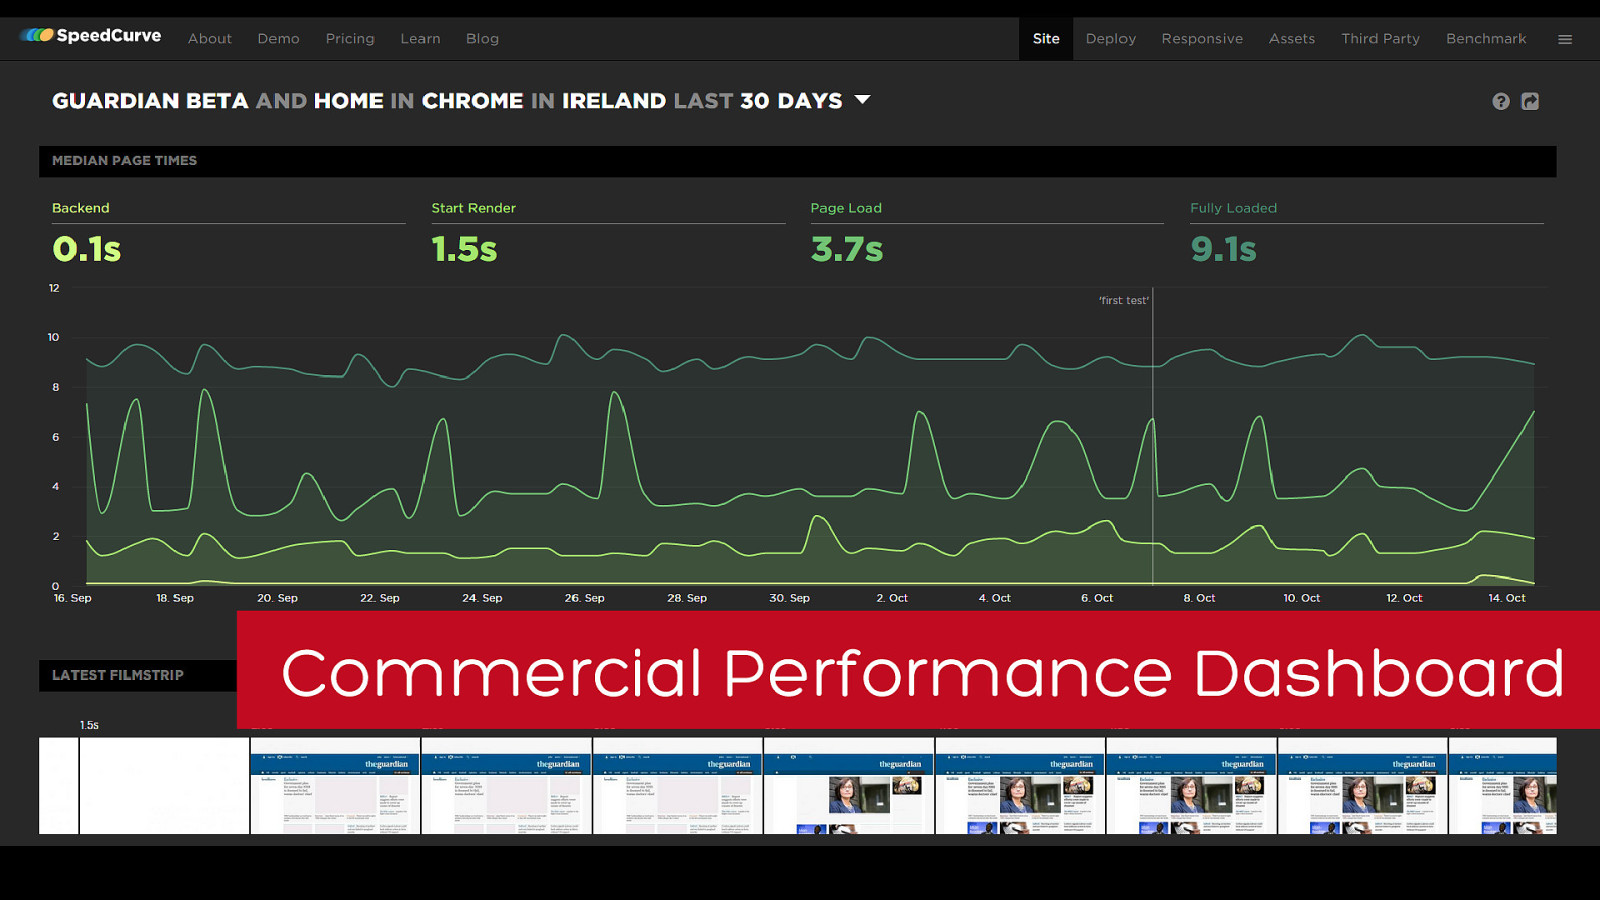
Commercial Performance Dashboard
Meet Jane
Jane’s challenge
Using visualisations to prove a point
Using visualisations to increase awareness
Using visualisations to create value
Using visualisations to track performance
Building visualisations into business processes
Too focussed?
https://www.flickr.com/photos/visualogist/3202396970/
So what have we got?
time
live
trends
one page
whole site
some pages
requires
technical
understanding
requires
some
understanding
intuitive
waterfall
filmstrip
heatmap
requestmap
perf
dash
ops dash
?
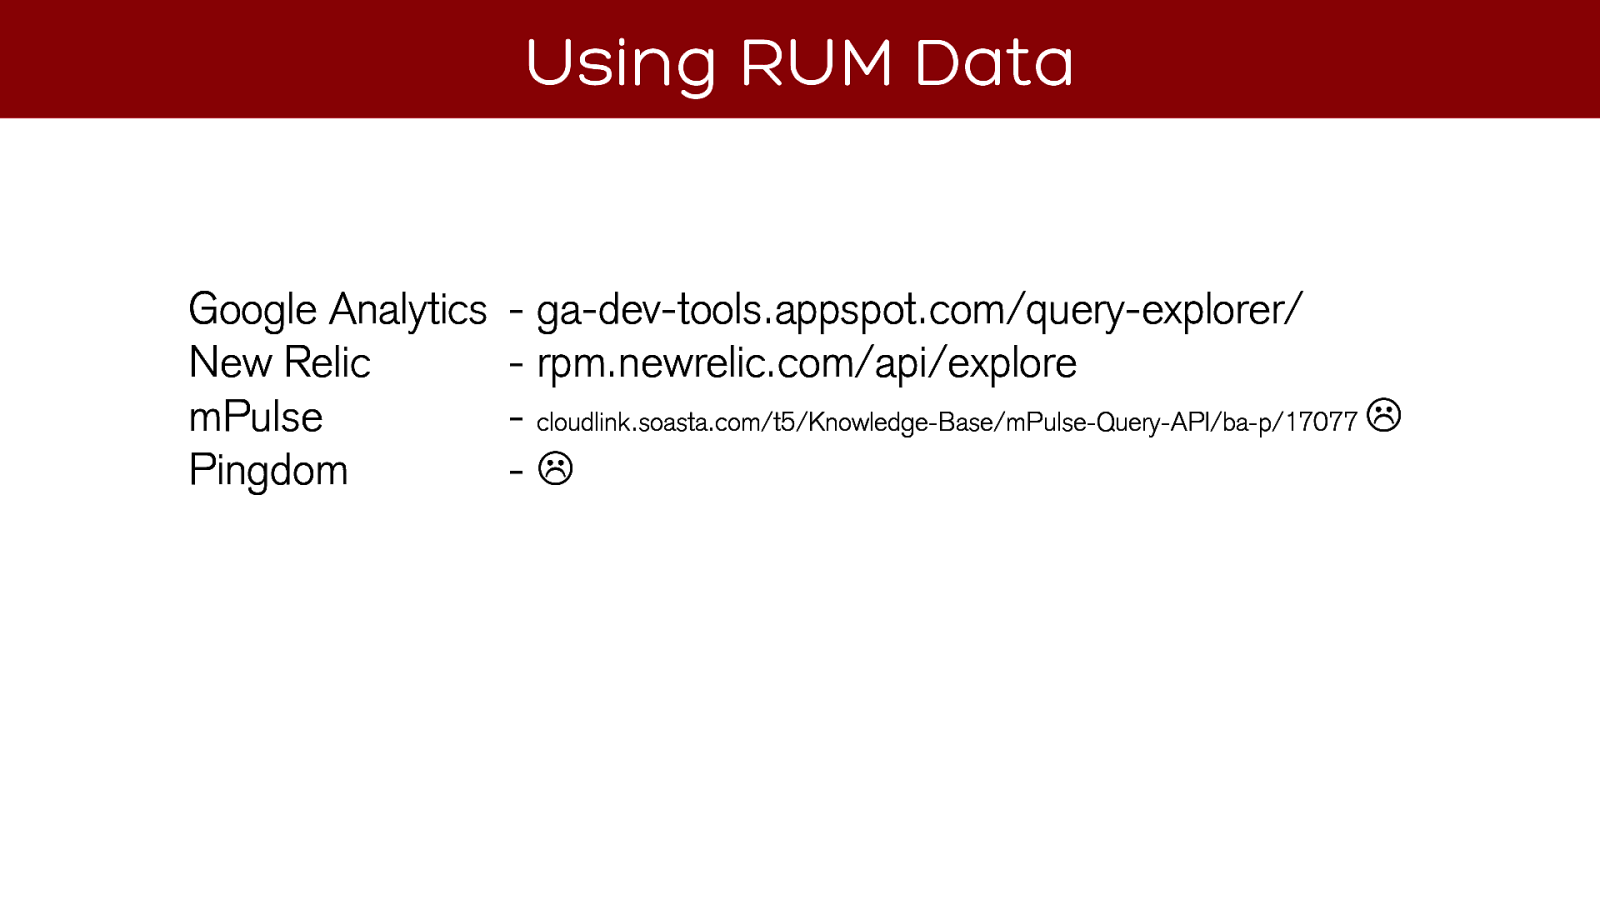
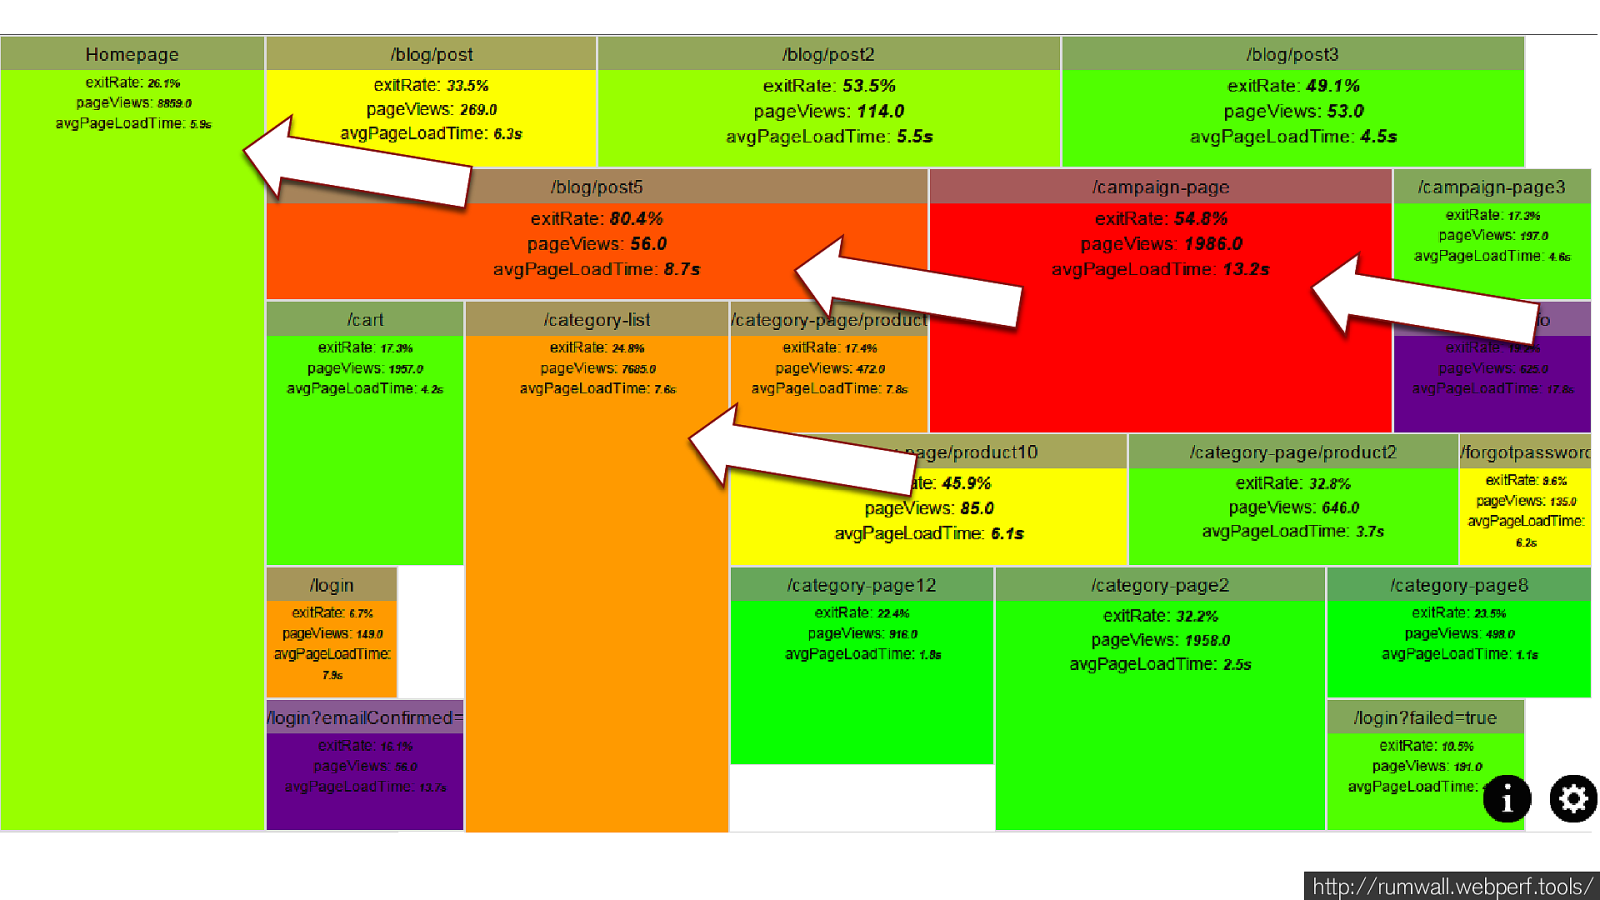
Using RUM Data
Google Analytics
explorer/
New Relic
rpm.newrelic.com/ api /explore
mPulse
p/17077
Pingdom
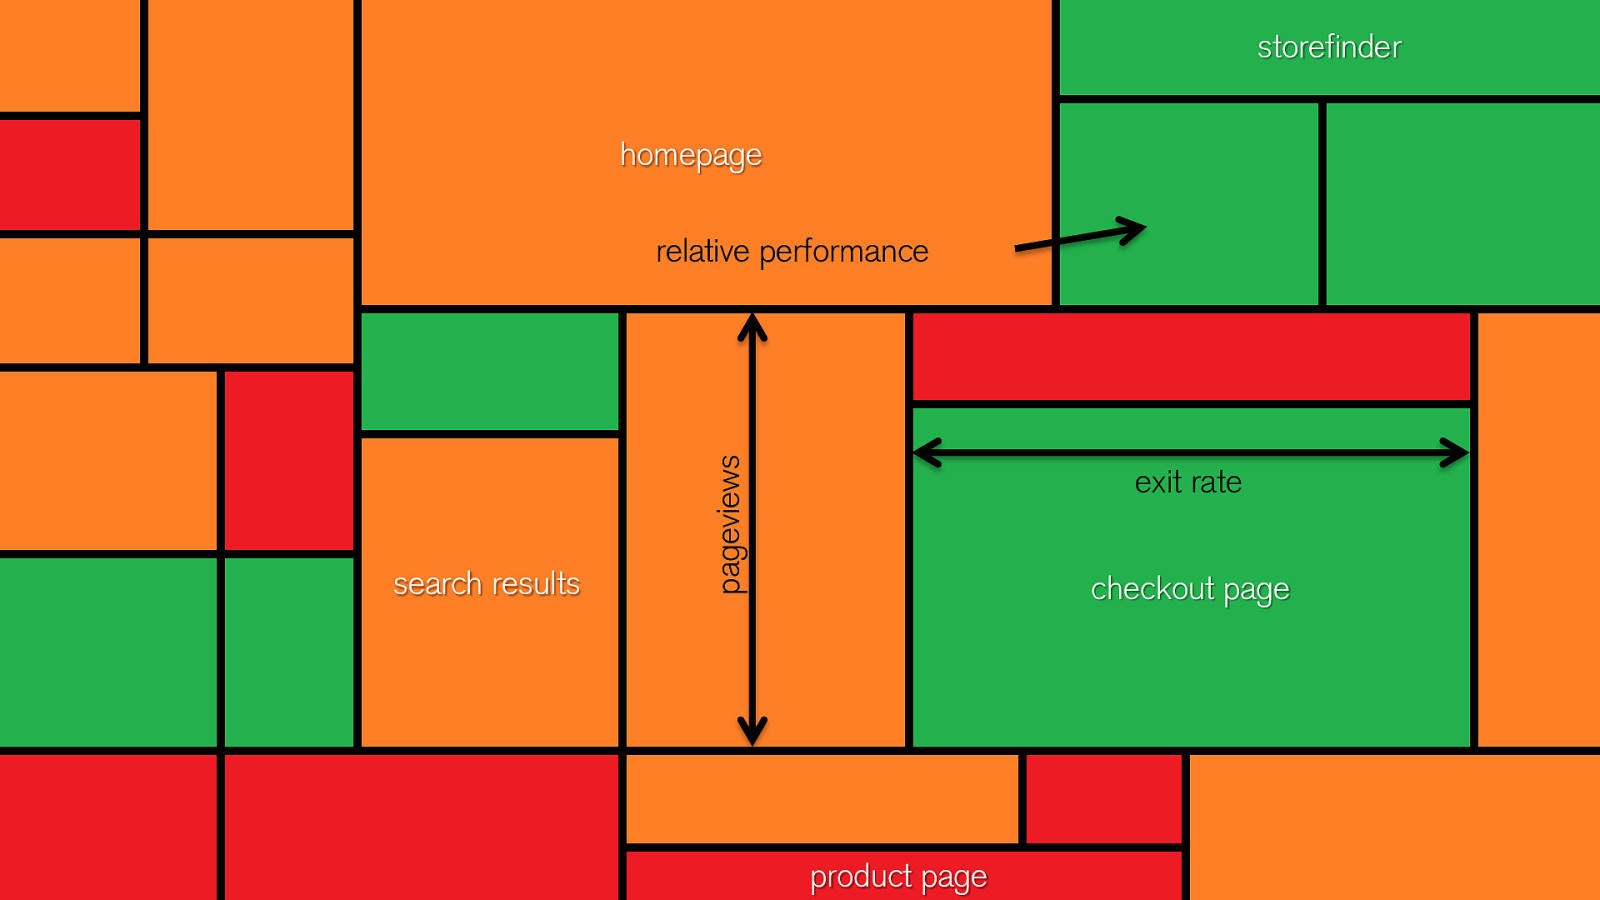
exit rate
pageviews
relative performance
homepage
checkout page
product page
storefinder
search results
http://rumwall.webperf.tools/
http://rumwall.webperf.tools/
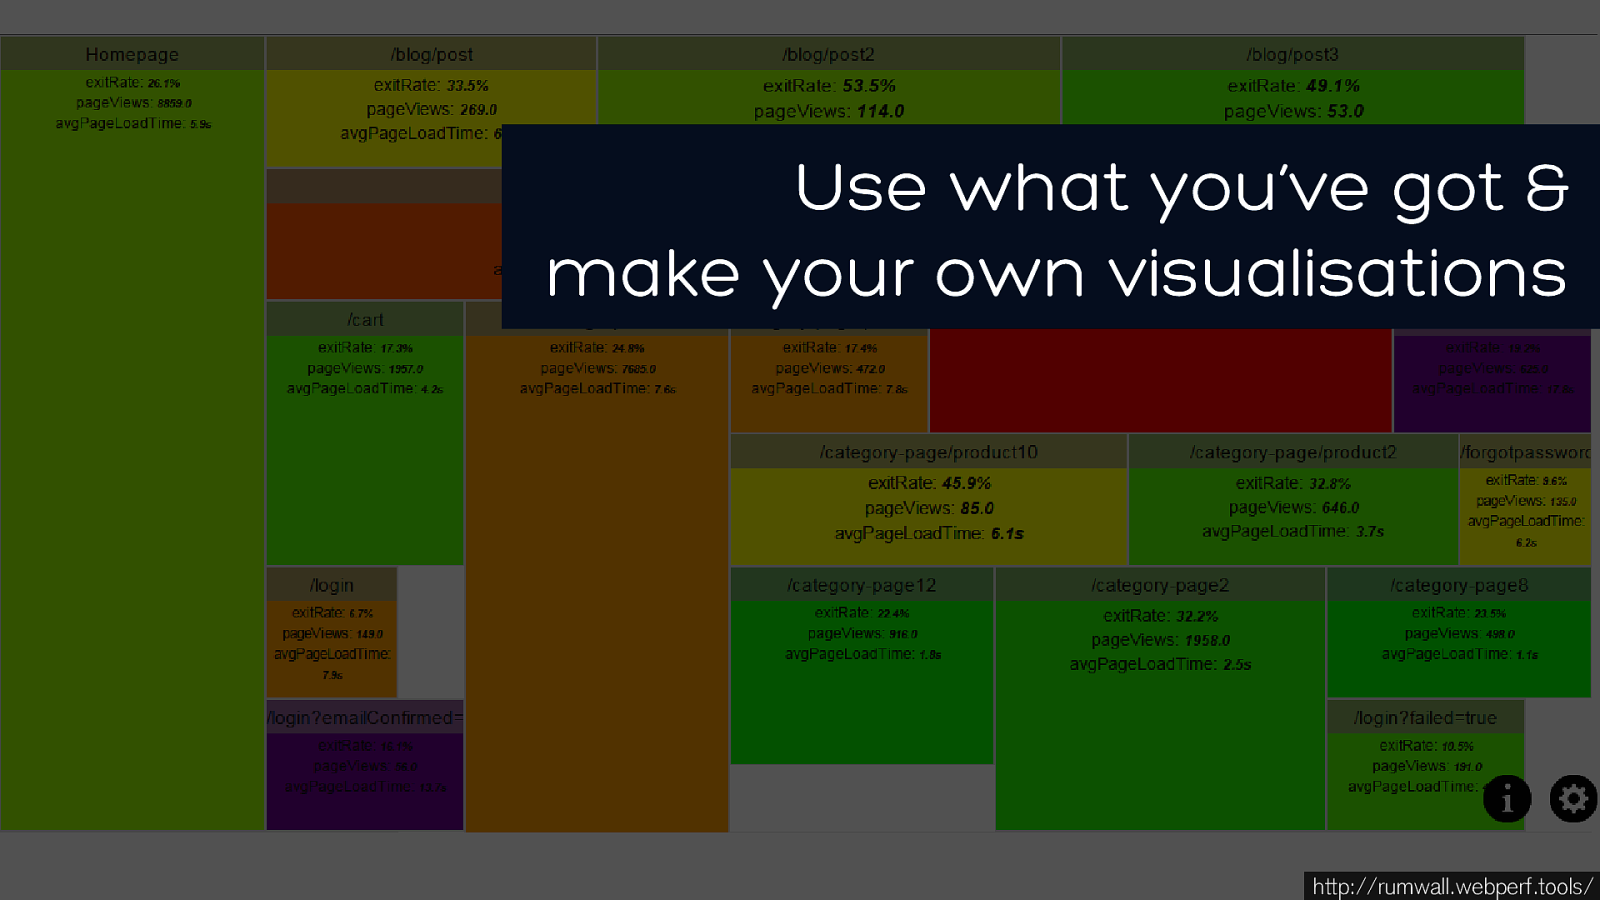
Use what you’ve got &
make your own visualisations
So what have we got?
time
live
trends
one page
whole site
some pages
requires
technical
understanding
requires
some
understanding
intuitive
waterfall
filmstrip
heatmap
requestmap
perf
dash
ops dash
rum wall
Meet Jane
Jane’s challenge
Using visualisations to prove a point
Using visualisations to increase awareness
Using visualisations to create value
Using visualisations to track performance
Building visualisations into business processes
analysis is only the beginning…
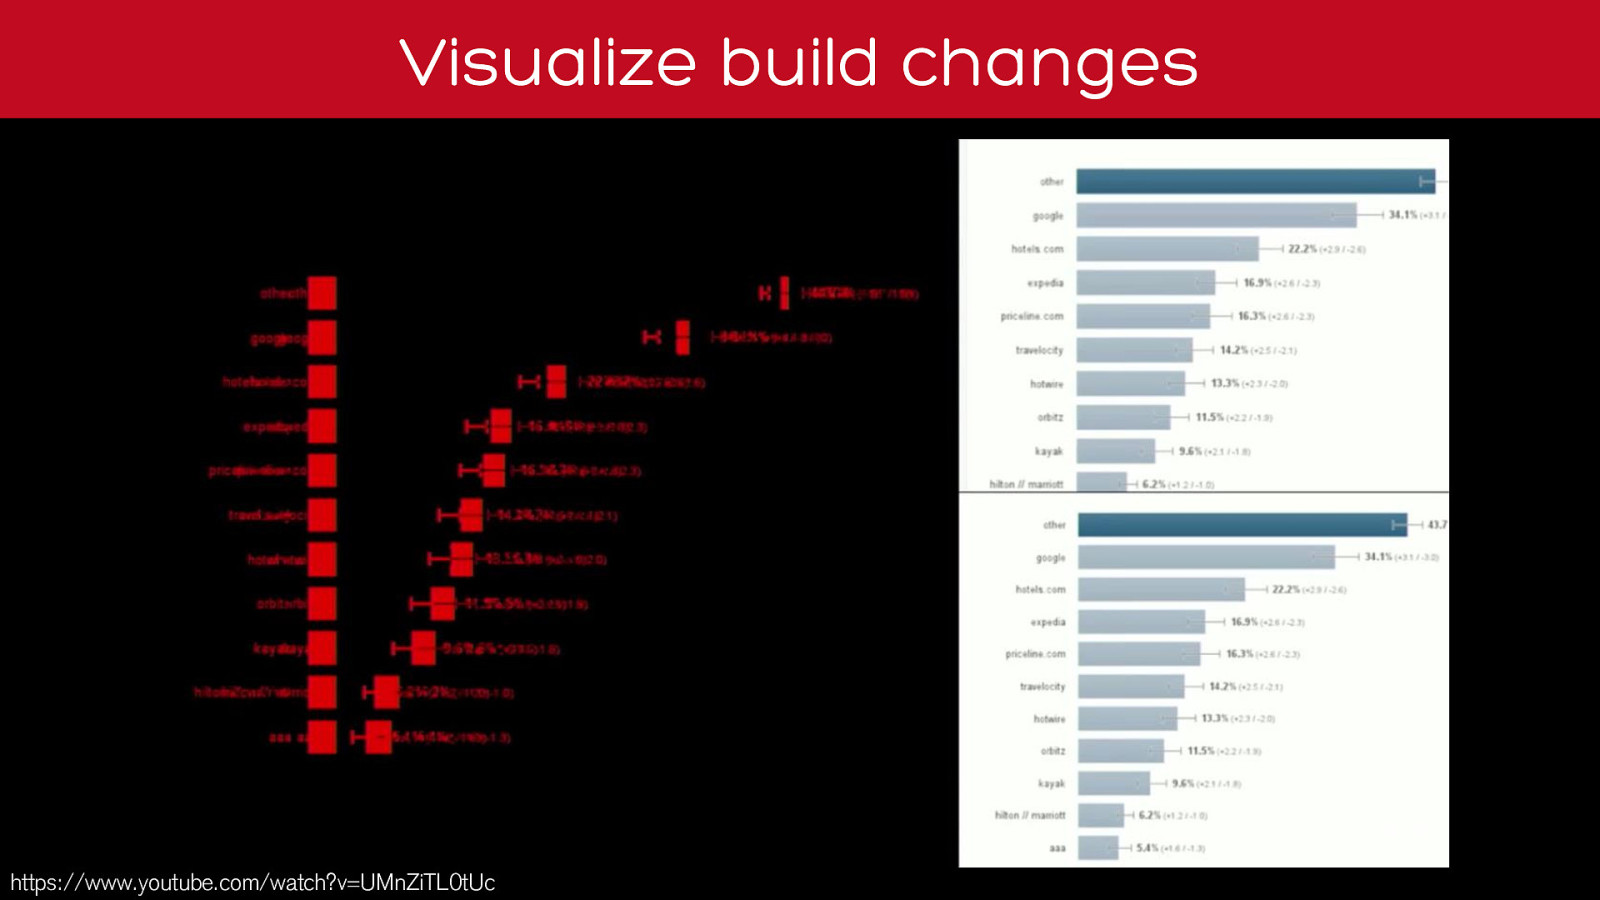
Visualize build changes
https://www.youtube.com/watch?v=UMnZiTL0tUc
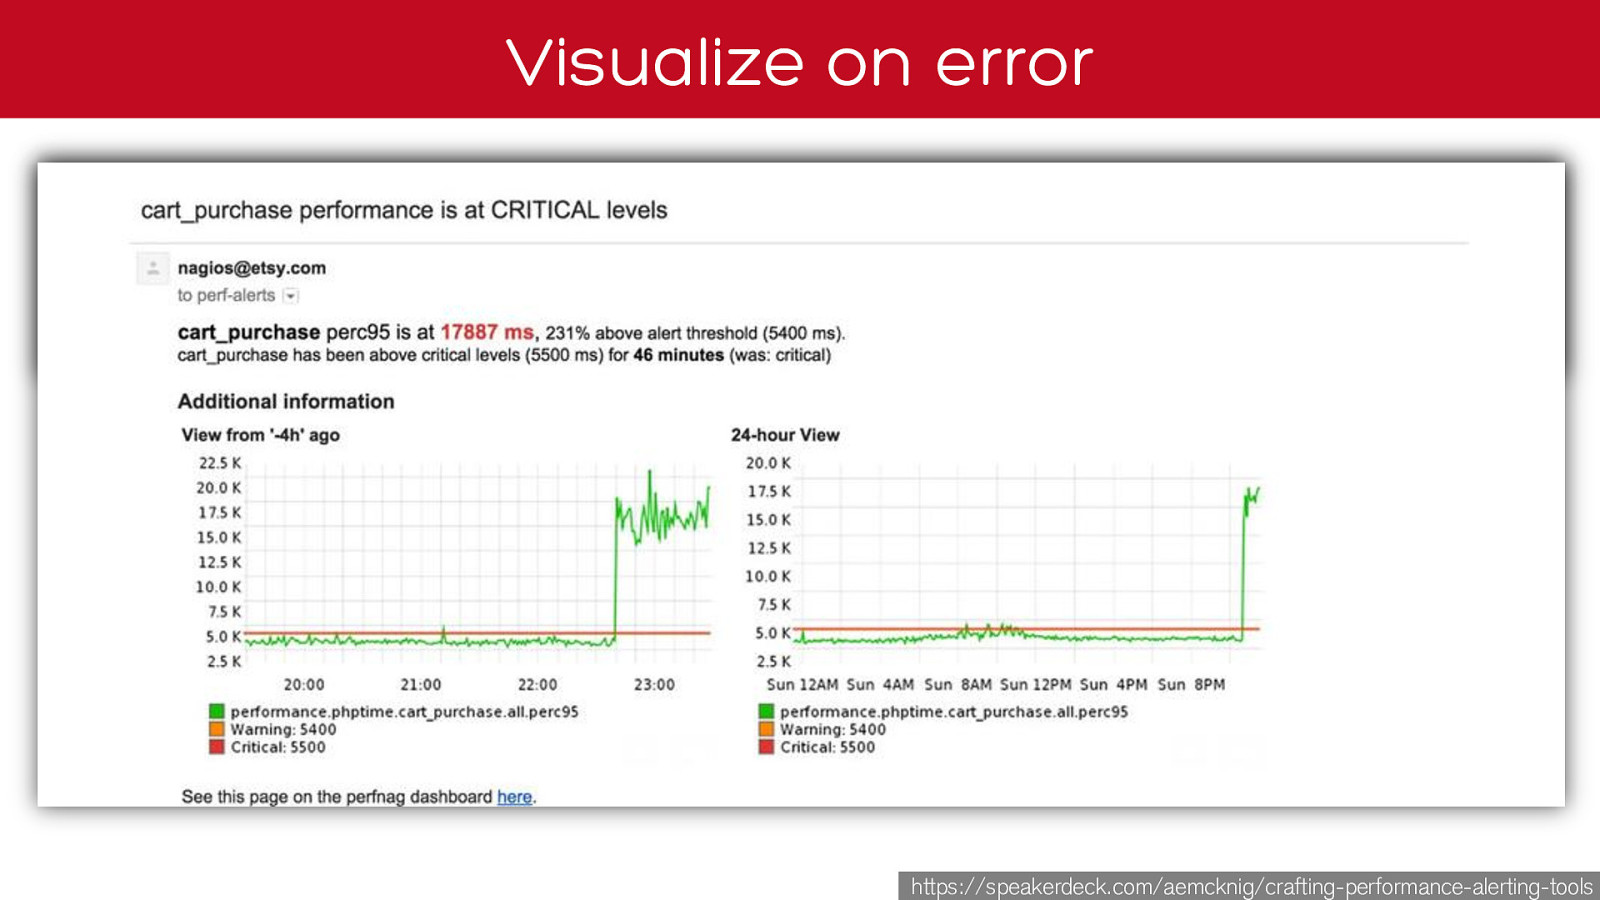
Visualize on error
tools
Meet Jane
Jane’s challenge
Using visualisations to prove a point
Using visualisations to increase awareness
Using visualisations to create value
Using visualisations to track performance
Building visualisations into business processes
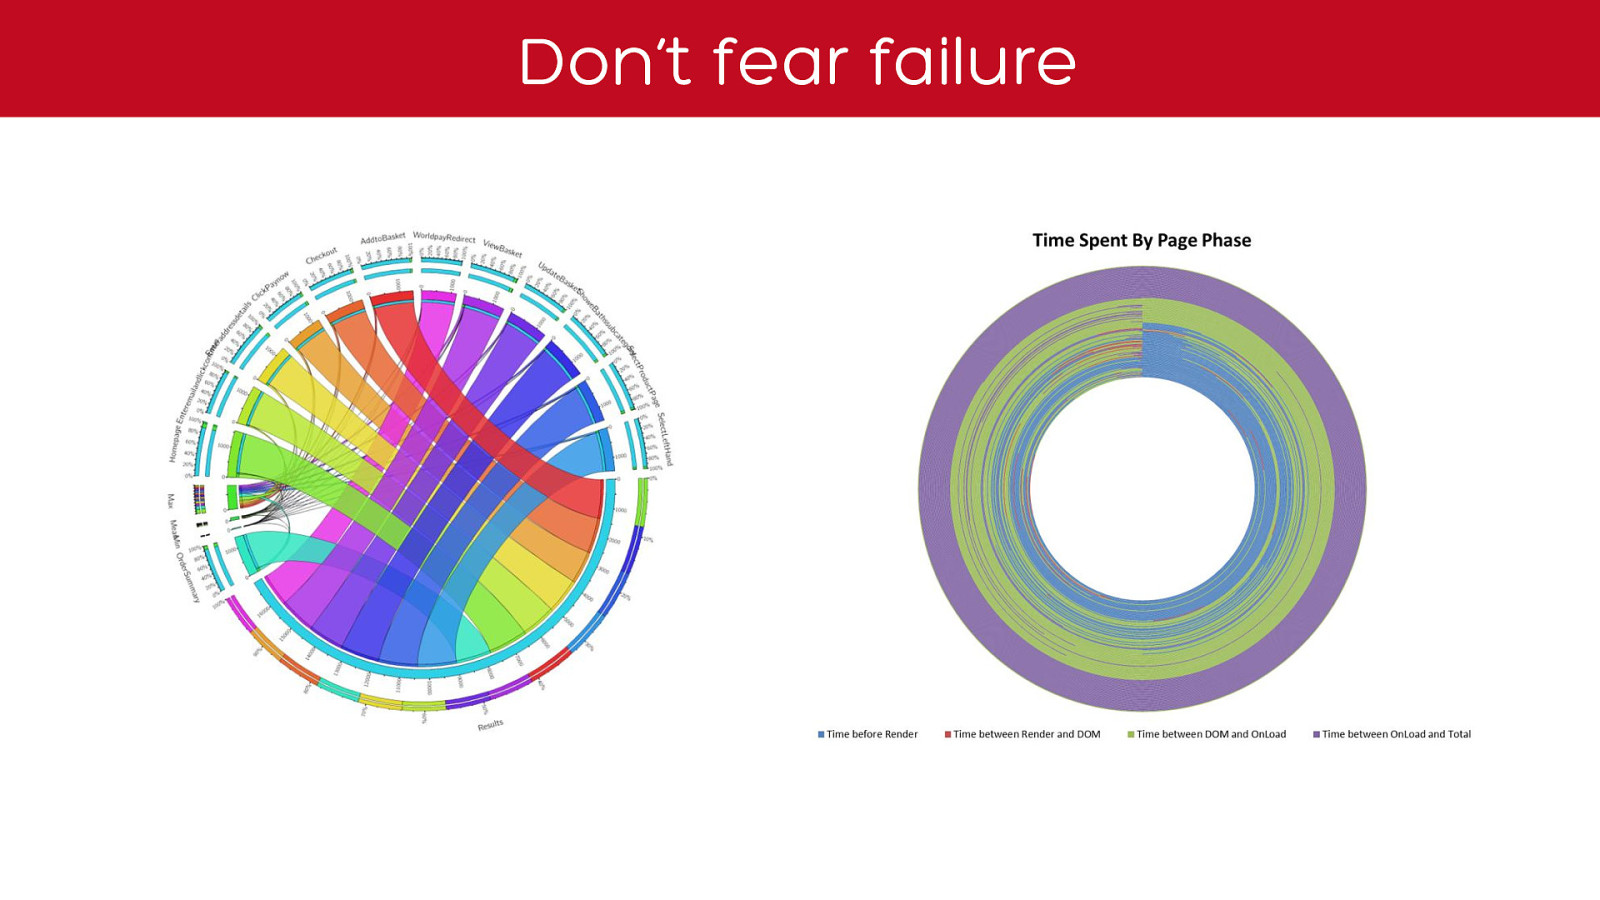
Don’t fear failure
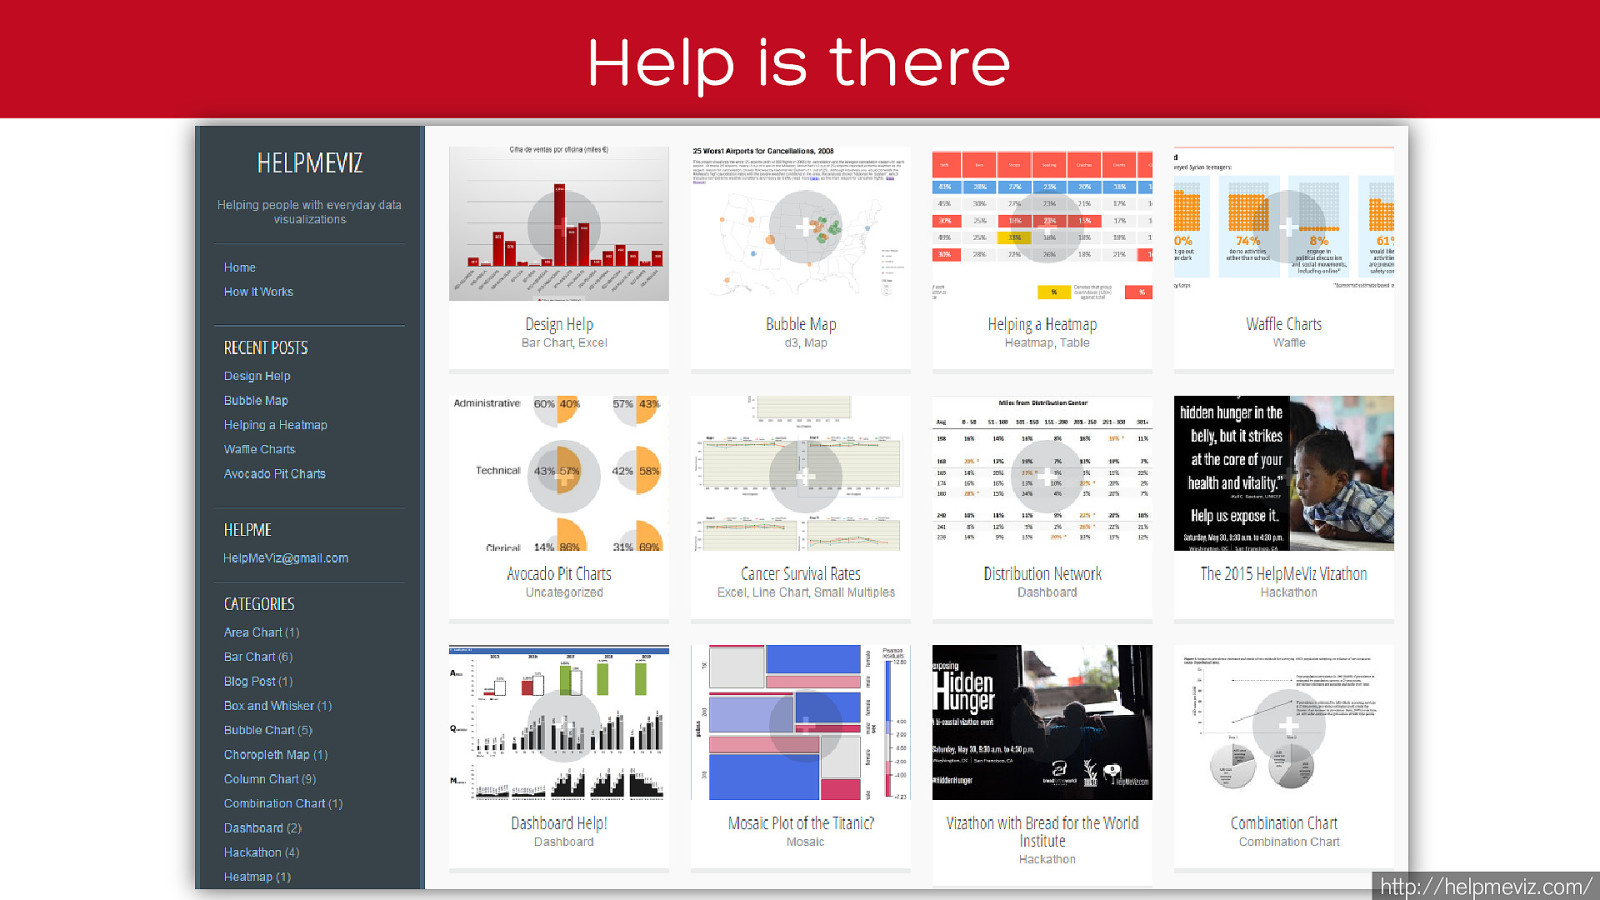
Help is there
http://helpmeviz.com/
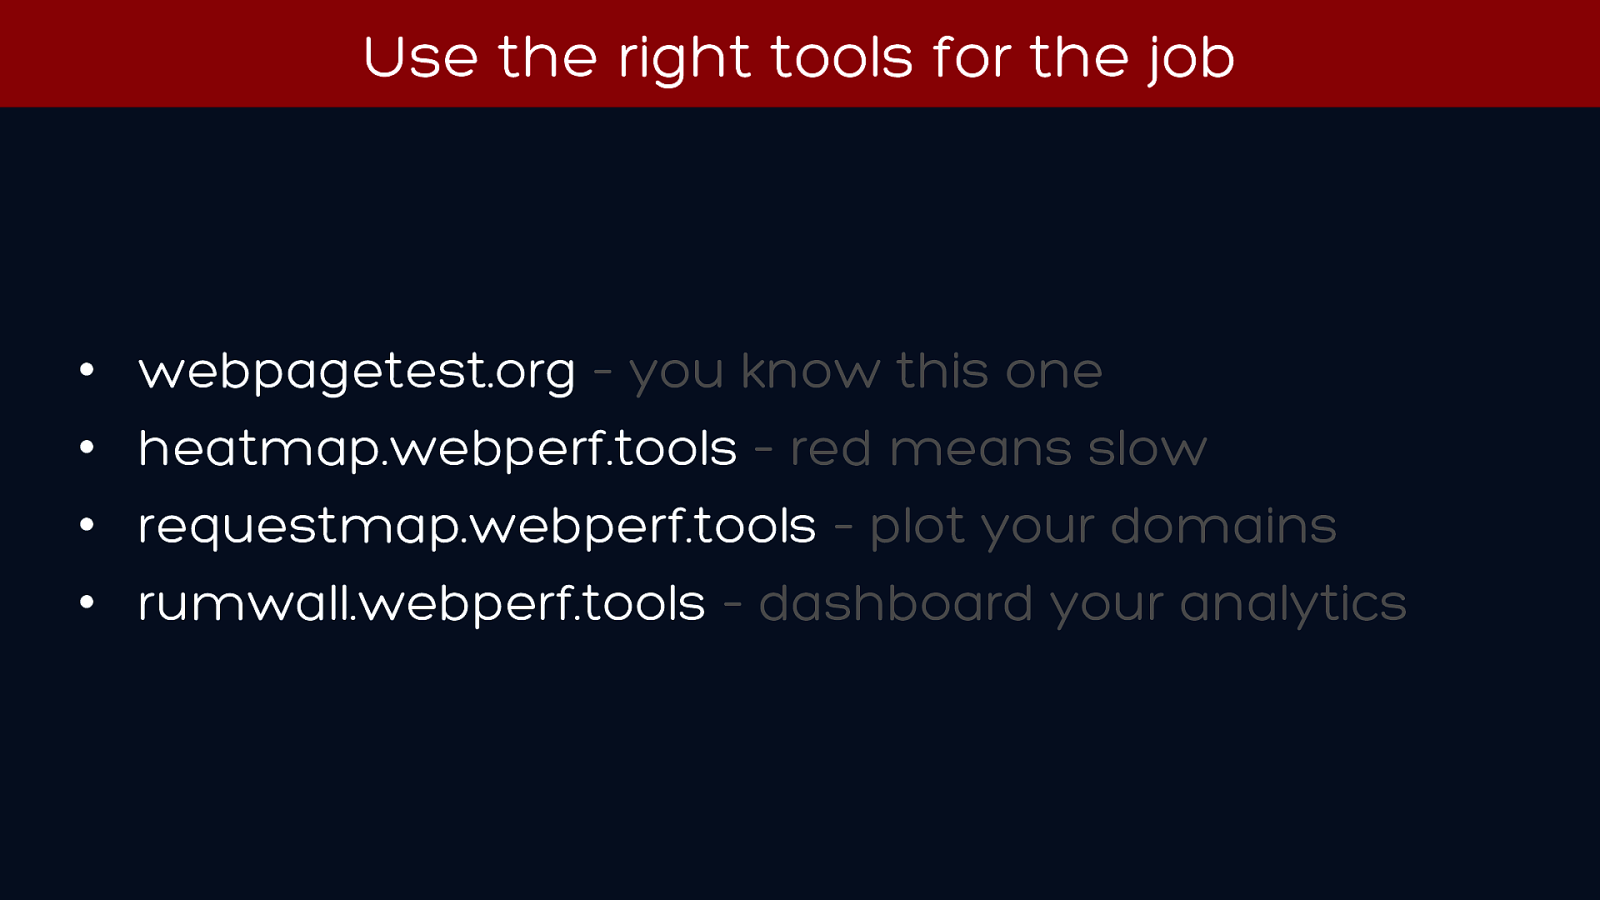
• webpagetest.org –
you know this one
• heatmap.webperf.tools
–
red means slow
• requestmap.webperf.tools
–
plot your domains
• rumwall.webperf.tools
–
dashboard your analytics
Use the right tools for the job
graphite.wikidot.com
• g raphene
github.com/ jondot / graphene
bit.ly/ foss_viz
Create your own
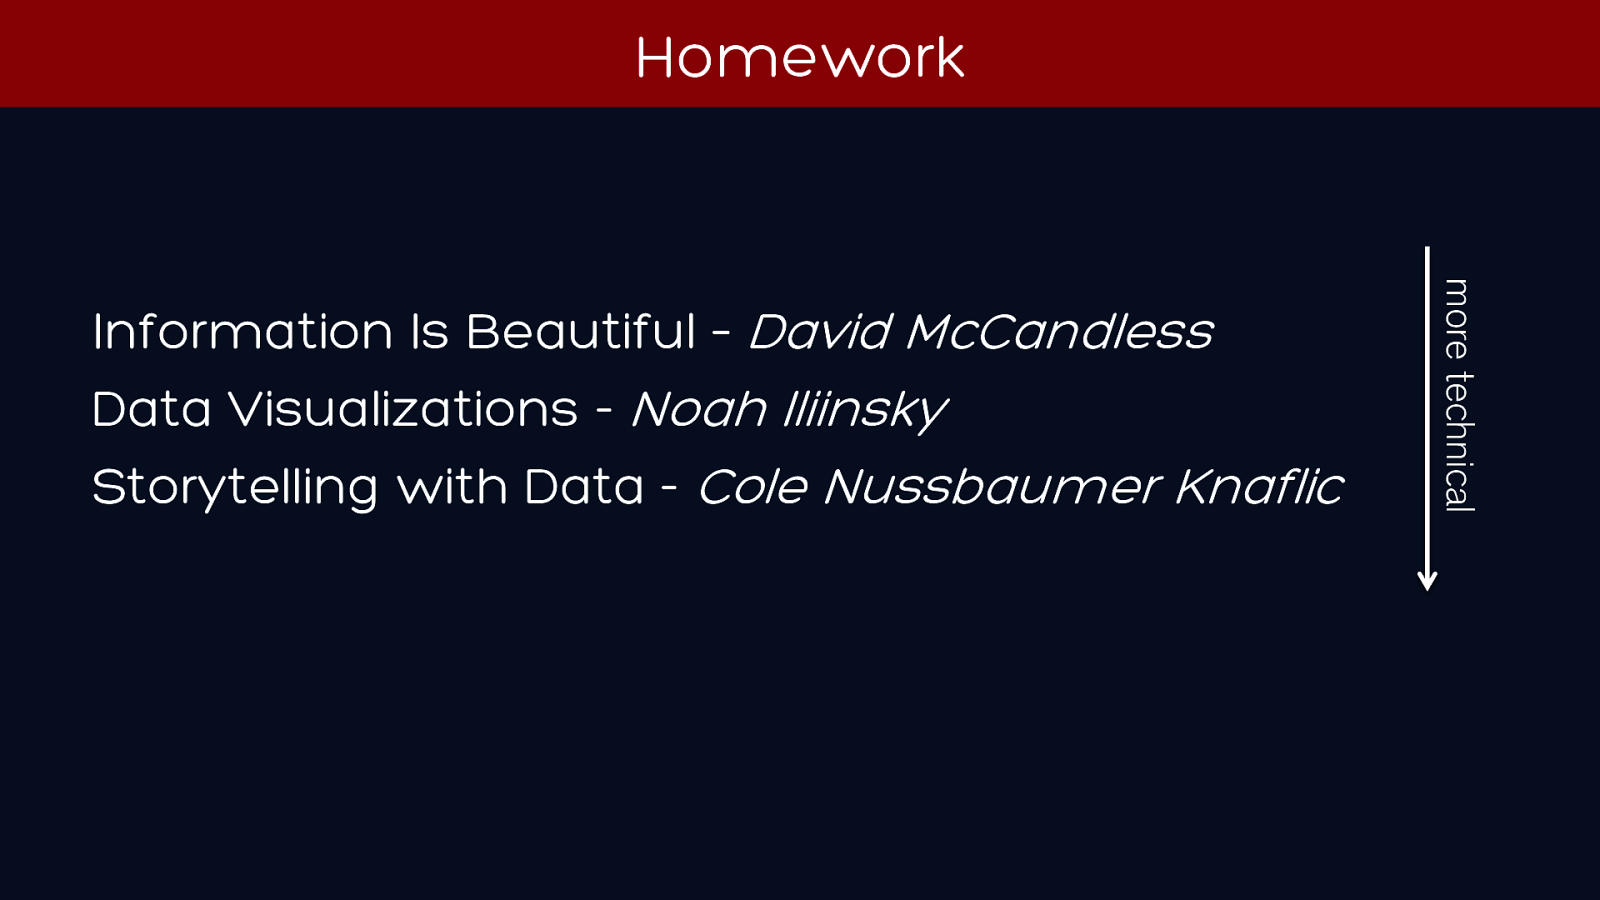
Information Is Beautiful –
David McCandless
Noah Iliinsky
Cole Nussbaumer
Knaflic
Homework
more technical
Thanks!
@ SimonHearne
slideshare.net/ SimonHearne
Break
Break
You are here

With all the different measurements we can take of web performance, the data we can report on becomes huge. Waterfall charts just don’t cut it any more – they are a technical tool to diagnose technical issues. What we need now are business-focused visualizations that quickly represent the impact of performance on user experience.
More and more regularly we are being asked for rapid analysis of key web performance challenges:
Where are the third parties coming from? What is the impact of loading web fonts? Are the ads on the page loading after the main content? How quickly could you answer these business-critical questions? Waterfall charts help, but need technical interpretation.
We have used visualizations for years – waterfall charts, domain breakdowns, filmstrips – but they all require some technical understanding for them to answer these questions.
Mark Zeman’s talk on visualizations at last year’s Velocity showed us that visualizations do not have to be technical to be meaningful. In this talk, Simon will demonstrate the value of exploring new types of visualizations to present a more holistic view of performance that anyone can understand.


 for free. You
can too.
for free. You
can too.