
A presentation at Linux.conf.au 2019 in in Christchurch, New Zealand by Mark Walkom

Awesome Monitoring Infrastructure Using the Elastic Stack Mark Walkom @warkolm Karen Carcamo @karencfv www.elastic.co LINUX.CONF.AU LINUX.CONF.AU 21-25 January 2019 | Christchurch | NZ 21-25 January 2019 Christchurch, NZ The Linux of Things The Linux of Things #LCA2019 | @linuxconfau | #LCA2019 @linuxconfau
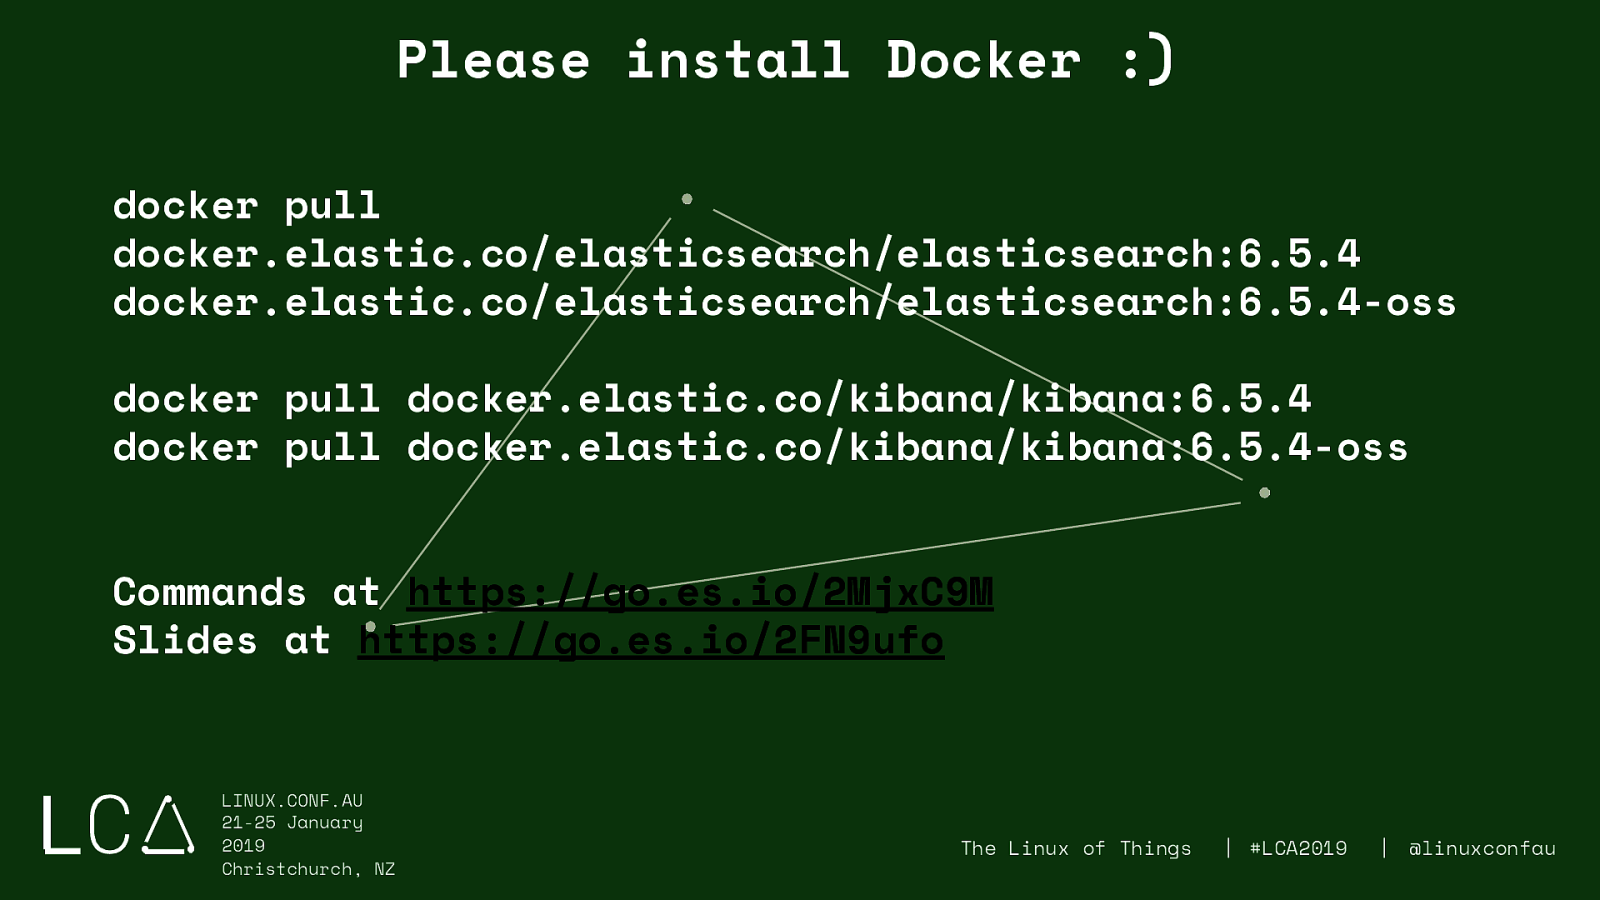
Please install Docker :) docker pull docker.elastic.co/elasticsearch/elasticsearch:6.5.4 docker.elastic.co/elasticsearch/elasticsearch:6.5.4-oss docker pull docker.elastic.co/kibana/kibana:6.5.4 docker pull docker.elastic.co/kibana/kibana:6.5.4-oss Commands at https://go.es.io/2MjxC9M Slides at https://go.es.io/2FN9ufo LINUX.CONF.AU LINUX.CONF.AU 21-25 January 2019 | Christchurch | NZ 21-25 January 2019 Christchurch, NZ The Linux of Things The Linux of Things #LCA2019 | @linuxconfau | #LCA2019 @linuxconfau
Us! 3
4
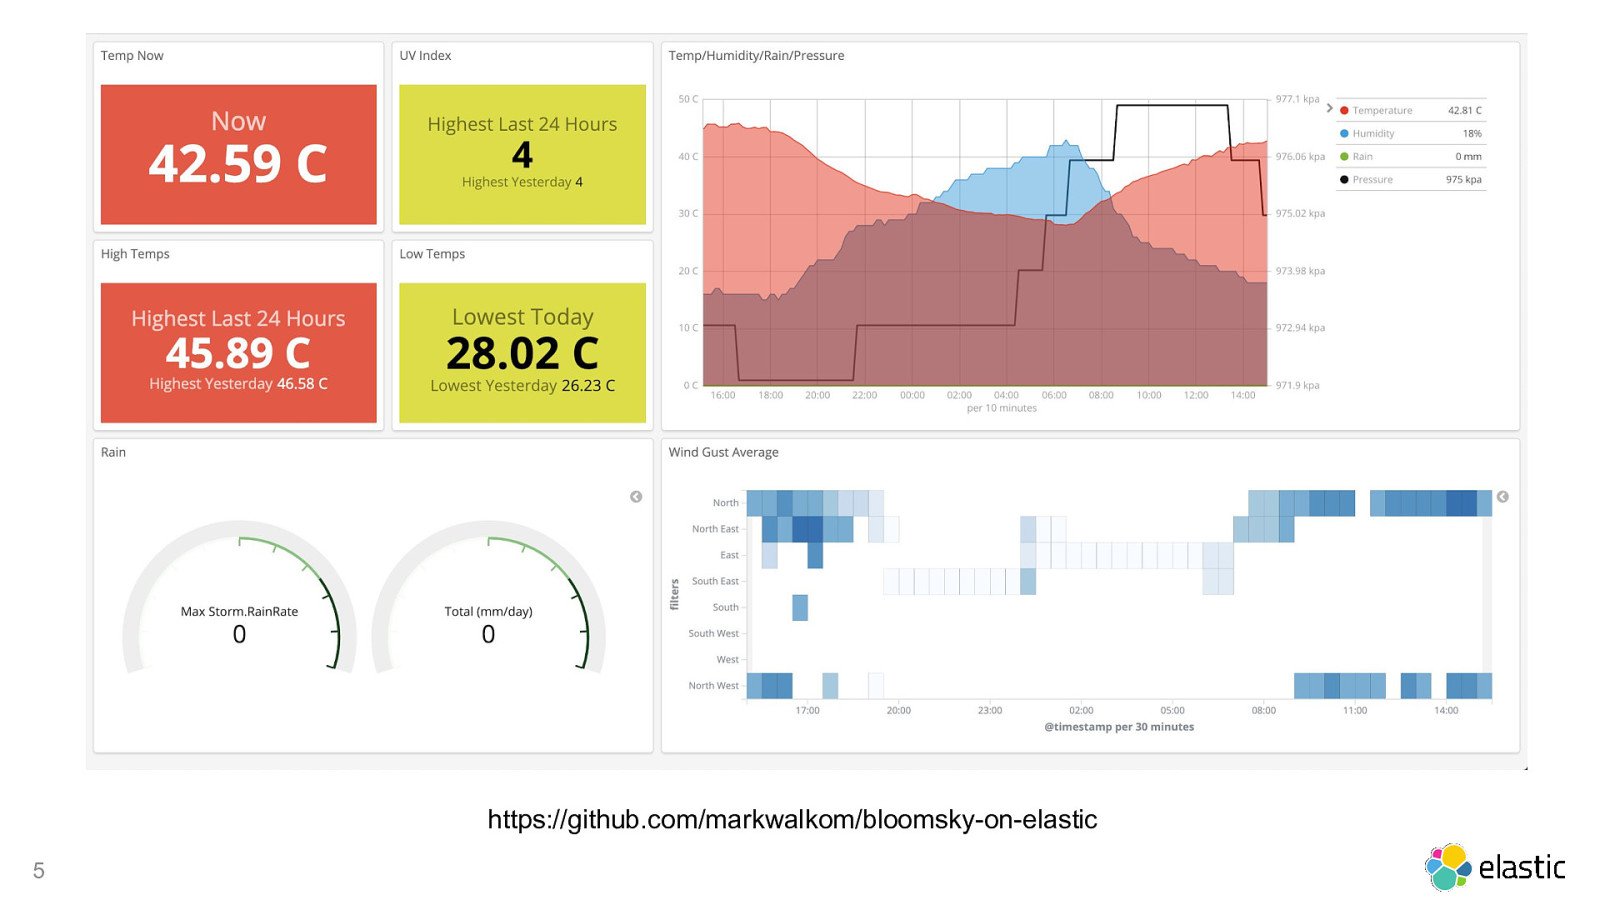
https://github.com/markwalkom/bloomsky-on-elastic 5
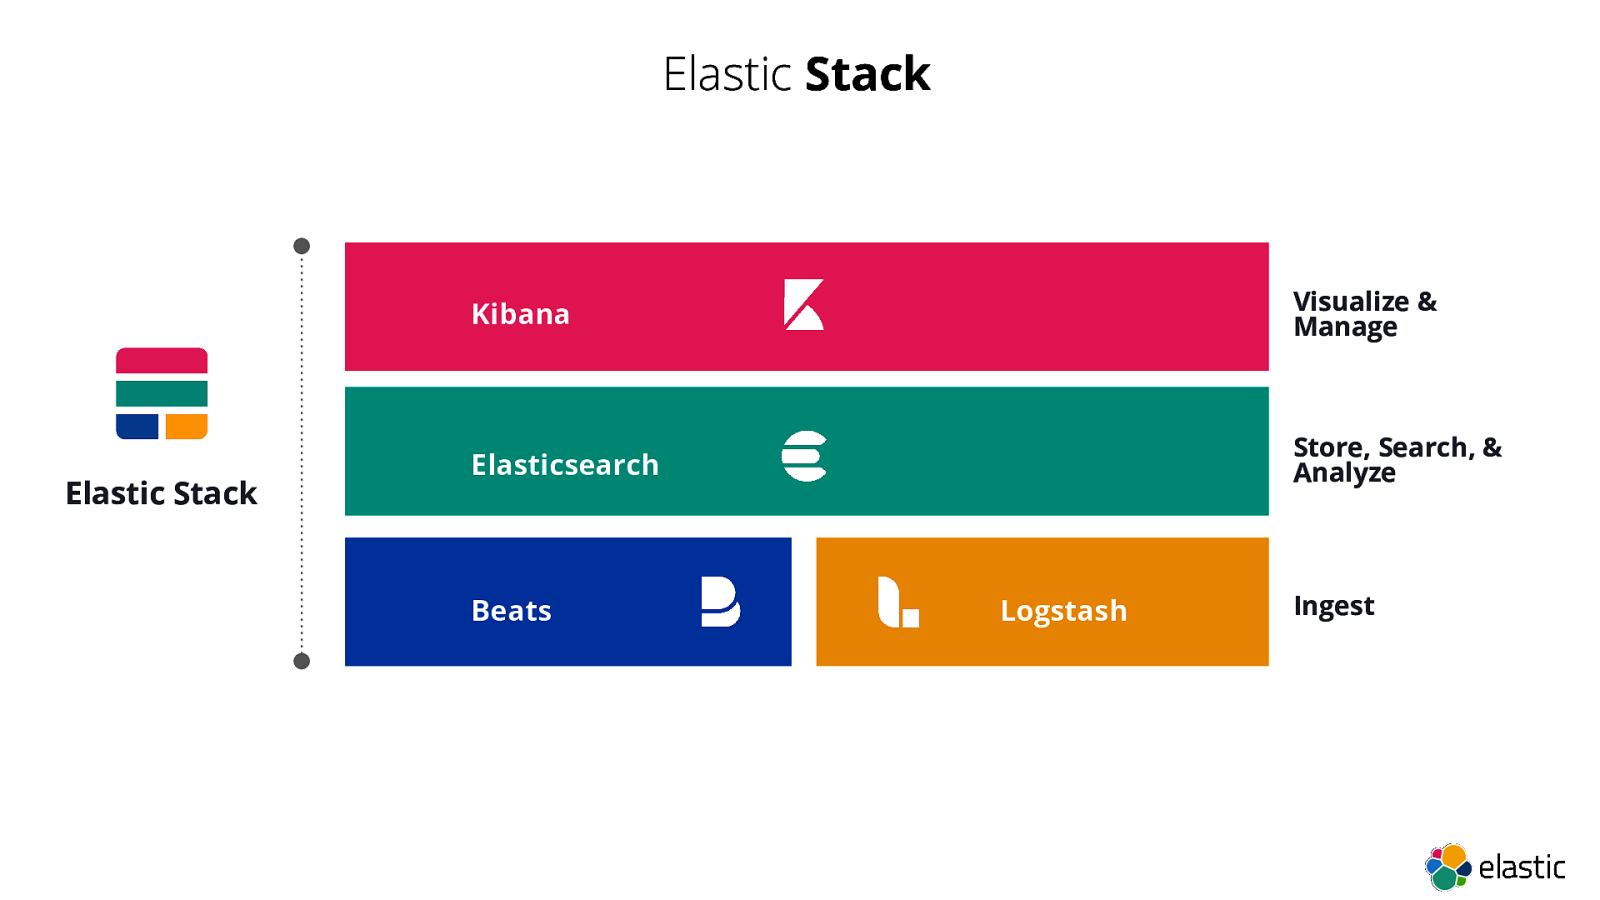
Elastic Stack Elasticsearch, Kibana, Beats, and Logstash 6
Elastic Stack Elastic Stack Kibana Visualize & Manage Elasticsearch Store, Search, & Analyze Beats Logstash Ingest
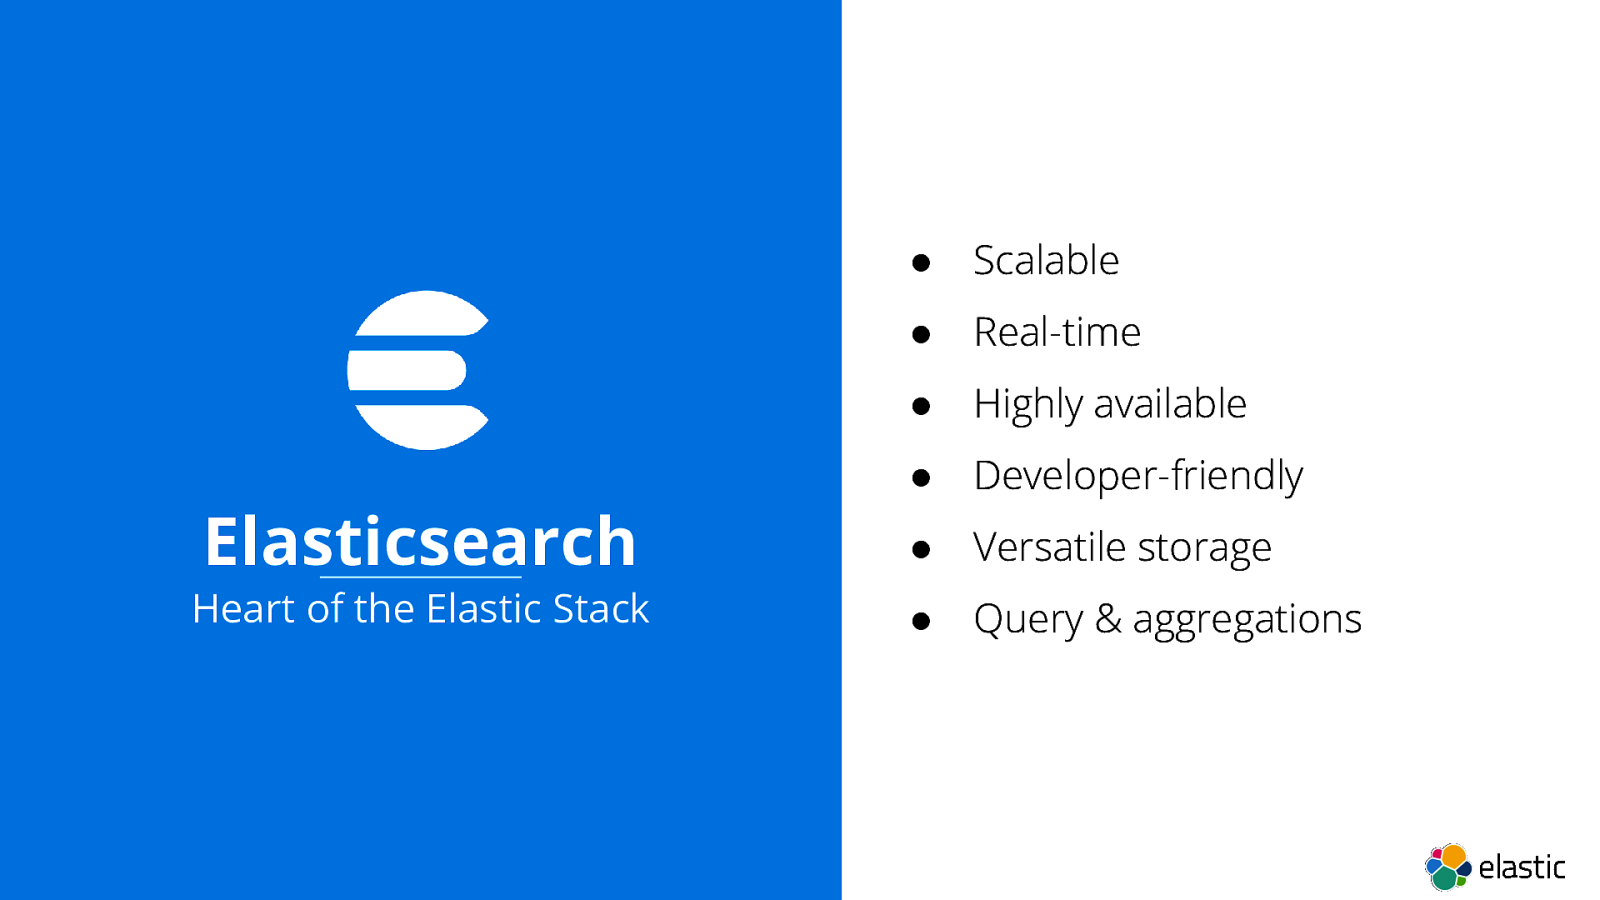
● Scalable ● Real-time ● Highly available ● Developer-friendly Elasticsearch ● Versatile storage Heart of the Elastic Stack ● Query & aggregations
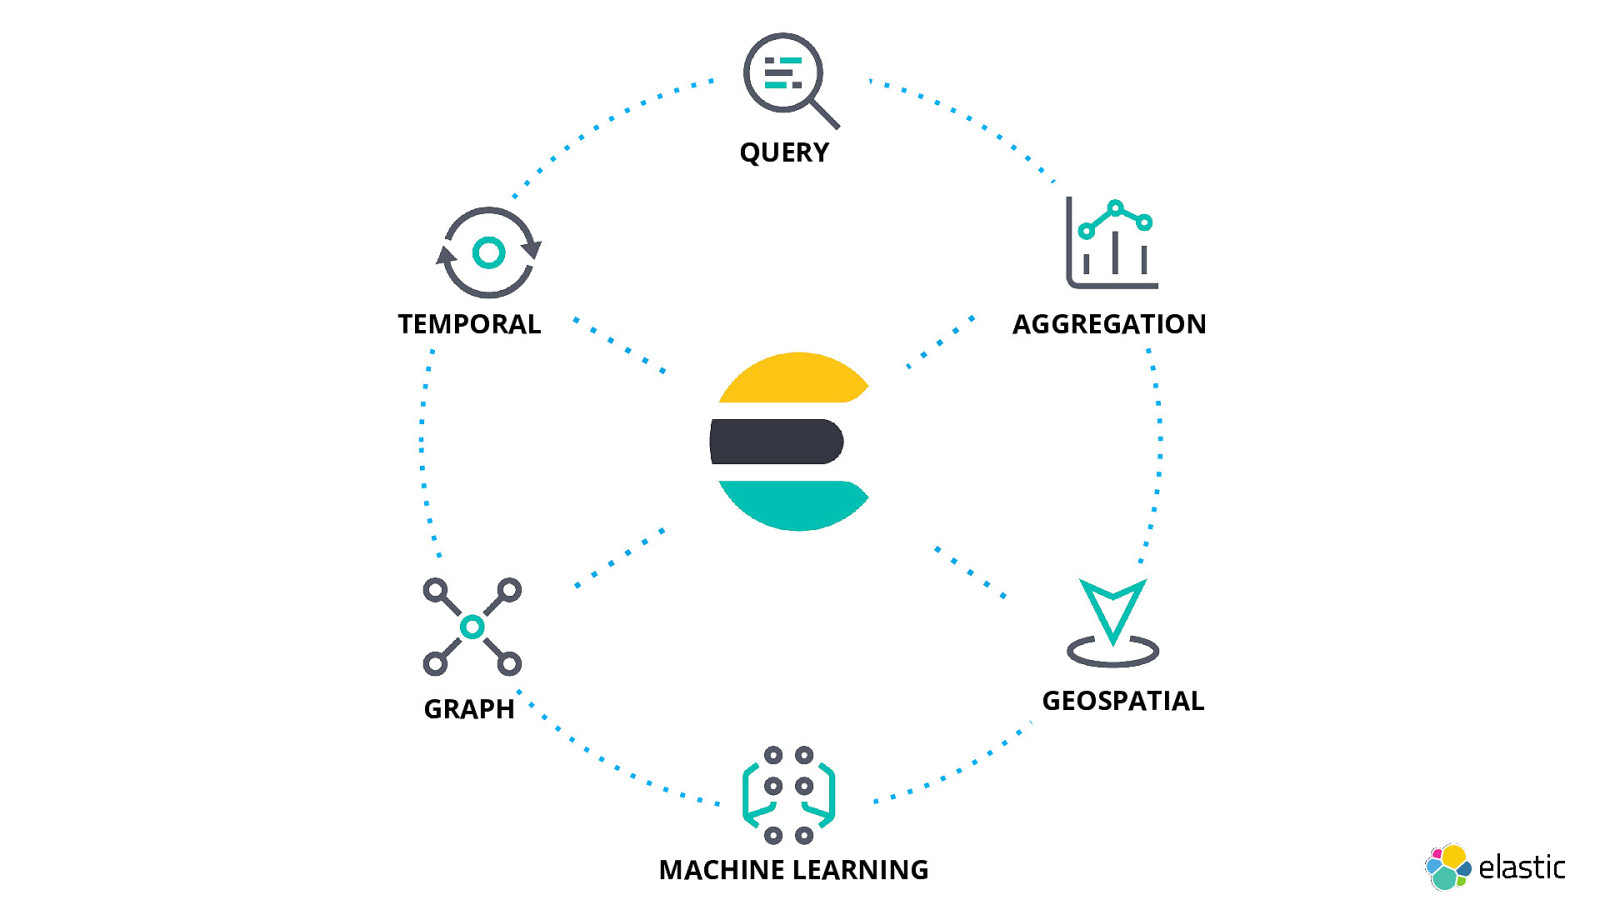
QUERY TEMPORAL AGGREGATION GEOSPATIAL GRAPH MACHINE LEARNING
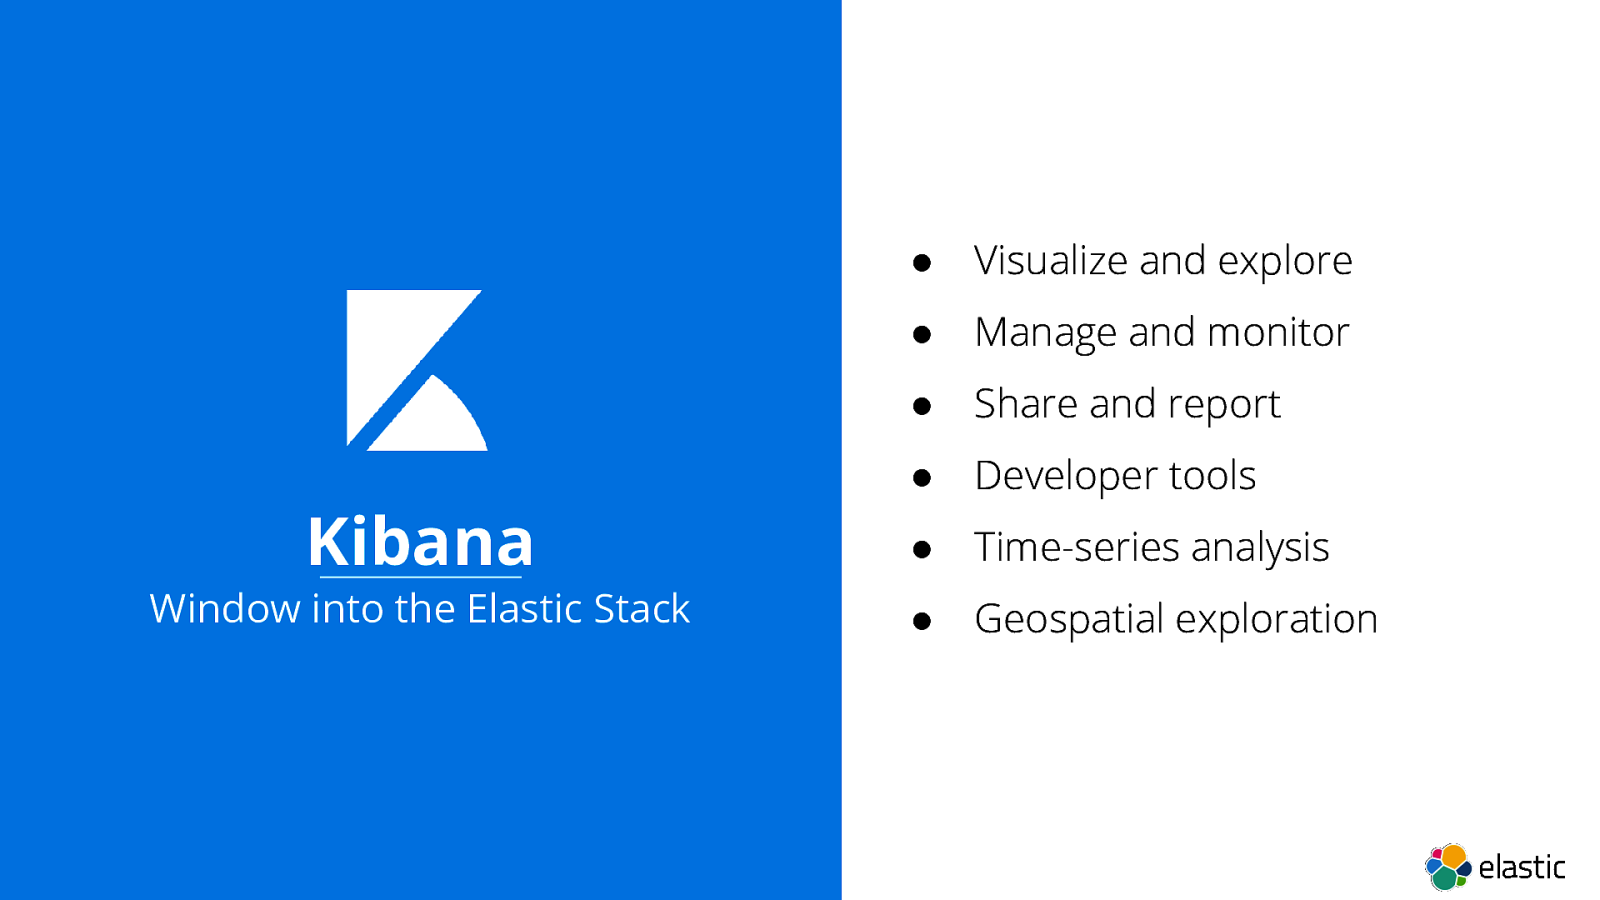
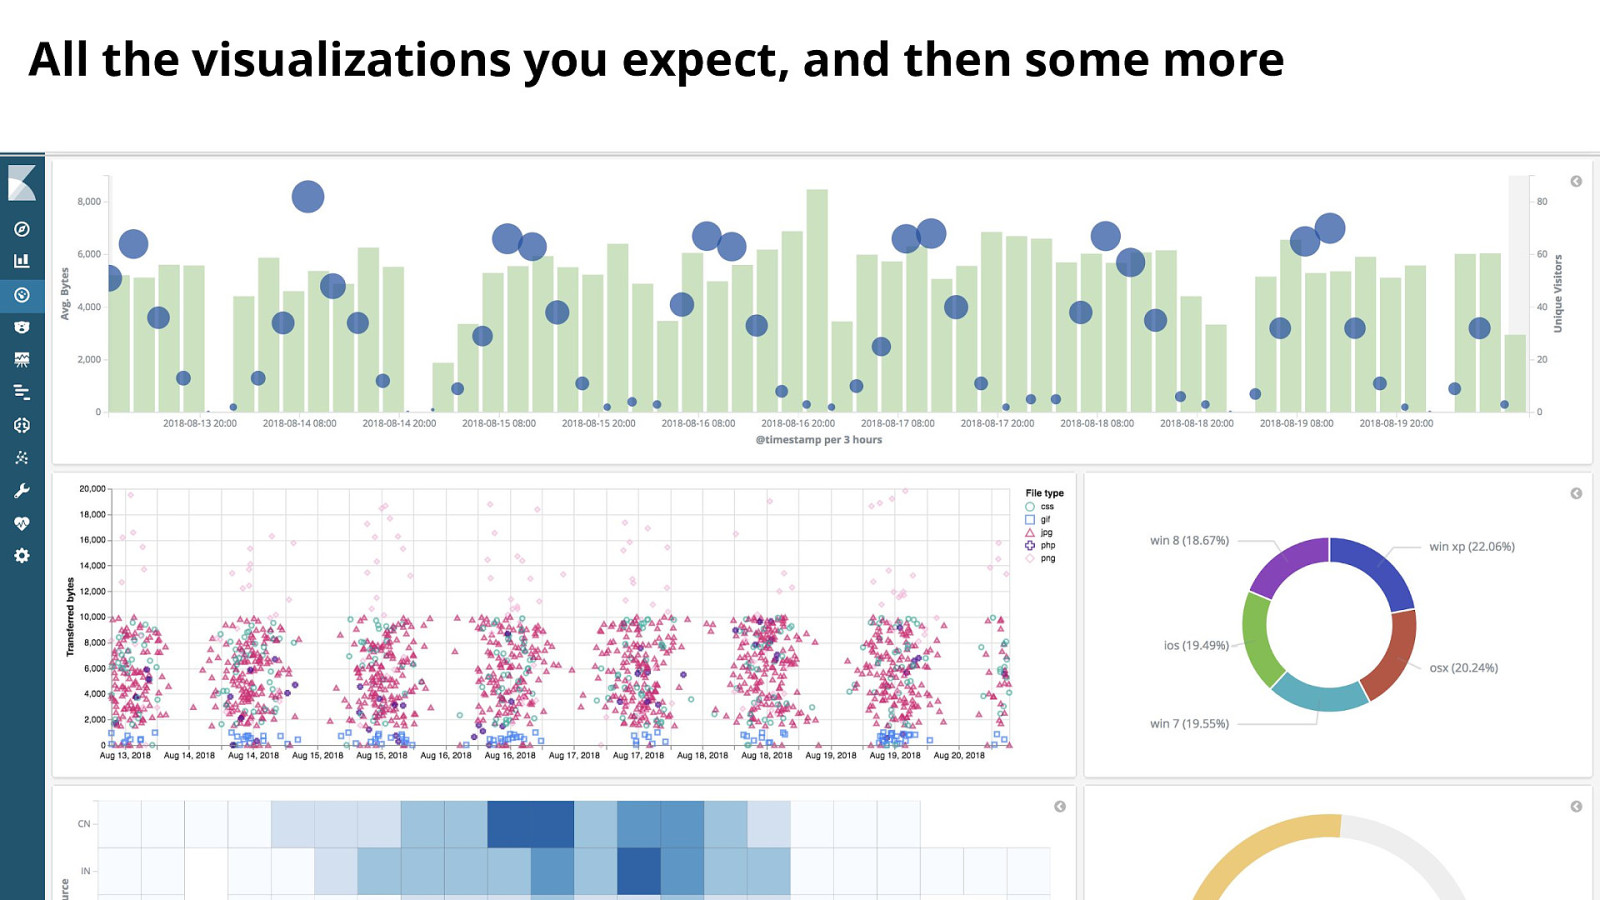
● Visualize and explore ● Manage and monitor ● Share and report ● Developer tools Kibana ● Time-series analysis Window into the Elastic Stack ● Geospatial exploration
All the visualizations you expect, and then some more 11
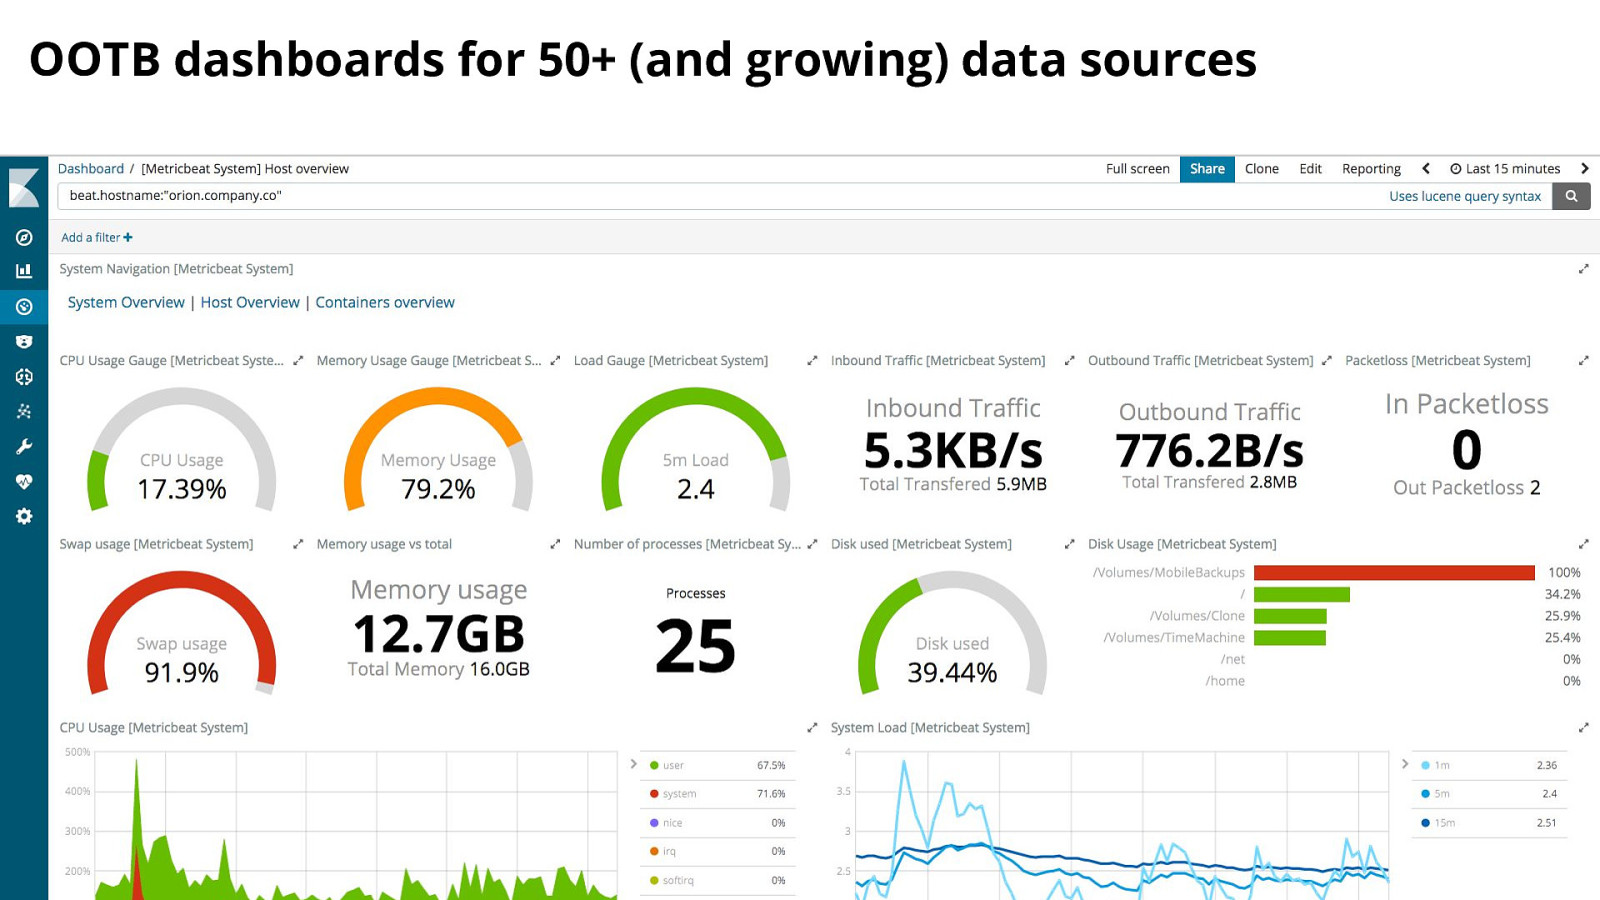
OOTB dashboards for 50+ (and growing) data sources 12
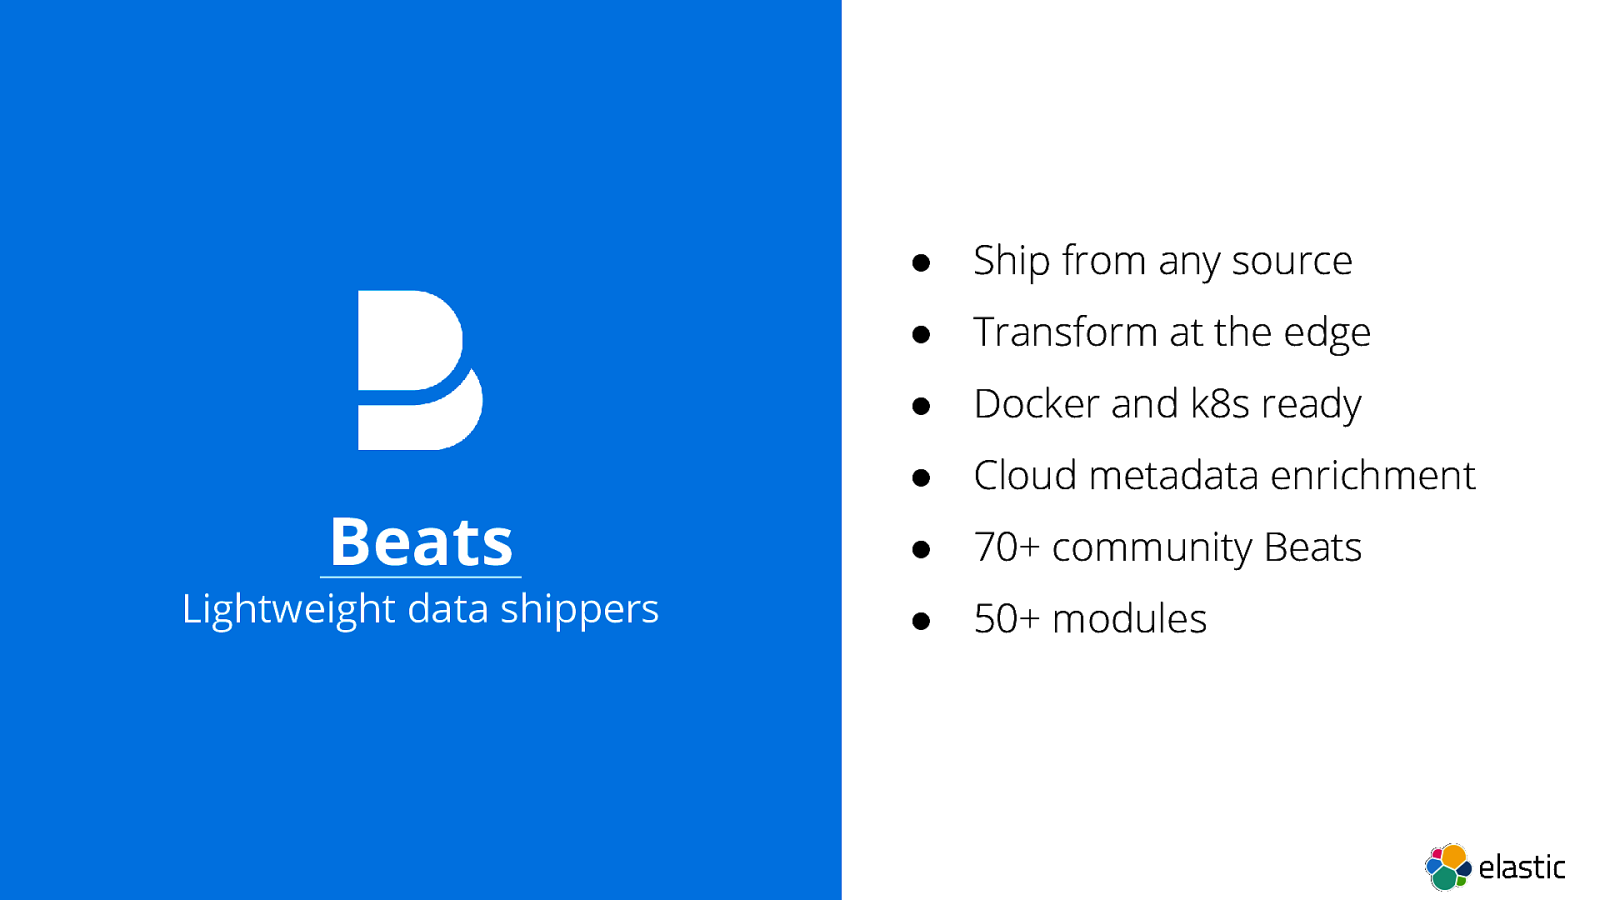
● Ship from any source ● Transform at the edge ● Docker and k8s ready ● Cloud metadata enrichment Beats ● 70+ community Beats Lightweight data shippers ● 50+ modules
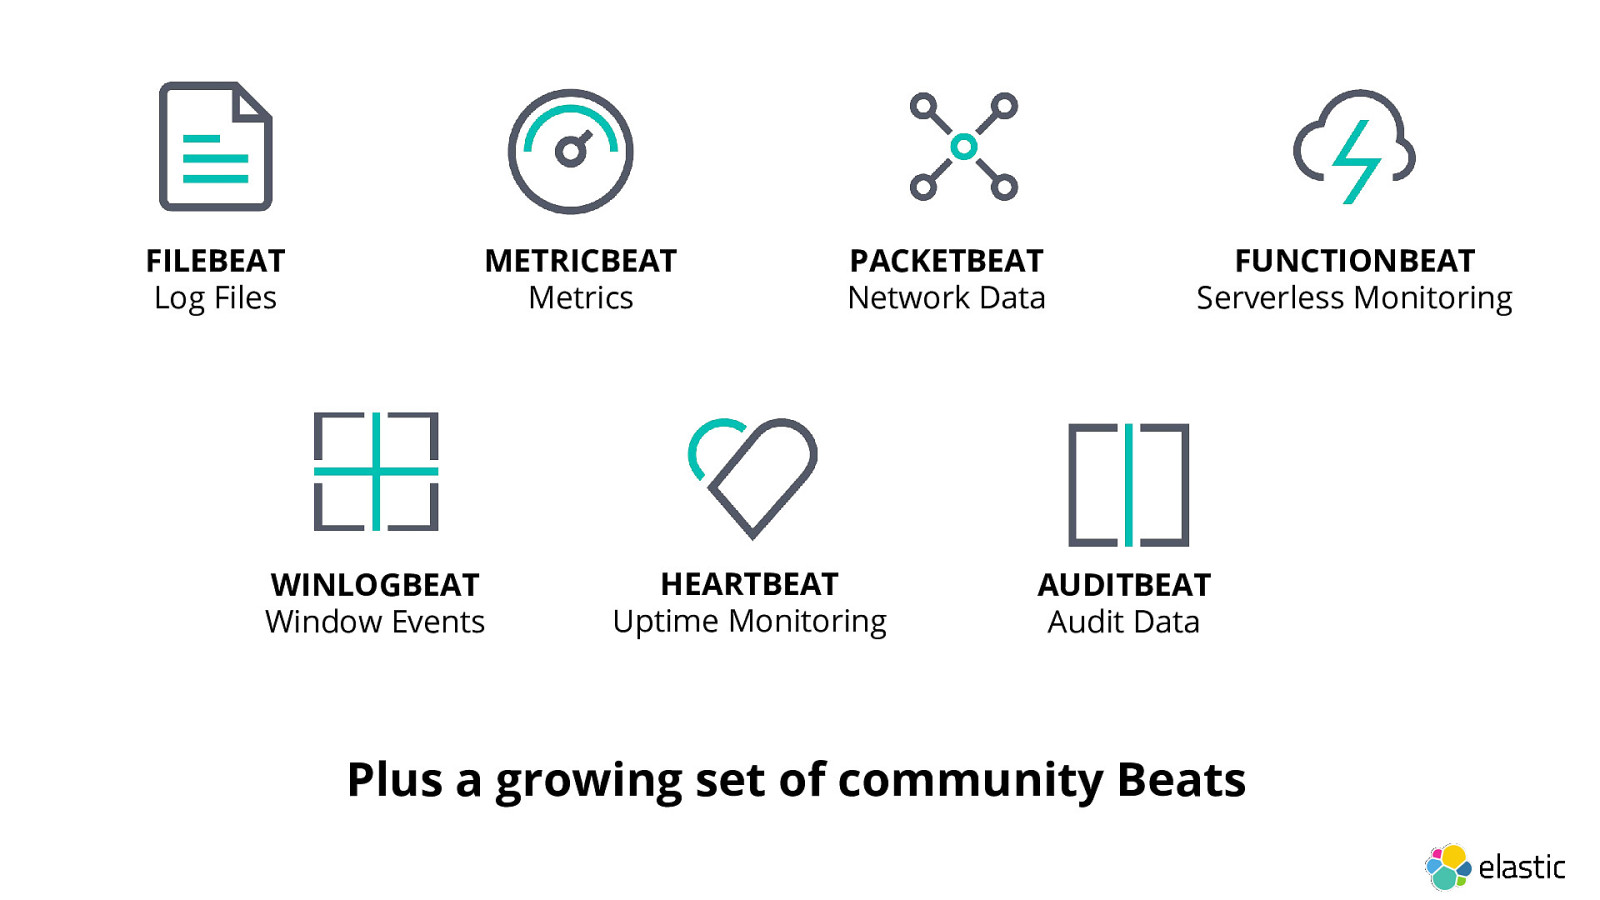
FILEBEAT Log Files METRICBEAT Metrics WINLOGBEAT Window Events PACKETBEAT Network Data HEARTBEAT Uptime Monitoring FUNCTIONBEAT Serverless Monitoring AUDITBEAT Audit Data Plus a growing set of community Beats
Logstash Data processing pipeline ● Flexible ETL engine ● Parse & transform data ● Many inputs & outputs ● Horizontally scalable ● 200+ plugins
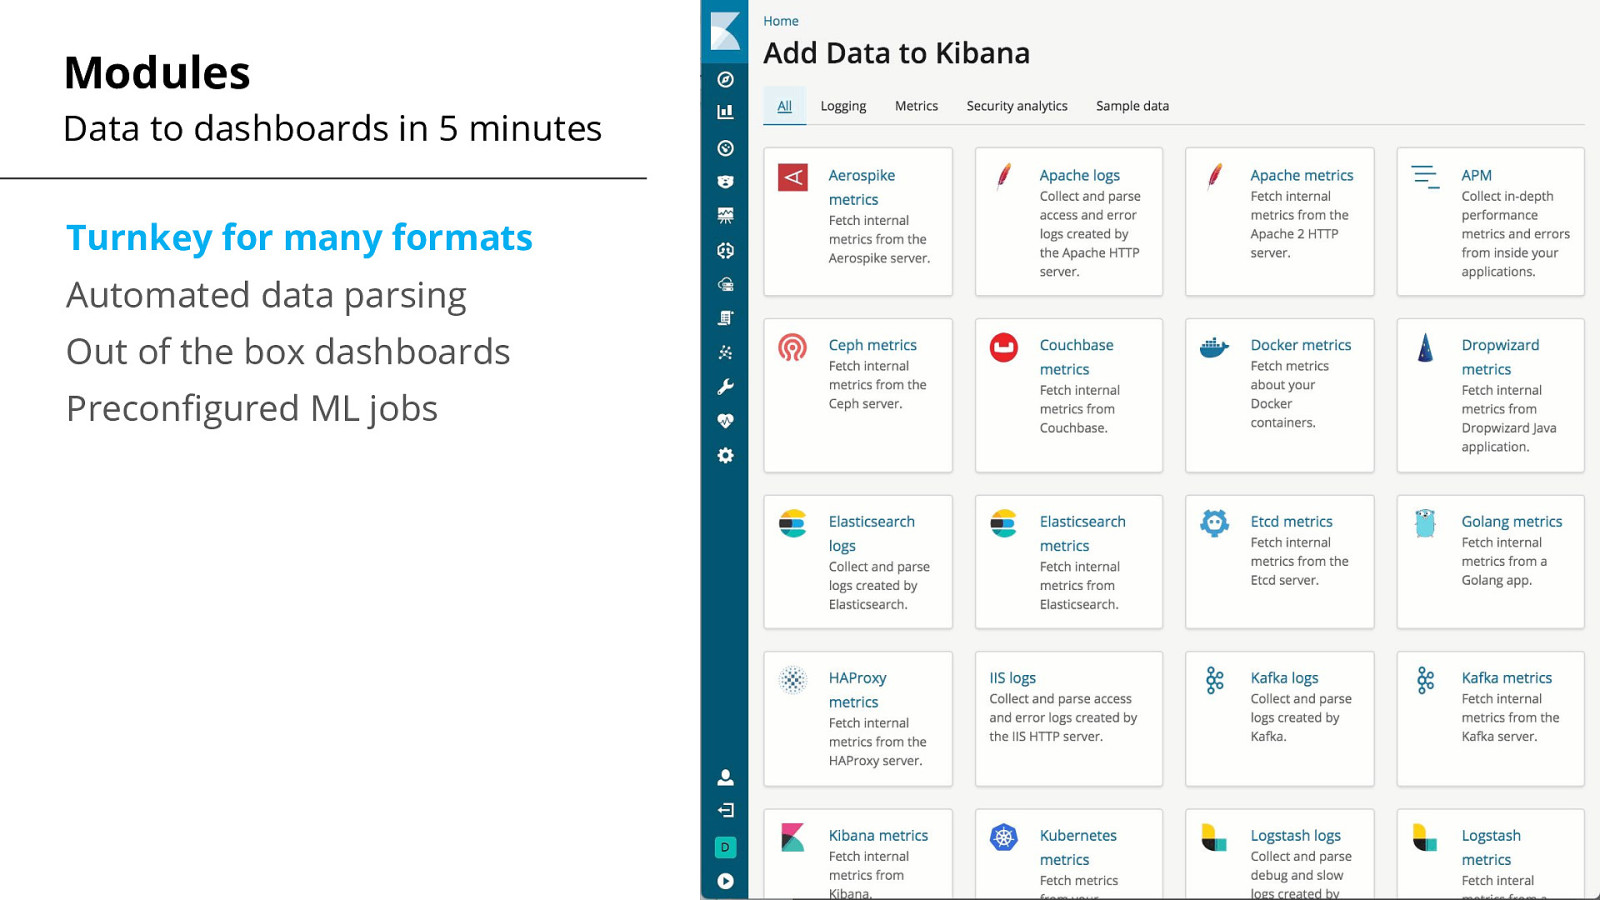
Modules Data to dashboards in 5 minutes Turnkey for many formats Automated data parsing Out of the box dashboards Preconfigured ML jobs
Let’s get started 17
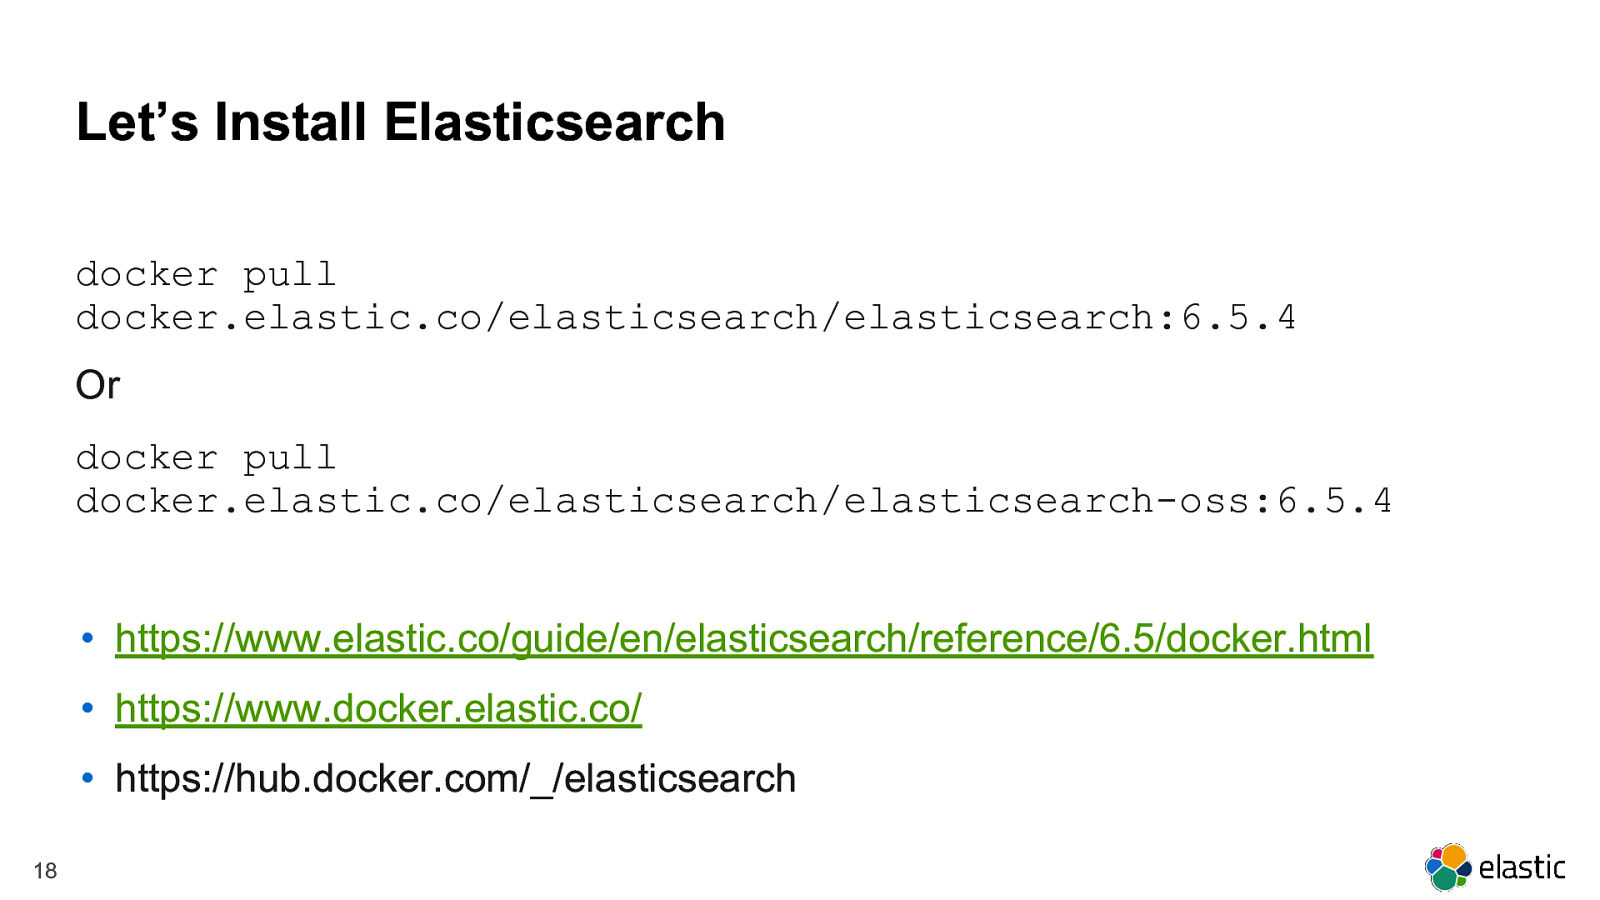
Let’s Install Elasticsearch docker pull docker.elastic.co/elasticsearch/elasticsearch:6.5.4 Or docker pull docker.elastic.co/elasticsearch/elasticsearch-oss:6.5.4 • https://www.elastic.co/guide/en/elasticsearch/reference/6.5/docker.html • https://www.docker.elastic.co/ • https://hub.docker.com/_/elasticsearch 18
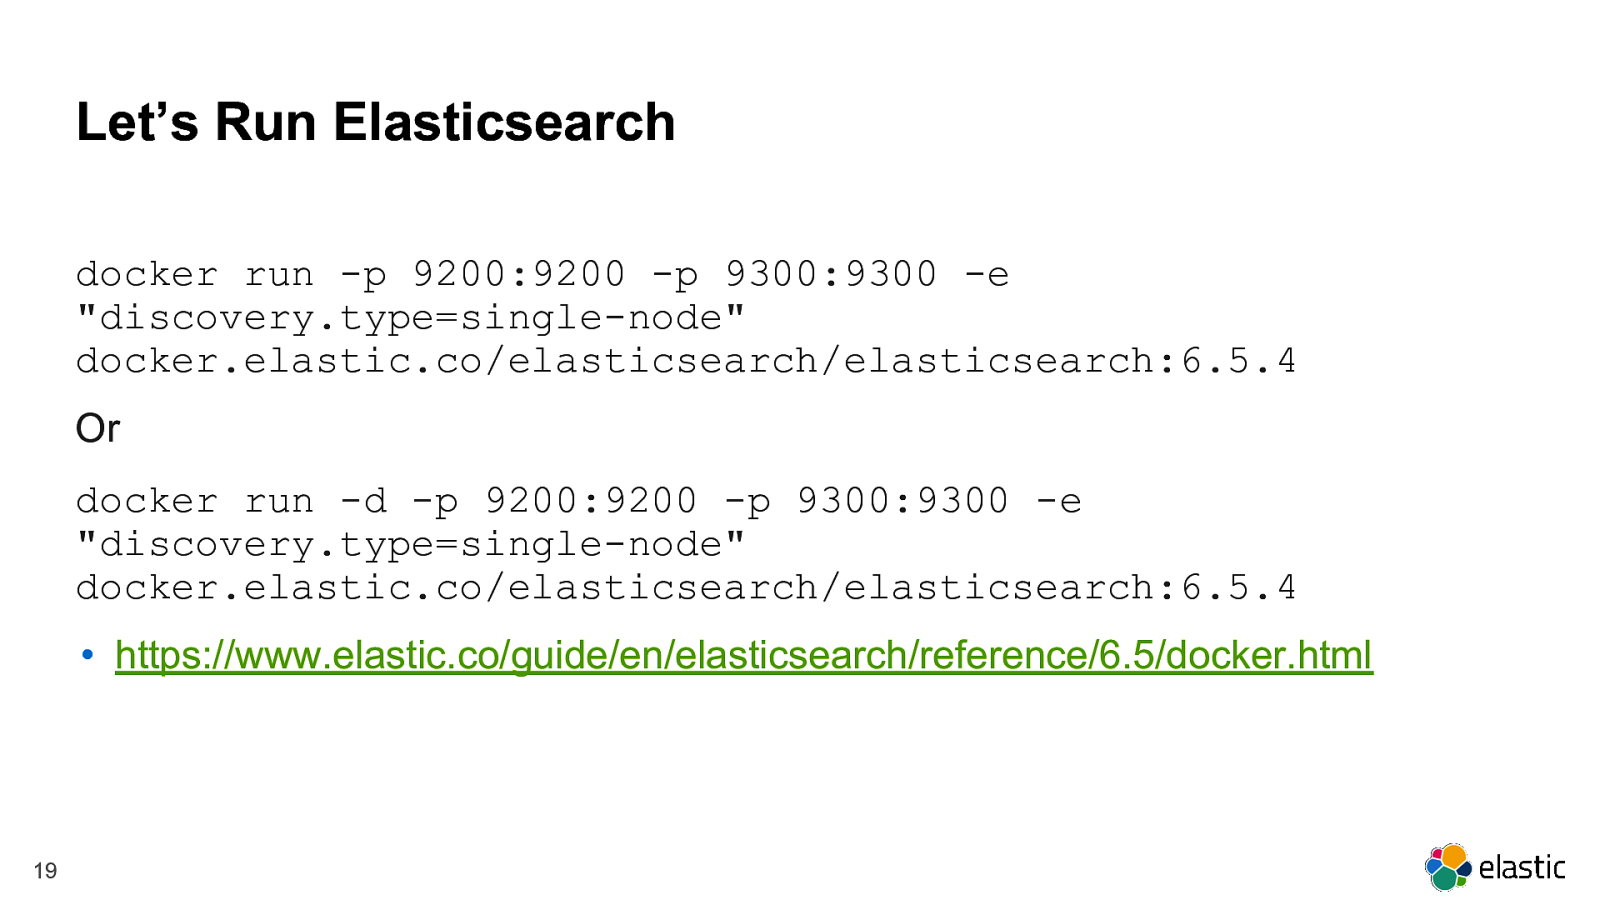
Let’s Run Elasticsearch docker run -p 9200:9200 -p 9300:9300 -e “discovery.type=single-node” docker.elastic.co/elasticsearch/elasticsearch:6.5.4 Or docker run -d -p 9200:9200 -p 9300:9300 -e “discovery.type=single-node” docker.elastic.co/elasticsearch/elasticsearch:6.5.4 • https://www.elastic.co/guide/en/elasticsearch/reference/6.5/docker.html 19
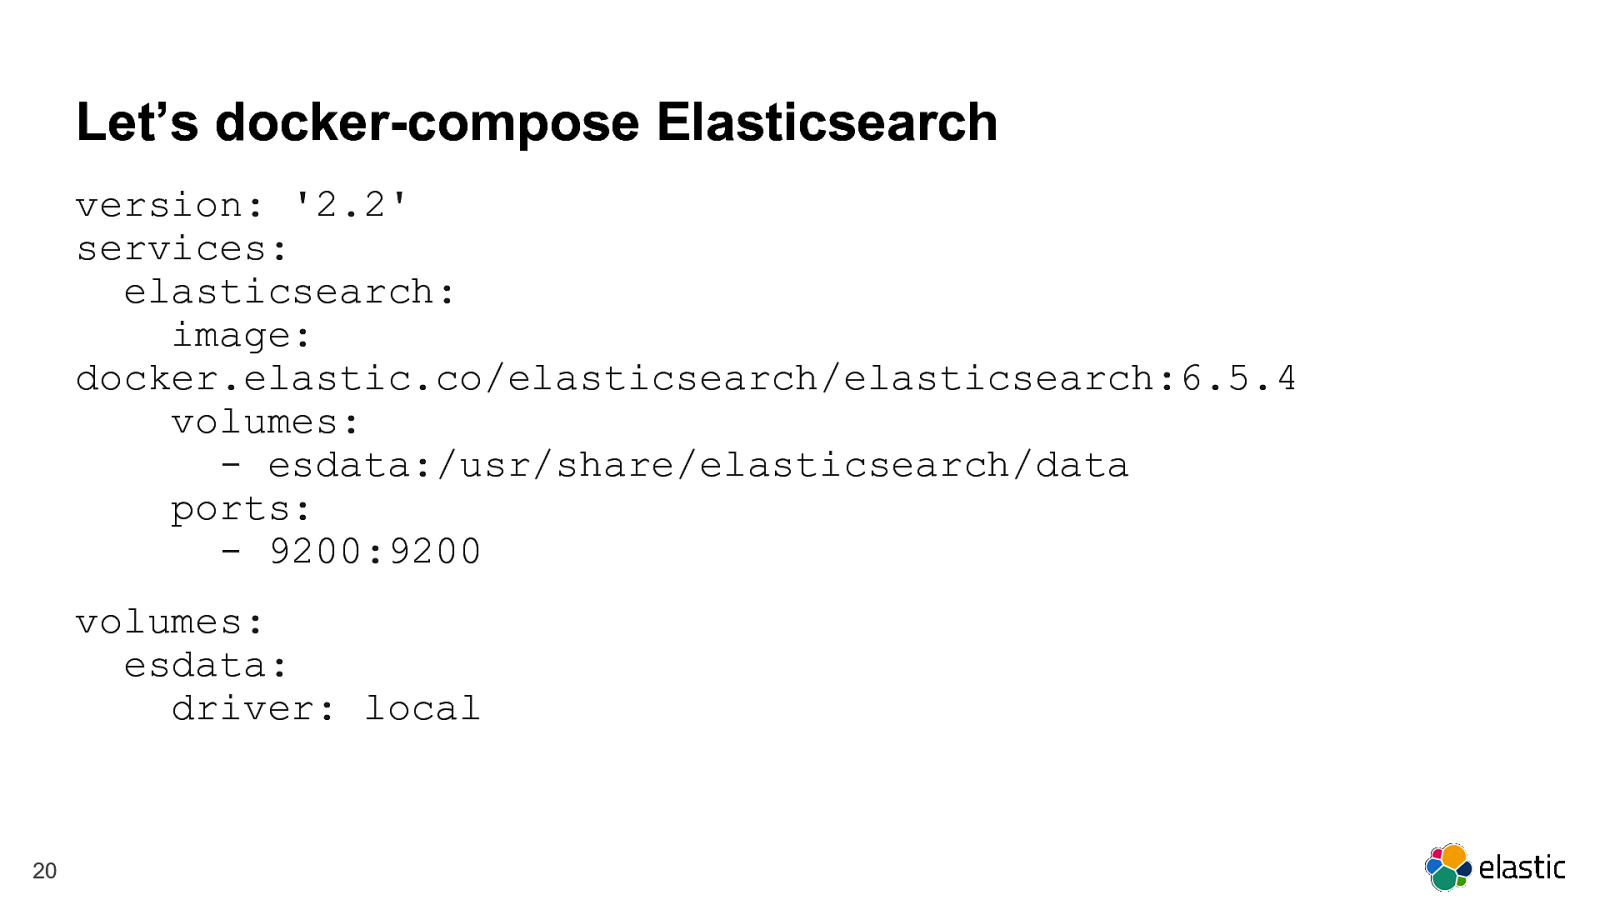
Let’s docker-compose Elasticsearch version: ‘2.2’ services: elasticsearch: image: docker.elastic.co/elasticsearch/elasticsearch:6.5.4 volumes: - esdata:/usr/share/elasticsearch/data ports: - 9200:9200 volumes: esdata: driver: local 20
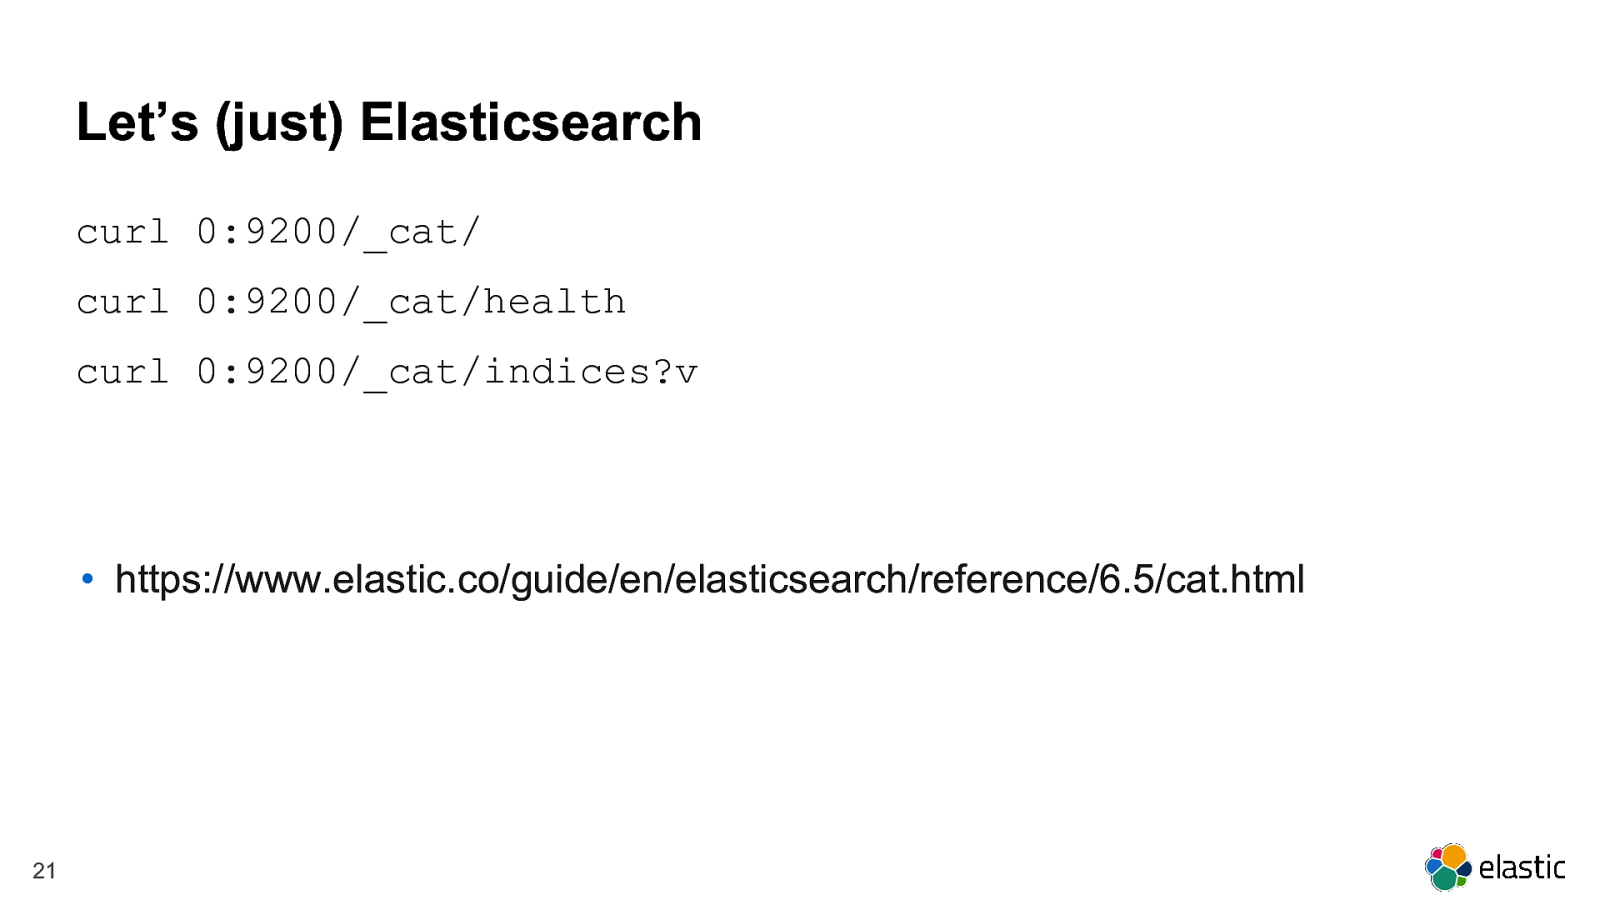
Let’s (just) Elasticsearch curl 0:9200/_cat/ curl 0:9200/_cat/health curl 0:9200/_cat/indices?v • https://www.elastic.co/guide/en/elasticsearch/reference/6.5/cat.html 21
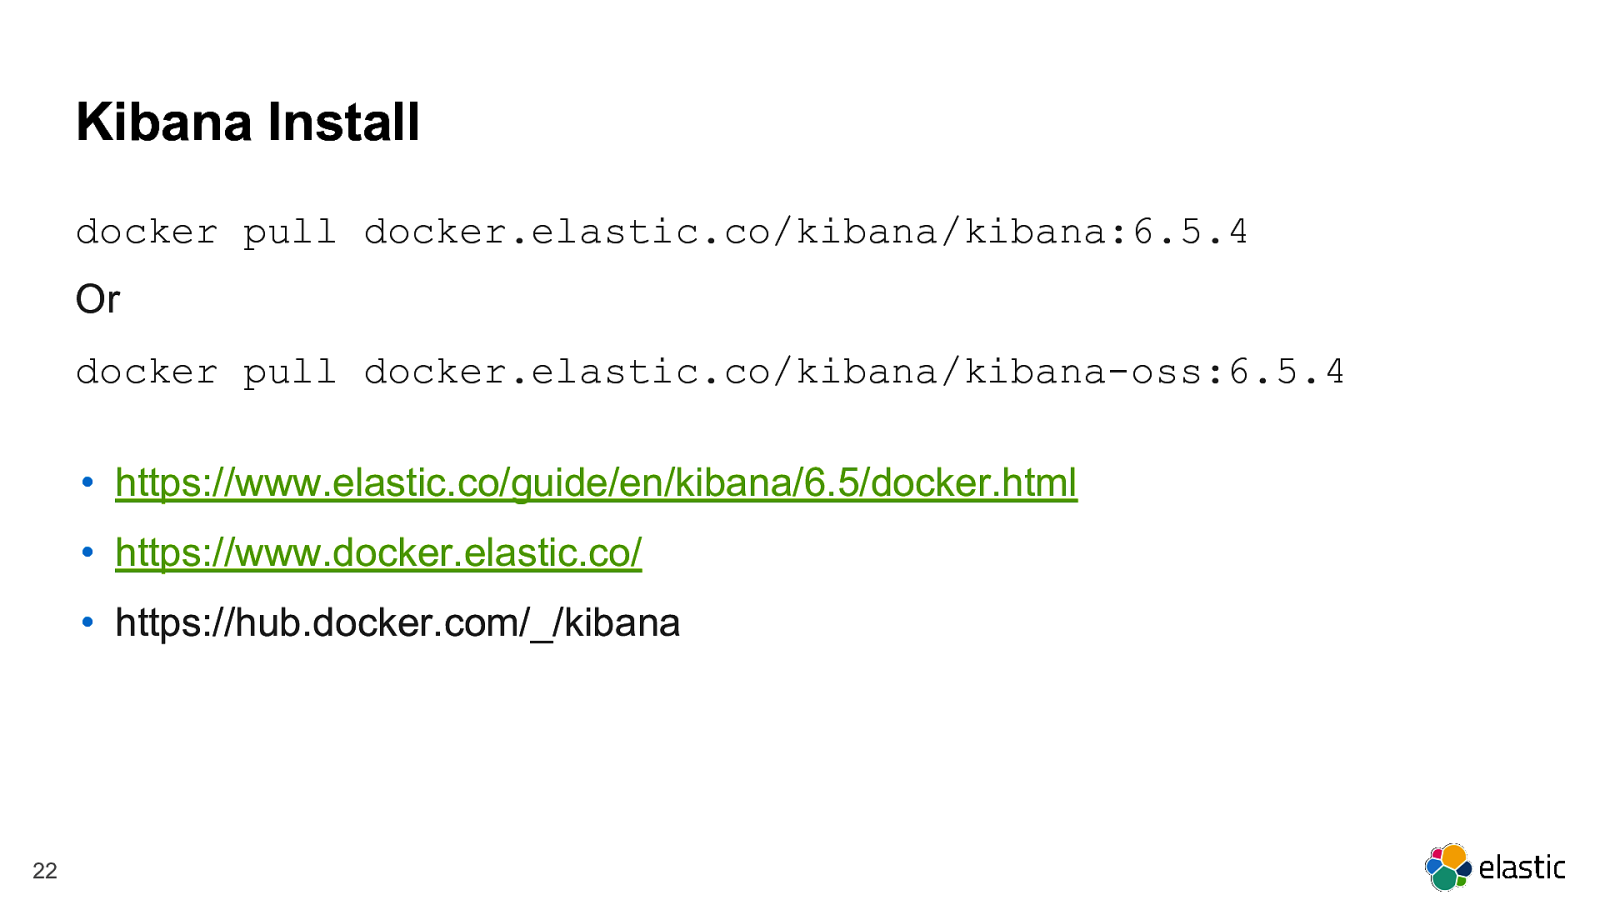
Kibana Install docker pull docker.elastic.co/kibana/kibana:6.5.4 Or docker pull docker.elastic.co/kibana/kibana-oss:6.5.4 • https://www.elastic.co/guide/en/kibana/6.5/docker.html • https://www.docker.elastic.co/ • https://hub.docker.com/_/kibana 22
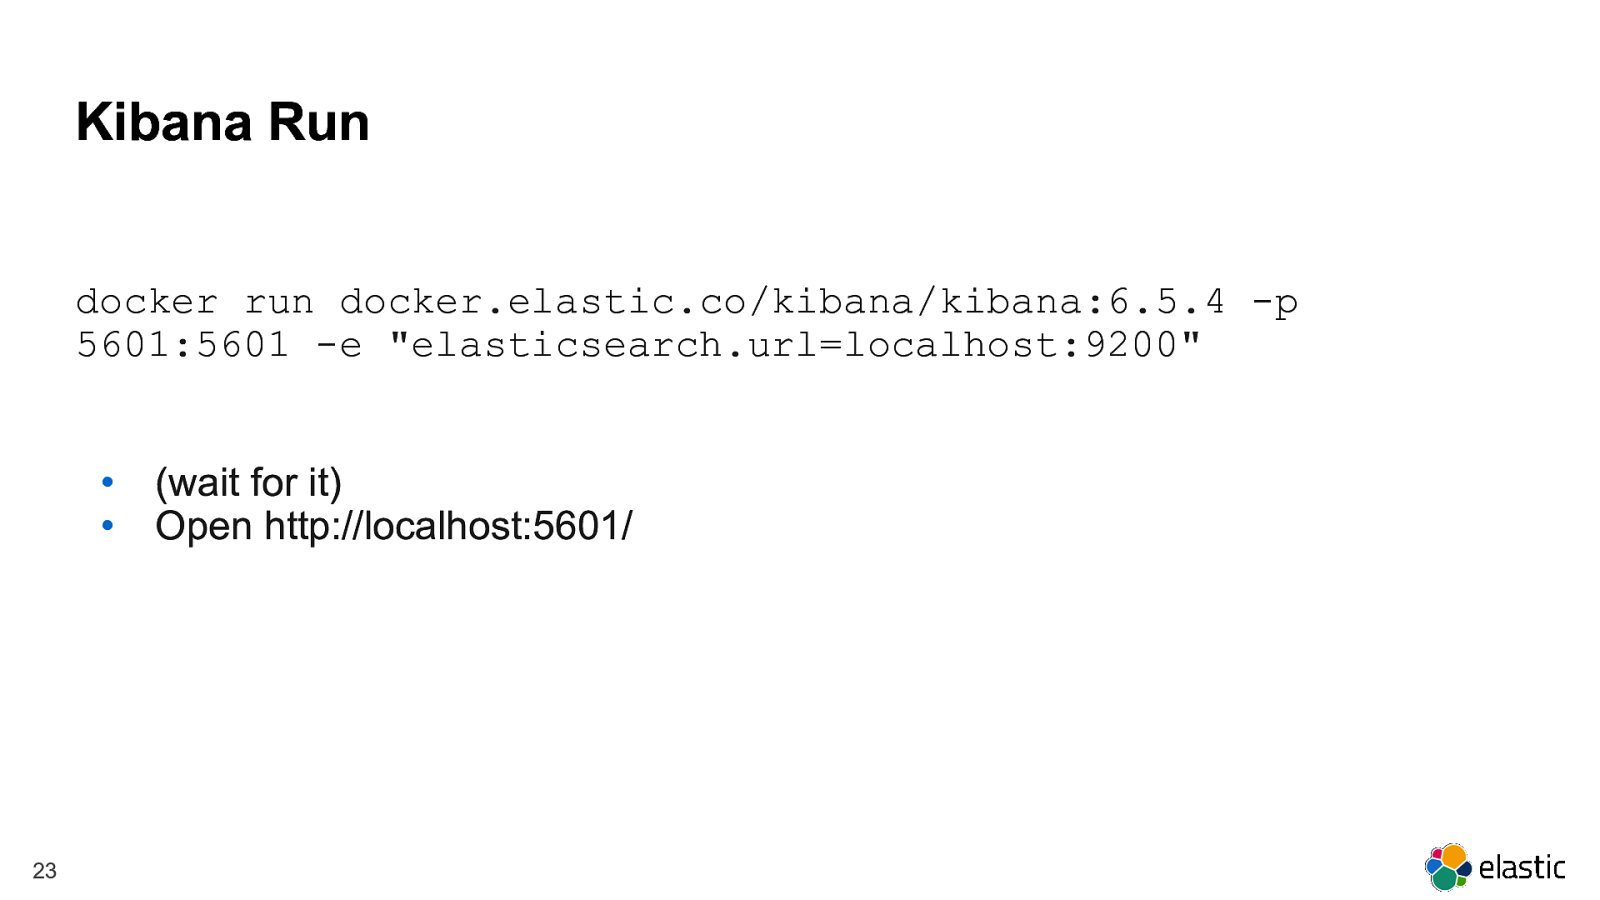
Kibana Run docker run docker.elastic.co/kibana/kibana:6.5.4 -p 5601:5601 -e “elasticsearch.url=localhost:9200” • • 23 (wait for it) Open http://localhost:5601/
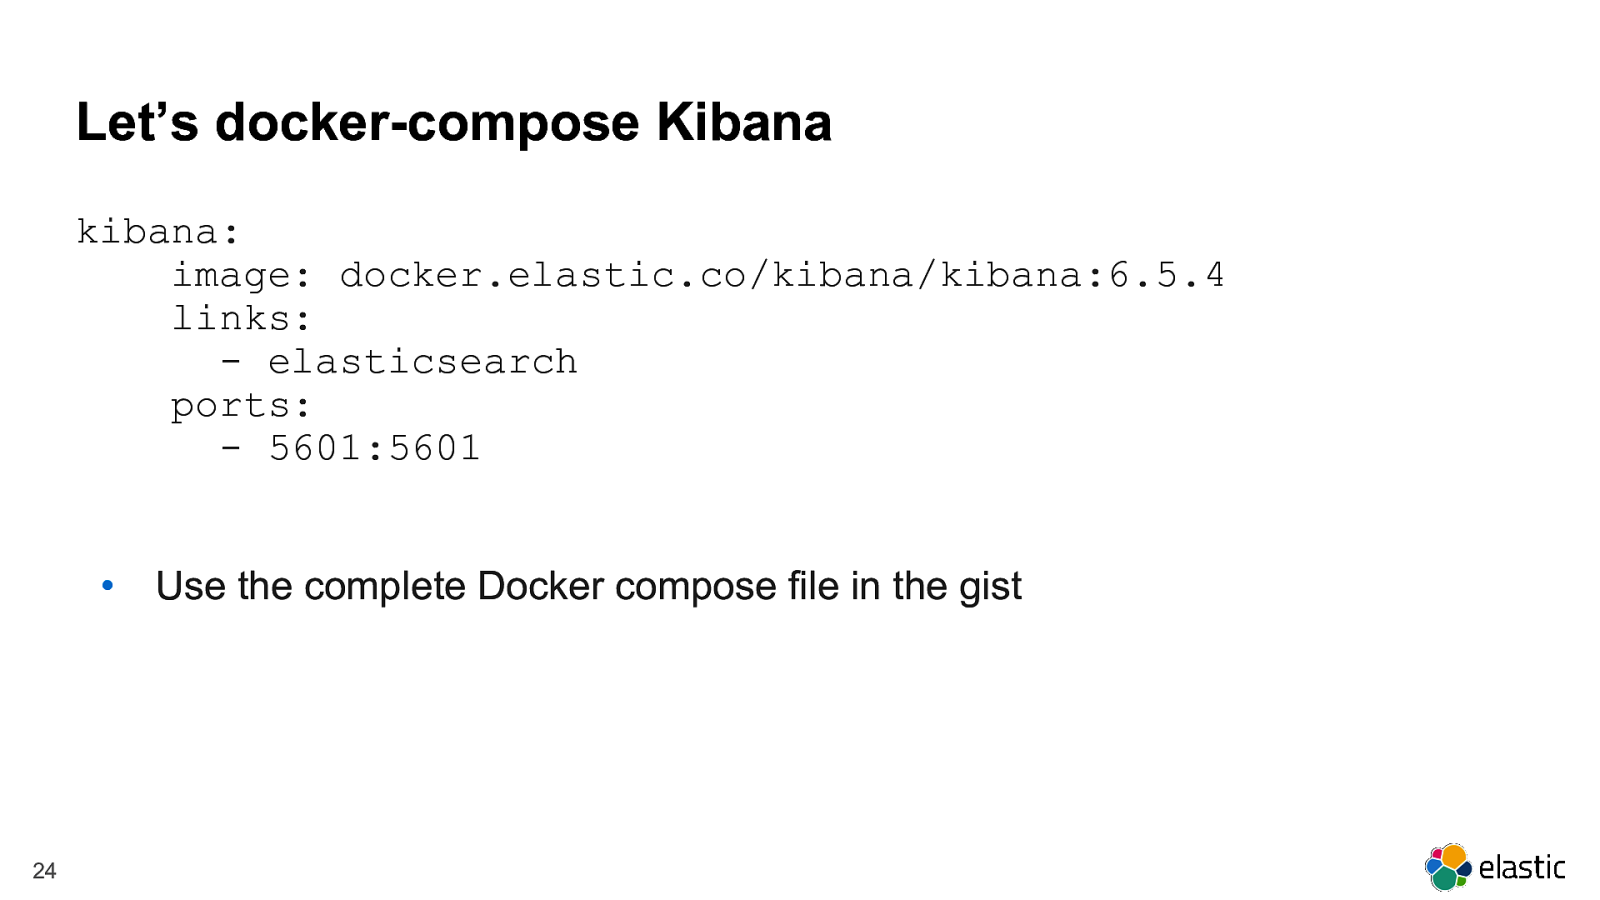
Let’s docker-compose Kibana kibana: image: docker.elastic.co/kibana/kibana:6.5.4 links: - elasticsearch ports: - 5601:5601 • 24 Use the complete Docker compose file in the gist
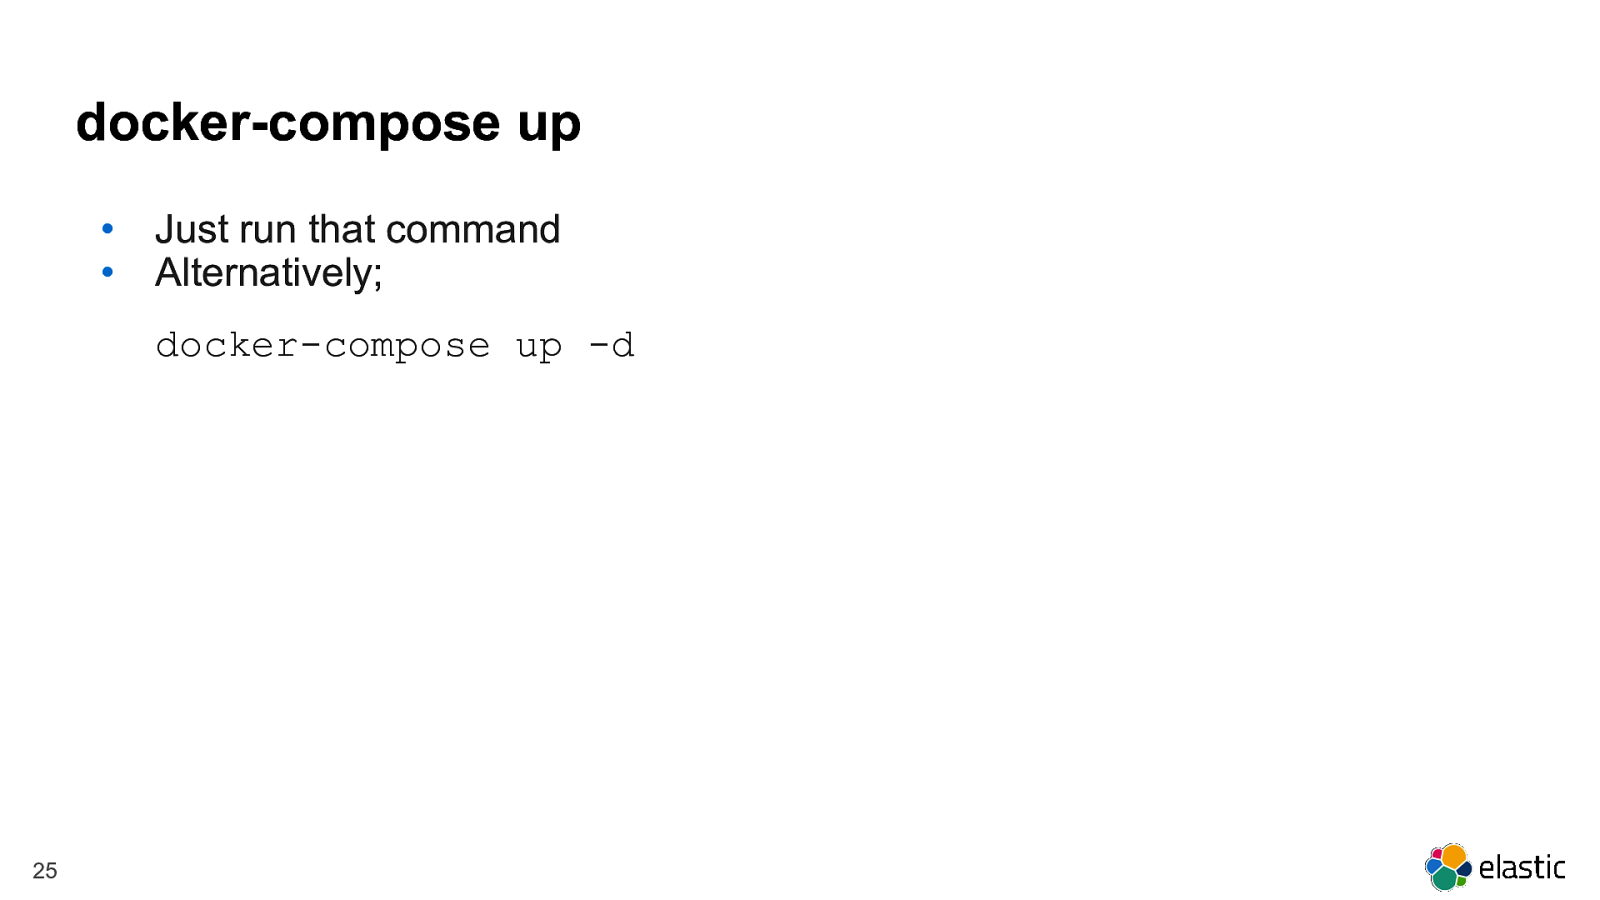
docker-compose up • • Just run that command Alternatively; docker-compose up -d 25
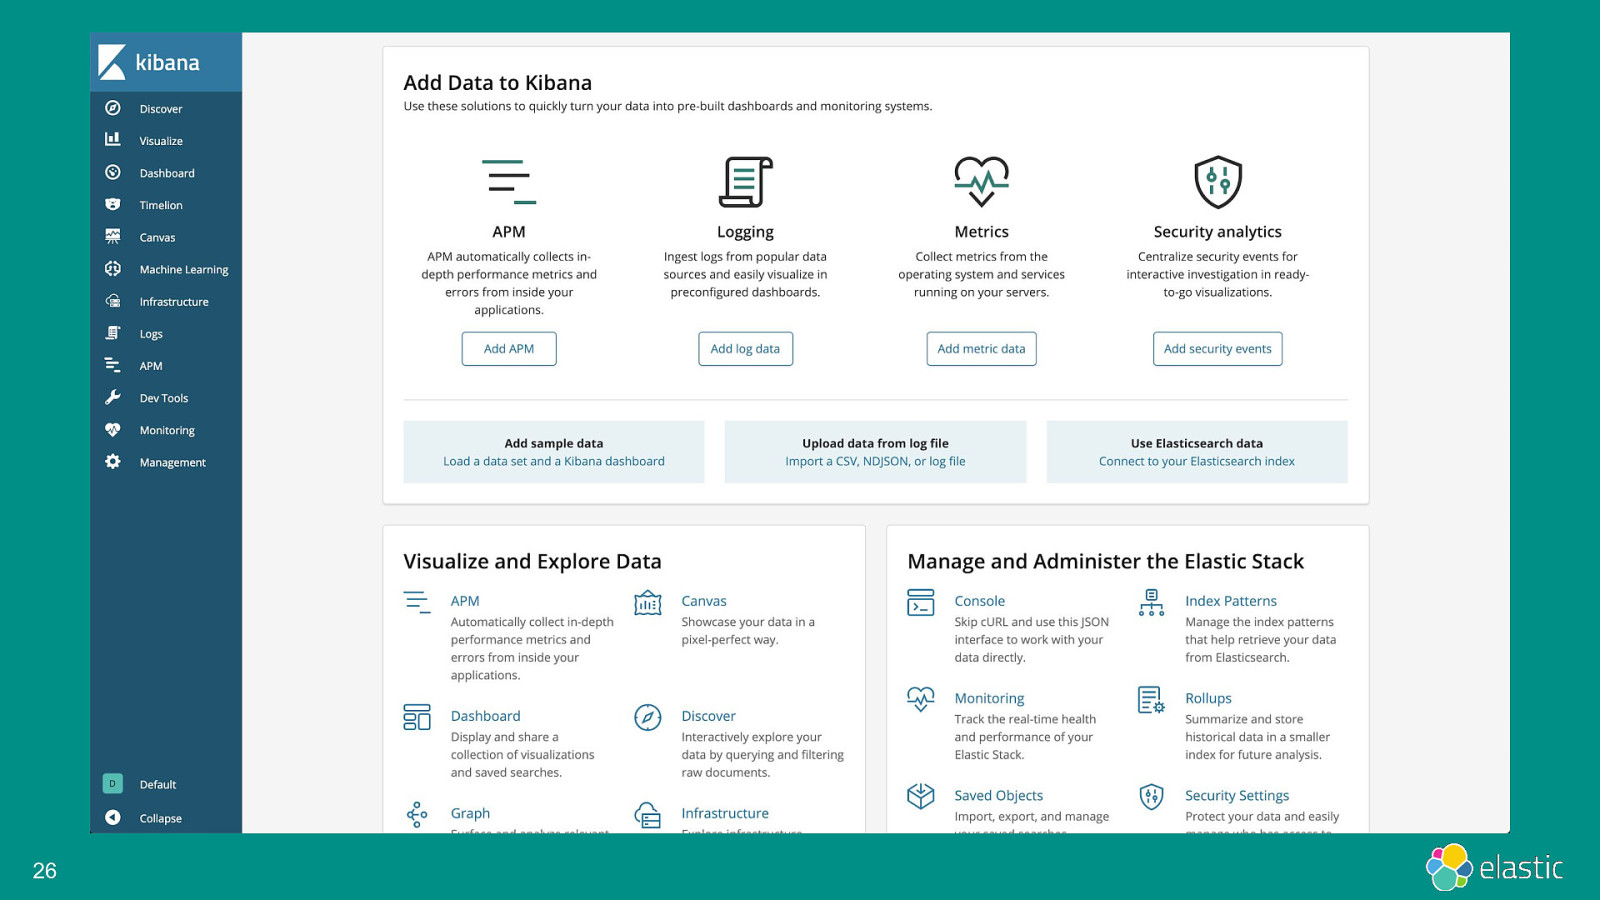
26
Metricbeat https://www.elastic.co/guide/en/beats/metricbeat/current/index.html 27
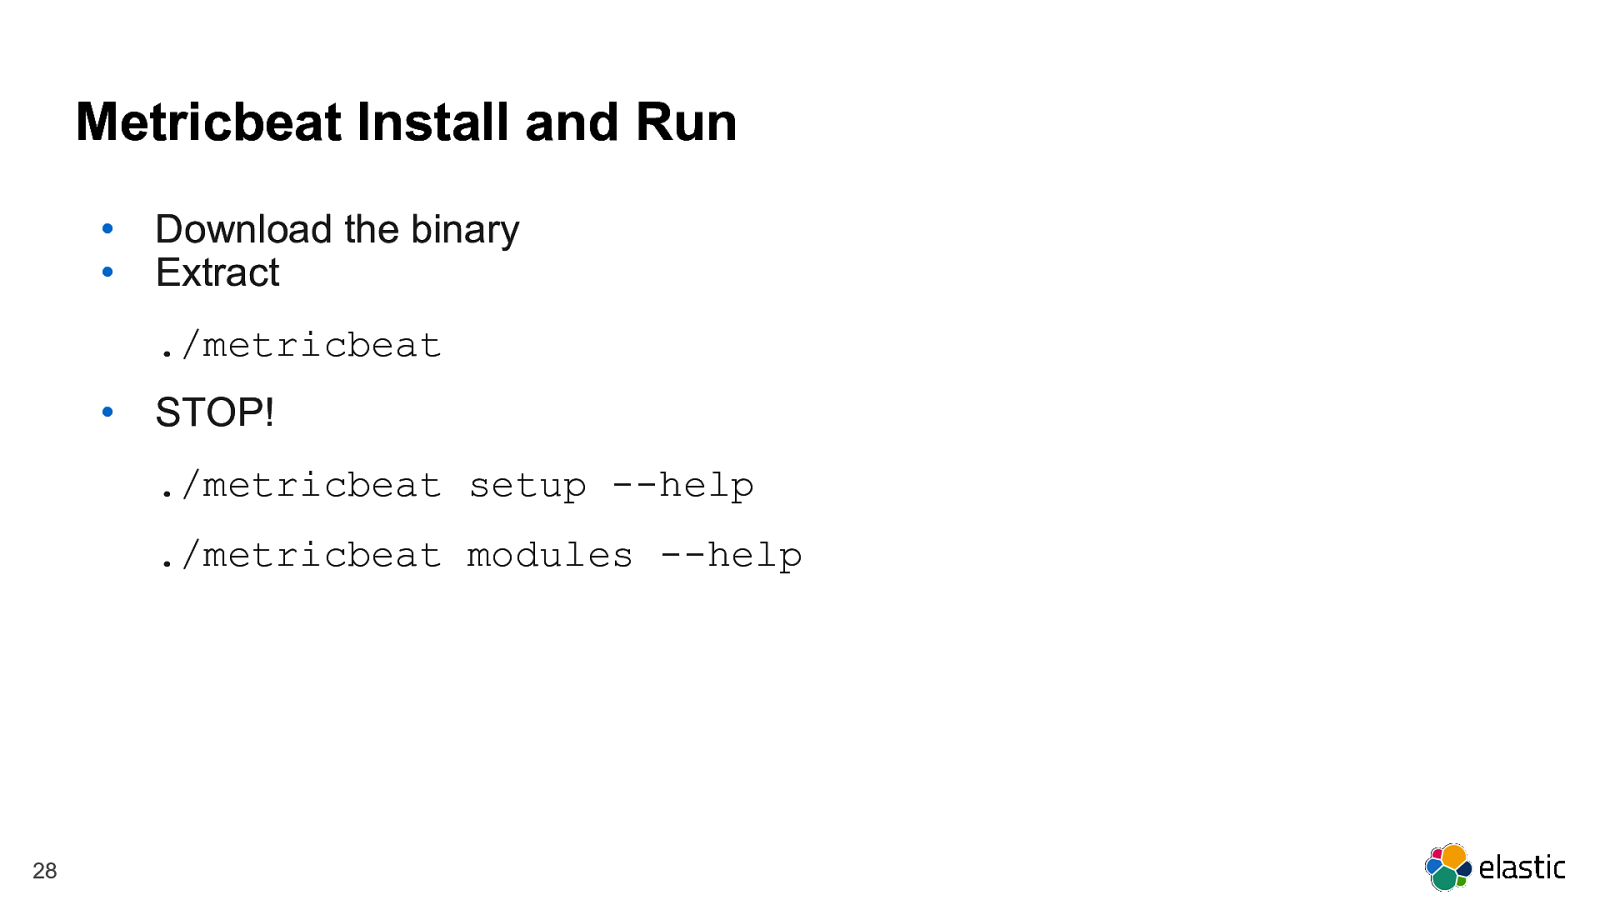
Metricbeat Install and Run • • Download the binary Extract ./metricbeat • STOP! ./metricbeat setup —help ./metricbeat modules —help 28
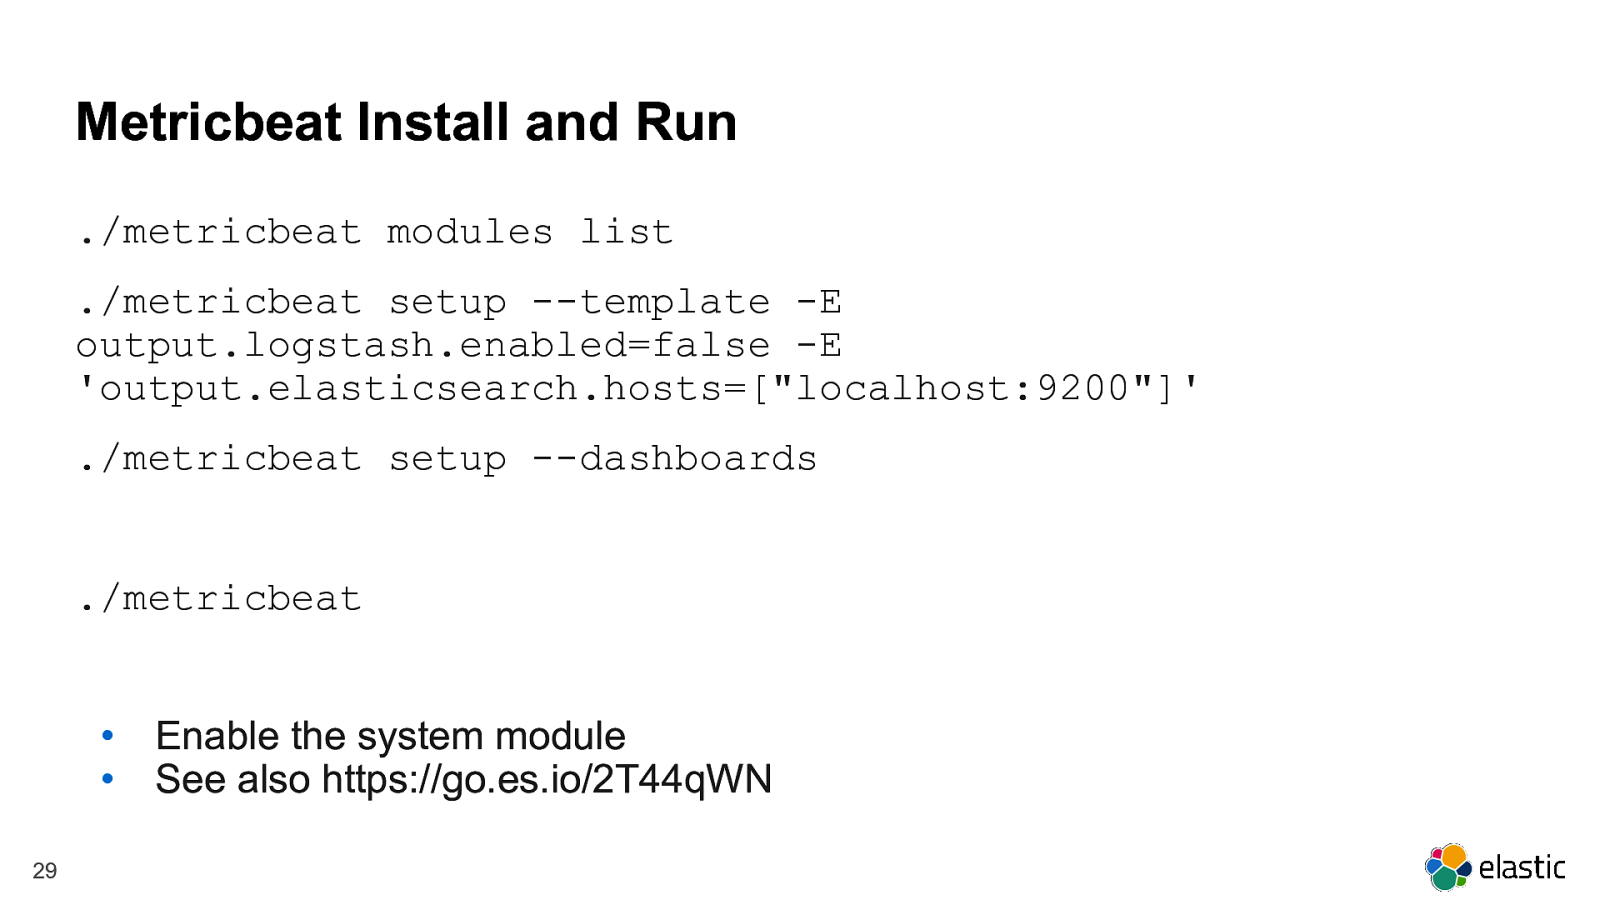
Metricbeat Install and Run ./metricbeat modules list ./metricbeat setup —template -E output.logstash.enabled=false -E ‘output.elasticsearch.hosts=[“localhost:9200”]’ ./metricbeat setup —dashboards ./metricbeat • • 29 Enable the system module See also https://go.es.io/2T44qWN
Filebeat https://www.elastic.co/guide/en/beats/filebeat/current/index.html 30
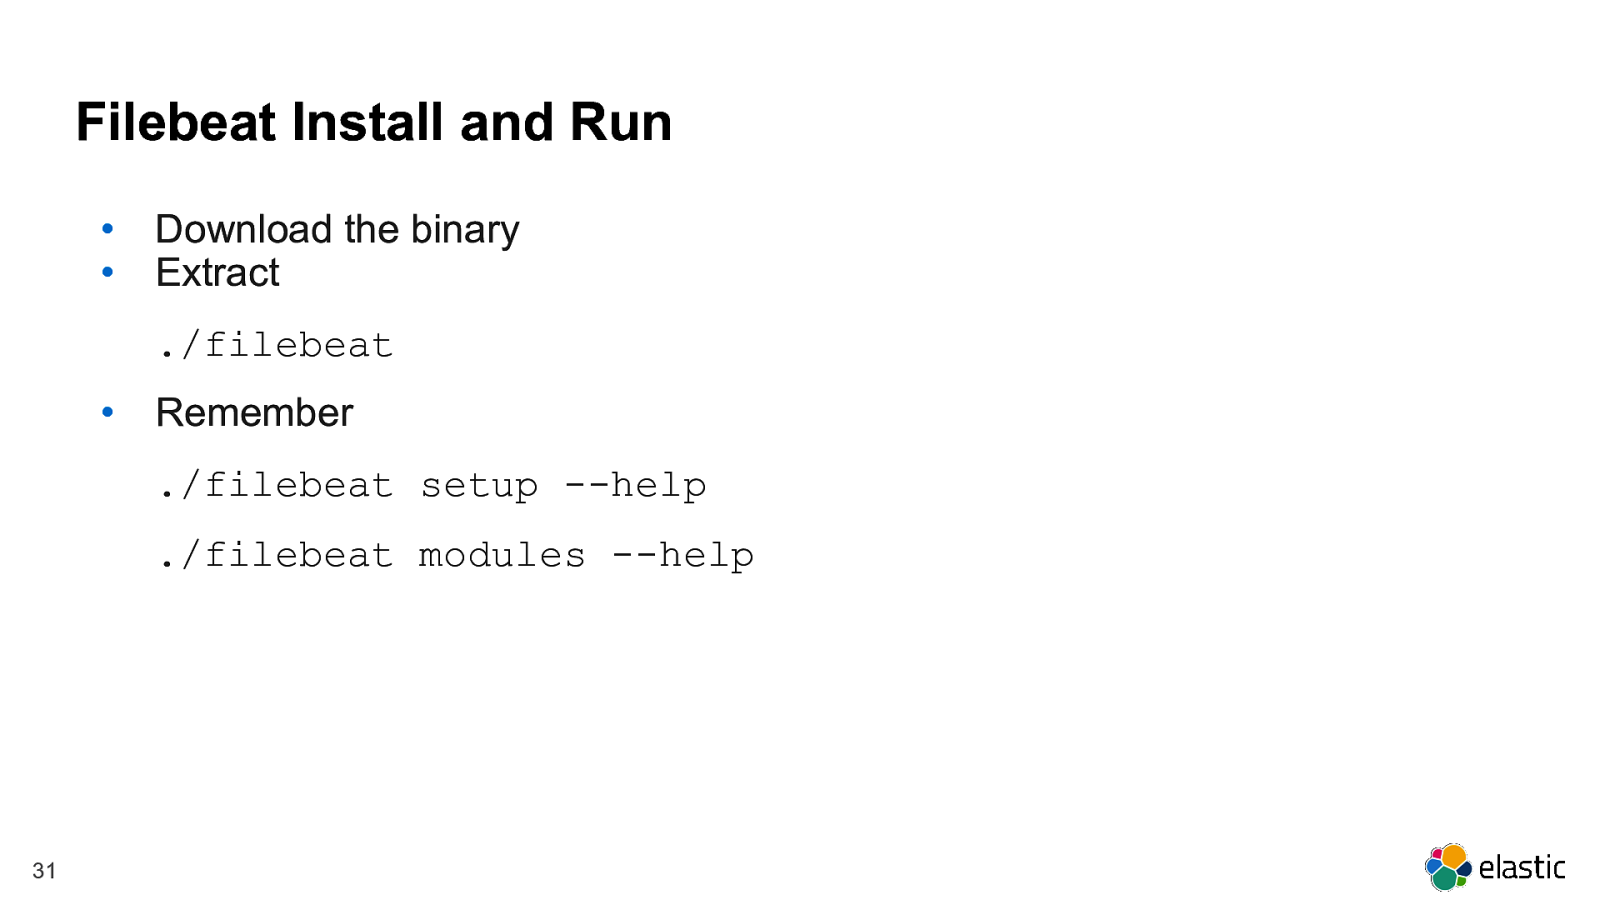
Filebeat Install and Run • • Download the binary Extract ./filebeat • Remember ./filebeat setup —help ./filebeat modules —help 31
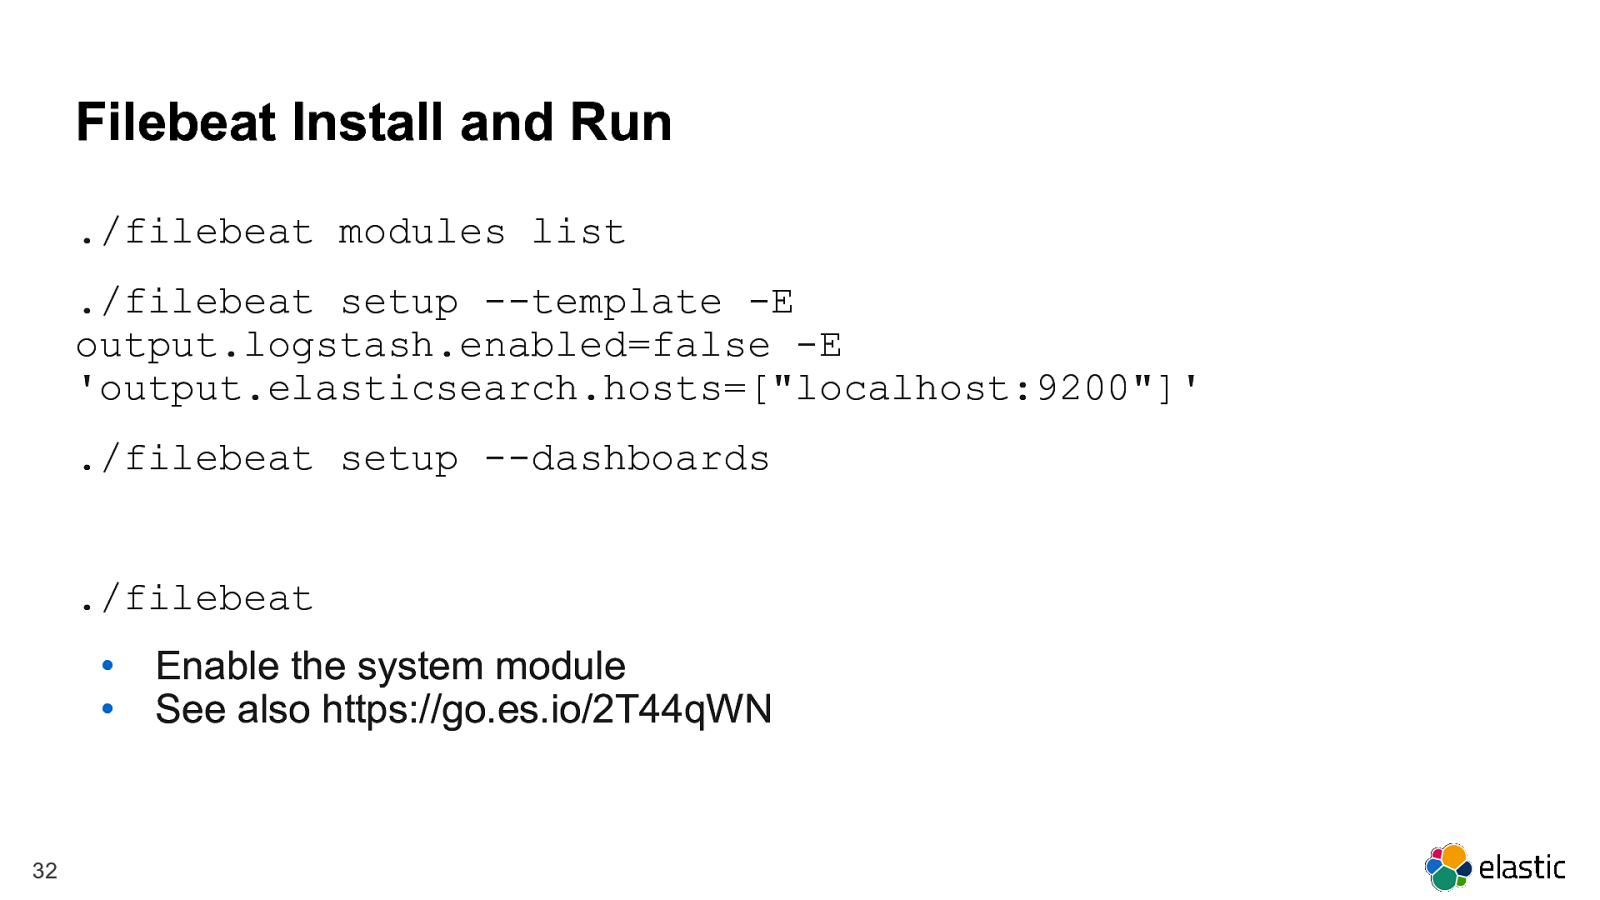
Filebeat Install and Run ./filebeat modules list ./filebeat setup —template -E output.logstash.enabled=false -E ‘output.elasticsearch.hosts=[“localhost:9200”]’ ./filebeat setup —dashboards ./filebeat • • 32 Enable the system module See also https://go.es.io/2T44qWN
Let’s kick it up a notch 33
Metricbeat - Enable the docker module Filebeat - Enable the docker input 34
Let’s analyse Elasticsearch traffic! 35
Packetbeat https://www.elastic.co/guide/en/beats/packetbeat/current/index.html 36
Packetbeat Install and Run • • Download the binary Extract ./packetbeat • Remember ./packetbeat setup —help ./packetbeat modules —help 37
Metricbeat Install and Run ./packetbeat modules list ./packetbeat setup —template -E output.logstash.enabled=false -E ‘output.elasticsearch.hosts=[“localhost:9200”]’ ./packetbeat setup —dashboards ./packetbeat • 38 See also https://go.es.io/2T44qWN
Heartbeat https://www.elastic.co/guide/en/beats/heartbeat/current/index.html 39
Heartbeat Install and Run • • Download the binary Extract ./heartbeat • Remember ./heartbeat setup —help ./heartbeat modules —help 40
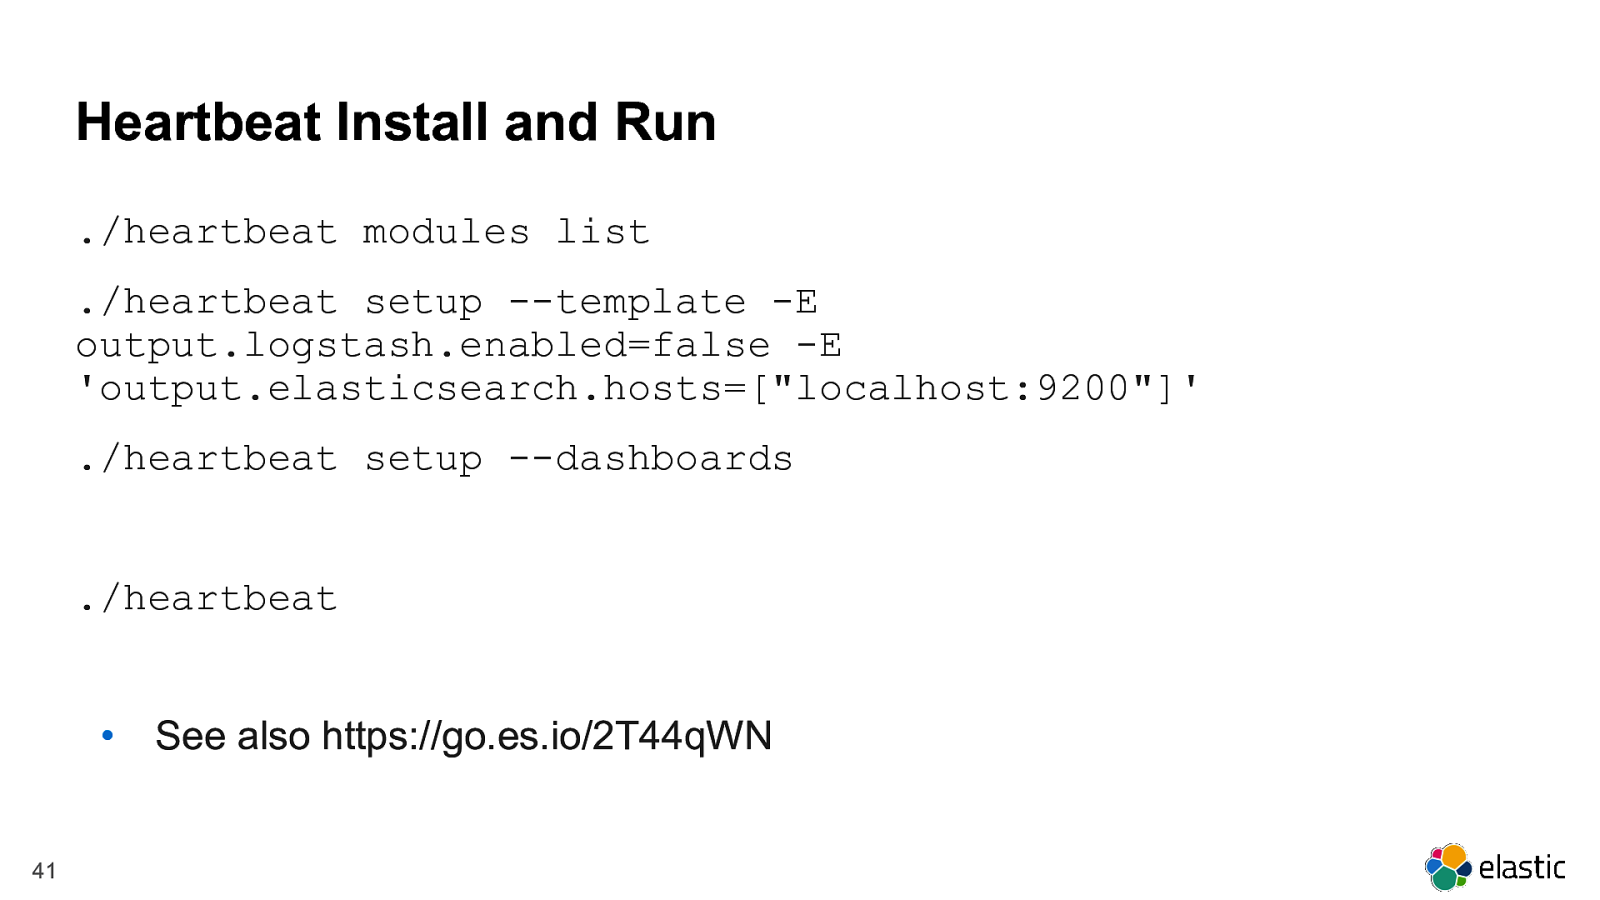
Heartbeat Install and Run ./heartbeat modules list ./heartbeat setup —template -E output.logstash.enabled=false -E ‘output.elasticsearch.hosts=[“localhost:9200”]’ ./heartbeat setup —dashboards ./heartbeat • 41 See also https://go.es.io/2T44qWN
Community beats Logstash! Elasticsearch Ingest [Heart|Winlog|DIY]beat APM Dashboards 42
Whakawhetai Koe! LINUX.CONF.AU LINUX.CONF.AU 21-25 January 2019 | Christchurch | NZ 21-25 January 2019 Christchurch, NZ The Linux of Things The Linux of Things #LCA2019 | @linuxconfau | #LCA2019 @linuxconfau

IoT is great, until something breaks or you want to see how things perform at scale! To handle the volumes of data that any IoT project can generate, many developers default to Open Source tool chains to capture and analyse logs and metrics, and then pinpoint errors, faults or inefficiencies in their systems.
One of the most widely used Open Source tools for this is the Elastic Stack:
This workshop gives you an overview of the four technologies, how they work together and how, from microservice logs to IoT metrics to containerised apps, it has you covered.
At the end of the workshop, you’ll walk away with a set of connected Docker containers capturing logs and metrics from your laptop, a head start on dashboards for analysis, and ideas to deploy for your next project.
https://linux.conf.au/schedule/presentation/161/
The following resources were mentioned during the presentation or are useful additional information.
The following code examples from the presentation can be tried out live.


 for free. You
can too.
for free. You
can too.