o_Research Survey Says! Get Better Data with UX Lauren Isaacson, MBA Market & UX Research Consultant Curio Research 1 Photo by Curtis MacNewton on Unsplash

A presentation at Digital Summit in June 2018 in Portland, OR, USA by Lauren Isaacson
o_Research Survey Says! Get Better Data with UX Lauren Isaacson, MBA Market & UX Research Consultant Curio Research 1 Photo by Curtis MacNewton on Unsplash
o_Research Thank you for being here! 2 Photo by Ricky Kharawala on Unsplash
.stackpathdns.com/9152012004322nXqEh.jpeg 3 www.curioresearch.net
https://c1.staticflickr.com/4/3064/4566278908_c97b3a557a.jpg 4 www.curioresearch.net

Photo by Ken Treloar on Unsplash 5 Surveys! What Are They Good For? Absolutely Something www.curioresearch.net

o_Research We love to send surveys 6 Photo by Nong Vang on Unsplash
M_V76_D622_Lord_kelvin_with_his_compass.png 7 If you cannot measure it, you cannot improve it. LO R D K E LV I N www.curioresearch.net

8 easy www.curioresearch.net
9 www.curioresearch.net

o_Research We hate to get surveys 10 Photo by Andre Hunter on Unsplash

https://upload.wikimedia.org/wikipedia/commons/thumb/f/f0/Busy_desk.svg/2000px-Busy_desk.svg.png 11 www.curioresearch.net

https://cdn.pixabay.com/photo/2012/05/04/10/56/work-47200_960_720.png 12 www.curioresearch.net
13 www.curioresearch.net

06/5279525928_199804e5c9_b.jpg 14 www.curioresearch.net

15 What Makes a Good Survey? dgallery.com/pictures/survey.jpg www.curioresearch.net

o_Research Keep it short 16 Photo by Meg Kannan on Unsplash
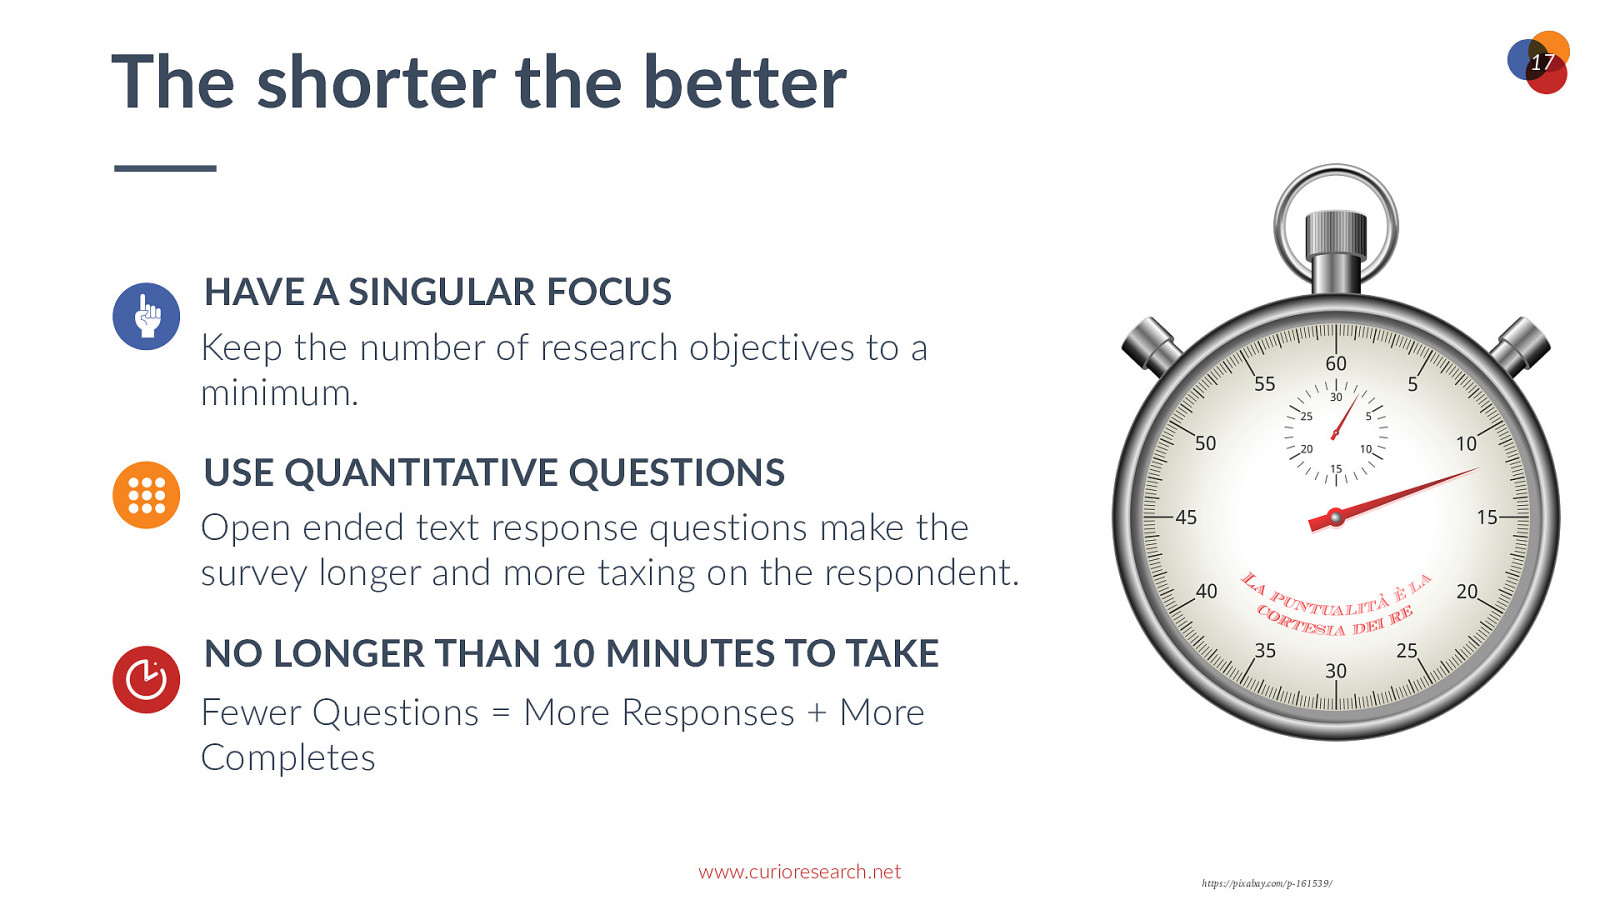
The shorter the better 17 HAVE A SINGULAR FOCUS Keep the number of research objectives to a minimum. USE QUANTITATIVE QUESTIONS Open ended text response questions make the survey longer and more taxing on the respondent. NO LONGER THAN 10 MINUTES TO TAKE Fewer Questions = More Responses + More Completes www.curioresearch.net https://pixabay.com/p-161539/
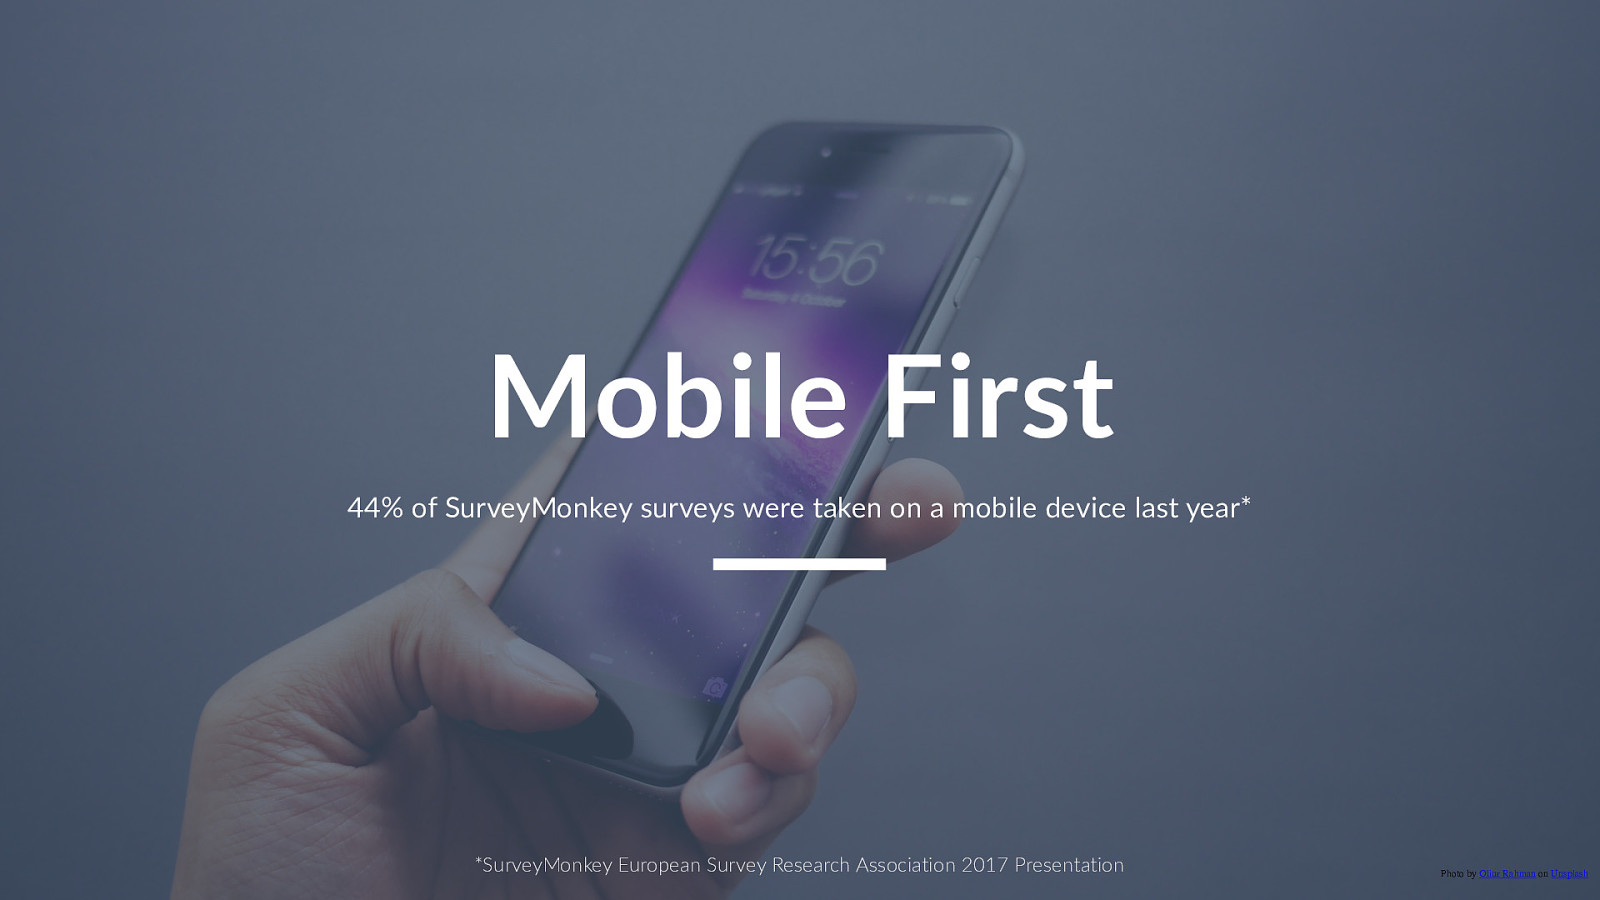
o_Research Mobile First 44% of SurveyMonkey surveys were taken on a mobile device last year* *SurveyMonkey European Survey Research Association 2017 Presentation 18 Photo by Oliur Rahman on Unsplash

o_Research Do you really need to ask that? Really? Are you sure? If you knew this information, what would you do? 19 a href=”hBps://www.flickr.com/photos/7342411@N02/4865201576/
o_Research Make all questions tweet* length questions Simply stated. Direct. Clear. Jargon free. *Classic 140, let’s not get started on 280 20

o_Research Be friendly Not formal 21 Photo by Alex Knight on Unsplash
o_Research Help respondents give you correct answers 22 Photo by Kelly Sikkema on Unsplash
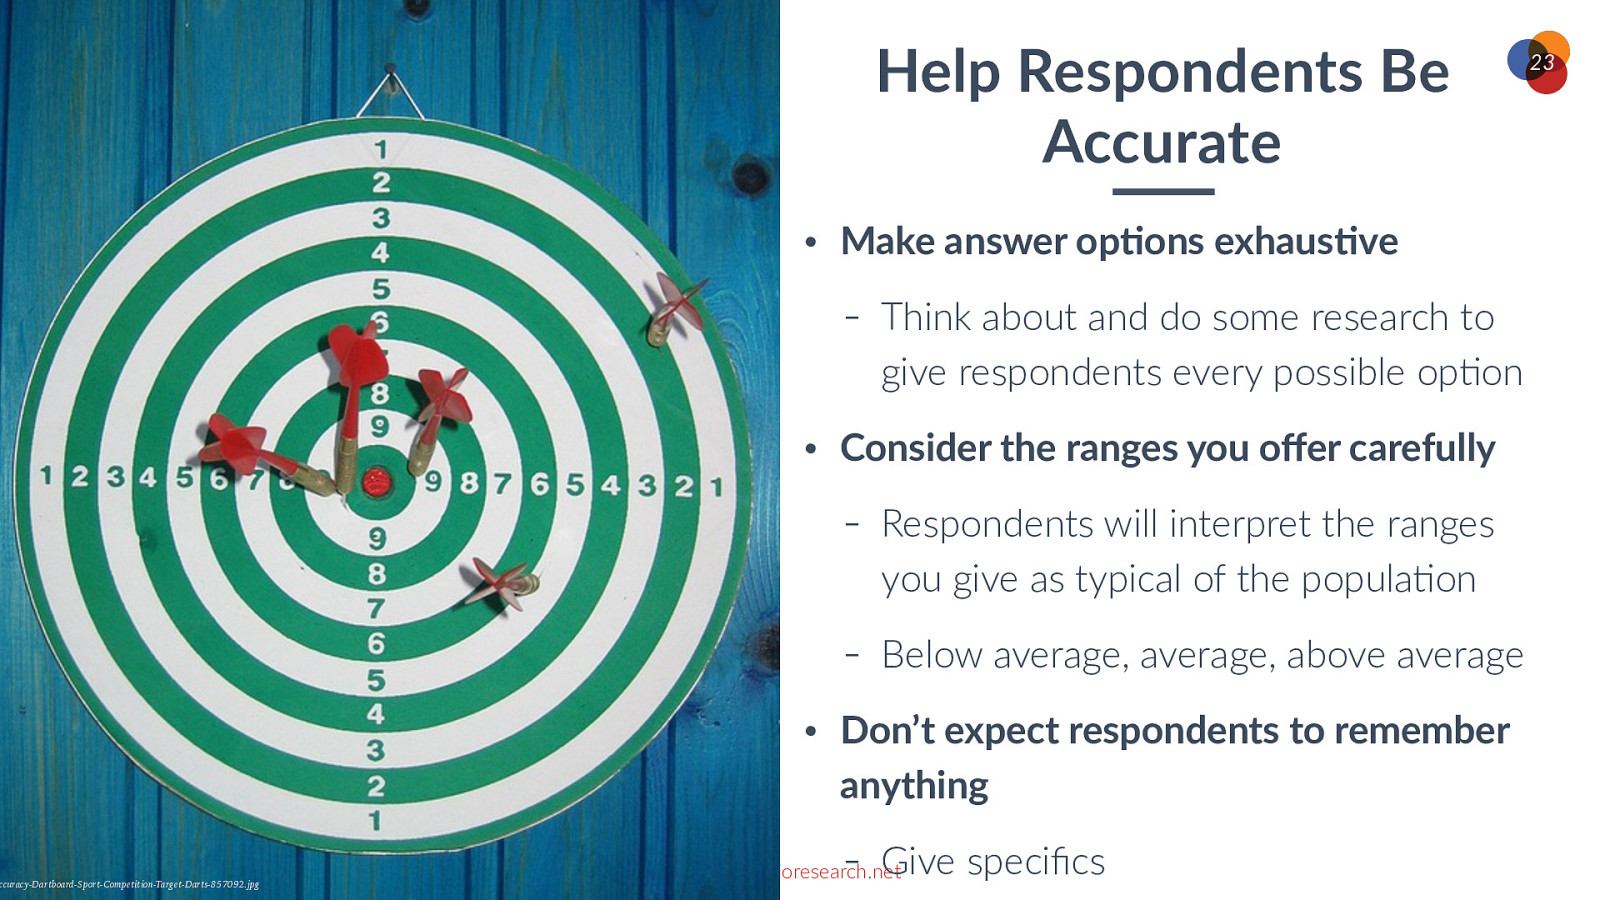
Below average, average, above average Don’t expect respondents to remember anything Give specifics www.curioresearch.net 23
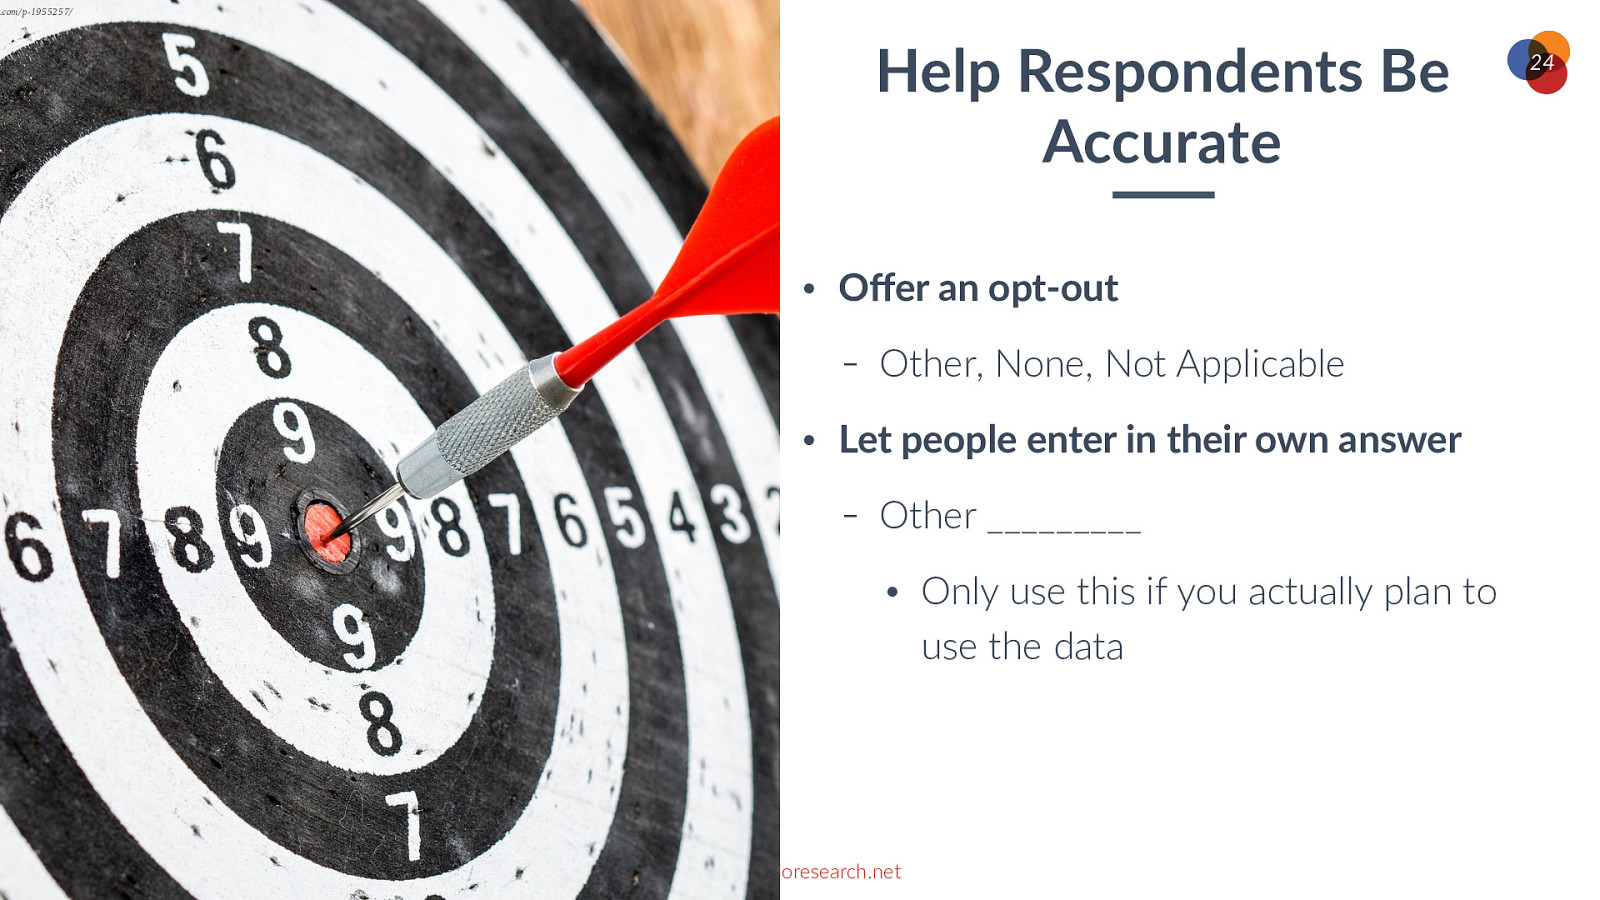
y.com/p-1955257/ Help Respondents Be Accurate • Offer an opt-out - • Other, None, Not Applicable Let people enter in their own answer - Other _________ • www.curioresearch.net Only use this if you actually plan to use the data 24

o_Research Do not make questions required 25 Photo by Isaiah Rustad on Unsplash

/ba1d87c311ebb69b3704a1d74acb193c—orient-savior.jpg 26 www.curioresearch.net
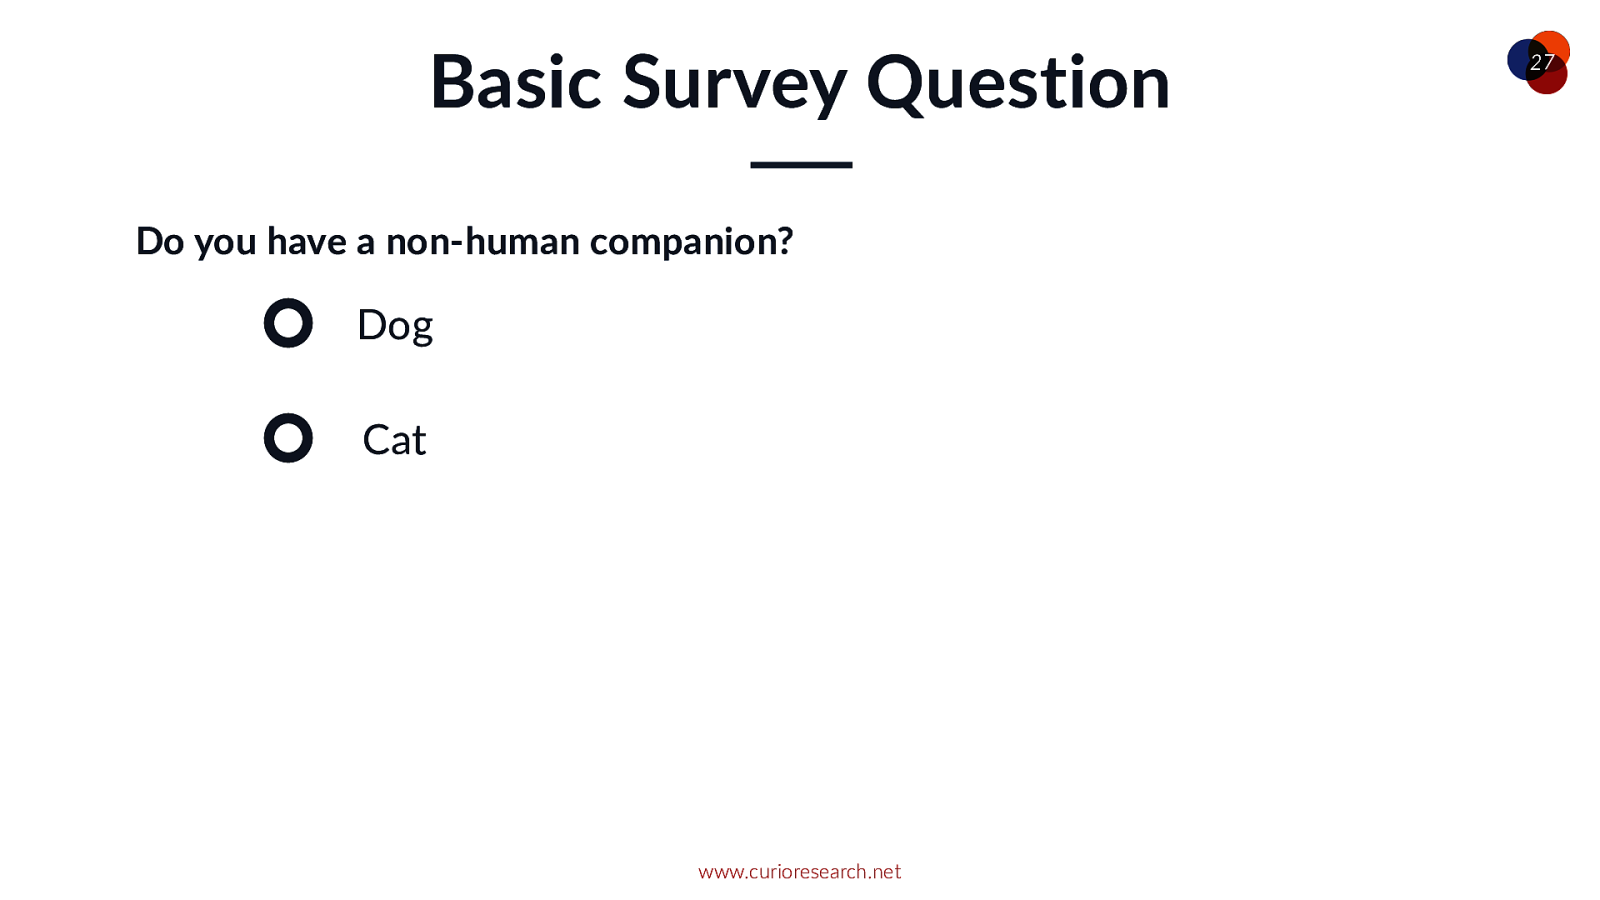
Basic Survey Question Do you have a non-human companion? Dog Cat www.curioresearch.net 27
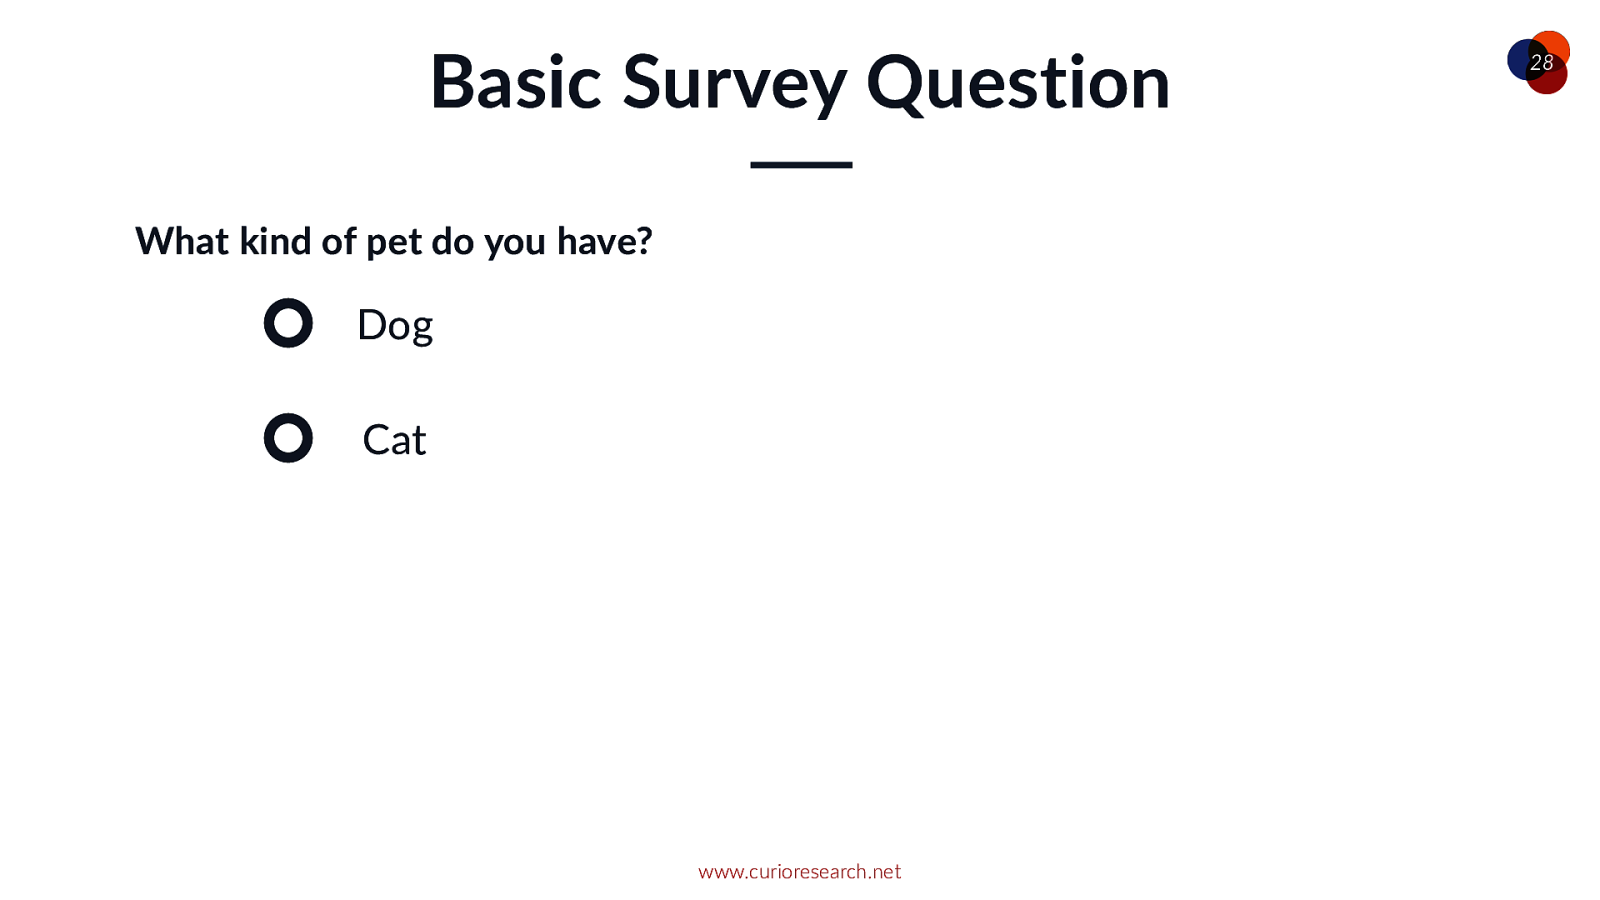
Basic Survey Question What kind of pet do you have? Dog Cat www.curioresearch.net 28
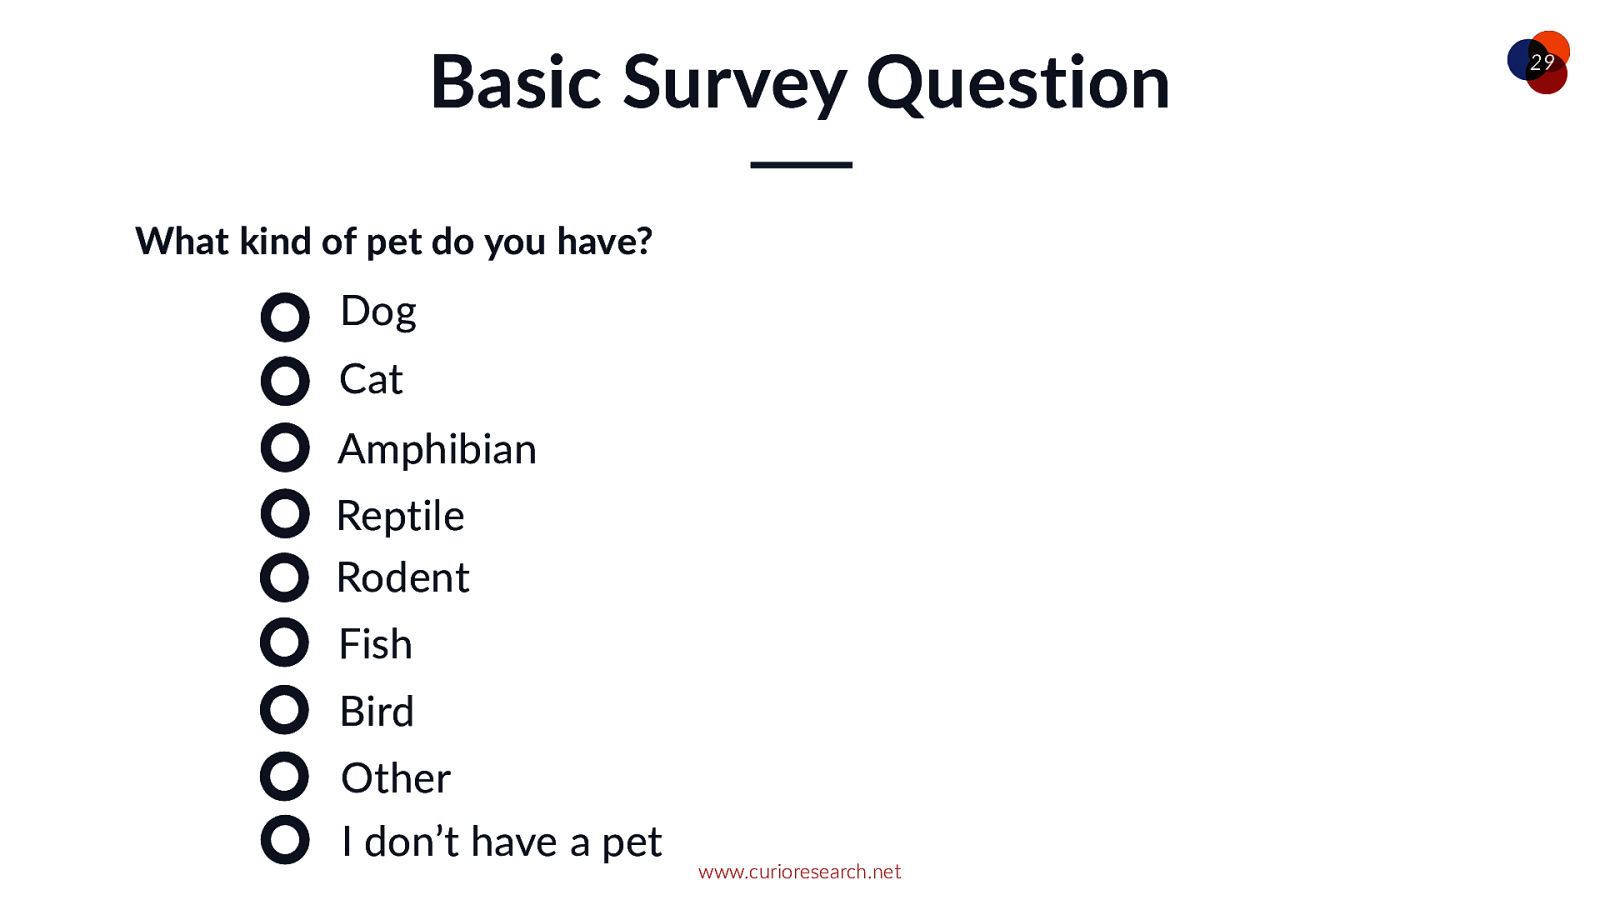
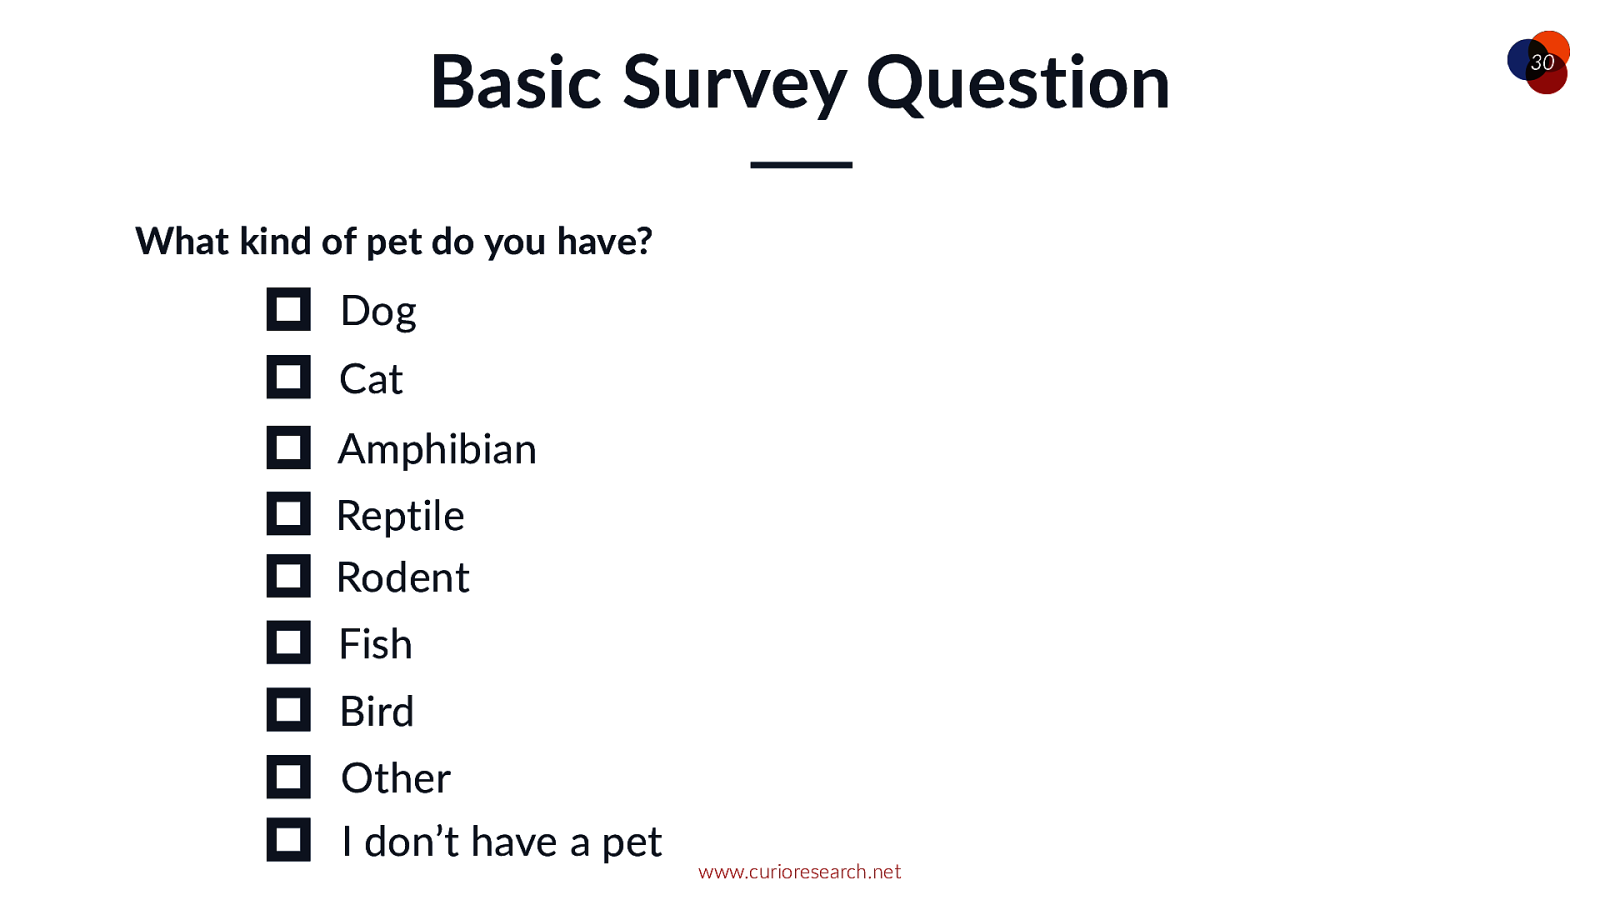
Basic Survey Question What kind of pet do you have? Dog Cat Amphibian Reptile Rodent Fish Bird Other I don’t have a pet www.curioresearch.net 29
Basic Survey Question What kind of pet do you have? Dog Cat Amphibian Reptile Rodent Fish Bird Other I don’t have a pet www.curioresearch.net 30
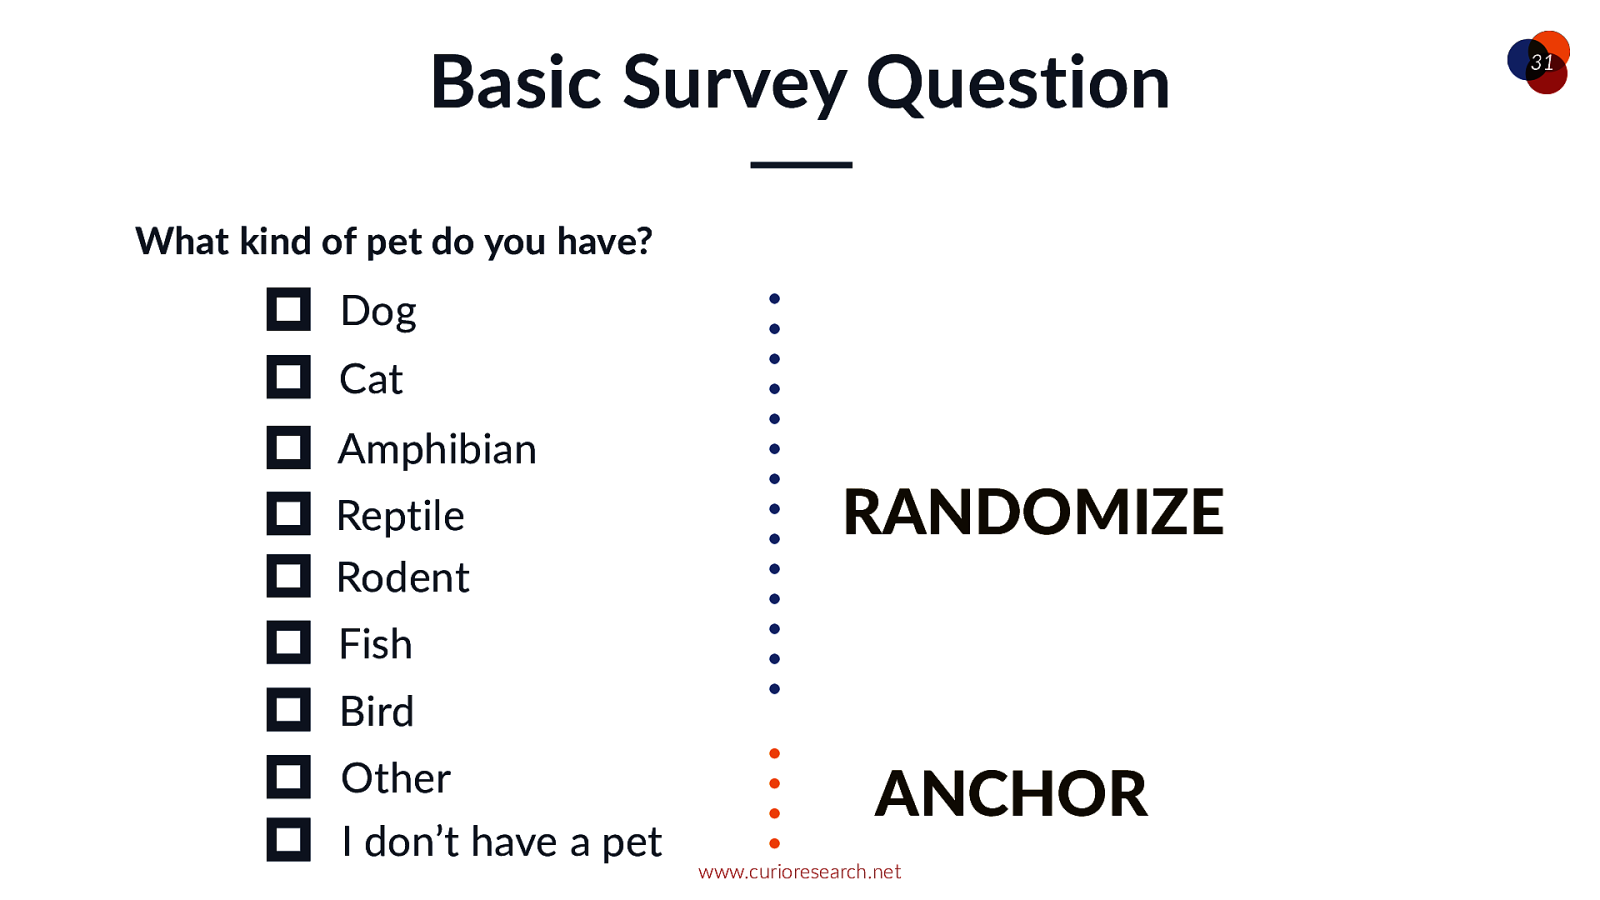
Basic Survey Question What kind of pet do you have? Dog Cat Amphibian Reptile Rodent RANDOMIZE Fish Bird Other I don’t have a pet ANCHOR www.curioresearch.net 31
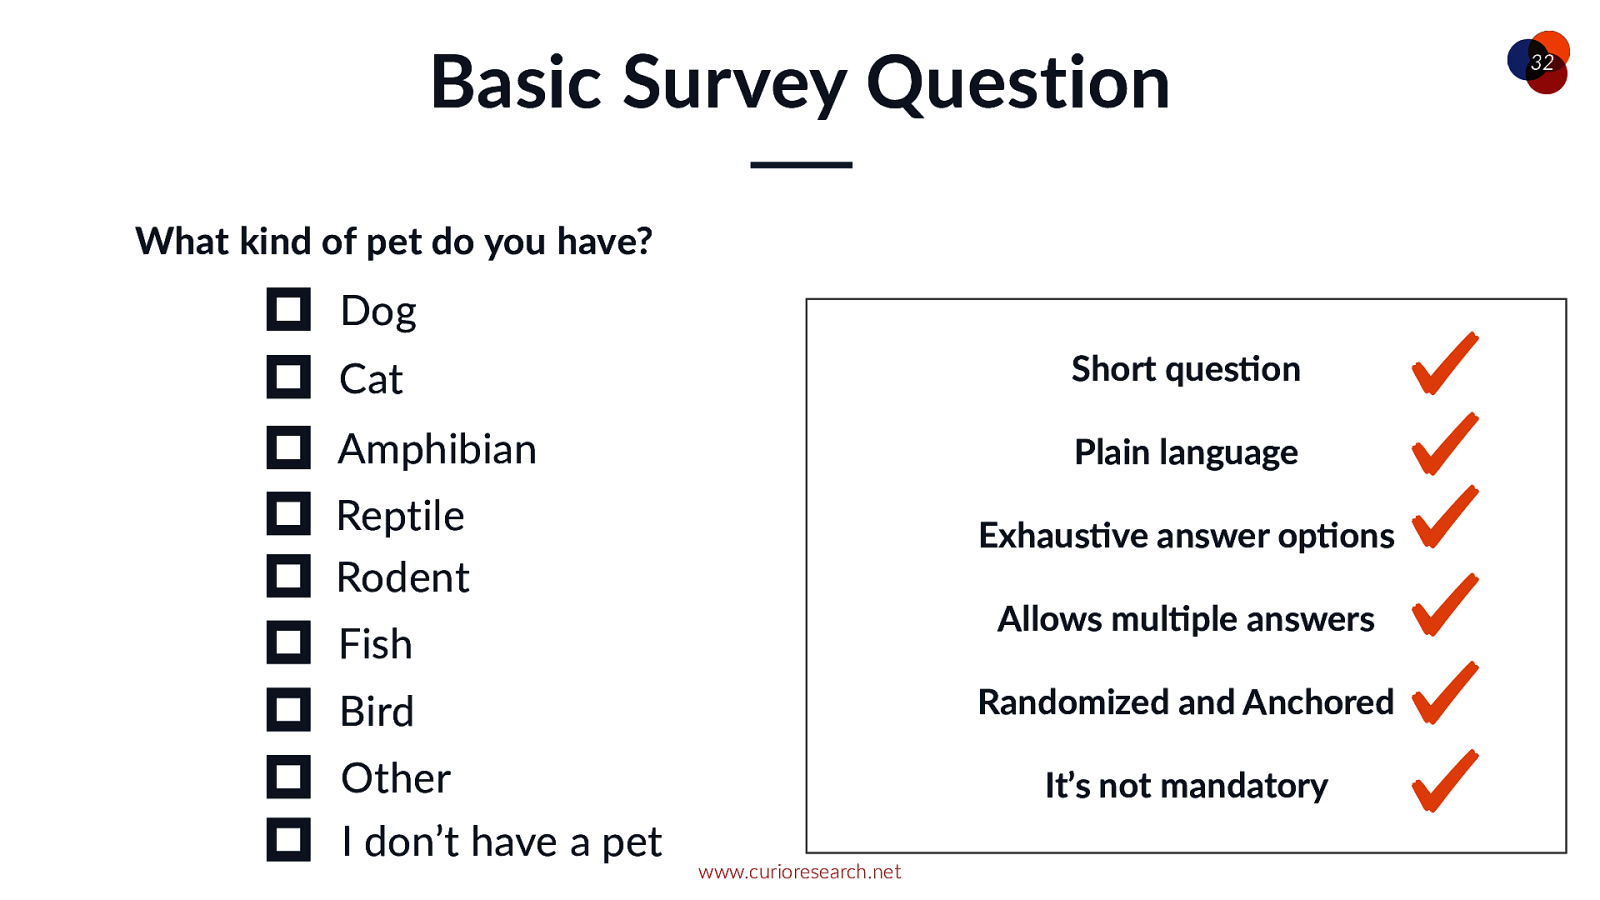
Basic Survey Question What kind of pet do you have? Dog Cat Short quesVon Amphibian Plain language Reptile Rodent ExhausVve answer opVons Allows mulVple answers Fish Randomized and Anchored Bird Other I don’t have a pet It’s not mandatory www.curioresearch.net 32
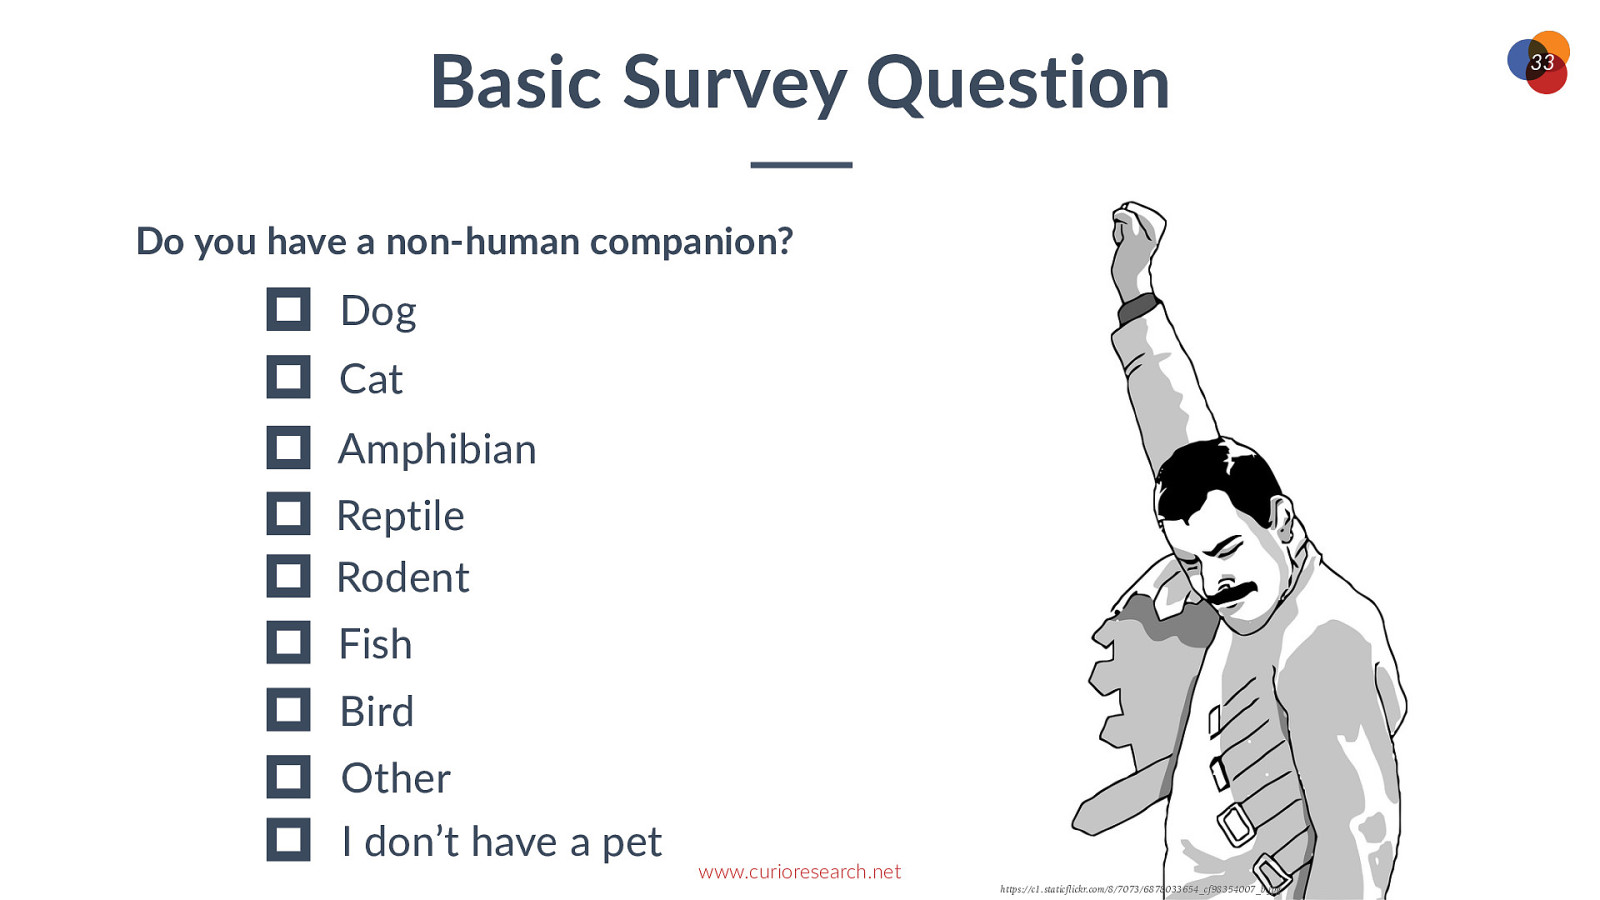
Basic Survey Question Do you have a non-human companion? Dog Cat Amphibian Reptile Rodent Fish Bird Other I don’t have a pet www.curioresearch.net https://c1.staticflickr.com/8/7073/6878033654_cf98354007_b.jpg 33

o_Research Scales 34 hBps://www.flickr.com/photos/40742367@N04/1643536194
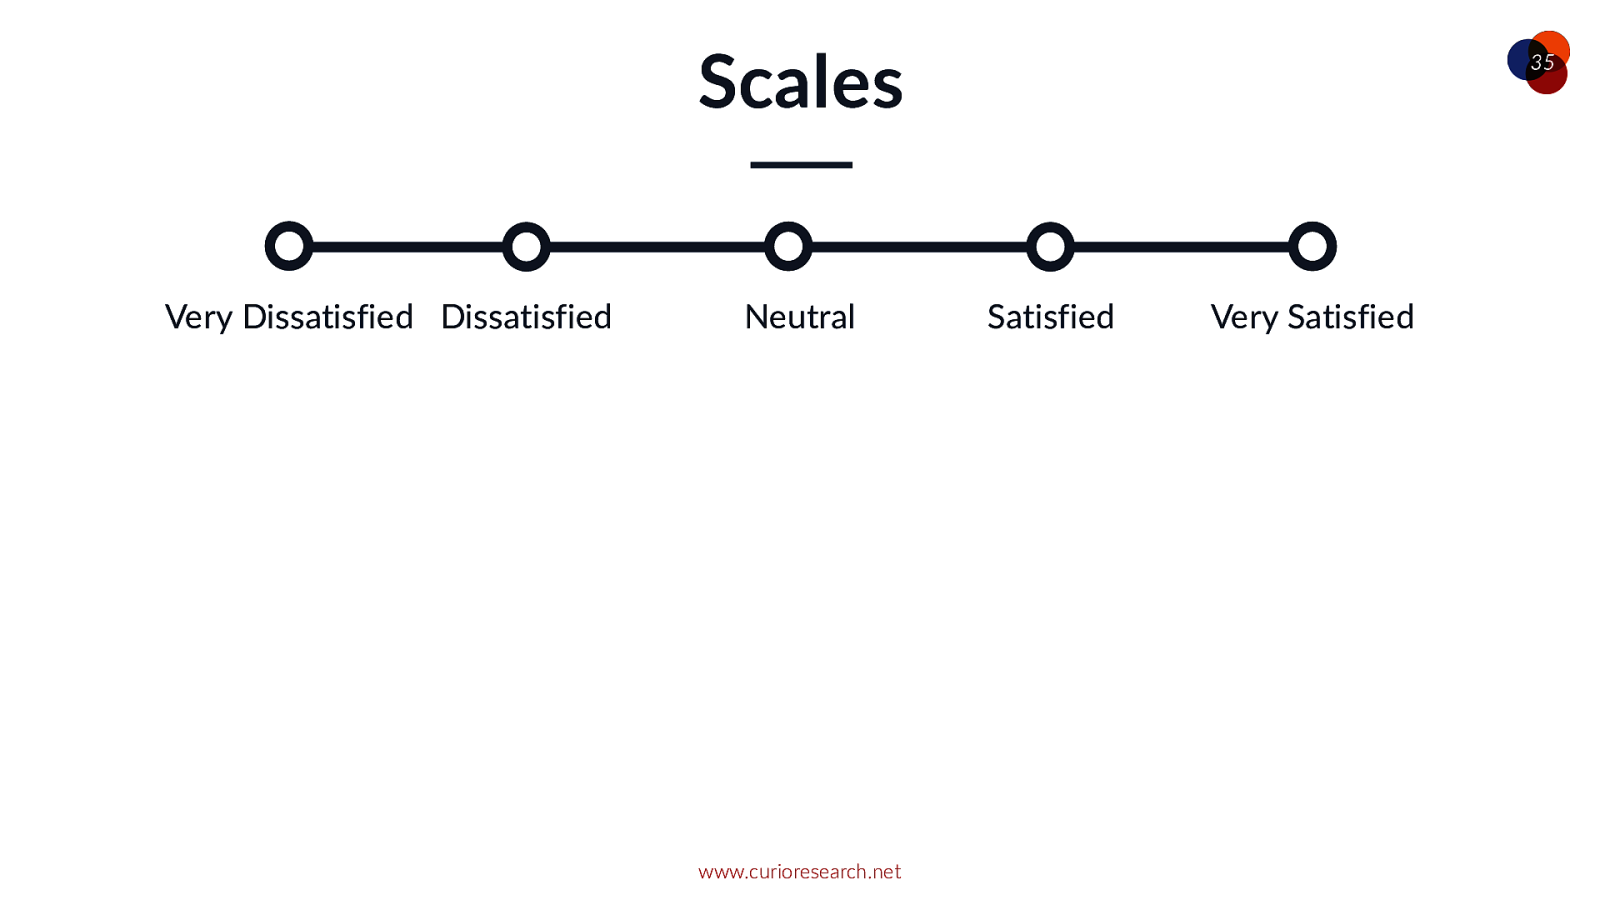
Scales Very Dissatisfied Dissatisfied Neutral www.curioresearch.net 35 Satisfied Very Satisfied
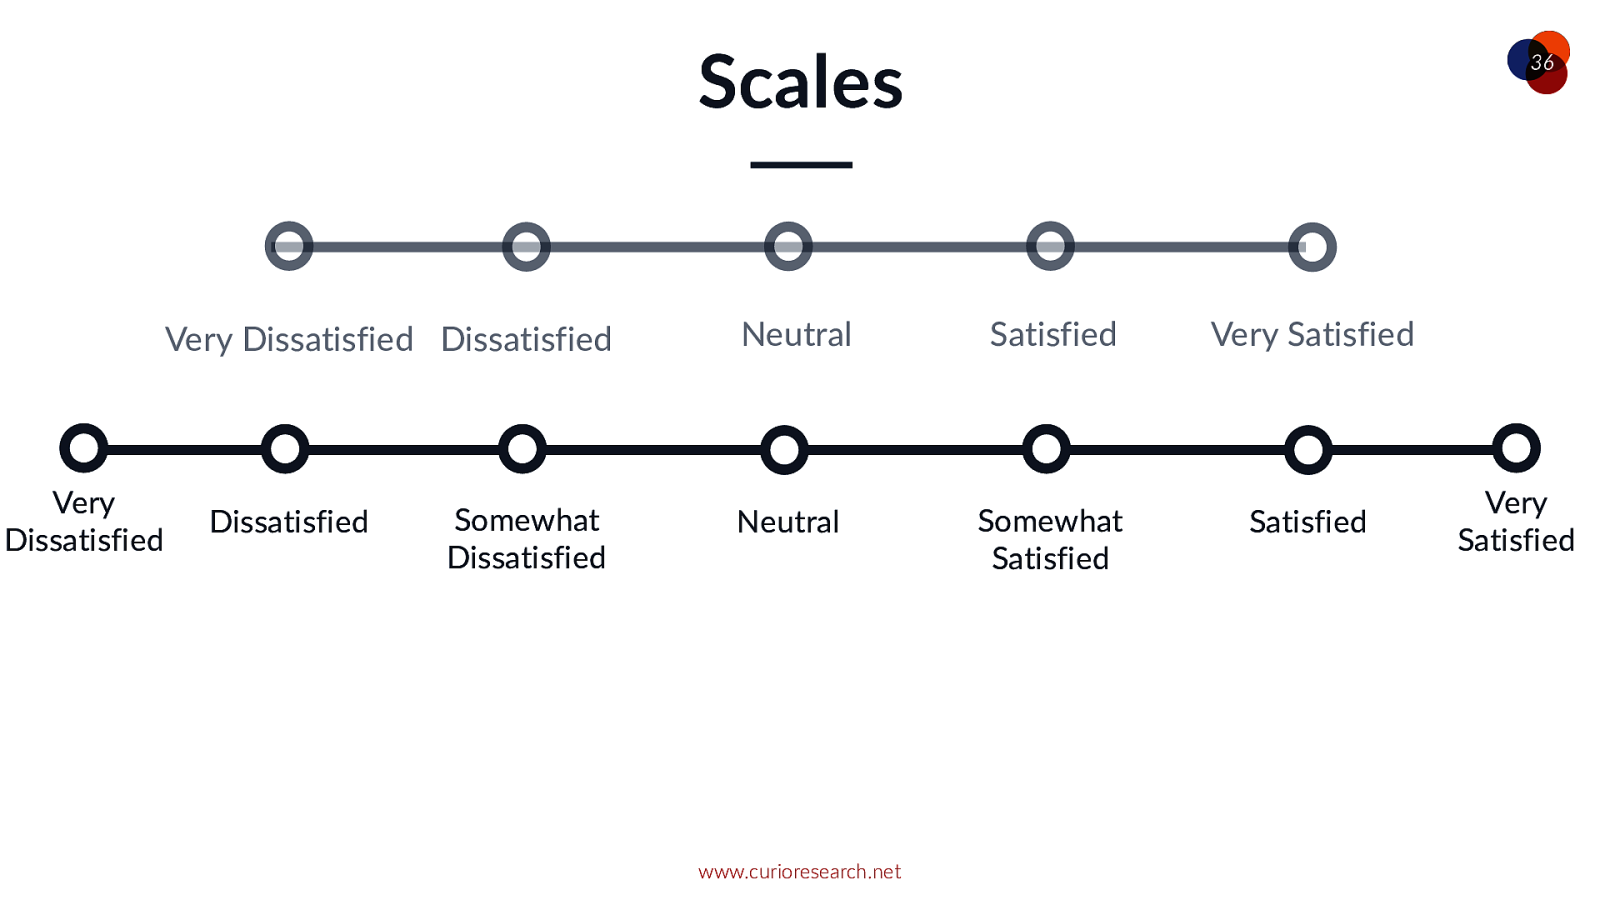
Scales Very Dissatisfied Dissatisfied Very Dissatisfied Dissatisfied Somewhat Dissatisfied Neutral Neutral www.curioresearch.net 36 Satisfied Somewhat Satisfied Very Satisfied Satisfied Very Satisfied
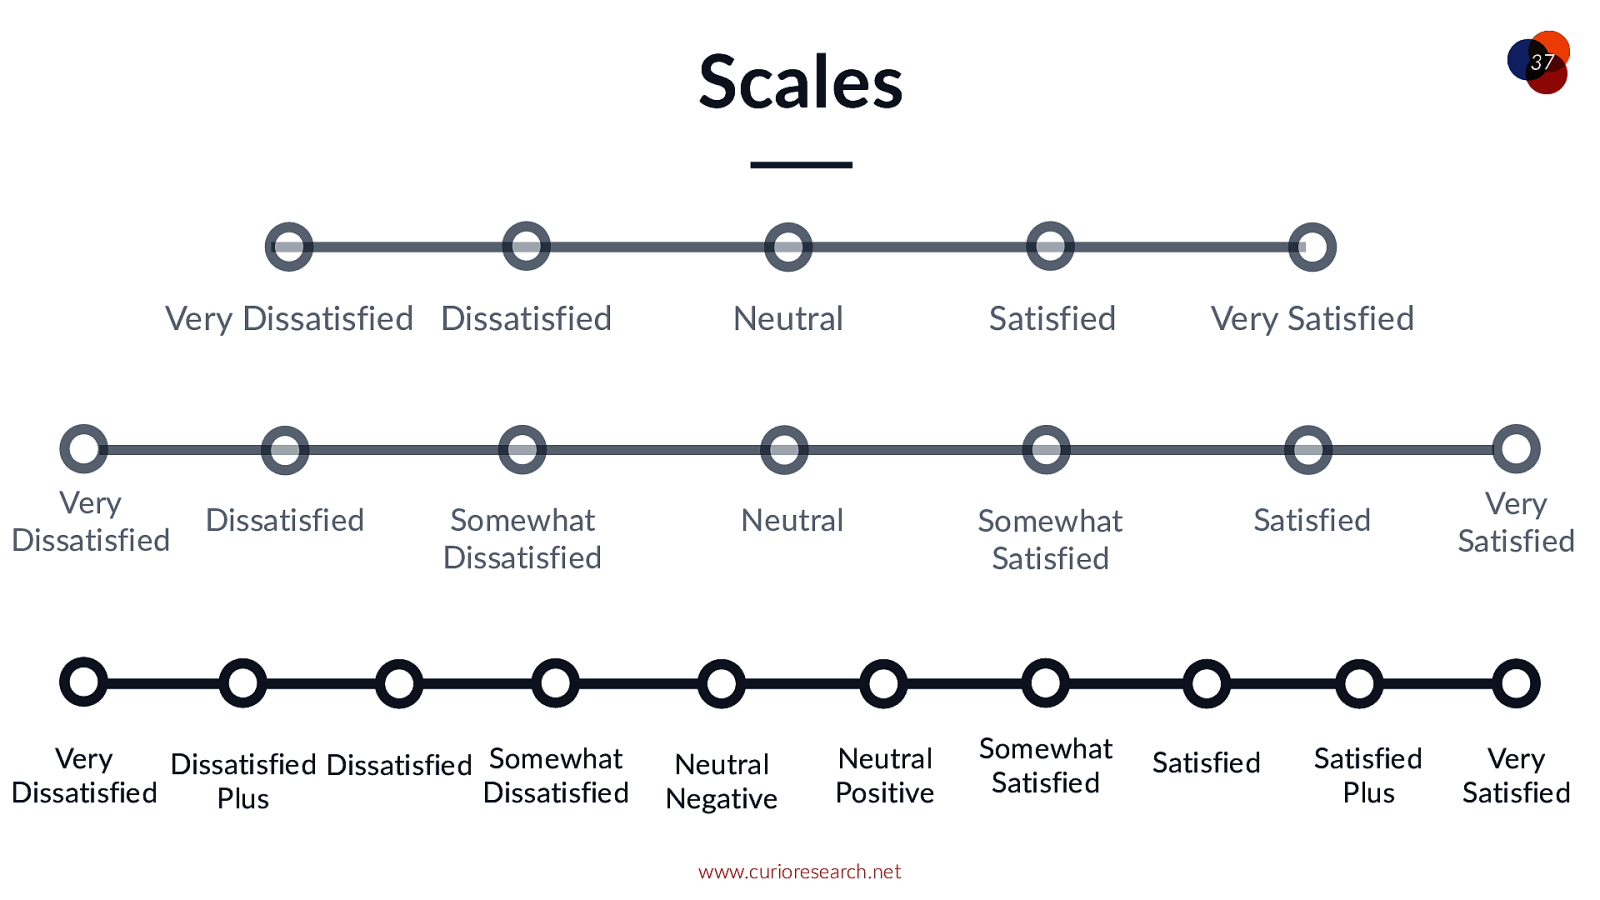
Scales Very Dissatisfied Dissatisfied Very Dissatisfied Dissatisfied Somewhat Dissatisfied Very Dissatisfied Dissatisfied Somewhat Dissatisfied Dissatisfied Plus Neutral Neutral Neutral Negative Neutral Positive www.curioresearch.net 37 Satisfied Somewhat Satisfied Somewhat Satisfied Very Satisfied Satisfied Satisfied Satisfied Plus Very Satisfied Very Satisfied
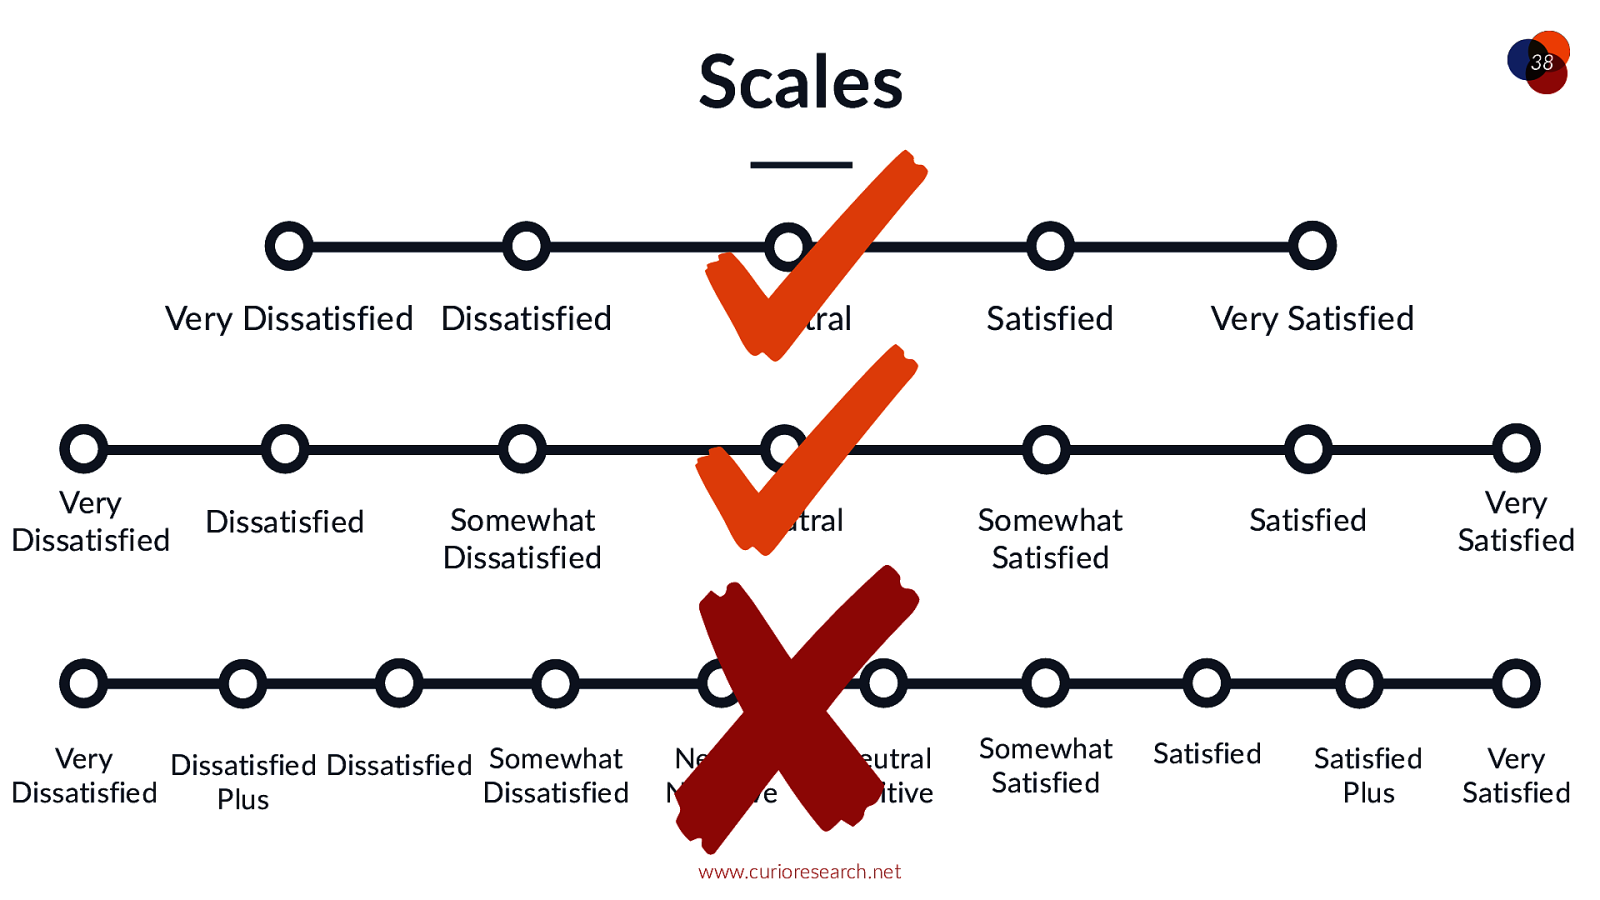
Scales Very Dissatisfied Dissatisfied Very Dissatisfied Dissatisfied Somewhat Dissatisfied Very Dissatisfied Dissatisfied Somewhat Dissatisfied Dissatisfied Plus Neutral Neutral Neutral Negative Neutral Positive www.curioresearch.net 38 Satisfied Somewhat Satisfied Somewhat Satisfied Very Satisfied Satisfied Satisfied Satisfied Plus Very Satisfied Very Satisfied
o_Research Neutral is a valid answer 39 Photo by Stanley Emrys on Unsplash
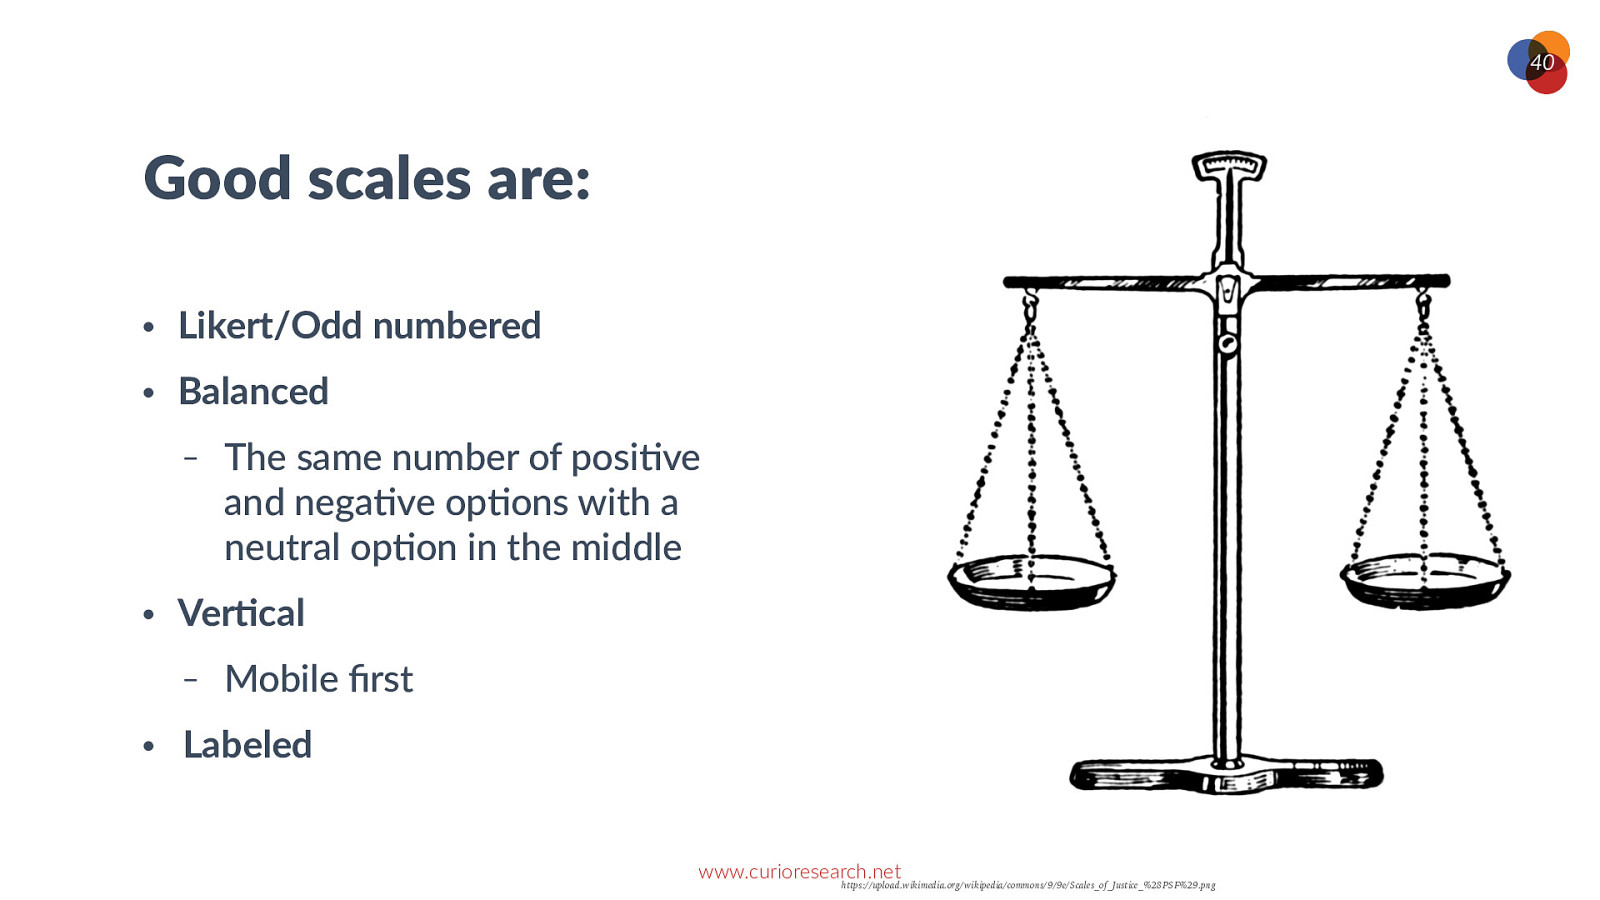
40 Good scales are: • Likert/Odd numbered • Balanced - • VerVcal - • The same number of posi0ve and nega0ve op0ons with a neutral op0on in the middle Mobile first Labeled www.curioresearch.net https://upload.wikimedia.org/wikipedia/commons/9/9e/Scales_of_Justice_%28PSF%29.png

/ba1d87c311ebb69b3704a1d74acb193c—orient-savior.jpg 41 www.curioresearch.net
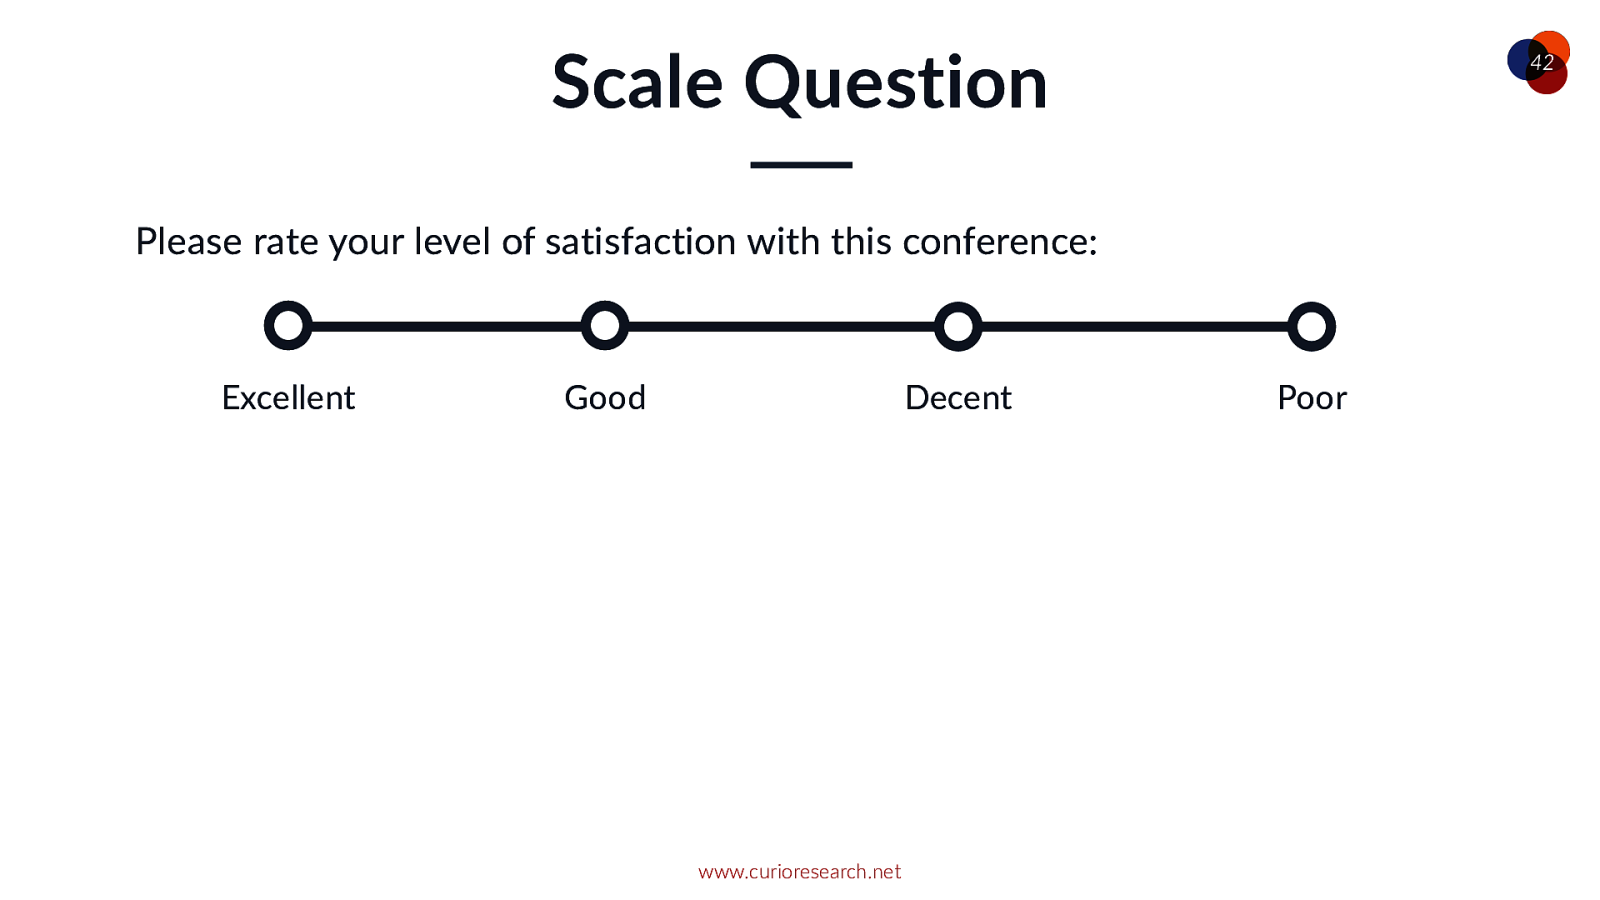
Scale Question 42 Please rate your level of satisfaction with this conference: Excellent Good Decent www.curioresearch.net Poor
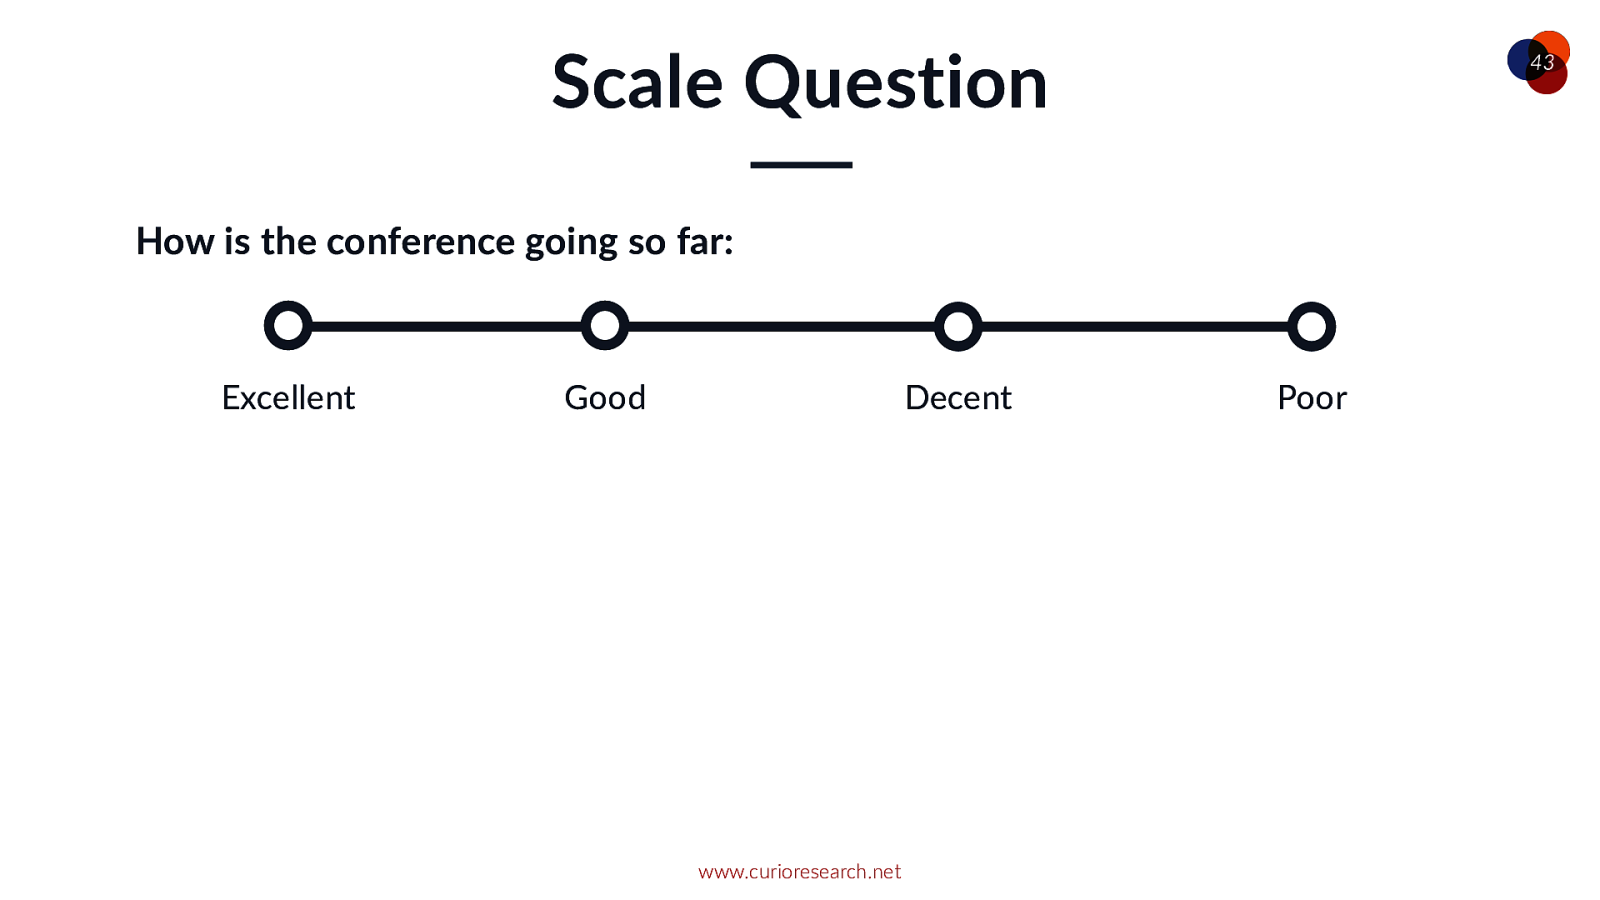
Scale Question 43 How is the conference going so far: Excellent Good Decent www.curioresearch.net Poor
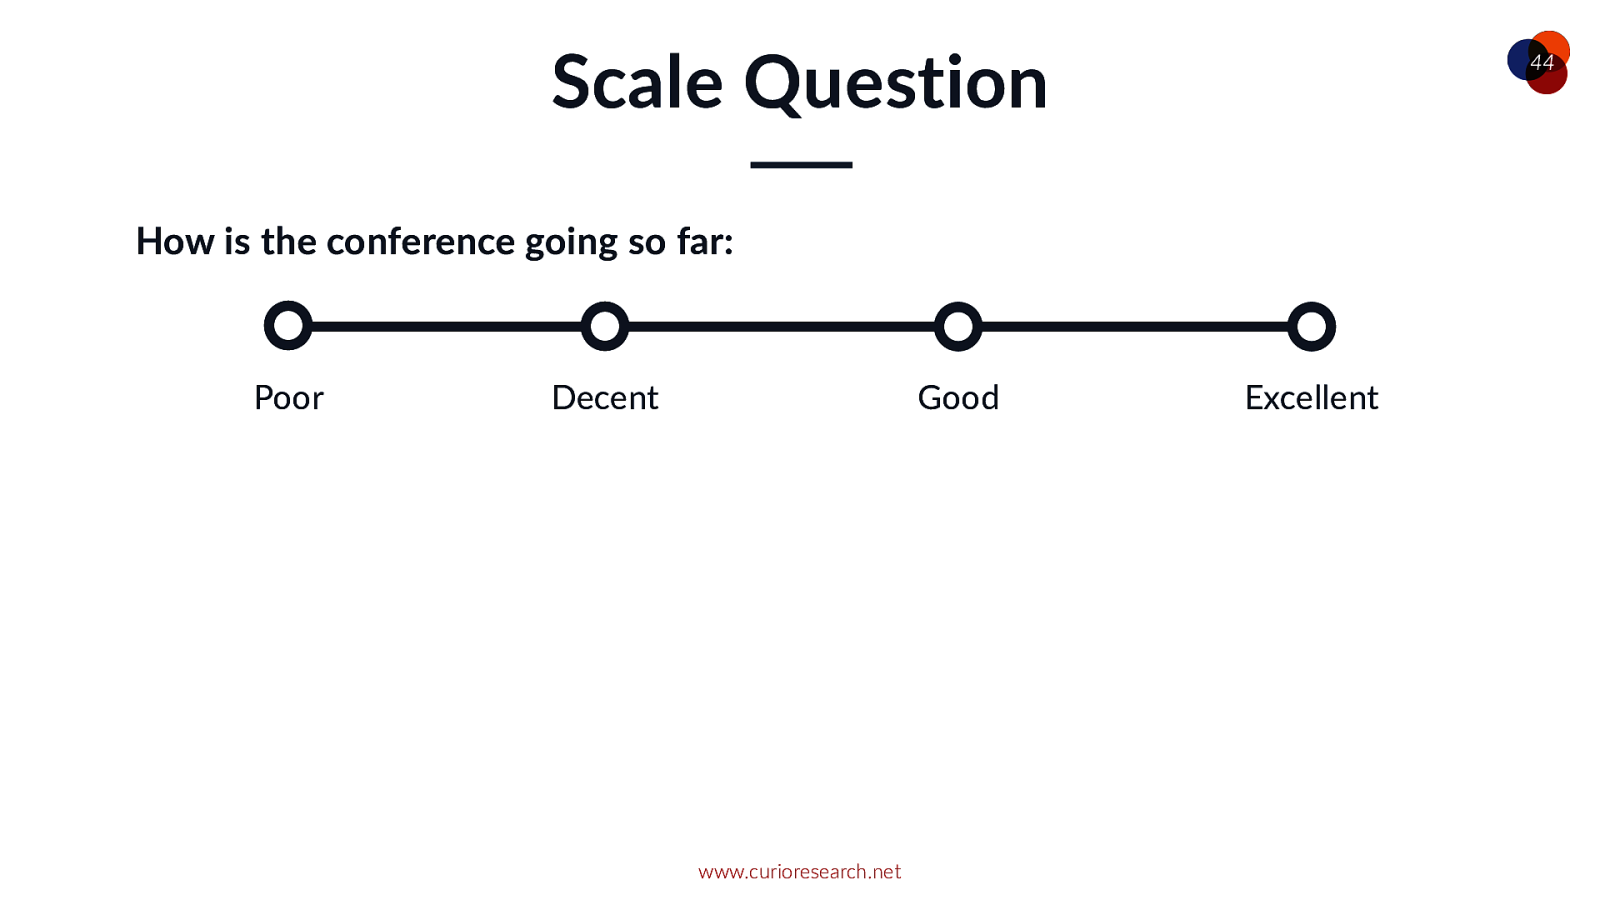
Scale Question 44 How is the conference going so far: Poor Decent Good www.curioresearch.net Excellent
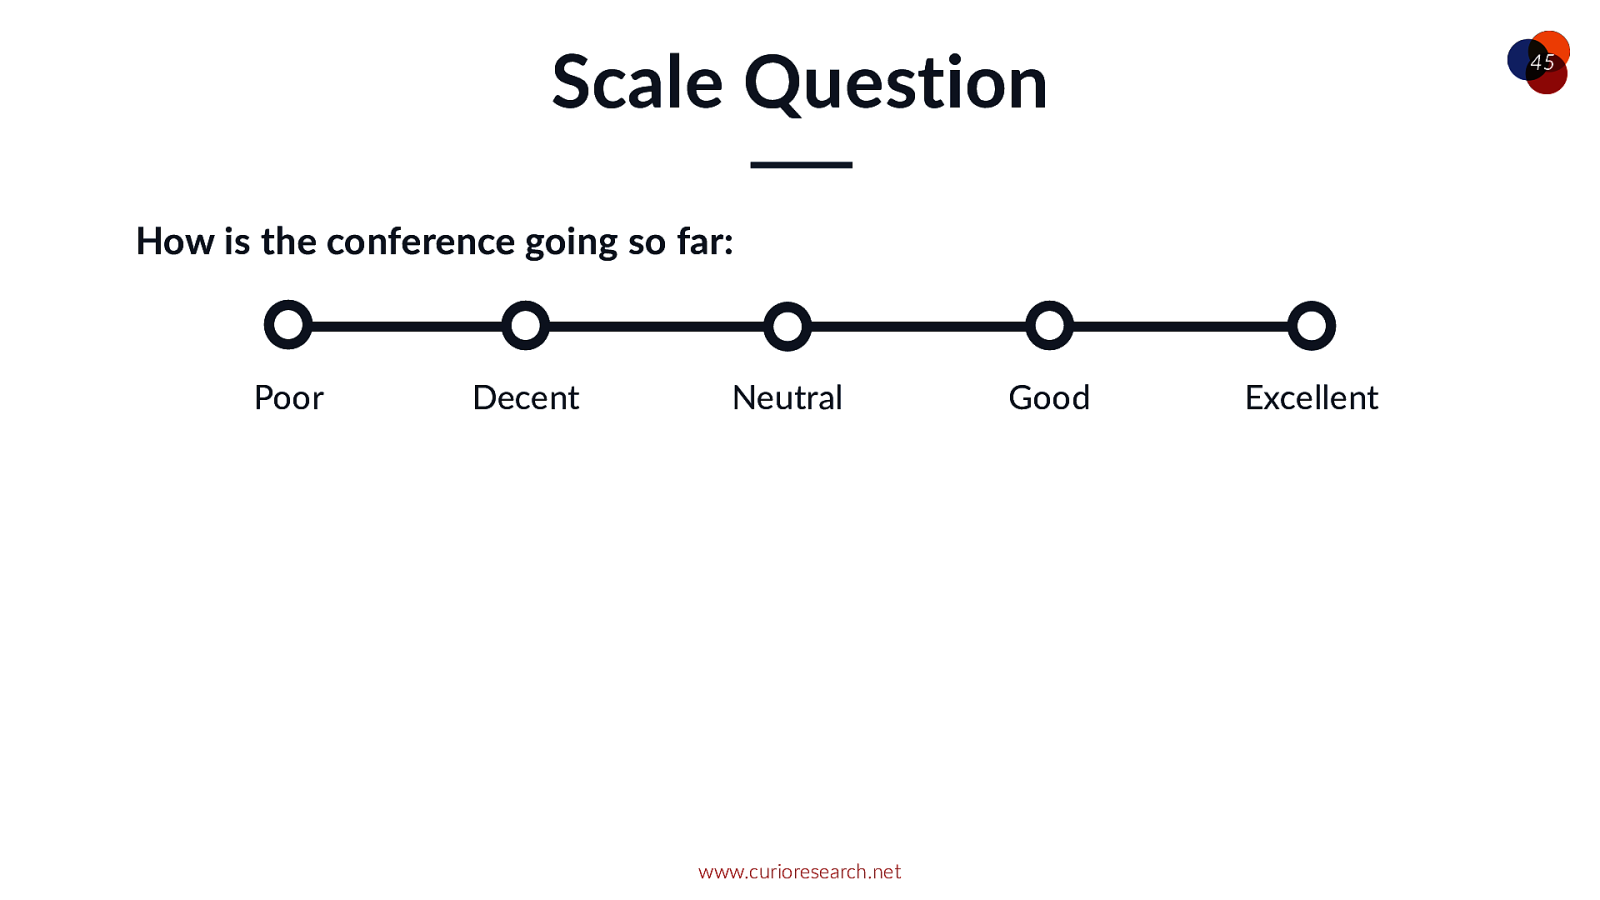
Scale Question 45 How is the conference going so far: Poor Decent Neutral www.curioresearch.net Good Excellent
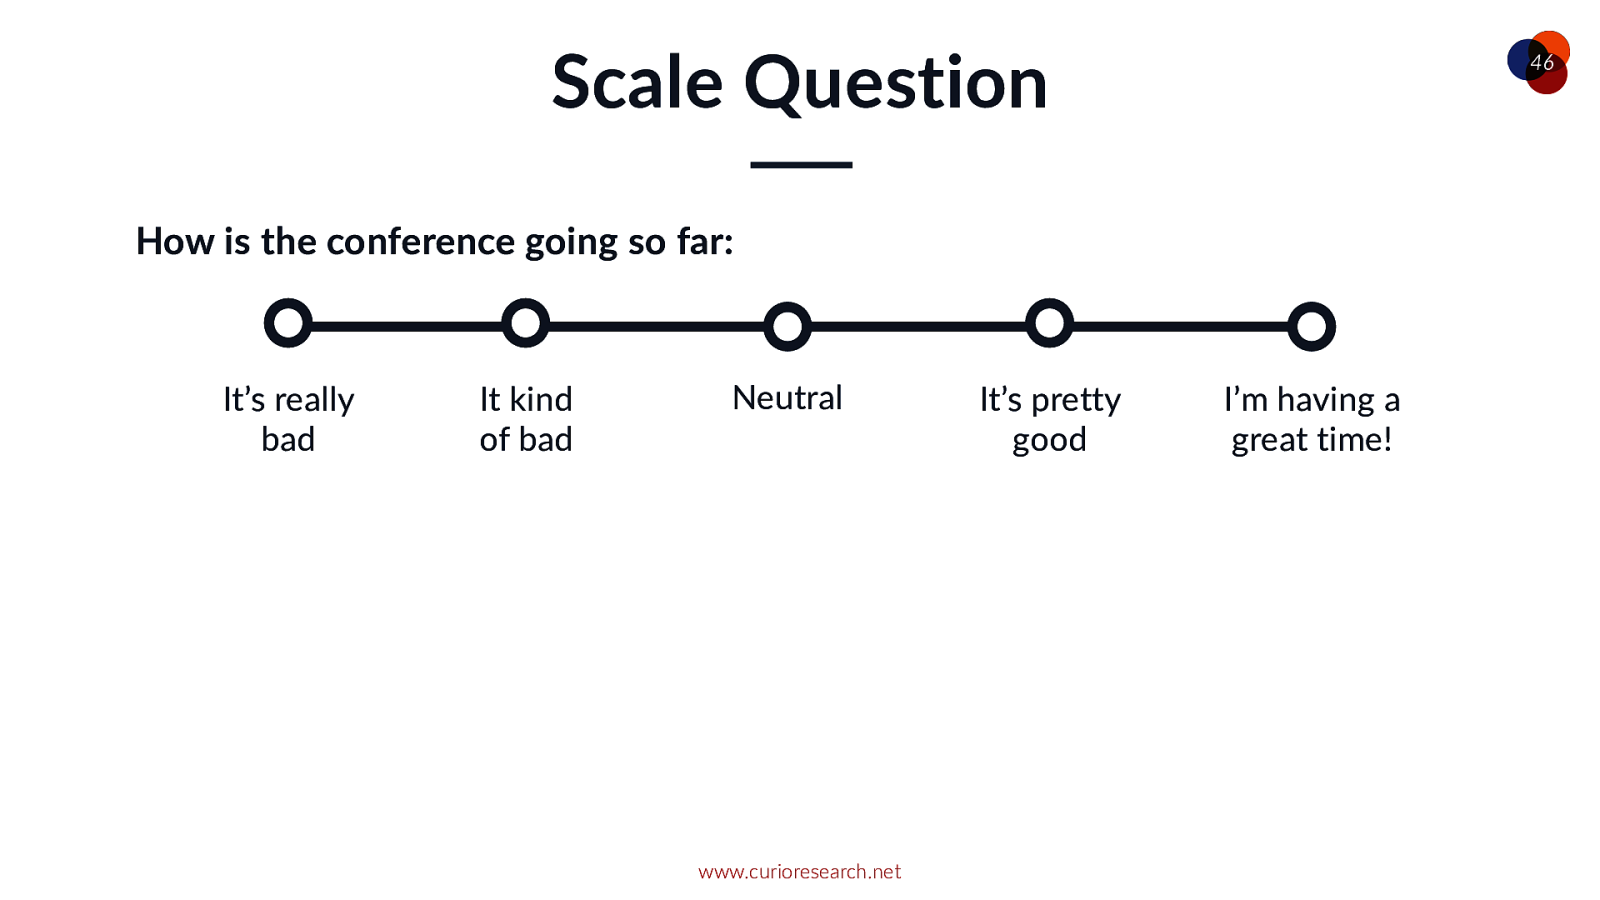
Scale Question 46 How is the conference going so far: It’s really bad It kind of bad Neutral www.curioresearch.net It’s pretty good I’m having a great time!
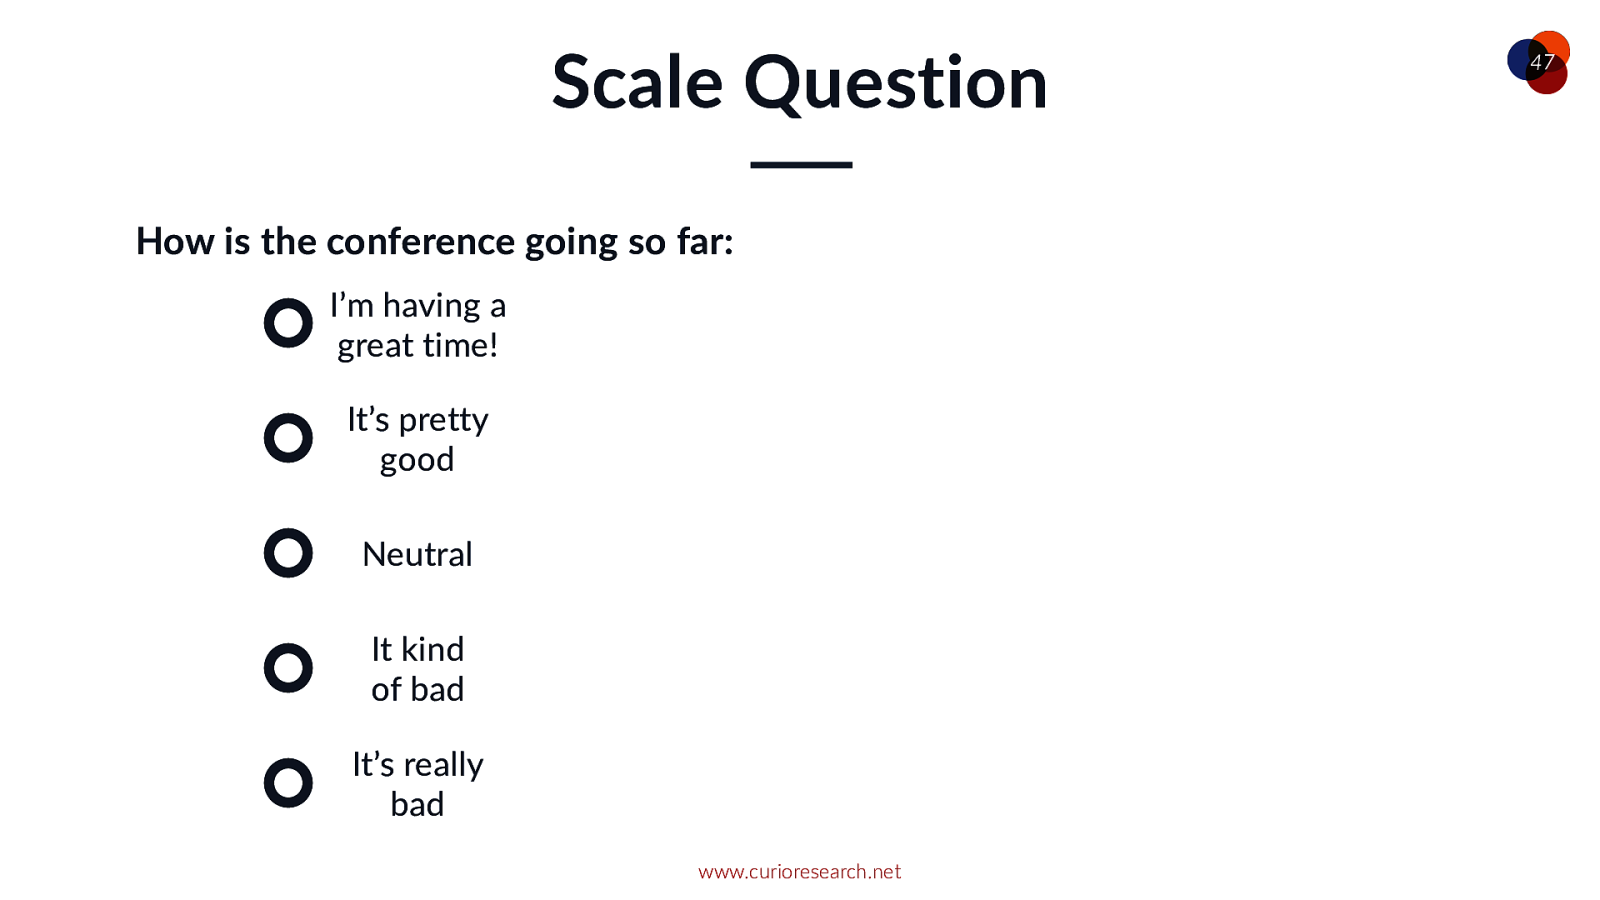
Scale Question How is the conference going so far: I’m having a great time! It’s pretty good Neutral It kind of bad It’s really bad www.curioresearch.net 47
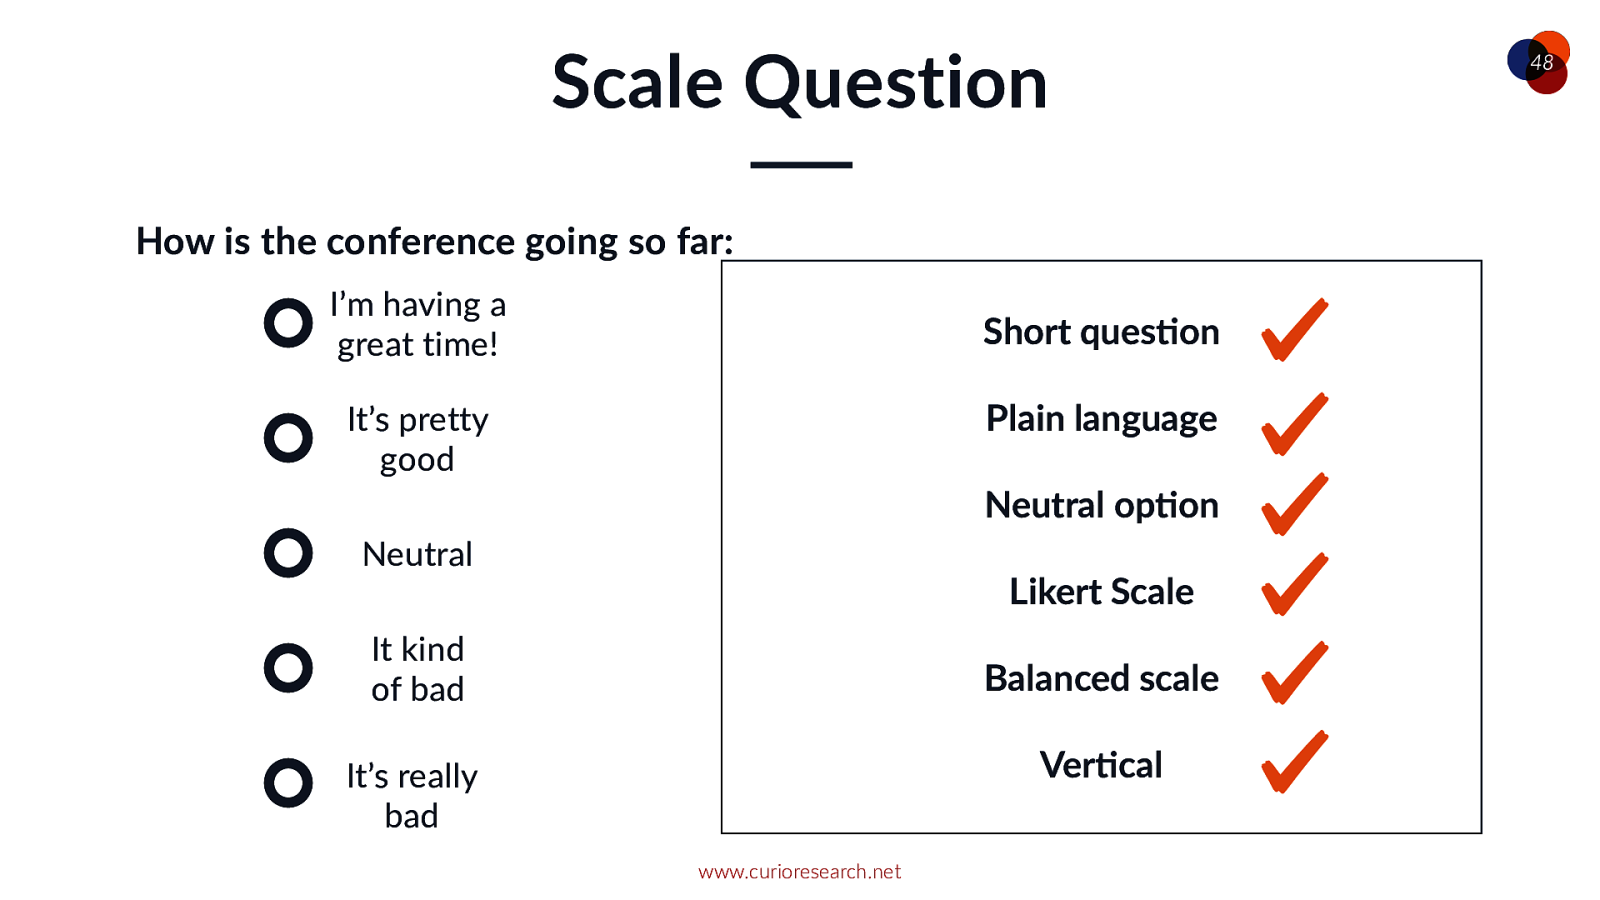
Scale Question How is the conference going so far: I’m having a great time! Short quesVon Plain language It’s pretty good Neutral opVon Neutral Likert Scale It kind of bad Balanced scale VerVcal It’s really bad www.curioresearch.net 48
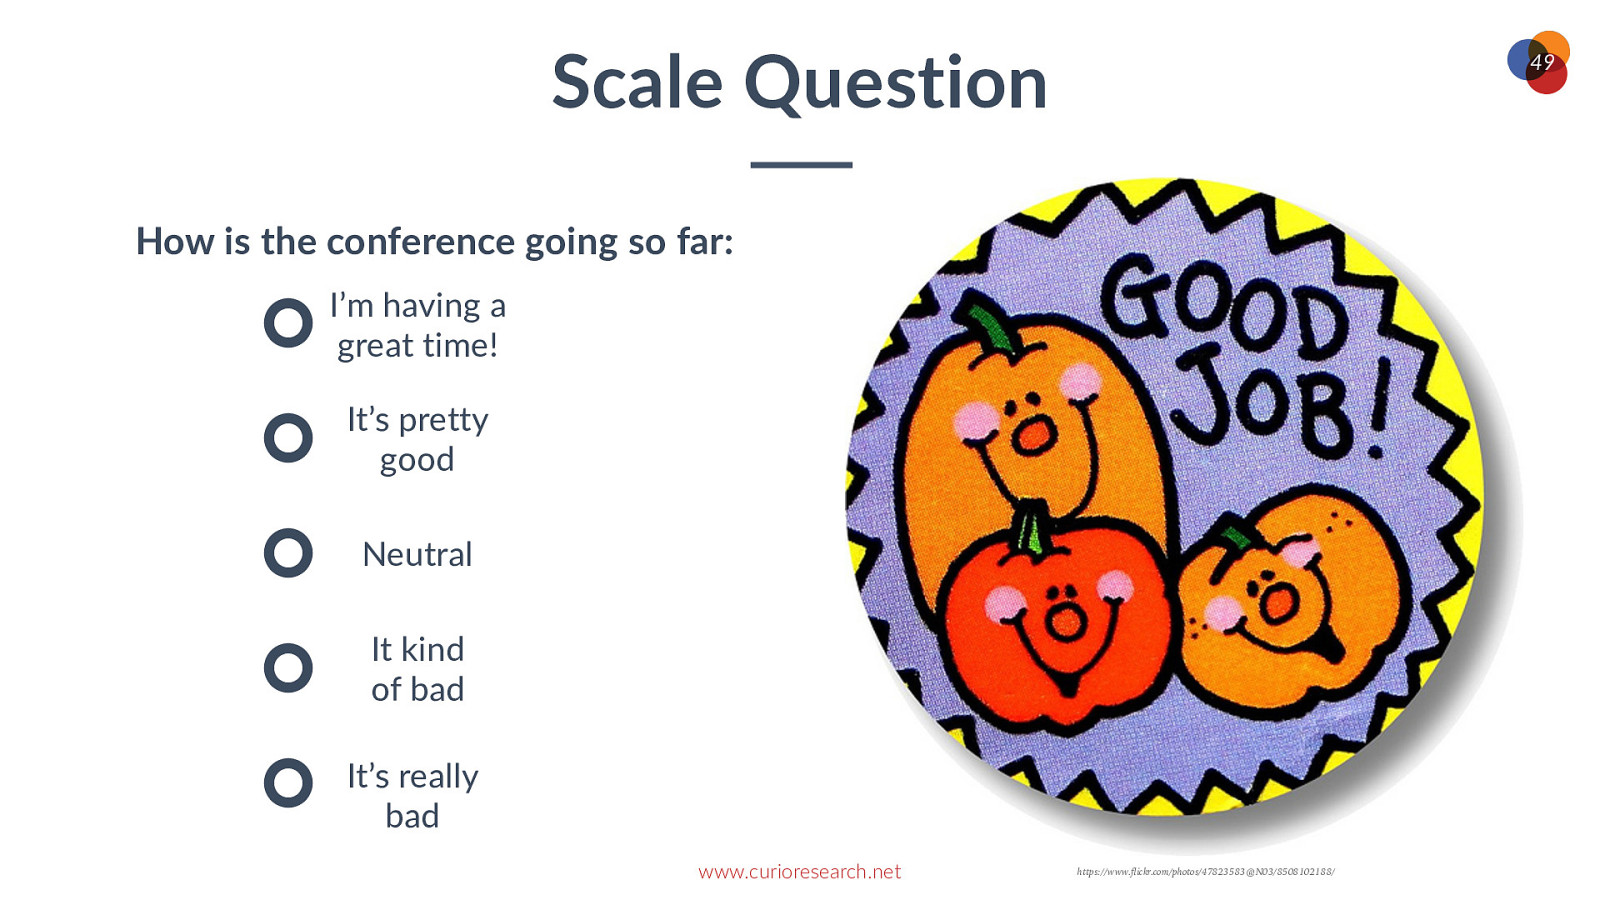
Scale Question 49 How is the conference going so far: I’m having a great time! It’s pretty good Neutral It kind of bad It’s really bad www.curioresearch.net https://www.flickr.com/photos/47823583@N03/8508102188/

o_Research Minimize grid usage Relying on grids is cheating 50 Photo by Samuel Zeller on Unsplash
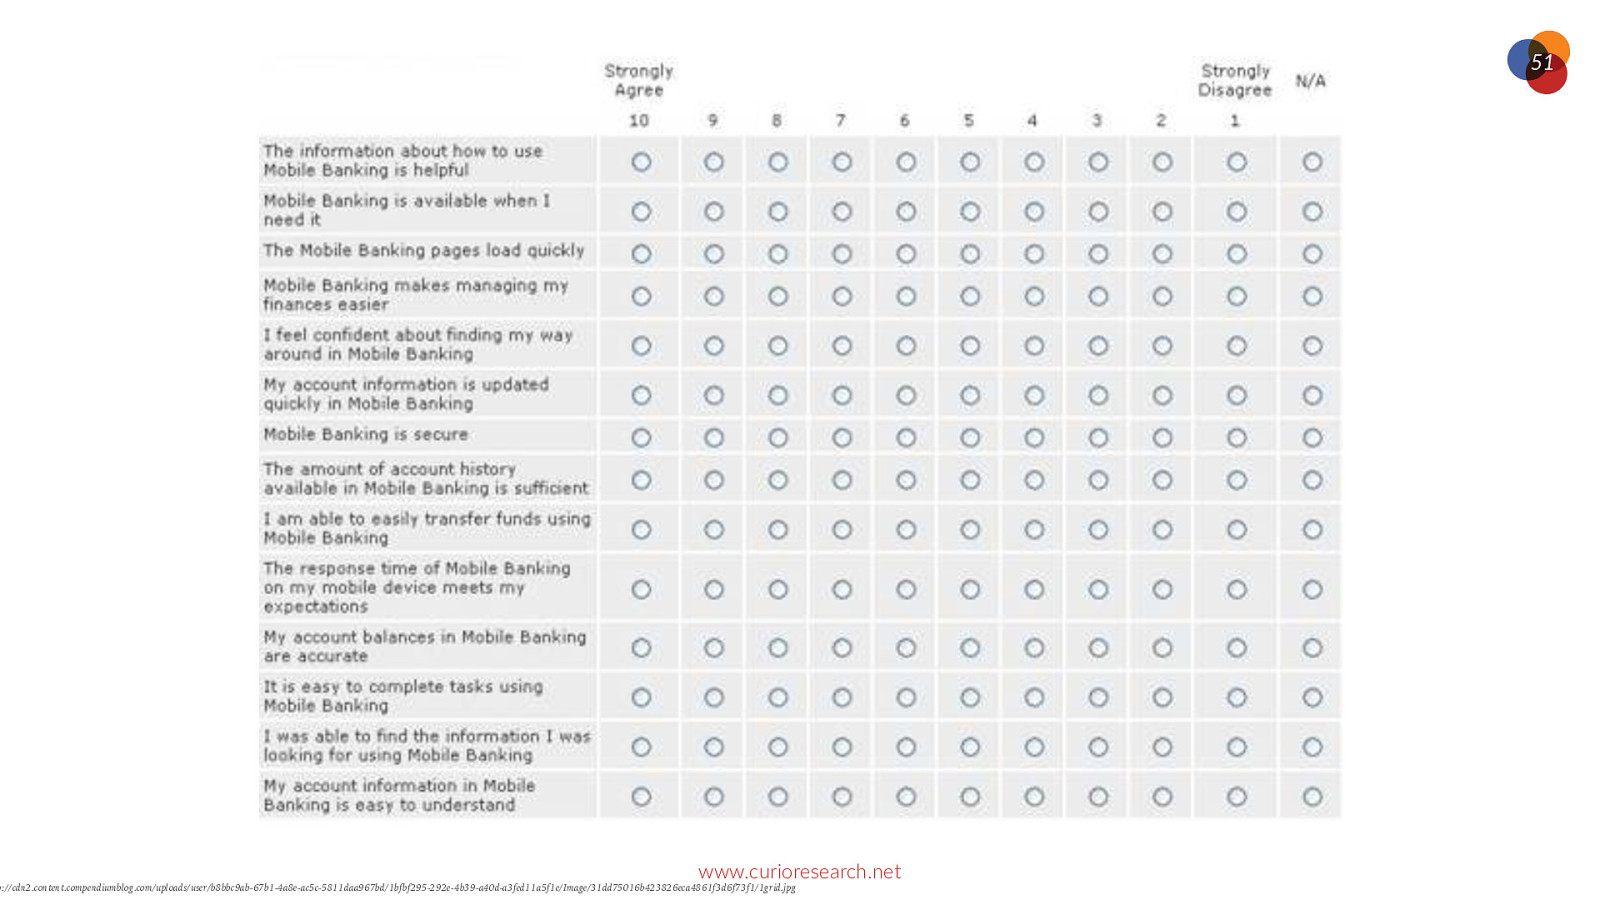
51 www.curioresearch.net p://cdn2.content.compendiumblog.com/uploads/user/b8bbc9ab-67b1-4a8e-ac5c-5811daa967bd/1bfbf295-292e-4b39-a40d-a3fed11a5f1e/Image/31dd75016b423826eca4861f3d6f73f1/1grid.jpg
o_Research Bias is real Agree or Disagree? 52 Photo by Frida Aguilar Estrada on Unsplash
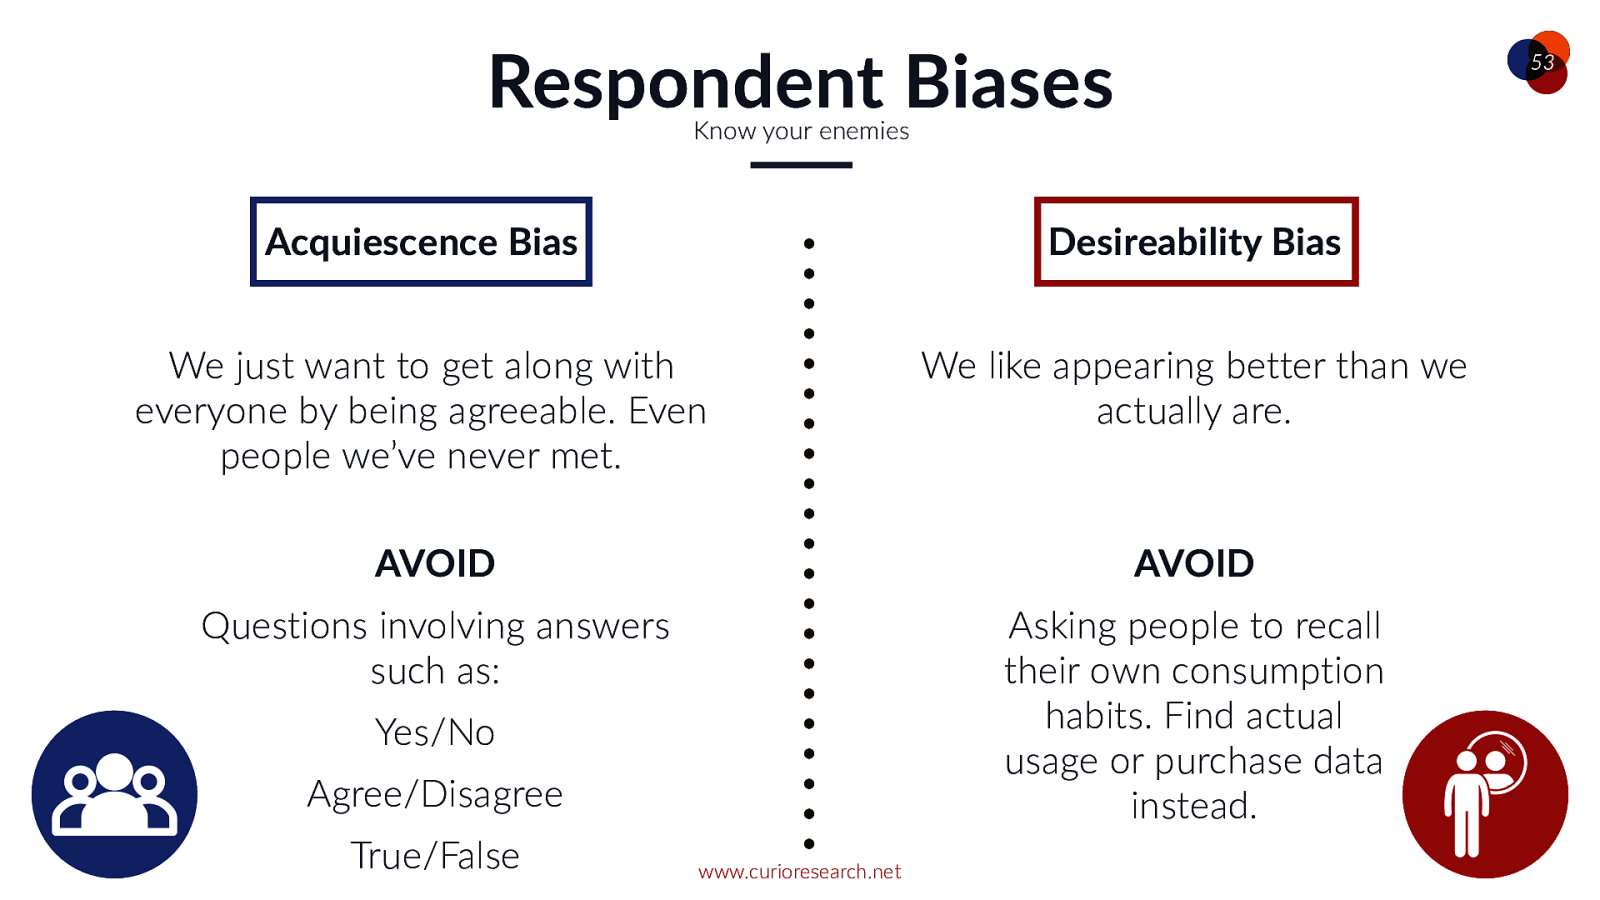
Respondent Biases 53 Know your enemies Acquiescence Bias Desireability Bias We just want to get along with everyone by being agreeable. Even people we’ve never met. We like appearing better than we actually are. AVOID AVOID Questions involving answers such as: Asking people to recall their own consumption habits. Find actual usage or purchase data instead. Yes/No Agree/Disagree True/False www.curioresearch.net
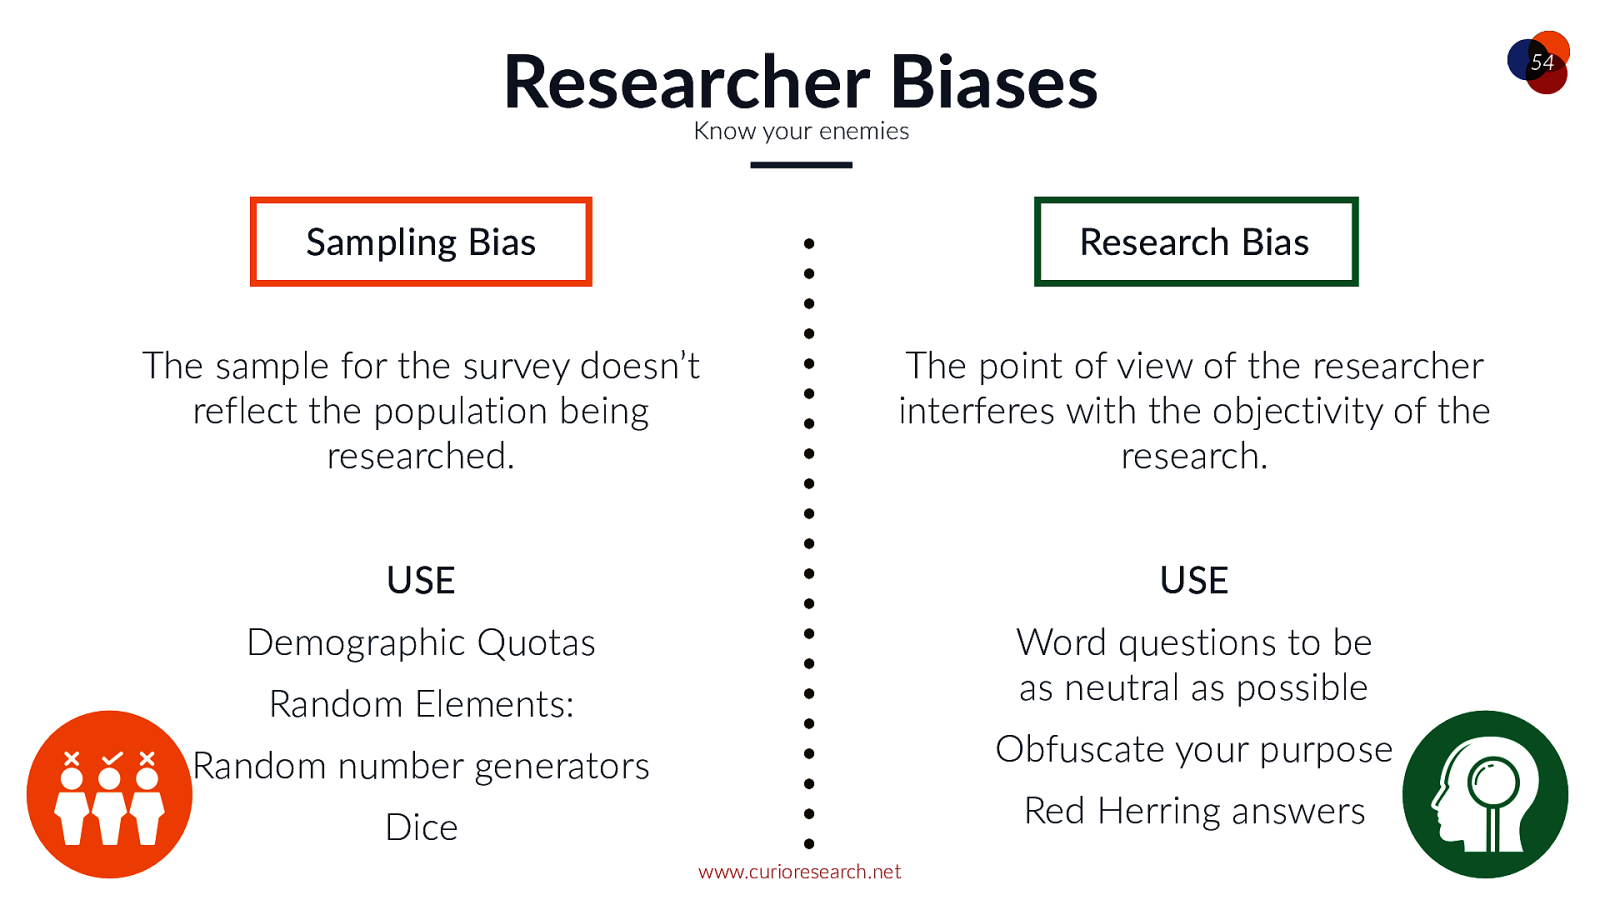
Researcher Biases 54 Know your enemies Sampling Bias Research Bias The sample for the survey doesn’t reflect the population being researched. The point of view of the researcher interferes with the objectivity of the research. USE USE Demographic Quotas Word questions to be as neutral as possible Random Elements: Obfuscate your purpose Random number generators Red Herring answers Dice www.curioresearch.net

/ba1d87c311ebb69b3704a1d74acb193c—orient-savior.jpg 55 www.curioresearch.net
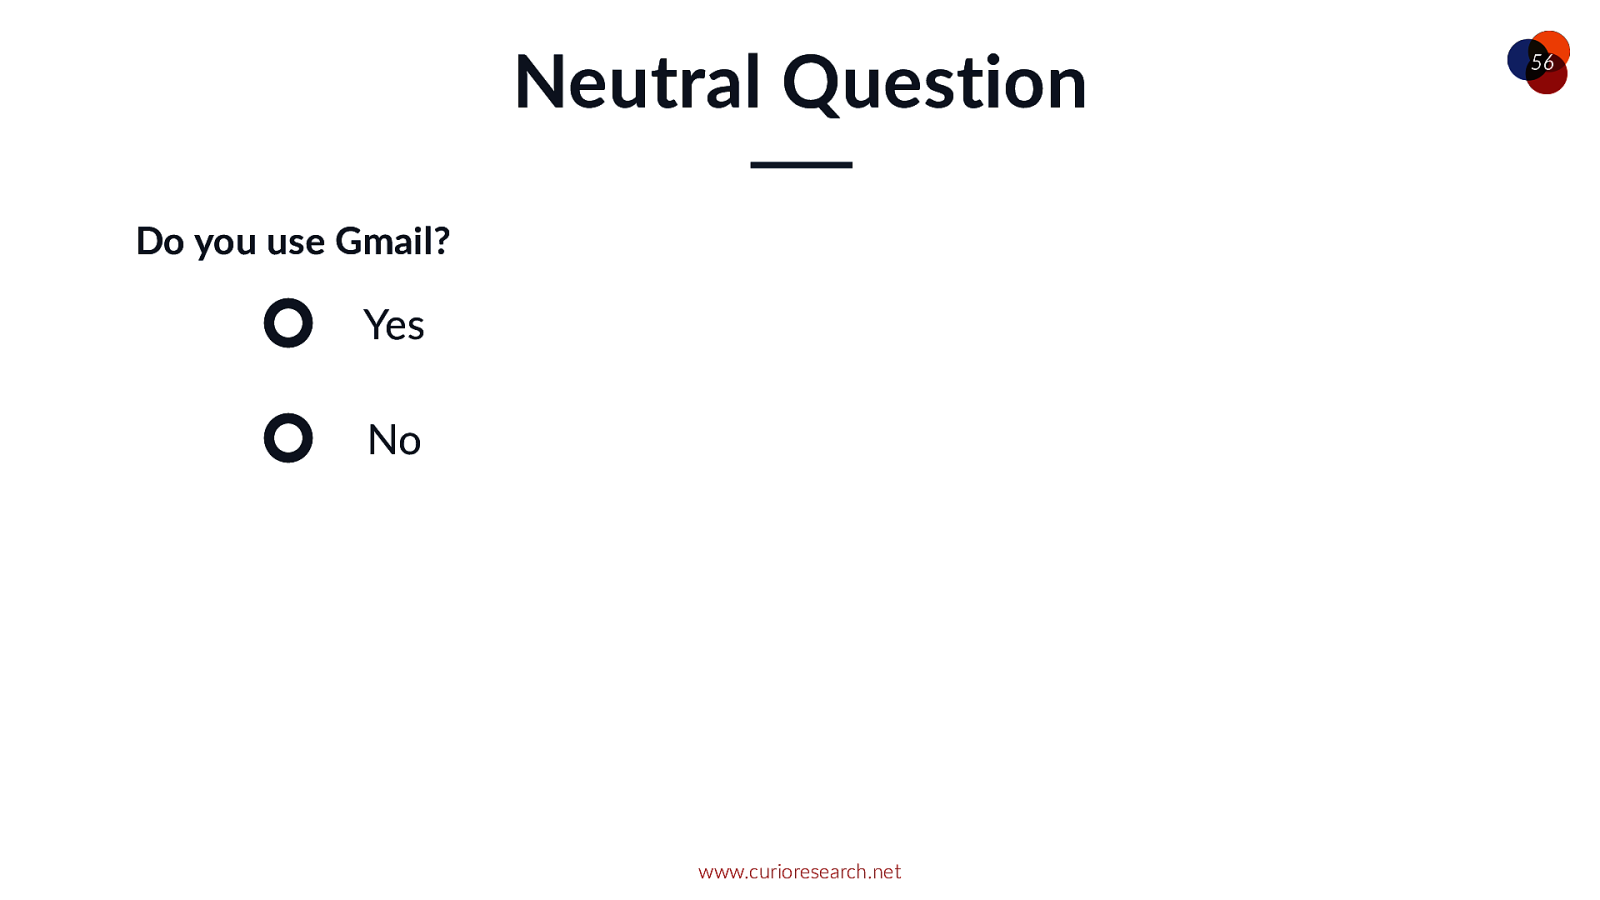
Neutral Question Do you use Gmail? Yes No www.curioresearch.net 56
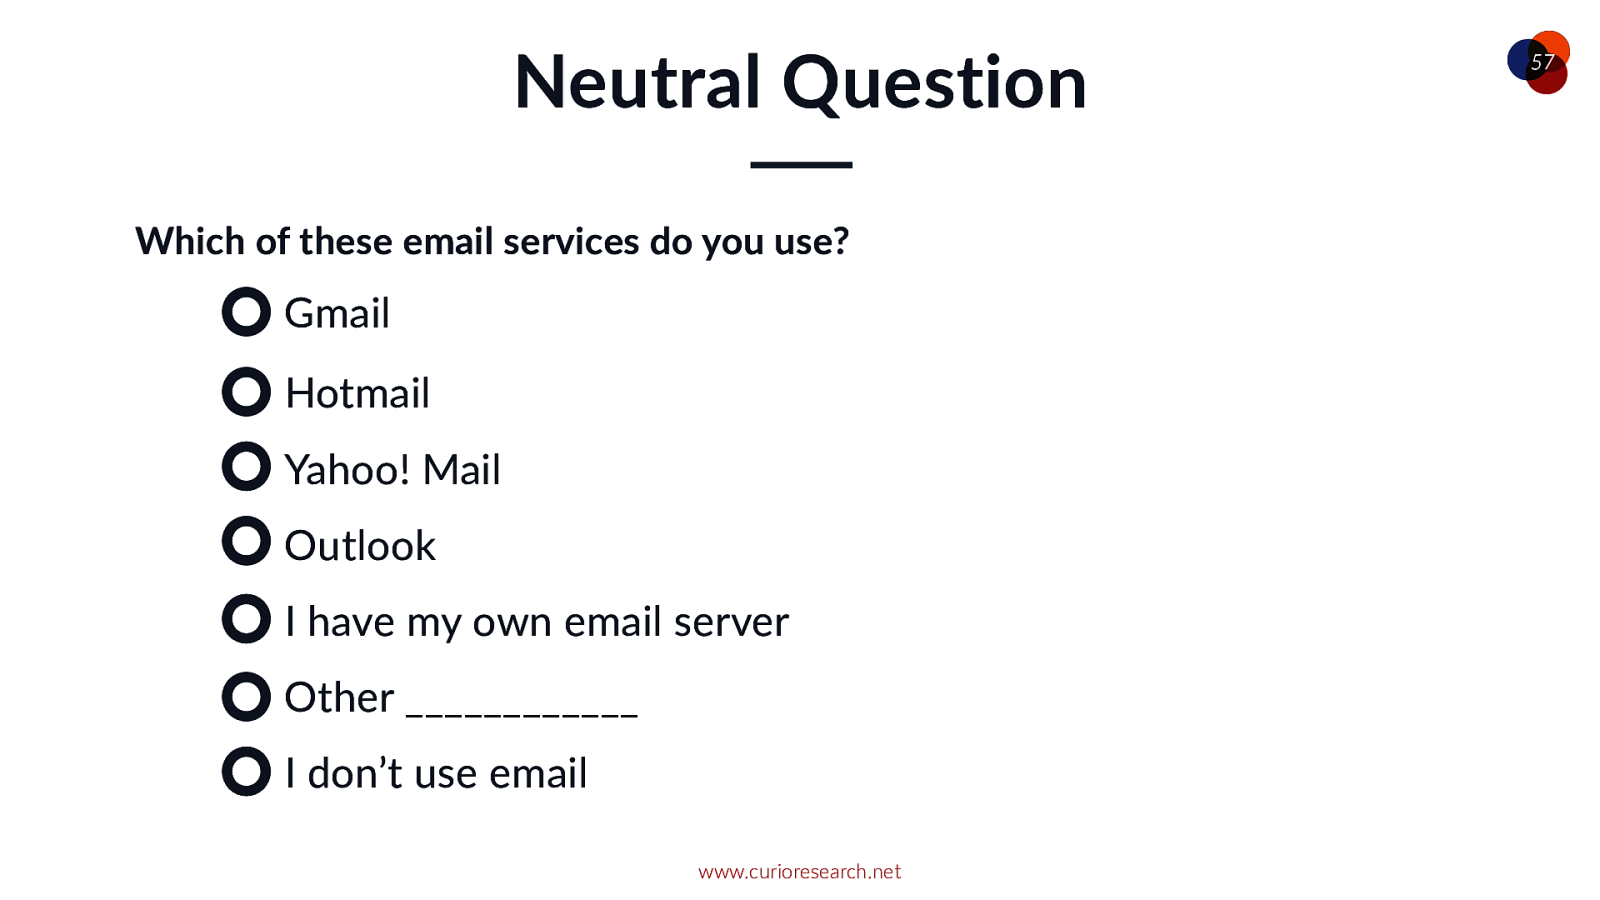
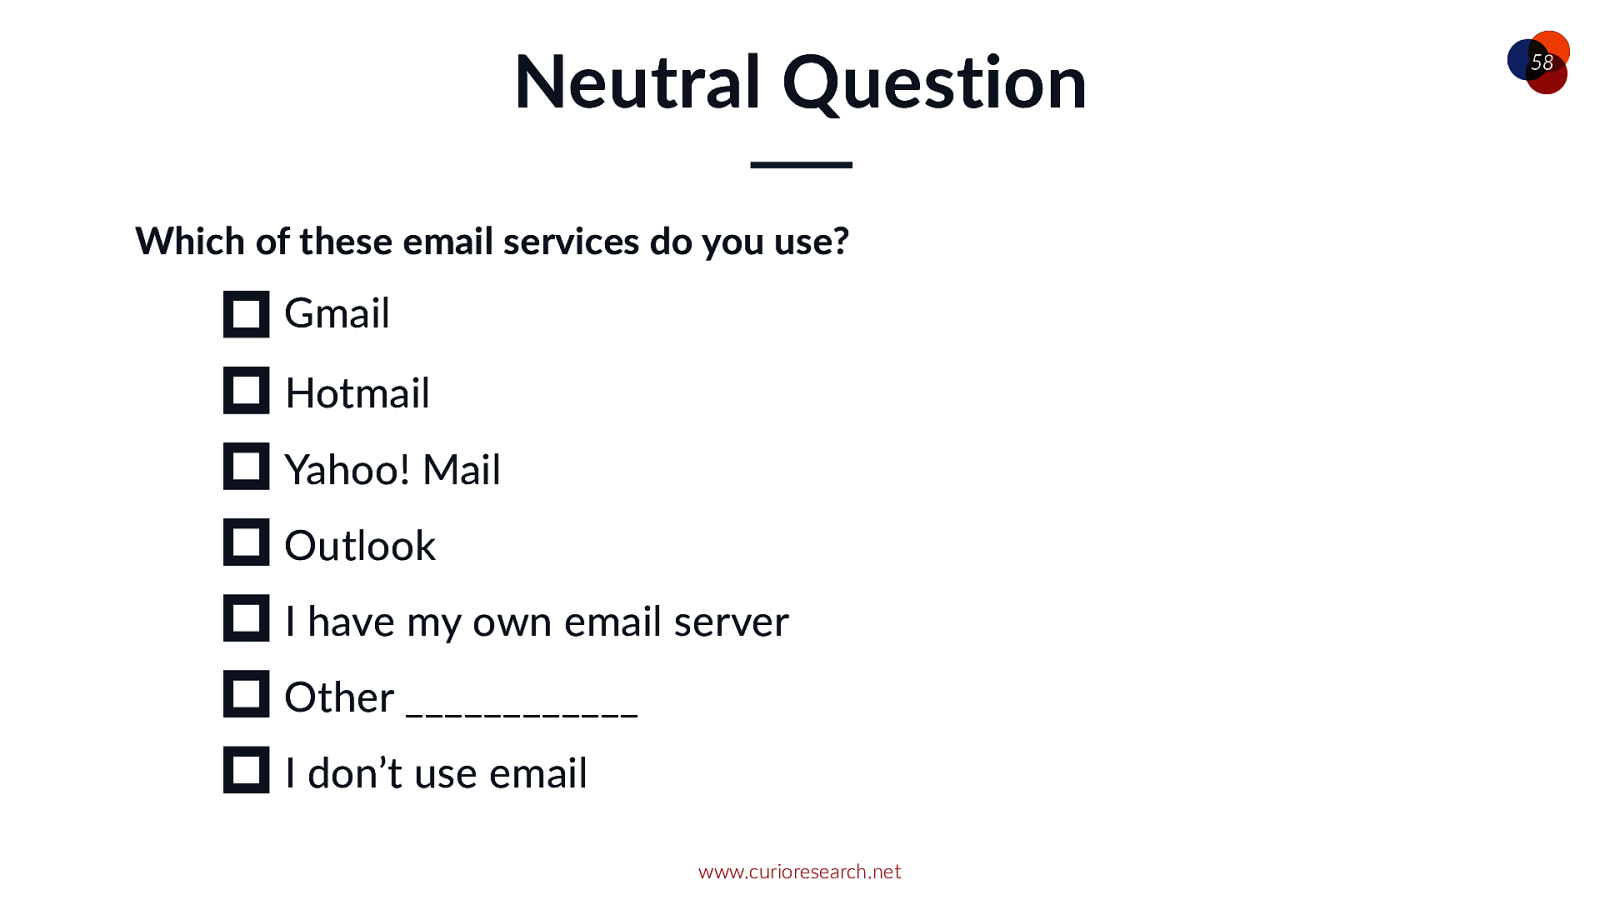
Neutral Question Which of these email services do you use? Gmail Hotmail Yahoo! Mail Outlook I have my own email server Other ____________ I don’t use email www.curioresearch.net 57
Neutral Question Which of these email services do you use? Gmail Hotmail Yahoo! Mail Outlook I have my own email server Other ____________ I don’t use email www.curioresearch.net 58
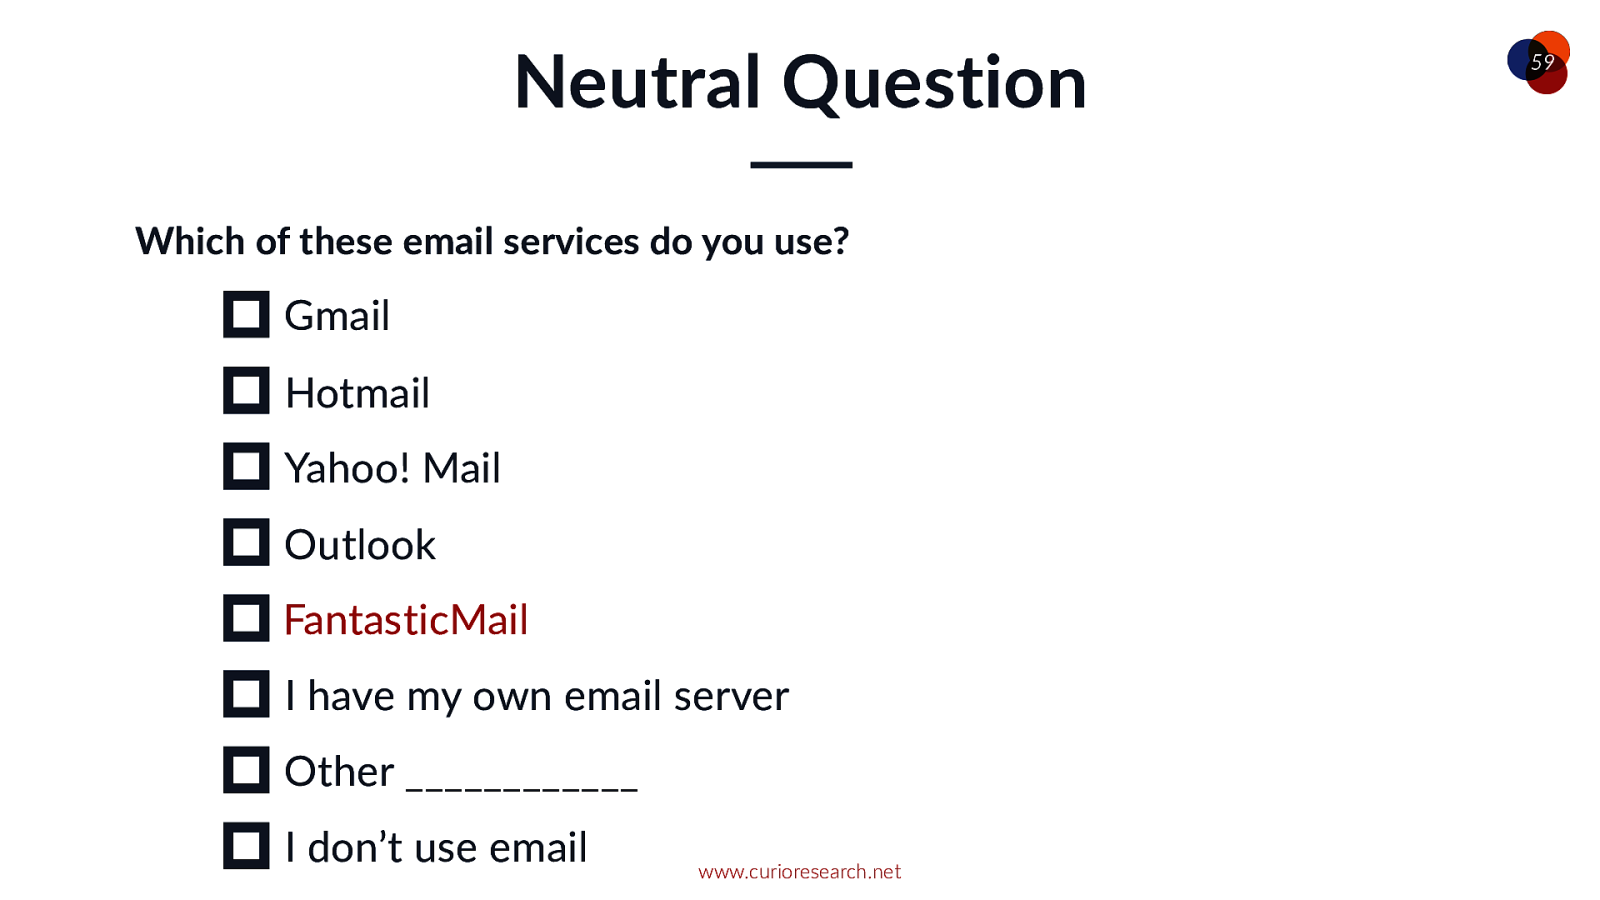
Neutral Question Which of these email services do you use? Gmail Hotmail Yahoo! Mail Outlook FantasticMail I have my own email server Other ____________ I don’t use email www.curioresearch.net 59
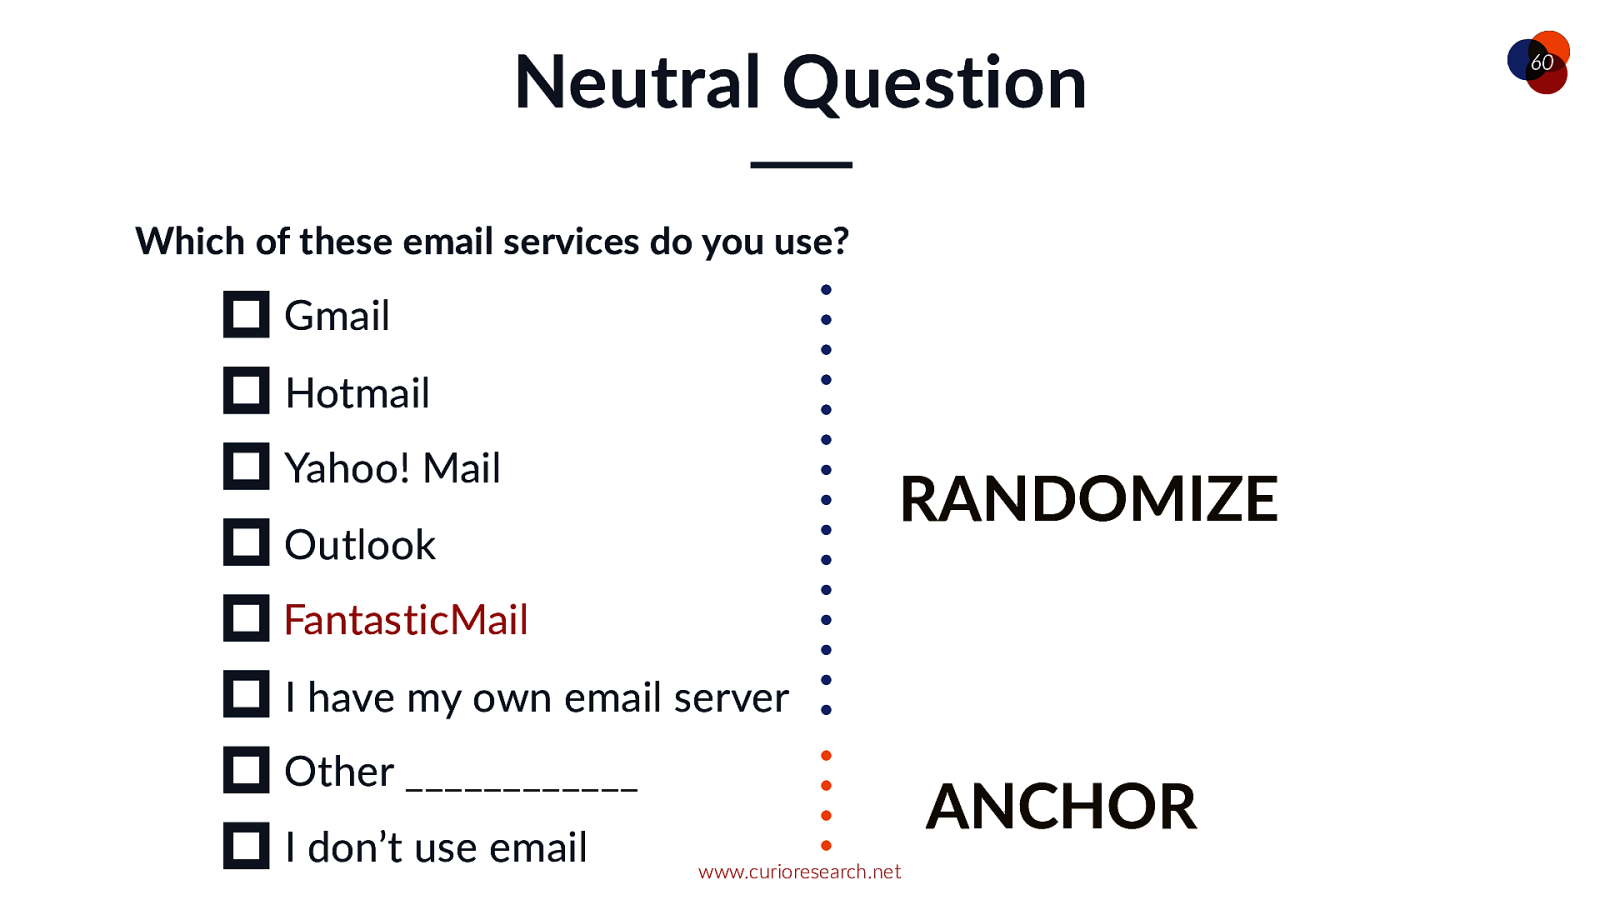
Neutral Question Which of these email services do you use? Gmail Hotmail Yahoo! Mail RANDOMIZE Outlook FantasticMail I have my own email server Other ____________ I don’t use email ANCHOR www.curioresearch.net 60
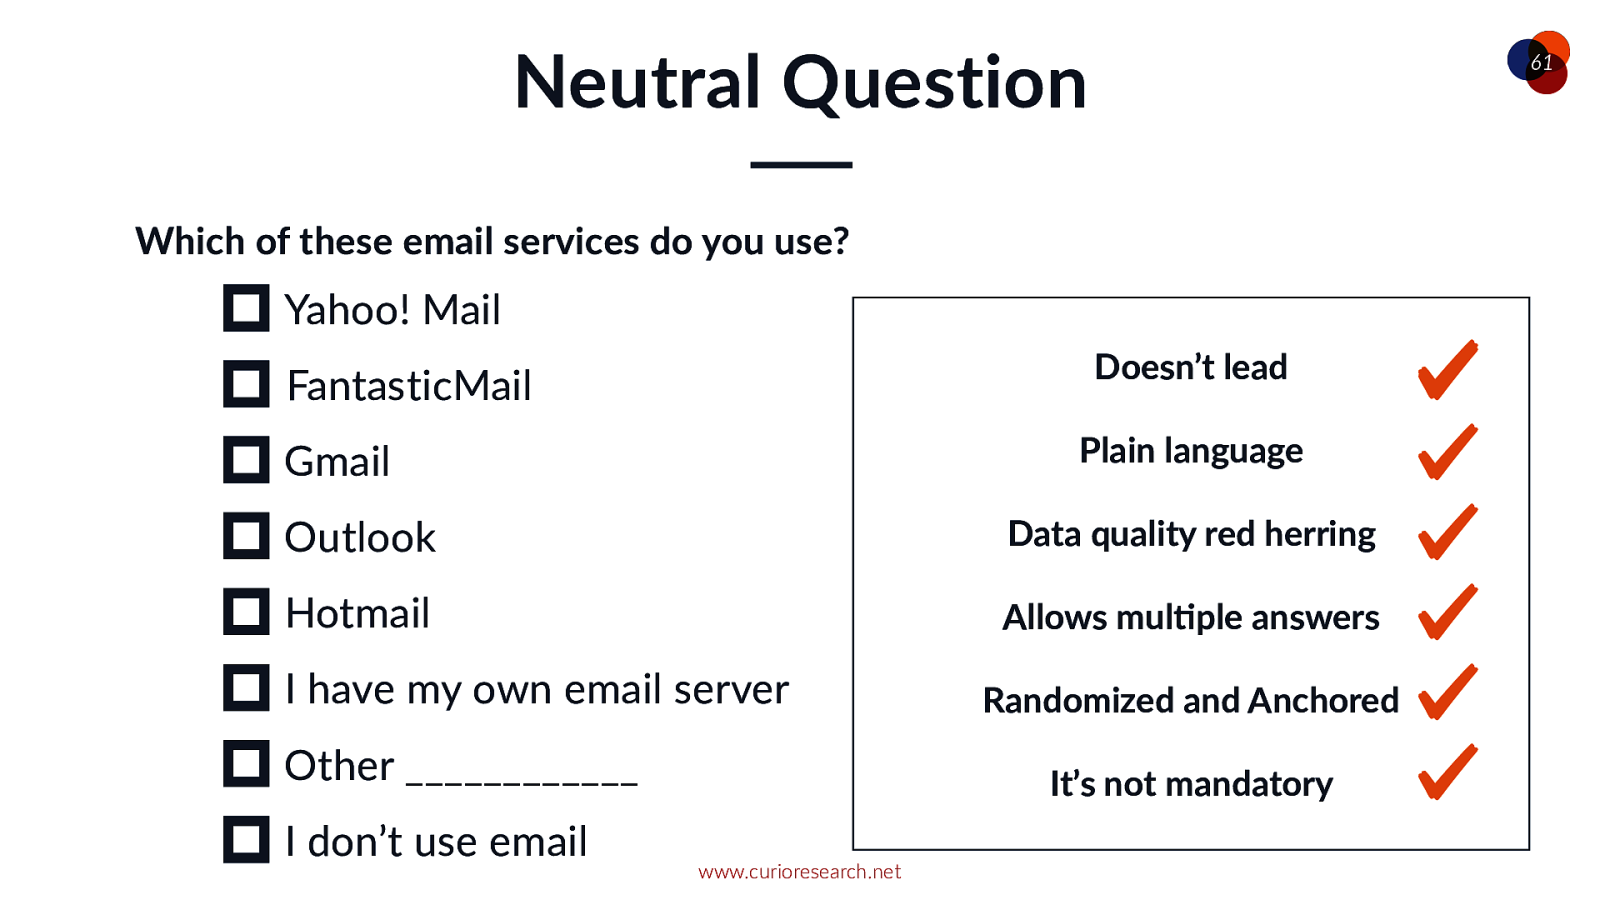
Neutral Question 61 Which of these email services do you use? Yahoo! Mail Doesn’t lead FantasticMail Plain language Gmail Outlook Data quality red herring Hotmail Allows mulVple answers I have my own email server Other ____________ I don’t use email Randomized and Anchored It’s not mandatory www.curioresearch.net
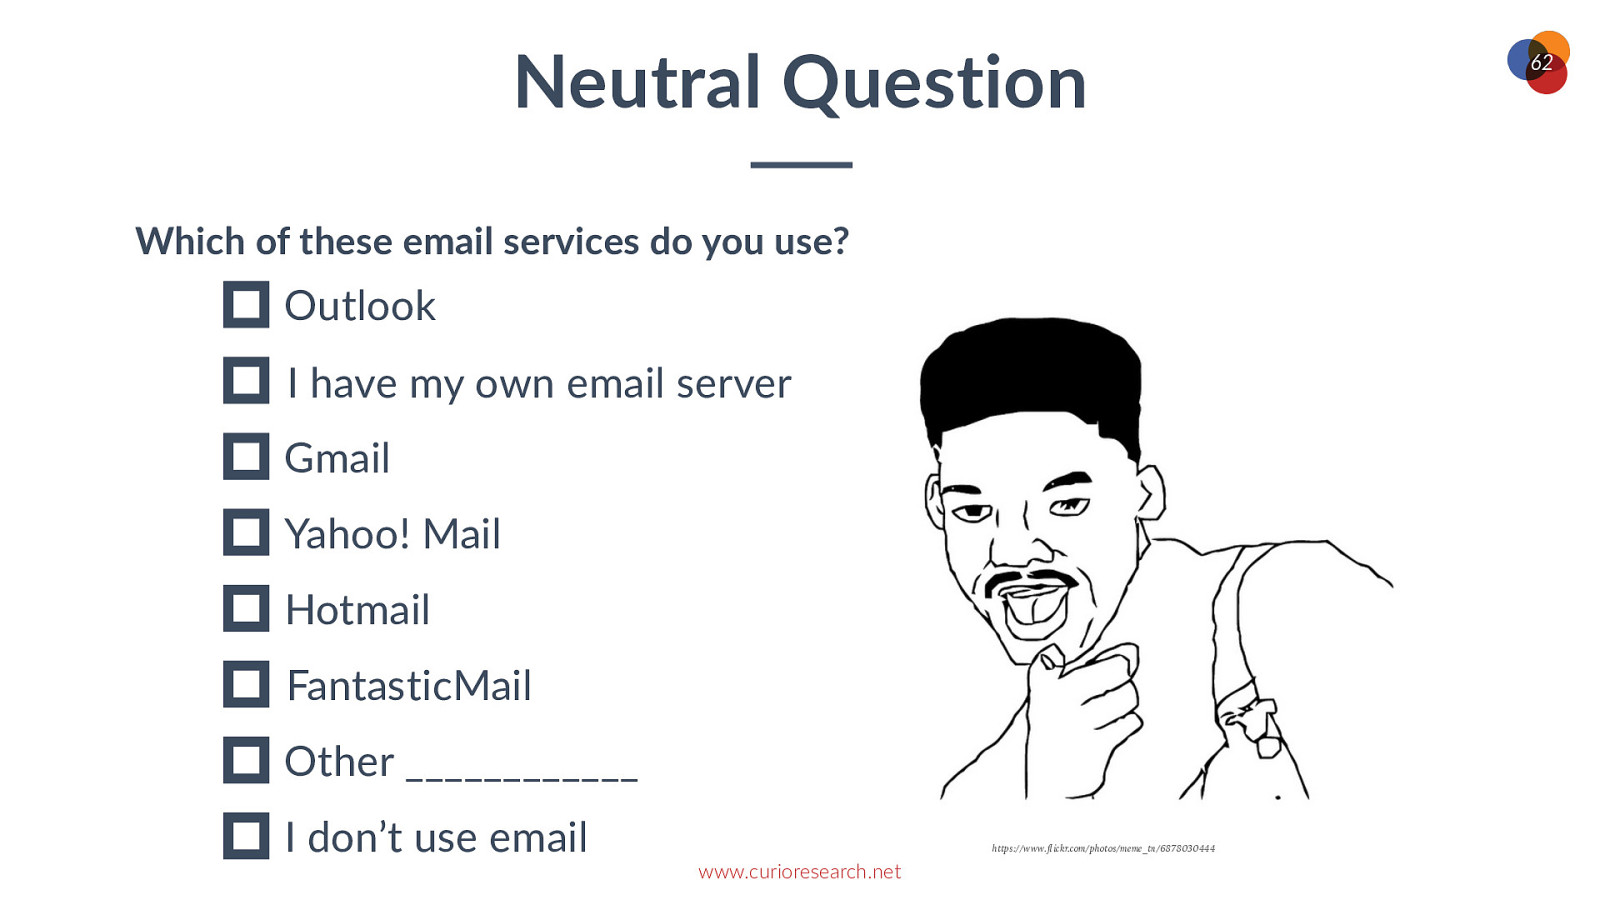
Neutral Question Which of these email services do you use? Outlook I have my own email server Gmail Yahoo! Mail Hotmail FantasticMail Other ____________ I don’t use email https://www.flickr.com/photos/meme_tn/6878030444 www.curioresearch.net 62

o_Research Incentivize 63 Photo by Olga DeLawrence on Unsplash
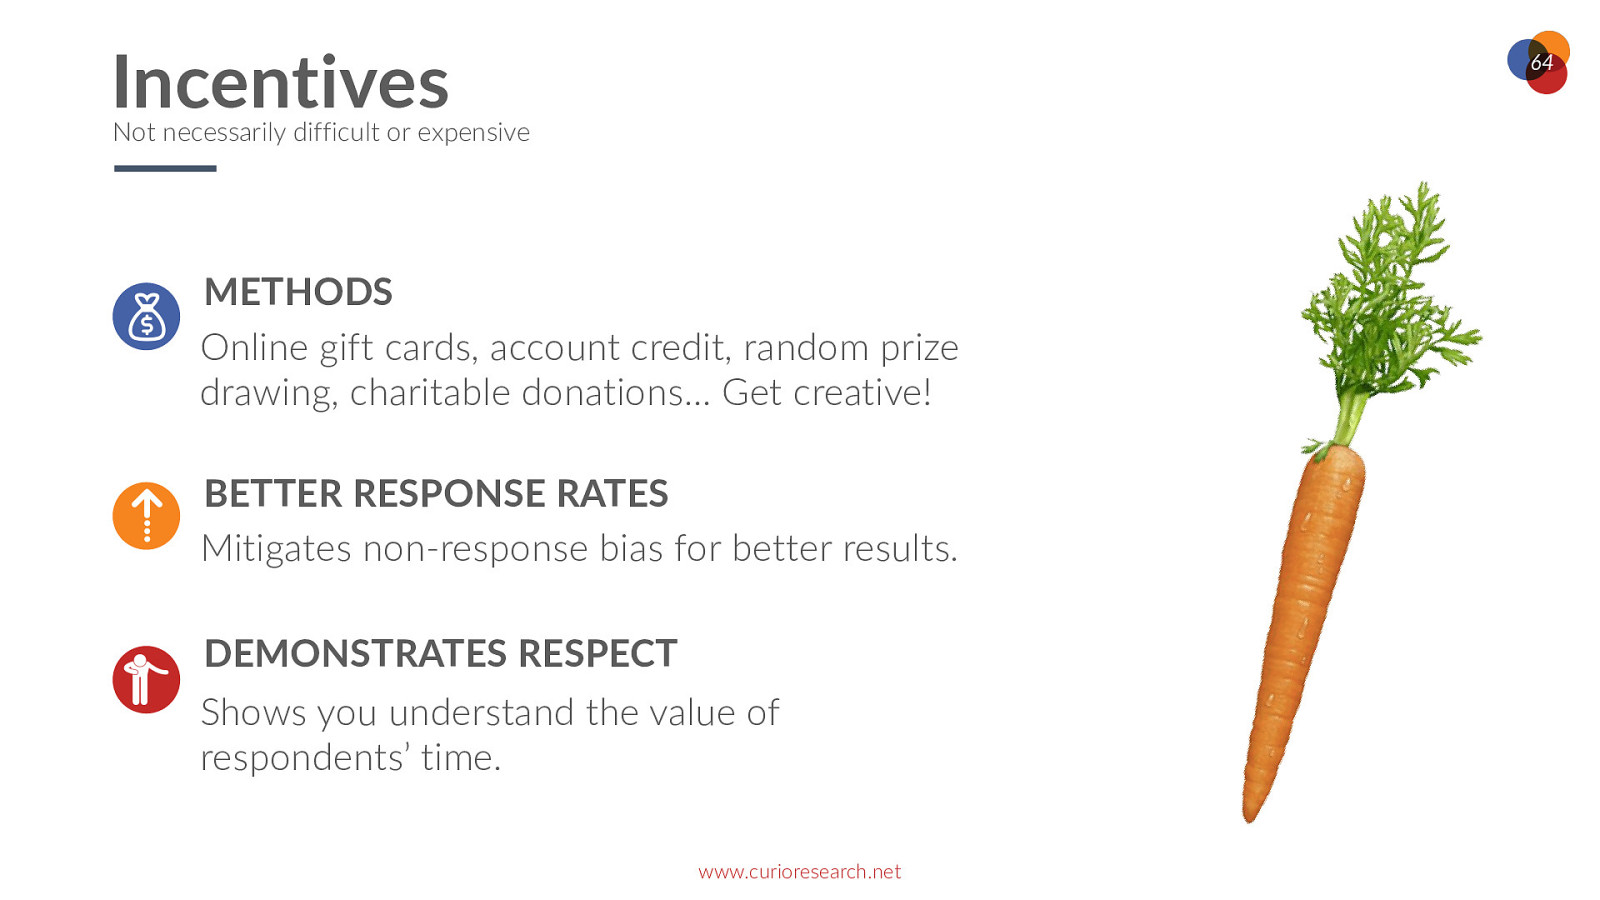
Incentives 64 Not necessarily difficult or expensive METHODS Online gift cards, account credit, random prize drawing, charitable donations… Get creative! BETTER RESPONSE RATES Mitigates non-response bias for better results. DEMONSTRATES RESPECT Shows you understand the value of respondents’ time. www.curioresearch.net

o_Research Open with gratitude Close with gratitude And a final open end 65 Photo by Tim Marshall on Unsplash
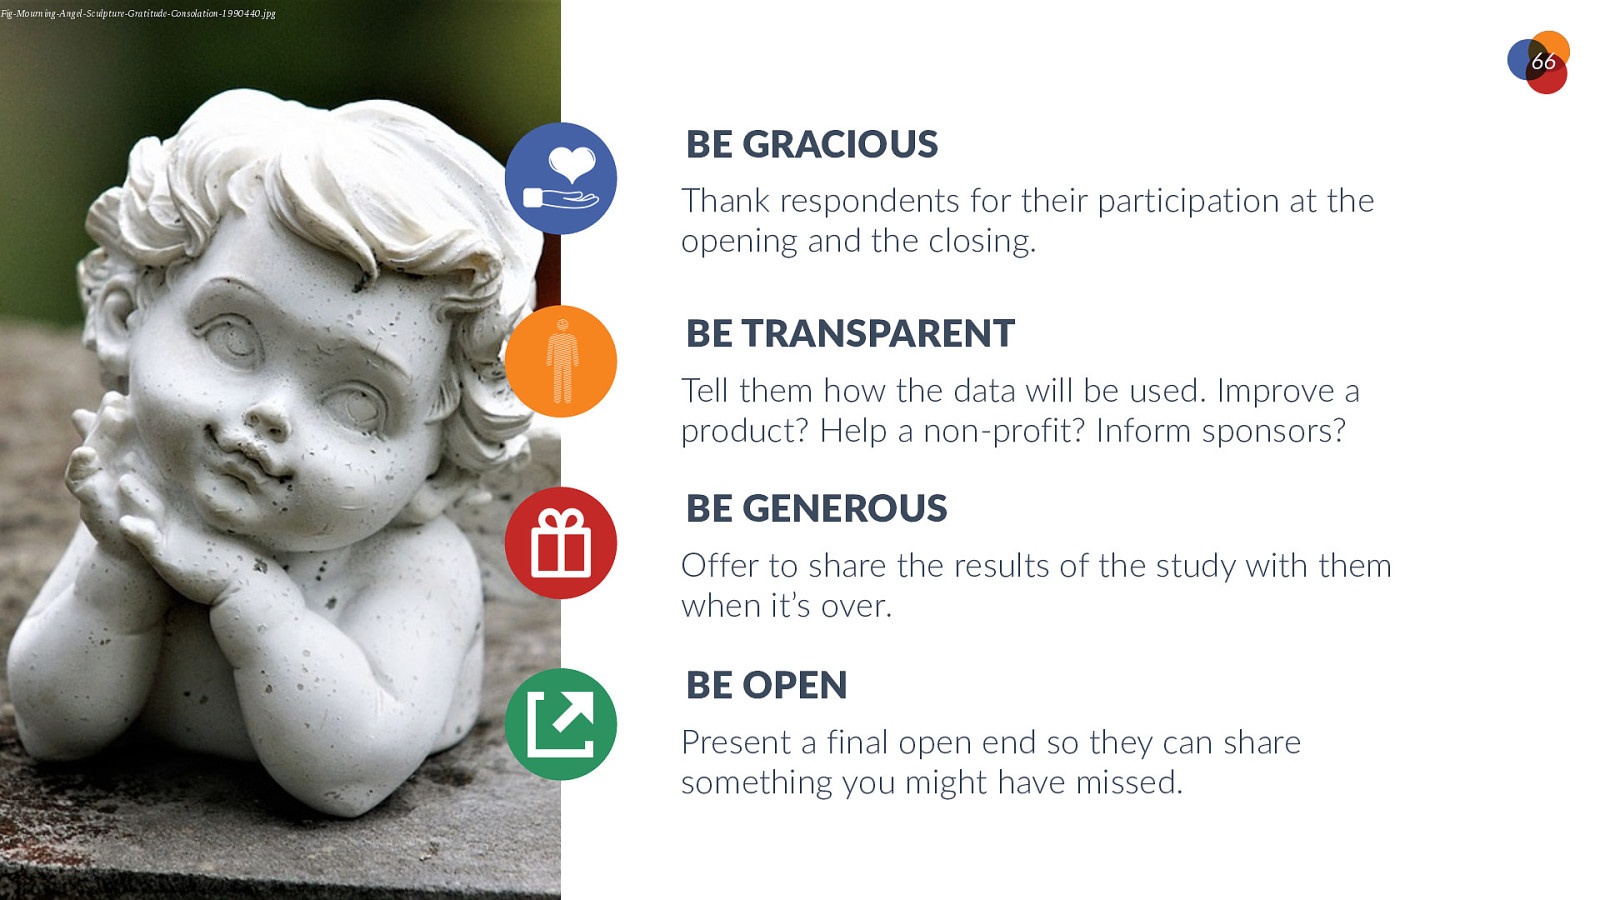
/Fig-Mourning-Angel-Sculpture-Gratitude-Consolation-1990440.jpg 66 BE GRACIOUS Thank respondents for their participation at the opening and the closing. BE TRANSPARENT Tell them how the data will be used. Improve a product? Help a non-profit? Inform sponsors? BE GENEROUS Offer to share the results of the study with them when it’s over. BE OPEN Present a final open end so they can share something you might have missed. www.companyname.com © 2016 Jetfabrik Multipurpose Theme. All Rights Reserved.

%2815139163553%29.jpg/1024px-Love_Hate_Love%2815139163553%29.jpg 67 Testing Your Surveys www.curioresearch.net
o_Research Usability Testing https://www.flickr.com/photos/raphaelquinet/513352193 68
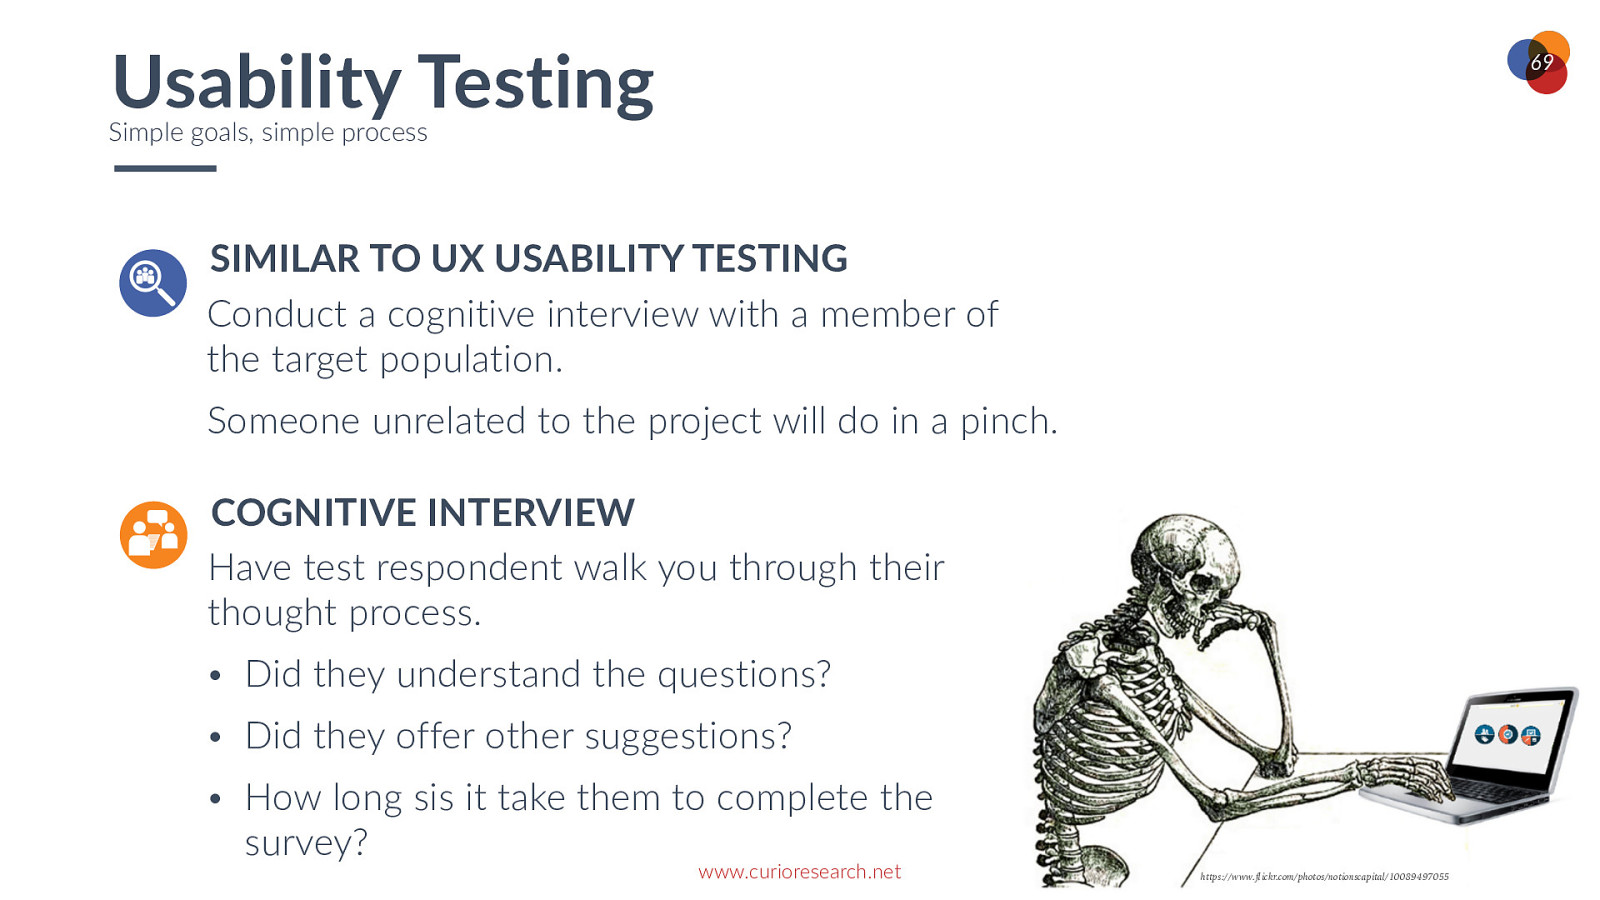
Usability Testing 69 Simple goals, simple process SIMILAR TO UX USABILITY TESTING Conduct a cognitive interview with a member of the target population. Someone unrelated to the project will do in a pinch. COGNITIVE INTERVIEW Have test respondent walk you through their thought process. • Did they understand the questions? • Did they offer other suggestions? • How long sis it take them to complete the survey? www.curioresearch.net https://www.flickr.com/photos/notionscapital/10089497055

o_Research Pilot Study 70 Photo by Igor Ovsyannykov on Unsplash
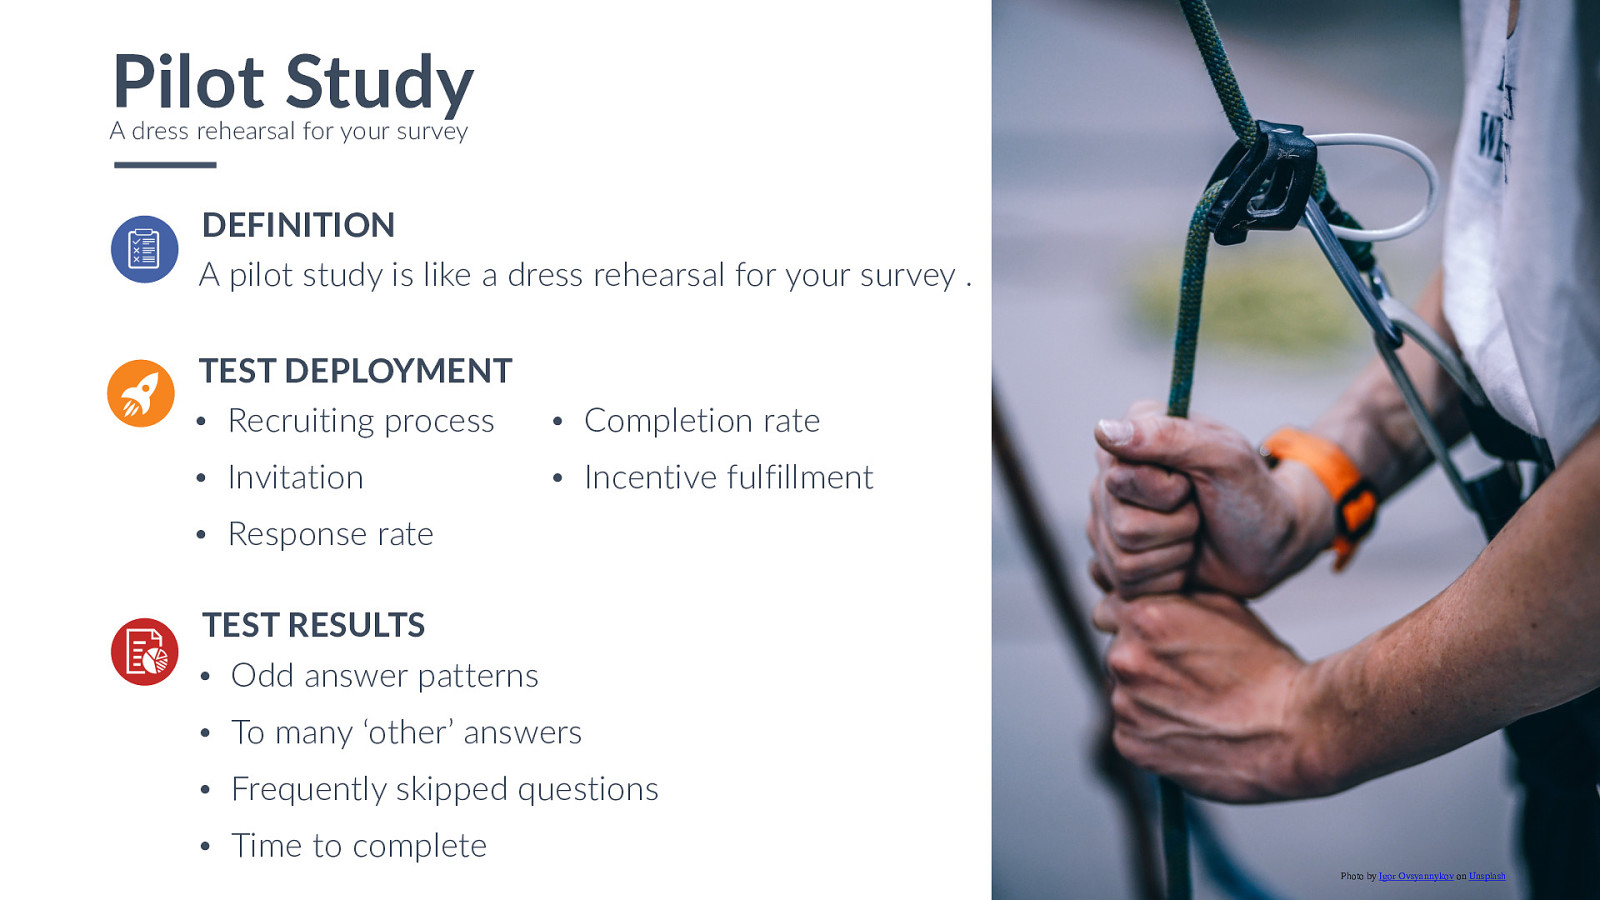
Pilot Study 71 A dress rehearsal for your survey DEFINITION A pilot study is like a dress rehearsal for your survey . TEST DEPLOYMENT • Recruiting process • Invitation • Response rate • Completion rate • Incentive fulfillment TEST RESULTS • Odd answer patterns • To many ‘other’ answers • Frequently skipped questions • Time to complete www.companyname.com © 2016 Jetfabrik Multipurpose Theme. All Rights Reserved. Photo by Igor Ovsyannykov on Unsplash

72 A Proper Sendoff dia/commons/0/0e/STS133_launch.jpg www.curioresearch.net
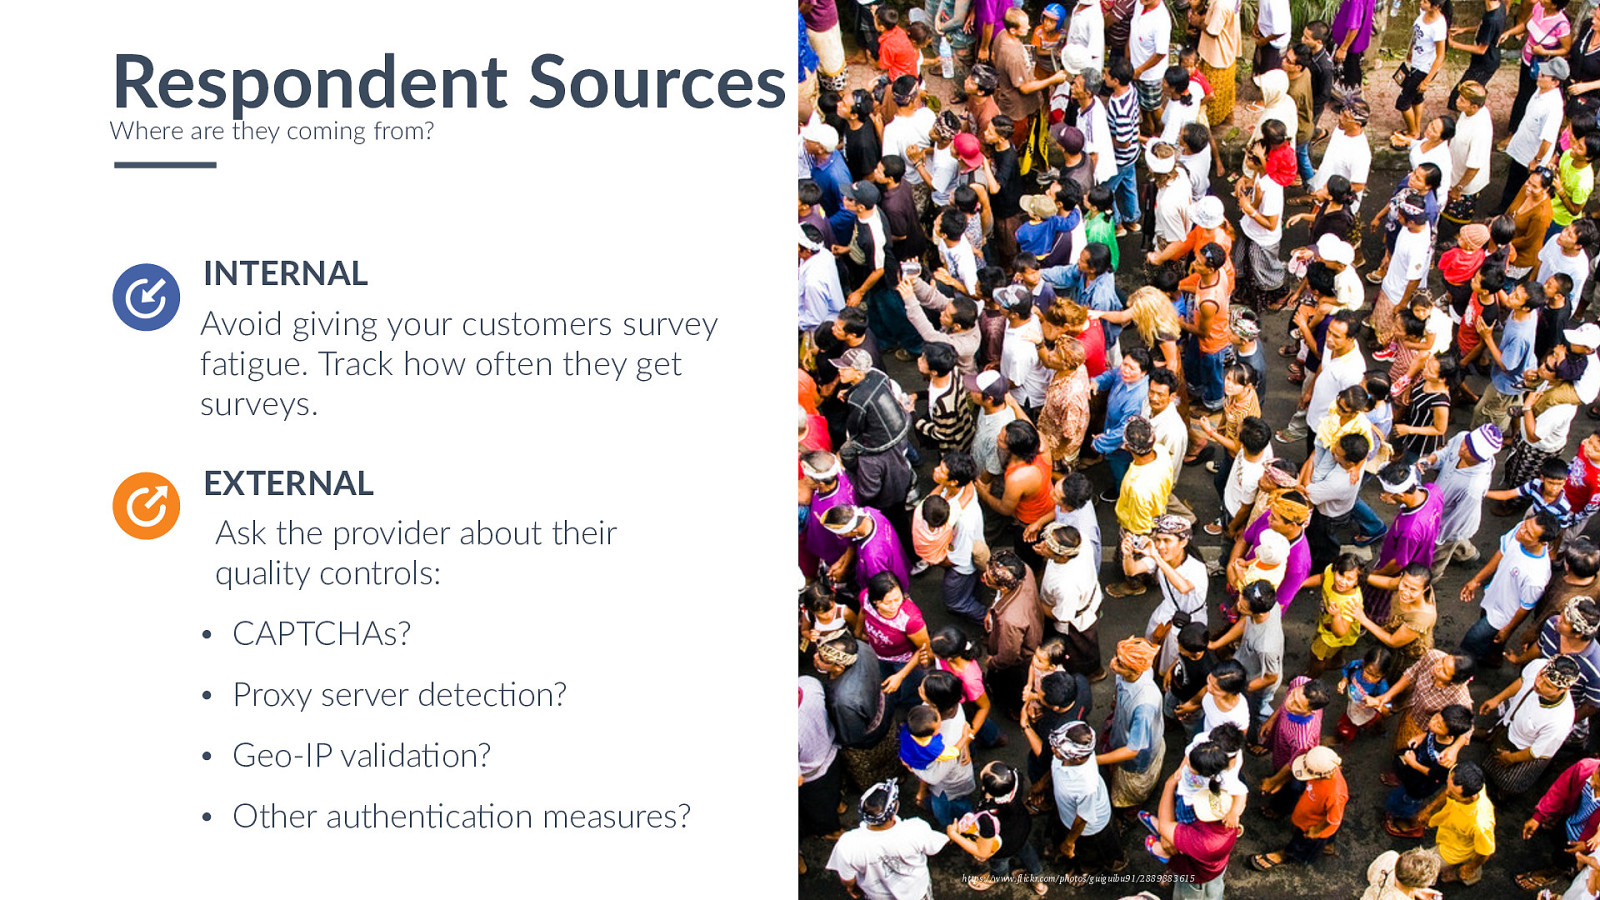
Respondent Sources Where are they coming from? INTERNAL Avoid giving your customers survey fatigue. Track how often they get surveys. EXTERNAL Ask the provider about their quality controls: • CAPTCHAs? • Proxy server detecOon? • Geo-IP validaOon? • Other authenOcaOon measures? www.companyname.com https://www.flickr.com/photos/guiguibu91/2889883615 © 2016 Jetfabrik Multipurpose Theme. All Rights Reserved. 73
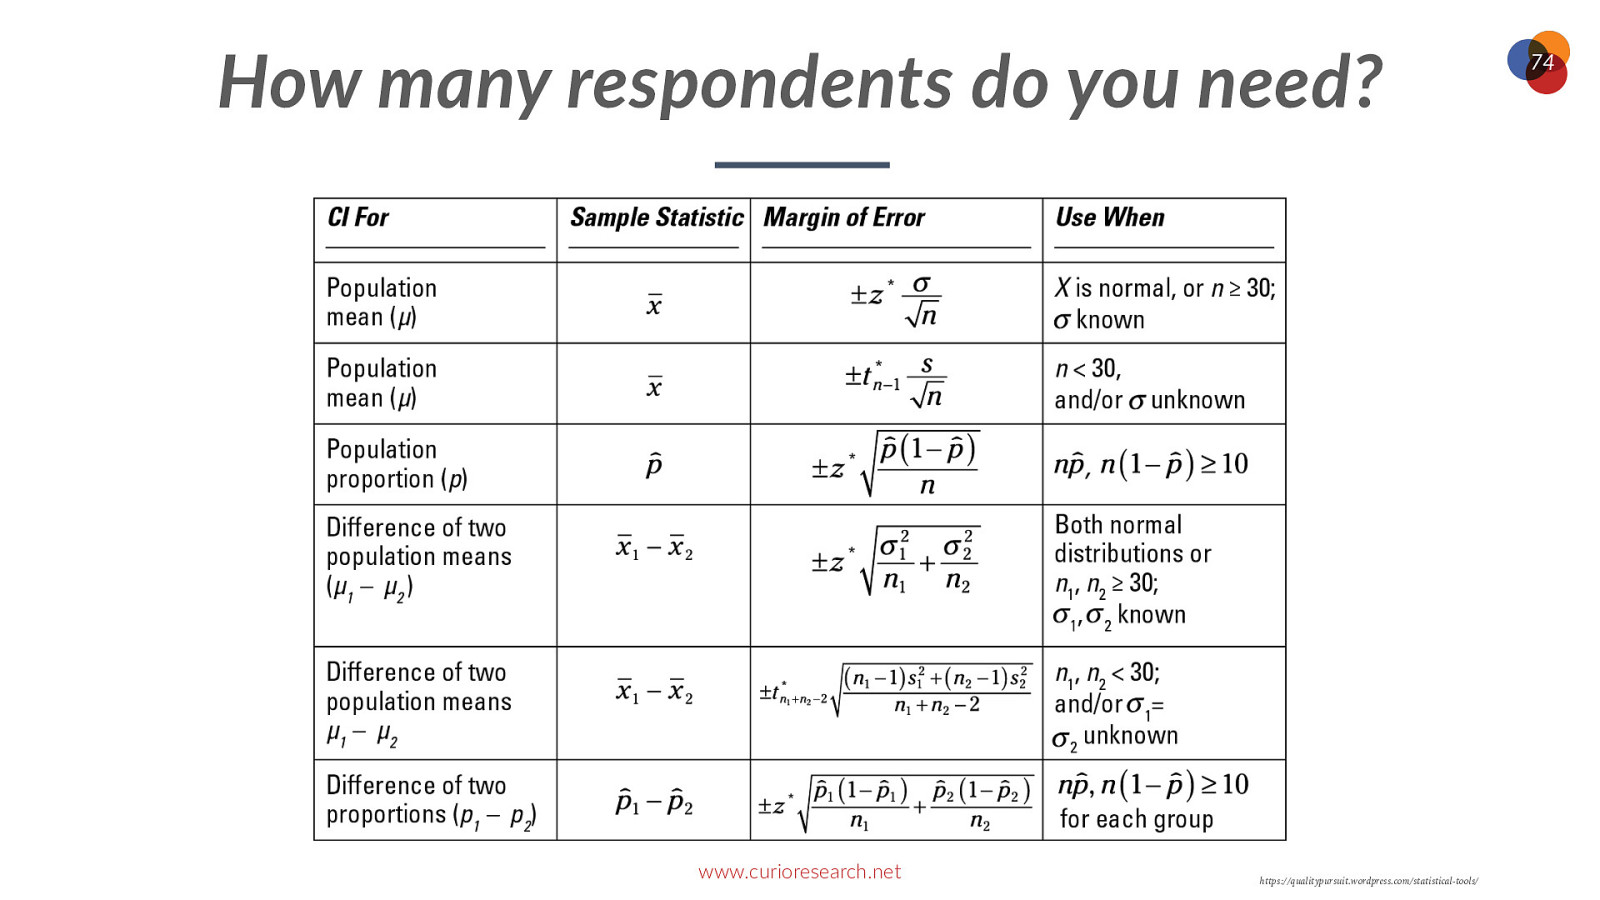
How many respondents do you need? www.curioresearch.net https://qualitypursuit.wordpress.com/statistical-tools/ 74
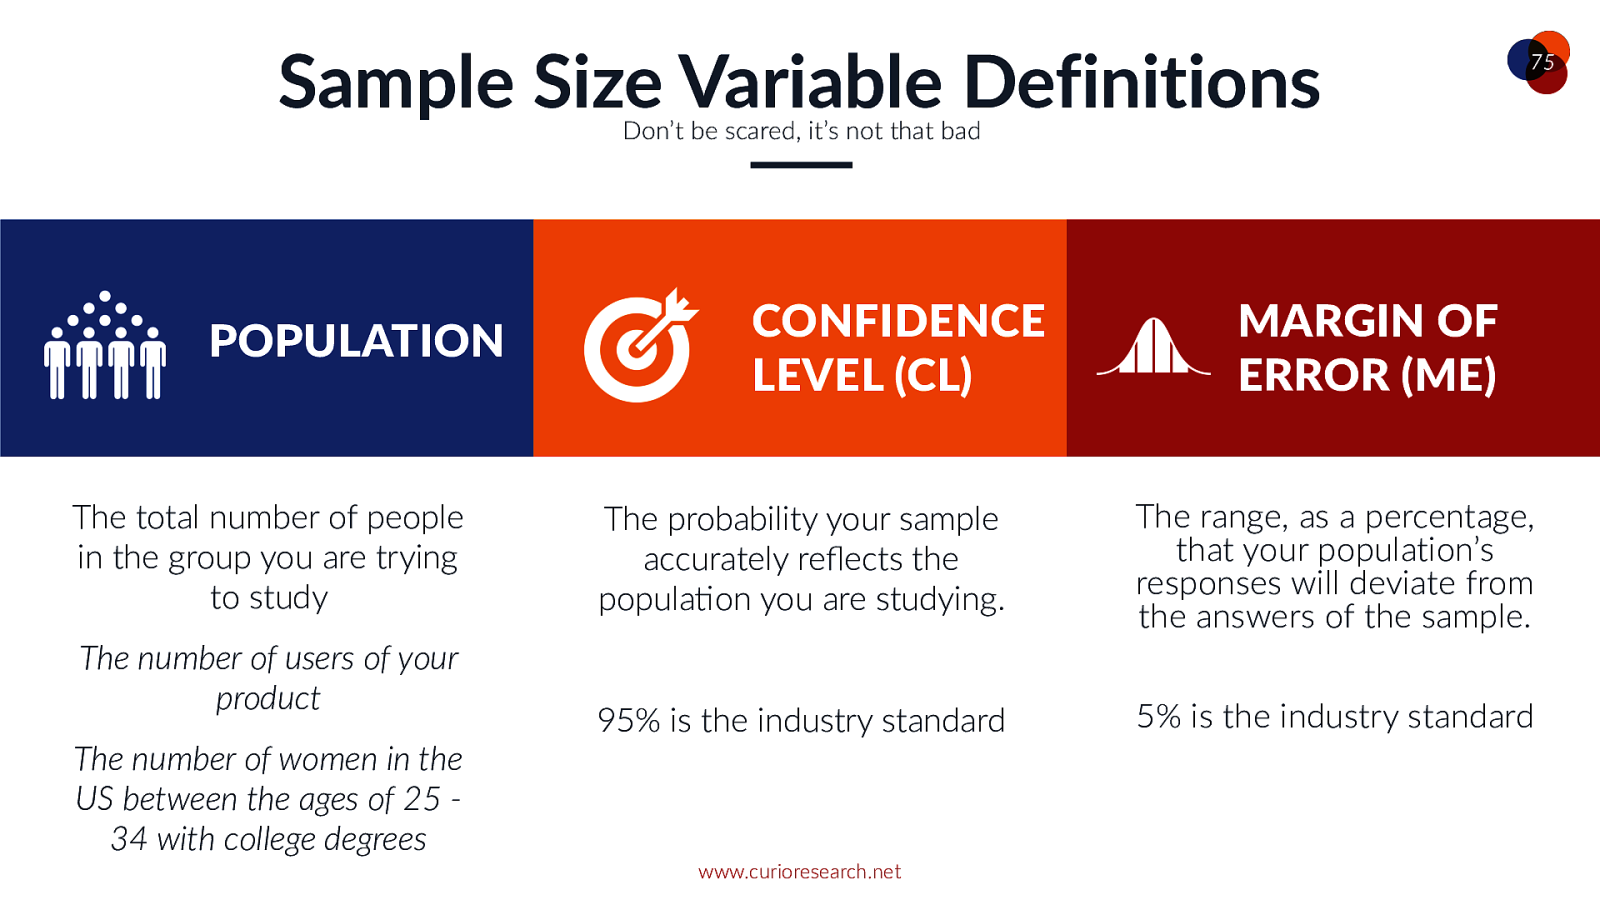
Sample Size Variable Definitions 75 Don’t be scared, it’s not that bad POPULATION The total number of people in the group you are trying to study The number of users of your product The number of women in the US between the ages of 25 34 with college degrees CONFIDENCE LEVEL (CL) MARGIN OF ERROR (ME) The probability your sample accurately reflects the populaOon you are studying. The range, as a percentage, that your population’s responses will deviate from the answers of the sample. 95% is the industry standard 5% is the industry standard www.curioresearch.net
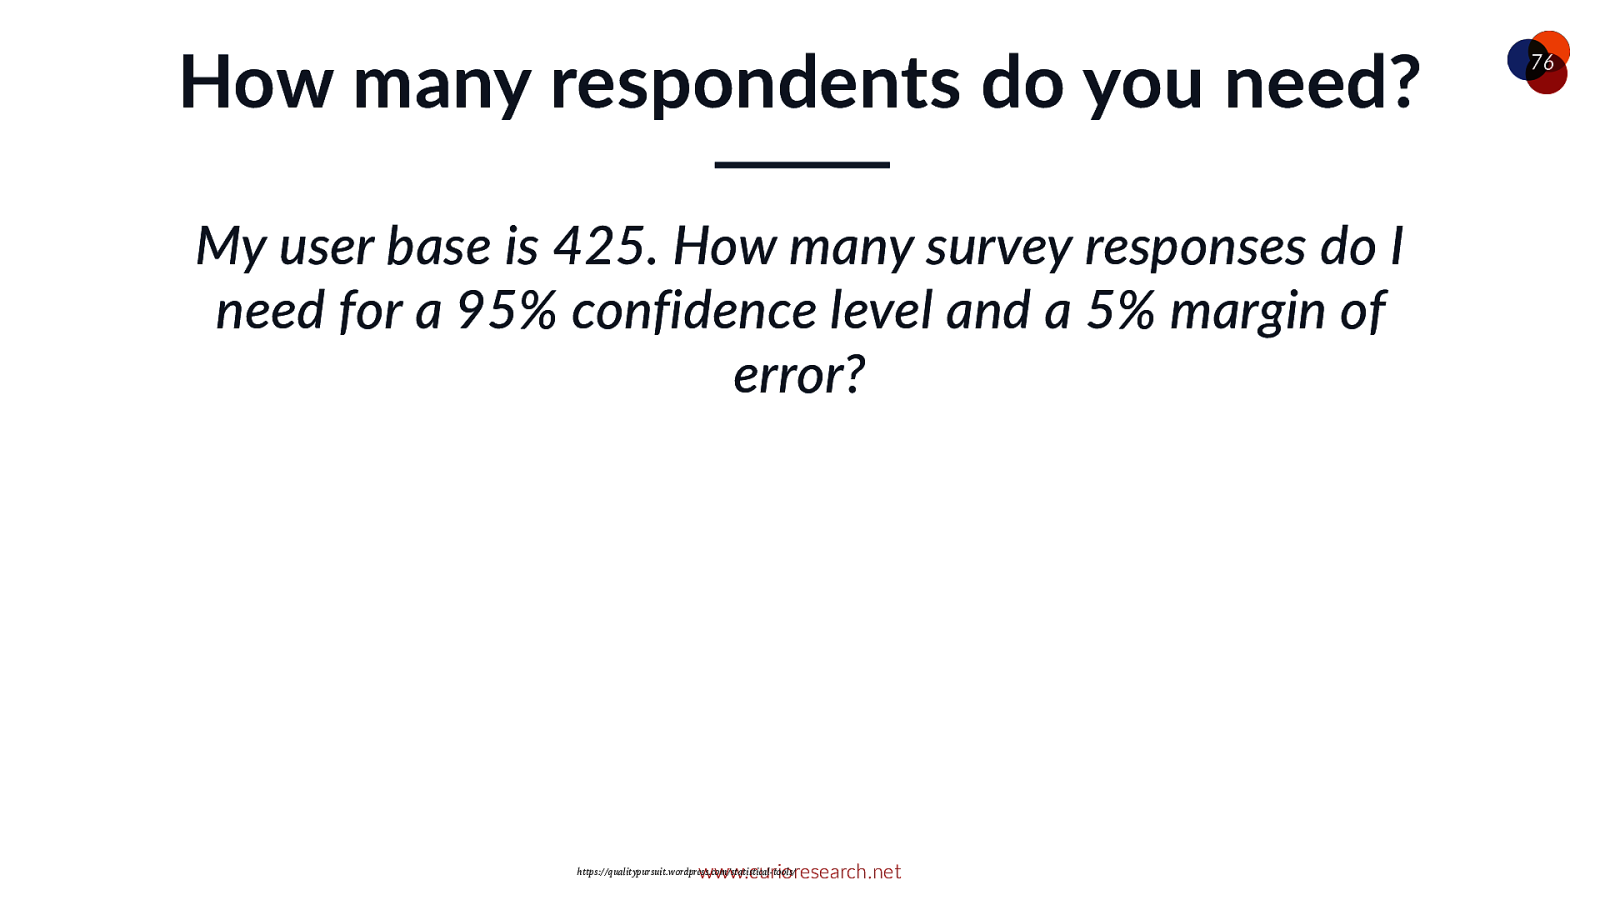
How many respondents do you need? My user base is 425. How many survey responses do I need for a 95% confidence level and a 5% margin of error? www.curioresearch.net https://qualitypursuit.wordpress.com/statistical-tools/ 76
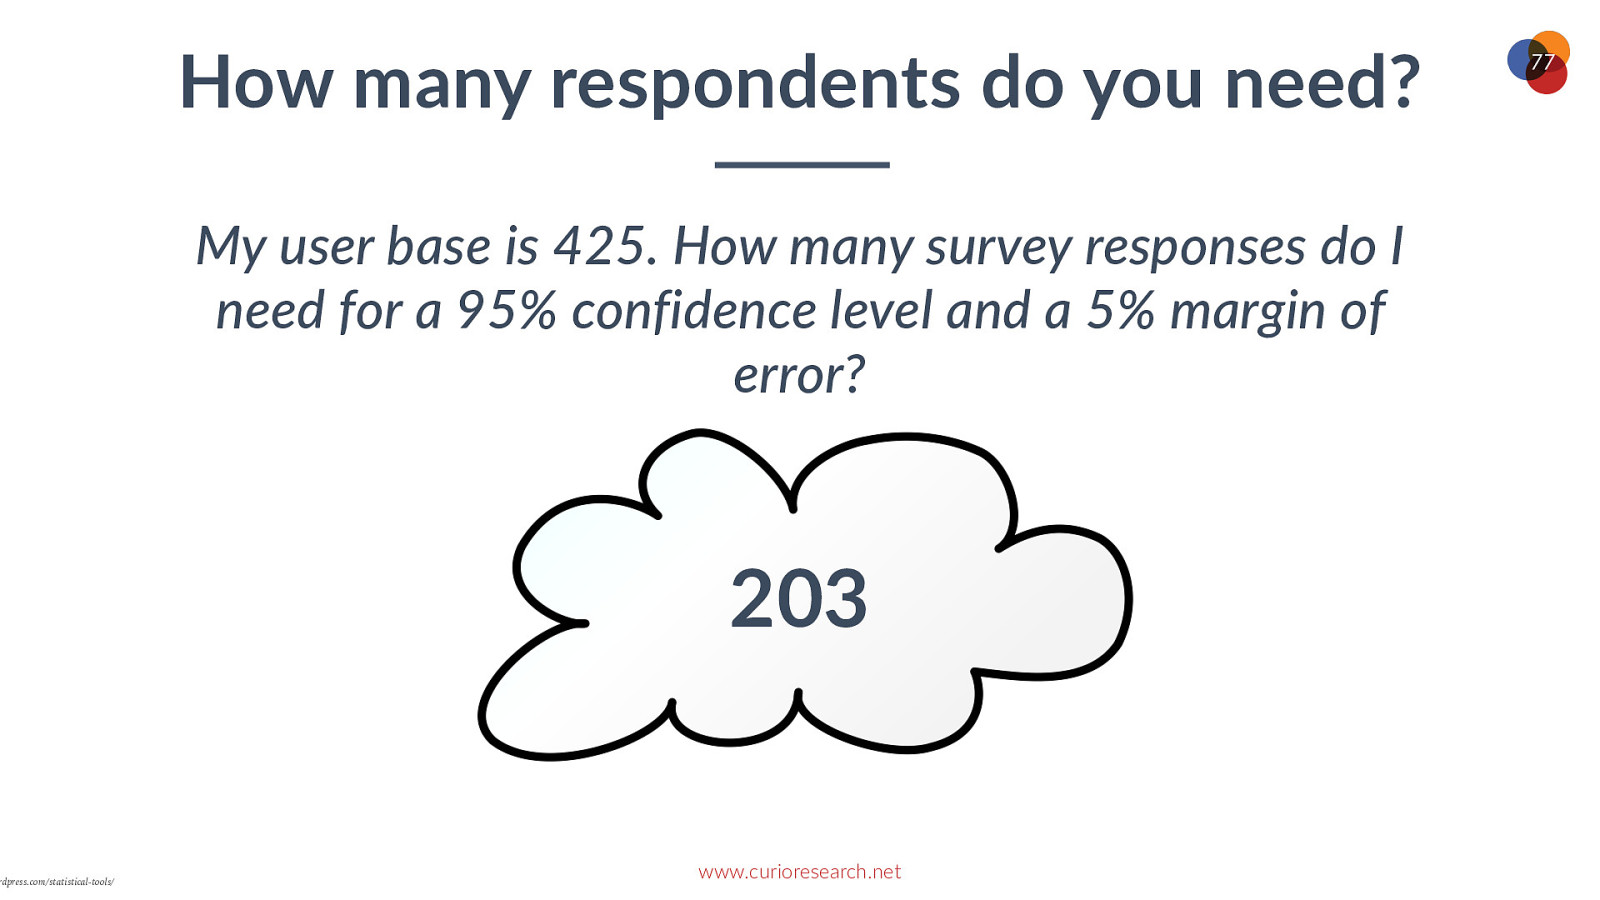
rdpress.com/statistical-tools/ How many respondents do you need? My user base is 425. How many survey responses do I need for a 95% confidence level and a 5% margin of error? 203 www.curioresearch.net 77
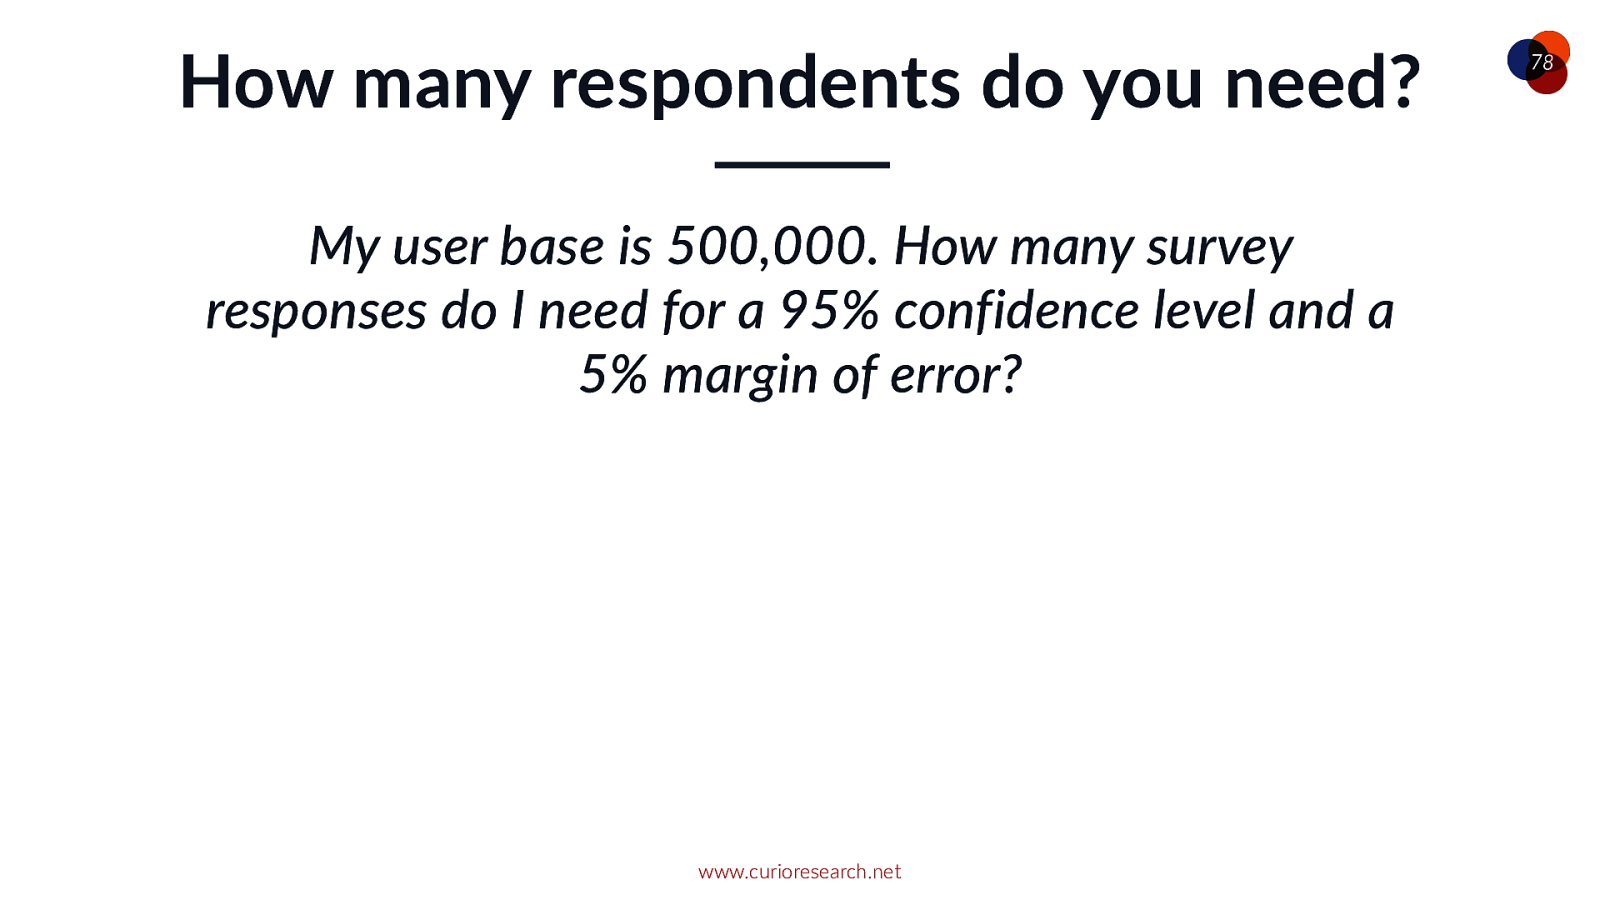
How many respondents do you need? My user base is 500,000. How many survey responses do I need for a 95% confidence level and a 5% margin of error? www.curioresearch.net 78
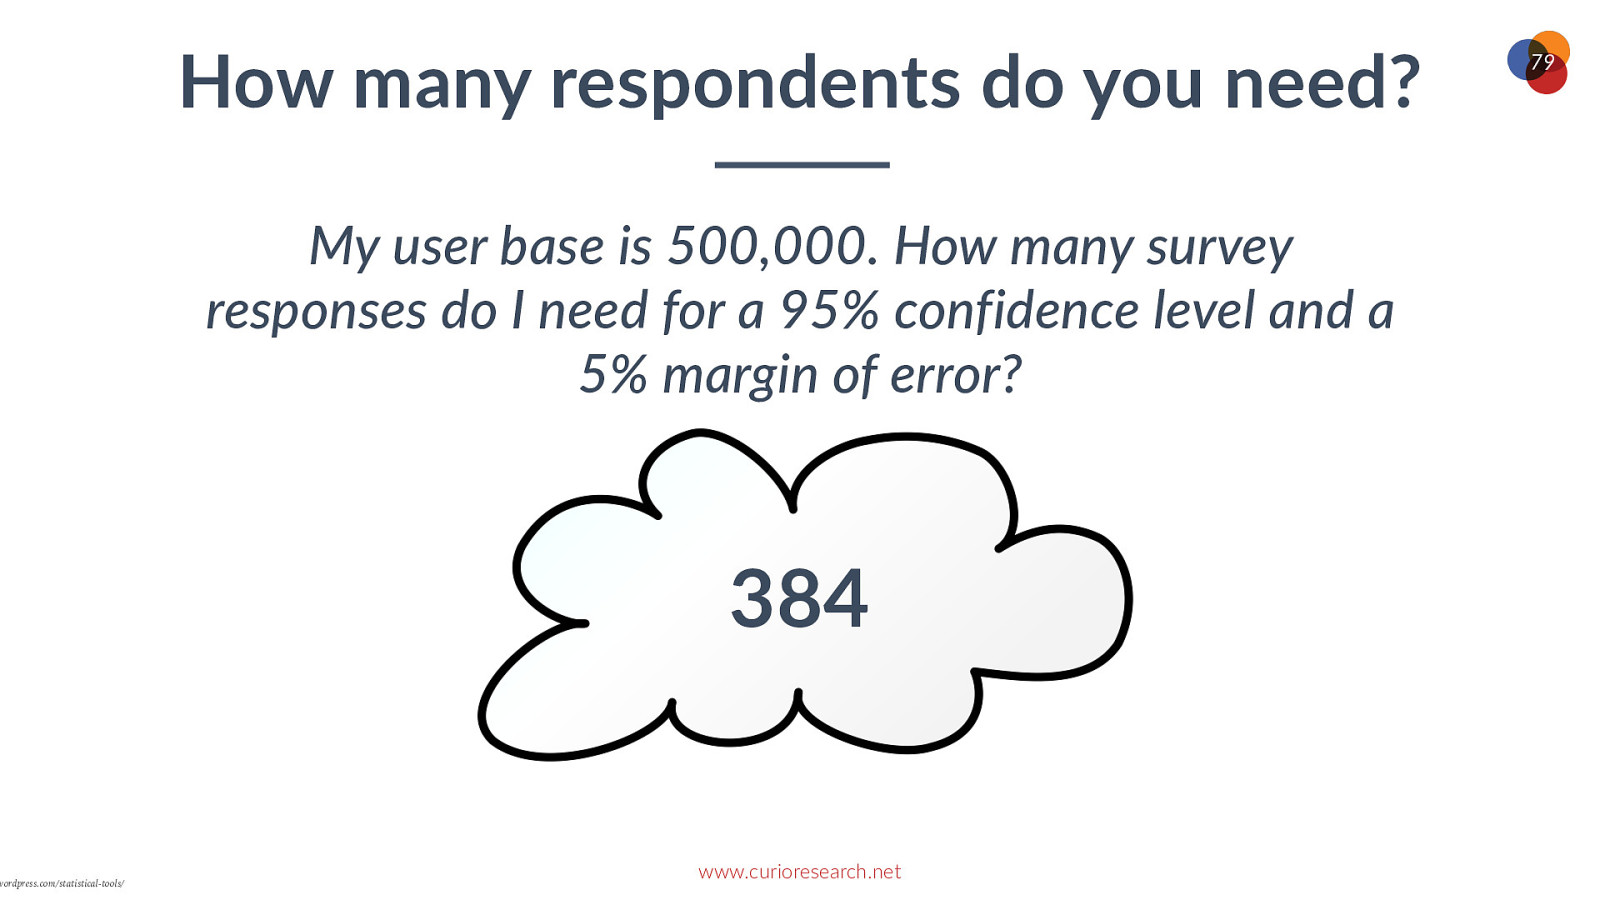
wordpress.com/statistical-tools/ How many respondents do you need? My user base is 500,000. How many survey responses do I need for a 95% confidence level and a 5% margin of error? 384 www.curioresearch.net 79
How many respondents do you need? My population size is about 5,000,000. How many survey responses do I need for a 95% confidence level and a 5% margin of error? www.curioresearch.net 80
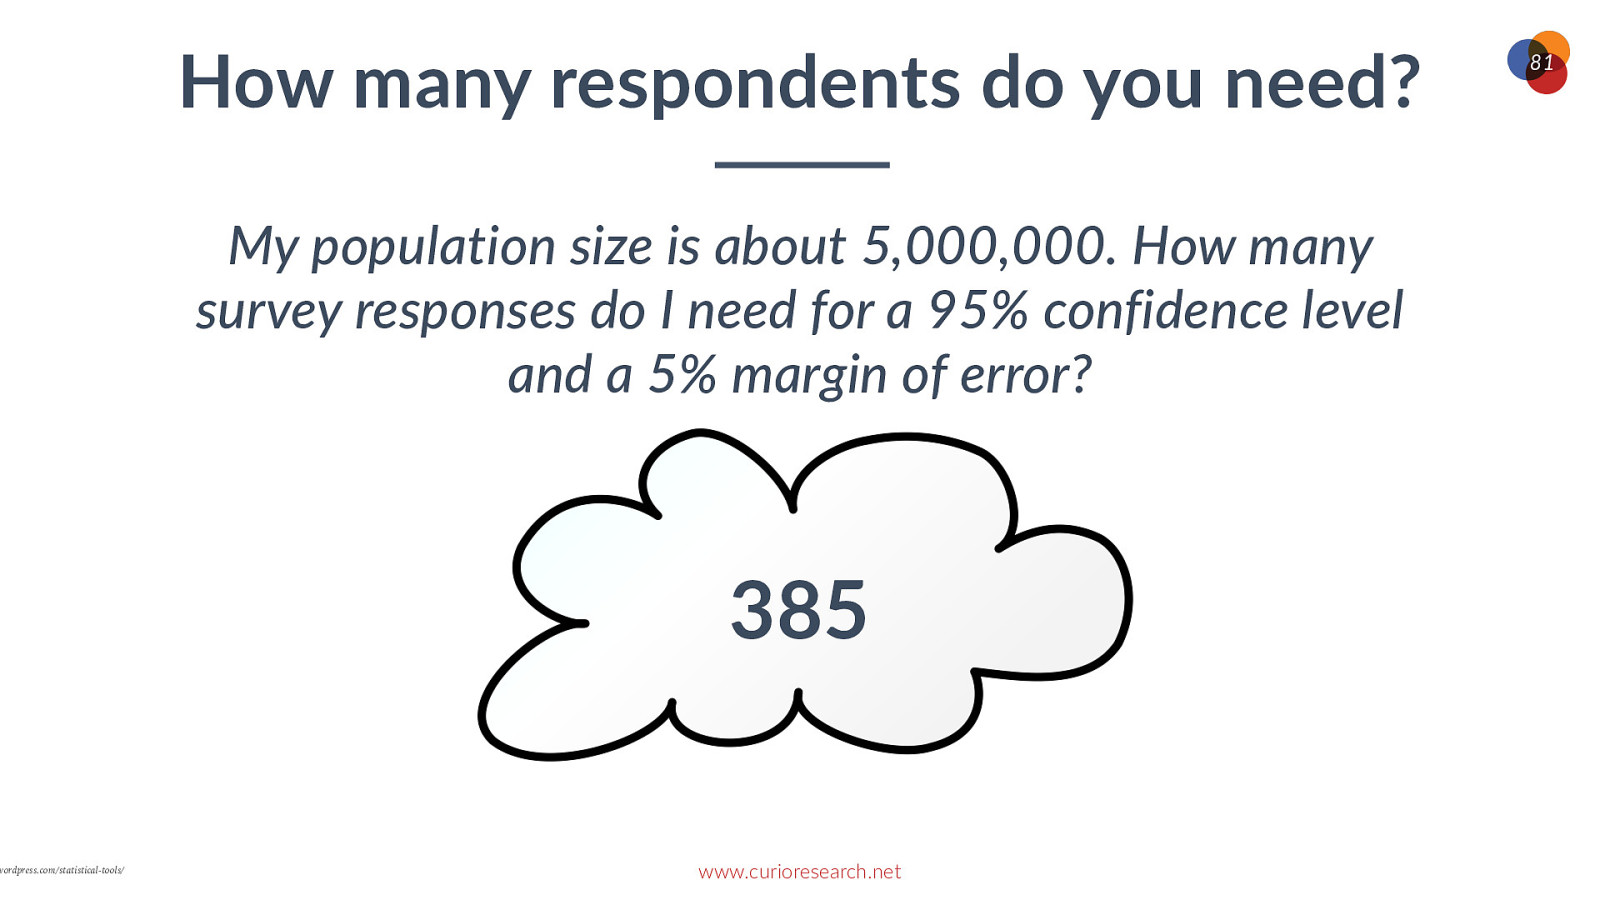
wordpress.com/statistical-tools/ How many respondents do you need? My population size is about 5,000,000. How many survey responses do I need for a 95% confidence level and a 5% margin of error? 385 www.curioresearch.net 81

o_Research The magic sample size is 400 82 Photo by Aziz Acharki on Unsplash

o_Research Photo by Ben White on Unsplash The Invitation 83
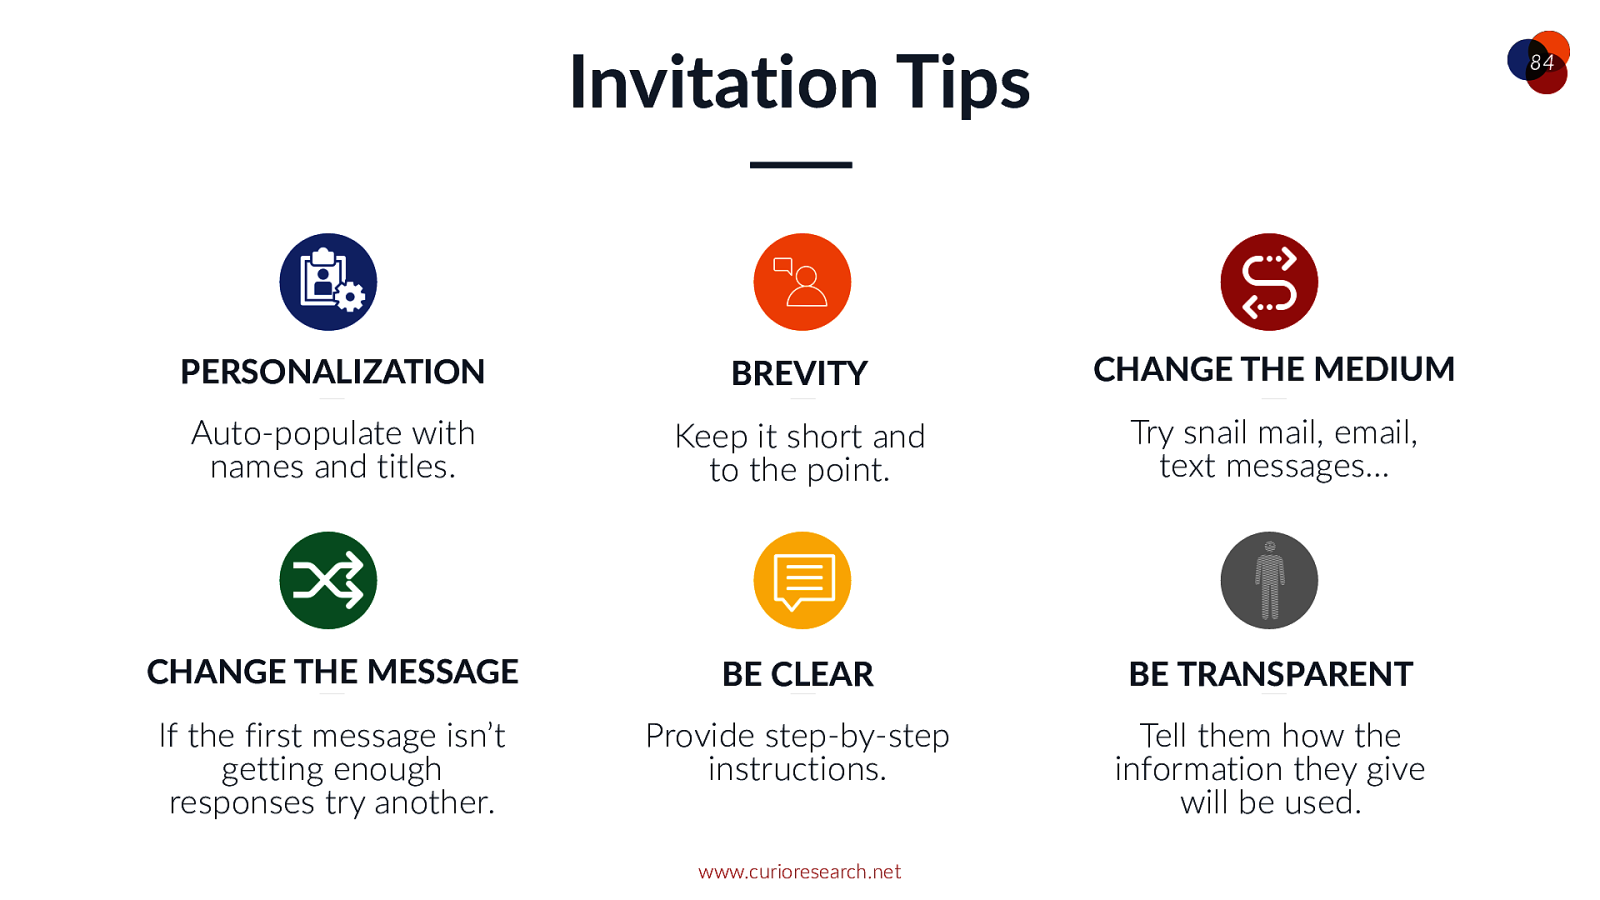
Invitation Tips 84 PERSONALIZATION BREVITY CHANGE THE MEDIUM Auto-populate with names and titles. Keep it short and to the point. Try snail mail, email, text messages… CHANGE THE MESSAGE BE CLEAR BE TRANSPARENT If the first message isn’t getting enough responses try another. Provide step-by-step instructions. Tell them how the information they give will be used. www.curioresearch.net

o_Research Point of contact Who ya gonna call? 85 Photo by Søren Astrup Jørgensen on Unsplash
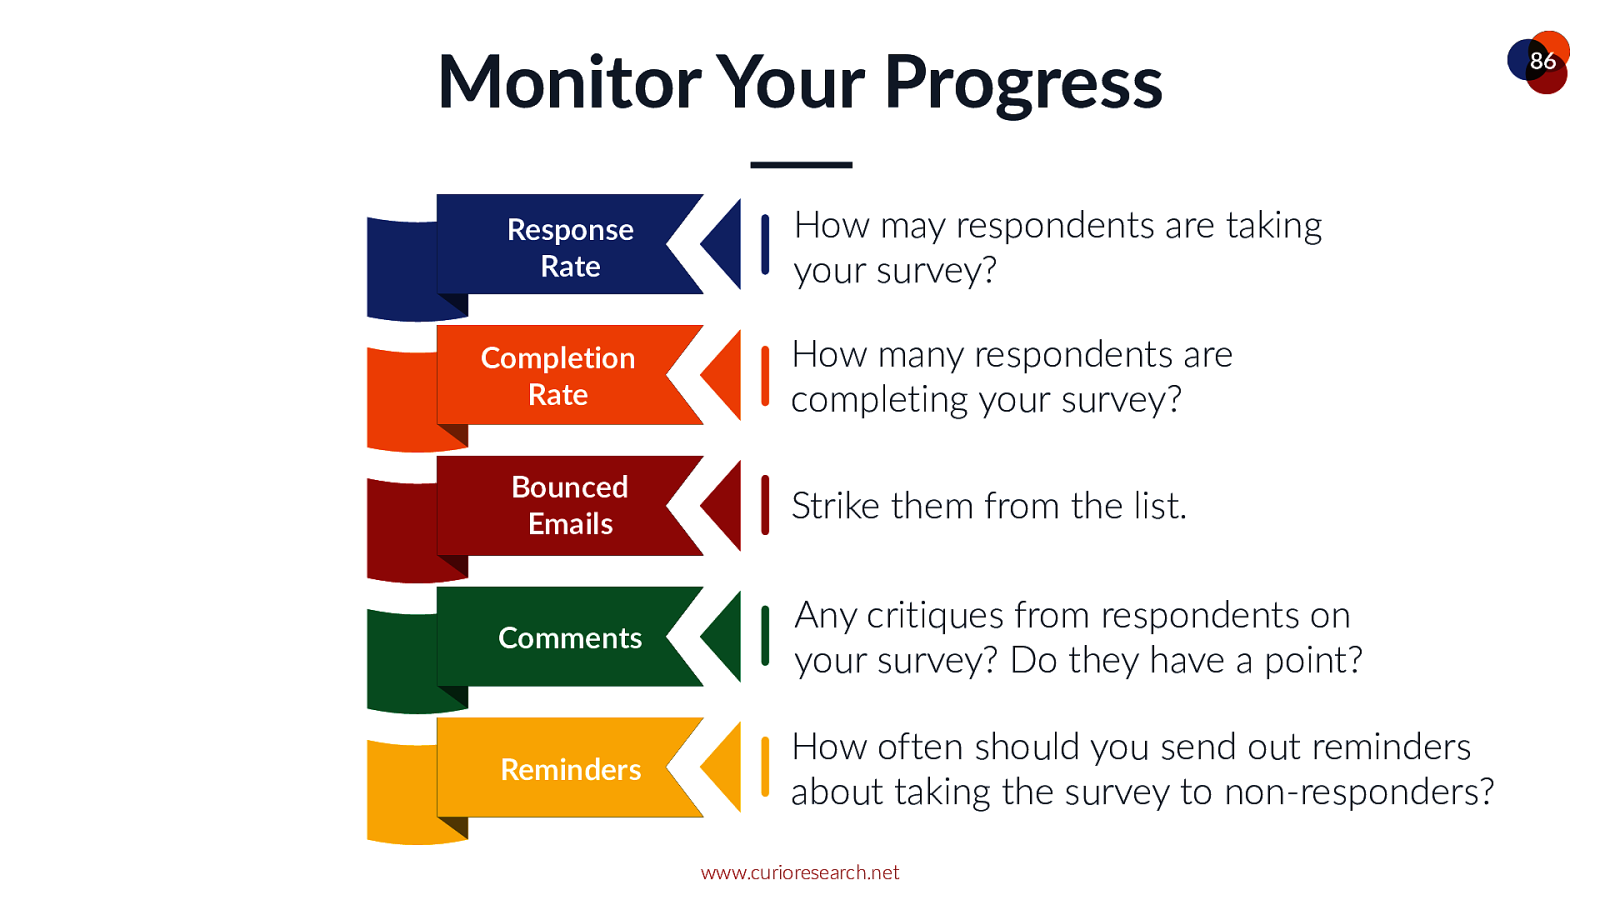
Monitor Your Progress Response Rate OPTION 01 Completion Rate OPTION 01 OPTION 01 Bounced Emails OPTION 01 Comments OPTION 01 Reminders How may respondents are taking your survey? How many respondents are completing your survey? Strike them from the list. Any critiques from respondents on your survey? Do they have a point? How often should you send out reminders about taking the survey to non-responders? www.curioresearch.net 86

27/9423385629_171671f9c2_b.jpg 87 Analyzing the Data www.curioresearch.net
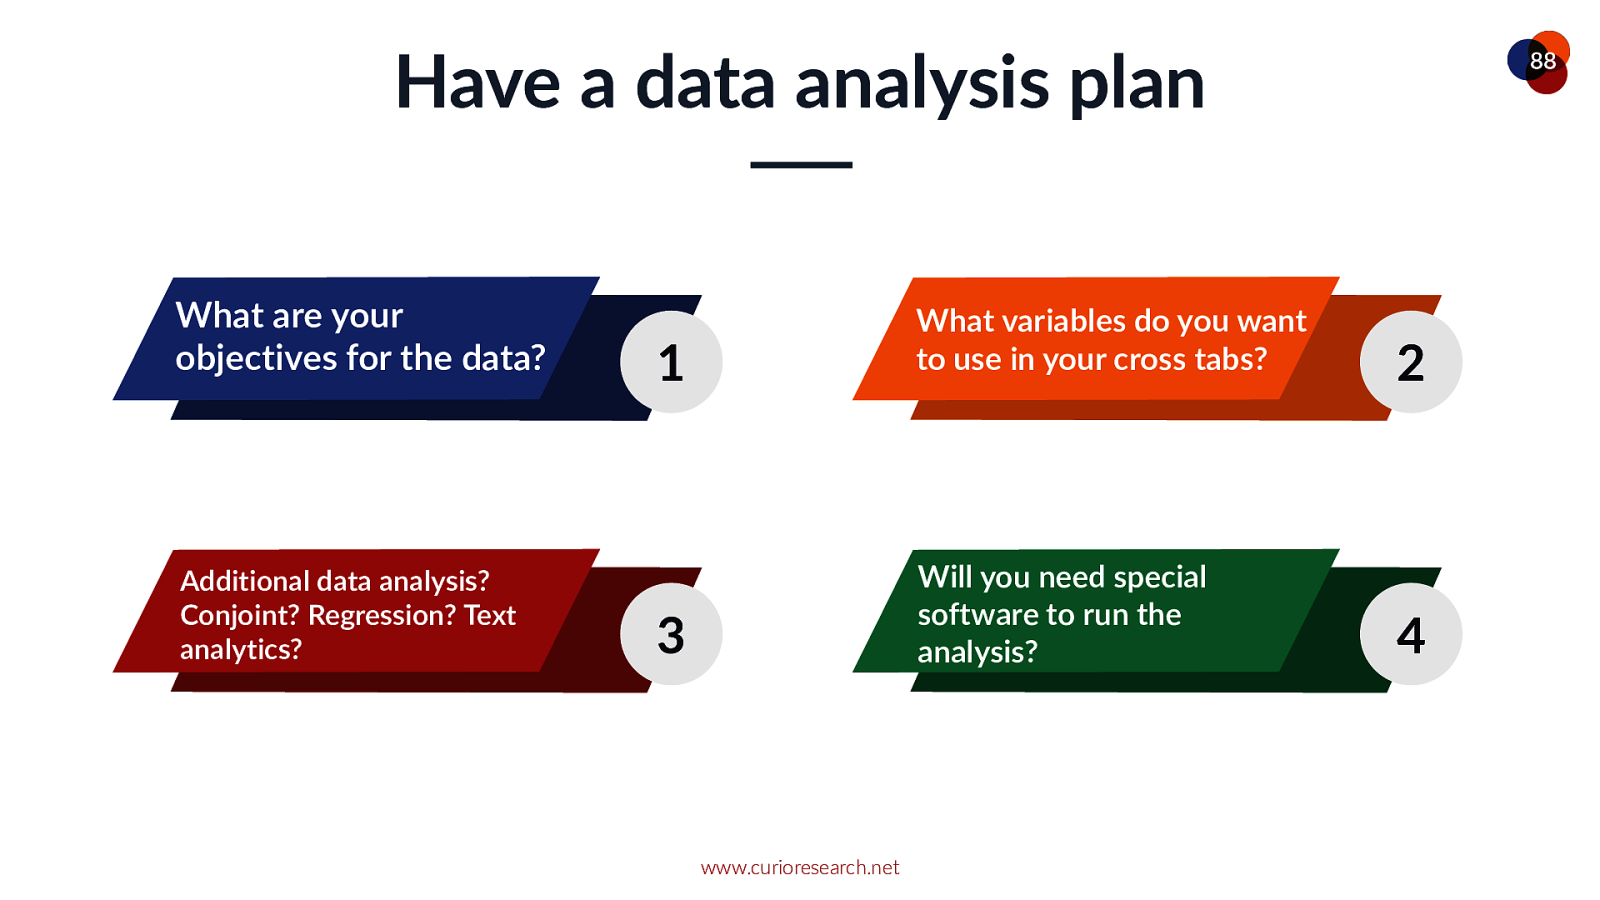
Have a data analysis plan What are your objectives for the data? Additional data analysis? Conjoint? Regression? Text analytics? 88 1 What variables do you want to use in your cross tabs? 2 3 Will you need special software to run the analysis? 4 www.curioresearch.net
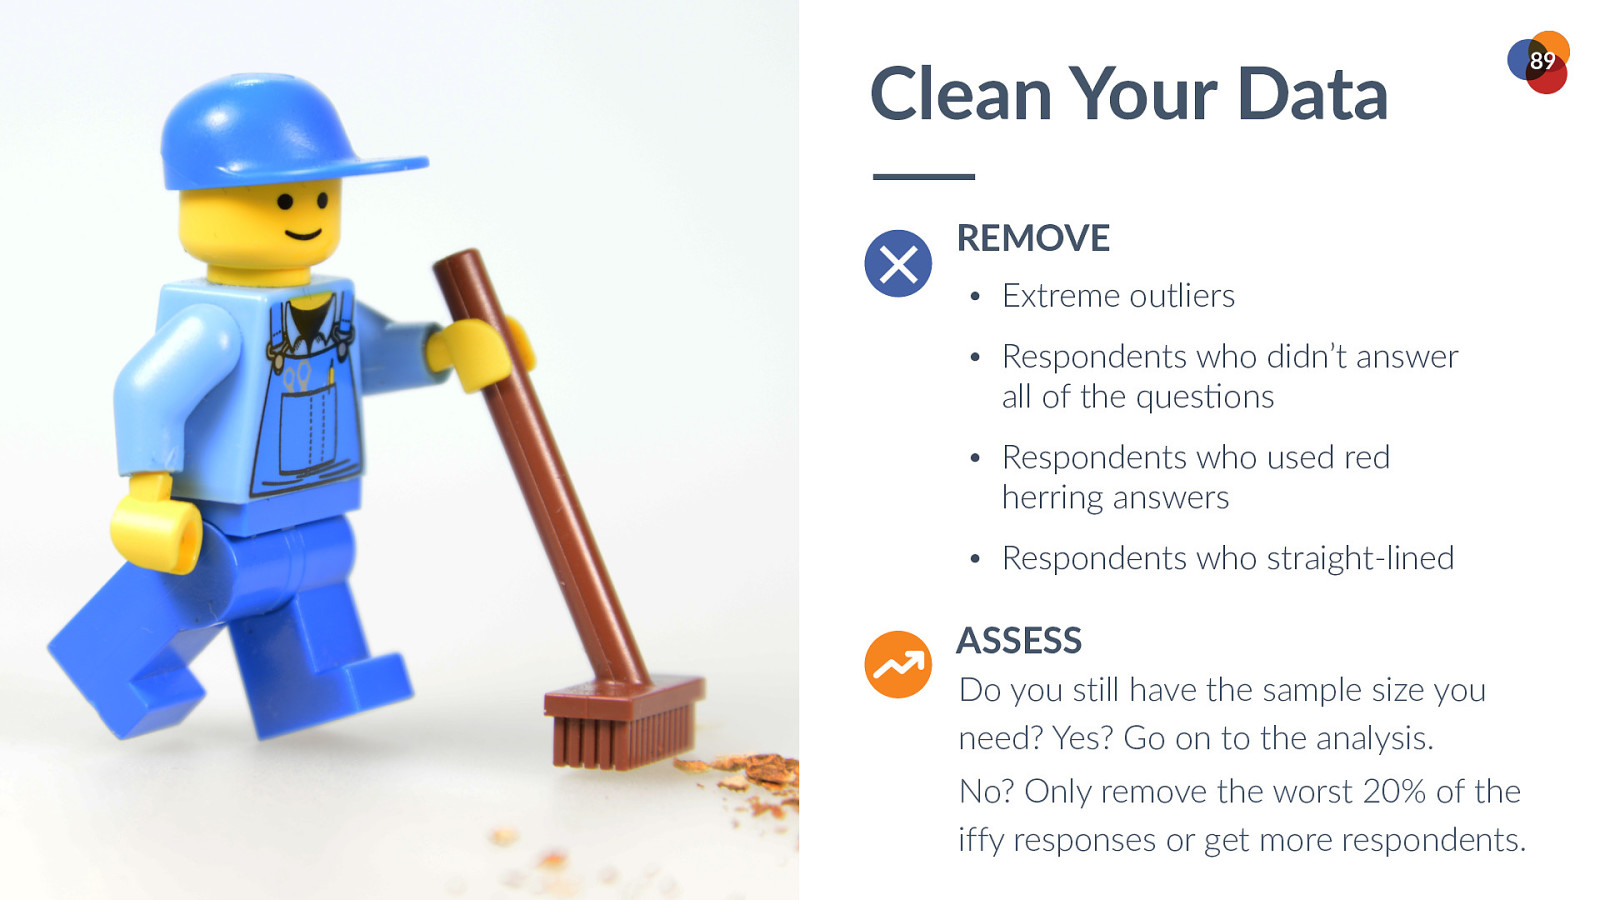
Clean Your Data REMOVE • Extreme outliers • Respondents who didn’t answer all of the quesOons • Respondents who used red herring answers • Respondents who straight-lined ASSESS Do you still have the sample size you need? Yes? Go on to the analysis. No? Only remove the worst 20% of the www.companyname.com iffy responses or get more respondents. © 2016 Jetfabrik Multipurpose Theme. All Rights Reserved. 89
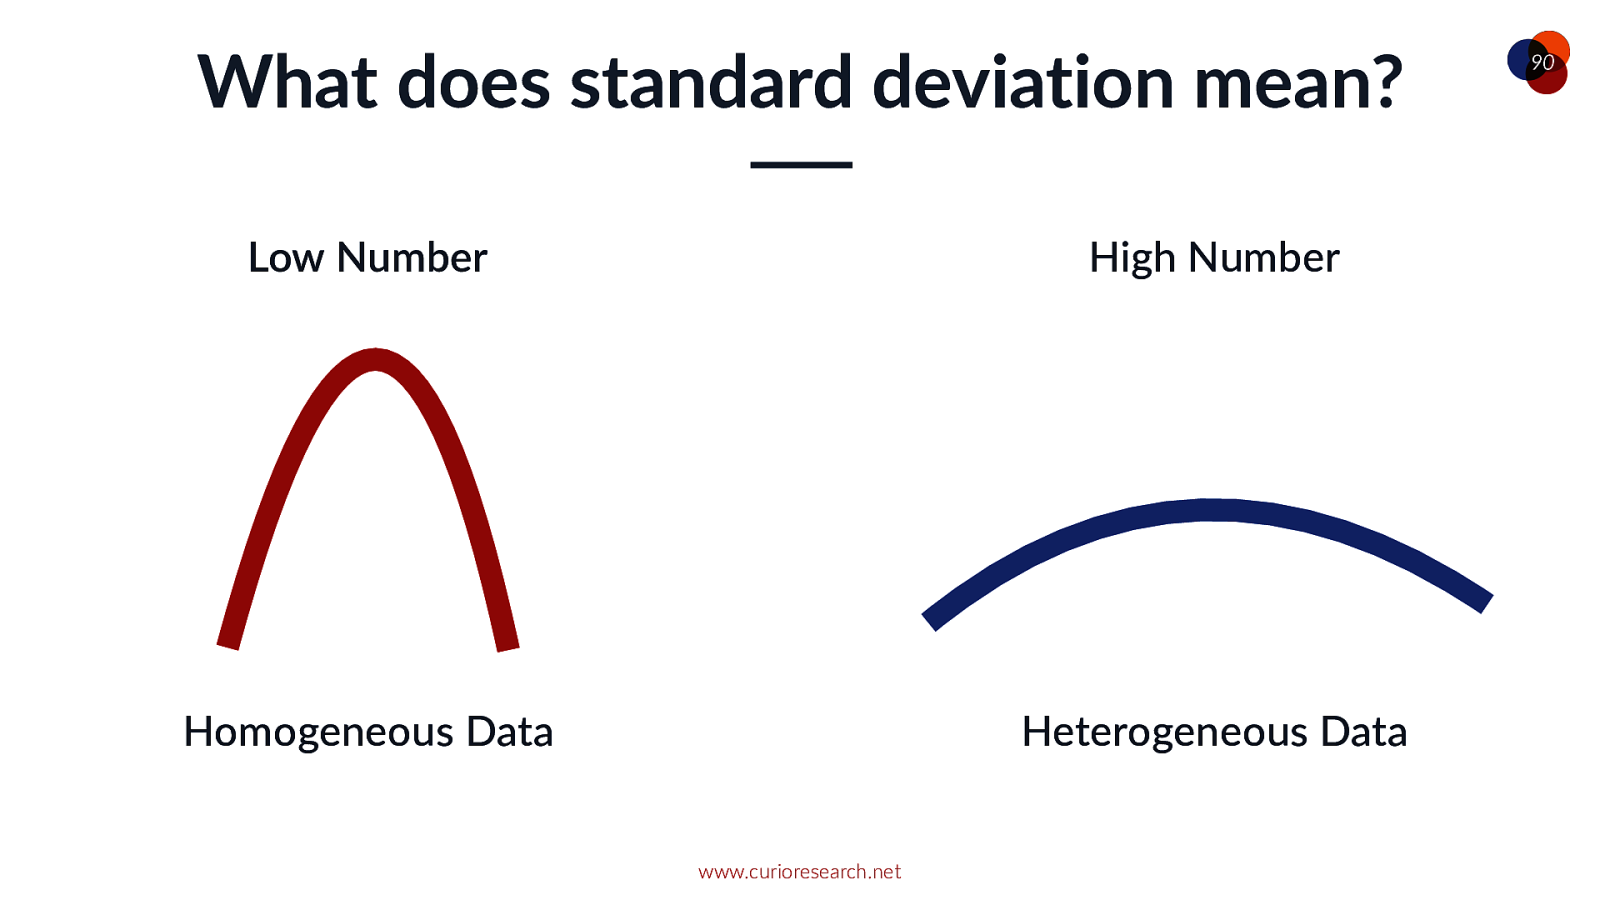
What does standard deviation mean? Low Number High Number Homogeneous Data Heterogeneous Data www.curioresearch.net 90
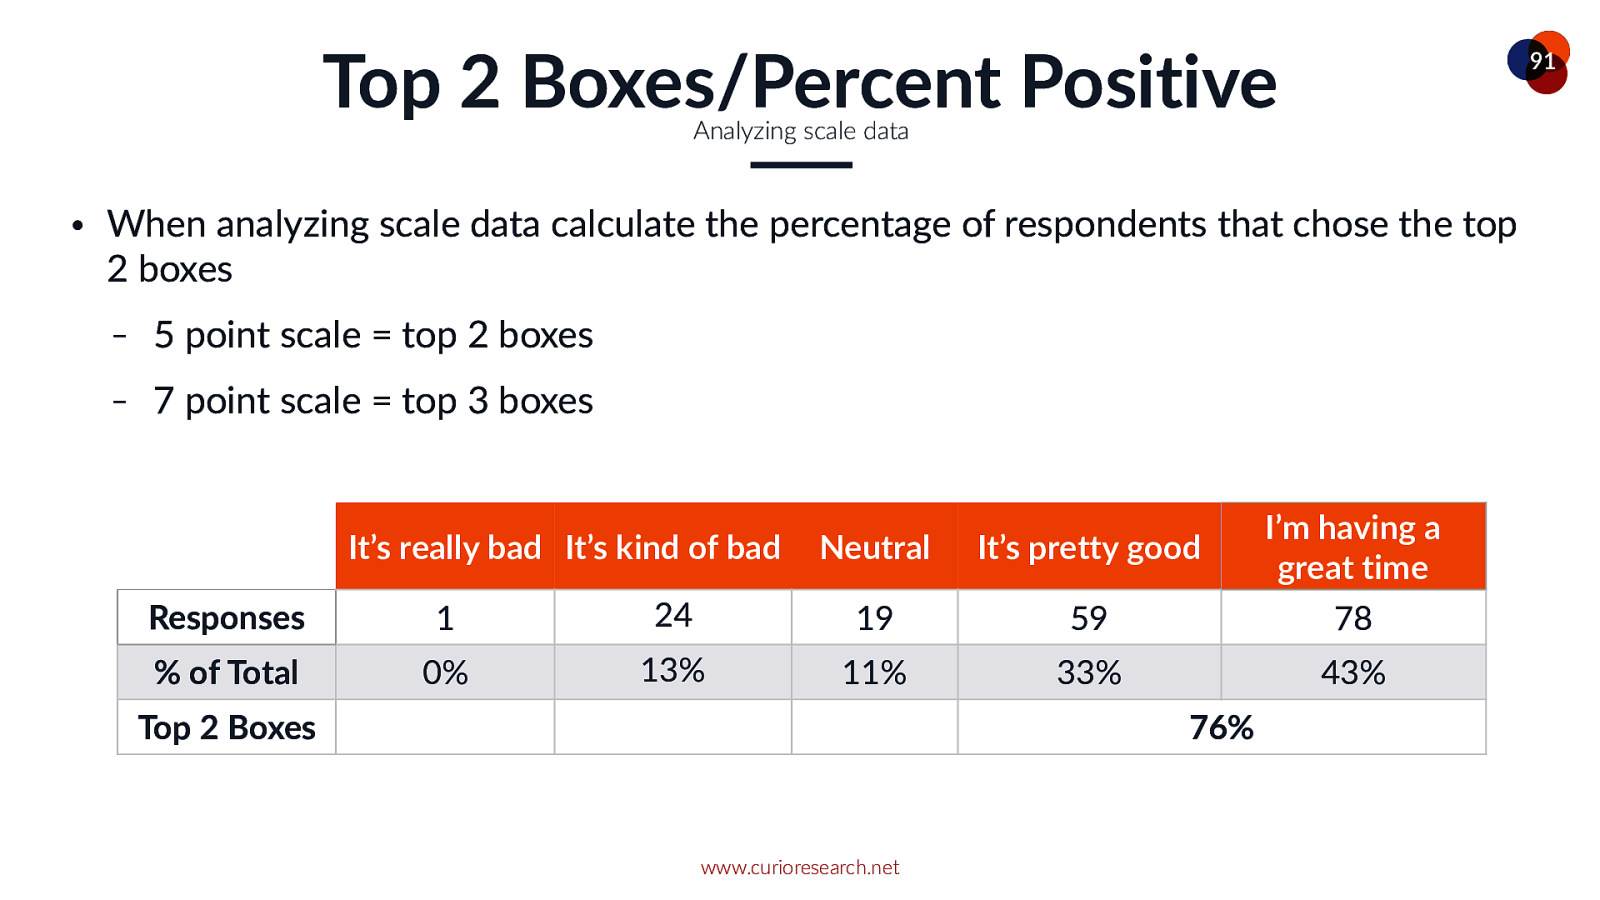
7 point scale = top 3 boxes It’s really bad It’s kind of bad Neutral It’s pretty good I’m having a great time Responses 1 24 19 59 78 % of Total 0% 13% 11% 33% 43% Top 2 Boxes 76% www.curioresearch.net
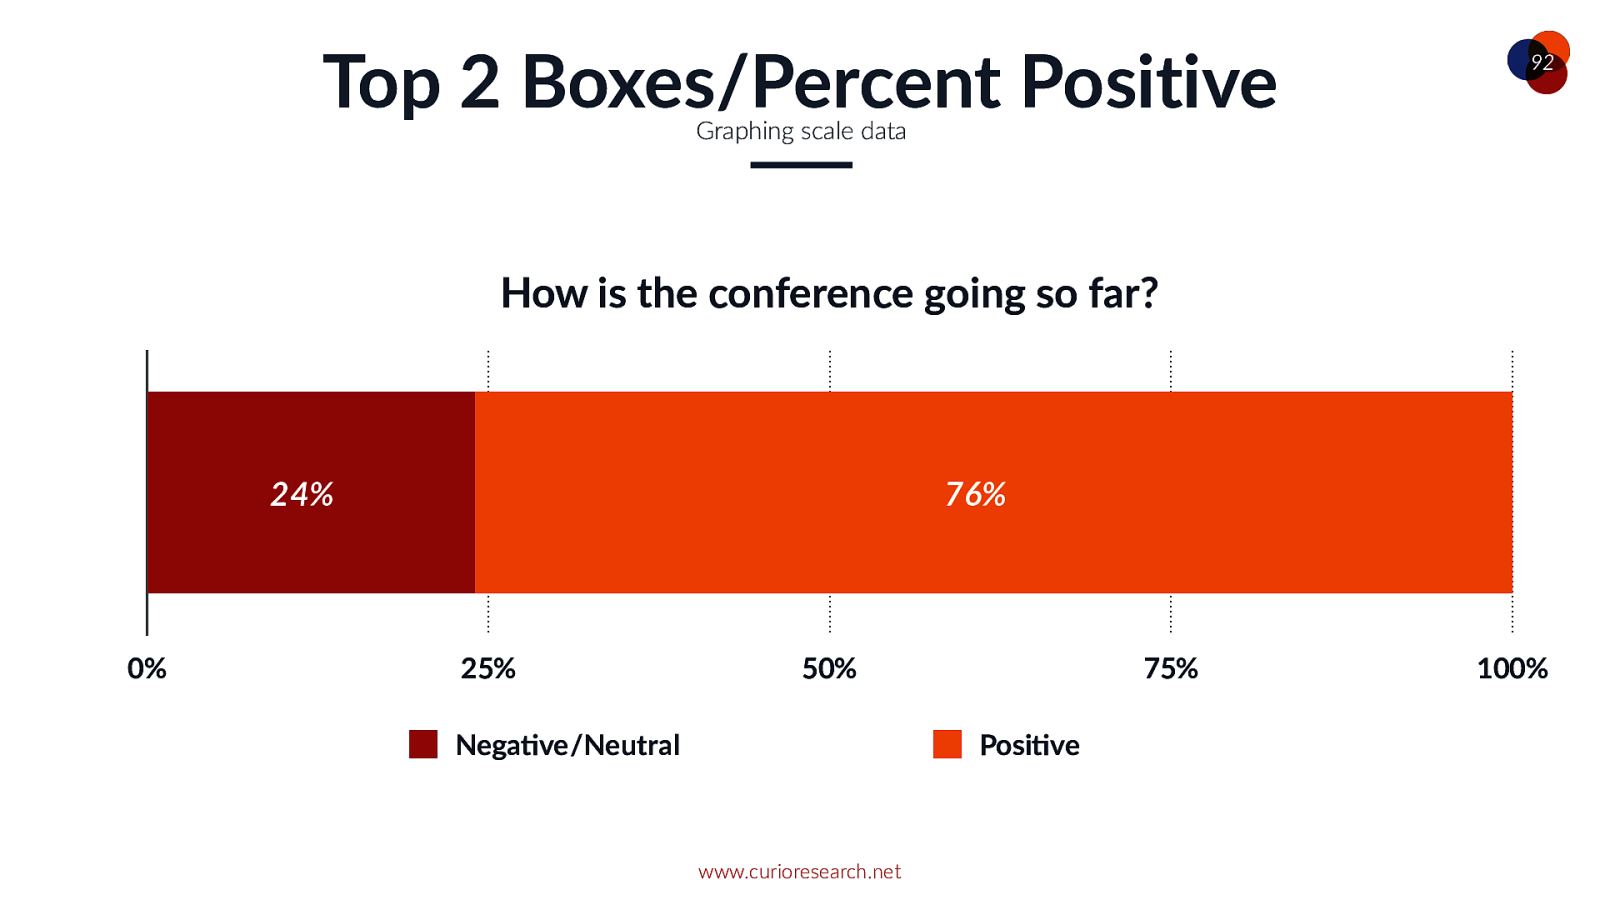
Top 2 Boxes/Percent Positive 92 Graphing scale data How is the conference going so far? 24% 0% 76% 25% 50% NegaVve /Neutral 75% PosiVve www.curioresearch.net 100%

s/30478819@N08/36996342724/ 93 Key Takeaways www.curioresearch.net
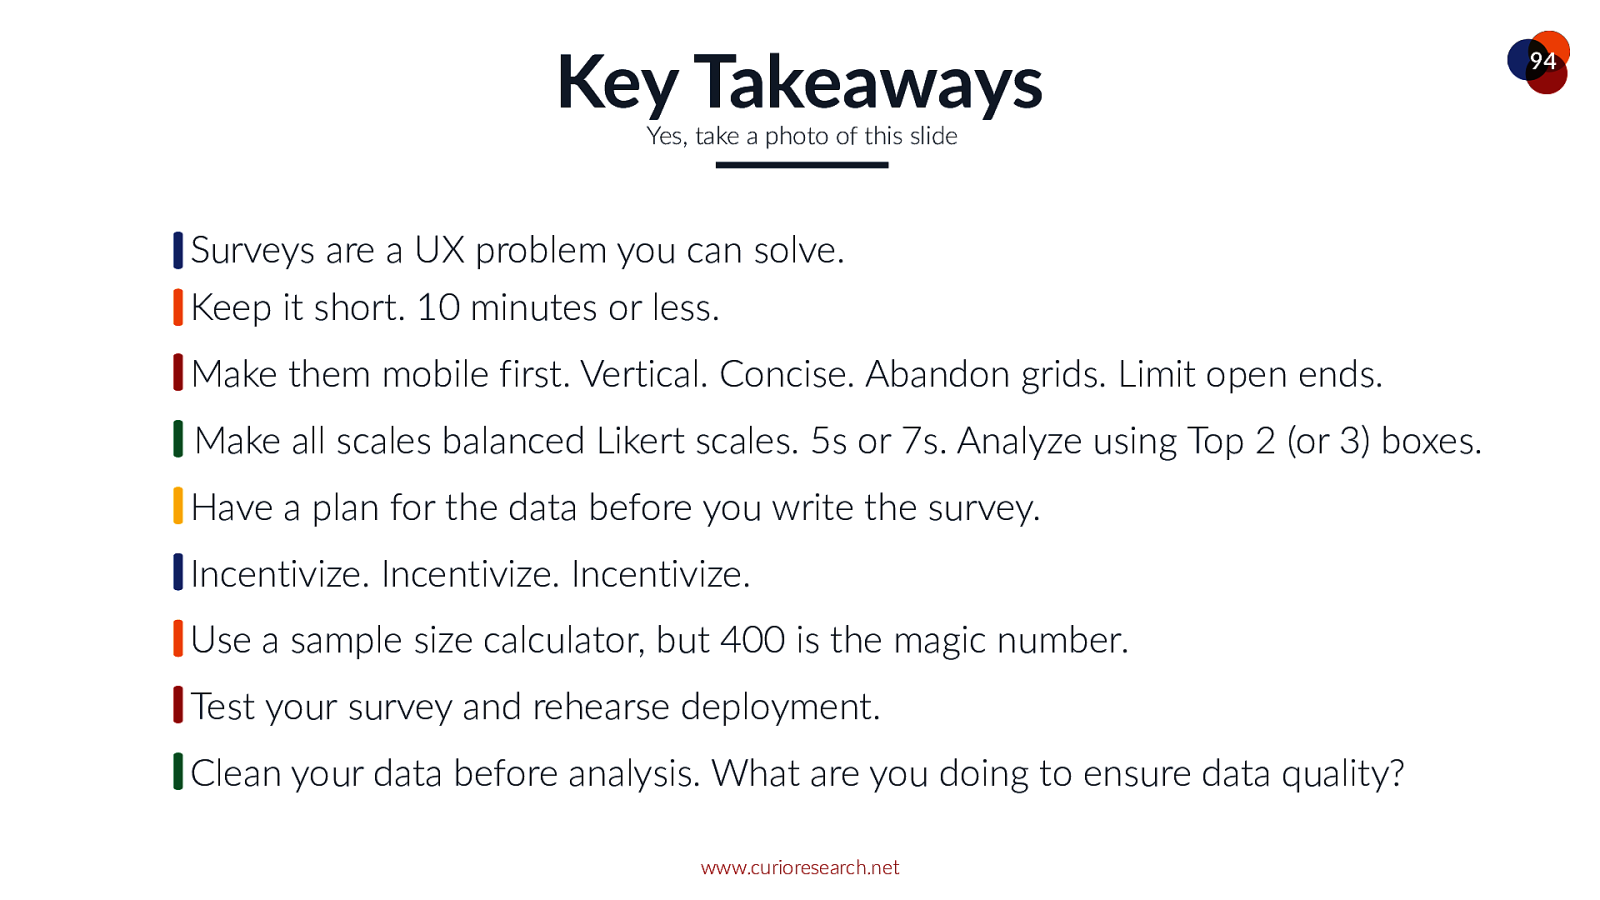
Key Takeaways Yes, take a photo of this slide Surveys are a UX problem you can solve. Keep it short. 10 minutes or less. Make them mobile first. Vertical. Concise. Abandon grids. Limit open ends. Make all scales balanced Likert scales. 5s or 7s. Analyze using Top 2 (or 3) boxes. Have a plan for the data before you write the survey. Incentivize. Incentivize. Incentivize. Use a sample size calculator, but 400 is the magic number. Test your survey and rehearse deployment. Clean your data before analysis. What are you doing to ensure data quality? www.curioresearch.net 94

https://www.flickr.com/photos/tetsumo/3802078924 95 But Wait, There’s More! www.curioresearch.net
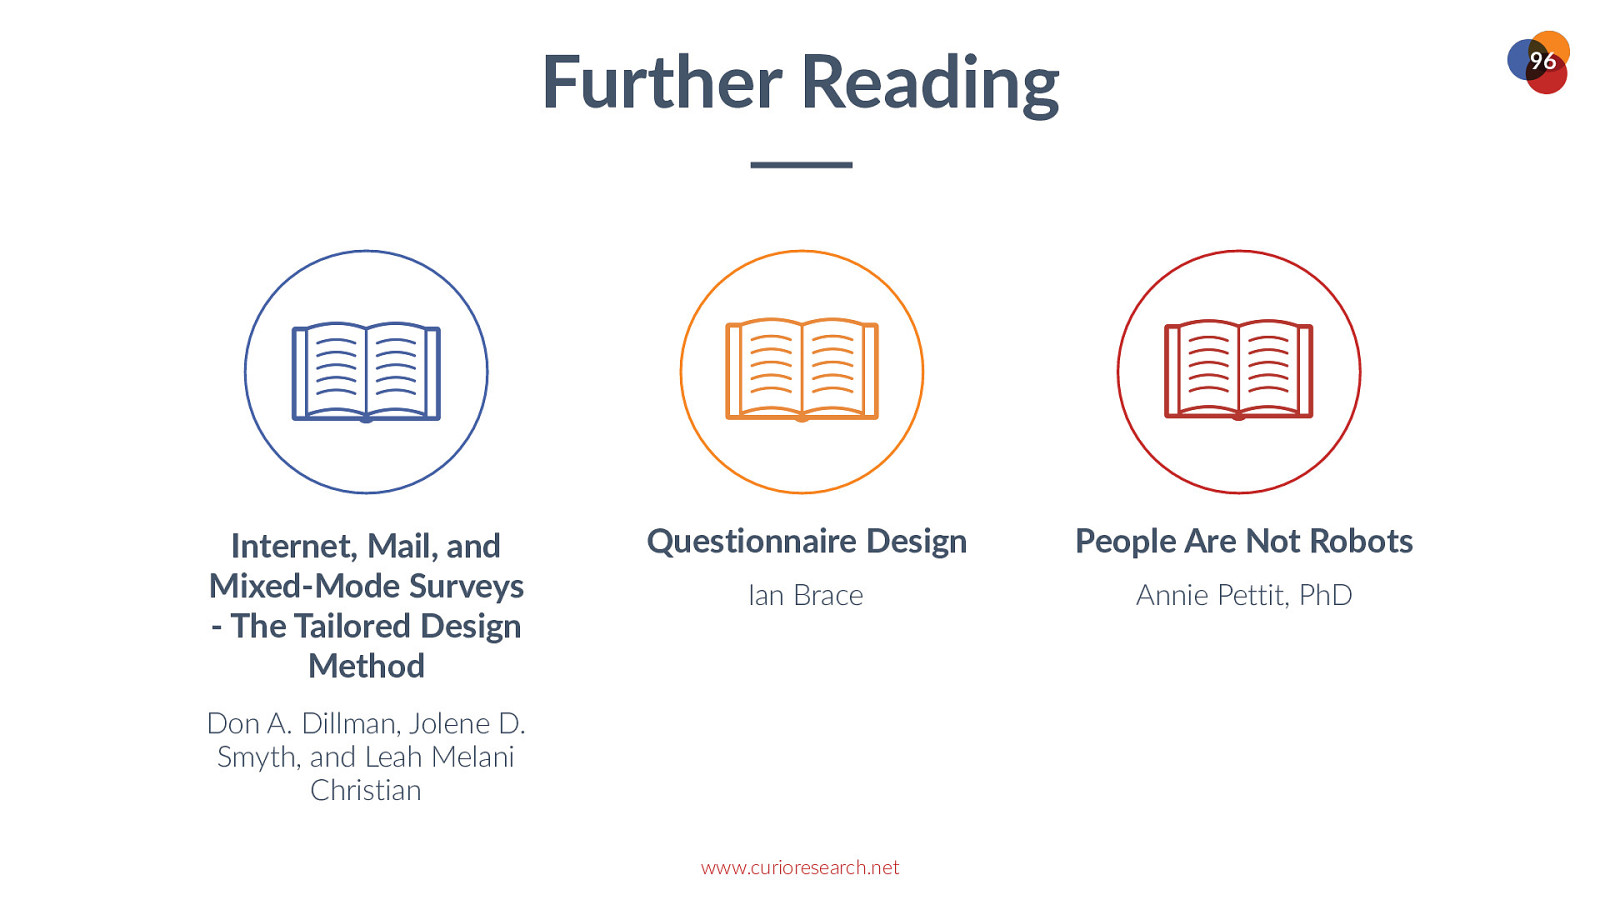
Further Reading Internet, Mail, and Mixed-Mode Surveys - The Tailored Design Method 96 Questionnaire Design People Are Not Robots Ian Brace Annie Pettit, PhD Don A. Dillman, Jolene D. Smyth, and Leah Melani Christian www.curioresearch.net
Online Sources 97 NewMR Annie Pettit, PhD Jeffrey Henning Ray Poynter Hashtag #NewMR Twitter @NewMR_News Youtube “NewMR Videos” Twitter @LoveStats Twitter @JHenning Twitter @RayPoynter www.curioresearch.net

98 THANK YOU CurioResearch.net @Curio_Research www.curioresearch.net Photo by Nick Hillier on Unsplash